微软Surface Pro 6(2018)(i5,128 GB,8GB)评测
| SD Card Reader | |
| average JPG Copy Test (av. of 3 runs) | |
| Microsoft Surface Book 2 (Toshiba Exceria Pro SDXC 64 GB UHS-II) | |
| Dell Latitude 5290 2-in-1 (Toshiba Exceria Pro M501 UHS-II) | |
| Microsoft Surface Pro 6, Core i5, 128 GB (Toshiba Exceria Pro M501 microSDXC 64GB) | |
| Average of class Convertible (28.1 - 197, n=23, last 2 years) | |
| Microsoft Surface Pro (2017) i7 (Toshiba Exceria Pro M401 64 GB) | |
| maximum AS SSD Seq Read Test (1GB) | |
| Microsoft Surface Book 2 (Toshiba Exceria Pro SDXC 64 GB UHS-II) | |
| Dell Latitude 5290 2-in-1 (Toshiba Exceria Pro M501 UHS-II) | |
| Average of class Convertible (28.9 - 254, n=22, last 2 years) | |
| Microsoft Surface Pro (2017) i7 (Toshiba Exceria Pro M401 64 GB) | |
| Microsoft Surface Pro 6, Core i5, 128 GB (Toshiba Exceria Pro M501 microSDXC 64GB) | |
| Networking | |
| iperf3 transmit AX12 | |
| Samsung Galaxy Book 12 SM-W728 | |
| Microsoft Surface Pro (2017) i5 | |
| HP Elite x2 1013 G3-2TT14EA | |
| Huawei Matebook E | |
| Microsoft Surface Pro 6, Core i7, 512 GB | |
| Microsoft Surface Pro 6, Core i5, 128 GB | |
| Lenovo ThinkPad X1 Tablet G3-20KJ001NGE | |
| Microsoft Surface Book 2 | |
| Microsoft Surface Go MHN-00003 | |
| Dell Latitude 5290 2-in-1 | |
| Lenovo Miix 520-12IKB 20M3000LGE | |
| iperf3 receive AX12 | |
| Dell Latitude 5290 2-in-1 | |
| Lenovo ThinkPad X1 Tablet G3-20KJ001NGE | |
| Samsung Galaxy Book 12 SM-W728 | |
| Microsoft Surface Pro 6, Core i7, 512 GB | |
| Microsoft Surface Go MHN-00003 | |
| Microsoft Surface Pro (2017) i5 | |
| Microsoft Surface Pro 6, Core i5, 128 GB | |
| Microsoft Surface Book 2 | |
| Huawei Matebook E | |
| HP Elite x2 1013 G3-2TT14EA | |
| Lenovo Miix 520-12IKB 20M3000LGE | |
| |||||||||||||||||||||||||
Brightness Distribution: 83 %
Center on Battery: 463 cd/m²
Contrast: 1447:1 (Black: 0.32 cd/m²)
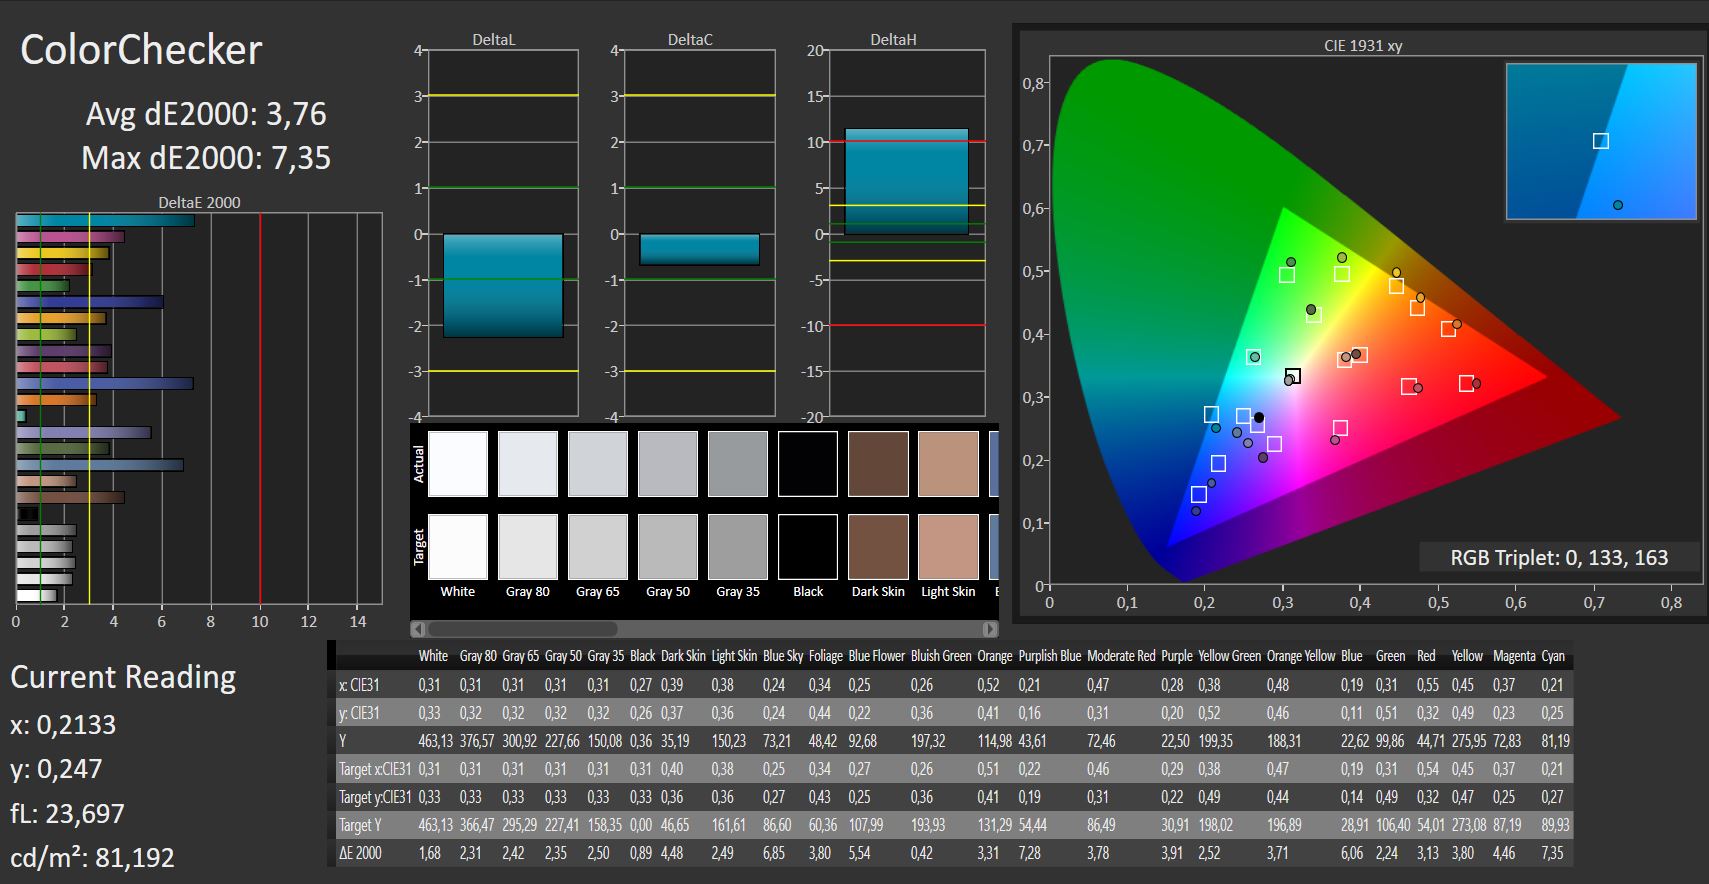
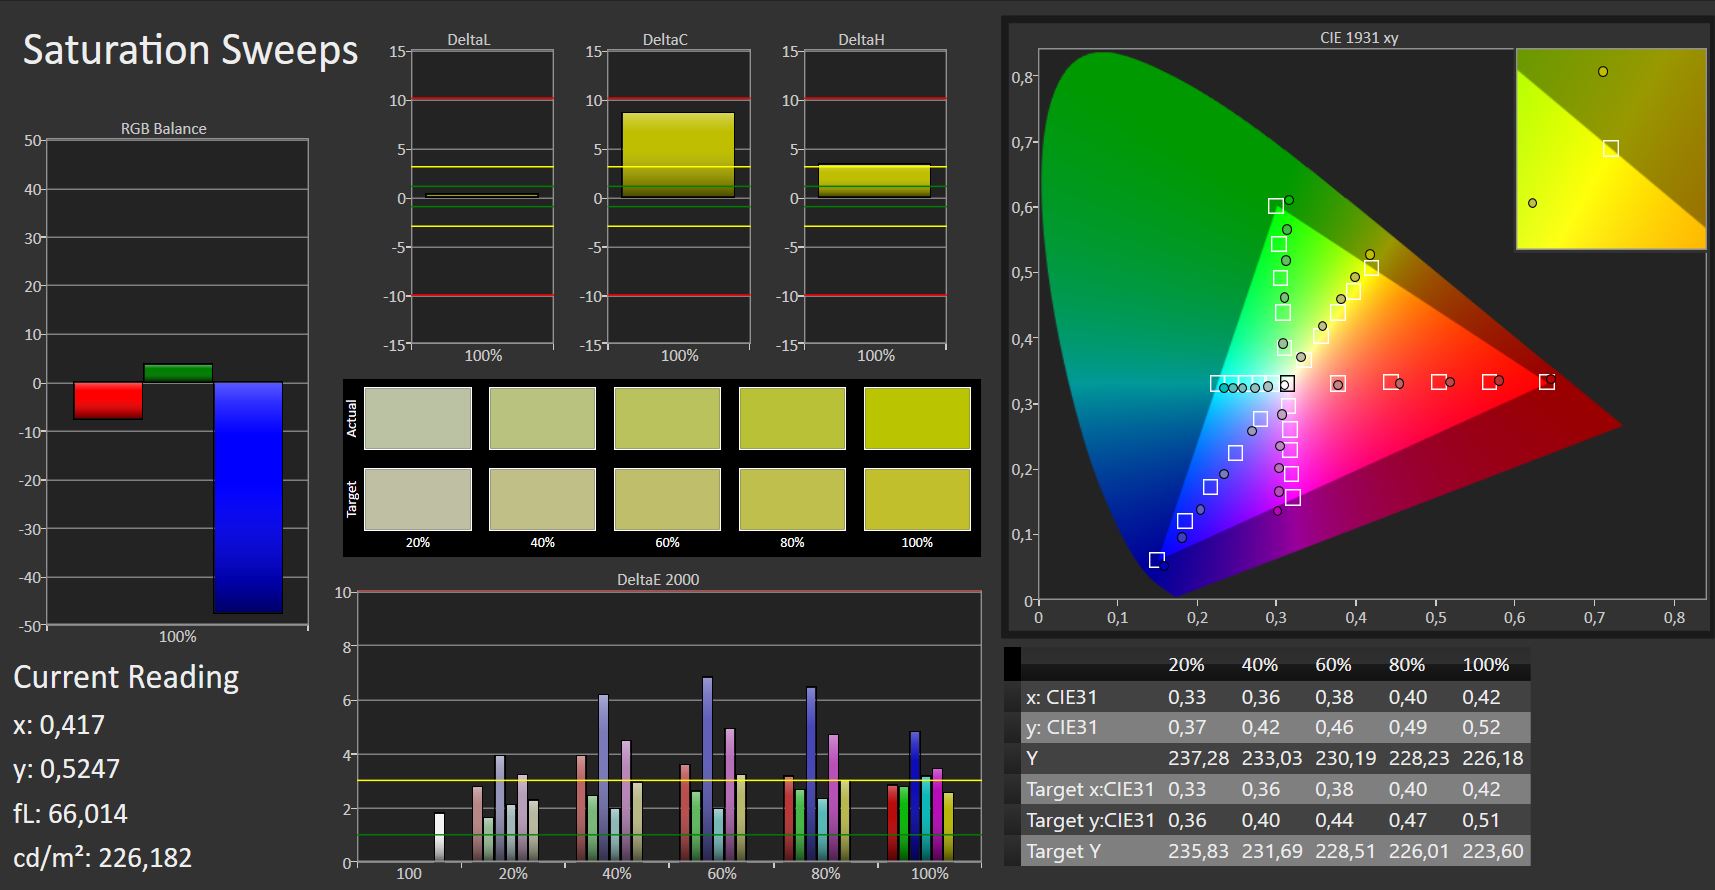
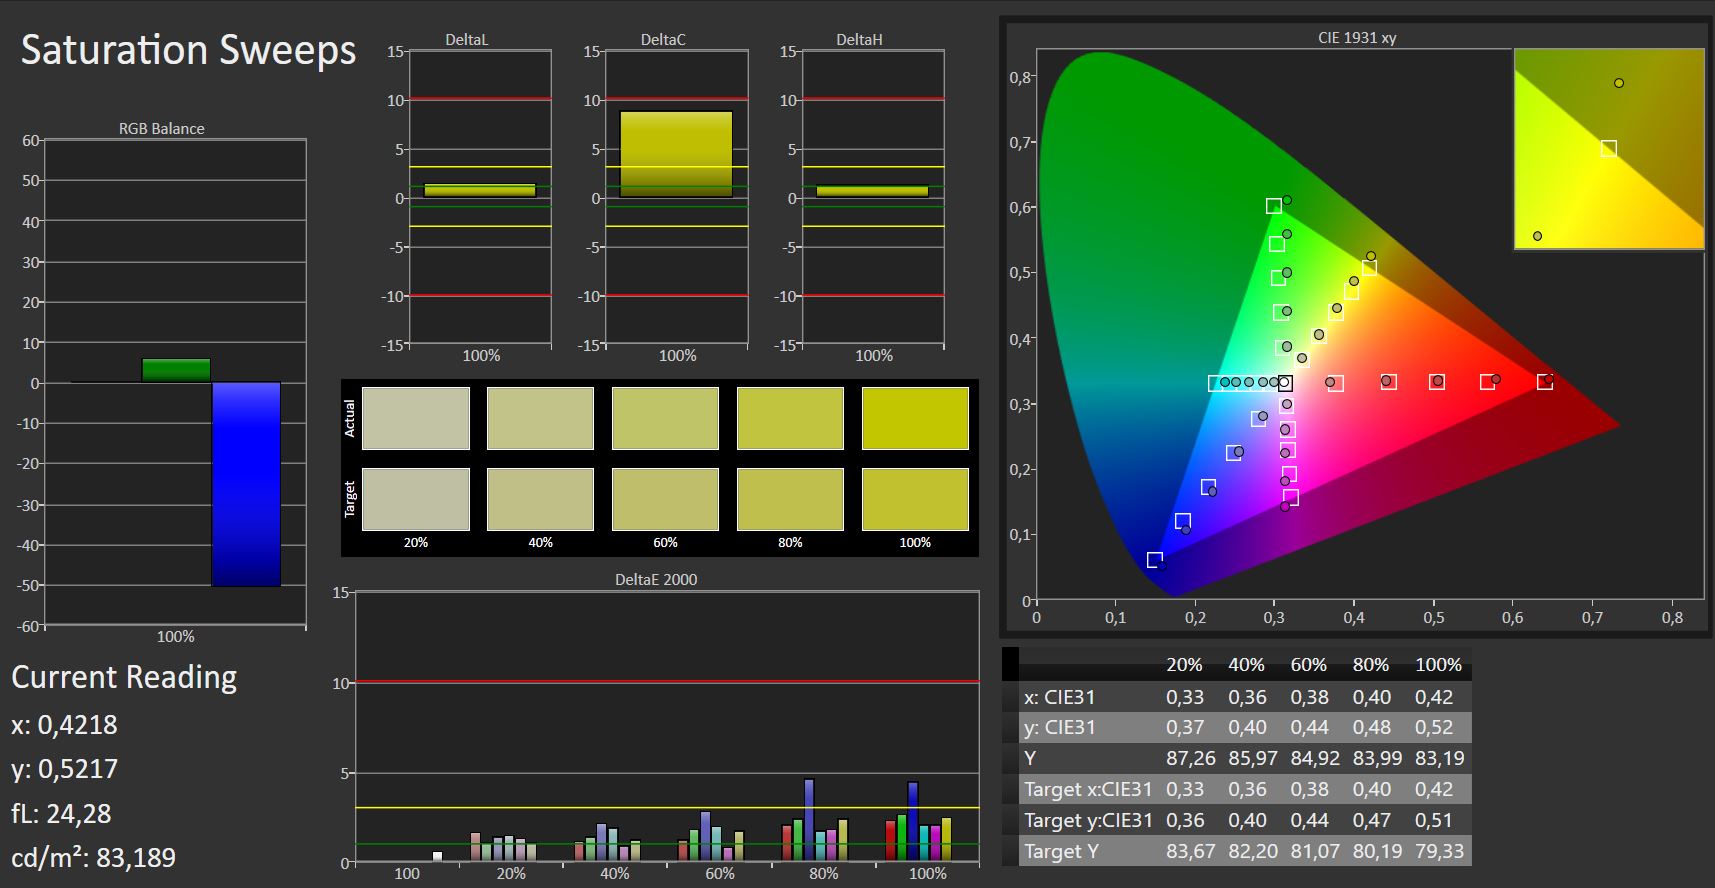
ΔE ColorChecker Calman: 3.76 | ∀{0.5-29.43 Ø4.72}
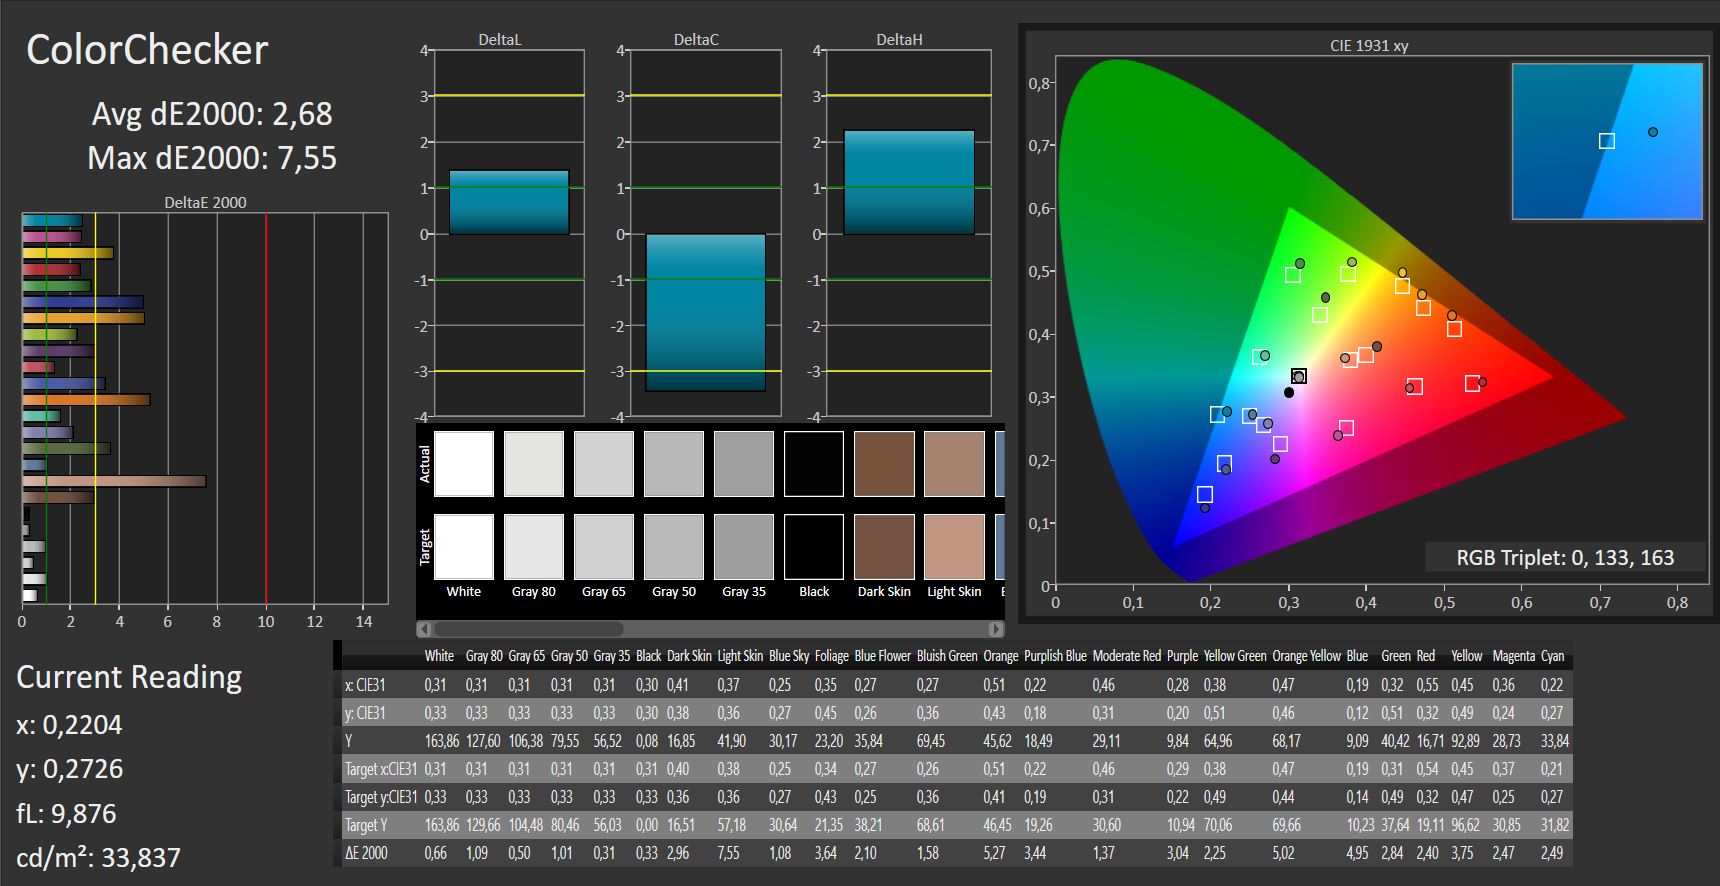
calibrated: 2.68
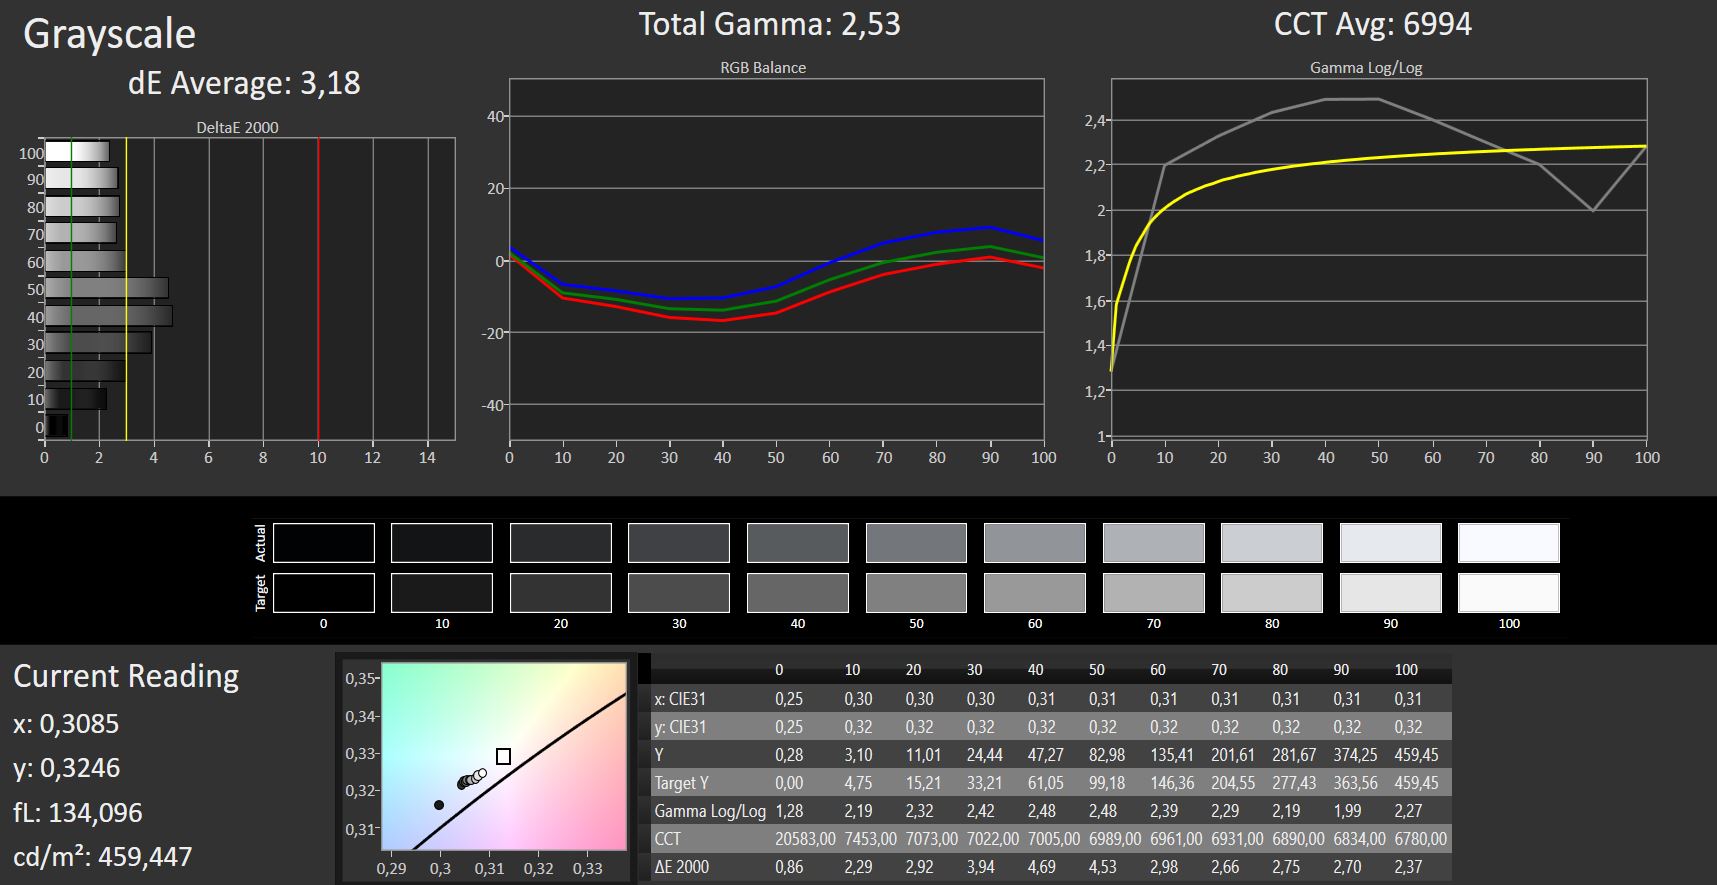
ΔE Greyscale Calman: 3.18 | ∀{0.09-98 Ø4.97}
90% sRGB (Argyll 1.6.3 3D)
59% AdobeRGB 1998 (Argyll 1.6.3 3D)
65.6% AdobeRGB 1998 (Argyll 3D)
90.4% sRGB (Argyll 3D)
65.5% Display P3 (Argyll 3D)
Gamma: 2.53
CCT: 6994 K
| Microsoft Surface Pro 6, Core i5, 128 GB LGPhilips LP123WQ112604, , 2736x1834, 12.3" | Microsoft Surface Pro (2017) i5 LG Display LP123WQ112604, , 2736x1824, 12.3" | Microsoft Surface Book 2 Panasonic MEI96A2 , , 3000x2000, 13.5" | Microsoft Surface Go MHN-00003 Sharp SHP14A6, , 1800x1200, 10" | Dell Latitude 5290 2-in-1 SHP1479, , 1920x1280, 12.3" | HP Elite x2 1013 G3-2TT14EA AU Optronics AUO101A, , 3000x2000, 13" | Lenovo ThinkPad X1 Tablet G3-20KJ001NGE LP130QP1-SPA1, , 3000x2000, 13" | Samsung Galaxy Book 12 SM-W728 Samsung SDCA029, , 2160x1440, 12" | Huawei Matebook E Chi Mei CMN7801, , 2160x1440, 12" | Lenovo Miix 520-12IKB 20M3000LGE Unbekannt, , 1920x1200, 12.2" | |
|---|---|---|---|---|---|---|---|---|---|---|
| Display | 6% | 5% | 4% | 9% | 5% | 7% | 16% | 21% | 1% | |
| Display P3 Coverage (%) | 65.5 | 67.6 3% | 67.9 4% | 66.5 2% | 70.5 8% | 67.5 3% | 68.1 4% 67.8 4% | 77.3 18% | 84.9 30% | 66.1 1% |
| sRGB Coverage (%) | 90.4 | 99 10% | 95.7 6% | 97.5 8% | 98.6 9% | 96.7 7% | 99.4 10% 99.1 10% | 92.8 3% | 99.8 10% | 91.6 1% |
| AdobeRGB 1998 Coverage (%) | 65.6 | 69.1 5% | 69.4 6% | 67.5 3% | 71.5 9% | 68.2 4% | 69.9 7% 69.3 6% | 83.1 27% | 79.9 22% | 66.7 2% |
| Response Times | -8% | -23% | -4% | -40% | -8% | -41% | 55% | 25% | 11% | |
| Response Time Grey 50% / Grey 80% * (ms) | 42 ? | 42 ? -0% | 52.8 ? -26% | 44 ? -5% | 56.8 ? -35% | 47 ? -12% | 47.2 ? -12% | 4 ? 90% | 26 ? 38% | 36 ? 14% |
| Response Time Black / White * (ms) | 25 ? | 29 ? -16% | 30 ? -20% | 25.6 ? -2% | 36 ? -44% | 26 ? -4% | 42.4 ? -70% | 20 ? 20% | 22 ? 12% | 23 ? 8% |
| PWM Frequency (Hz) | 20800 ? | 21000 | 1020 ? | 1852 ? | 250 ? | 200 ? | ||||
| Screen | 5% | 20% | 23% | -5% | -8% | 5% | 85% | -11% | -32% | |
| Brightness middle (cd/m²) | 463 | 417 -10% | 385 -17% | 456 -2% | 548 18% | 452 -2% | 474 2% | 376 -19% | 439 -5% | 384 -17% |
| Brightness (cd/m²) | 450 | 401 -11% | 372 -17% | 426 -5% | 545 21% | 412 -8% | 418 -7% | 378 -16% | 428 -5% | 355 -21% |
| Brightness Distribution (%) | 83 | 88 6% | 89 7% | 88 6% | 86 4% | 85 2% | 76 -8% | 91 10% | 92 11% | 80 -4% |
| Black Level * (cd/m²) | 0.32 | 0.29 9% | 0.21 34% | 0.31 3% | 0.51 -59% | 0.48 -50% | 0.33 -3% | 0.03 91% | 0.35 -9% | 0.56 -75% |
| Contrast (:1) | 1447 | 1438 -1% | 1833 27% | 1471 2% | 1075 -26% | 942 -35% | 1436 -1% | 12533 766% | 1254 -13% | 686 -53% |
| Colorchecker dE 2000 * | 3.76 | 3.63 3% | 1.6 57% | 1.3 65% | 3.65 3% | 4.05 -8% | 3.2 15% | 4.1 -9% | 5.17 -38% | 4.58 -22% |
| Colorchecker dE 2000 max. * | 7.35 | 6.74 8% | 4.5 39% | 3 59% | 7.15 3% | 6.64 10% | 6.1 17% | 6.45 12% | 7.68 -4% | 11.63 -58% |
| Colorchecker dE 2000 calibrated * | 2.68 | 1.1 59% | 1.81 32% | 1.56 42% | 0.9 66% | |||||
| Greyscale dE 2000 * | 3.18 | 2.18 31% | 1.5 53% | 1.4 56% | 5.5 -73% | 4.87 -53% | 4.5 -42% | 3.64 -14% | 5.69 -79% | 5.63 -77% |
| Gamma | 2.53 87% | 3.09 71% | 2.22 99% | 2.24 98% | 2.154 102% | 2.71 81% | 2.07 106% | 2.58 85% | 2.42 91% | 2.45 90% |
| CCT | 6994 93% | 6767 96% | 6502 100% | 6687 97% | 7052 92% | 7160 91% | 5881 111% | 7113 91% | 7999 81% | 7571 86% |
| Color Space (Percent of AdobeRGB 1998) (%) | 59 | 63 7% | 64 8% | 62.3 6% | 65.2 11% | 62 5% | 64 8% | 74 25% | 71 20% | 60 2% |
| Color Space (Percent of sRGB) (%) | 90 | 99 10% | 95.9 7% | 96.8 8% | 99.1 10% | 97 8% | 99.4 10% | 93 3% | 100 11% | 92 2% |
| Total Average (Program / Settings) | 1% /
4% | 1% /
11% | 8% /
16% | -12% /
-7% | -4% /
-6% | -10% /
1% | 52% /
67% | 12% /
0% | -7% /
-20% |
* ... smaller is better
Display Response Times
| ↔ Response Time Black to White | ||
|---|---|---|
| 25 ms ... rise ↗ and fall ↘ combined | ↗ 14 ms rise | 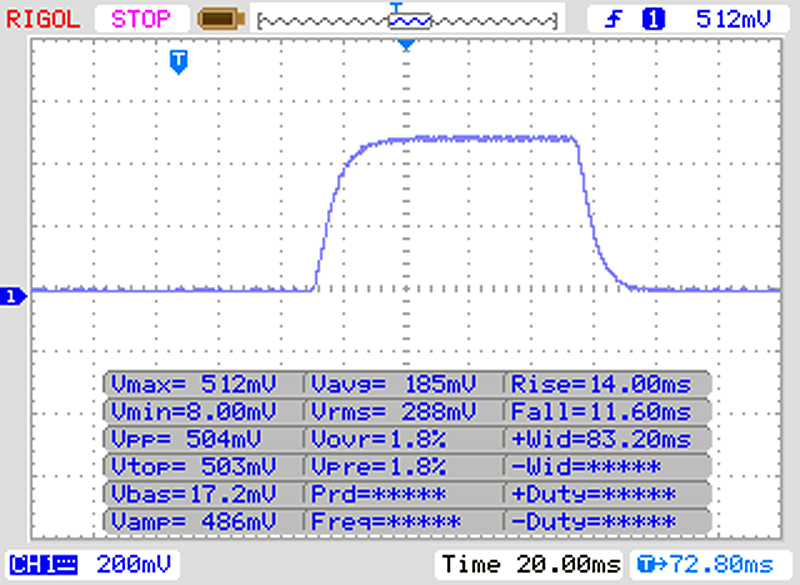 |
| ↘ 11 ms fall | ||
| The screen shows relatively slow response rates in our tests and may be too slow for gamers. In comparison, all tested devices range from 0.1 (minimum) to 240 (maximum) ms. » 59 % of all devices are better. This means that the measured response time is worse than the average of all tested devices (19.8 ms). | ||
| ↔ Response Time 50% Grey to 80% Grey | ||
| 42 ms ... rise ↗ and fall ↘ combined | ↗ 22 ms rise | 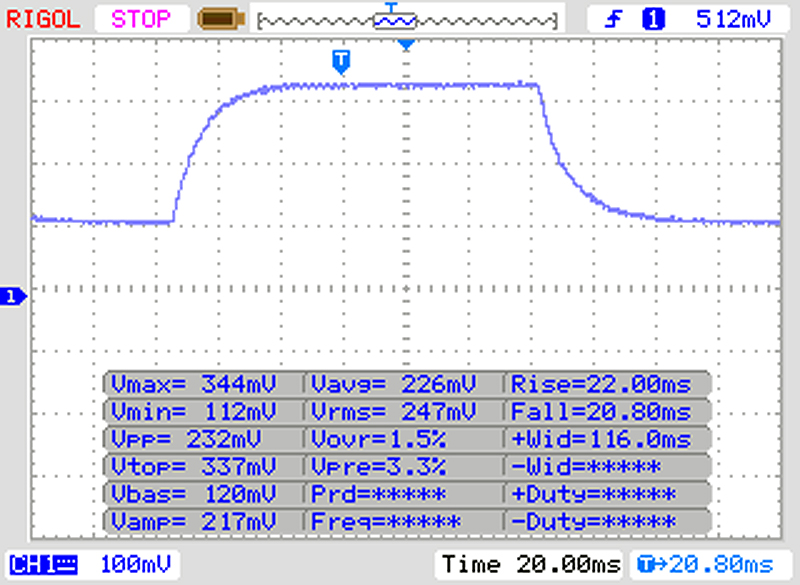 |
| ↘ 20 ms fall | ||
| The screen shows slow response rates in our tests and will be unsatisfactory for gamers. In comparison, all tested devices range from 0.165 (minimum) to 636 (maximum) ms. » 67 % of all devices are better. This means that the measured response time is worse than the average of all tested devices (31 ms). | ||
Screen Flickering / PWM (Pulse-Width Modulation)
| Screen flickering / PWM detected | 20800 Hz | ≤ 50 % brightness setting | 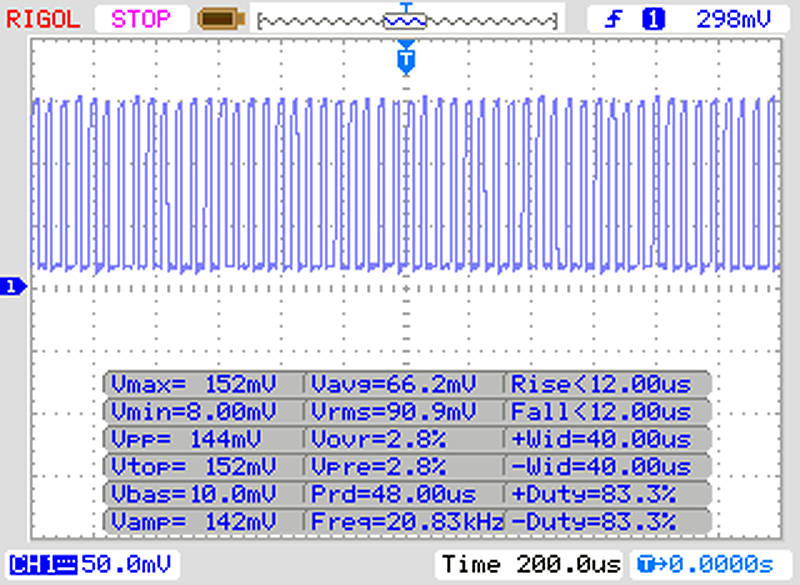 |
The display backlight flickers at 20800 Hz (worst case, e.g., utilizing PWM) Flickering detected at a brightness setting of 50 % and below. There should be no flickering or PWM above this brightness setting. The frequency of 20800 Hz is quite high, so most users sensitive to PWM should not notice any flickering. In comparison: 52 % of all tested devices do not use PWM to dim the display. If PWM was detected, an average of 7772 (minimum: 5 - maximum: 343500) Hz was measured. | |||
| PCMark 8 Home Score Accelerated v2 | 3088 points | |
| PCMark 8 Creative Score Accelerated v2 | 4227 points | |
| PCMark 8 Work Score Accelerated v2 | 3970 points | |
| PCMark 10 Score | 3076 points | |
Help | ||
| Microsoft Surface Pro 6, Core i5, 128 GB Toshiba KBG30ZPZ128G | Microsoft Surface Pro (2017) i5 Samsung PM971 KUS030202M | Microsoft Surface Pro 6, Core i7, 512 GB Toshiba KBG30ZPZ512G | Microsoft Surface Book 2 Samsung PM961 MZVLW256HEHP | Microsoft Surface Go MHN-00003 64 GB eMMC Flash | HP Elite x2 1013 G3-2TT14EA Samsung PM961 MZVLW256HEHP | Samsung Galaxy Book 12 SM-W728 Samsung SSD PM871a MZNLN256HMHQ | Huawei Matebook E SanDisk SD8SN8U256G1027 | Lenovo Miix 520-12IKB 20M3000LGE Samsung SSD PM961 1TB M.2 PCIe 3.0 x4 NVMe (MZVLW1T0) | Average Toshiba KBG30ZPZ128G | |
|---|---|---|---|---|---|---|---|---|---|---|
| CrystalDiskMark 3.0 | 240% | 212% | 202% | -39% | 312% | 148% | 106% | 336% | 0% | |
| Read Seq (MB/s) | 748 | 723 -3% | 651 -13% | 1370 83% | 259.6 -65% | 1786 139% | 511 -32% | 506 -32% | 883 18% | 748 ? 0% |
| Write Seq (MB/s) | 127.6 | 853 568% | 792 521% | 341.2 167% | 122.4 -4% | 1209 847% | 473.7 271% | 461 261% | 932 630% | 127.6 ? 0% |
| Read 512 (MB/s) | 385.3 | 225 -42% | 388.2 1% | 654 70% | 190.6 -51% | 717 86% | 443.7 15% | 341.9 -11% | 586 52% | 385 ? 0% |
| Write 512 (MB/s) | 115.8 | 445 284% | 575 397% | 337.9 192% | 107.1 -8% | 798 589% | 395.4 241% | 294.7 154% | 627 441% | 115.8 ? 0% |
| Read 4k (MB/s) | 29.93 | 46 54% | 43.75 46% | 43.64 46% | 19.06 -36% | 49.66 66% | 40.46 35% | 32.46 8% | 54.8 83% | 29.9 ? 0% |
| Write 4k (MB/s) | 39.77 | 125 214% | 97.2 144% | 148.5 273% | 24.27 -39% | 104.2 162% | 91.9 131% | 65.3 64% | 139.3 250% | 39.8 ? 0% |
| Read 4k QD32 (MB/s) | 192.7 | 423 120% | 241.2 25% | 465.5 142% | 34.45 -82% | 286 48% | 289.1 50% | 381.8 98% | 607 215% | 192.7 ? 0% |
| Write 4k QD32 (MB/s) | 45.38 | 373 722% | 304.9 572% | 337.1 643% | 33.64 -26% | 298.4 558% | 260.7 474% | 184.4 306% | 498.5 999% | 45.4 ? 0% |

| 3DMark 11 - 1280x720 Performance GPU | |
| Average of class Convertible (1505 - 40732, n=50, last 2 years) | |
| Microsoft Surface Book 2 | |
| Microsoft Surface Pro 6, Core i7, 512 GB | |
| Microsoft Surface Pro 6, Core i5, 128 GB | |
| Average Intel UHD Graphics 620 (1144 - 3432, n=244) | |
| Lenovo Miix 520-12IKB 20M3000LGE | |
| Lenovo Miix 520-12IKB 20M3000LGE | |
| Dell Latitude 5290 2-in-1 | |
| HP Elite x2 1013 G3-2TT14EA | |
| Samsung Galaxy Book 12 SM-W728 | |
| Microsoft Surface Go MHN-00003 | |
| Huawei Matebook E | |
| 3DMark 11 Performance | 2048 points | |
| 3DMark Cloud Gate Standard Score | 8748 points | |
Help | ||
| Thief - 1024x768 Very Low Preset | |
| Microsoft Surface Pro 6, Core i7, 512 GB | |
| Average Intel UHD Graphics 620 (16.3 - 34.3, n=10) | |
| Microsoft Surface Pro 6, Core i5, 128 GB | |
| Microsoft Surface Pro (2017) i5 | |
| Rise of the Tomb Raider - 1024x768 Lowest Preset | |
| Microsoft Surface Book 2 | |
| Microsoft Surface Pro 6, Core i7, 512 GB | |
| Average Intel UHD Graphics 620 (10.4 - 110.7, n=82) | |
| Samsung Galaxy Book 12 SM-W728 | |
| HP Elite x2 1013 G3-2TT14EA | |
| Microsoft Surface Pro (2017) i5 | |
| Microsoft Surface Pro 6, Core i5, 128 GB | |
| Microsoft Surface Go MHN-00003 | |
| Civilization 6 - 1024x768 Minimum Preset | |
| Microsoft Surface Pro 6, Core i7, 512 GB | |
| Microsoft Surface Pro 6, Core i5, 128 GB | |
| Average Intel UHD Graphics 620 (27.8 - 54.4, n=13) | |
| Farming Simulator 17 - 1366x768 Medium Preset | |
| Microsoft Surface Pro 6, Core i7, 512 GB | |
| Average Intel UHD Graphics 620 (8 - 67.9, n=12) | |
| Microsoft Surface Pro 6, Core i5, 128 GB | |
| Samsung Galaxy Book 12 SM-W728 | |
| Middle-earth: Shadow of War - 1280x720 Lowest Preset | |
| Microsoft Surface Pro 6, Core i7, 512 GB | |
| Average Intel UHD Graphics 620 (18 - 23, n=3) | |
| Microsoft Surface Pro 6, Core i5, 128 GB | |
| F1 2018 - 1280x720 Ultra Low Preset | |
| Microsoft Surface Pro 6, Core i5, 128 GB | |
| Average Intel UHD Graphics 620 (31 - 35.8, n=5) | |
| Microsoft Surface Pro 6, Core i7, 512 GB | |
| Shadow of the Tomb Raider - 1280x720 Lowest Preset | |
| Average of class Convertible (24 - 180, n=2, last 2 years) | |
| Microsoft Surface Pro 6, Core i5, 128 GB | |
| Microsoft Surface Pro 6, Core i7, 512 GB | |
| Average Intel UHD Graphics 620 (12 - 21.7, n=13) | |
| low | med. | high | ultra | |
|---|---|---|---|---|
| BioShock Infinite (2013) | 70.2 | 38 | 31.9 | 8.6 |
| Thief (2014) | 23.7 | 10.4 | 8.5 | |
| Dota 2 Reborn (2015) | 72.9 | 46.3 | 20.6 | 18.3 |
| Rise of the Tomb Raider (2016) | 14.1 | 8.9 | ||
| Civilization 6 (2016) | 38.8 | 14.1 | 5.9 | |
| Farming Simulator 17 (2016) | 58.1 | 47.8 | 19 | |
| Middle-earth: Shadow of War (2017) | 18 | 10 | ||
| X-Plane 11.11 (2018) | 30.3 | 22.7 | 19.1 | |
| F1 2018 (2018) | 35.8 | 11 | 9 | 4 |
| Shadow of the Tomb Raider (2018) | 21.7 | 5.4 |
(+) The maximum temperature on the upper side is 39.7 °C / 103 F, compared to the average of 35.4 °C / 96 F, ranging from 19.6 to 60 °C for the class Convertible.
(±) The bottom heats up to a maximum of 41.1 °C / 106 F, compared to the average of 36.9 °C / 98 F
(+) In idle usage, the average temperature for the upper side is 31.2 °C / 88 F, compared to the device average of 30.3 °C / 87 F.
(±) The palmrests and touchpad can get very hot to the touch with a maximum of 39.1 °C / 102.4 F.
(-) The average temperature of the palmrest area of similar devices was 28 °C / 82.4 F (-11.1 °C / -20 F).
| Off / Standby | |
| Idle | |
| Load |
|
Key:
min: | |
| Microsoft Surface Pro 6, Core i5, 128 GB i5-8250U, UHD Graphics 620, Toshiba KBG30ZPZ128G, IPS, 2736x1834, 12.3" | Microsoft Surface Pro (2017) i5 i5-7300U, HD Graphics 620, Samsung PM971 KUS030202M, IPS, 2736x1824, 12.3" | Microsoft Surface Pro 6, Core i7, 512 GB i7-8650U, UHD Graphics 620, Toshiba KBG30ZPZ512G, IPS, 2736x1824, 12.3" | Microsoft Surface Book 2 i7-8650U, GeForce GTX 1050 Mobile, Samsung PM961 MZVLW256HEHP, IPS, 3000x2000, 13.5" | Microsoft Surface Go MHN-00003 Pentium 4415Y, UHD Graphics 615, 64 GB eMMC Flash, IPS, 1800x1200, 10" | Dell Latitude 5290 2-in-1 i5-8350U, UHD Graphics 620, Toshiba XG5 KXG50ZNV256G, IPS, 1920x1280, 12.3" | HP Elite x2 1013 G3-2TT14EA i5-8350U, UHD Graphics 620, Samsung PM961 MZVLW256HEHP, IPS, 3000x2000, 13" | Samsung Galaxy Book 12 SM-W728 i5-7200U, HD Graphics 620, Samsung SSD PM871a MZNLN256HMHQ, Super AMOLED, 2160x1440, 12" | Huawei Matebook E i5-7Y54, HD Graphics 615, SanDisk SD8SN8U256G1027, IPS, 2160x1440, 12" | Lenovo Miix 520-12IKB 20M3000LGE i5-8550U, UHD Graphics 620, Samsung SSD PM961 1TB M.2 PCIe 3.0 x4 NVMe (MZVLW1T0), IPS, 1920x1200, 12.2" | Average Intel UHD Graphics 620 | Average of class Convertible | |
|---|---|---|---|---|---|---|---|---|---|---|---|---|
| Power Consumption | 12% | -3% | -94% | 33% | -3% | -13% | -2% | 14% | 4% | -7% | -27% | |
| Idle Minimum * (Watt) | 4.3 | 3.6 16% | 3.2 26% | 4.7 -9% | 2.88 33% | 3 30% | 4.9 -14% | 3.9 9% | 3.9 9% | 3.9 9% | 3.81 ? 11% | 4.22 ? 2% |
| Idle Average * (Watt) | 8.7 | 8.1 7% | 8.7 -0% | 10.6 -22% | 4.8 45% | 7.2 17% | 8.9 -2% | 9 -3% | 8.8 -1% | 8.2 6% | 6.94 ? 20% | 6.97 ? 20% |
| Idle Maximum * (Watt) | 9.4 | 8.7 7% | 10.4 -11% | 12.3 -31% | 7.5 20% | 10 -6% | 11 -17% | 11.9 -27% | 8.9 5% | 8.4 11% | 8.75 ? 7% | 8.63 ? 8% |
| Load Average * (Watt) | 24.5 | 25.5 -4% | 29.2 -19% | 81 -231% | 16.9 31% | 37.1 -51% | 32 -31% | 27.3 -11% | 20 18% | 25.2 -3% | 35 ? -43% | 43.9 ? -79% |
| Load Maximum * (Watt) | 36 | 23.5 35% | 40.8 -13% | 100.3 -179% | 23.8 34% | 38.2 -6% | 36 -0% | 27.9 23% | 21.8 39% | 37 -3% | 47.5 ? -32% | 67.1 ? -86% |
| Witcher 3 ultra * (Watt) | 97 |
* ... smaller is better
| Microsoft Surface Pro 6, Core i5, 128 GB i5-8250U, UHD Graphics 620, 45 Wh | Microsoft Surface Pro (2017) i5 i5-7300U, HD Graphics 620, 45 Wh | Microsoft Surface Pro 6, Core i7, 512 GB i7-8650U, UHD Graphics 620, 45 Wh | Microsoft Surface Book 2 i7-8650U, GeForce GTX 1050 Mobile, 75 Wh | Microsoft Surface Go MHN-00003 Pentium 4415Y, UHD Graphics 615, 28 Wh | Dell Latitude 5290 2-in-1 i5-8350U, UHD Graphics 620, 42 Wh | HP Elite x2 1013 G3-2TT14EA i5-8350U, UHD Graphics 620, 50 Wh | Samsung Galaxy Book 12 SM-W728 i5-7200U, HD Graphics 620, 39 Wh | Huawei Matebook E i5-7Y54, HD Graphics 615, 33.7 Wh | Lenovo Miix 520-12IKB 20M3000LGE i5-8550U, UHD Graphics 620, 38 Wh | Average of class Convertible | |
|---|---|---|---|---|---|---|---|---|---|---|---|
| Battery runtime | 25% | 2% | 40% | 1% | -38% | -9% | -3% | -25% | -38% | 26% | |
| Reader / Idle (h) | 17.8 | 17.6 -1% | 18.1 2% | 24.5 38% | 12.9 -28% | 13 -27% | 17.2 -3% | 27.7 ? 56% | |||
| WiFi v1.3 (h) | 9.1 | 12.4 36% | 8.5 -7% | 11.1 22% | 7.5 -18% | 5 -45% | 7.7 -15% | 6.8 -25% | 5.6 -38% | 12.1 ? 33% | |
| Load (h) | 2 | 2.8 40% | 2.2 10% | 3.2 60% | 3 50% | 1.4 -30% | 2.3 15% | 1.779 ? -11% | |||
| H.264 (h) | 15.6 | 6.4 | 6.5 | 6.8 | 15.3 ? | ||||||
| Witcher 3 ultra (h) | 3.8 |
Pros
Cons
2018款 Surface Pro仍然是最好的Windows平板电脑之一,它有着优秀的做工,出色的屏幕,可圈可点的相机,好用的输入设备(即使Type Cover和手写笔需另外购买),以及一个非常不错的麦克风。
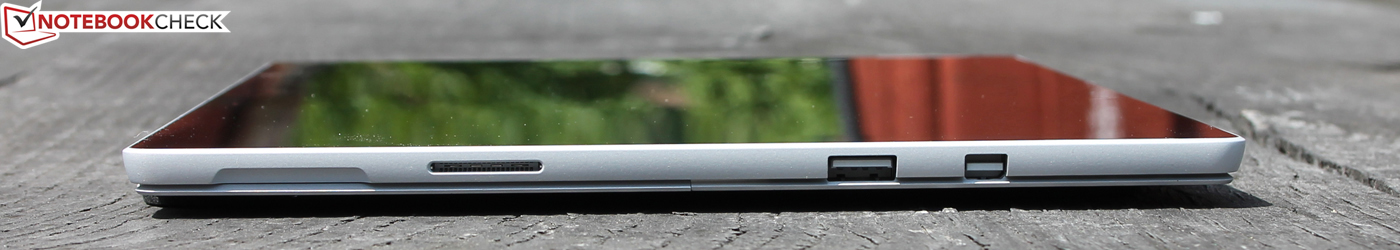
但是,与同类型产品相比,它并没有在每个方面都做到最好。接口选择仍然很有限,USB-C应该是今年每一台设备的标配,而且最好能支持雷电3。然而,即使在其最高端的Surface Book上,微软仍然没有配备雷电3.
凭借其相同的外壳,屏幕,输入设备和接口选择,Surface Pro i5版与i7版有着同样的91分评分。不过,两者间的差异仍然非常明显:尽管续航时间大致相同,在纯粹的性能上差别却不小。i7版本的性能提升了22%,并没有像i5那样降频-前者在高负荷情况下只有11%的降频,后者则达到了25%。
如果你需要性能,i7版会是更好的选择,不过,对于办公和上网使用来说,i5完全够用。
坏消息是,微软选择了较慢的东芝NVMe SSD(128 GB),而i7版配备的512 GB硬盘则快得多。慢速SSD是这台设备PCMark性能不佳的罪魁祸首。
i7和i5型号在纯粹计算能力上可能有很大差异,但它们在PCMark跑分中相差只有5-18%,尽管512GB的SSD性能要好得多。
“实际性能的细小差距不禁使我们发问:i7型号是否值得购买?性能狂热者可能会从i7版中获利,因为它的理论性能要高出i5版22%。”
我们认为对于办公和浏览网页的需求来说,i7会有点性能过剩,i5版则刚刚好。
不幸的是,2018款的续航由2017款的12小时降到了9小时,不过即便如此,它仍比使用Kaby Lake-R平台的竞品有着更好的续航表现。
惠普Elite x2 1013 G3是Surface Pro的绝佳替代品,其性能与Surface Pro i7版本相当,不过续航略短。作为补偿,Elite x2 1013 G3配有两个雷电3接口和3:2的3K屏幕。
在撰写本文时,还有另外一台竞品-联想ThinkPad X1 Tablet-在接受我们的测评。它配备了手写笔,3000×2000分辨率的屏幕和LTE模块,但是这台13英寸平板重量偏高(连键盘1270克)。与Surface Pro相同,它有着3:2的屏幕比例,但多了两个雷电3接口,看起来是一个更好的选择。我们的测评将很快完成并发布。
2018/11/7更新,256 GB SSD更快:
256 GB型号不仅提供了两倍的存储空间,速度也得到了显著提高。东芝的KBG30ZPZ256G比128 GB型号平均要快30%,这导致PCMark基准测试得分提高了2-10%。
3000元的差价是否值得取决于买家自己,毕竟您可能不需要额外的存储空间。不过,无论是否是微软有意而为,256 GB的Surface Pro 6还是会比128 GB版稍快一些。
Microsoft Surface Pro 6, Core i5, 128 GB
- 02/17/2020 v7 (old)
Sebastian Jentsch
Price comparison

