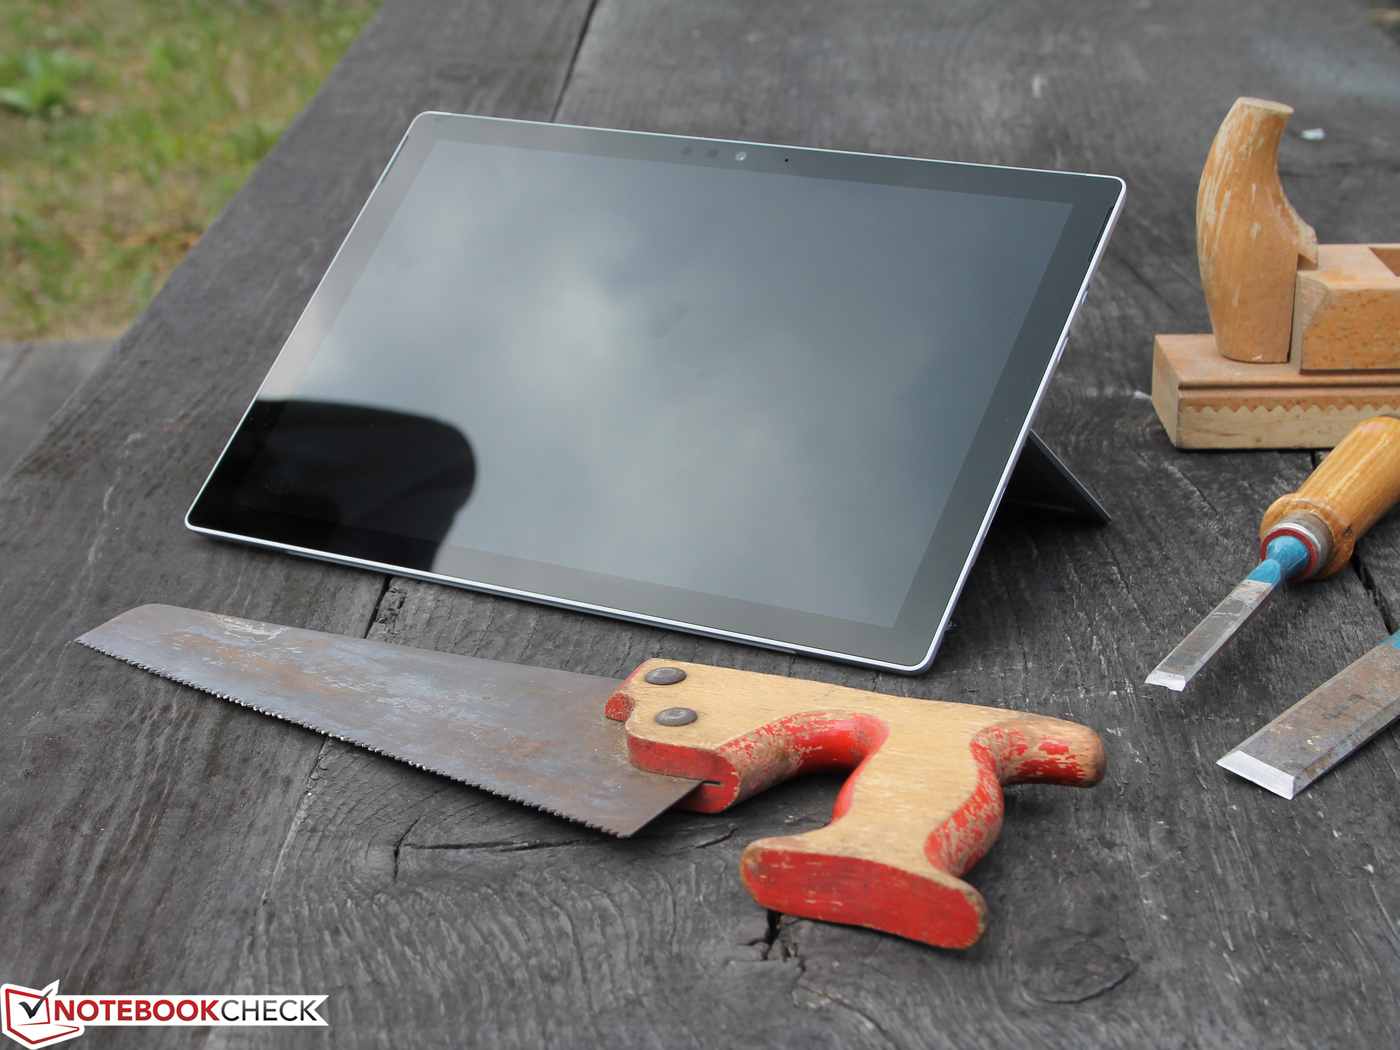
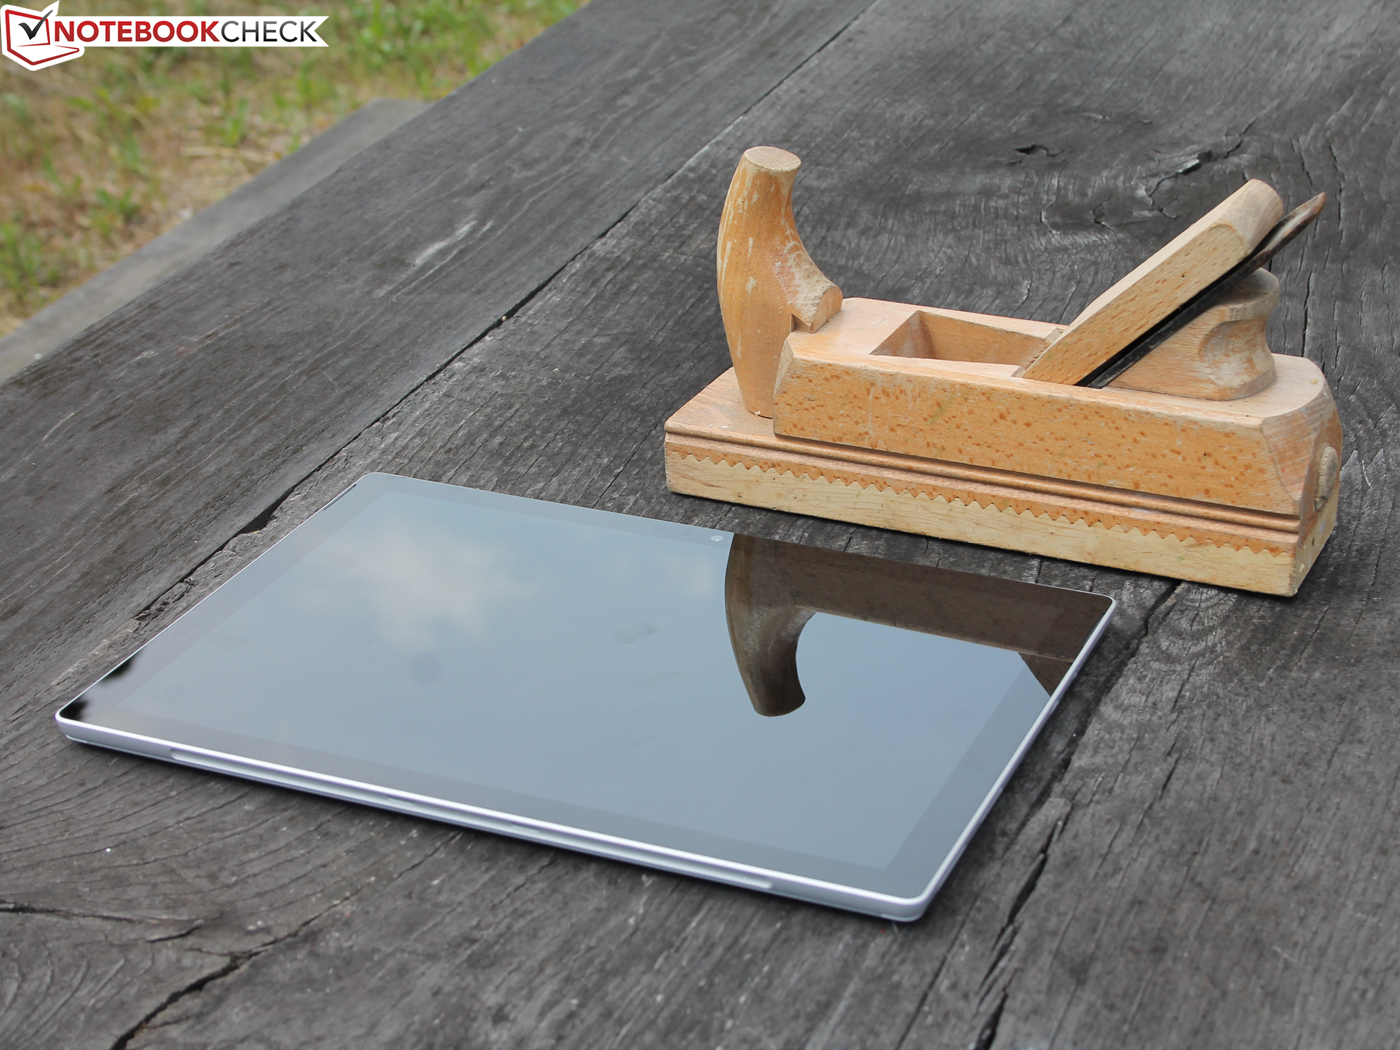
微软 Surface Pro 2017 (i5-7300U, 256 GB) 变形本简短评测
| |||||||||||||||||||||||||
Brightness Distribution: 88 %
Center on Battery: 417 cd/m²
Contrast: 1438:1 (Black: 0.29 cd/m²)
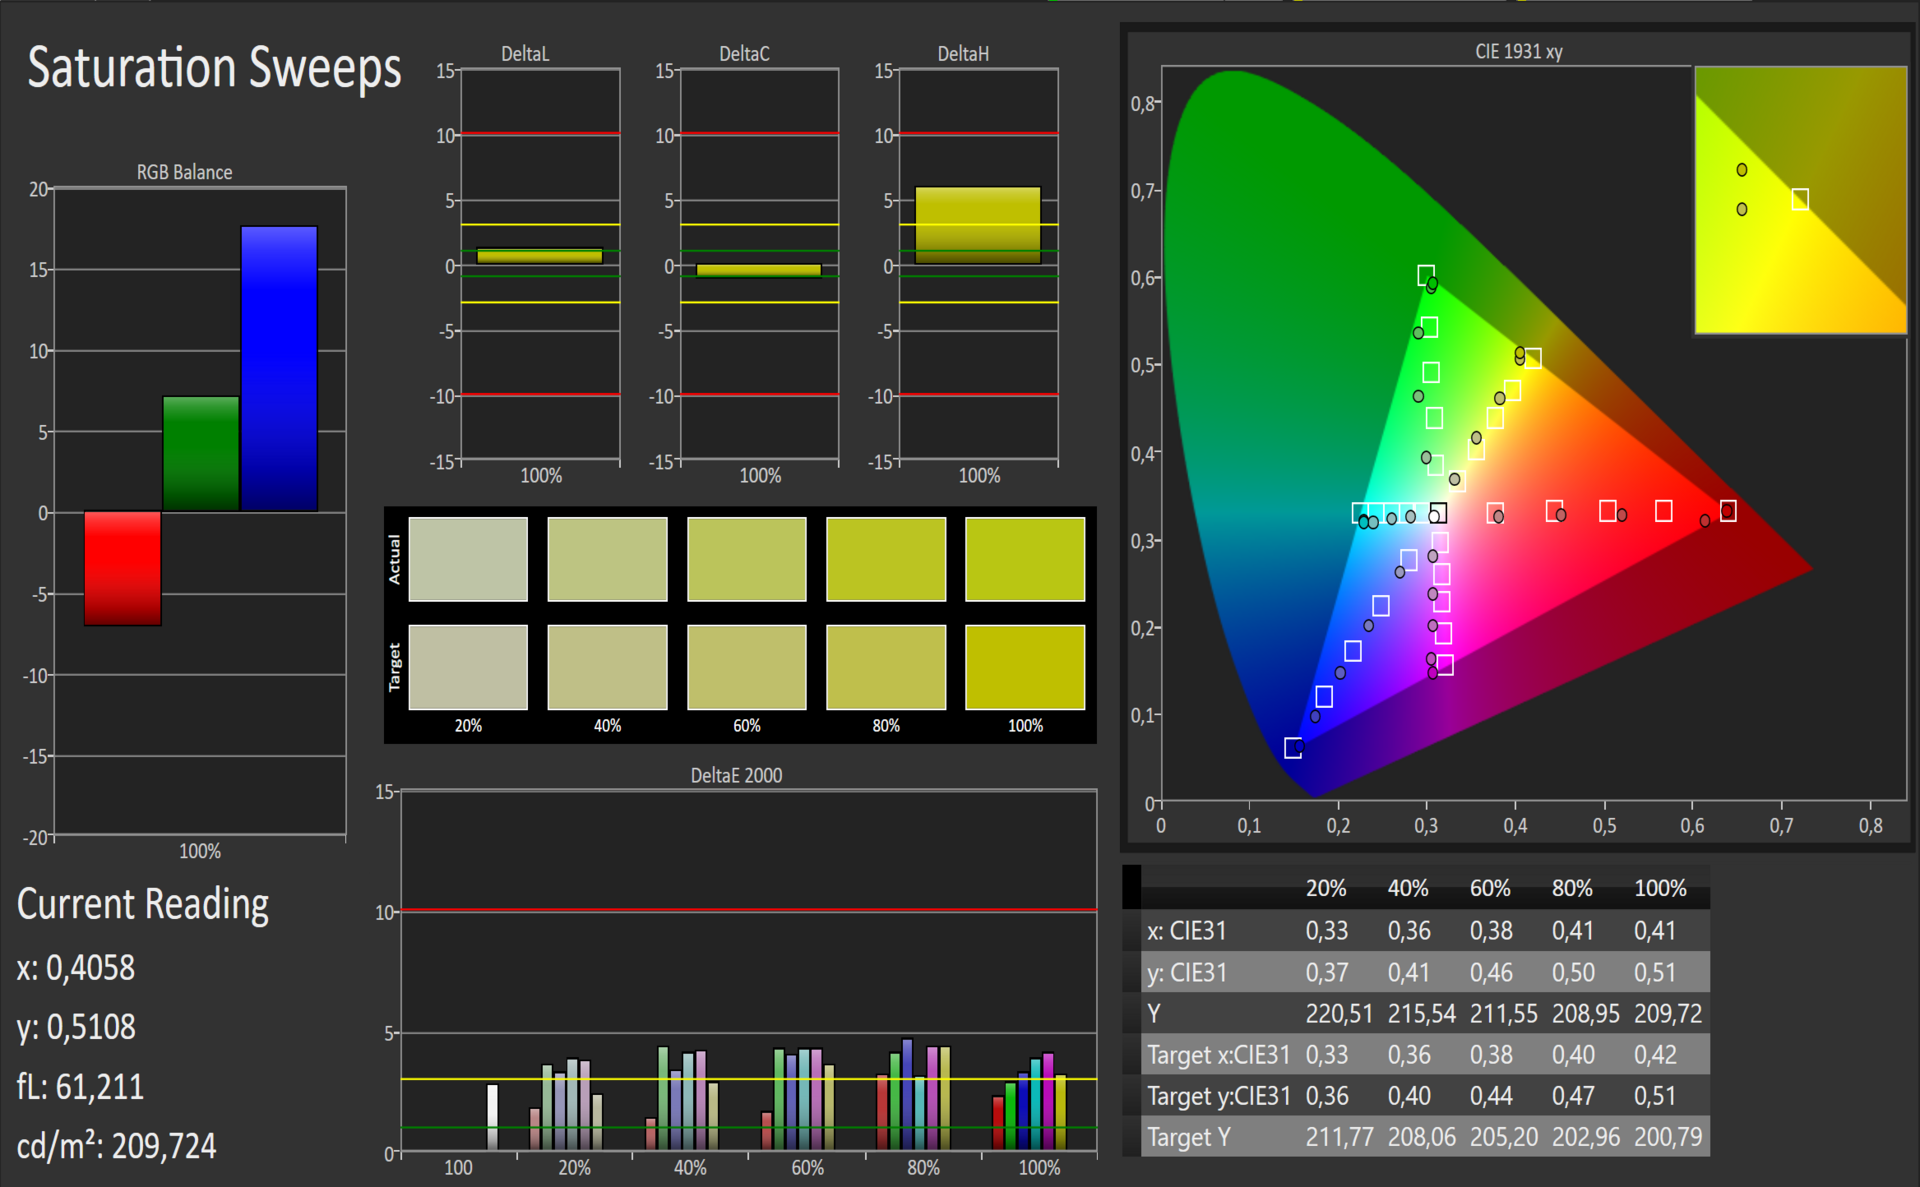
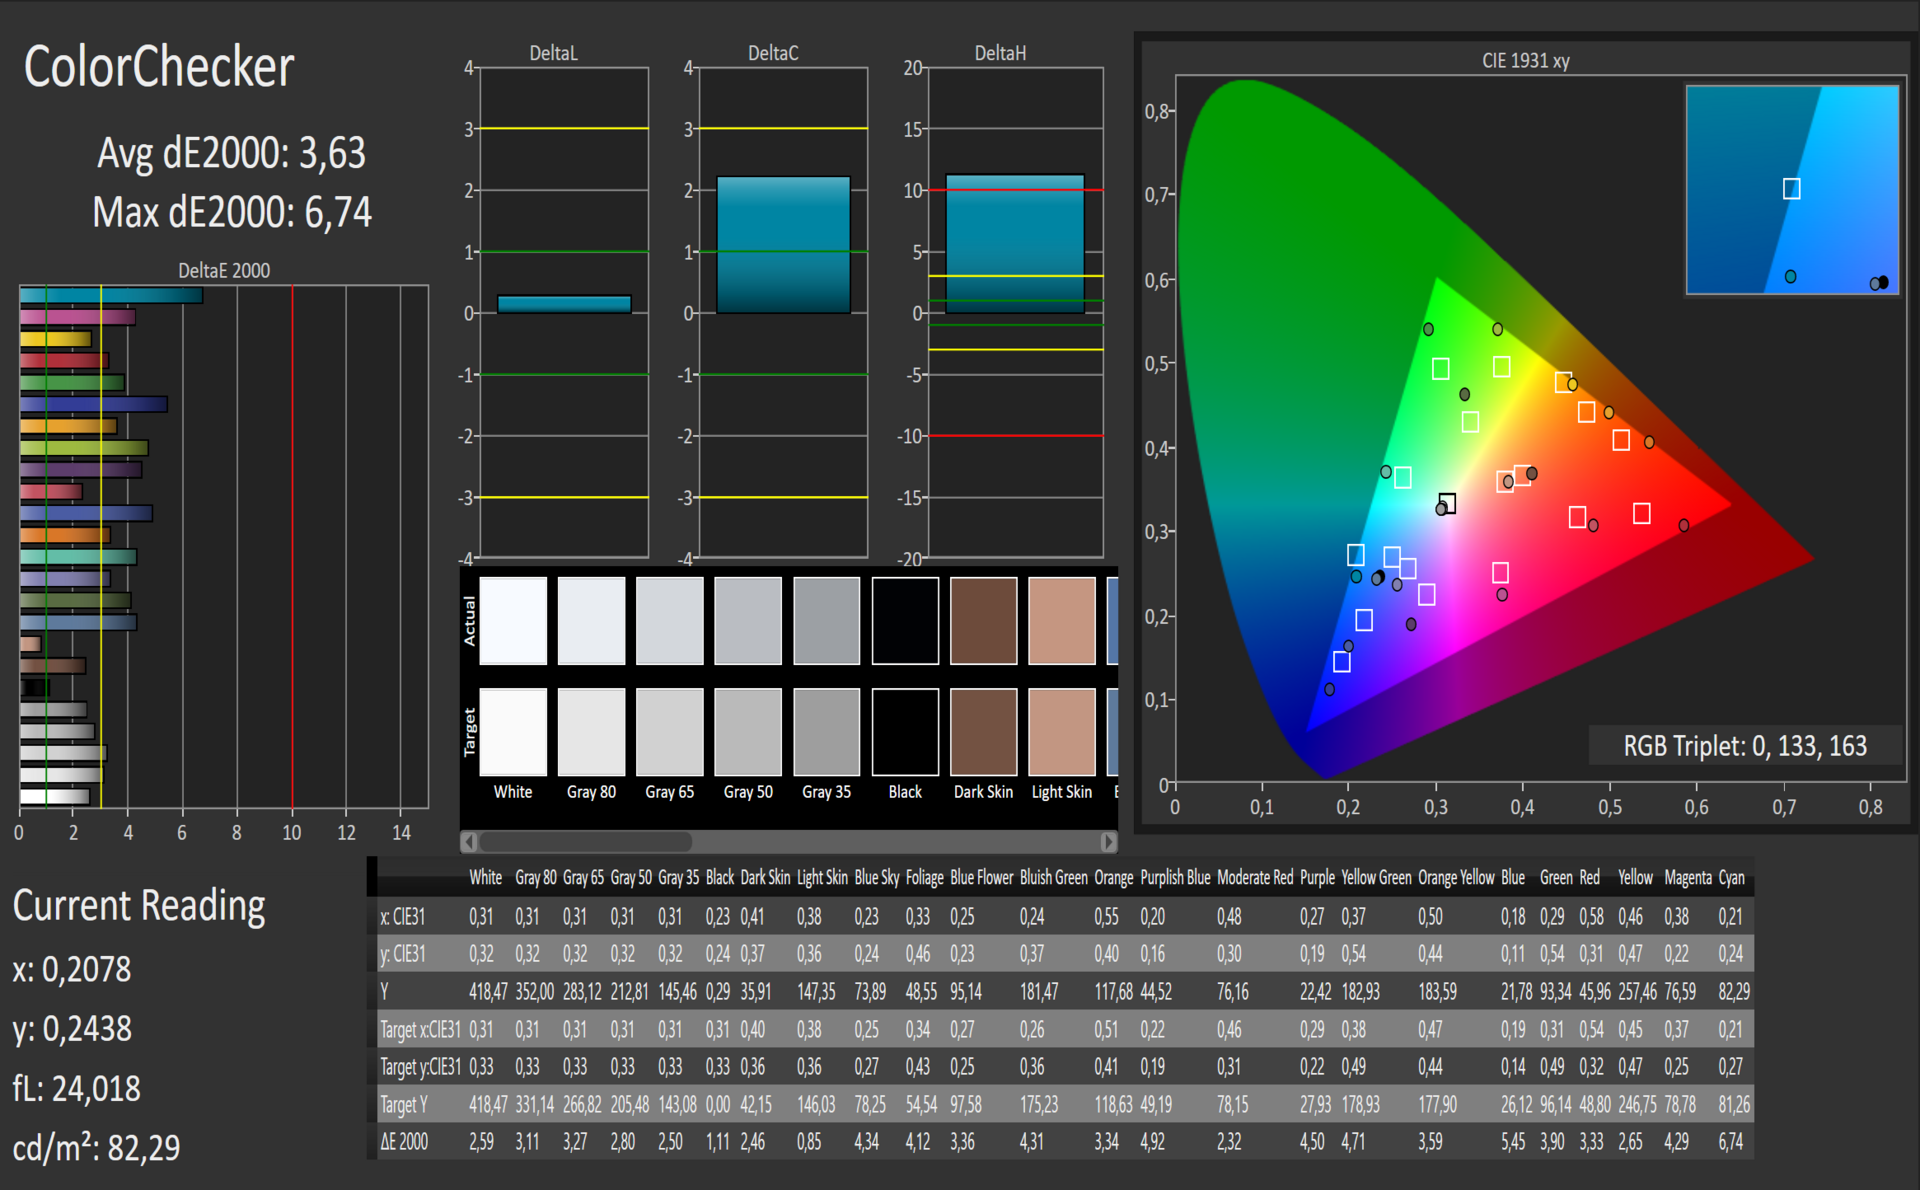
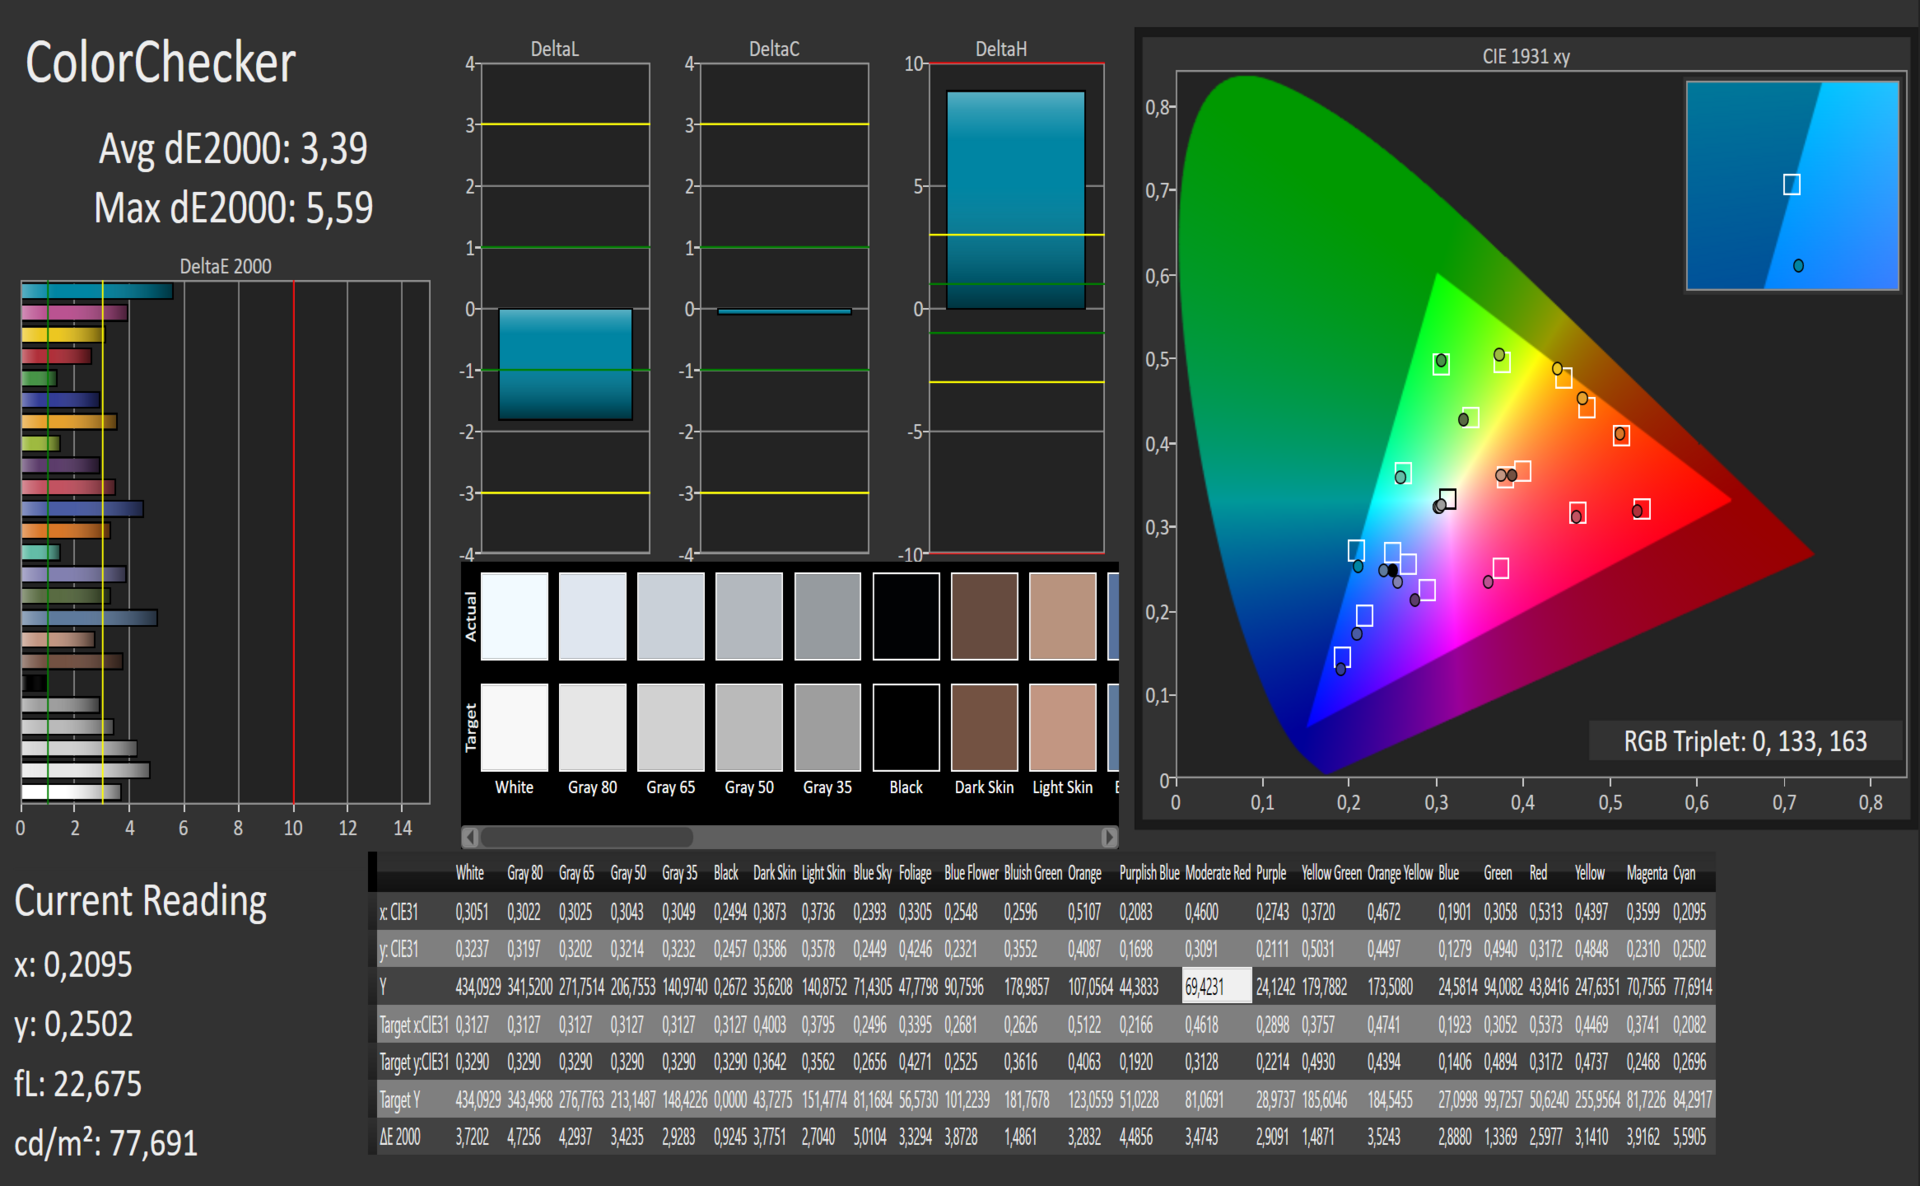
ΔE ColorChecker Calman: 3.63 | ∀{0.5-29.43 Ø4.73}
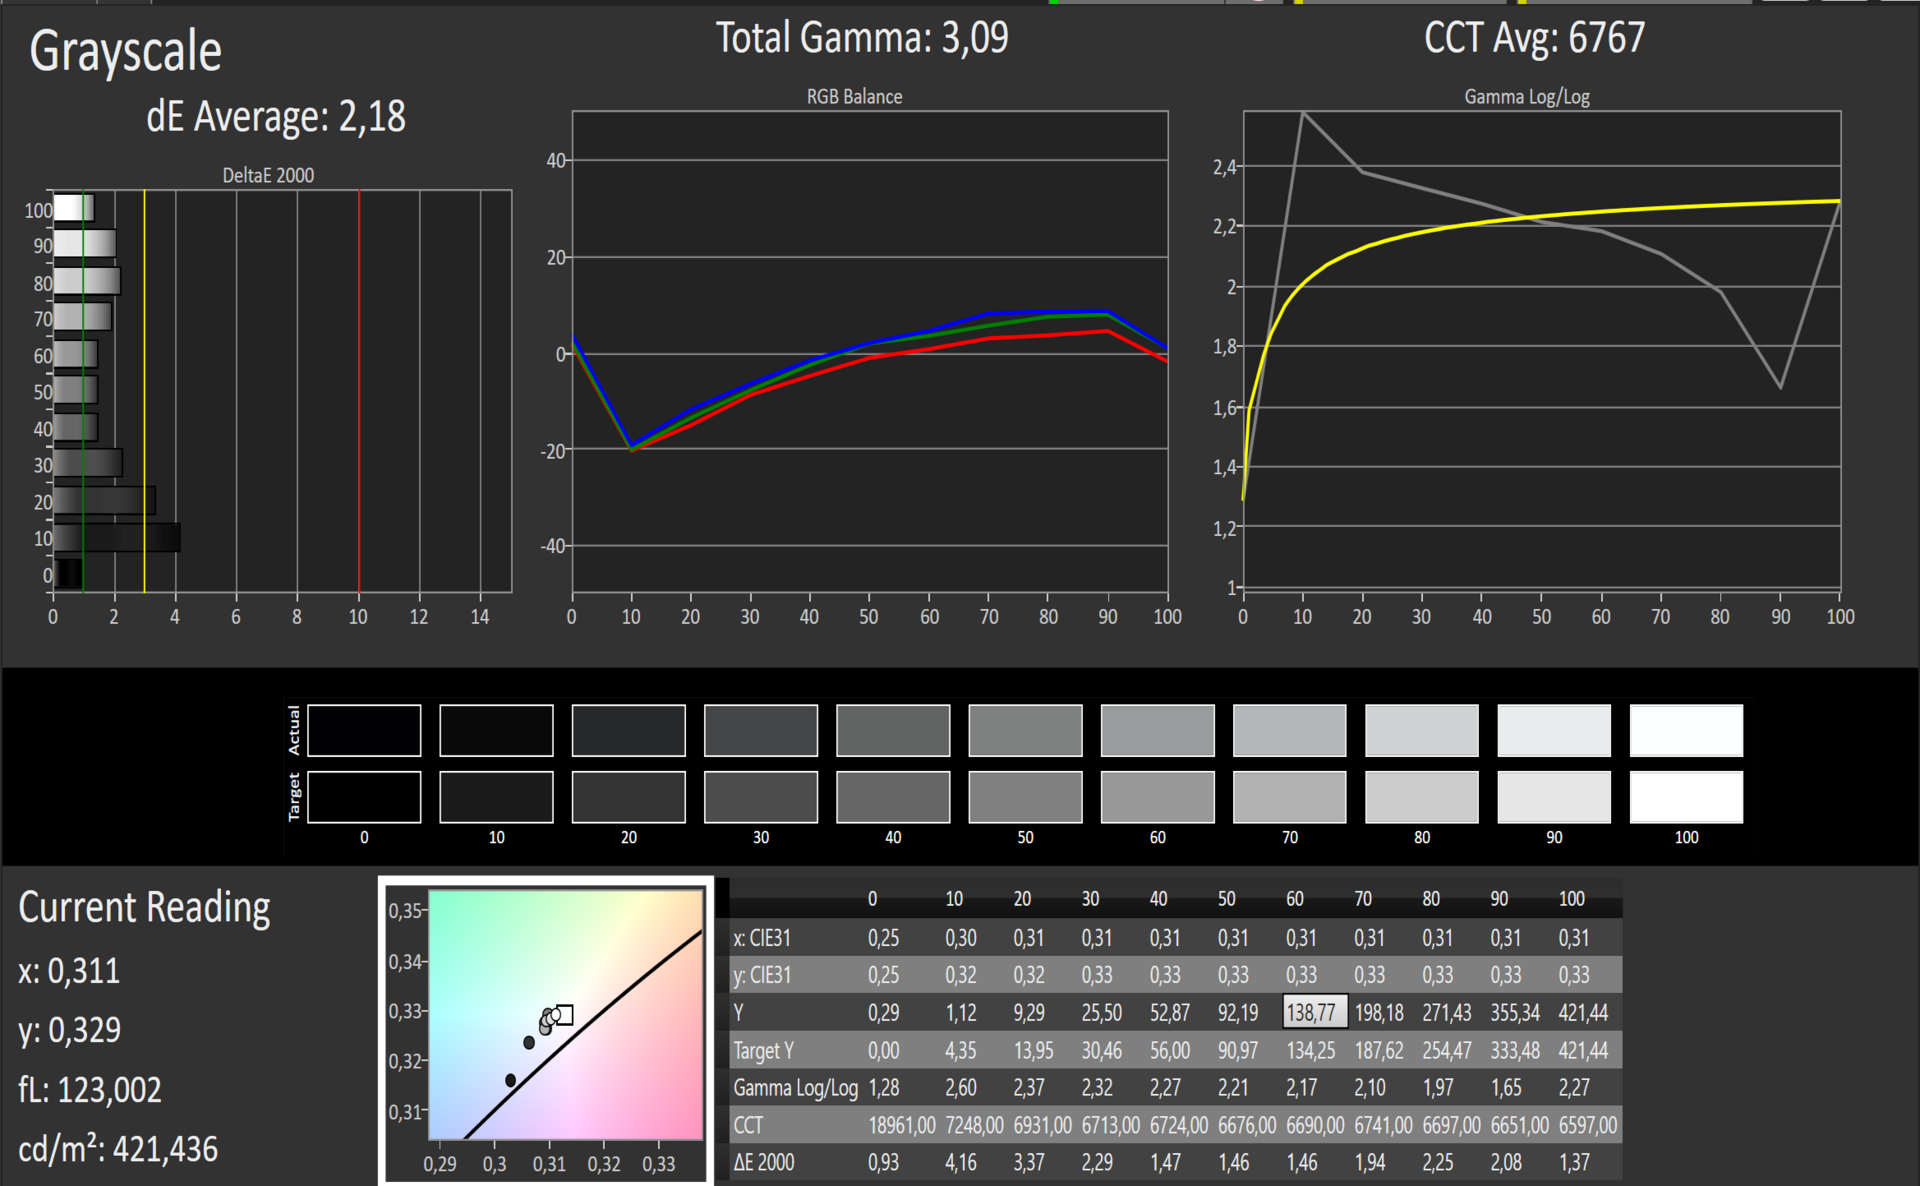
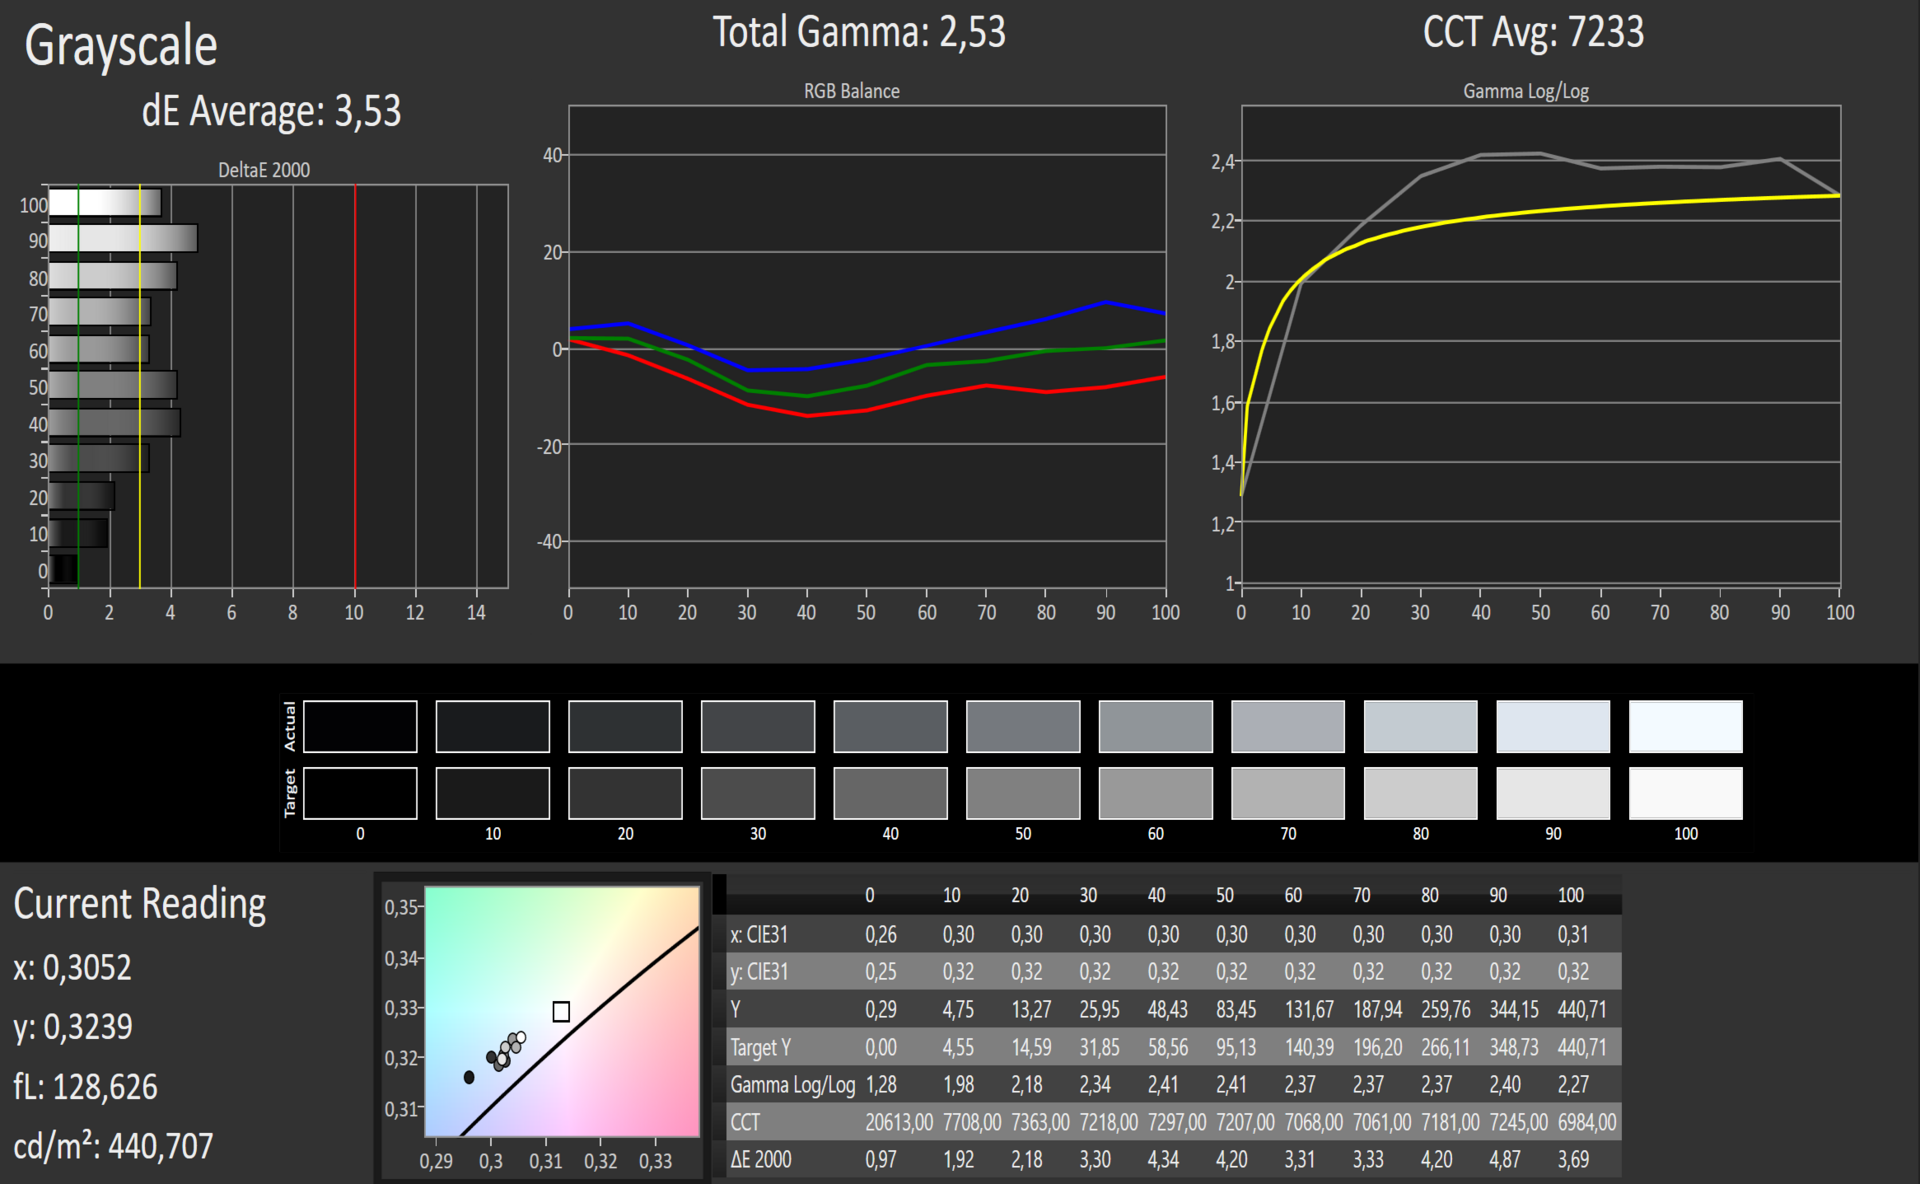
ΔE Greyscale Calman: 2.18 | ∀{0.09-98 Ø4.97}
99% sRGB (Argyll 1.6.3 3D)
63% AdobeRGB 1998 (Argyll 1.6.3 3D)
69.1% AdobeRGB 1998 (Argyll 3D)
99% sRGB (Argyll 3D)
67.6% Display P3 (Argyll 3D)
Gamma: 3.09
CCT: 6767 K
| Microsoft Surface Pro (2017) i5 LG Display LP123WQ112604, , 2736x1824, 12.3" | Microsoft Surface Pro 4, Core i5, 128GB Samsung 123YL01-001 ID: SDC3853, , 2736x1824, 12.3" | Lenovo Ideapad Miix 720-12IKB AUO B120YAN01 / AUO106F, , 2880x1920, 12" | Lenovo ThinkPad X1 Tablet Gen 2 LSN120QL01L01, , 2160x1440, 12" | Asus Transformer 3 Pro T303UA-GN050T BOE BOE06AC (NV126A1M-N51), , 2880x1920, 12.6" | Toshiba Portege Z20t-C-121 Toshiba TOS508F, , 1920x1080, 12.5" | Dell Latitude 12 5285 2-in-1 BOE06DC, , 1920x1280, 12.3" | HP Elite x2 1012 G1 LG Philips, , 1920x1280, 12.1" | |
|---|---|---|---|---|---|---|---|---|
| Display | -3% | -5% | 13% | -36% | -6% | -23% | ||
| Display P3 Coverage (%) | 67.6 | 65 -4% | 65.2 -4% | 81.8 21% | 42.51 -37% | 62.8 -7% | 53.8 -20% | |
| sRGB Coverage (%) | 99 | 96.5 -3% | 91 -8% | 98.3 -1% | 63.7 -36% | 94 -5% | 73.7 -26% | |
| AdobeRGB 1998 Coverage (%) | 69.1 | 67 -3% | 66.1 -4% | 82.2 19% | 43.95 -36% | 64.7 -6% | 53.8 -22% | |
| Response Times | -9% | 5% | 27% | 15% | -35% | -4% | 21% | |
| Response Time Grey 50% / Grey 80% * (ms) | 42 ? | 46 ? -10% | 45 ? -7% | 28.4 ? 32% | 30 ? 29% | 61 ? -45% | 42.4 ? -1% | 33.2 ? 21% |
| Response Time Black / White * (ms) | 29 ? | 31.2 ? -8% | 24 ? 17% | 22.8 ? 21% | 29 ? -0% | 36 ? -24% | 30.8 ? -6% | 22.8 ? 21% |
| PWM Frequency (Hz) | 21000 | 50 ? | 221.2 ? | 200 ? | 210.1 ? | |||
| Screen | -13% | -33% | -35% | -23% | -82% | -20% | -48% | |
| Brightness middle (cd/m²) | 417 | 413 -1% | 406 -3% | 388.1 -7% | 316 -24% | 354 -15% | 523.2 25% | 322 -23% |
| Brightness (cd/m²) | 401 | 396 -1% | 396 -1% | 344 -14% | 307 -23% | 330 -18% | 522 30% | 319 -20% |
| Brightness Distribution (%) | 88 | 87 -1% | 88 0% | 78 -11% | 91 3% | 86 -2% | 88 0% | 97 10% |
| Black Level * (cd/m²) | 0.29 | 0.36 -24% | 0.3 -3% | 0.39 -34% | 0.29 -0% | 0.63 -117% | 0.42 -45% | 0.42 -45% |
| Contrast (:1) | 1438 | 1147 -20% | 1353 -6% | 995 -31% | 1090 -24% | 562 -61% | 1246 -13% | 767 -47% |
| Colorchecker dE 2000 * | 3.63 | 3.09 15% | 5.28 -45% | 4.6 -27% | 3.91 -8% | 8.28 -128% | 4 -10% | 6.02 -66% |
| Colorchecker dE 2000 max. * | 6.74 | 9.83 -46% | 9.1 -35% | 7.9 -17% | 12.71 -89% | 8.6 -28% | 10.06 -49% | |
| Greyscale dE 2000 * | 2.18 | 3.92 -80% | 6.71 -208% | 6.1 -180% | 5.37 -146% | 9.15 -320% | 5.5 -152% | 6.29 -189% |
| Gamma | 3.09 71% | 2.3 96% | 2.29 96% | 2.07 106% | 2.36 93% | 2.73 81% | 2.16 102% | 2.4 92% |
| CCT | 6767 96% | 7333 89% | 6532 100% | 7104 91% | 7812 83% | 5953 109% | 7546 86% | 7712 84% |
| Color Space (Percent of AdobeRGB 1998) (%) | 63 | 61 -3% | 59 -6% | 59 -6% | 72 14% | 40 -37% | 64.86 3% | 47.8 -24% |
| Color Space (Percent of sRGB) (%) | 99 | 97 -2% | 91 -8% | 91 -8% | 98 -1% | 63 -36% | 93.97 -5% | 73.2 -26% |
| Total Average (Program / Settings) | -8% /
-10% | -11% /
-22% | -4% /
-25% | 2% /
-11% | -51% /
-67% | -10% /
-15% | -17% /
-34% |
* ... smaller is better
Display Response Times
| ↔ Response Time Black to White | ||
|---|---|---|
| 29 ms ... rise ↗ and fall ↘ combined | ↗ 18 ms rise | 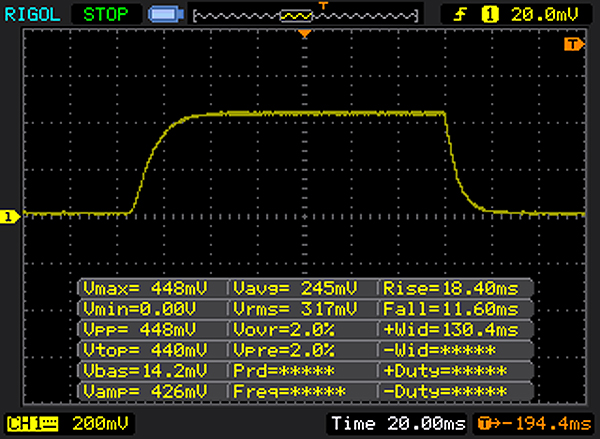 |
| ↘ 11 ms fall | ||
| The screen shows relatively slow response rates in our tests and may be too slow for gamers. In comparison, all tested devices range from 0.1 (minimum) to 240 (maximum) ms. » 77 % of all devices are better. This means that the measured response time is worse than the average of all tested devices (19.9 ms). | ||
| ↔ Response Time 50% Grey to 80% Grey | ||
| 42 ms ... rise ↗ and fall ↘ combined | ↗ 20 ms rise | 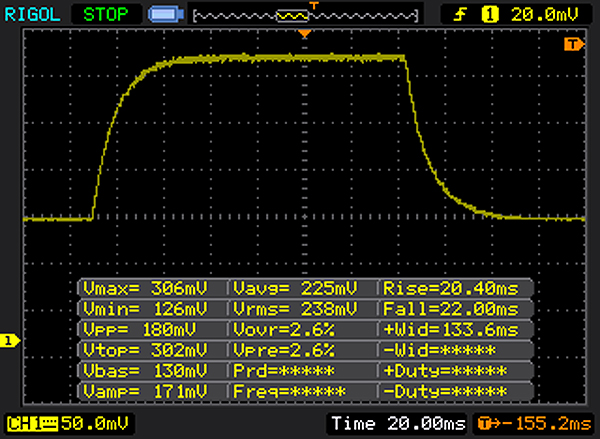 |
| ↘ 22 ms fall | ||
| The screen shows slow response rates in our tests and will be unsatisfactory for gamers. In comparison, all tested devices range from 0.165 (minimum) to 636 (maximum) ms. » 67 % of all devices are better. This means that the measured response time is worse than the average of all tested devices (31.1 ms). | ||
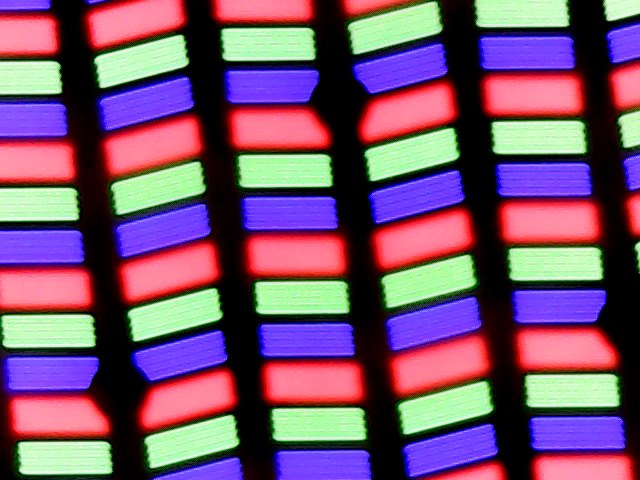
Screen Flickering / PWM (Pulse-Width Modulation)
| Screen flickering / PWM detected | 21000 Hz | 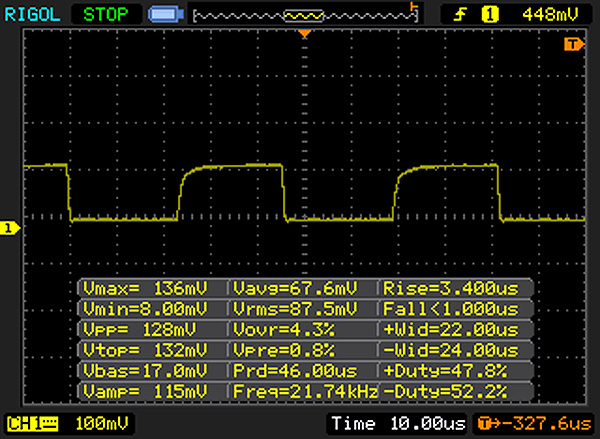 | |
The display backlight flickers at 21000 Hz (worst case, e.g., utilizing PWM) . The frequency of 21000 Hz is quite high, so most users sensitive to PWM should not notice any flickering. In comparison: 52 % of all tested devices do not use PWM to dim the display. If PWM was detected, an average of 7794 (minimum: 5 - maximum: 343500) Hz was measured. | |||
| PCMark 8 Home Score Accelerated v2 | 2936 points | |
| PCMark 8 Work Score Accelerated v2 | 3983 points | |
| PCMark 10 Score | 2957 points | |
Help | ||
| Microsoft Surface Pro (2017) i5 Samsung PM971 KUS030202M | Microsoft Surface Pro 4, Core i5, 128GB Samsung MZFLV128 NVMe | Lenovo Ideapad Miix 720-12IKB Samsung SSD PM961 1TB M.2 PCIe 3.0 x4 NVMe (MZVLW1T0) | Lenovo ThinkPad X1 Tablet Gen 2 Samsung PM961 MZVLW256HEHP | Asus Transformer 3 Pro T303UA-GN050T SK Hynix Canvas SC300 512GB M.2 (HFS512G39MND) | Toshiba Portege Z20t-C-121 Samsung SSD PM871 MZNLN512HCJH | Dell Latitude 12 5285 2-in-1 Samsung PM961 MZVLW256HEHP | HP Elite x2 1012 G1 Liteon L8H-256V2G | |
|---|---|---|---|---|---|---|---|---|
| CrystalDiskMark 3.0 | -33% | 135% | 54% | -33% | -10% | 19% | -25% | |
| Read Seq (MB/s) | 723 | 666 -8% | 2408 233% | 1739 141% | 398.9 -45% | 505 -30% | 1294 79% | 501 -31% |
| Write Seq (MB/s) | 853 | 154.2 -82% | 1702 100% | 1259 48% | 402 -53% | 501 -41% | 865 1% | 297.2 -65% |
| Read 512 (MB/s) | 225 | 266.3 18% | 1301 478% | 698 210% | 303.1 35% | 412.6 83% | 406 80% | 351.7 56% |
| Write 512 (MB/s) | 445 | 154.2 -65% | 1288 189% | 869 95% | 320.3 -28% | 422.4 -5% | 589 32% | 295.7 -34% |
| Read 4k (MB/s) | 46 | 28.51 -38% | 53.6 17% | 52.3 14% | 26.11 -43% | 32.87 -29% | 31.75 -31% | 28.31 -38% |
| Write 4k (MB/s) | 125 | 101.5 -19% | 162.2 30% | 120 -4% | 57.7 -54% | 89.7 -28% | 72.2 -42% | 90.3 -28% |
| Read 4k QD32 (MB/s) | 423 | 368.3 -13% | 504 19% | 247.9 -41% | 245.8 -42% | 352.4 -17% | 493.3 17% | 285 -33% |
| Write 4k QD32 (MB/s) | 373 | 153.6 -59% | 420.8 13% | 259 -31% | 253.8 -32% | 316.9 -15% | 434.5 16% | 268.4 -28% |

| 3DMark Cloud Gate Standard Score | 5420 points | |
| 3DMark Fire Strike Score | 805 points | |
Help | ||
| The Witcher 3 - 1024x768 Low Graphics & Postprocessing | |
| HP Elite x2 1012 G1 | |
| Microsoft Surface Pro (2017) i5 | |
| Rise of the Tomb Raider - 1024x768 Lowest Preset | |
| Asus Transformer 3 Pro T303UA-GN050T | |
| Acer Aspire Switch Alpha 12 SA5-271-56HM | |
| Lenovo Ideapad Miix 720-12IKB | |
| Microsoft Surface Pro (2017) i5 | |
| Samsung Galaxy Tab Pro S W700N | |
| Thief - 1024x768 Very Low Preset | |
| Lenovo Ideapad Miix 720-12IKB | |
| Microsoft Surface Pro (2017) i5 | |
| low | med. | high | ultra | |
|---|---|---|---|---|
| BioShock Infinite (2013) | 42.9 | 32.15 | 28.3 | |
| Thief (2014) | 21.3 | 13.8 | 11.4 | |
| The Witcher 3 (2015) | 9.5 | 7 | ||
| Rise of the Tomb Raider (2016) | 14.7 | 9.7 |
(+) The maximum temperature on the upper side is 39.2 °C / 103 F, compared to the average of 35.4 °C / 96 F, ranging from 19.6 to 60 °C for the class Convertible.
(±) The bottom heats up to a maximum of 40.3 °C / 105 F, compared to the average of 36.9 °C / 98 F
(±) In idle usage, the average temperature for the upper side is 32.2 °C / 90 F, compared to the device average of 30.3 °C / 87 F.
(±) The palmrests and touchpad can get very hot to the touch with a maximum of 39.2 °C / 102.6 F.
(-) The average temperature of the palmrest area of similar devices was 28 °C / 82.4 F (-11.2 °C / -20.2 F).
Microsoft Surface Pro (2017) i5 audio analysis
(-) | not very loud speakers (68 dB)
Bass 100 - 315 Hz
(±) | reduced bass - on average 9.7% lower than median
(±) | linearity of bass is average (7% delta to prev. frequency)
Mids 400 - 2000 Hz
(+) | balanced mids - only 4.6% away from median
(+) | mids are linear (6.3% delta to prev. frequency)
Highs 2 - 16 kHz
(+) | balanced highs - only 2.1% away from median
(+) | highs are linear (5.2% delta to prev. frequency)
Overall 100 - 16.000 Hz
(±) | linearity of overall sound is average (18.2% difference to median)
Compared to same class
» 39% of all tested devices in this class were better, 7% similar, 54% worse
» The best had a delta of 6%, average was 20%, worst was 57%
Compared to all devices tested
» 39% of all tested devices were better, 8% similar, 53% worse
» The best had a delta of 4%, average was 24%, worst was 134%
Lenovo Ideapad Miix 720-12IKB audio analysis
(-) | not very loud speakers (64 dB)
Bass 100 - 315 Hz
(±) | reduced bass - on average 9.9% lower than median
(-) | bass is not linear (16.2% delta to prev. frequency)
Mids 400 - 2000 Hz
(±) | higher mids - on average 7.3% higher than median
(±) | linearity of mids is average (13.3% delta to prev. frequency)
Highs 2 - 16 kHz
(+) | balanced highs - only 3.3% away from median
(±) | linearity of highs is average (12.2% delta to prev. frequency)
Overall 100 - 16.000 Hz
(±) | linearity of overall sound is average (25.1% difference to median)
Compared to same class
» 76% of all tested devices in this class were better, 7% similar, 17% worse
» The best had a delta of 6%, average was 20%, worst was 57%
Compared to all devices tested
» 77% of all tested devices were better, 5% similar, 18% worse
» The best had a delta of 4%, average was 24%, worst was 134%
| Off / Standby | |
| Idle | |
| Load |
|
Key:
min: | |
| Microsoft Surface Pro (2017) i5 i5-7300U, HD Graphics 620, Samsung PM971 KUS030202M, IPS, 2736x1824, 12.3" | Microsoft Surface Pro 4, Core i5, 128GB 6300U, HD Graphics 520, Samsung MZFLV128 NVMe, IPS, 2736x1824, 12.3" | Lenovo Ideapad Miix 720-12IKB i7-7500U, HD Graphics 620, Samsung SSD PM961 1TB M.2 PCIe 3.0 x4 NVMe (MZVLW1T0), IPS, 2880x1920, 12" | Lenovo ThinkPad X1 Tablet Gen 2 i5-7Y54, HD Graphics 615, Samsung PM961 MZVLW256HEHP, IPS, 2160x1440, 12" | Asus Transformer 3 Pro T303UA-GN050T 6500U, HD Graphics 520, SK Hynix Canvas SC300 512GB M.2 (HFS512G39MND), IPS, 2880x1920, 12.6" | Toshiba Portege Z20t-C-121 6Y75, HD Graphics 515, Samsung SSD PM871 MZNLN512HCJH, IPS, 1920x1080, 12.5" | Dell Latitude 12 5285 2-in-1 i7-7600U, HD Graphics 620, Samsung PM961 MZVLW256HEHP, IPS, 1920x1280, 12.3" | HP Elite x2 1012 G1 6Y54, HD Graphics 515, Liteon L8H-256V2G, IPS, 1920x1280, 12.1" | Acer Aspire Switch Alpha 12 SA5-271-56HM 6200U, HD Graphics 520, Kingston RBU-SNS8152S3256GG2, IPS, 2160x1440, 12" | |
|---|---|---|---|---|---|---|---|---|---|
| Power Consumption | -4% | -5% | 7% | -39% | 12% | -6% | -2% | -33% | |
| Idle Minimum * (Watt) | 3.6 | 4.4 -22% | 3.5 3% | 5 -39% | 6.7 -86% | 4.3 -19% | 2.85 21% | 3.7 -3% | 7.3 -103% |
| Idle Average * (Watt) | 8.1 | 9 -11% | 7.2 11% | 6.3 22% | 10.3 -27% | 6.1 25% | 6.76 17% | 6.8 16% | 10 -23% |
| Idle Maximum * (Watt) | 8.7 | 10.7 -23% | 7.9 9% | 7.8 10% | 13.5 -55% | 8.9 -2% | 6.91 21% | 7.6 13% | 10.15 -17% |
| Load Average * (Watt) | 25.5 | 19.6 23% | 29.6 -16% | 19.5 24% | 26 -2% | 16.3 36% | 32.88 -29% | 22.5 12% | 25.2 1% |
| Load Maximum * (Watt) | 23.5 | 19.9 15% | 30.8 -31% | 19.6 17% | 28.8 -23% | 18.6 21% | 37.41 -59% | 34.5 -47% | 29.3 -25% |
* ... smaller is better
| Microsoft Surface Pro (2017) i5 i5-7300U, HD Graphics 620, 45 Wh | Microsoft Surface Pro 4, Core i5, 128GB 6300U, HD Graphics 520, 38 Wh | Lenovo Ideapad Miix 720-12IKB i7-7500U, HD Graphics 620, 41 Wh | Lenovo ThinkPad X1 Tablet Gen 2 i5-7Y54, HD Graphics 615, 37 Wh | Asus Transformer 3 Pro T303UA-GN050T 6500U, HD Graphics 520, 39 Wh | Toshiba Portege Z20t-C-121 6Y75, HD Graphics 515, 72 Wh | Dell Latitude 12 5285 2-in-1 i7-7600U, HD Graphics 620, 42 Wh | HP Elite x2 1012 G1 6Y54, HD Graphics 515, 37 Wh | Acer Aspire Switch Alpha 12 SA5-271-56HM 6200U, HD Graphics 520, 37 Wh | HP Spectre x2 12-a001ng 6Y30, HD Graphics 515, 43 Wh | Samsung Galaxy Tab Pro S W700N 6Y30, HD Graphics 515, 39.5 Wh | |
|---|---|---|---|---|---|---|---|---|---|---|---|
| Battery runtime | -30% | -39% | -33% | -56% | 8% | -23% | -31% | -42% | -30% | -12% | |
| Reader / Idle (h) | 17.6 | 15 -15% | 11.9 -32% | 11 -37% | 7.1 -60% | 17.9 2% | 12.2 -31% | 10.7 -39% | 11.4 -35% | 18.5 5% | |
| WiFi v1.3 (h) | 12.4 | 7.1 -43% | 5.8 -53% | 7.4 -40% | 3.7 -70% | 13.4 8% | 8.1 -35% | 7.4 -40% | 5.4 -56% | 6.1 -51% | 8.8 -29% |
| Load (h) | 2.8 | 1.9 -32% | 1.9 -32% | 2.2 -21% | 1.7 -39% | 1.8 -36% | 2.2 -21% | 1.9 -32% | 2.7 -4% | ||
| H.264 (h) | 3.4 | 7.2 | 7.8 | 8.6 |
Pros
Cons
新2017款Surface Pro同Surface Pro 4相比最明显的区别就是电池续航能力:在我们的Wi-Fi续航测试之中,从7小时提升至12小时。没有其他竞品能与之相比。
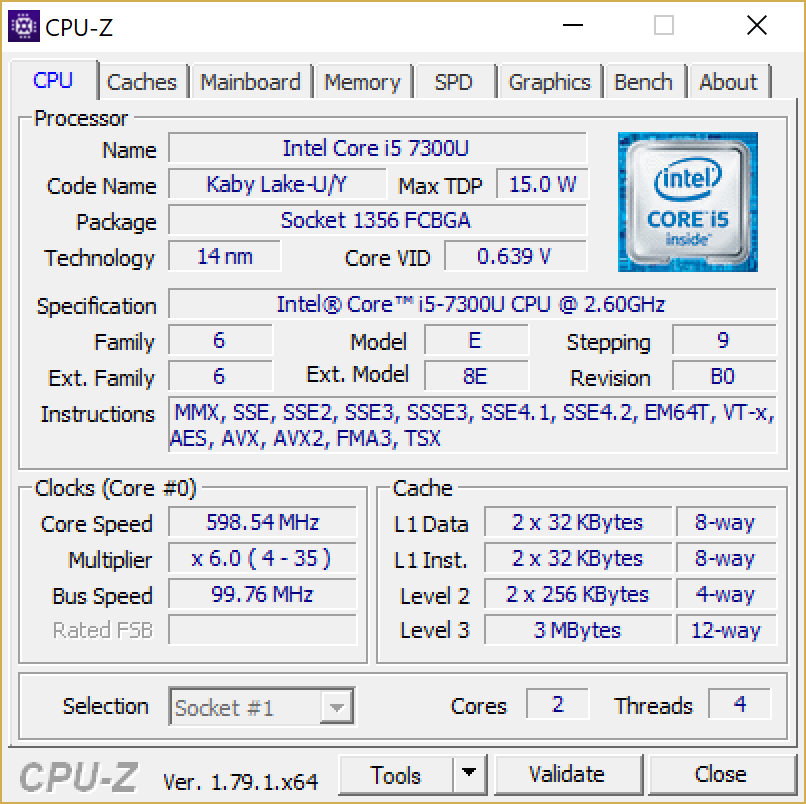
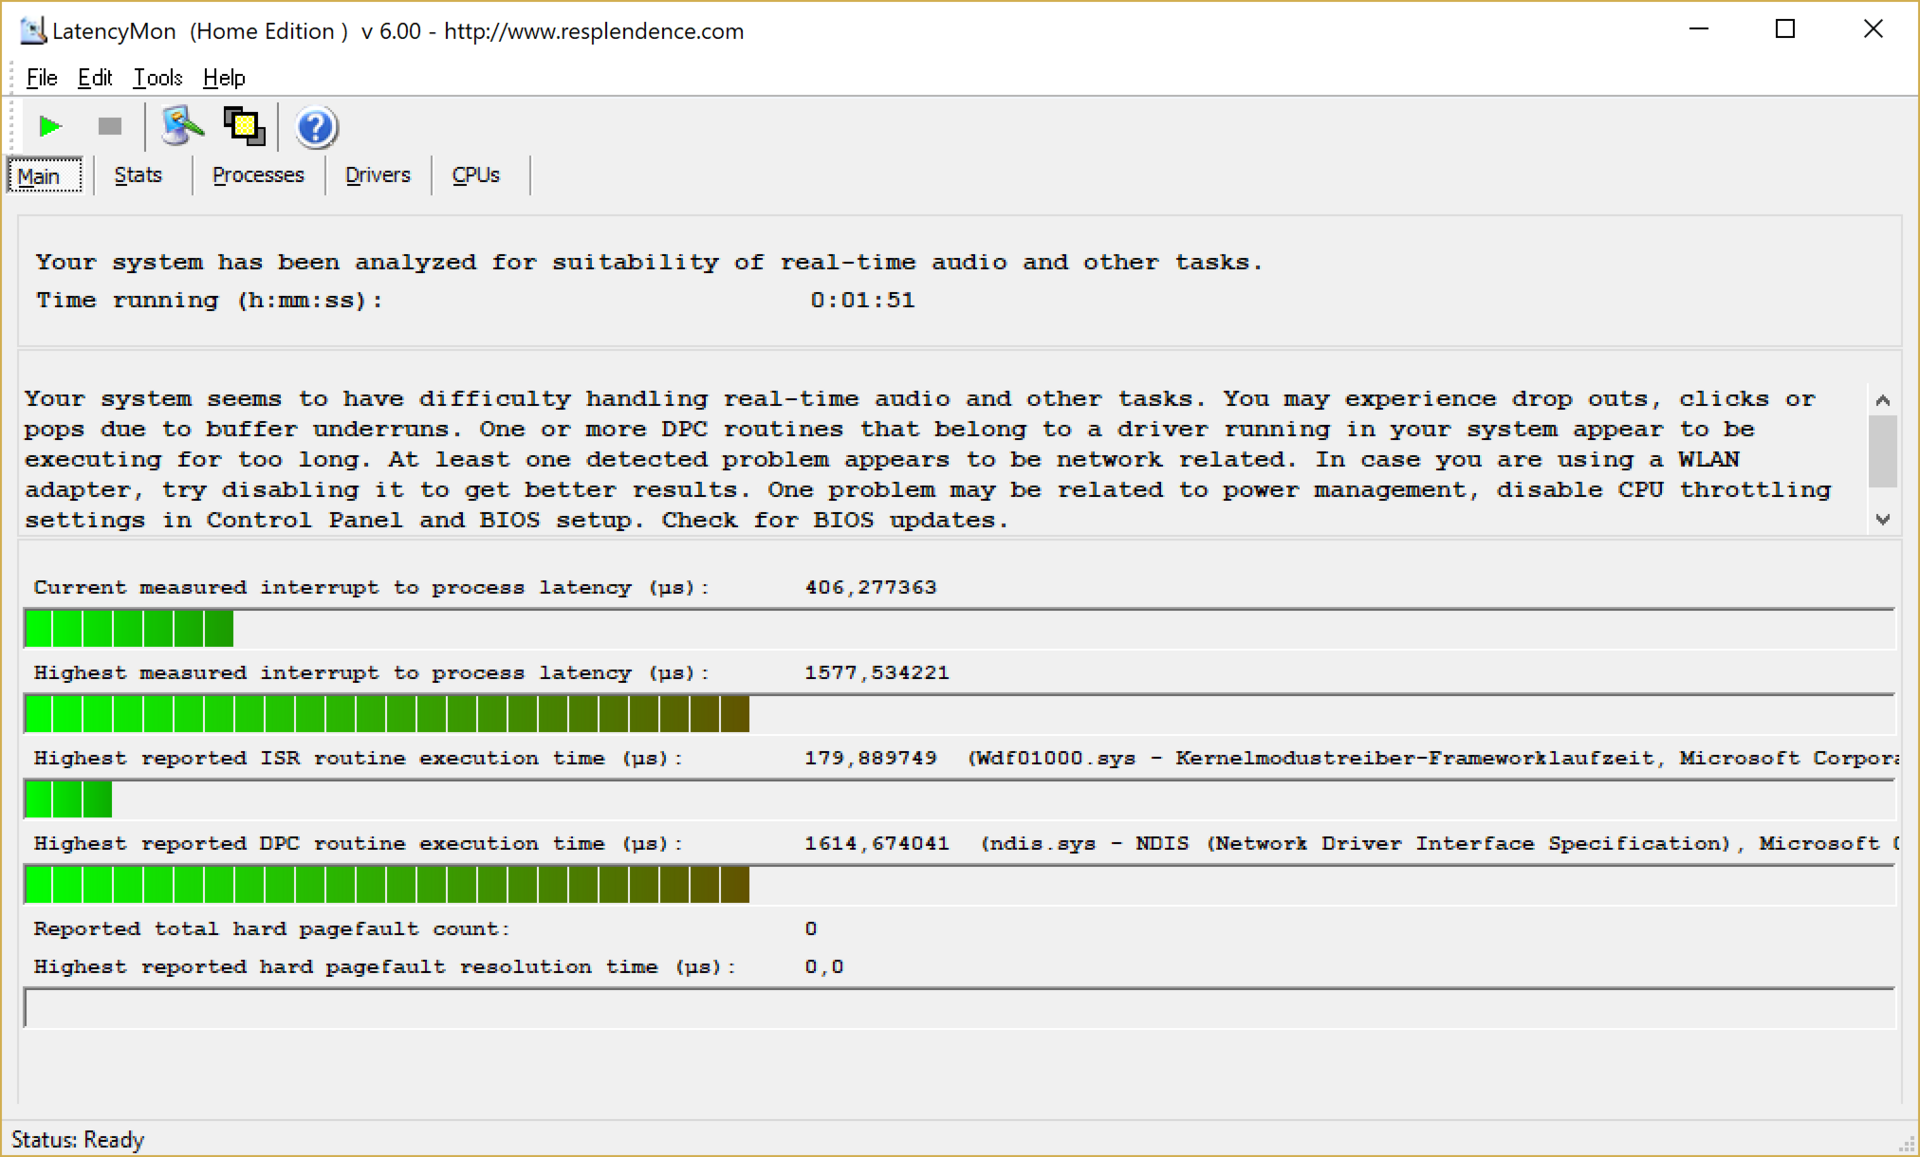
归功于真空腔均热板散热技术,无风扇的Core i5-7300U也能在短时间爆发出巅峰性能。在此之后,CPU就会出现降频。因此,重度用户最好选择戴尔 Latitude 12 5285(i7-7600U,在我们的Cinebench测试中有10%的落后)或是IdeaPad MiiX 720 (i7-7500U,有9%的落后)。尽管这两台设备也会出现过热后降频的现象,但是不至于2017款Surface Pro那么明显(33%)。
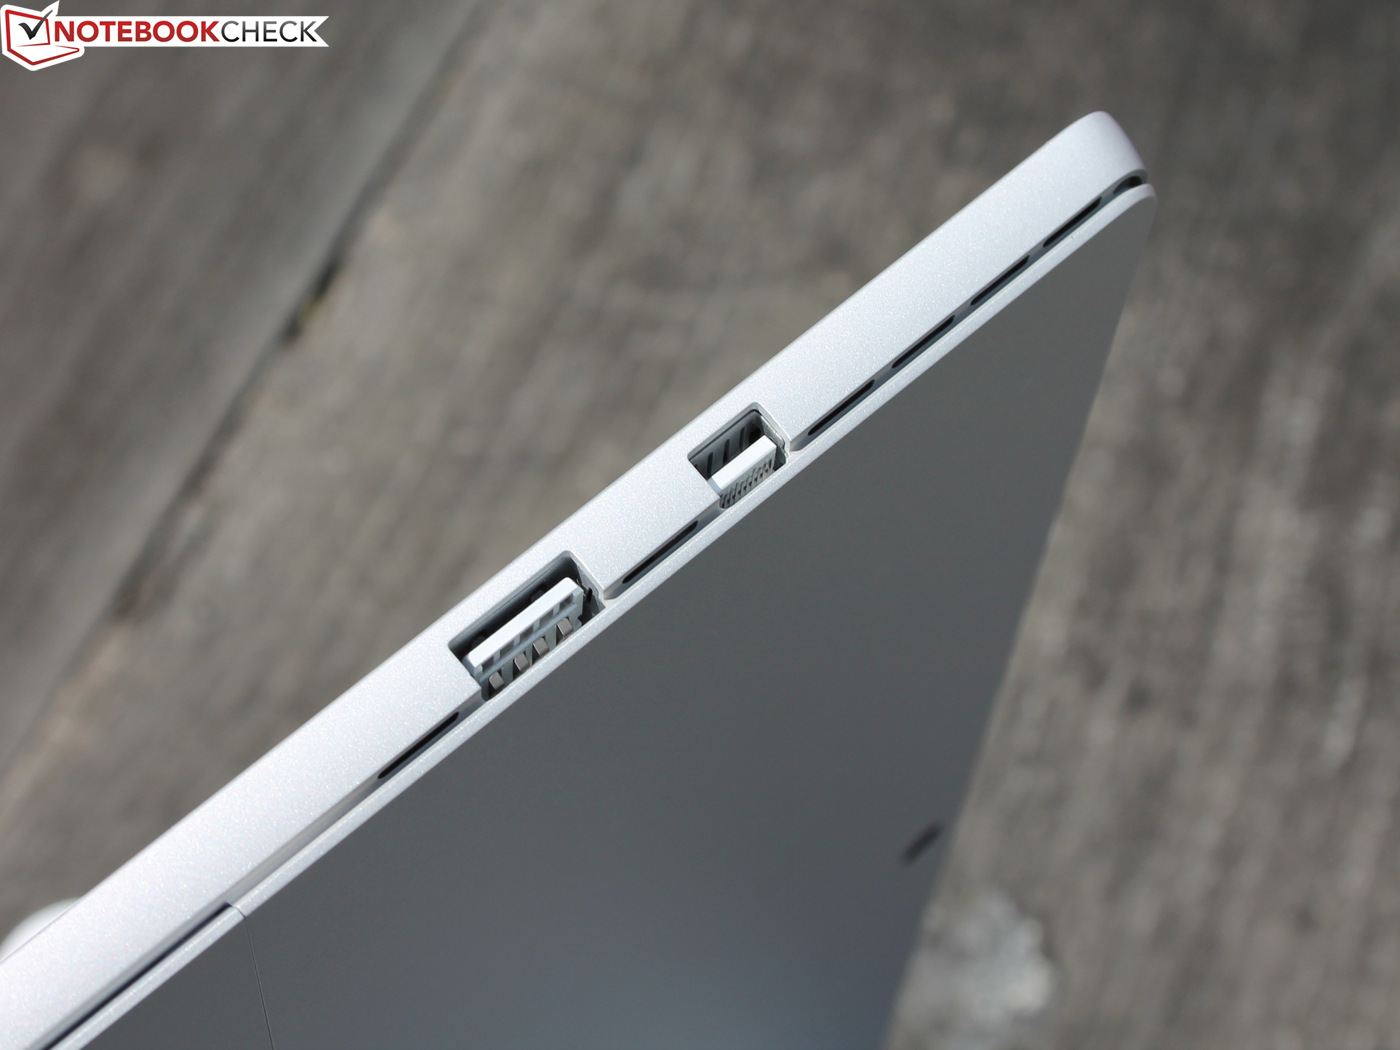
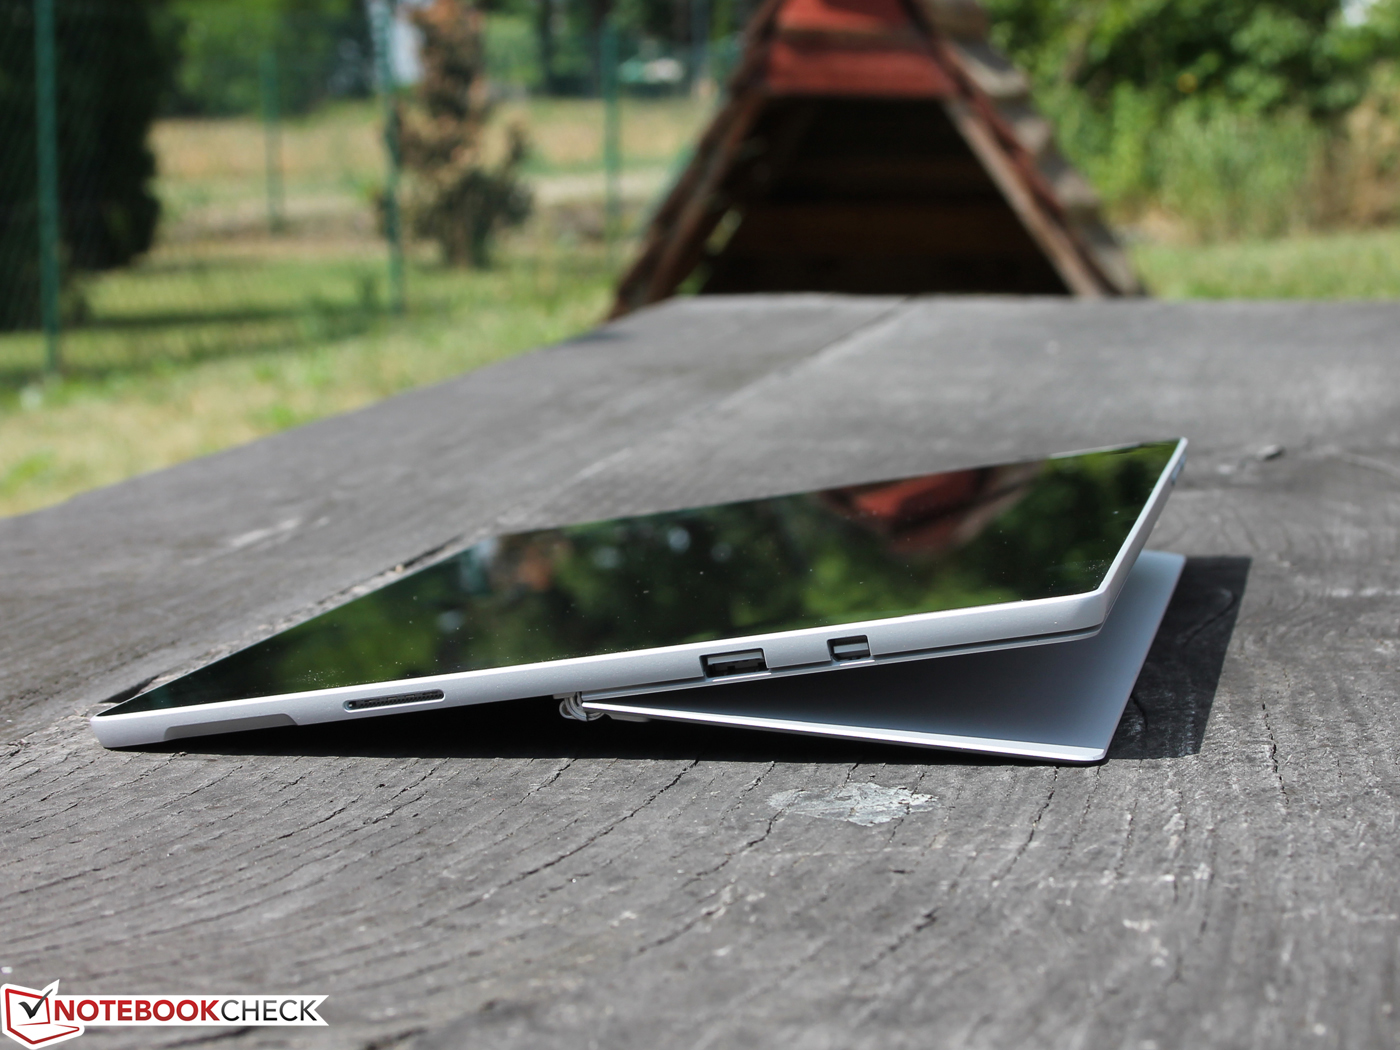
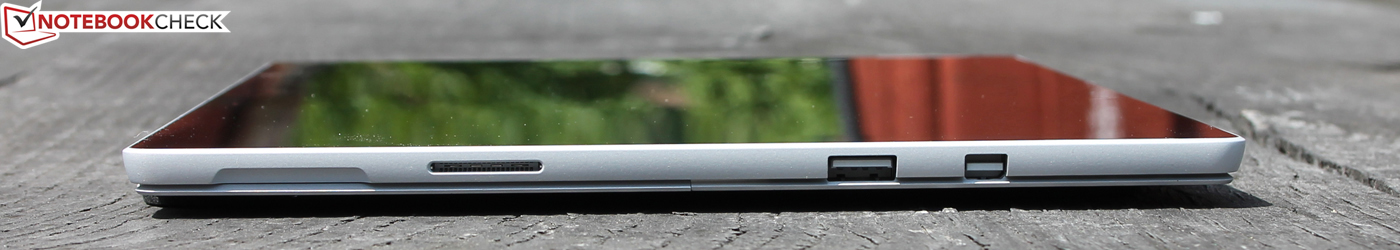
这就使得 Surface Pro 2017款所宣称的主要优点-无风扇条件下的笔记本性能-成为了过烟云。性能并不弱,但无法长期维持。再者,我们并没有发现微软所宣称的50%的性能提升。它同时也缺少USB Type-C和 Thunderbolt 3接口,若有的话 Surface Pro还是很有前景的。
从好的方面来看,他配有支持Windows Hello技术的优质摄像头,不错的麦克风,令人满意的sRGB色域显示屏。而这些需要1299美元。我们认为这款平板电脑定价过高,特别是这个价格除了一个平板和充电器外没有任何东西。
可选替代品
寻找 Surface Pro的替代品时下述三款平板可供考虑。它们都搭载 15W 处理器,我们也给出了相近的评分(戴尔),且降频程度由于有风扇辅助散热而没有 Surface Pro那么糟糕。它们也更加便宜。
戴尔 Latitude 12 5285 2-in-1 (1275 欧元/~$1458, 88%)
联想 IdeaPad Miix 720-12IKB 1 (1145 欧元/~$1309, 85%)
华硕 Transformer 3 Pro T303UA (1100 欧元/~$1258, 86%)
Latitude 12 仅有全高清屏幕,但它的亮度出色。它们三个都带有USB Type-C接口,联想和华硕的平板甚至支持Thunderbolt 3。不幸的是,后者在我们的Wi-Fi测试之中只坚持了3小时43风扇且CPU无法发挥其的全部性能。
这使IdeaPad Miix 720成为仅有的替代品。尽管仅有5:45的Wi-Fi续航时长;它也有它的长处:仅10%的降频影响,反馈力度不错的键盘,2880x1920的优秀显示屏。
若是你不需要这台Surface Pro的超长续航,Miix 720与Transformer 3 Pro有更高的性价比。毕竟我们需要再加上键盘扩展坞,一支笔,以及一个USB扩展坞才能得到一台完整的而不是只有光秃秃几个接口的设备。
注:本文是基于完整评测的缩减版本,阅读完整的英文评测,请点击这里。
Microsoft Surface Pro (2017) i5
- 06/26/2017 v6 (old)
Sebastian Jentsch
Price comparison
