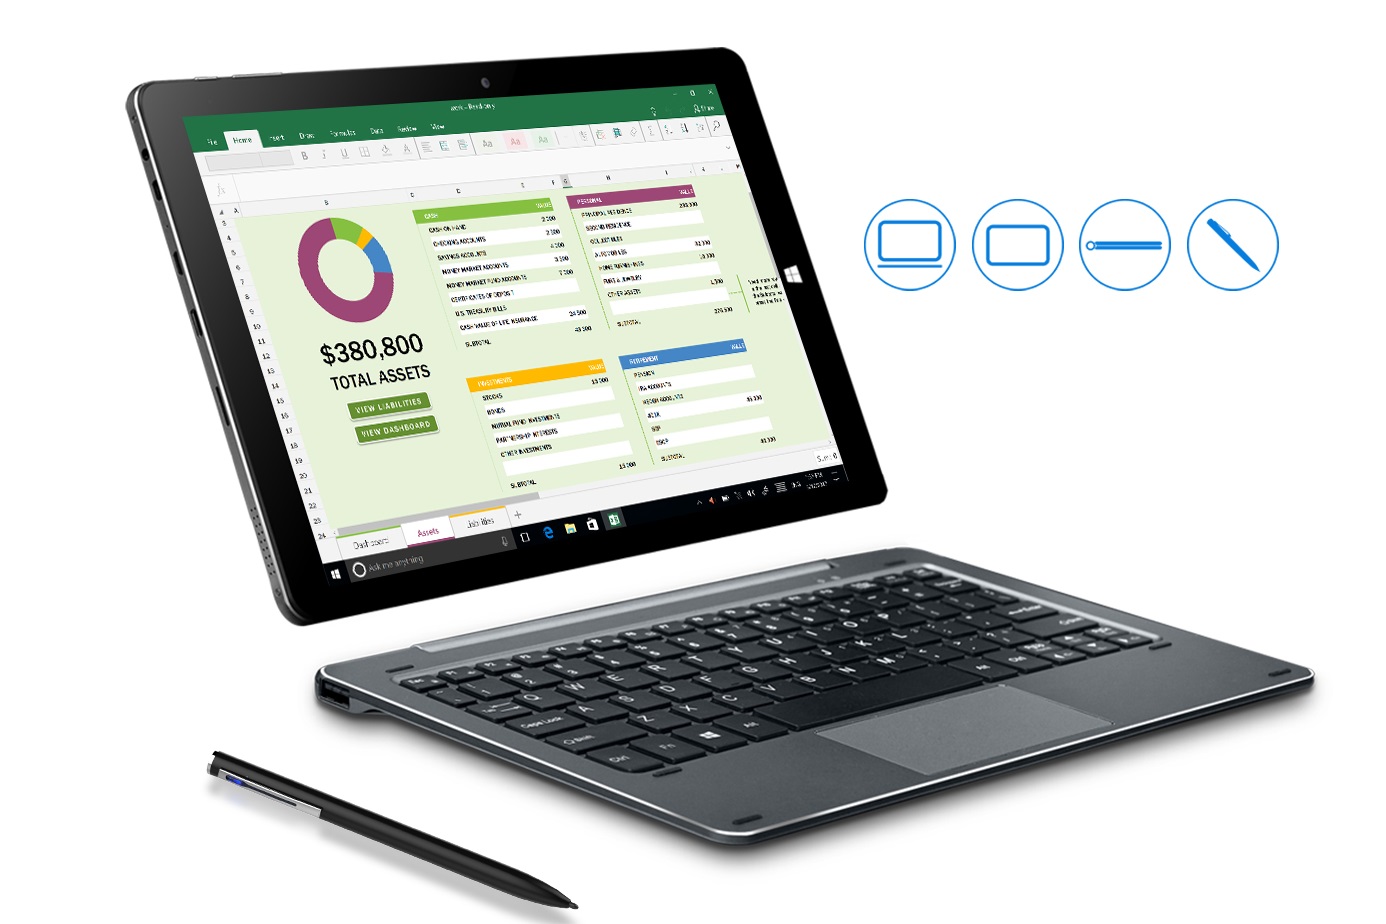
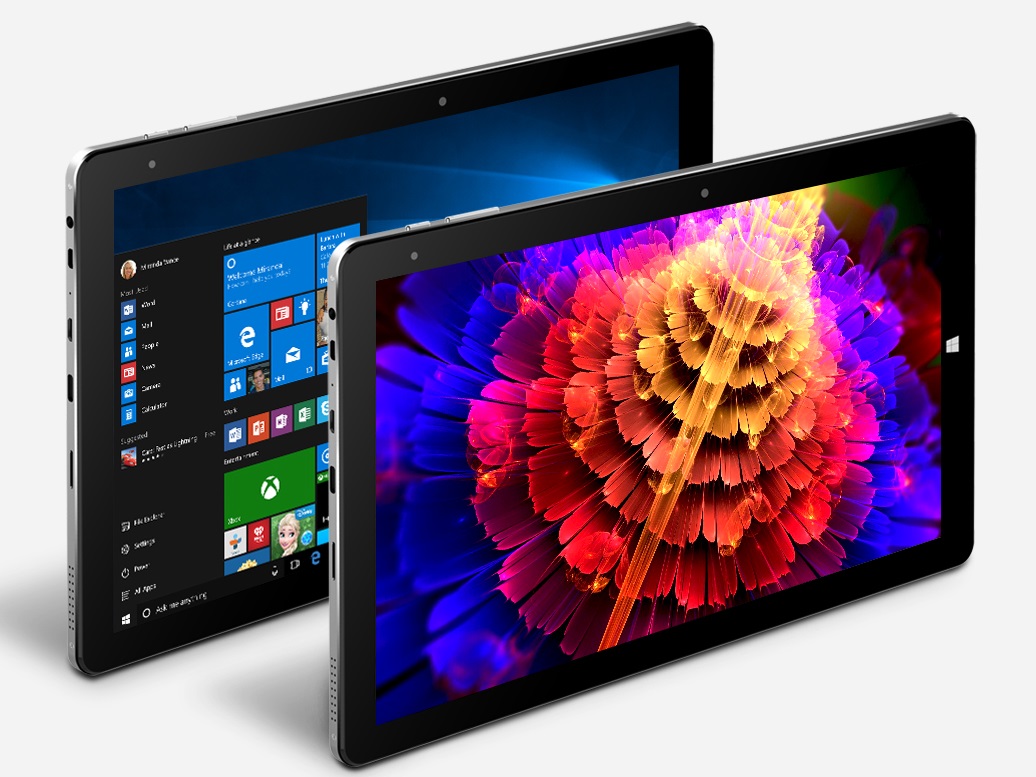
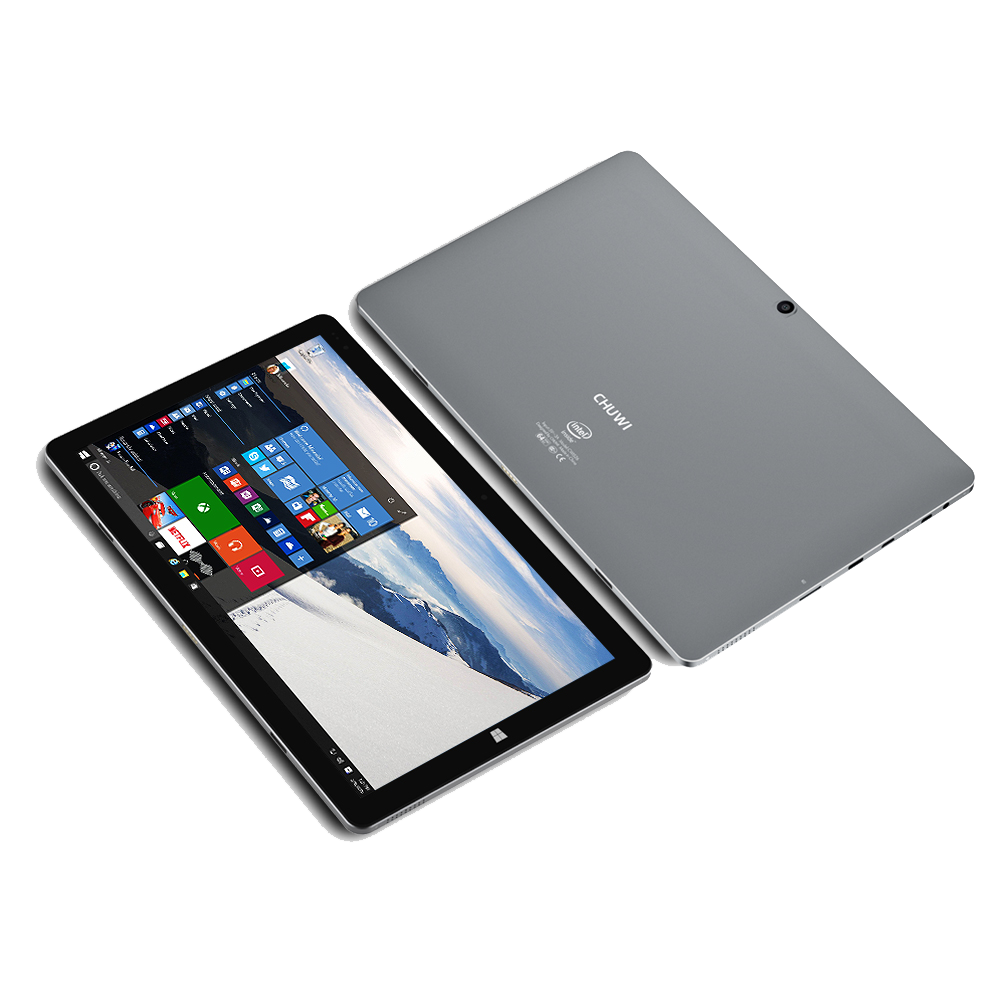
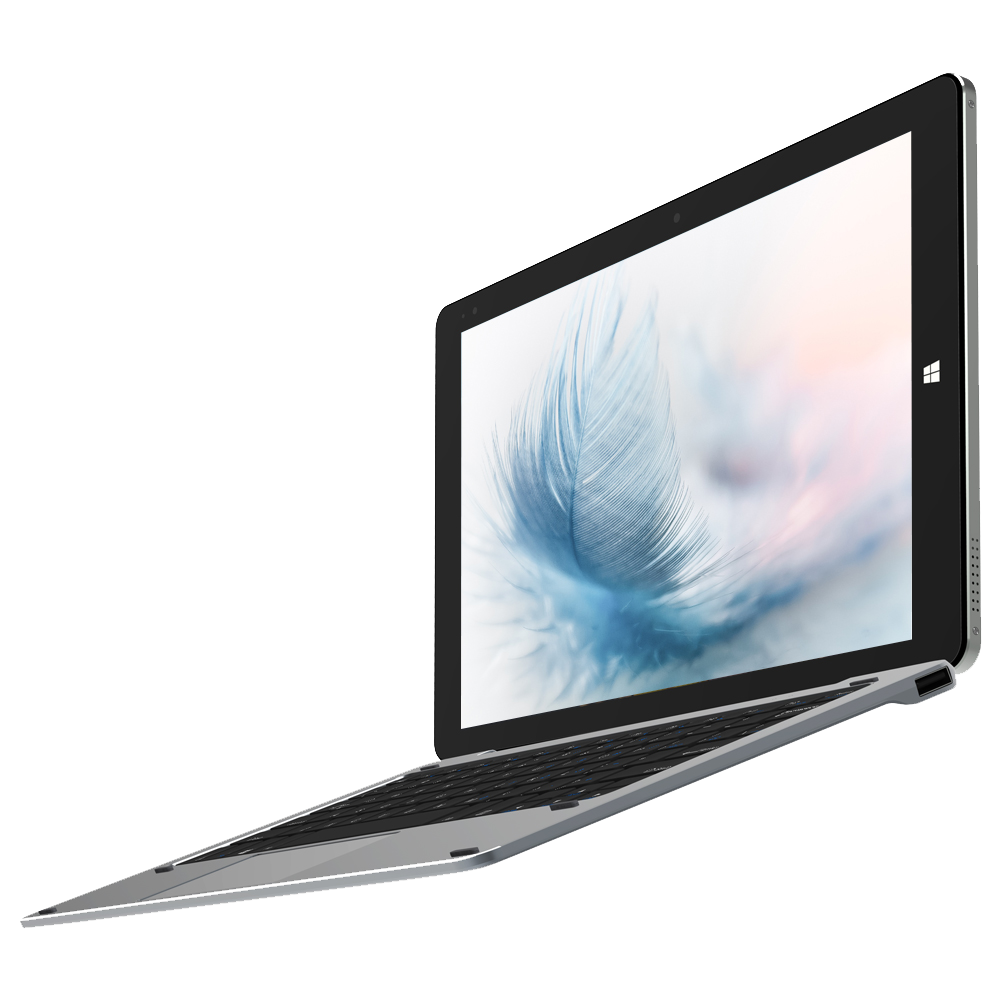
驰为Hi10 Air (Atom x5-Z8350, 4 GB RAM, 64 GB eMMC) 二合一平板评测
| SD Card Reader | |
| average JPG Copy Test (av. of 3 runs) | |
| Microsoft Surface Go MHN-00003 (Toshiba Exceria Pro M501) | |
| Average of class Convertible (29.4 - 141, n=20, last 2 years) | |
| HP x2 210 G2 (Toshiba Exceria Pro M501 microSDXC 64GB) | |
| maximum AS SSD Seq Read Test (1GB) | |
| Average of class Convertible (67.5 - 254, n=19, last 2 years) | |
| Microsoft Surface Go MHN-00003 (Toshiba Exceria Pro M501) | |
| HP x2 210 G2 (Toshiba Exceria Pro M501 microSDXC 64GB) | |
| Chuwi Hi10 Air (Toshiba Exceria Pro M501 microSDXC 64GB) | |
| Networking | |
| iperf3 transmit AX12 | |
| HP x2 210 G2 | |
| Microsoft Surface Go MHN-00003 | |
| Chuwi Hi10 Pro | |
| Chuwi Hi10 Air | |
| iperf3 receive AX12 | |
| Microsoft Surface Go MHN-00003 | |
| HP x2 210 G2 | |
| Chuwi Hi10 Pro | |
| Chuwi Hi10 Air | |
| |||||||||||||||||||||||||
Brightness Distribution: 78 %
Center on Battery: 315 cd/m²
Contrast: 1247:1 (Black: 0.3 cd/m²)
ΔE ColorChecker Calman: 4 | ∀{0.5-29.43 Ø4.71}
ΔE Greyscale Calman: 5.44 | ∀{0.09-98 Ø4.96}
99% sRGB (Argyll 1.6.3 3D)
64% AdobeRGB 1998 (Argyll 1.6.3 3D)
70.2% AdobeRGB 1998 (Argyll 3D)
98.9% sRGB (Argyll 3D)
68.5% Display P3 (Argyll 3D)
Gamma: 2.35
CCT: 7689 K
| Chuwi Hi10 Air BOE TV101WUM, , 1920x1200, 10.1" | Chuwi Hi10 Pro LCD, , 1920x1200, 10.1" | HP x2 210 G2 AU Optronics AUO18D4, , 1280x800, 10.1" | Lenovo Ideapad D330-10IGM AU Optronics B101UAN01.7, , 1920x1200, 10.1" | Microsoft Surface Go MHN-00003 Sharp SHP14A6, , 1800x1200, 10" | |
|---|---|---|---|---|---|
| Display | -37% | -20% | -3% | ||
| Display P3 Coverage (%) | 68.5 | 42.17 -38% | 54.1 -21% | 66.5 -3% | |
| sRGB Coverage (%) | 98.9 | 62.9 -36% | 81.2 -18% | 97.5 -1% | |
| AdobeRGB 1998 Coverage (%) | 70.2 | 43.6 -38% | 55.9 -20% | 67.5 -4% | |
| Response Times | -64% | -28% | -7% | -6% | |
| Response Time Grey 50% / Grey 80% * (ms) | 40 ? | 83 ? -108% | 46 ? -15% | 39 ? 2% | 44 ? -10% |
| Response Time Black / White * (ms) | 25 ? | 30 ? -20% | 35 ? -40% | 29 ? -16% | 25.6 ? -2% |
| PWM Frequency (Hz) | 1020 ? | ||||
| Screen | -13% | -26% | -10% | 29% | |
| Brightness middle (cd/m²) | 374 | 379 1% | 292 -22% | 389 4% | 456 22% |
| Brightness (cd/m²) | 328 | 356 9% | 275 -16% | 376 15% | 426 30% |
| Brightness Distribution (%) | 78 | 87 12% | 82 5% | 91 17% | 88 13% |
| Black Level * (cd/m²) | 0.3 | 0.42 -40% | 0.17 43% | 0.43 -43% | 0.31 -3% |
| Contrast (:1) | 1247 | 902 -28% | 1718 38% | 905 -27% | 1471 18% |
| Colorchecker dE 2000 * | 4 | 4.8 -20% | 6.76 -69% | 5.23 -31% | 1.3 67% |
| Colorchecker dE 2000 max. * | 9.68 | 11.2 -16% | 24.45 -153% | 9.39 3% | 3 69% |
| Greyscale dE 2000 * | 5.44 | 6.7 -23% | 6.01 -10% | 5.45 -0% | 1.4 74% |
| Gamma | 2.35 94% | 2.23 99% | 2.26 97% | 2.49 88% | 2.24 98% |
| CCT | 7689 85% | 6988 93% | 6749 96% | 7728 84% | 6687 97% |
| Color Space (Percent of AdobeRGB 1998) (%) | 64 | 40 -37% | 51 -20% | 62.3 -3% | |
| Color Space (Percent of sRGB) (%) | 99 | 63 -36% | 81 -18% | 96.8 -2% | |
| Colorchecker dE 2000 calibrated * | 1.99 | 1.1 | |||
| Total Average (Program / Settings) | -39% /
-23% | -30% /
-28% | -12% /
-12% | 7% /
18% |
* ... smaller is better
Display Response Times
| ↔ Response Time Black to White | ||
|---|---|---|
| 25 ms ... rise ↗ and fall ↘ combined | ↗ 14 ms rise | 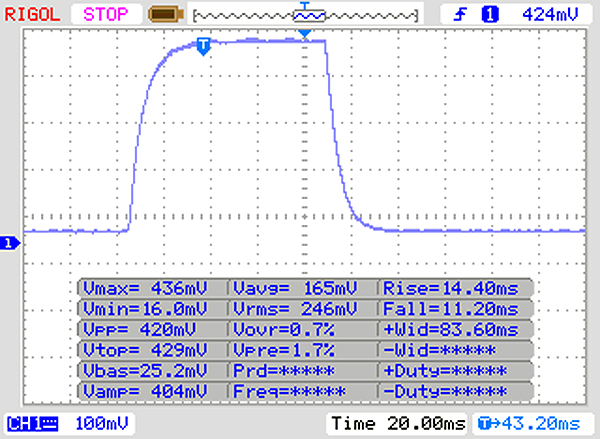 |
| ↘ 11 ms fall | ||
| The screen shows relatively slow response rates in our tests and may be too slow for gamers. In comparison, all tested devices range from 0.1 (minimum) to 240 (maximum) ms. » 59 % of all devices are better. This means that the measured response time is worse than the average of all tested devices (19.8 ms). | ||
| ↔ Response Time 50% Grey to 80% Grey | ||
| 40 ms ... rise ↗ and fall ↘ combined | ↗ 21 ms rise | 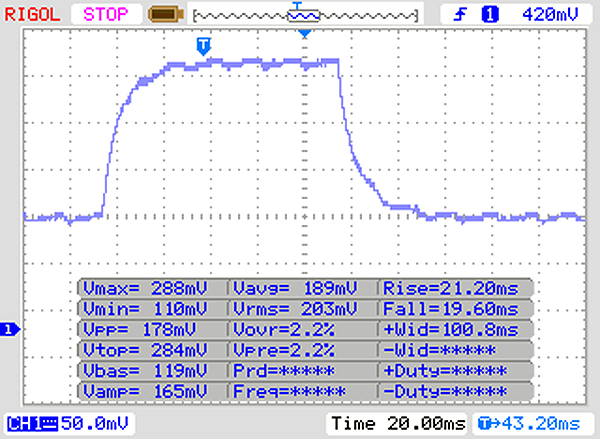 |
| ↘ 19 ms fall | ||
| The screen shows slow response rates in our tests and will be unsatisfactory for gamers. In comparison, all tested devices range from 0.165 (minimum) to 636 (maximum) ms. » 61 % of all devices are better. This means that the measured response time is worse than the average of all tested devices (31 ms). | ||
Screen Flickering / PWM (Pulse-Width Modulation)
| Screen flickering / PWM not detected | 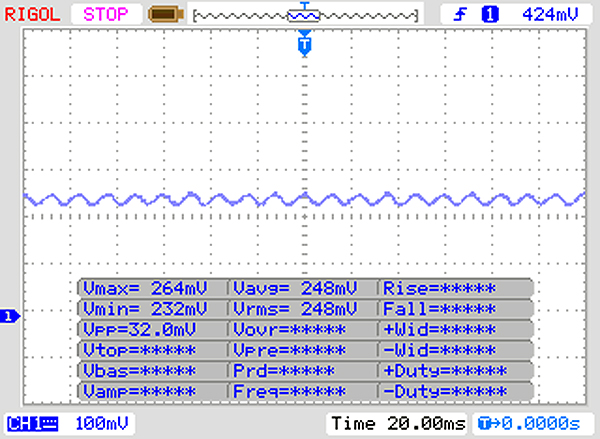 | ||
In comparison: 52 % of all tested devices do not use PWM to dim the display. If PWM was detected, an average of 7747 (minimum: 5 - maximum: 343500) Hz was measured. | |||
| PCMark 8 - Home Score Accelerated v2 | |
| Average of class Convertible (n=1last 2 years) | |
| Lenovo Ideapad D330-10IGM | |
| HP x2 210 G2 | |
| Average Intel Atom x5-Z8350, Intel HD Graphics (Cherry Trail) (1088 - 1520, n=7) | |
| Chuwi Hi10 Air | |
| Microsoft Surface Go MHN-00003 | |
| PCMark 8 Home Score Accelerated v2 | 1235 points | |
Help | ||
| Chuwi Hi10 Air 64 GB eMMC Flash | HP x2 210 G2 64 GB eMMC Flash | Lenovo Ideapad D330-10IGM 128 GB eMMC Flash | Microsoft Surface Go MHN-00003 64 GB eMMC Flash | Average 64 GB eMMC Flash | Average of class Convertible | |
|---|---|---|---|---|---|---|
| CrystalDiskMark 5.2 / 6 | 25% | 86% | 95% | 21% | 2555% | |
| Write 4K (MB/s) | 15.11 | 18.11 20% | 39.04 158% | 26.91 78% | 16 ? 6% | 146.4 ? 869% |
| Read 4K (MB/s) | 12.37 | 15.77 27% | 6.114 -51% | 19.72 59% | 11 ? -11% | 67.2 ? 443% |
| Write Seq (MB/s) | 74.7 | 62.5 -16% | 220 195% | 126.2 69% | 109 ? 46% | 2559 ? 3326% |
| Read Seq (MB/s) | 147 | 121.8 -17% | 213.5 45% | 268 82% | 207 ? 41% | 2959 ? 1913% |
| Write 4K Q32T1 (MB/s) | 15.19 | 31.72 109% | 46.89 209% | 62.9 314% | 22.4 ? 47% | 459 ? 2922% |
| Read 4K Q32T1 (MB/s) | 33.82 | 48.64 44% | 40.26 19% | 39.82 18% | 31.5 ? -7% | 588 ? 1639% |
| Write Seq Q32T1 (MB/s) | 77.3 | 95.6 24% | 145.2 88% | 131.3 70% | 104.6 ? 35% | 4416 ? 5613% |
| Read Seq Q32T1 (MB/s) | 153.2 | 166.5 9% | 194.4 27% | 259.3 69% | 166.5 ? 9% | 5848 ? 3717% |

| 3DMark 11 - 1280x720 Performance GPU | |
| Average of class Convertible (1505 - 40732, n=47, last 2 years) | |
| Microsoft Surface Go MHN-00003 | |
| Lenovo Ideapad D330-10IGM | |
| HP x2 210 G2 | |
| Average Intel HD Graphics (Cherry Trail) (278 - 494, n=22) | |
| Chuwi Hi10 Air | |
| 3DMark 11 Performance | 319 points | |
Help | ||
| Chuwi Hi10 Air HD Graphics (Cherry Trail), Z8350, 64 GB eMMC Flash | Chuwi Hi10 Pro HD Graphics (Cherry Trail), Z8300, 64 GB eMMC Flash | HP x2 210 G2 HD Graphics 400 (Braswell), Z8350, 64 GB eMMC Flash | Lenovo Ideapad D330-10IGM UHD Graphics 605, Pentium N5000, 128 GB eMMC Flash | Microsoft Surface Go MHN-00003 UHD Graphics 615, Pentium 4415Y, 64 GB eMMC Flash | |
|---|---|---|---|---|---|
| Heat | -2% | 2% | 4% | 6% | |
| Maximum Upper Side * (°C) | 42.4 | 43.5 -3% | 40.8 4% | 41.7 2% | 44 -4% |
| Maximum Bottom * (°C) | 37.7 | 36 5% | 38.9 -3% | 39.7 -5% | 43 -14% |
| Idle Upper Side * (°C) | 33.8 | 35.5 -5% | 32.4 4% | 31.7 6% | 26 23% |
| Idle Bottom * (°C) | 30.4 | 32.2 -6% | 29.8 2% | 26.5 13% | 24.4 20% |
* ... smaller is better
(±) The maximum temperature on the upper side is 42.4 °C / 108 F, compared to the average of 35.4 °C / 96 F, ranging from 19.6 to 60 °C for the class Convertible.
(+) The bottom heats up to a maximum of 37.7 °C / 100 F, compared to the average of 36.9 °C / 98 F
(+) In idle usage, the average temperature for the upper side is 30.6 °C / 87 F, compared to the device average of 30.3 °C / 87 F.
(±) The palmrests and touchpad can get very hot to the touch with a maximum of 36.2 °C / 97.2 F.
(-) The average temperature of the palmrest area of similar devices was 28 °C / 82.4 F (-8.2 °C / -14.8 F).
Chuwi Hi10 Air audio analysis
(-) | not very loud speakers (67 dB)
Bass 100 - 315 Hz
(-) | nearly no bass - on average 28% lower than median
(+) | bass is linear (3% delta to prev. frequency)
Mids 400 - 2000 Hz
(±) | reduced mids - on average 9.6% lower than median
(-) | mids are not linear (20% delta to prev. frequency)
Highs 2 - 16 kHz
(±) | higher highs - on average 6.4% higher than median
(±) | linearity of highs is average (12.3% delta to prev. frequency)
Overall 100 - 16.000 Hz
(-) | overall sound is not linear (39.2% difference to median)
Compared to same class
» 97% of all tested devices in this class were better, 1% similar, 2% worse
» The best had a delta of 6%, average was 20%, worst was 57%
Compared to all devices tested
» 95% of all tested devices were better, 0% similar, 5% worse
» The best had a delta of 4%, average was 23%, worst was 134%
HP x2 210 G2 audio analysis
(-) | not very loud speakers (67.6 dB)
Bass 100 - 315 Hz
(-) | nearly no bass - on average 15.9% lower than median
(+) | bass is linear (6.5% delta to prev. frequency)
Mids 400 - 2000 Hz
(+) | balanced mids - only 3.5% away from median
(+) | mids are linear (5.2% delta to prev. frequency)
Highs 2 - 16 kHz
(+) | balanced highs - only 4.9% away from median
(+) | highs are linear (4.5% delta to prev. frequency)
Overall 100 - 16.000 Hz
(±) | linearity of overall sound is average (22.2% difference to median)
Compared to same class
» 65% of all tested devices in this class were better, 6% similar, 29% worse
» The best had a delta of 6%, average was 20%, worst was 57%
Compared to all devices tested
» 65% of all tested devices were better, 6% similar, 29% worse
» The best had a delta of 4%, average was 23%, worst was 134%
| Chuwi Hi10 Air HD Graphics (Cherry Trail), Z8350, 64 GB eMMC Flash | Chuwi Hi10 Pro HD Graphics (Cherry Trail), Z8300, 64 GB eMMC Flash | HP x2 210 G2 HD Graphics 400 (Braswell), Z8350, 64 GB eMMC Flash | Lenovo Ideapad D330-10IGM UHD Graphics 605, Pentium N5000, 128 GB eMMC Flash | Microsoft Surface Go MHN-00003 UHD Graphics 615, Pentium 4415Y, 64 GB eMMC Flash | |
|---|---|---|---|---|---|
| Power Consumption | -132% | -146% | -195% | -230% | |
| Idle Minimum * (Watt) | 1.2 | 1.4 -17% | 2.9 -142% | 3.1 -158% | 2.88 -140% |
| Idle Average * (Watt) | 1.3 | 4.82 -271% | 4.8 -269% | 5.6 -331% | 4.8 -269% |
| Idle Maximum * (Watt) | 1.8 | 5.43 -202% | 5.2 -189% | 6.2 -244% | 7.5 -317% |
| Load Average * (Watt) | 6.2 | 11.61 -87% | 10.4 -68% | 13.5 -118% | 16.9 -173% |
| Load Maximum * (Watt) | 6.8 | 12.48 -84% | 10.9 -60% | 15.3 -125% | 23.8 -250% |
* ... smaller is better
| Off / Standby | |
| Idle | |
| Load |
|
Key:
min: | |
| Chuwi Hi10 Air Z8350, HD Graphics (Cherry Trail), Wh | Chuwi Hi10 Pro Z8300, HD Graphics (Cherry Trail), 0 Wh | HP x2 210 G2 Z8350, HD Graphics 400 (Braswell), 32.5 Wh | Lenovo Ideapad D330-10IGM Pentium N5000, UHD Graphics 605, 39 Wh | Microsoft Surface Go MHN-00003 Pentium 4415Y, UHD Graphics 615, 28 Wh | Average of class Convertible | |
|---|---|---|---|---|---|---|
| Battery runtime | ||||||
| WiFi v1.3 (h) | 6.6 | 6.1 -8% | 9.2 39% | 11.4 73% | 7.5 14% | 12 ? 82% |
Pros
Cons

Chuwi Hi10 Air是一款极具吸引力的设备。它有很多很便宜并且有些过时的部件,但它仍然是物有所值的。Hi10 Air拥有做工出色的铝制外壳和令人印象深刻的显示屏,同时它的键盘也很不错。
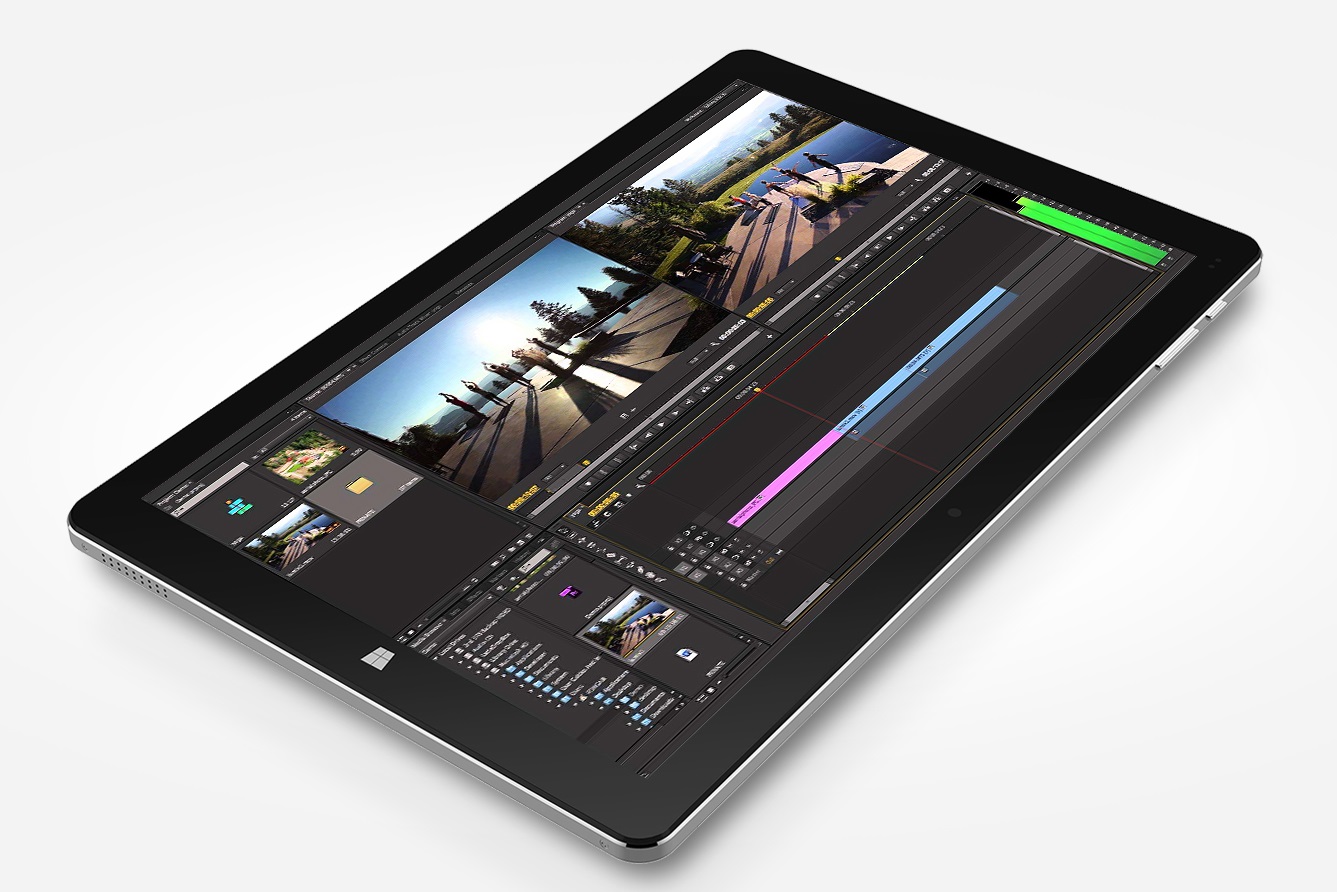
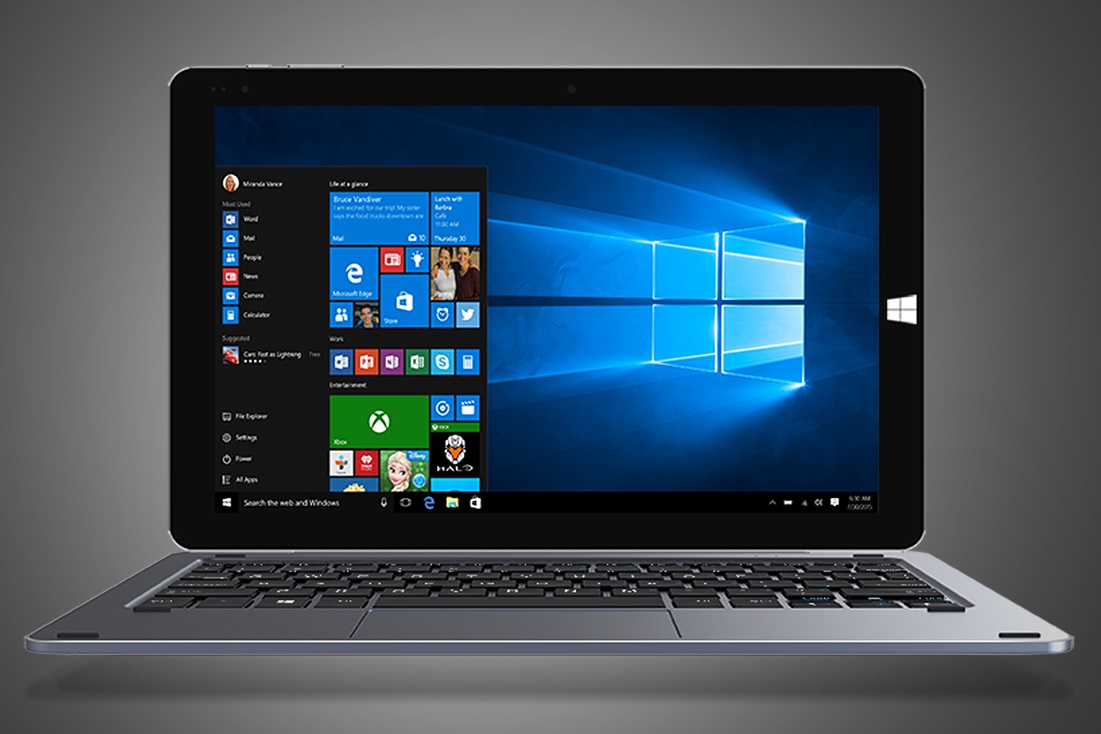
Windows 10基本上可以流畅运行,但这是事情开始分崩离析的地方。你不能像Hi10 Pro那样同时拥有Android系统,这很令人不爽,因为Hi10 Air上的多任务处理几乎都会造成死机。
此外,触控板过于敏感,平板电脑的续航时间非常差。此外,一些Hi10 Air的部件已显疲态。该设备具有性能差的可怕的microSD,Wi-Fi以及Atom的处理器。 eMMC闪存存储比我们的比较设备中使用的闪存速度慢得多。
尽管配备过时的硬件,Chuwi Hi10 Air总体上是一个令人惊讶的产品。物有所值,只有一些实际的缺点。
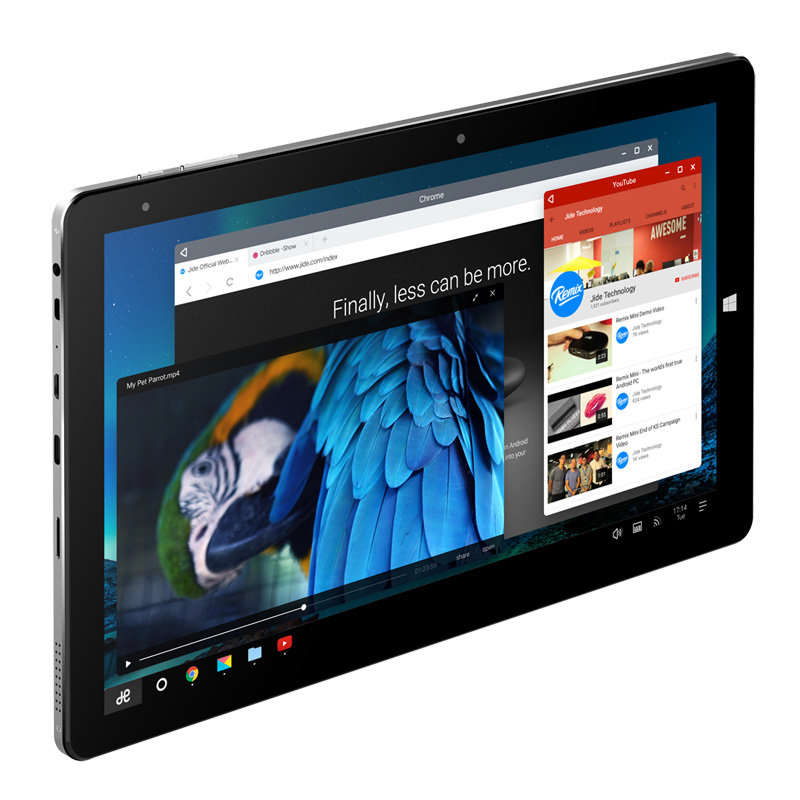
或者,如果您对Hi10 Air感兴趣,甚至可以看看Hi10 Pro。它发布于2016年,但它与其较新的Air衍生型号共享大部分相同的部件,优缺点也和Hi10 Air大致相同。虽然它依赖于过时的Android 5.1作为其第二个操作系统,所以我们可以看到为什么Chuwi没有将其包含在Hi10 Air中。
Chuwi Hi10 Air
- 04/25/2019 v6 (old)
Christian Hintze
Price comparison

