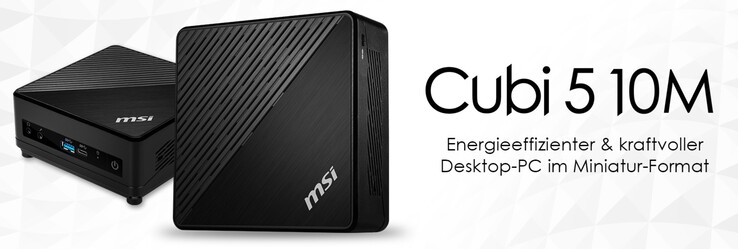
微星Cubi 5 10M与酷睿i3-10110U和27英寸显示器MD271的回顾
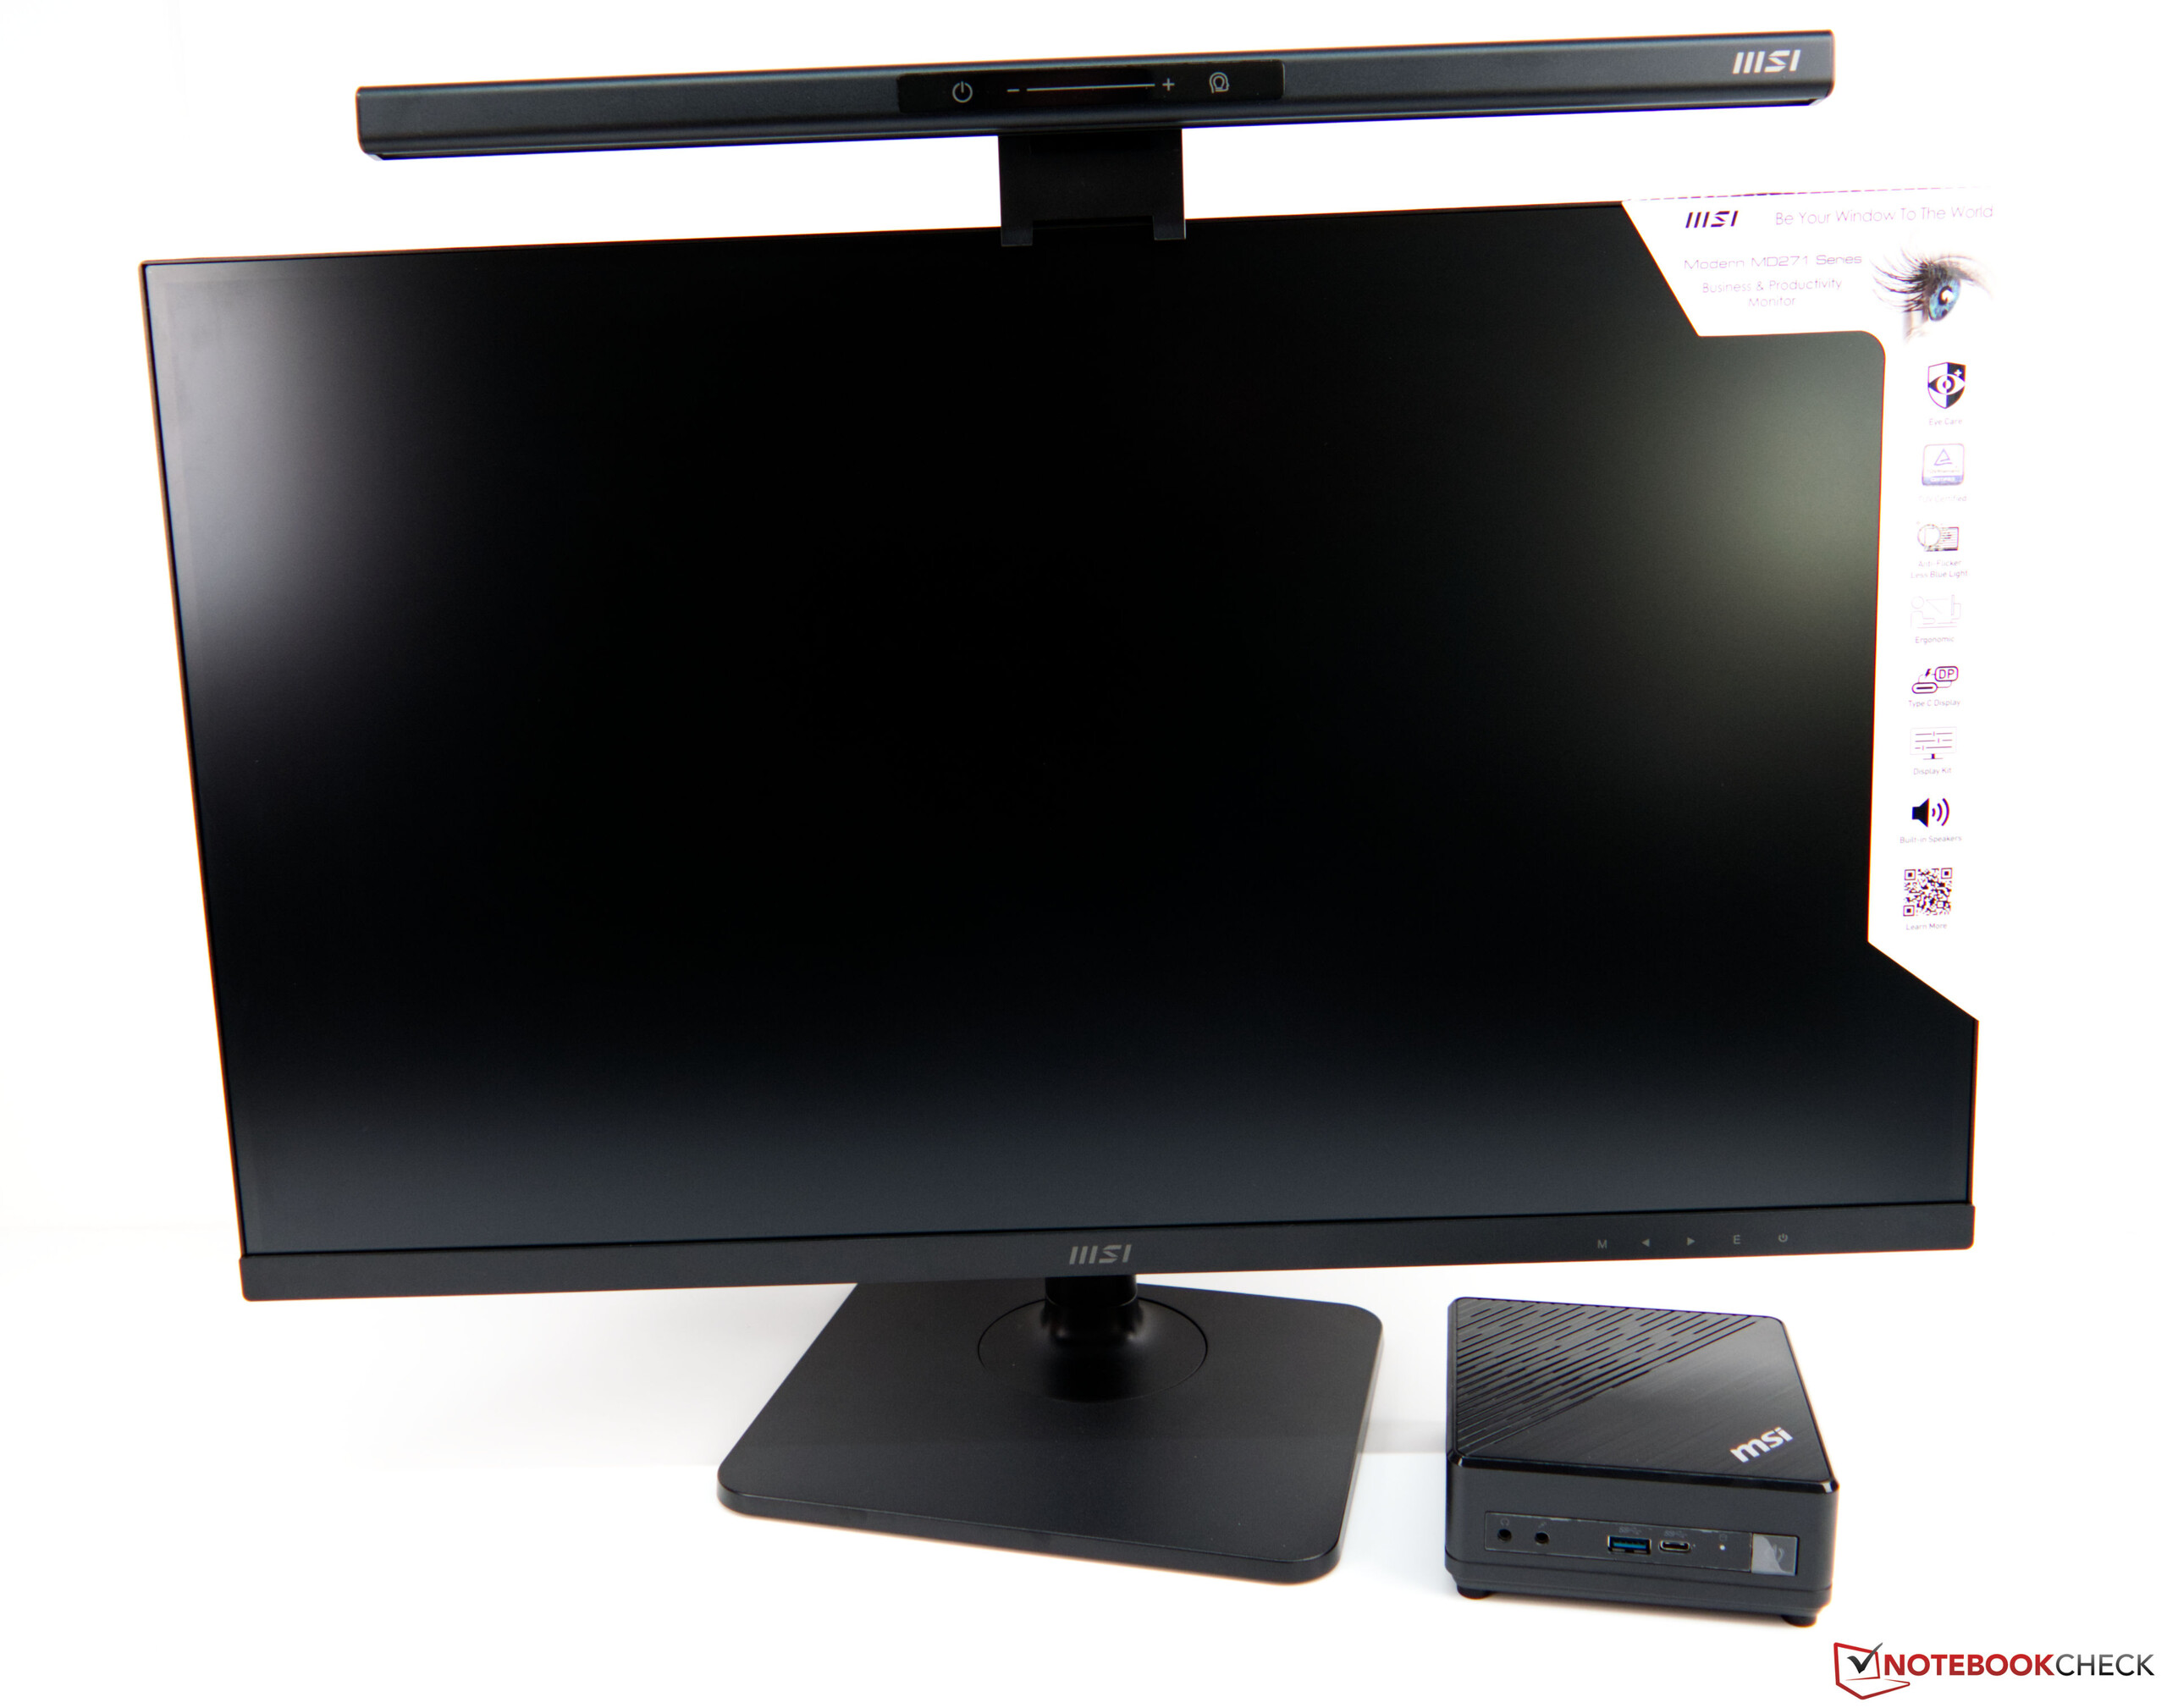
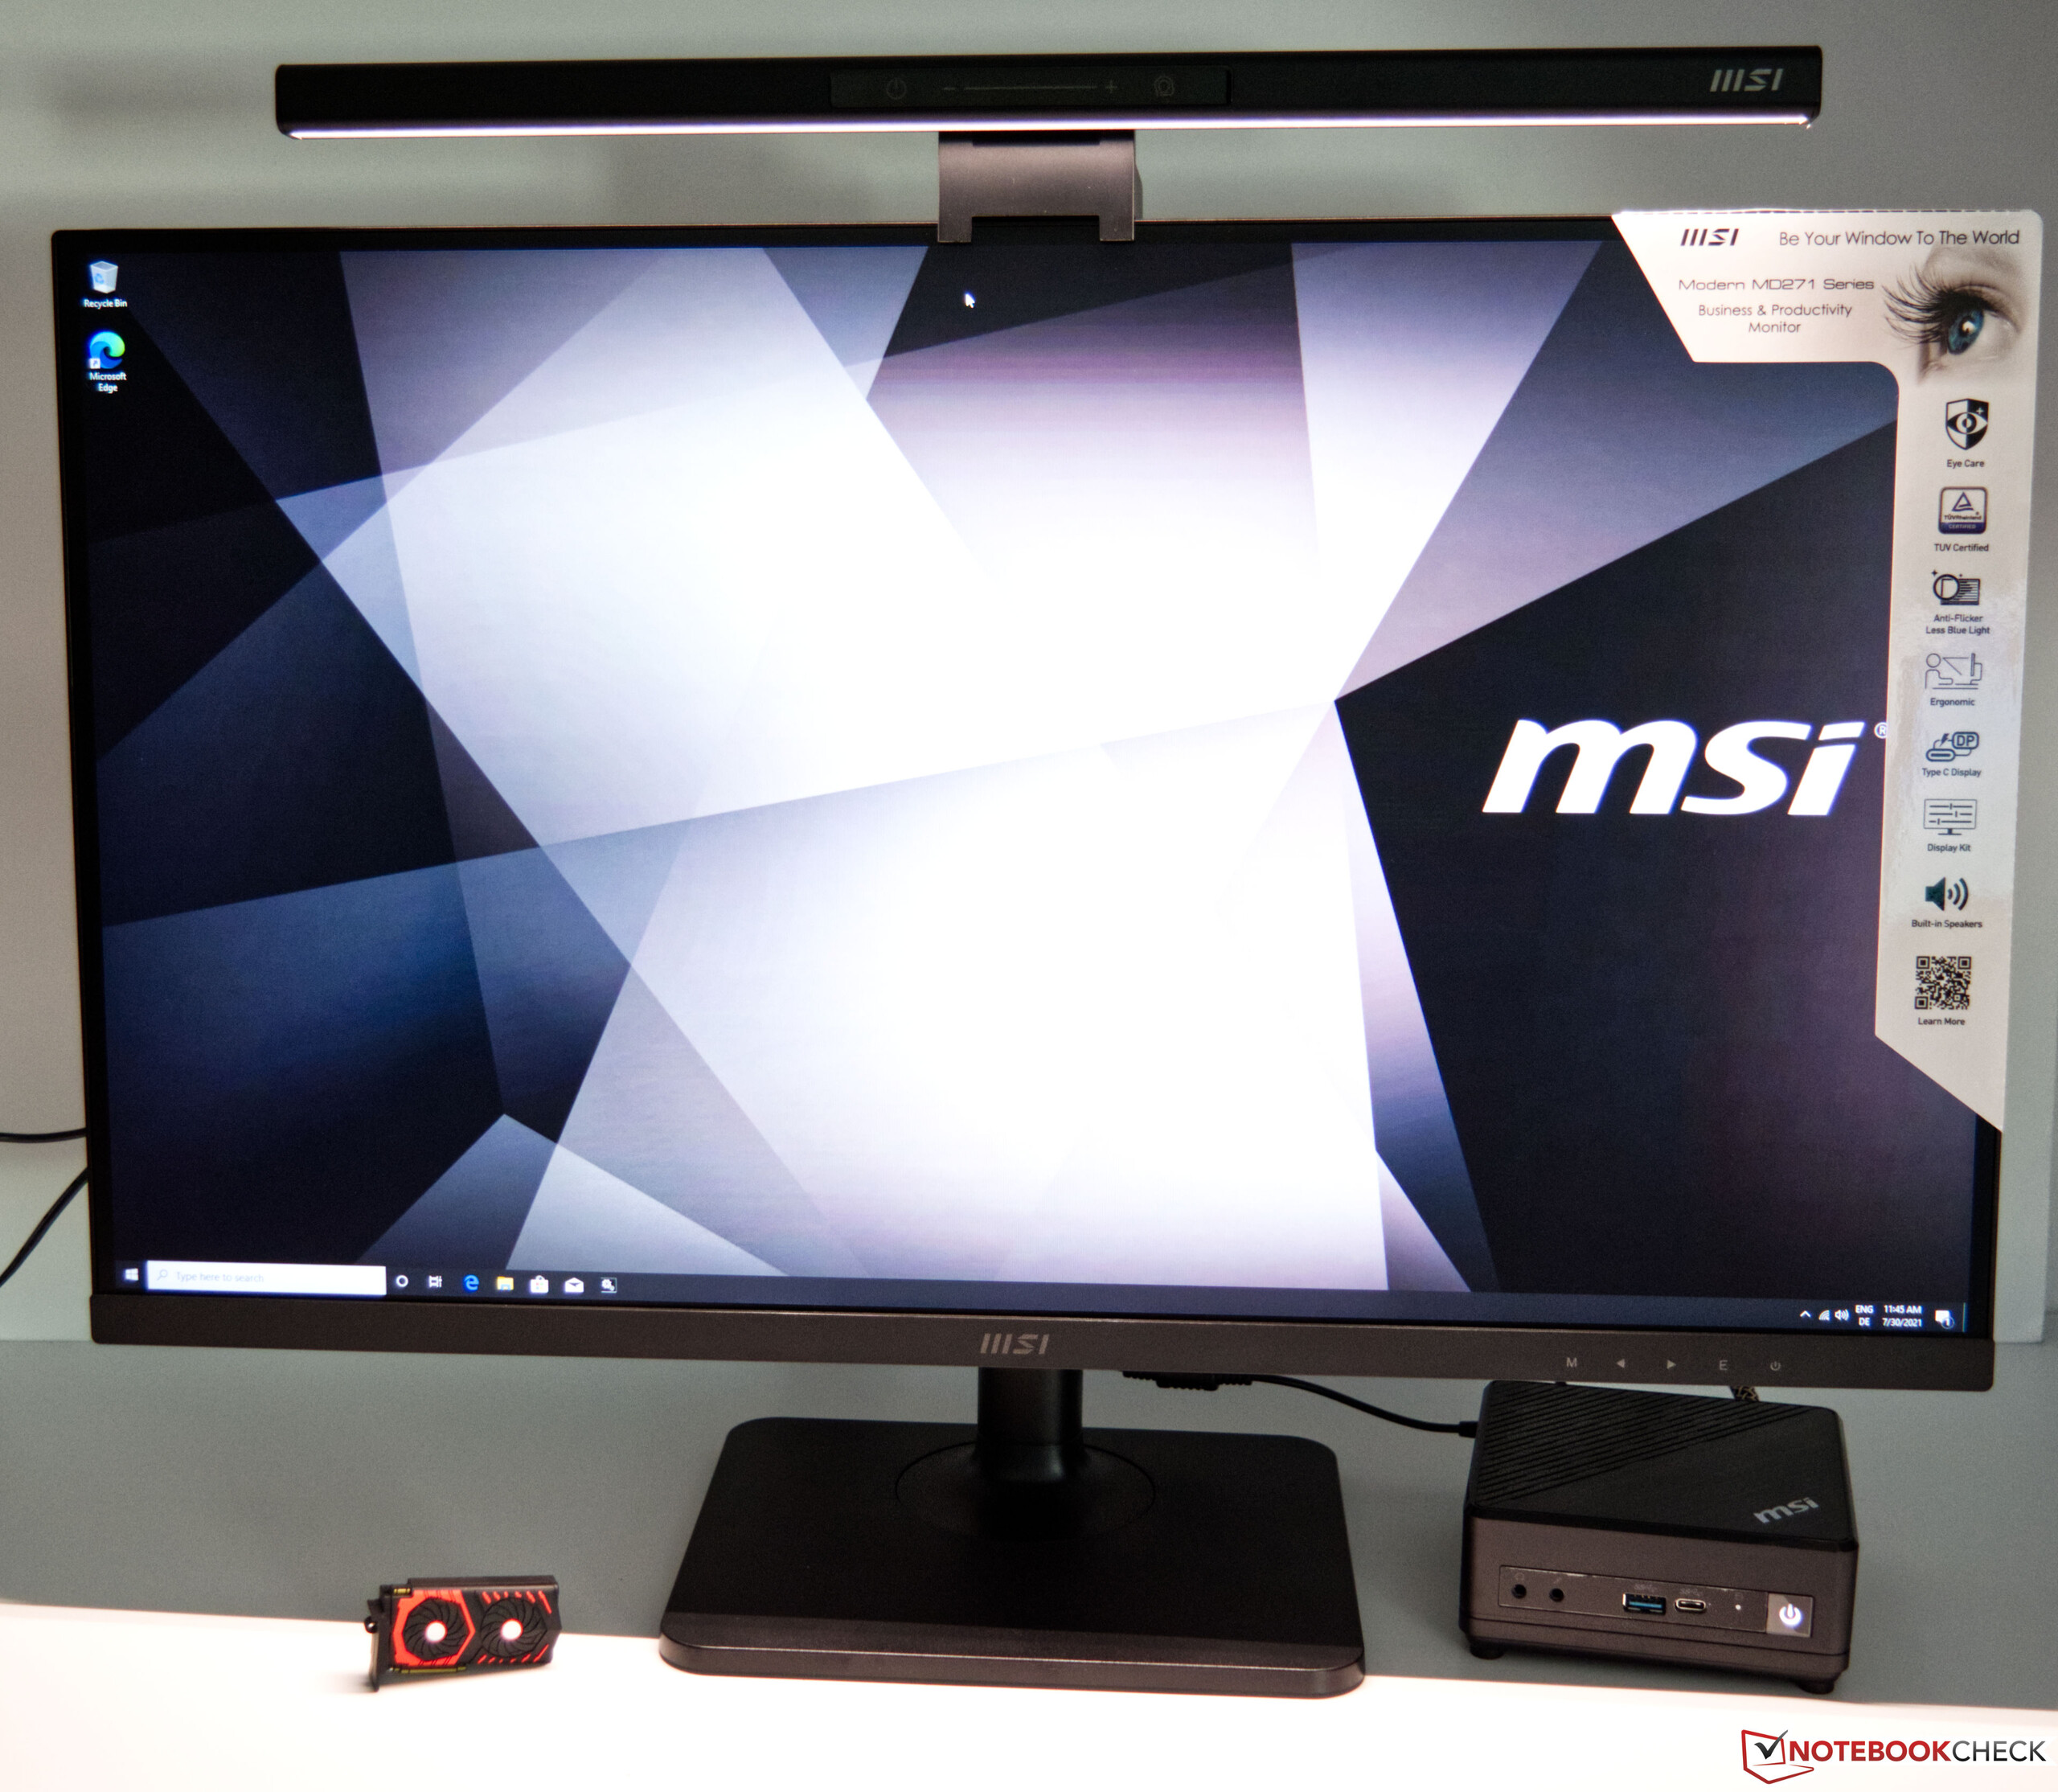
微星为这次评测提供了一个办公室设置,包括Cubi 5 10M,27英寸微星Modern MD271显示器和一个灯条。
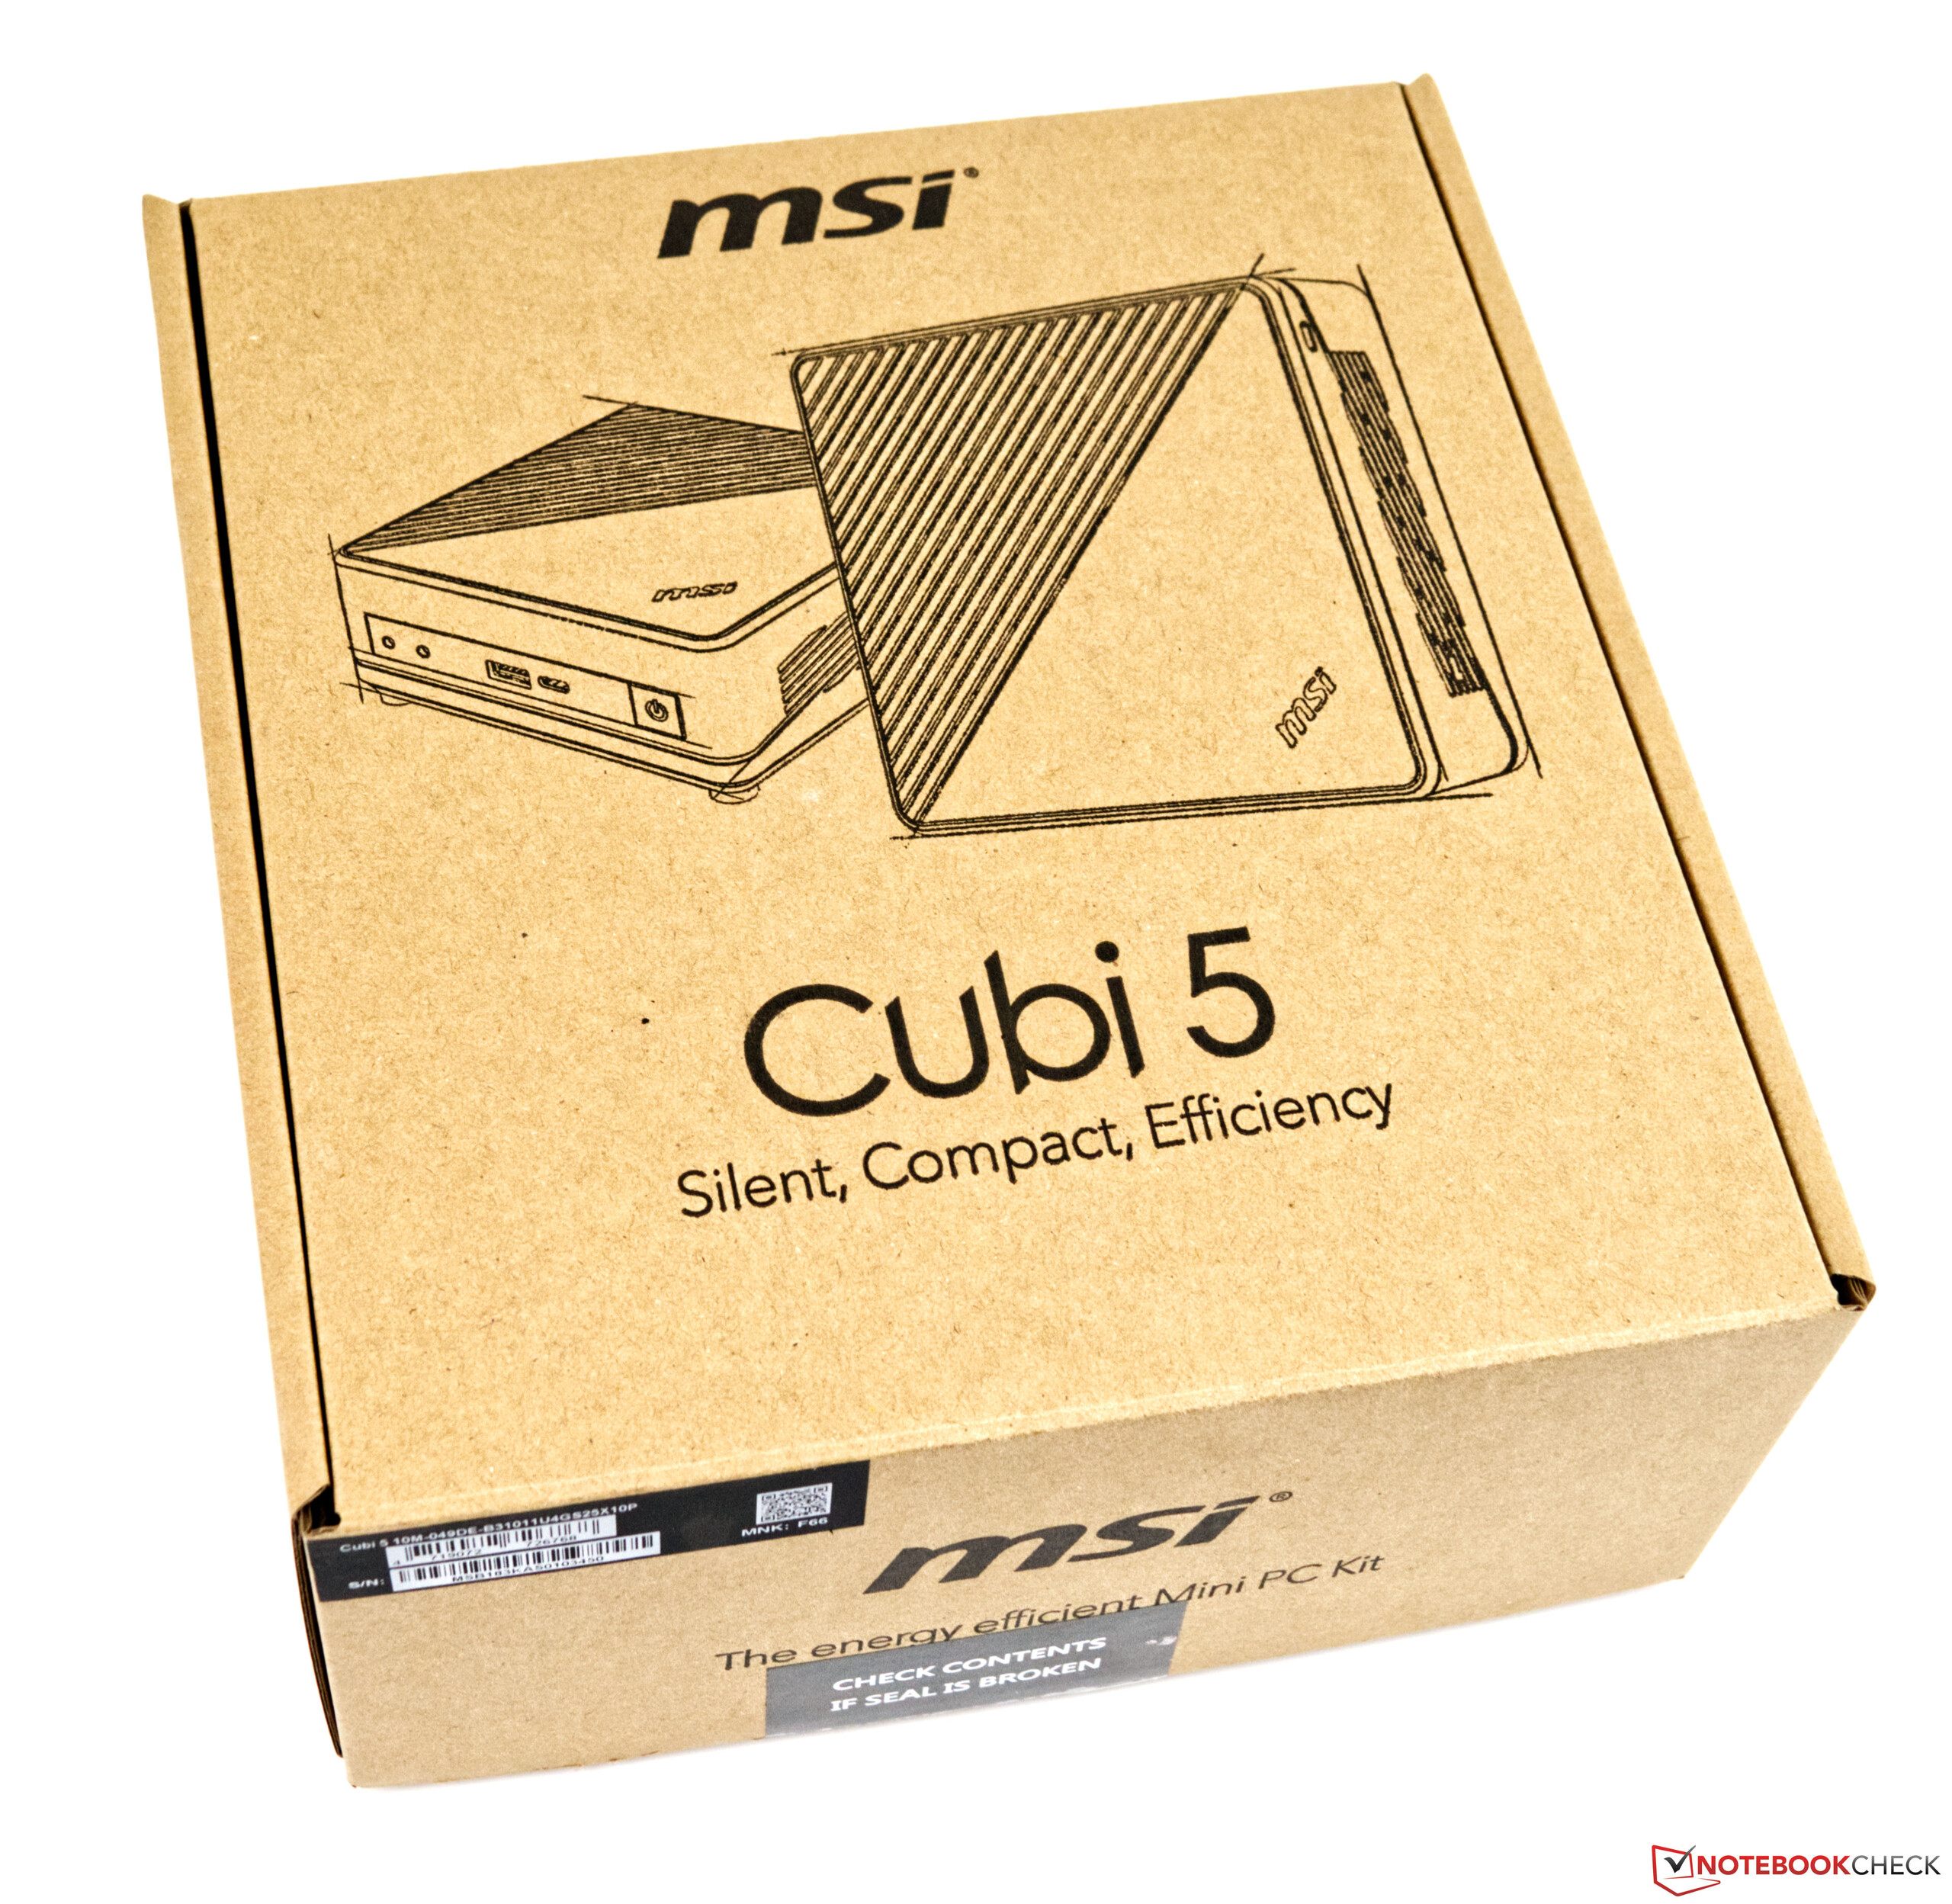
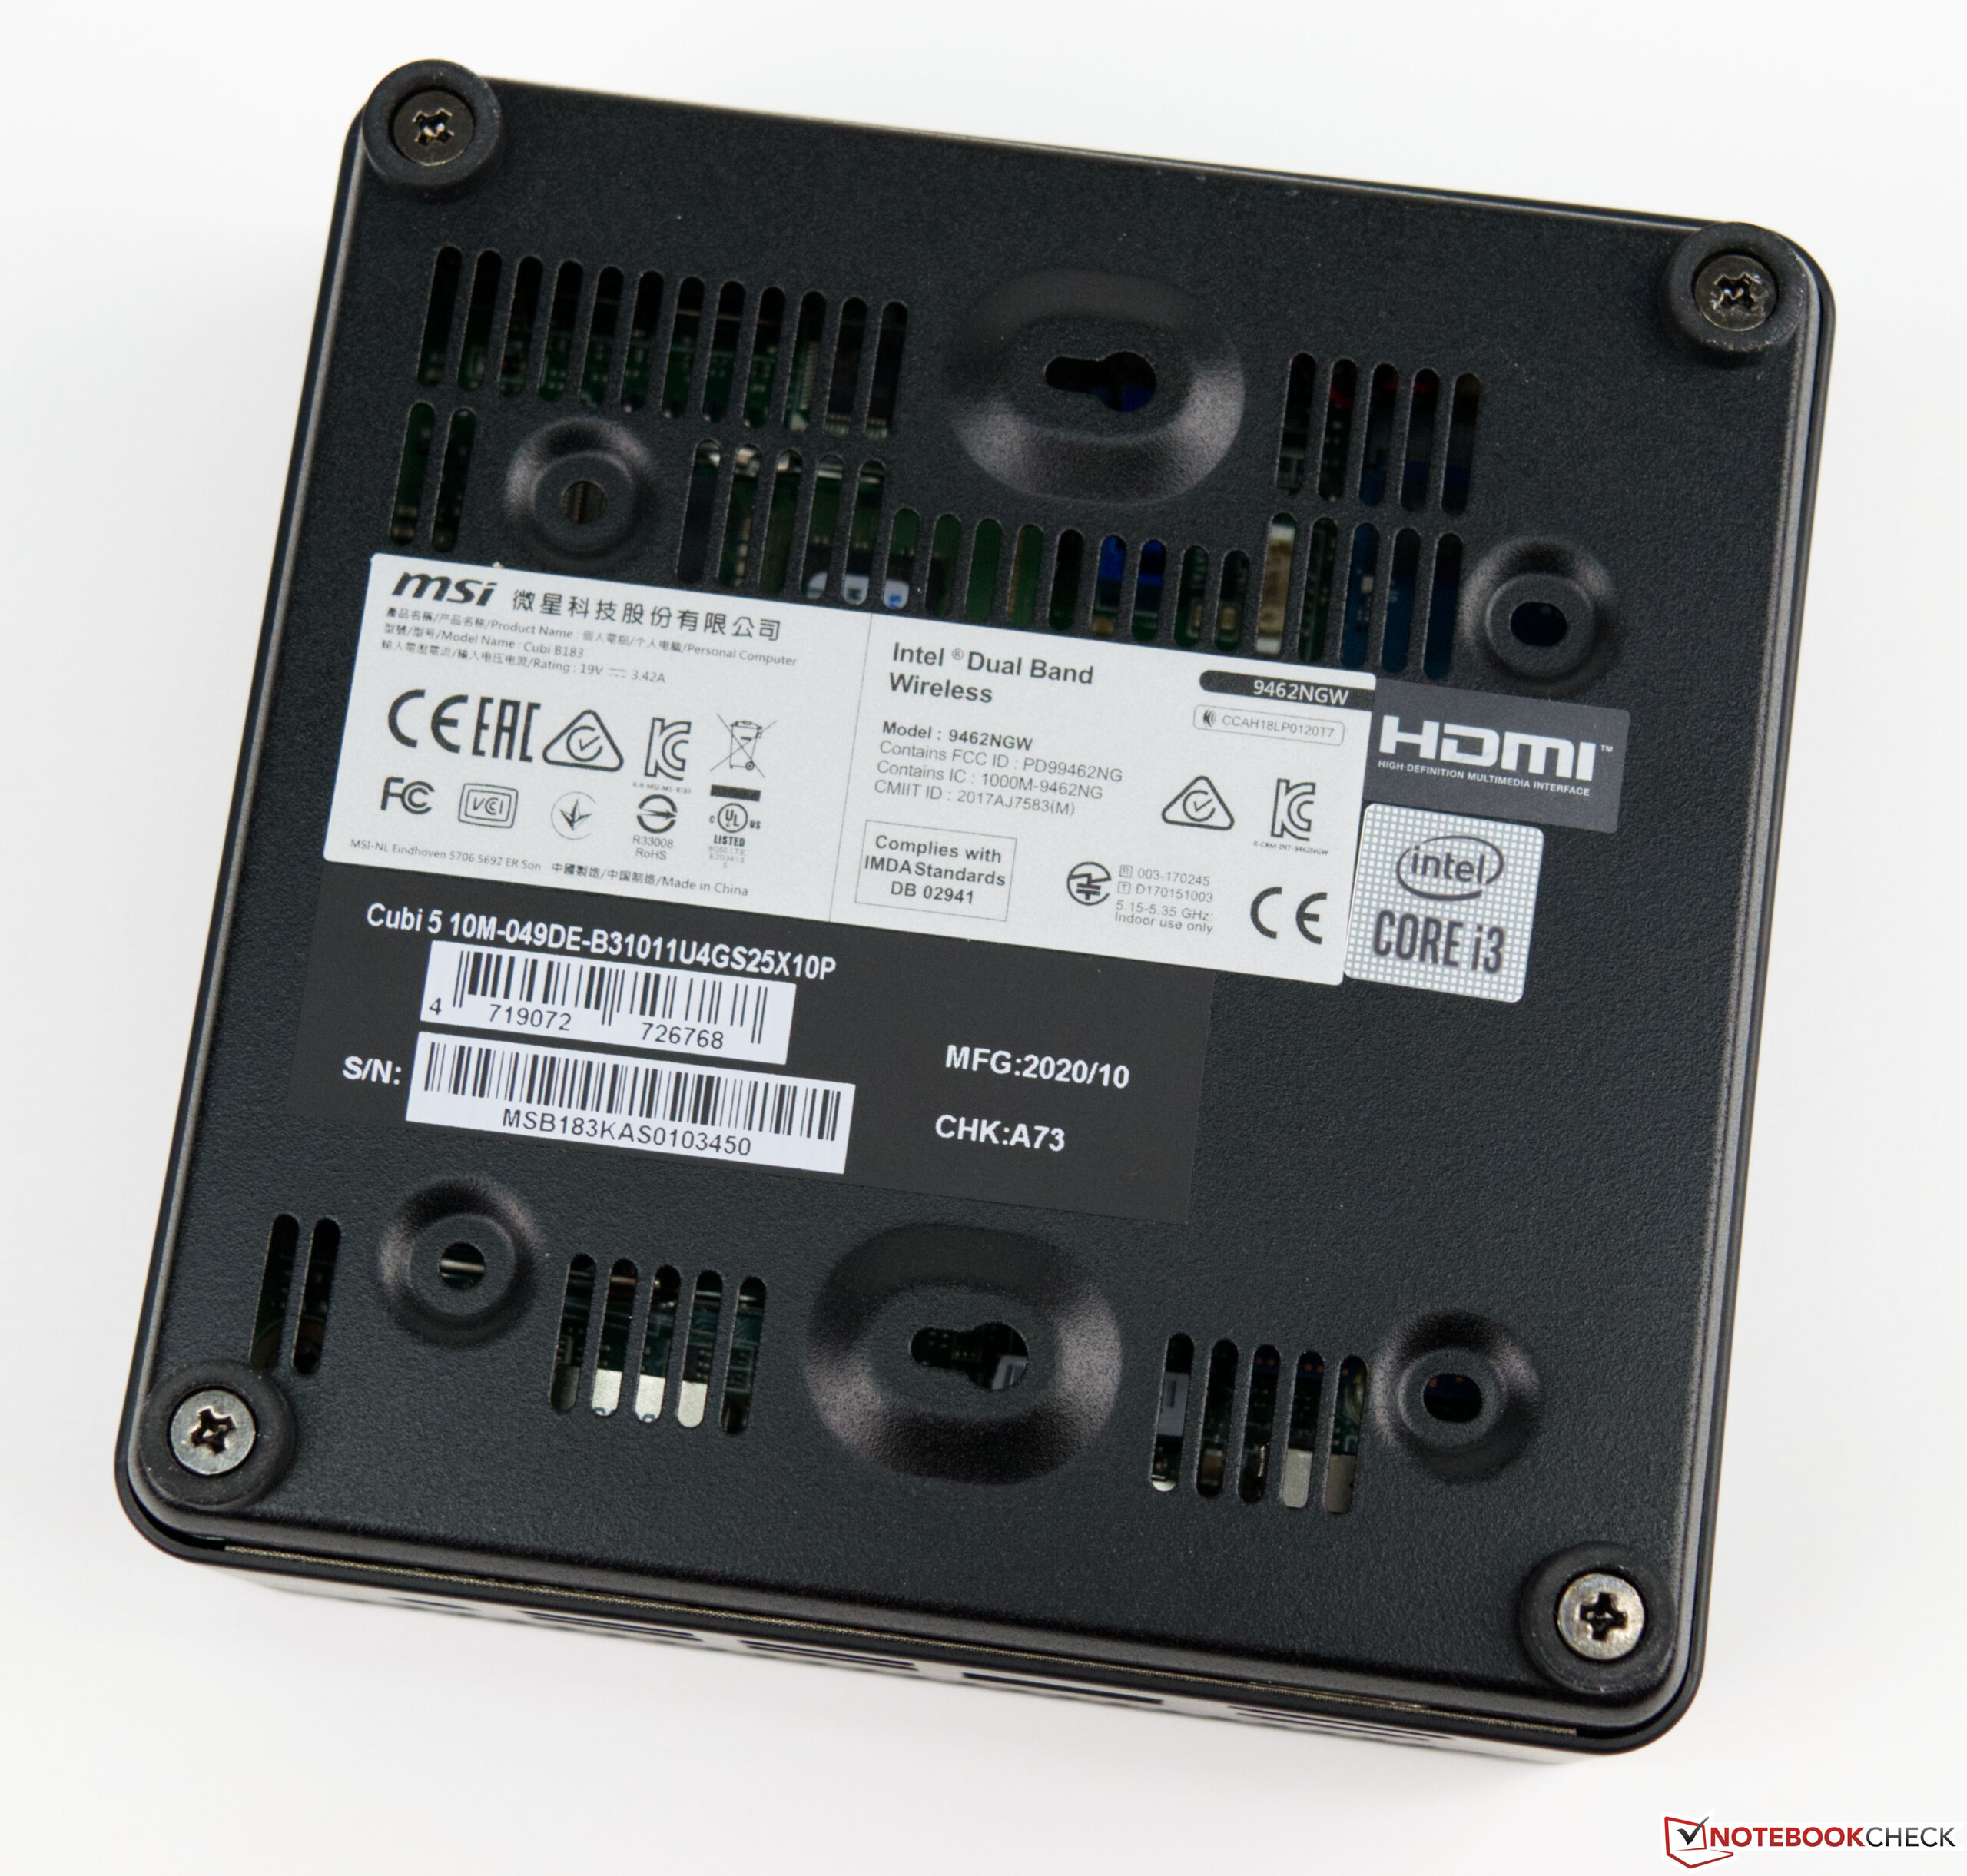
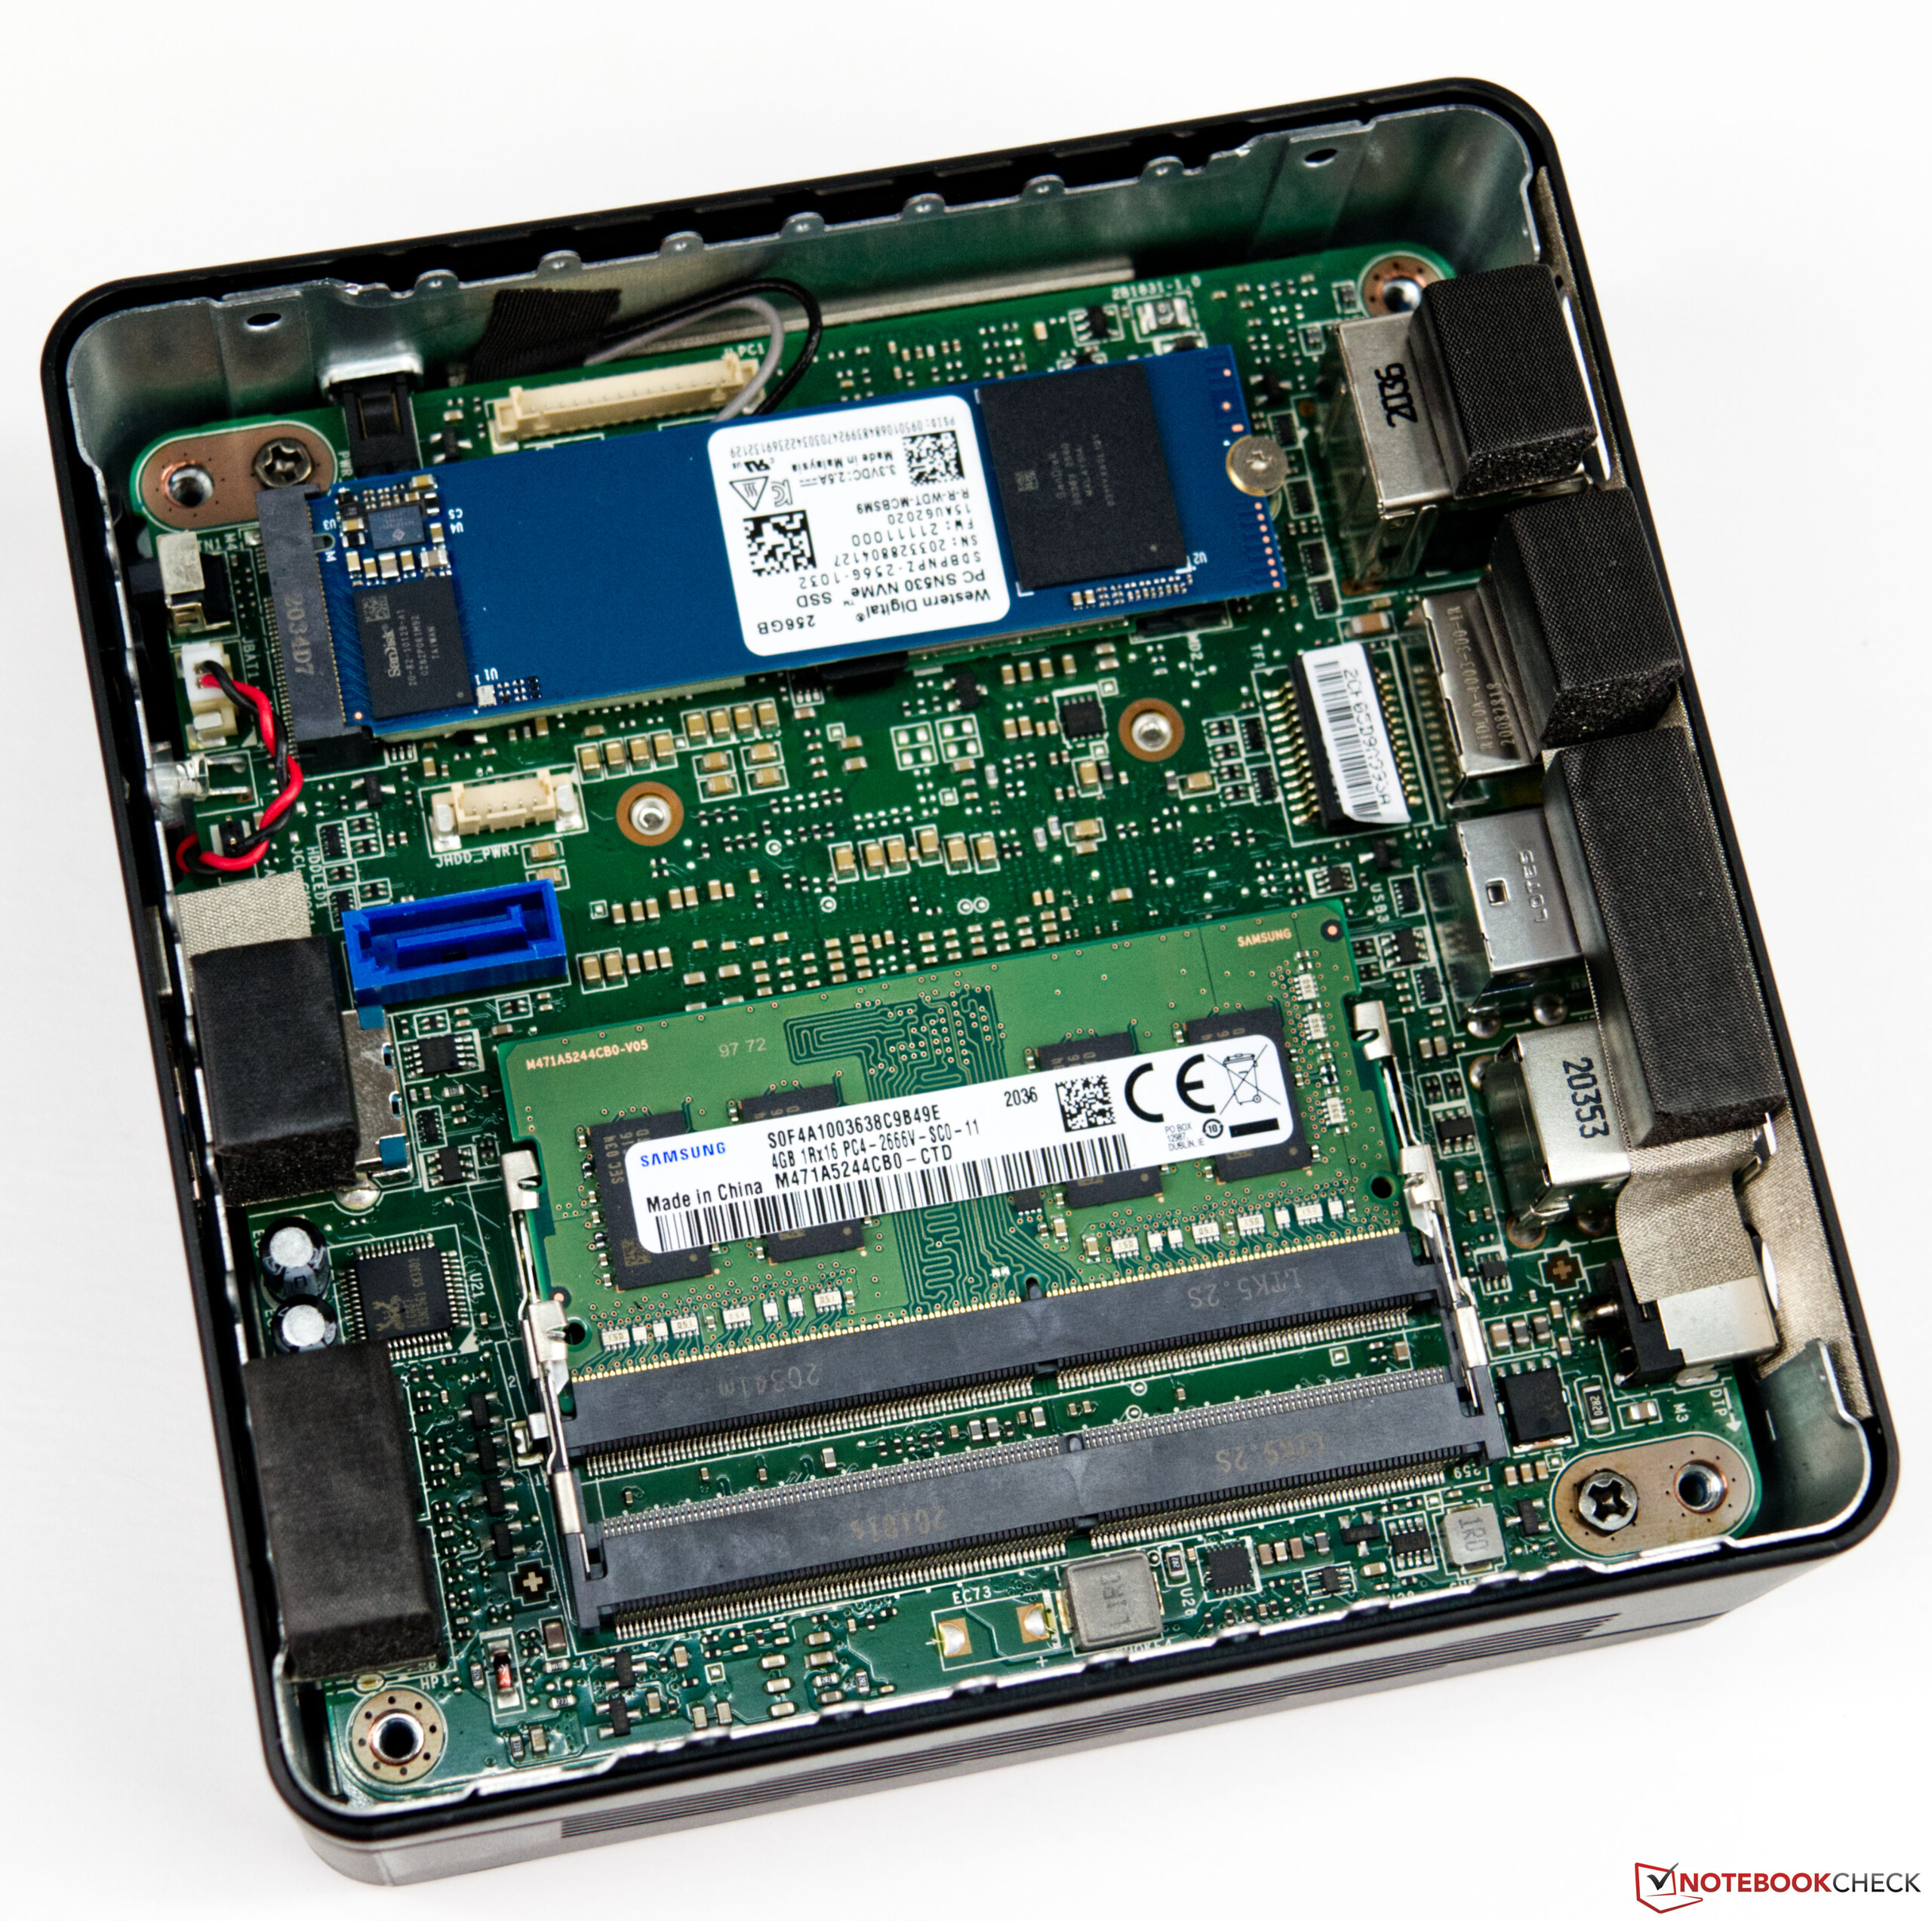
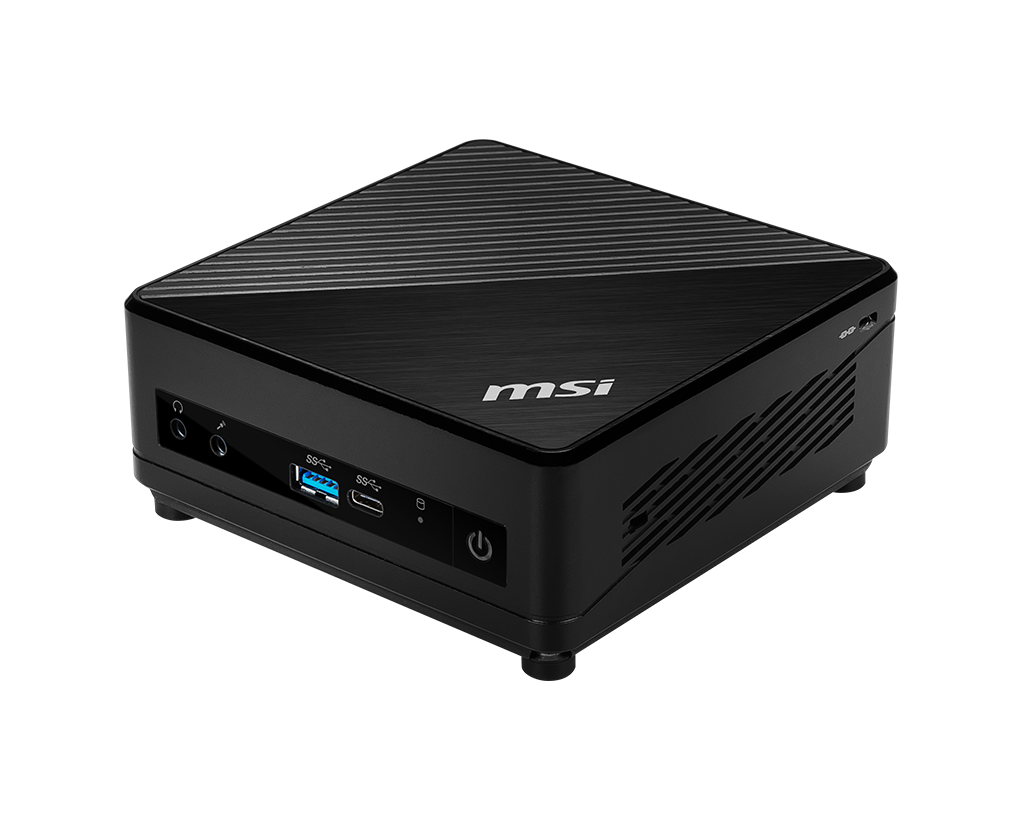
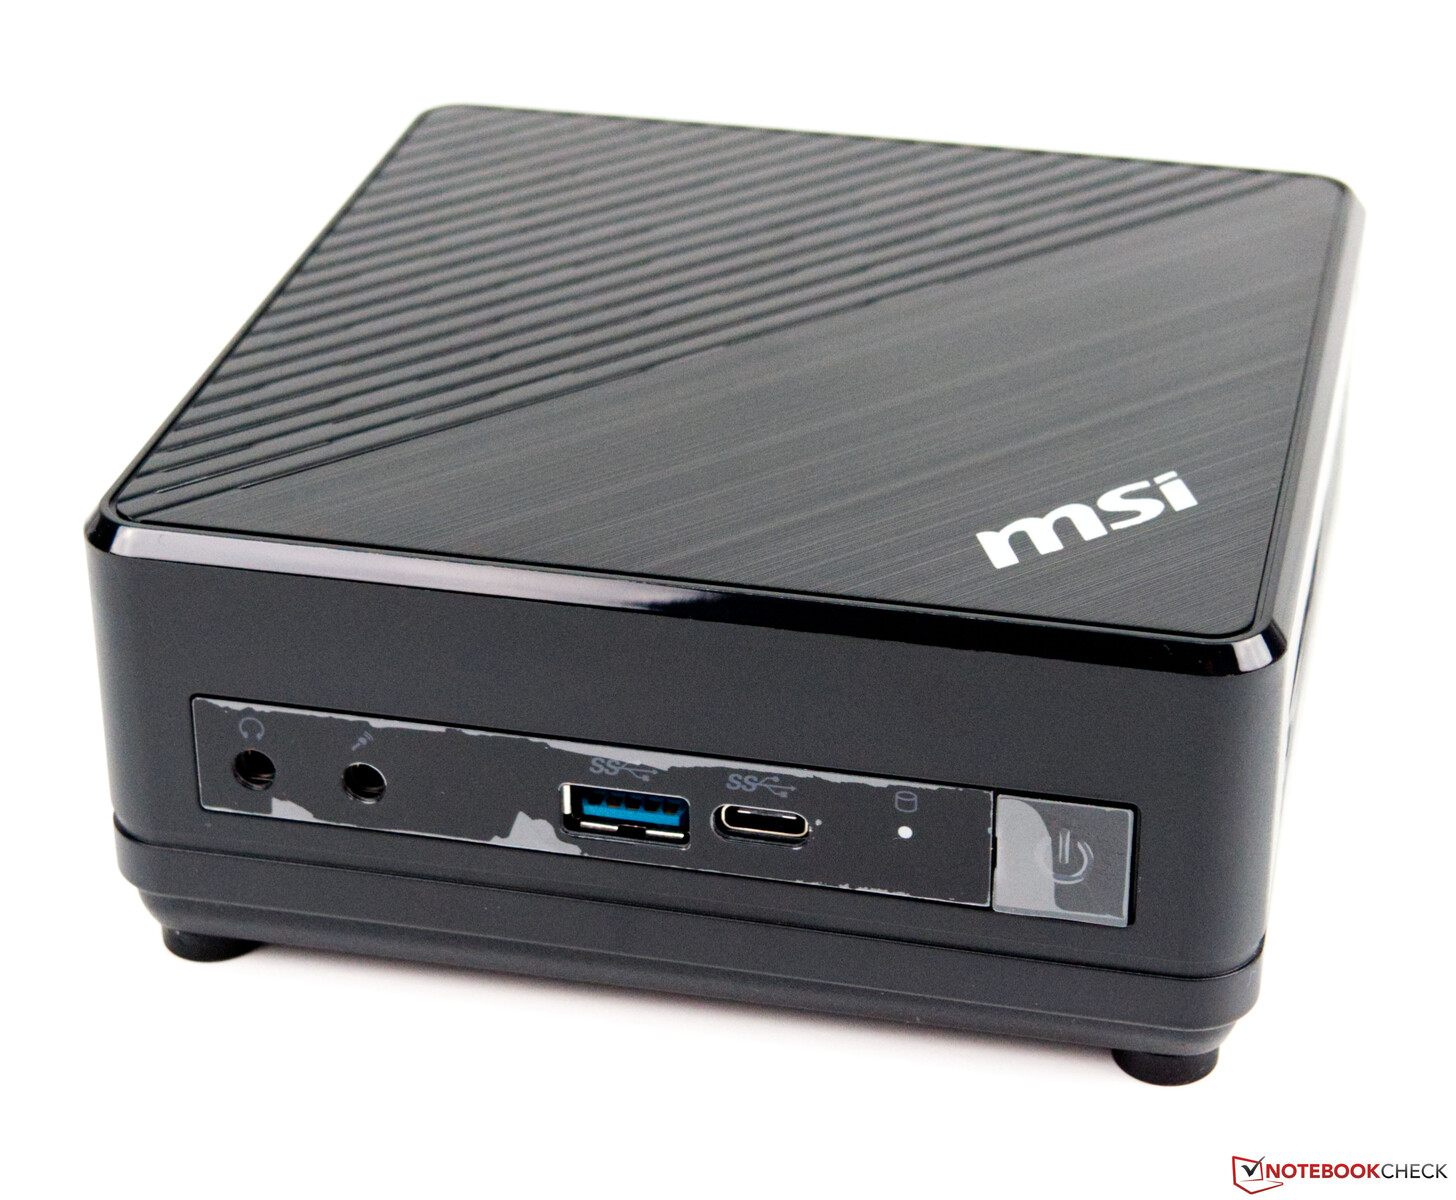
Cubi 5 10M是一款基于Comet Lake的迷你PC,在形状和尺寸上有点类似于英特尔NUC。我们测试设备中的SoC是英特尔酷睿i3-10110U,这是一个双核处理器,共有4个线程。安装的工作存储器是一个4GB的SO-DIMM模块,必要时可以更换或扩展。总共可以使用两个SO-DIMM模块。256GB固态硬盘提供NVMe支持,从而提供快速的读写速率。一切都安装在124 x 54 x 124(宽x高x深)毫米的小箱子里(约4.9 x 2.1 x 4.9英寸)。这意味着Cubi 5 M10与英特尔NUC 10性能套件直接相比,只是略大一些。如果安装的M.2固态硬盘对你来说太小,你可以把它换掉或在设备中安装另一个2.5英寸的驱动器。所有必要的螺丝和电缆都包括在内。在我们的测试配置中,Cubi 5 M10迷你电脑的售价略低于540欧元(约638美元)。然而,我们想强调的是,这不是一个裸机系统,这意味着没有额外的费用用于内存、大容量存储和操作系统。
微星Cubi 5 M10有六种不同的配置。你可以在这里找到一个列表https://de.msi.com/Business-Productivity-PC/Cubi-5-10M/Specification 。然而,你应该小心,因为替代选项是所谓的裸机系统。这些系统没有工作内存和大容量存储。操作系统也需要额外购买,这就推高了价格。
案例与设备
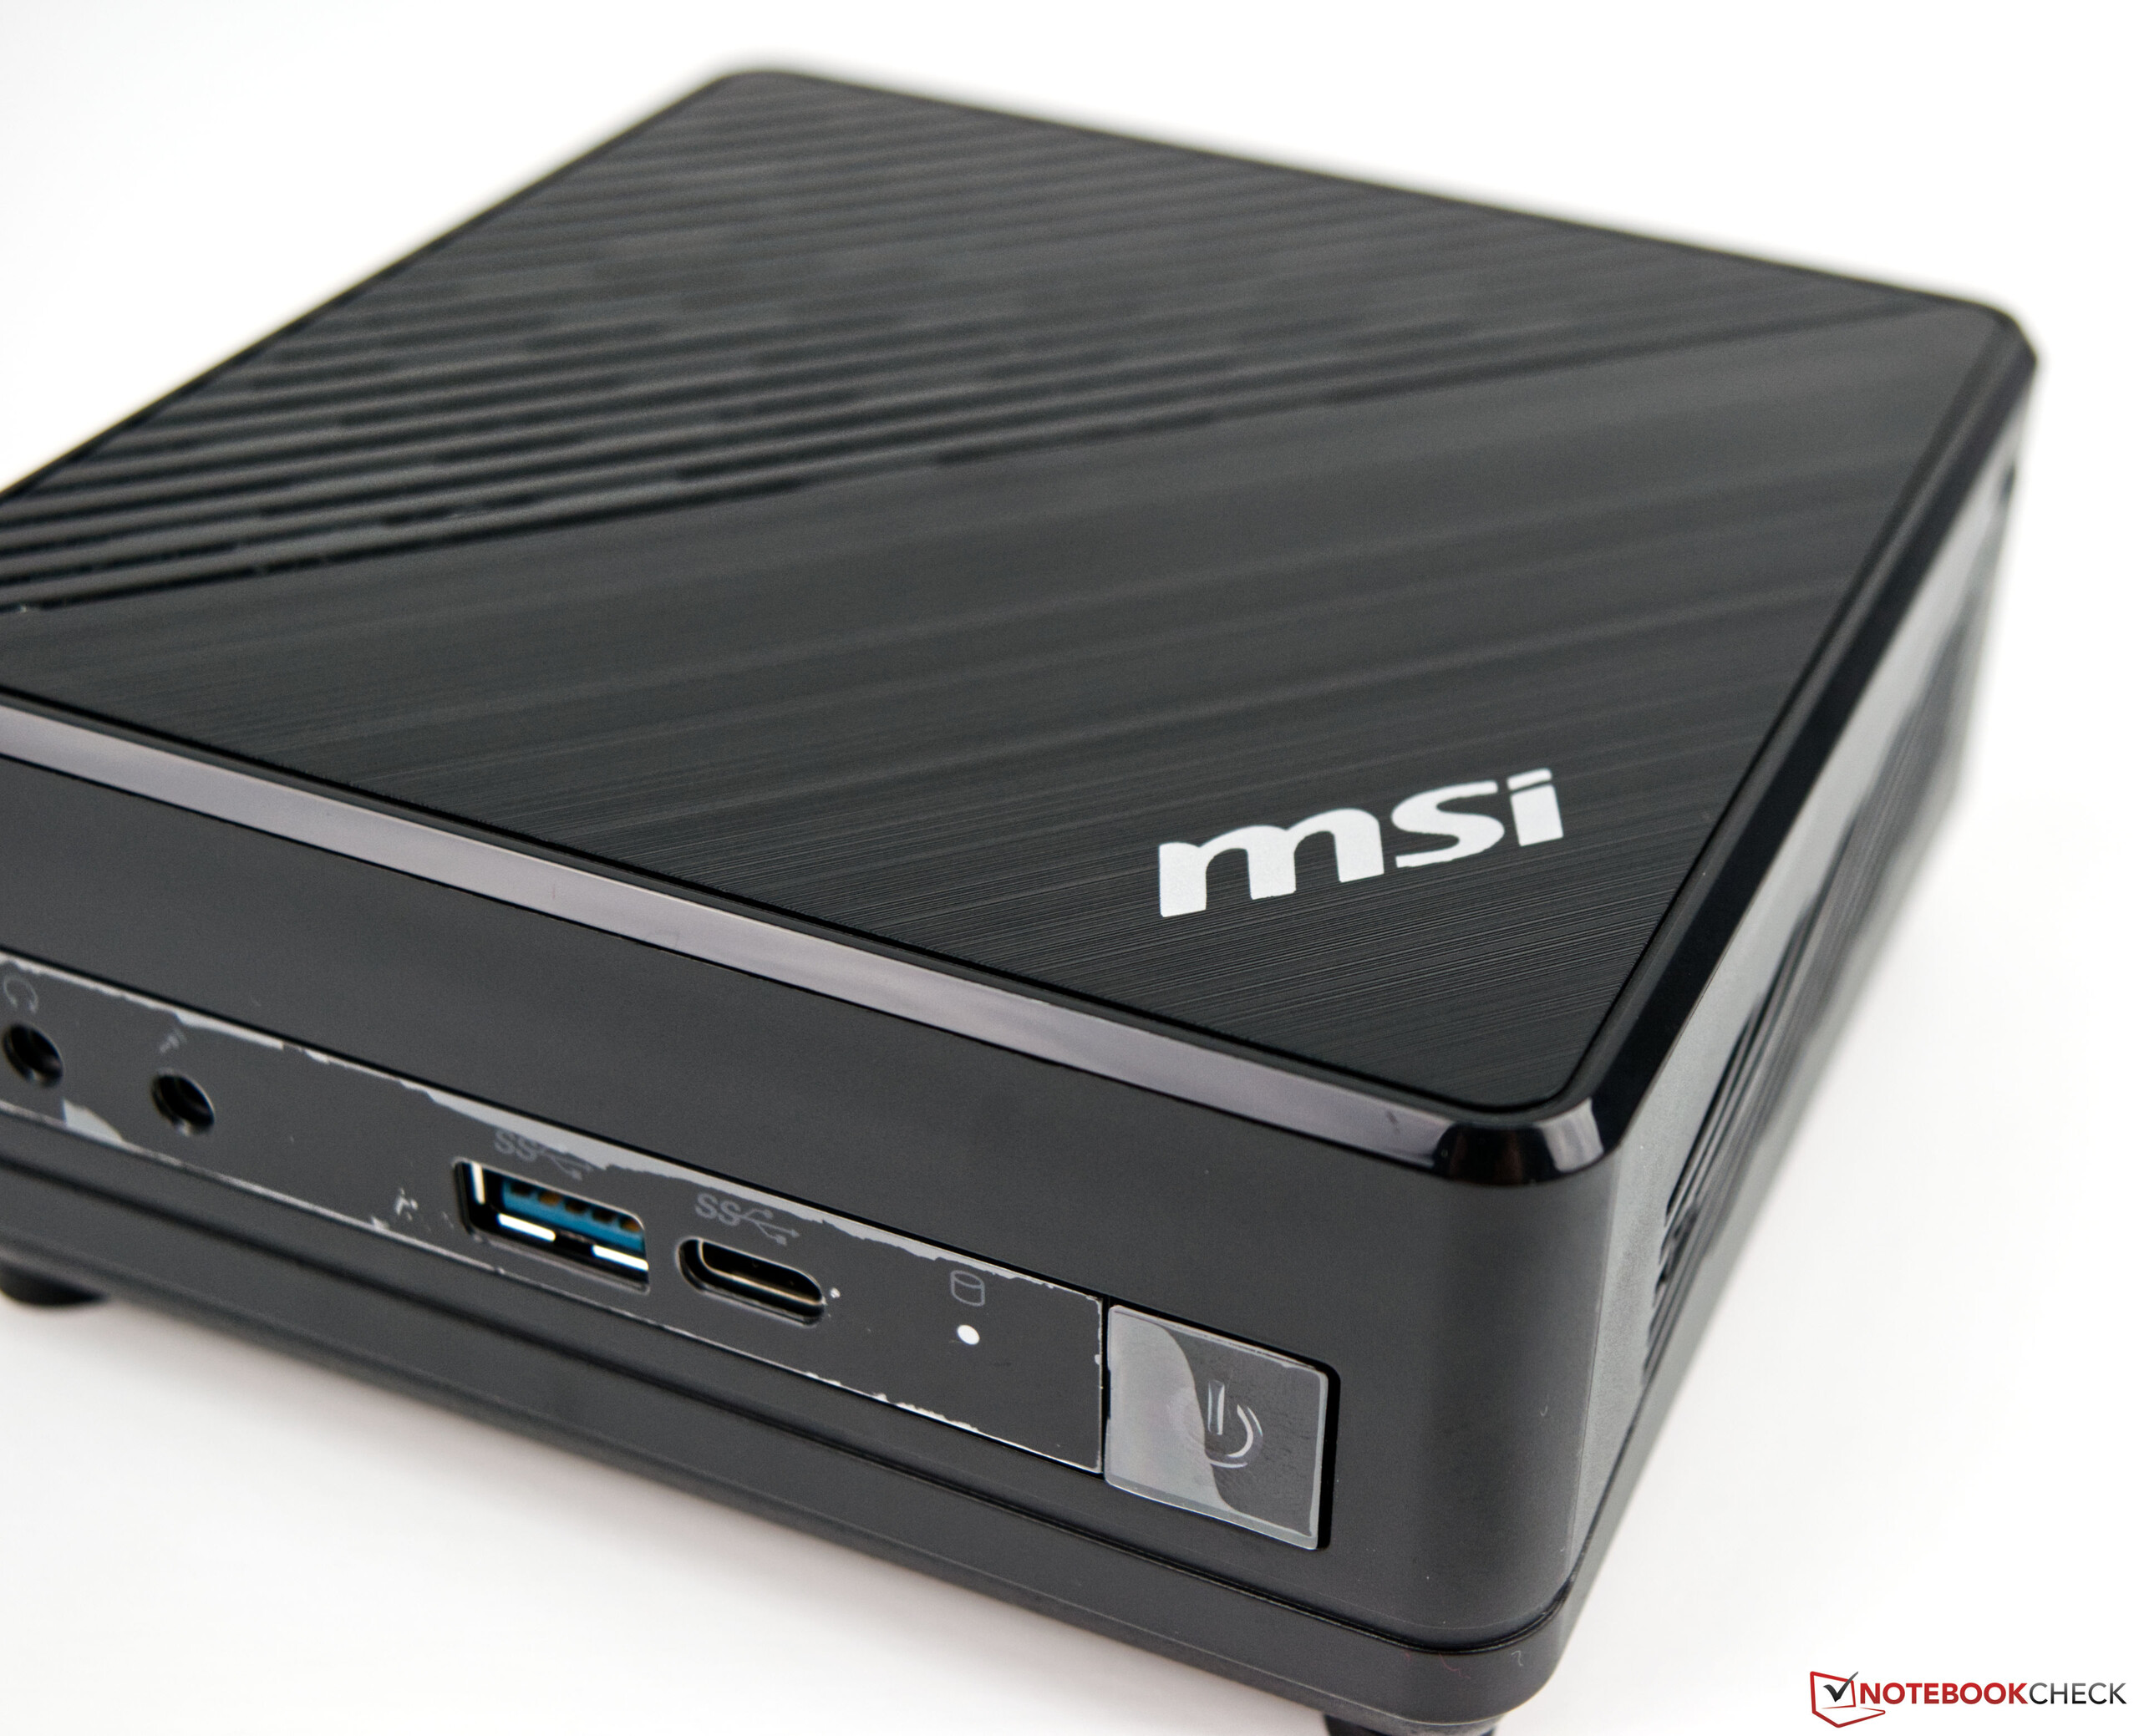
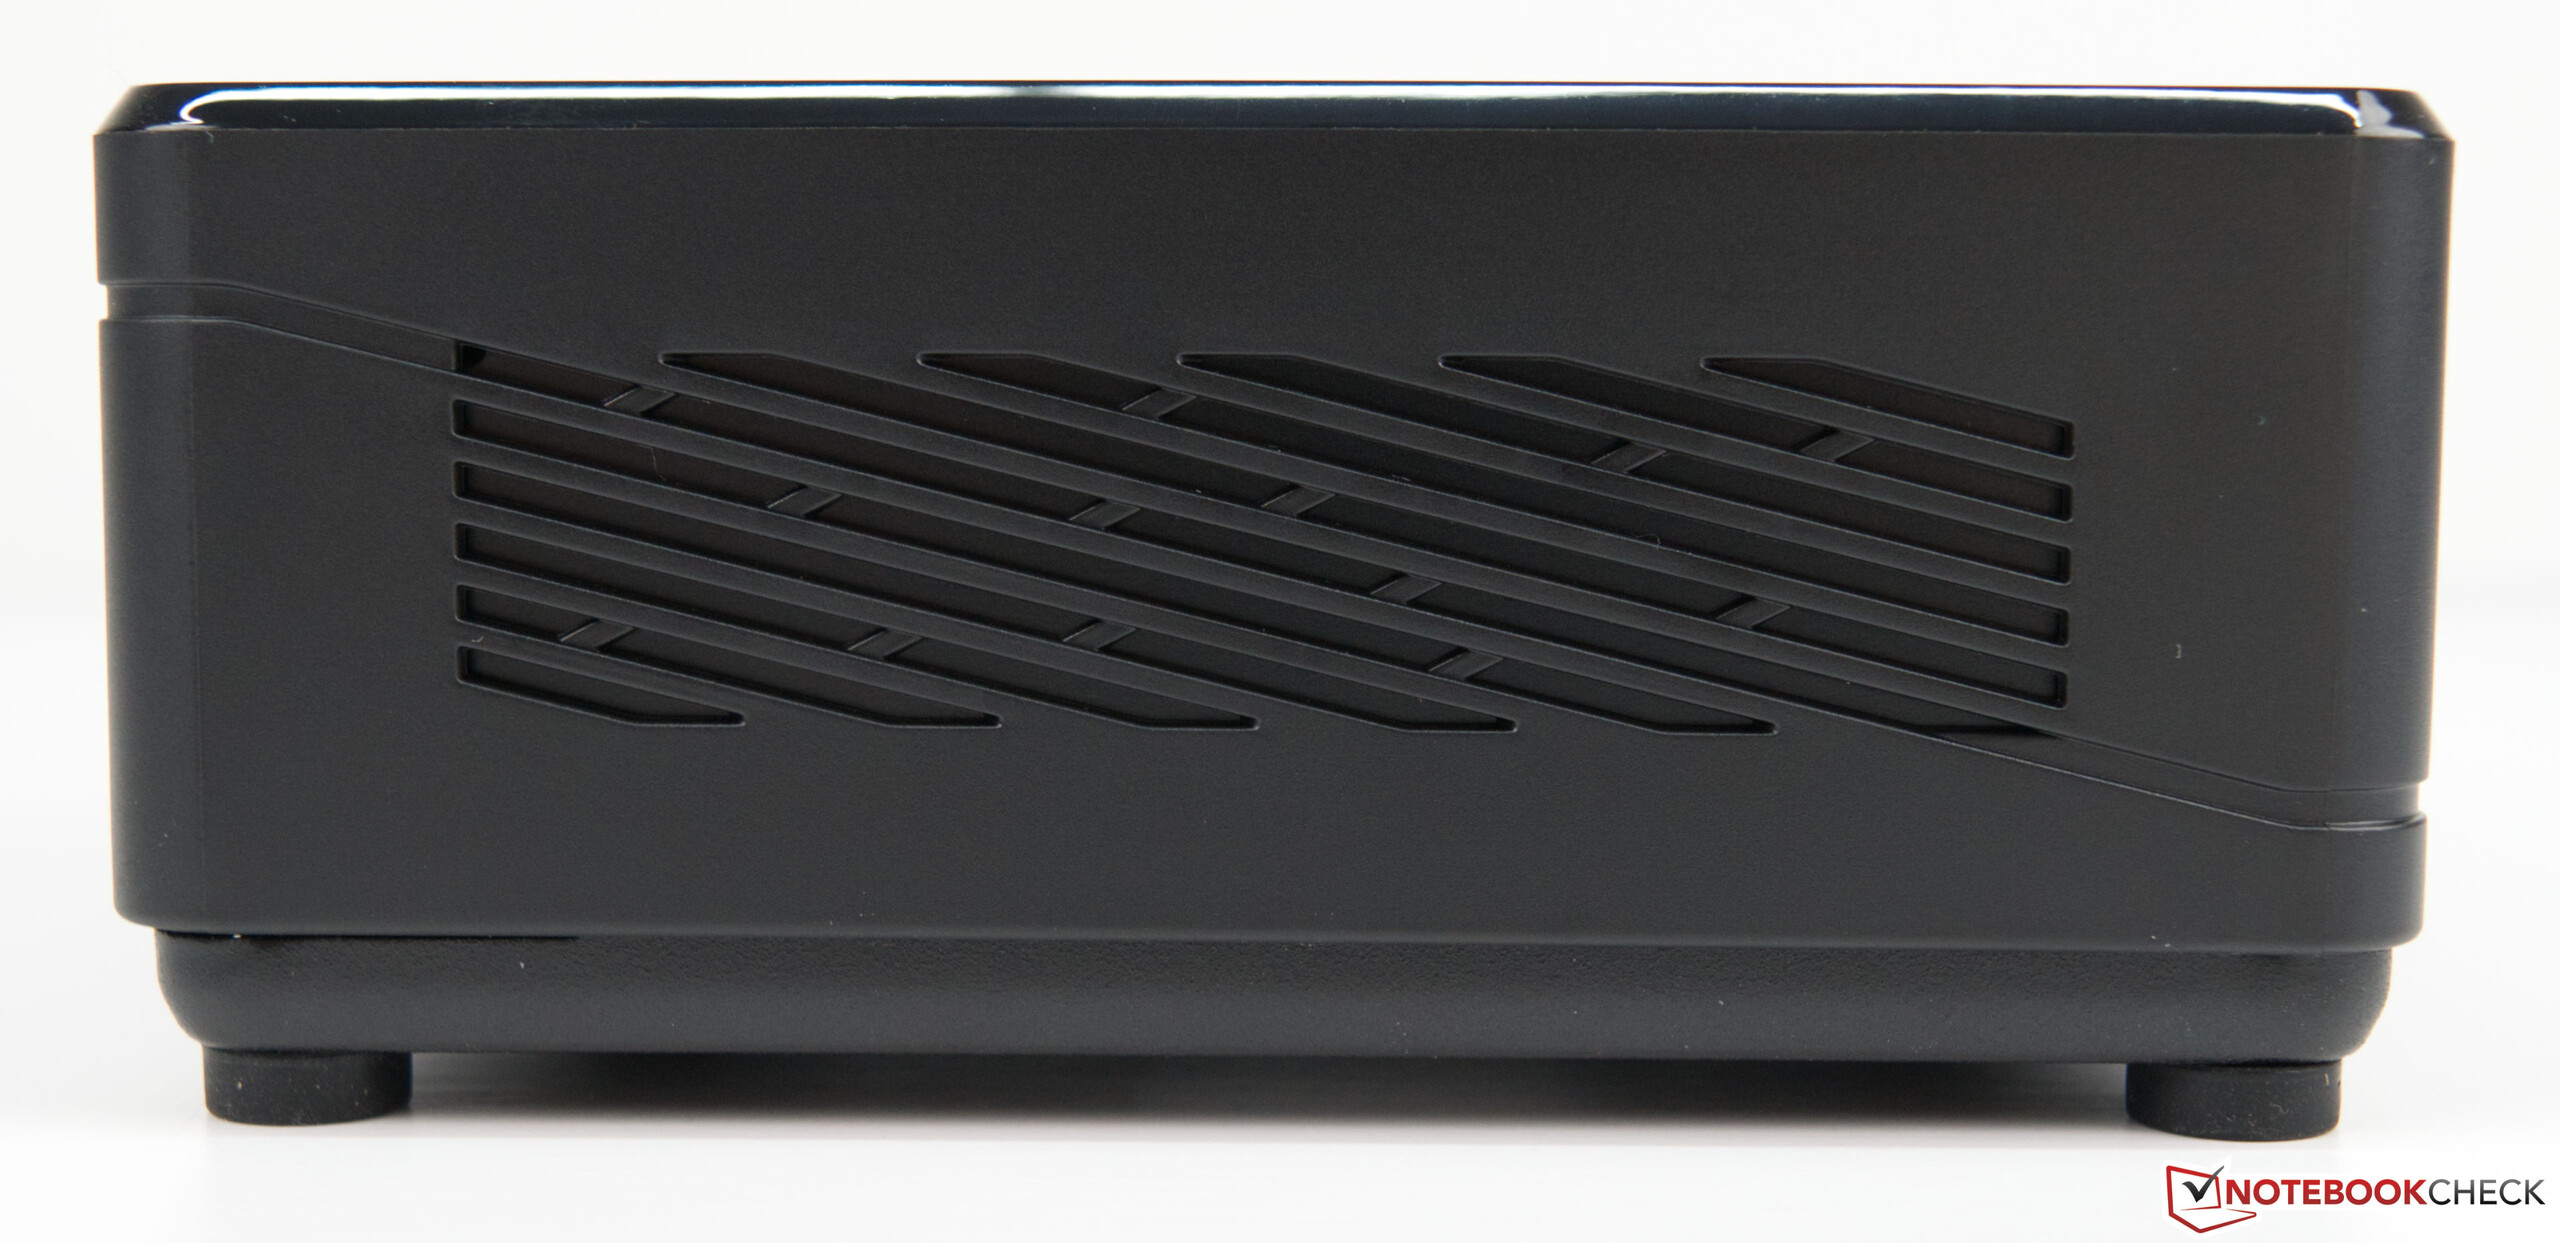
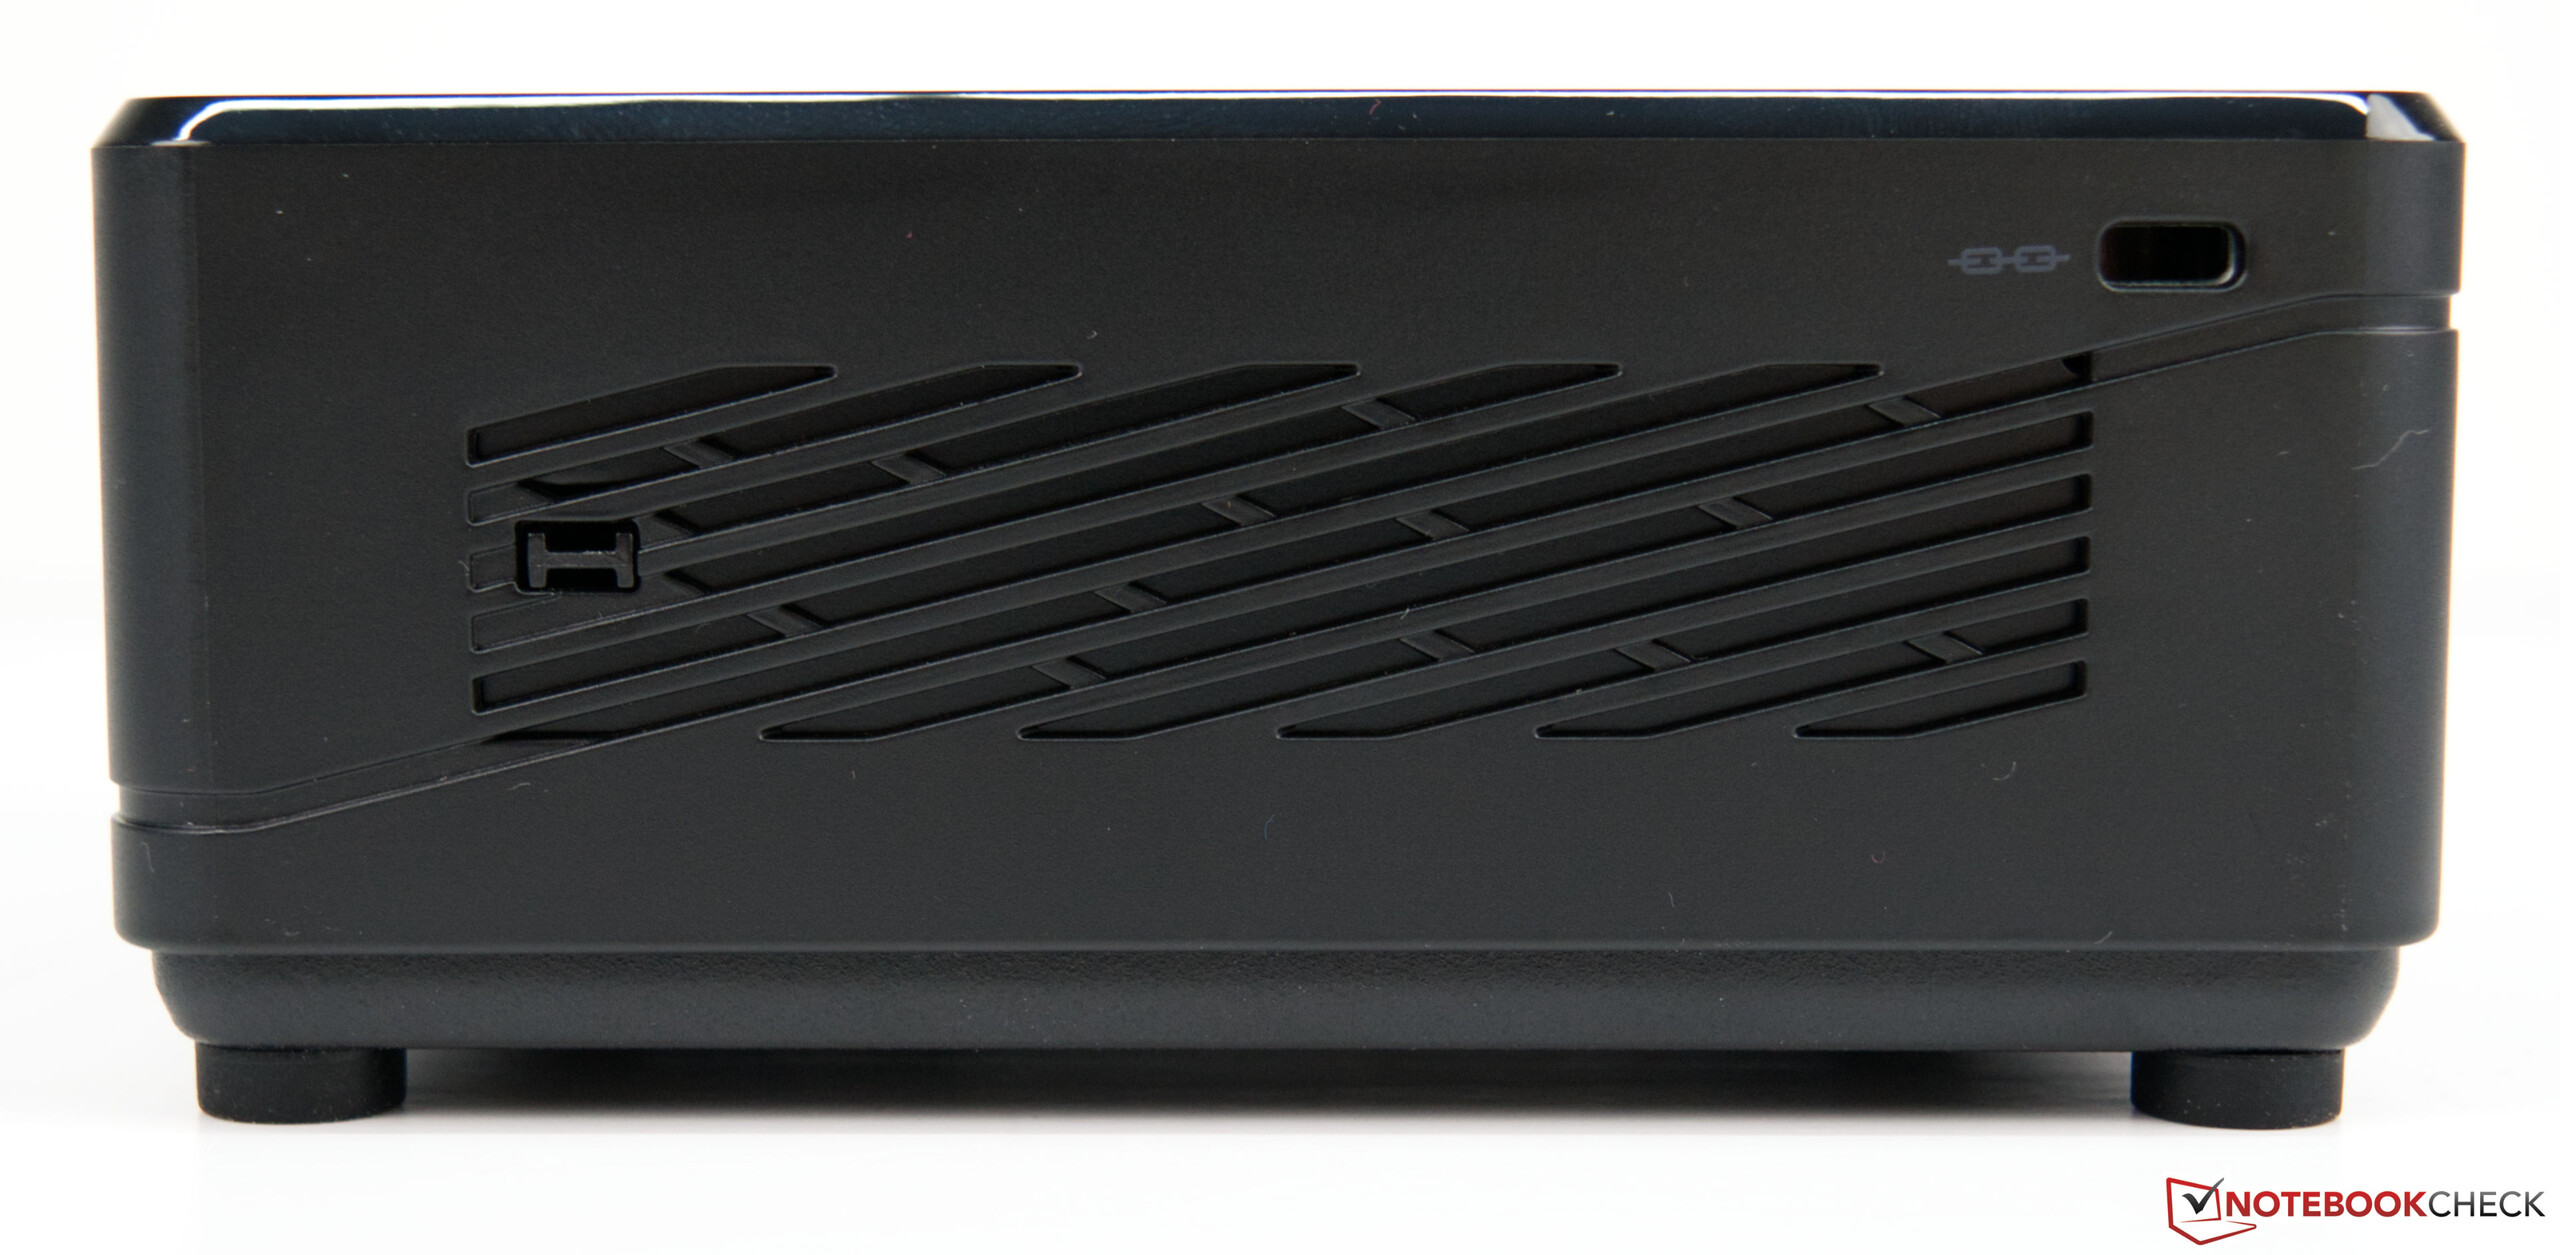
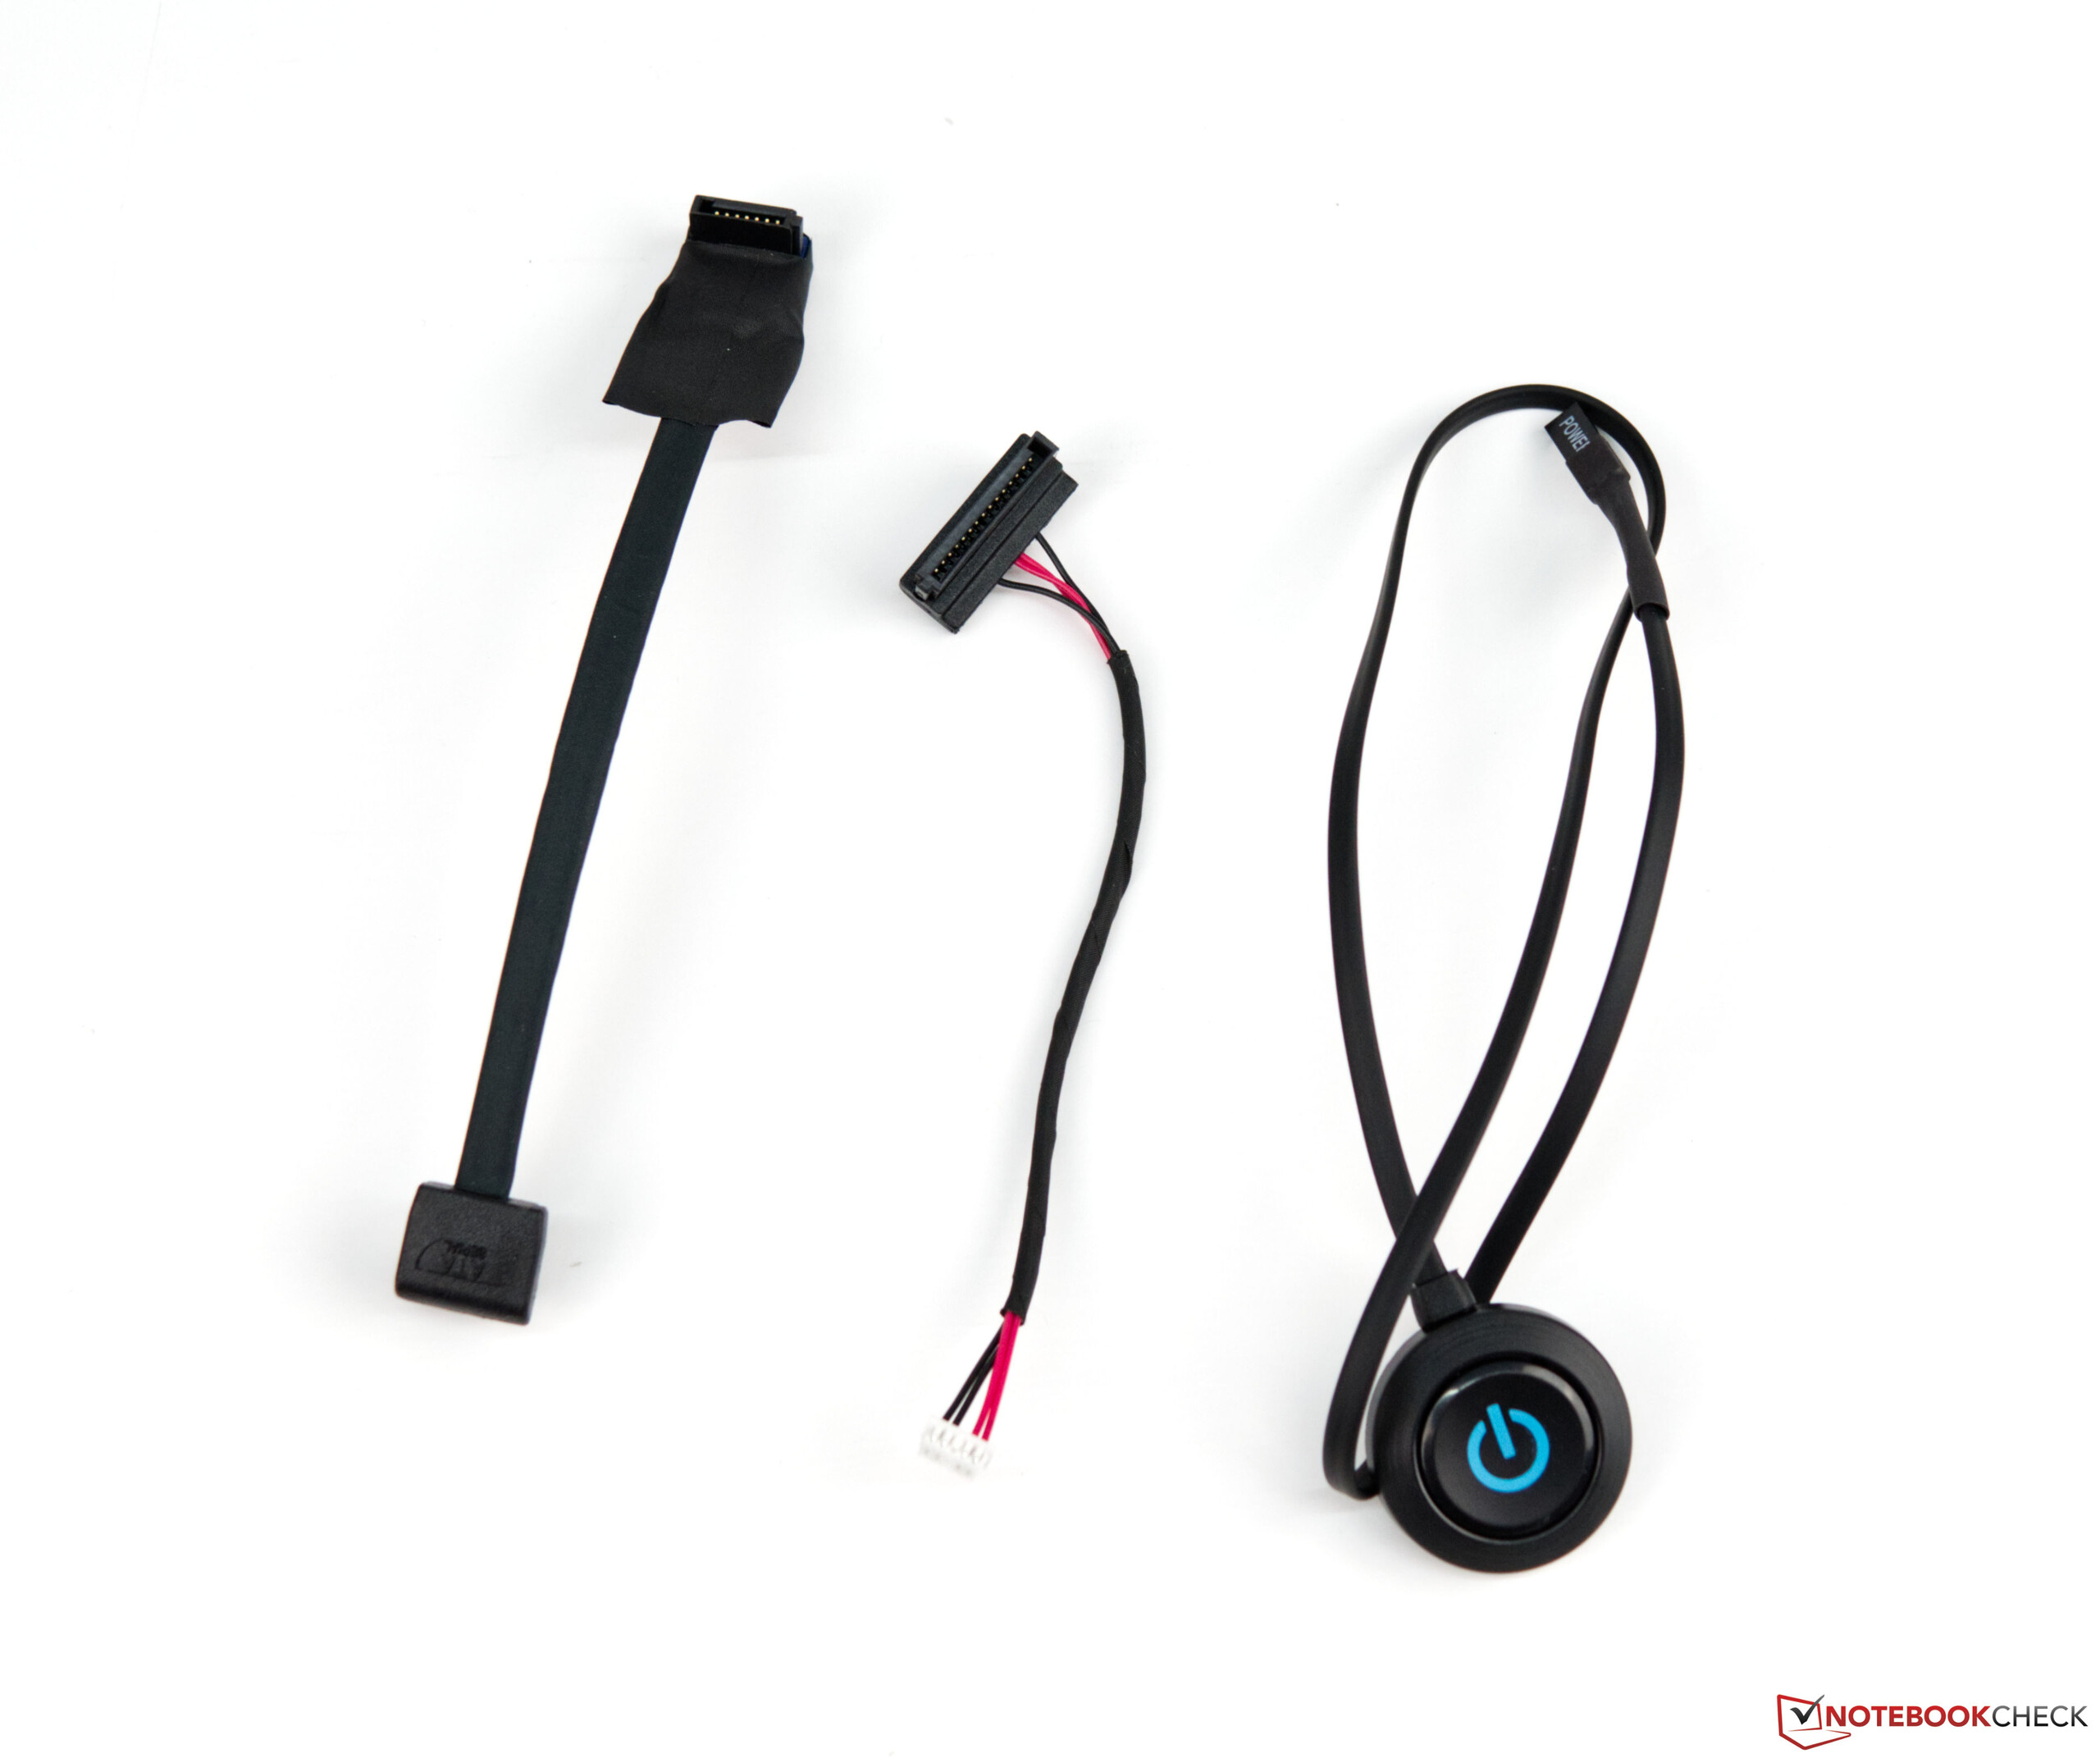
这款箱子的内部有很多塑料和金属,以保证稳定性。黑色的箱子用一些点缀物来提亮。幸运的是,没有使用钢琴烤漆表面。这些东西随着时间的推移很快就会被划伤,并使指纹很快就能看到。箱子非常坚固,在底部提供了一个维护舱口。这样你就可以快速接触到里面安装的部件。该设备也可以直接连接到显示器上,只要它有一个Vesa支架。可以安装一个可选的按钮,以便顺利打开设备。
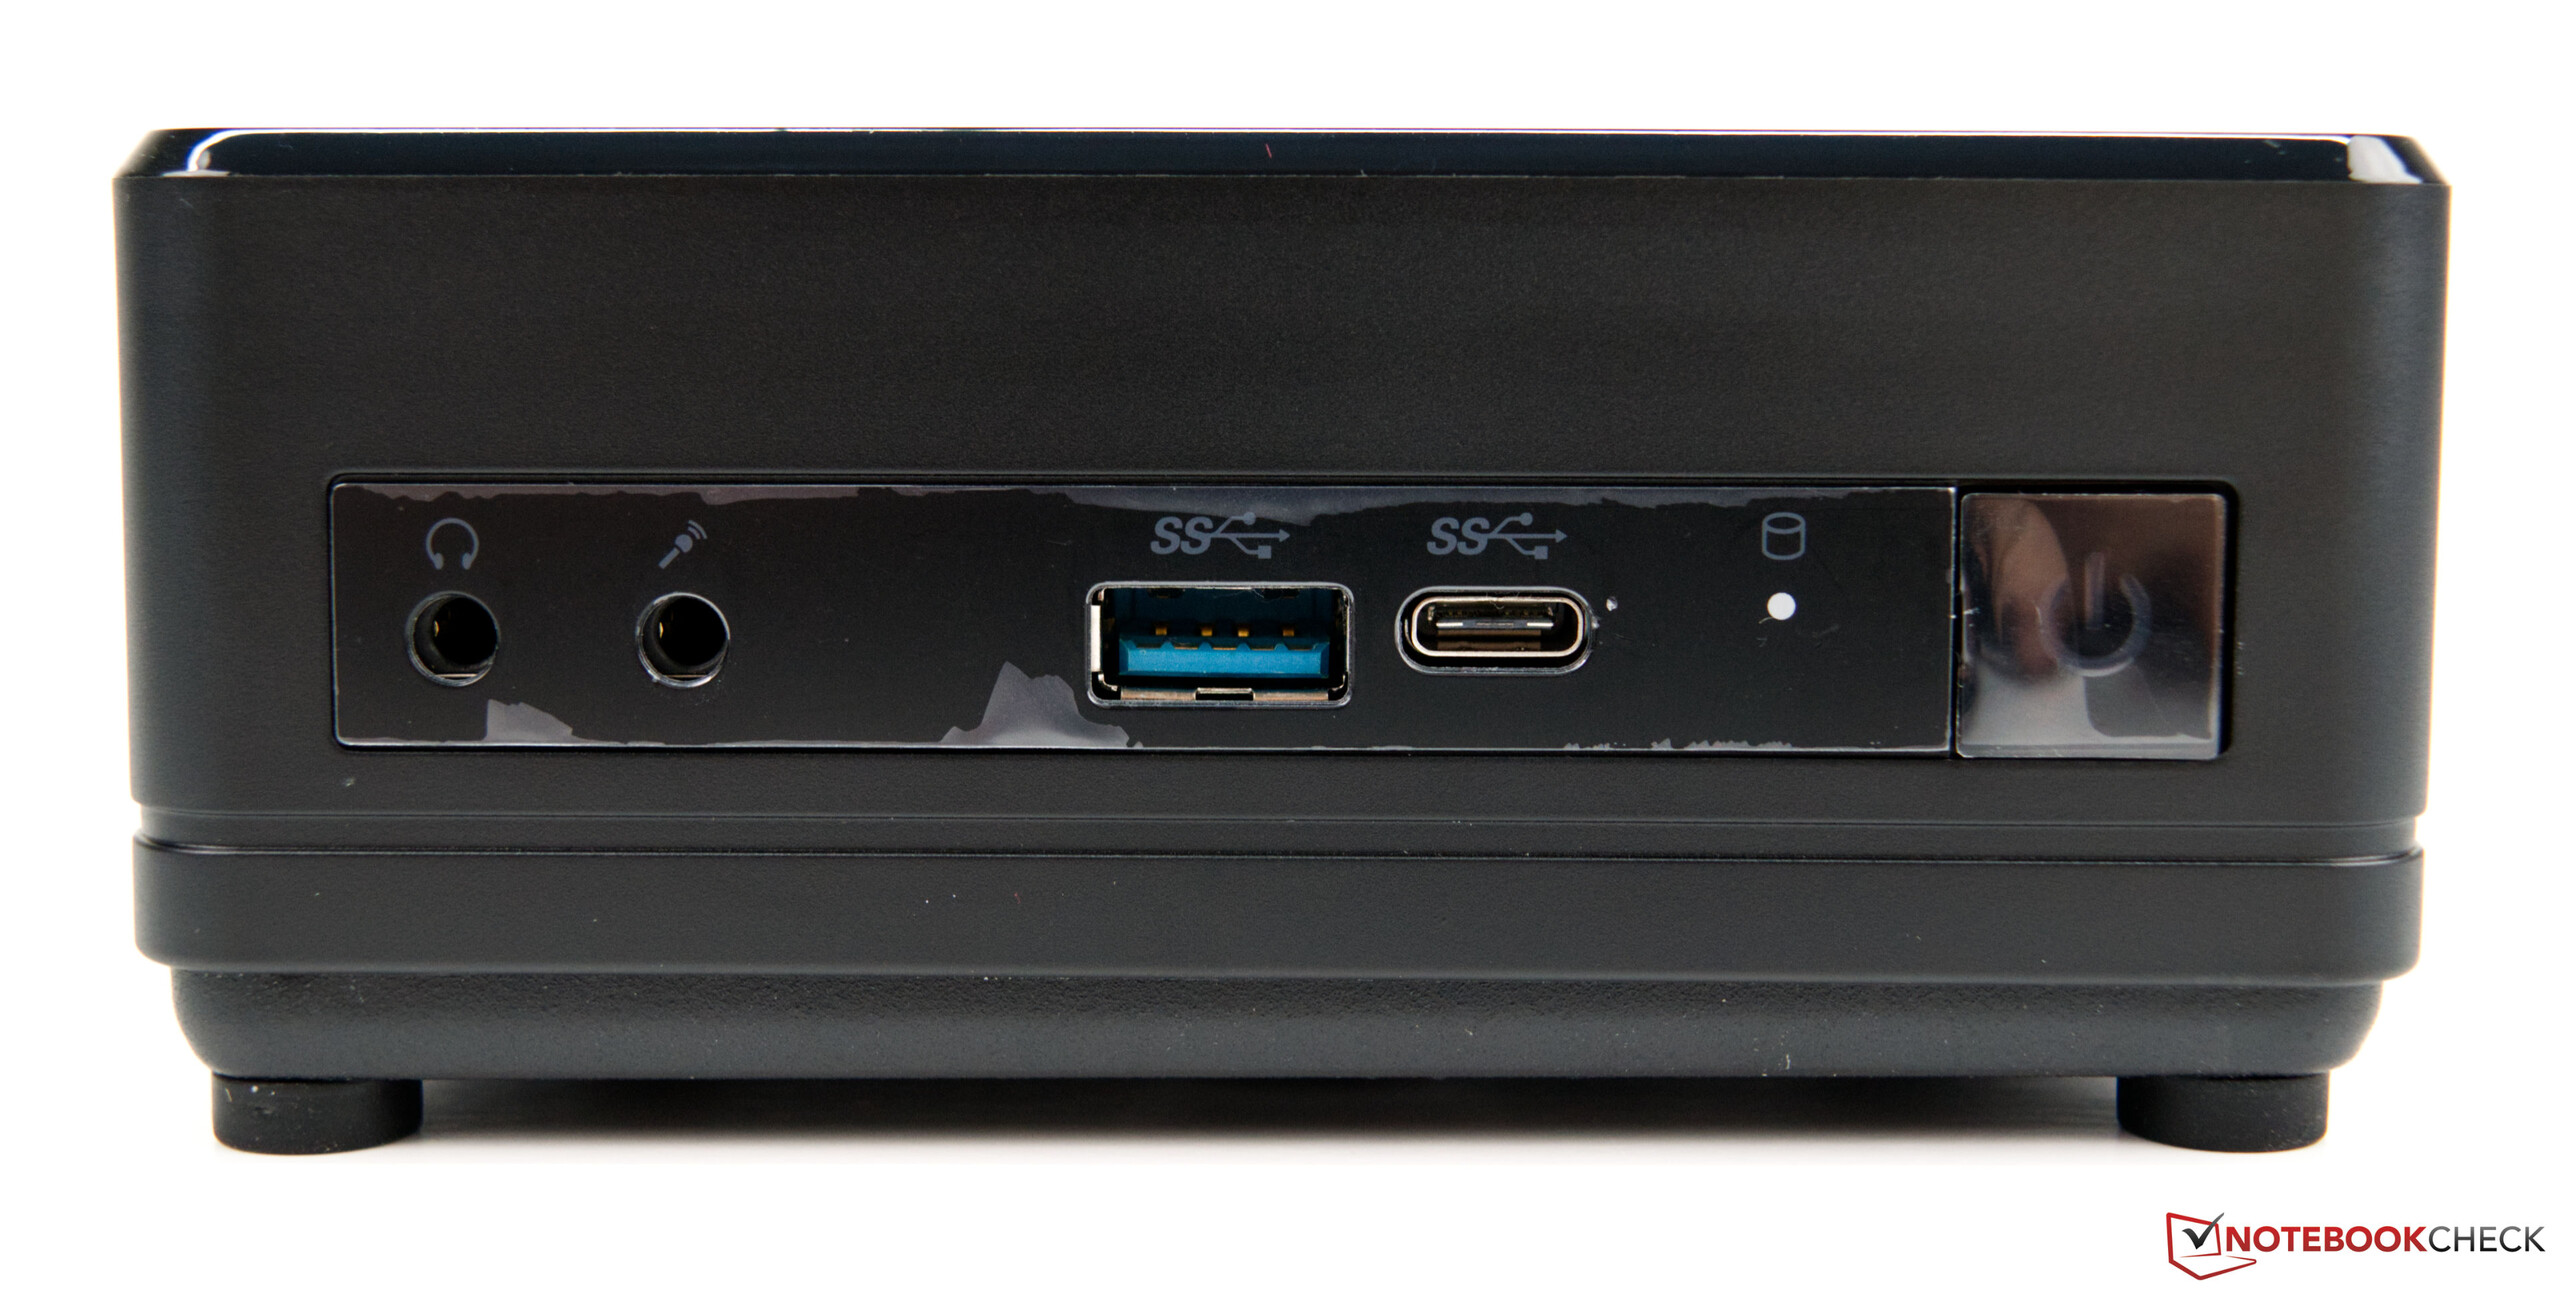
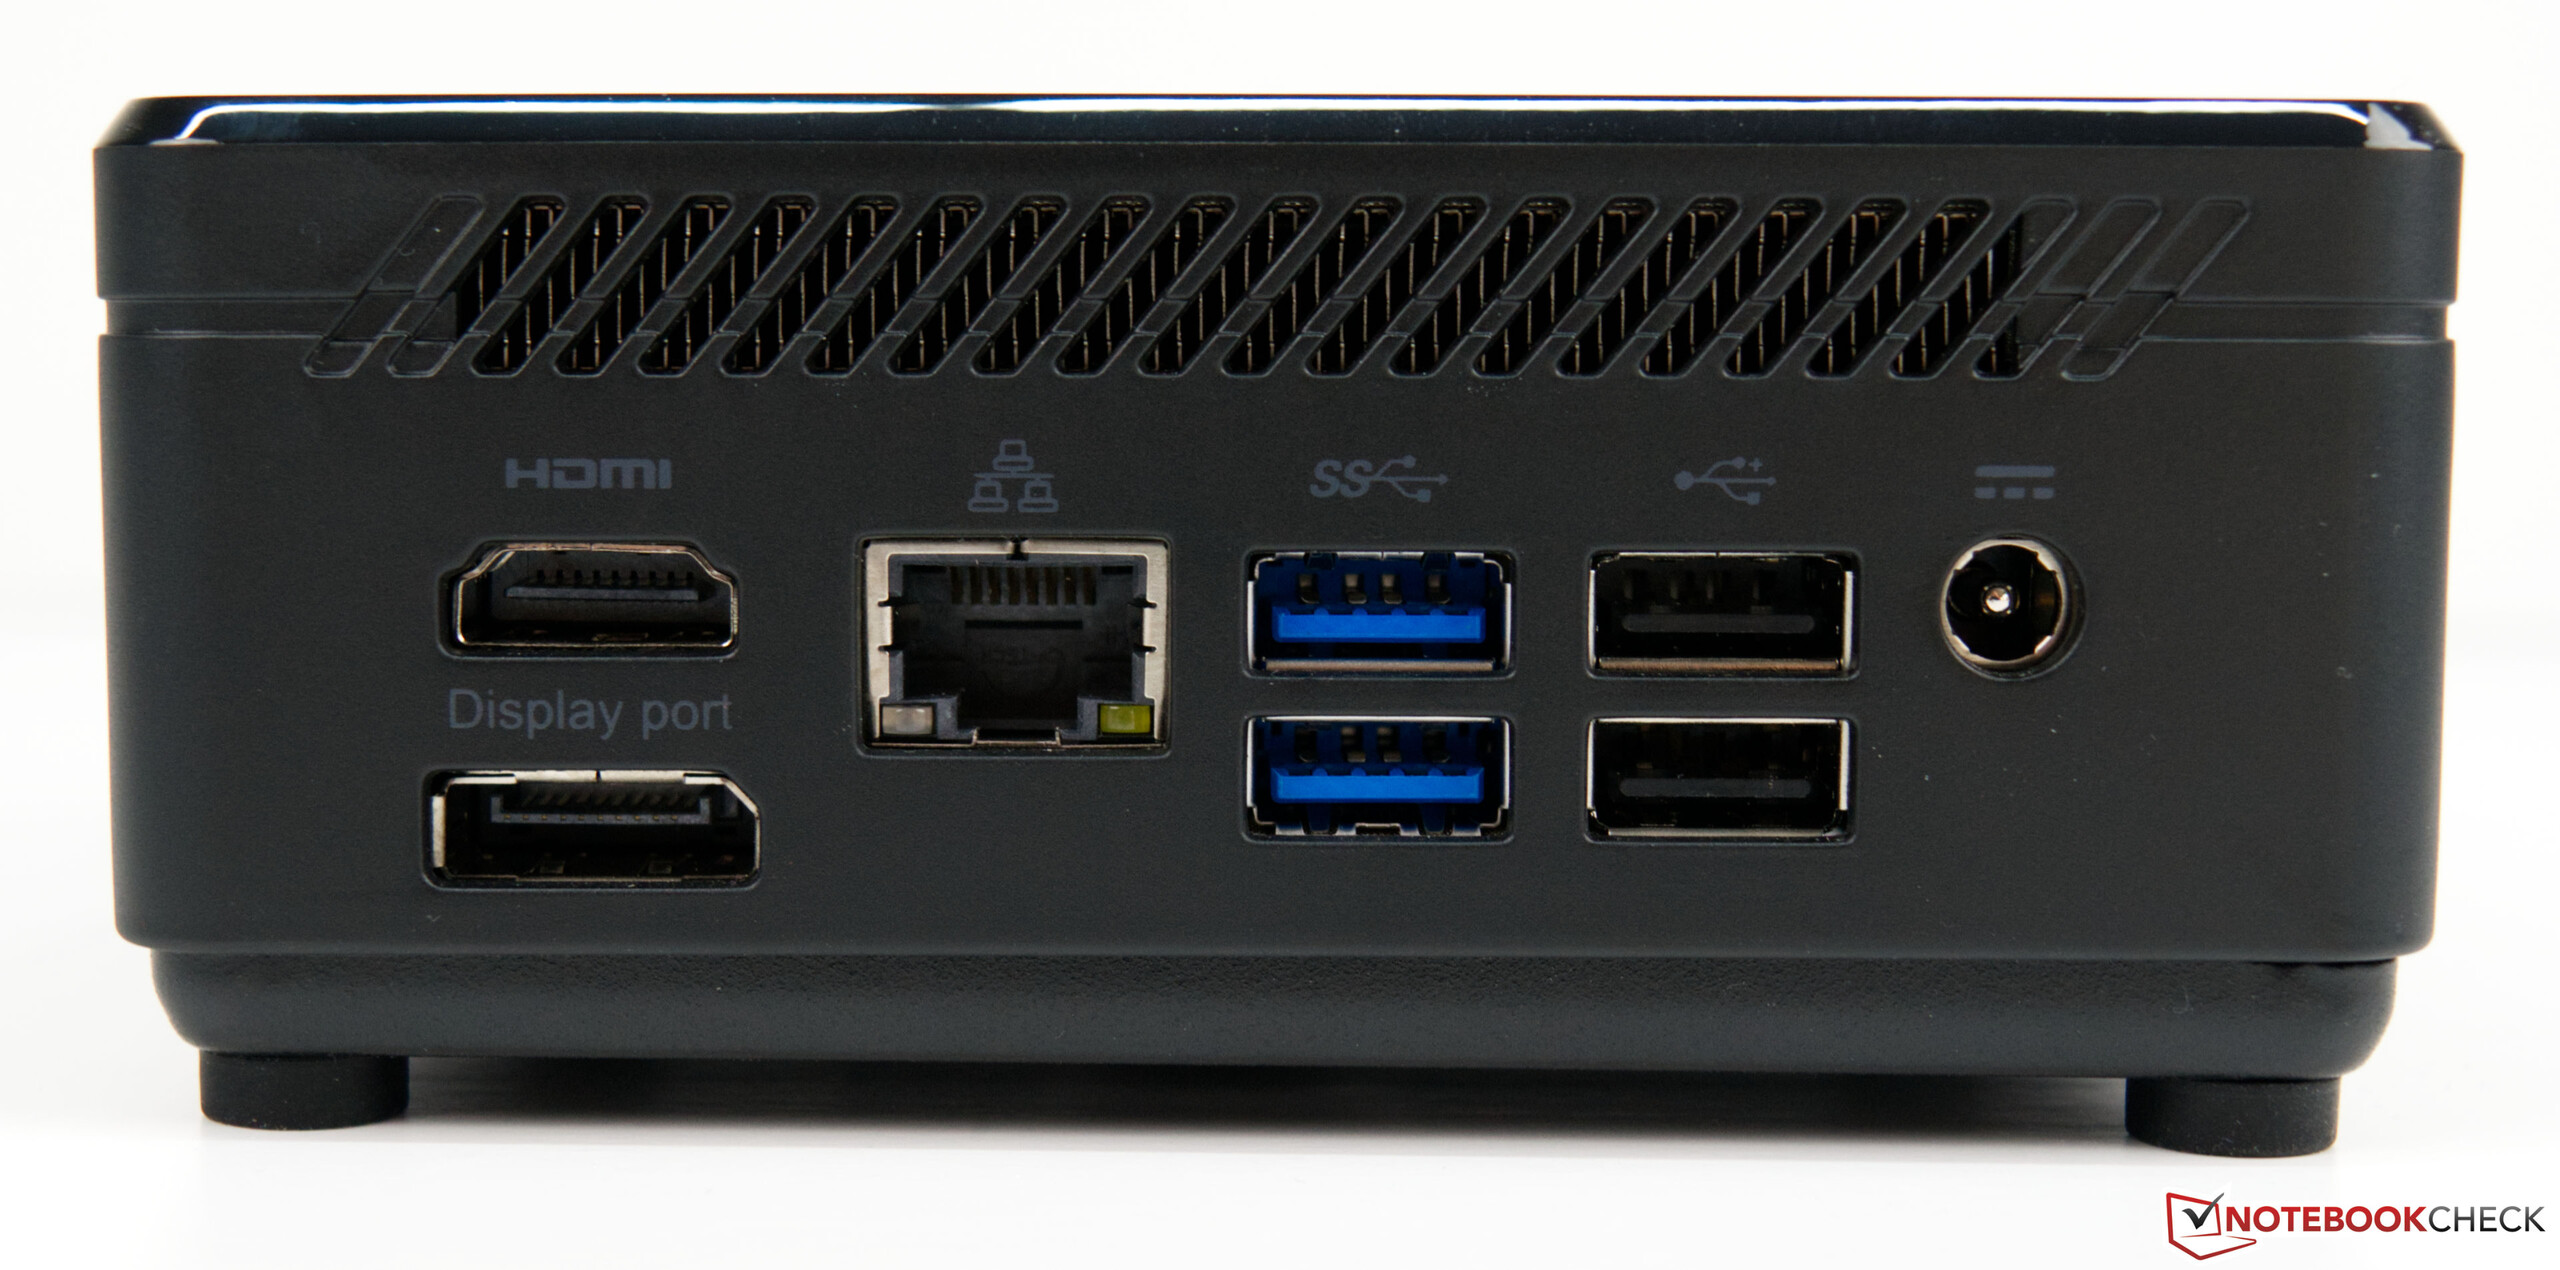
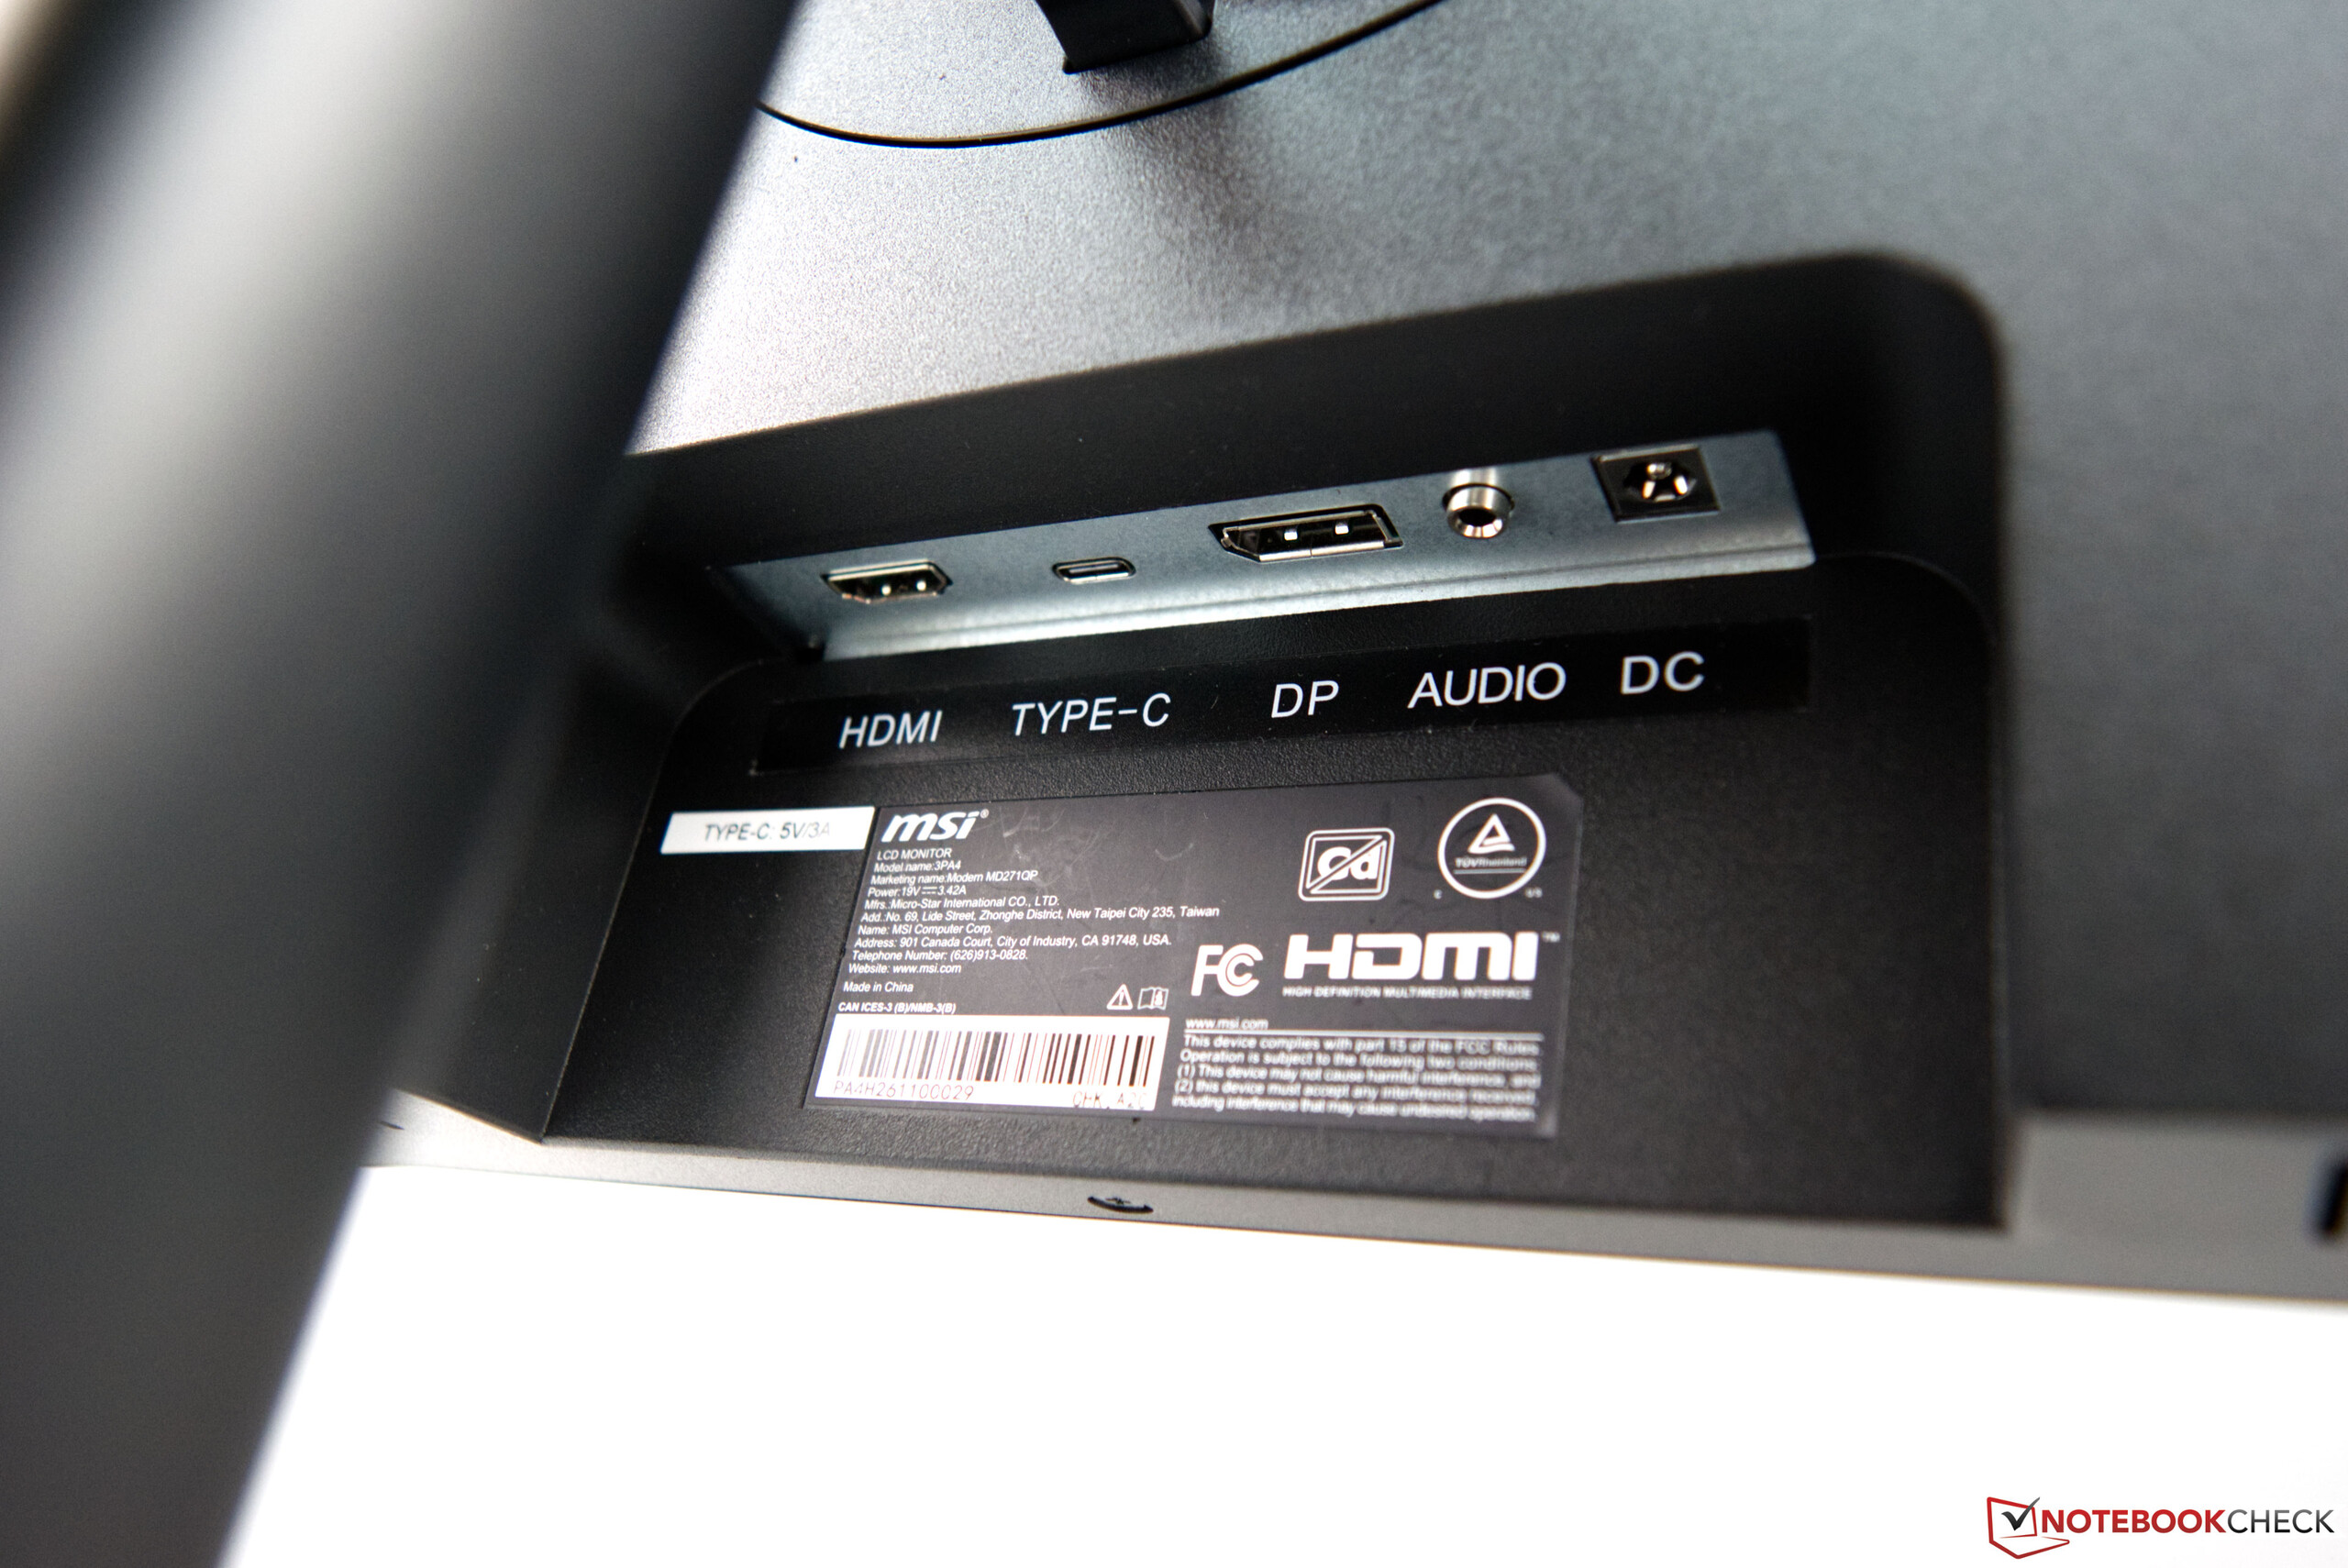
Cubi 5 10M为外部设备提供了足够的选择。总共五个USB-A端口是足够的。不过,前面还有一个TypeC接口。外部屏幕可以通过DisplayPort或HDMI连接。


性能 - 没有太大的改进余地
微星Cubi 5 10M配备了 英特尔酷睿i3-10110U这对于简单的办公应用是相当足够的。其计算能力足以满足日常办公和偶尔上网的需要。然而,如果你经常在同一时间使用许多浏览器标签,安装的4GB DDR4内存可能很快达到极限。这里建议升级到8GB,这可以通过第二个模块快速完成。大多数用户应该能够应付256GB的SSD。由于支持NVMe,该固态硬盘提供了快速的数据传输率,系统很快就可以启动了。
处理器
英特尔酷睿i3-10110U提供两个原生内核,总共有四个线程。该SoC属于英特尔的Comet Lake系列,其基本时钟为2.1 GHz。根据负载情况,该SoC可以在短时间内将Turbo频率提升至4.1 GHz。作为一个双核处理器,英特尔酷睿i3-10110U只提供相对较低的性能,这也反映在基准测试中。与稍大的英特尔酷睿i5-10210U的差距是巨大的,特别是在多核基准测试中。尽管如此,微星Cubi 5 10M中的英特尔酷睿i3-10110U的性能与我们的平均速率基本持平。
| Cinebench R15 | |
| CPU Single 64Bit | |
| Intel NUC10i7FNH, Intel Core i7-10710U | |
| Intel NUC10i5FNK, Intel Core i5-10210U | |
| MSI Cubi 5 10M, Intel Core i3-10110U | |
| Average Intel Core i3-10110U (129 - 172, n=5) | |
| Intel NUC6i5SYH, Intel Core i5-6260U | |
| Intel NUC5i5RYH, Intel Core i5-5250U | |
| Intel NUC5i3RYK, Intel Core i3-5010U | |
| AC6-M Mini-PC, Intel Celeron J4125 | |
| CPU Multi 64Bit | |
| Intel NUC10i7FNH, Intel Core i7-10710U | |
| Intel NUC10i5FNK, Intel Core i5-10210U | |
| Average Intel Core i3-10110U (314 - 405, n=5) | |
| MSI Cubi 5 10M, Intel Core i3-10110U | |
| Intel NUC6i5SYH, Intel Core i5-6260U | |
| Intel NUC5i5RYH, Intel Core i5-5250U | |
| AC6-M Mini-PC, Intel Celeron J4125 | |
| Intel NUC5i3RYK, Intel Core i3-5010U | |
| Intel NUC5i3RYK, Intel Core i3-5010U | |
| Cinebench R11.5 | |
| CPU Single 64Bit | |
| Intel NUC10i7FNH, Intel Core i7-10710U | |
| Intel NUC10i5FNK, Intel Core i5-10210U | |
| MSI Cubi 5 10M, Intel Core i3-10110U | |
| Average Intel Core i3-10110U (n=1) | |
| Intel NUC6i5SYH, Intel Core i5-6260U | |
| Intel NUC5i5RYH, Intel Core i5-5250U | |
| AC6-M Mini-PC, Intel Celeron J4125 | |
| CPU Multi 64Bit | |
| Intel NUC10i7FNH, Intel Core i7-10710U | |
| Intel NUC10i5FNK, Intel Core i5-10210U | |
| MSI Cubi 5 10M, Intel Core i3-10110U | |
| Average Intel Core i3-10110U (n=1) | |
| Intel NUC6i5SYH, Intel Core i5-6260U | |
| AC6-M Mini-PC, Intel Celeron J4125 | |
| Intel NUC5i5RYH, Intel Core i5-5250U | |
| Cinebench R20 | |
| CPU (Single Core) | |
| Intel NUC10i7FNH, Intel Core i7-10710U | |
| Intel NUC10i5FNK, Intel Core i5-10210U | |
| Average Intel Core i3-10110U (400 - 405, n=3) | |
| MSI Cubi 5 10M, Intel Core i3-10110U | |
| Intel NUC5i3RYK, Intel Core i3-5010U | |
| AC6-M Mini-PC, Intel Celeron J4125 | |
| CPU (Multi Core) | |
| Intel NUC10i7FNH, Intel Core i7-10710U | |
| Intel NUC10i5FNK, Intel Core i5-10210U | |
| Average Intel Core i3-10110U (743 - 928, n=3) | |
| MSI Cubi 5 10M, Intel Core i3-10110U | |
| AC6-M Mini-PC, Intel Celeron J4125 | |
| Intel NUC5i3RYK, Intel Core i3-5010U | |
| Blender - v2.79 BMW27 CPU | |
| AC6-M Mini-PC, Intel Celeron J4125 | |
| Average Intel Core i3-10110U (1174 - 1385, n=2) | |
| Intel NUC10i5FNK, Intel Core i5-10210U | |
| Intel NUC10i7FNH, Intel Core i7-10710U | |
| wPrime 2.10 | |
| 1024m | |
| Intel NUC5i3RYK, Intel Core i3-5010U | |
| Intel NUC5i5RYH, Intel Core i5-5250U | |
| AC6-M Mini-PC, Intel Celeron J4125 | |
| Intel NUC6i5SYH, Intel Core i5-6260U | |
| MSI Cubi 5 10M, Intel Core i3-10110U | |
| Average Intel Core i3-10110U (523 - 543, n=2) | |
| Intel NUC10i5FNK, Intel Core i5-10210U | |
| Intel NUC10i7FNH, Intel Core i7-10710U | |
| 32m | |
| Intel NUC5i3RYK, Intel Core i3-5010U | |
| Intel NUC5i5RYH, Intel Core i5-5250U | |
| Intel NUC6i5SYH, Intel Core i5-6260U | |
| MSI Cubi 5 10M, Intel Core i3-10110U | |
| AC6-M Mini-PC, Intel Celeron J4125 | |
| Average Intel Core i3-10110U (13.9 - 17.6, n=2) | |
| Intel NUC10i5FNK, Intel Core i5-10210U | |
| Intel NUC10i7FNH, Intel Core i7-10710U | |
| X264 HD Benchmark 4.0 | |
| Pass 2 | |
| Intel NUC10i7FNH, Intel Core i7-10710U | |
| Intel NUC10i5FNK, Intel Core i5-10210U | |
| Average Intel Core i3-10110U (20.6 - 20.7, n=2) | |
| MSI Cubi 5 10M, Intel Core i3-10110U | |
| Intel NUC6i5SYH, Intel Core i5-6260U | |
| AC6-M Mini-PC, Intel Celeron J4125 | |
| Intel NUC5i5RYH, Intel Core i5-5250U | |
| Intel NUC5i3RYK, Intel Core i3-5010U | |
| Pass 1 | |
| Intel NUC10i7FNH, Intel Core i7-10710U | |
| Intel NUC10i5FNK, Intel Core i5-10210U | |
| Average Intel Core i3-10110U (106.5 - 113.6, n=2) | |
| MSI Cubi 5 10M, Intel Core i3-10110U | |
| Intel NUC6i5SYH, Intel Core i5-6260U | |
| Intel NUC5i5RYH, Intel Core i5-5250U | |
| AC6-M Mini-PC, Intel Celeron J4125 | |
| Intel NUC5i3RYK, Intel Core i3-5010U | |
| TrueCrypt | |
| Serpent Mean 100MB | |
| Intel NUC10i7FNH, Intel Core i7-10710U | |
| Intel NUC10i5FNK, Intel Core i5-10210U | |
| Average Intel Core i3-10110U (0.21 - 0.23, n=2) | |
| MSI Cubi 5 10M, Intel Core i3-10110U | |
| AC6-M Mini-PC, Intel Celeron J4125 | |
| Intel NUC6i5SYH, Intel Core i5-6260U | |
| Intel NUC5i5RYH, Intel Core i5-5250U | |
| Intel NUC5i3RYK, Intel Core i3-5010U | |
| Twofish Mean 100MB | |
| Intel NUC10i7FNH, Intel Core i7-10710U | |
| Intel NUC10i5FNK, Intel Core i5-10210U | |
| Average Intel Core i3-10110U (0.346 - 0.394, n=2) | |
| MSI Cubi 5 10M, Intel Core i3-10110U | |
| Intel NUC6i5SYH, Intel Core i5-6260U | |
| AC6-M Mini-PC, Intel Celeron J4125 | |
| Intel NUC5i5RYH, Intel Core i5-5250U | |
| Intel NUC5i3RYK, Intel Core i3-5010U | |
| AES Mean 100MB | |
| Intel NUC10i5FNK, Intel Core i5-10210U | |
| Intel NUC10i7FNH, Intel Core i7-10710U | |
| Average Intel Core i3-10110U (1.9 - 2.2, n=2) | |
| AC6-M Mini-PC, Intel Celeron J4125 | |
| MSI Cubi 5 10M, Intel Core i3-10110U | |
| Intel NUC6i5SYH, Intel Core i5-6260U | |
| Intel NUC5i5RYH, Intel Core i5-5250U | |
| Intel NUC5i3RYK, Intel Core i3-5010U | |
| Geekbench 4.4 | |
| 64 Bit Multi-Core Score | |
| Intel NUC10i7FNH, Intel Core i7-10710U | |
| Intel NUC10i5FNK, Intel Core i5-10210U | |
| Average Intel Core i3-10110U (n=1) | |
| AC6-M Mini-PC, Intel Celeron J4125 | |
| Intel NUC5i3RYK, Intel Core i3-5010U | |
| 64 Bit Single-Core Score | |
| Intel NUC10i7FNH, Intel Core i7-10710U | |
| Average Intel Core i3-10110U (n=1) | |
| Intel NUC10i5FNK, Intel Core i5-10210U | |
| Intel NUC5i3RYK, Intel Core i3-5010U | |
| AC6-M Mini-PC, Intel Celeron J4125 | |
| HWBOT x265 Benchmark v2.2 - 4k Preset | |
| Intel NUC10i7FNH, Intel Core i7-10710U | |
| Intel NUC10i5FNK, Intel Core i5-10210U | |
| Average Intel Core i3-10110U (2.72 - 3.12, n=2) | |
| AC6-M Mini-PC, Intel Celeron J4125 | |
| Intel NUC5i3RYK, Intel Core i3-5010U | |
* ... smaller is better
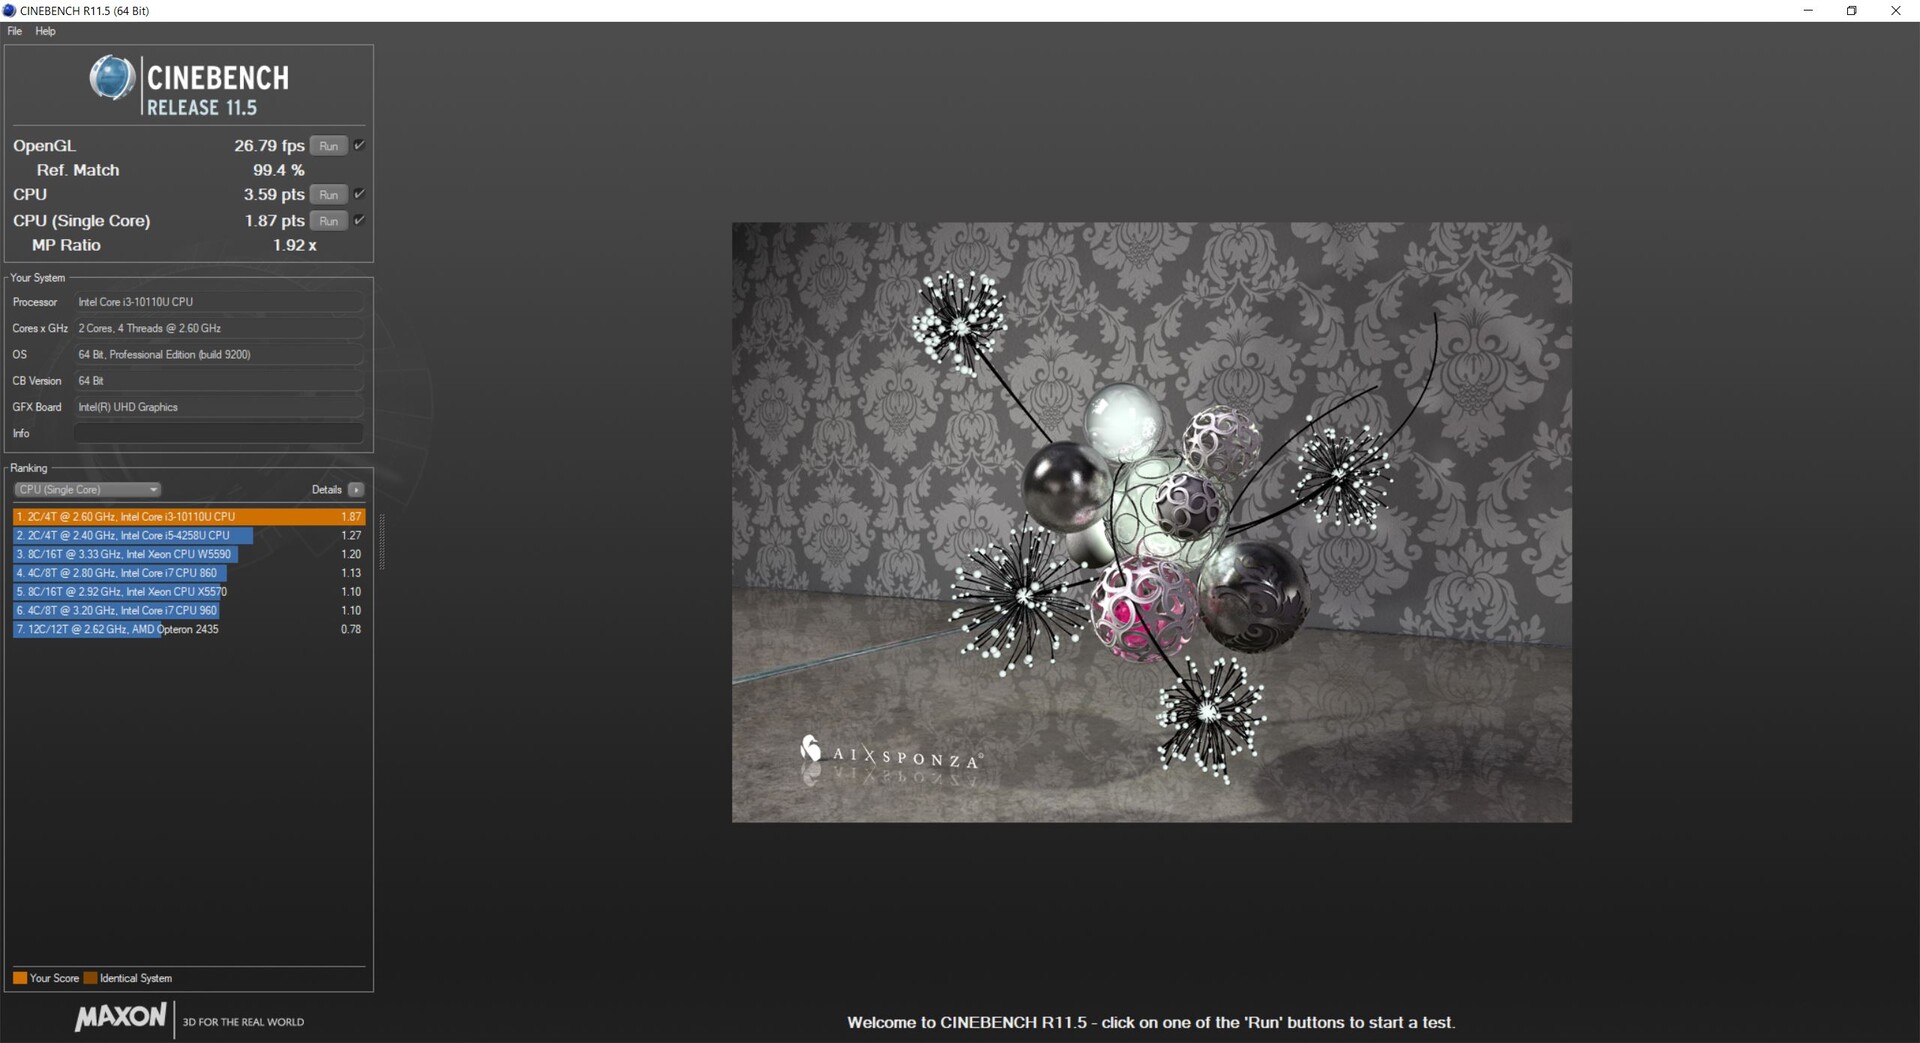
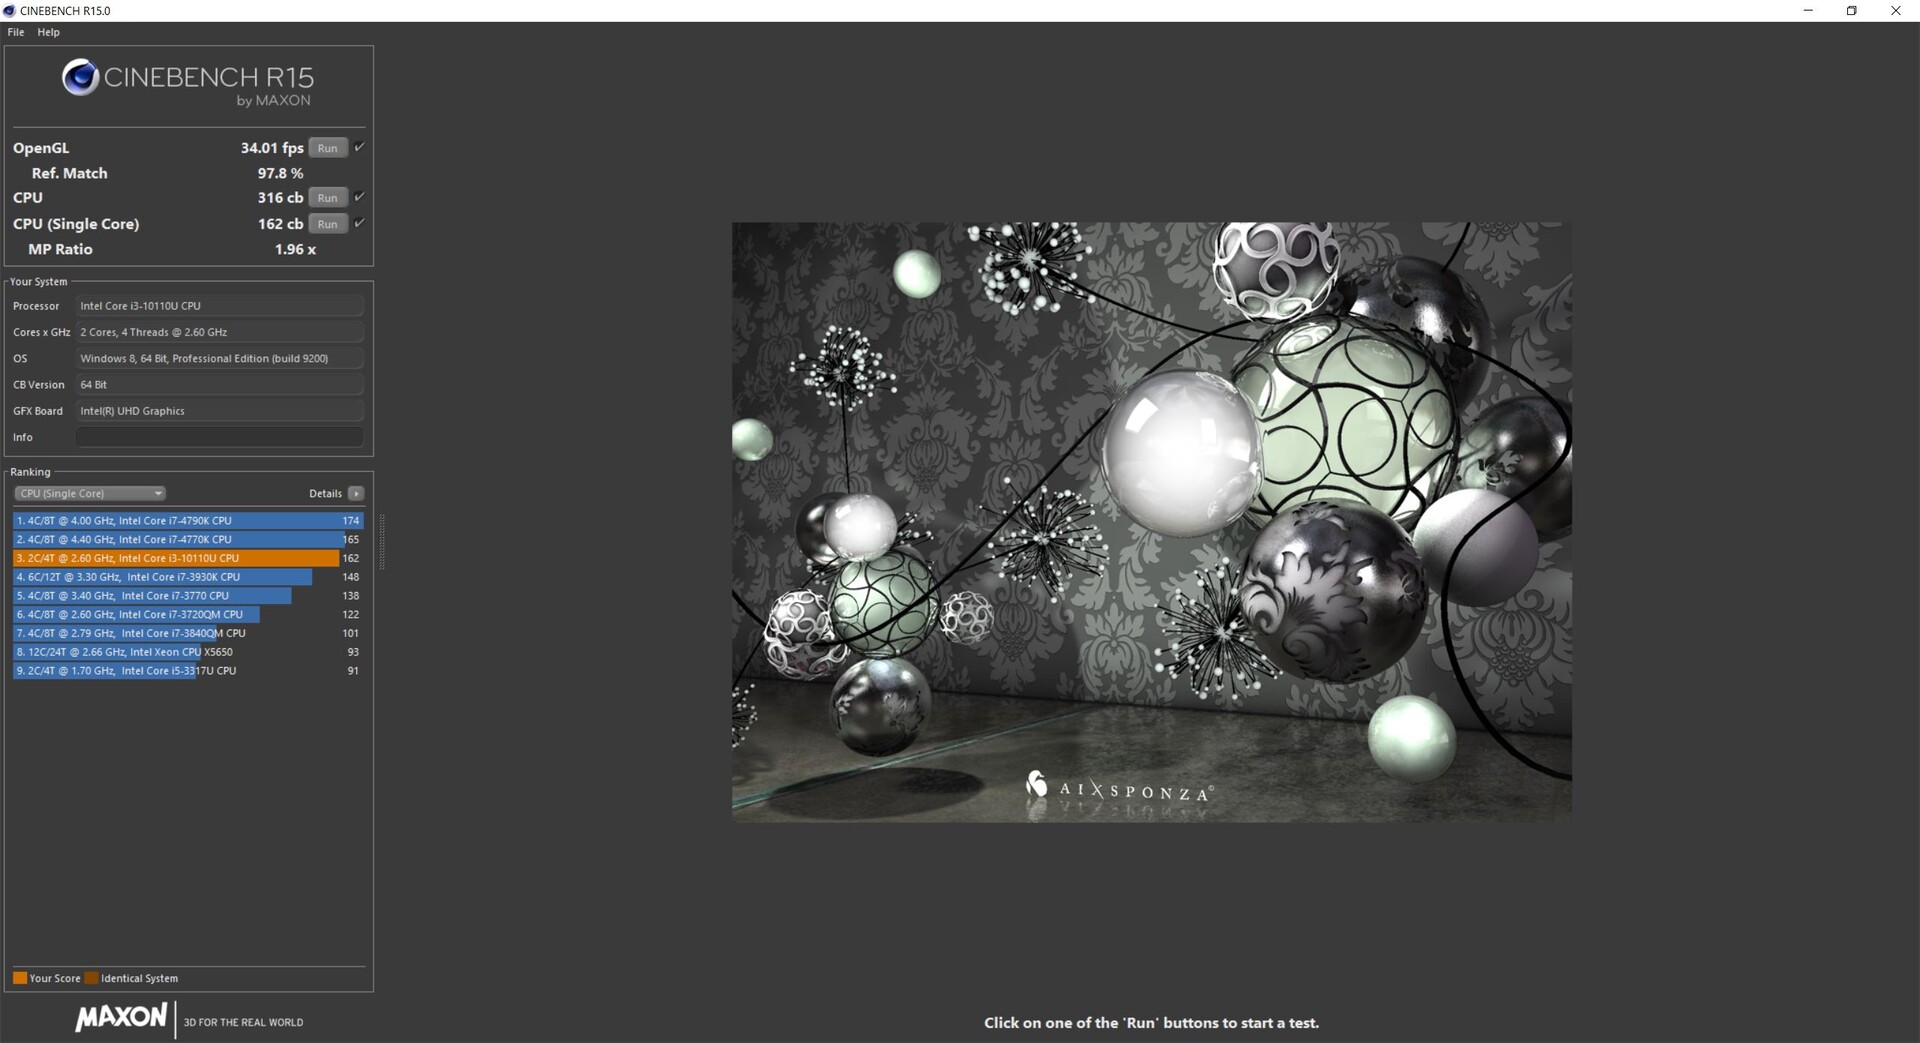
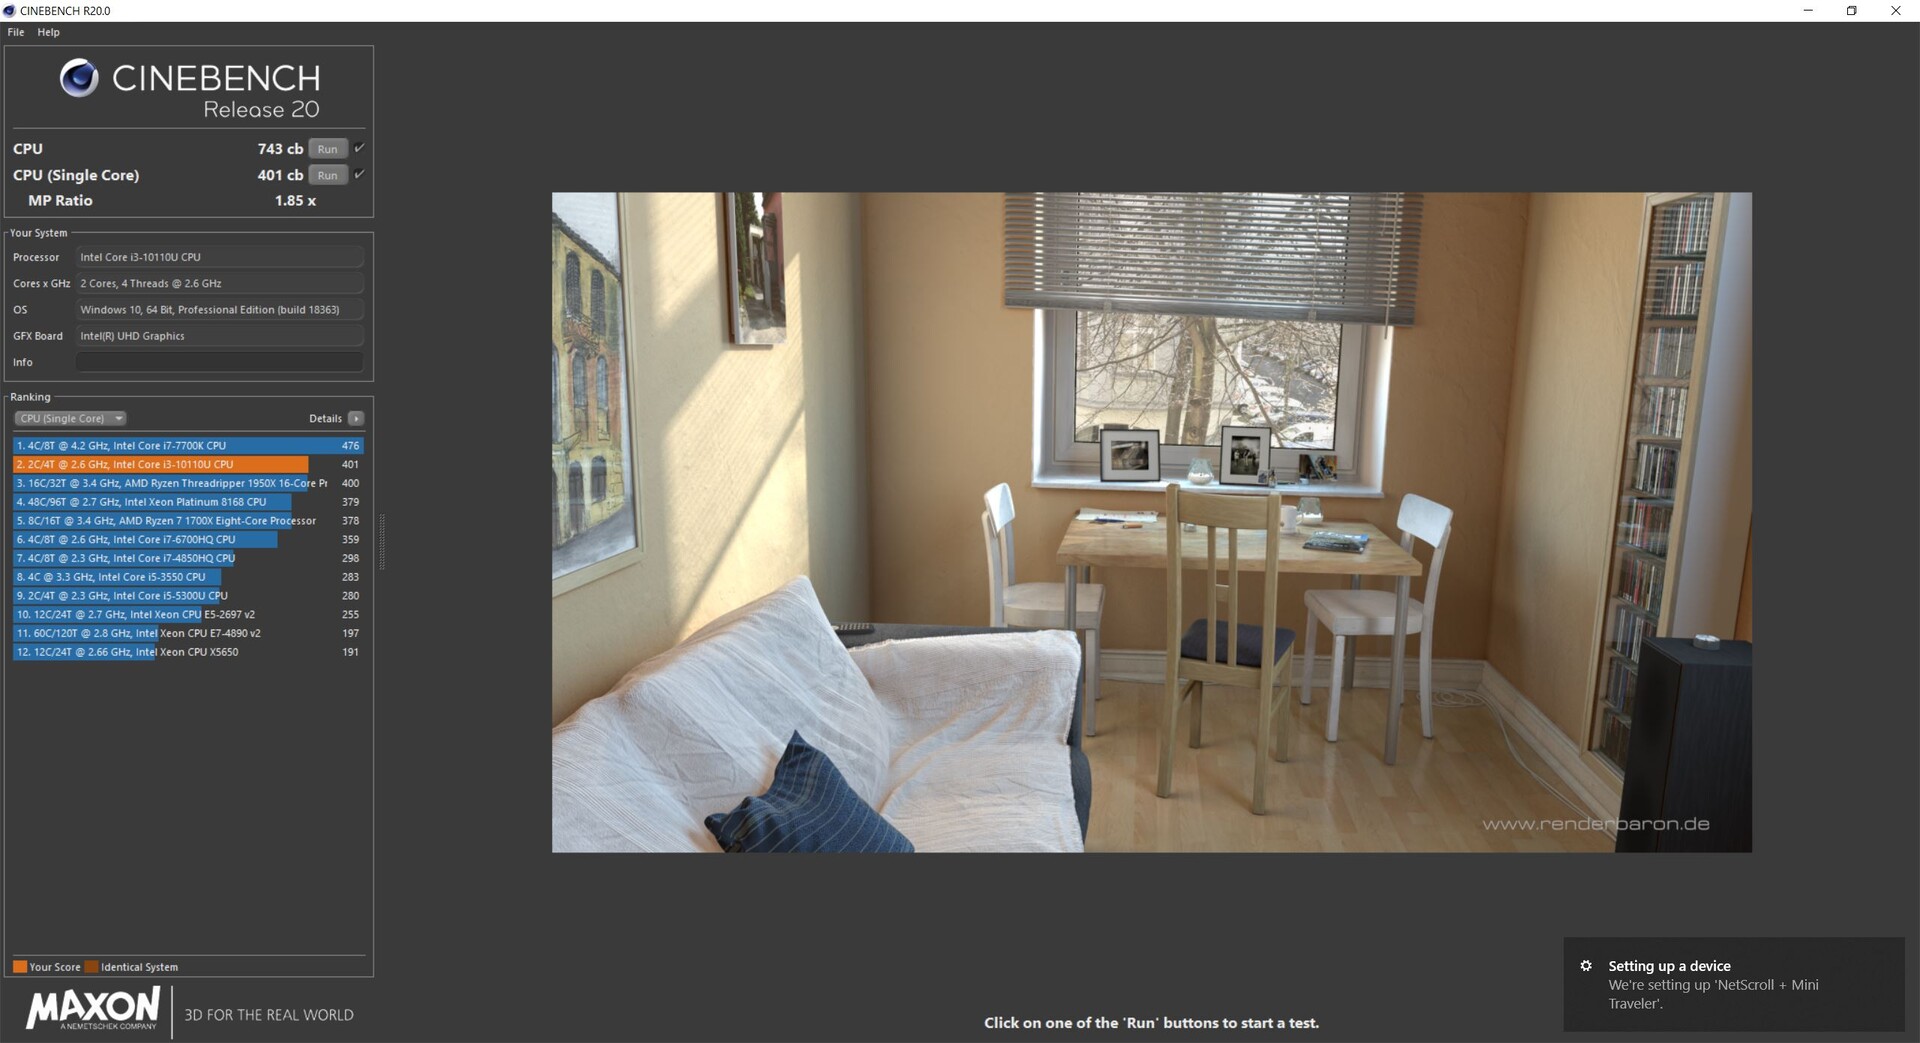
Cinebench R15多循环
在使用Cinebench R15多循环的负载测试中,Cubi 5 10M可以很好地控制英特尔酷睿i3-10110U。即使在持续负载后,冷却系统也没有过载。
系统性能
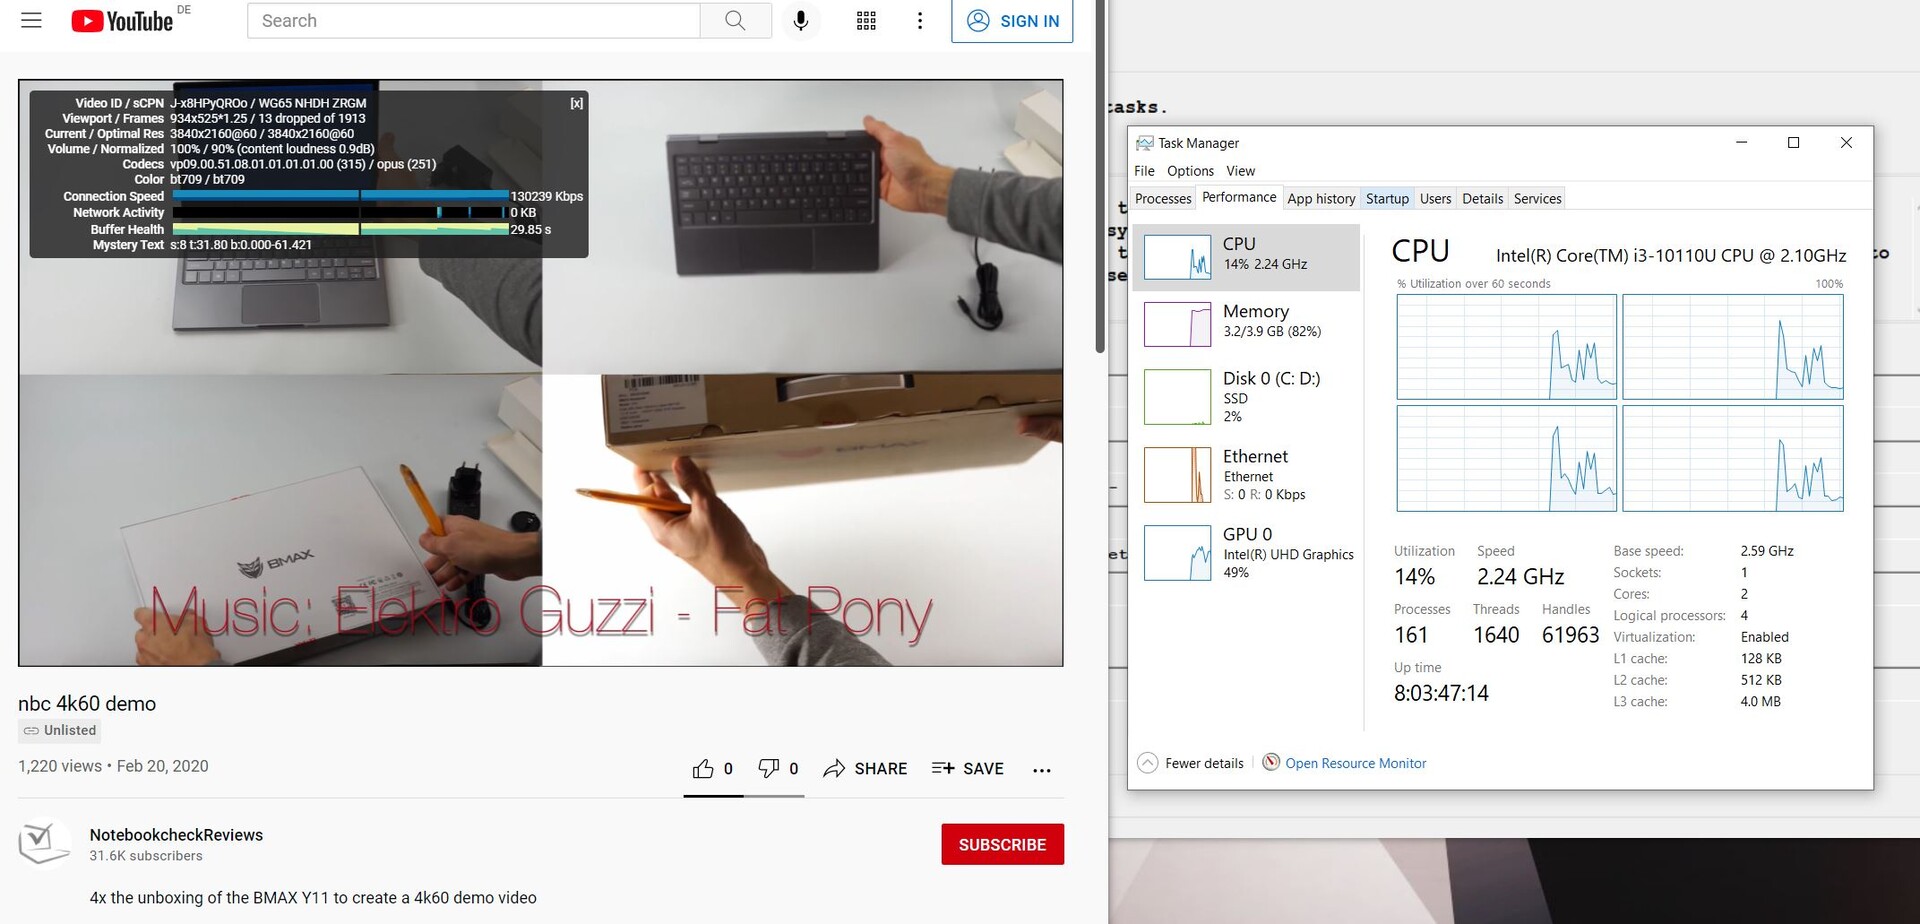
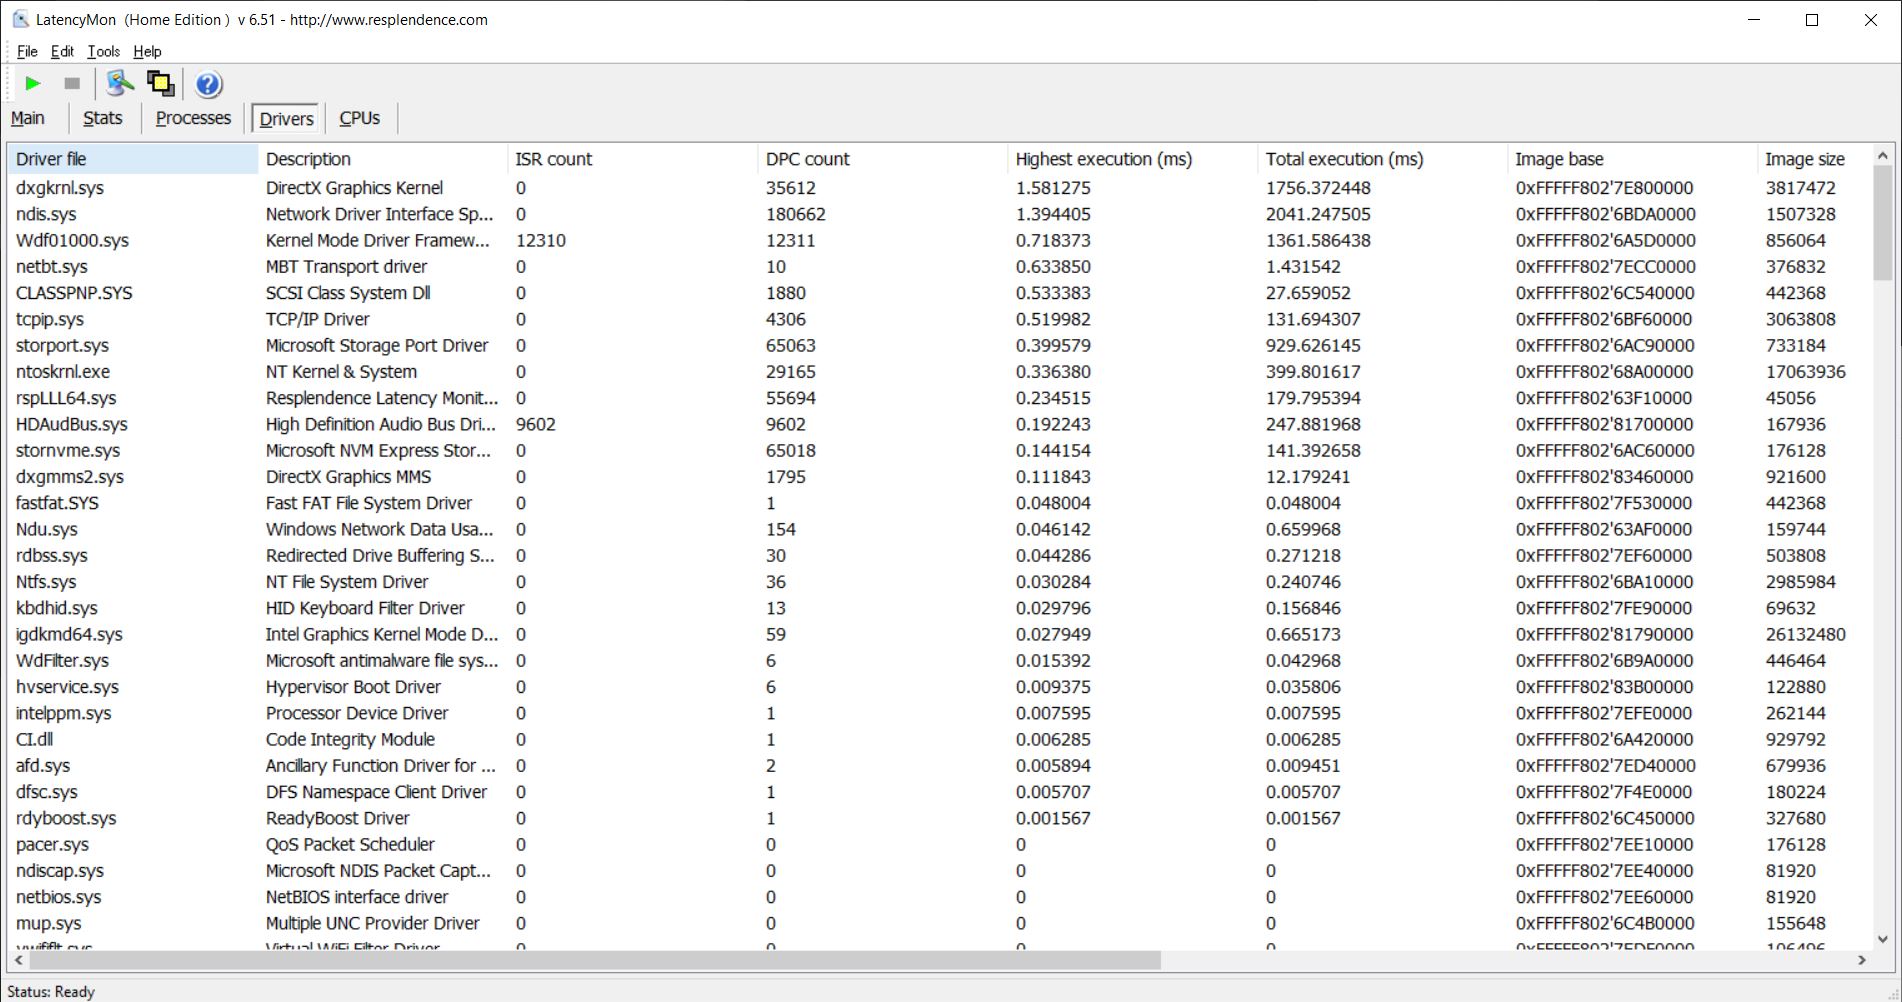
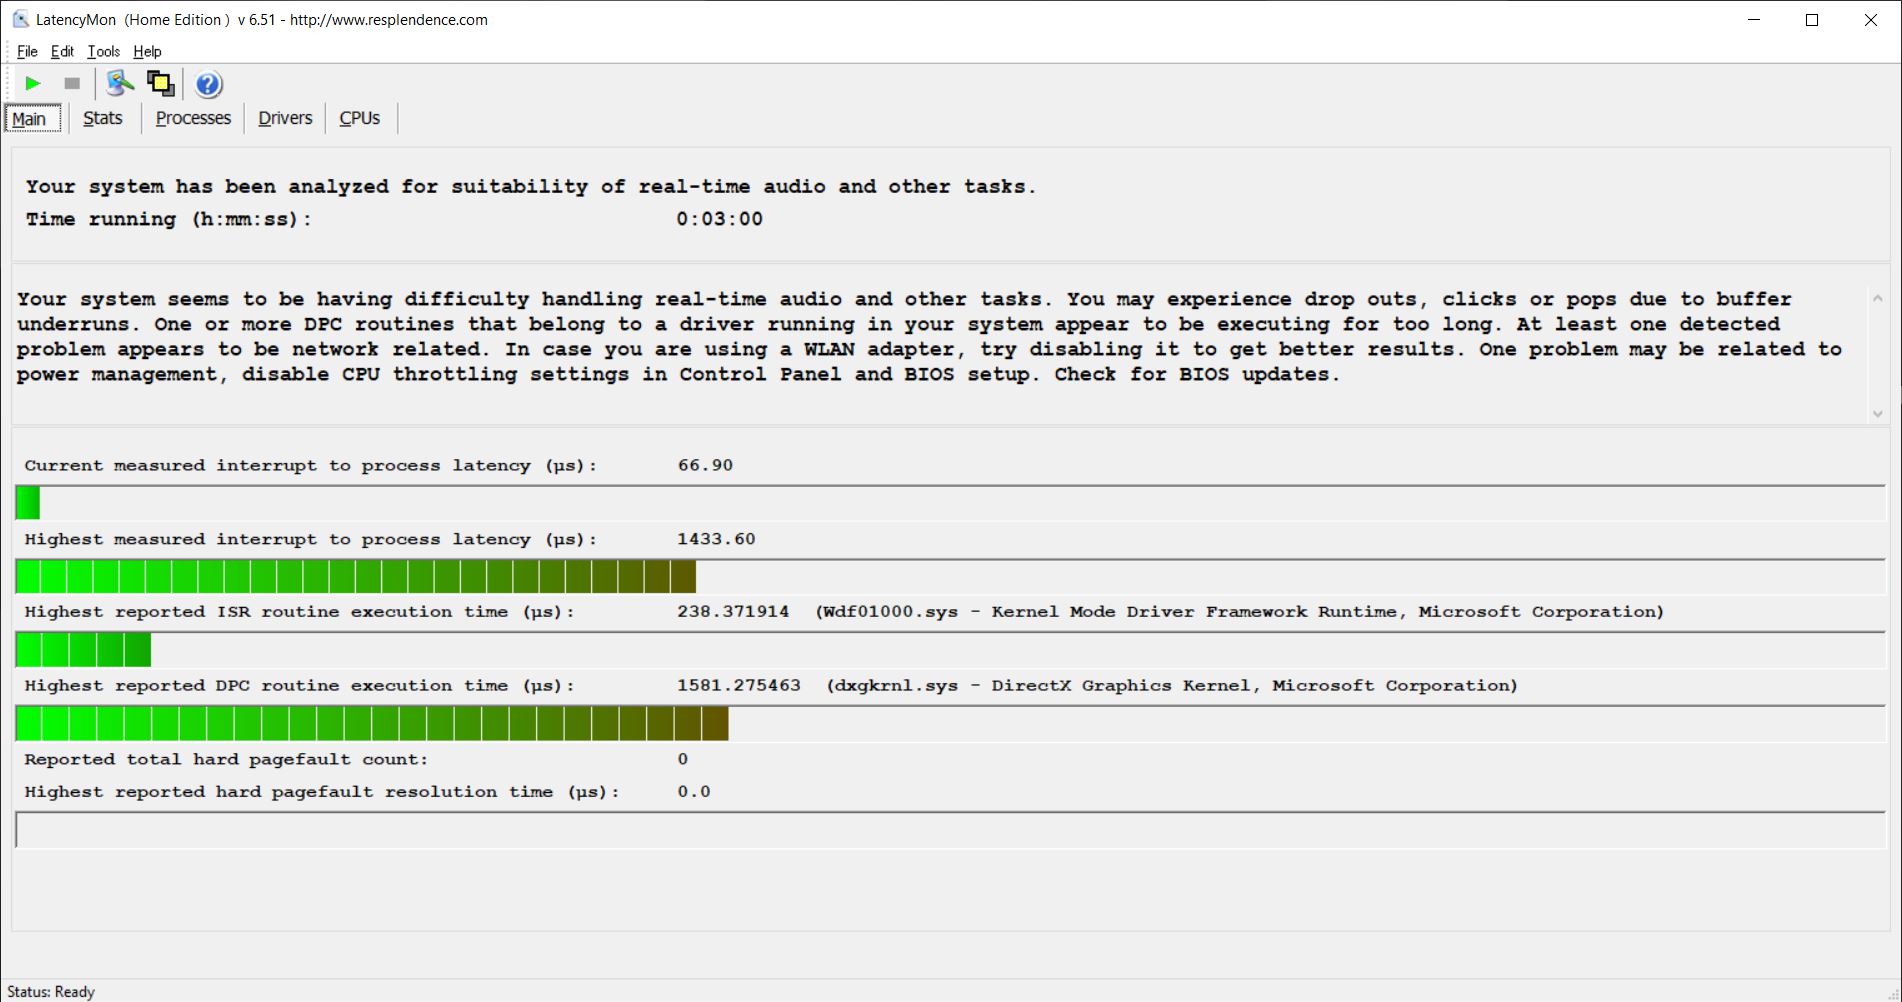
系统性能的合成基准测试清楚地显示了双核CPU的劣势。i3-10110U不再能跟上原生4核的步伐,不得不以明显的差距排在它们后面。与我们数据库中的平均性能的差距也是惊人的。我们怀疑这其中的原因是工作内存紧张。微星Cubi 5 10M在负载下和播放4K视频材料时的测量延迟方面表现令人惊讶。我们曾假设这里的延迟会高得多。Cubi 5 10M显然在与英特尔NUC的比较中获胜。然而,播放高分辨率的视频材料对迷你PC的性能要求很高。应该给SoC几秒钟的缓冲时间。在这之后,就可以顺利播放了。
| PCMark 10 | |
| Score | |
| Intel NUC10i7FNH, Intel Core i7-10710U | |
| Intel NUC10i5FNK, Intel Core i5-10210U | |
| Average Intel Core i3-10110U (2958 - 3542, n=3) | |
| MSI Cubi 5 10M, Intel Core i3-10110U | |
| Intel NUC5i3RYK, Intel Core i3-5010U | |
| AC6-M Mini-PC, Intel Celeron J4125 | |
| Productivity | |
| Intel NUC10i7FNH, Intel Core i7-10710U | |
| Intel NUC10i5FNK, Intel Core i5-10210U | |
| Average Intel Core i3-10110U (5397 - 6758, n=3) | |
| MSI Cubi 5 10M, Intel Core i3-10110U | |
| Intel NUC5i3RYK, Intel Core i3-5010U | |
| AC6-M Mini-PC, Intel Celeron J4125 | |
| Essentials | |
| Intel NUC10i7FNH, Intel Core i7-10710U | |
| Intel NUC10i5FNK, Intel Core i5-10210U | |
| Average Intel Core i3-10110U (6210 - 7583, n=3) | |
| MSI Cubi 5 10M, Intel Core i3-10110U | |
| Intel NUC5i3RYK, Intel Core i3-5010U | |
| AC6-M Mini-PC, Intel Celeron J4125 | |
| Digital Content Creation | |
| Intel NUC10i7FNH, Intel Core i7-10710U | |
| Intel NUC10i5FNK, Intel Core i5-10210U | |
| Average Intel Core i3-10110U (2097 - 2390, n=3) | |
| MSI Cubi 5 10M, Intel Core i3-10110U | |
| Intel NUC5i3RYK, Intel Core i3-5010U | |
| AC6-M Mini-PC, Intel Celeron J4125 | |
| DPC Latencies / LatencyMon - interrupt to process latency (max), Web, Youtube, Prime95 | |
| AC6-M Mini-PC, Intel Celeron J4125 | |
| Average Intel Core i3-10110U (1581 - 5347, n=3) | |
| MSI Cubi 5 10M, Intel Core i3-10110U | |
* ... smaller is better
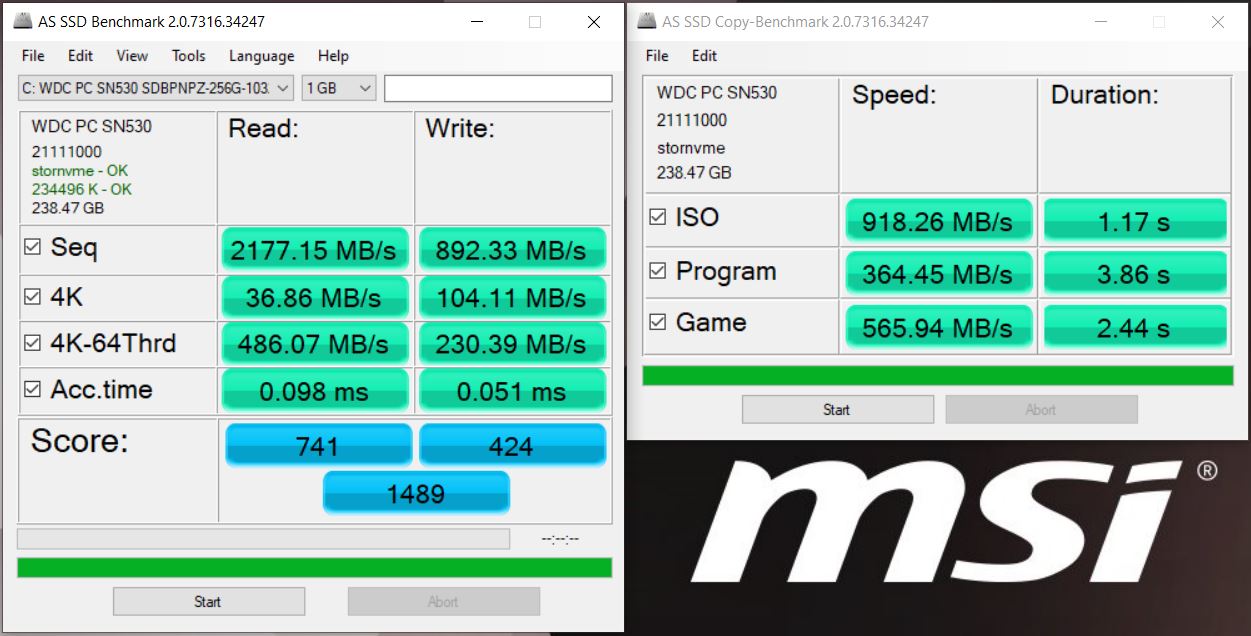
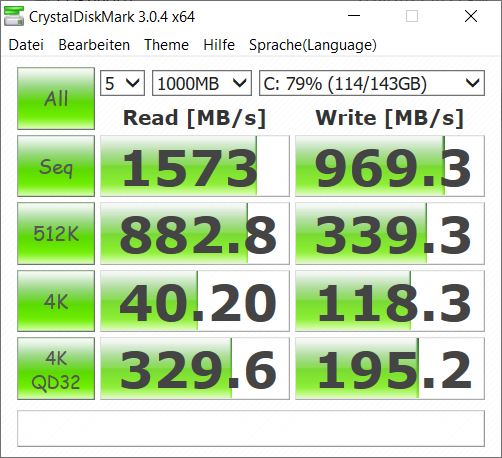
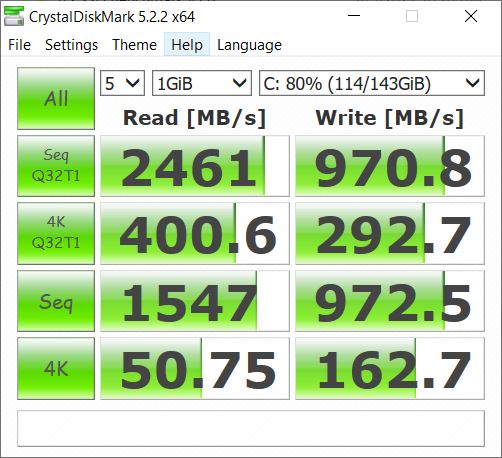
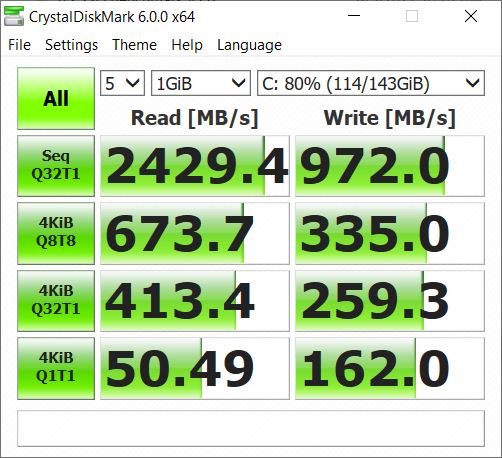
大容量存储
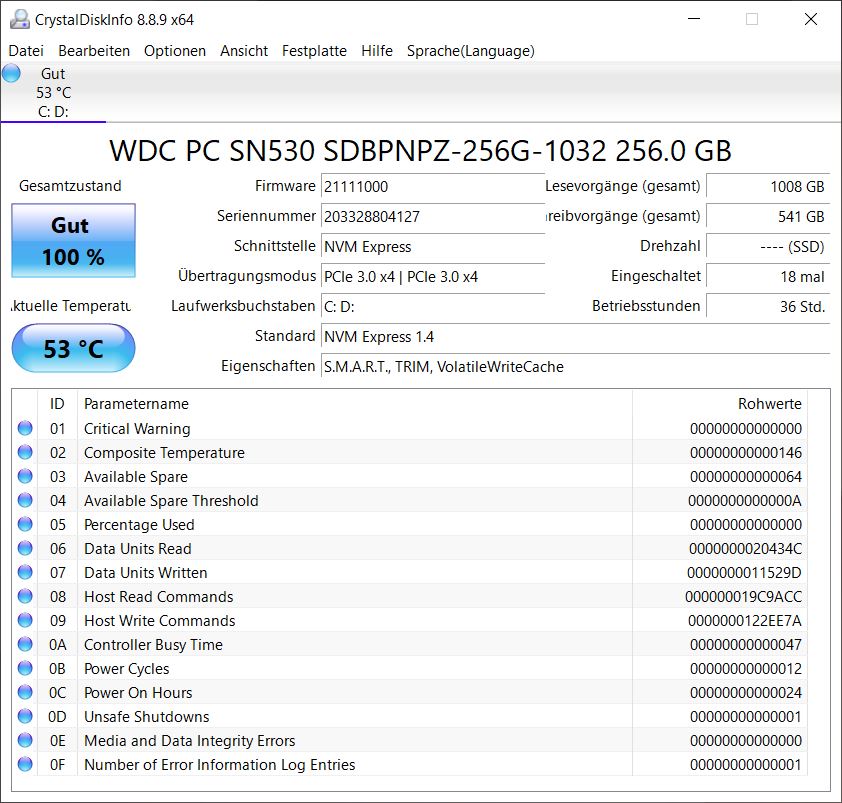
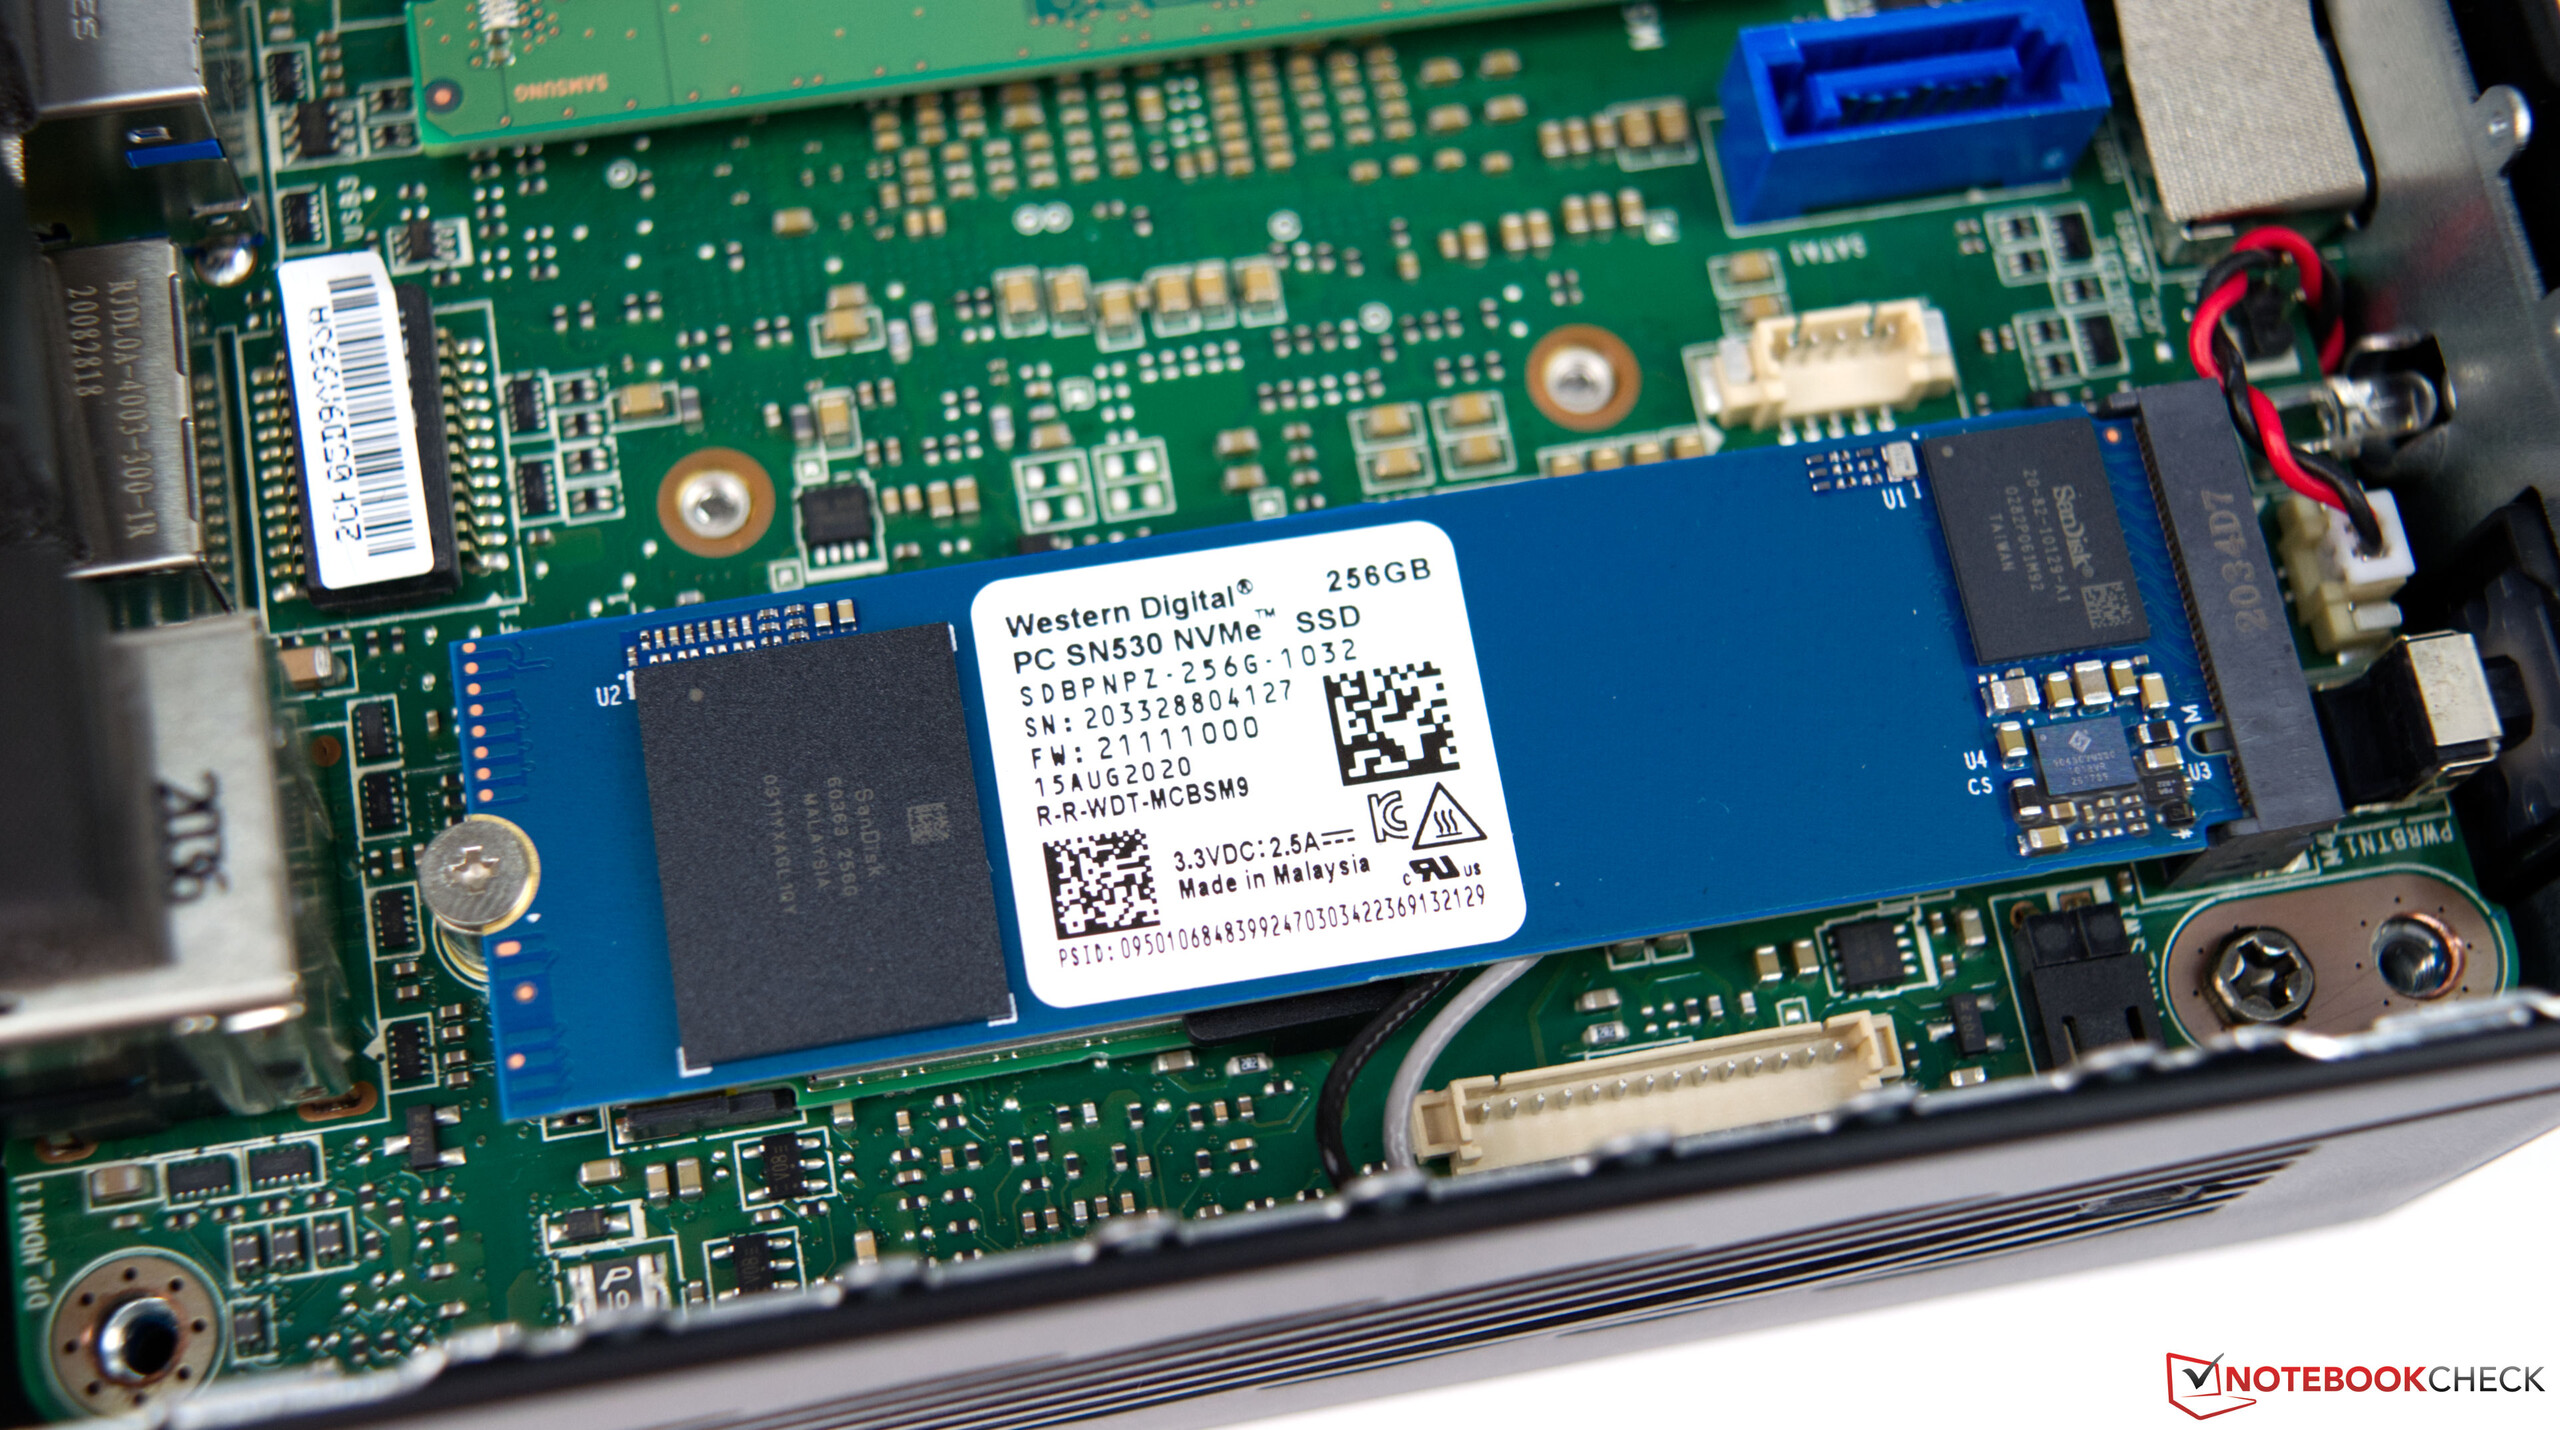
我们的测试系统配备了一个256GB的固态硬盘。这也包含了操作系统,这意味着用户有将近220GB的可用空间。使用的SSD是西数公司的M.2-2280格式的快速NVMe SSD。在测试中,该固态硬盘以非常好的读取率给人留下了深刻的印象,尽管写入率可能会更好一些。底线是,对于一台简单的办公电脑来说,其性能是绰绰有余的。第二个2.5英寸格式的数据介质仍然可以存放在机箱内。所有必要的连接线都包括在交货范围内。
图形卡
的 英特尔UHD Graphics 620是众所周知的。然而,英特尔酷睿i3-10110U只提供24个EU中的23个,这也可以从性能中看出。此外,我们的测试样本只适用于一个RAM模块,这意味着额外的性能会损失。第二个RAM模块仍然可以提供一个小的性能提升。尽管如此,不应期待有什么奇迹发生。然而,微星Cube 5 10M不适合用于游戏。只有非常简单的休闲游戏可以期待办公室的奴隶。
更多关于英特尔UHD Graphics 620的基准测试可以找到这里.
| 3DMark 11 - 1280x720 Performance GPU | |
| Intel NUC6i5SYH, Intel Core i5-6260U | |
| Intel NUC10i7FNH, Intel Core i7-10710U | |
| Intel NUC10i5FNK, Intel Core i5-10210U | |
| Average Intel UHD Graphics 620 (1144 - 3432, n=244) | |
| Intel NUC5i5RYH, Intel Core i5-5250U | |
| MSI Cubi 5 10M, Intel Core i3-10110U | |
| Intel NUC5i3RYK, Intel Core i3-5010U | |
| 3DMark | |
| 1280x720 Ice Storm Standard Graphics | |
| Intel NUC10i7FNH, Intel Core i7-10710U | |
| Average Intel UHD Graphics 620 (13790 - 102010, n=66) | |
| Intel NUC5i5RYH, Intel Core i5-5250U | |
| Intel NUC10i5FNK, Intel Core i5-10210U | |
| MSI Cubi 5 10M, Intel Core i3-10110U | |
| 1920x1080 Ice Storm Extreme Graphics | |
| Intel NUC10i7FNH, Intel Core i7-10710U | |
| Average Intel UHD Graphics 620 (26409 - 59483, n=71) | |
| Intel NUC5i3RYK, Intel Core i3-5010U | |
| Intel NUC10i5FNK, Intel Core i5-10210U | |
| MSI Cubi 5 10M, Intel Core i3-10110U | |
| 1920x1080 Fire Strike Graphics | |
| Intel NUC6i5SYH, Intel Core i5-6260U | |
| Intel NUC10i7FNH, Intel Core i7-10710U | |
| Intel NUC10i5FNK, Intel Core i5-10210U | |
| Average Intel UHD Graphics 620 (557 - 2608, n=213) | |
| Intel NUC5i5RYH, Intel Core i5-5250U | |
| MSI Cubi 5 10M, Intel Core i3-10110U | |
| Intel NUC5i3RYK, Intel Core i3-5010U | |
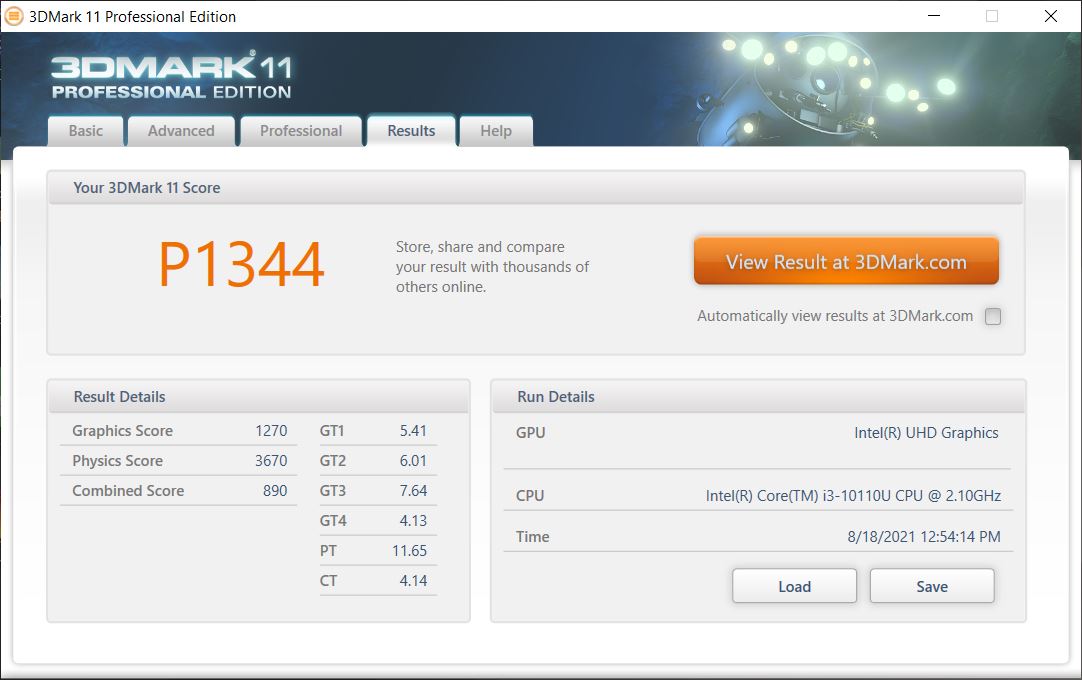
| 3DMark 11 Performance | 1395 points | |
| 3DMark Ice Storm Standard Score | 39769 points | |
| 3DMark Cloud Gate Standard Score | 5358 points | |
| 3DMark Fire Strike Score | 725 points | |
| 3DMark Fire Strike Extreme Score | 342 points | |
| 3DMark Time Spy Score | 708 points | |
Help | ||
排放与能源
温度
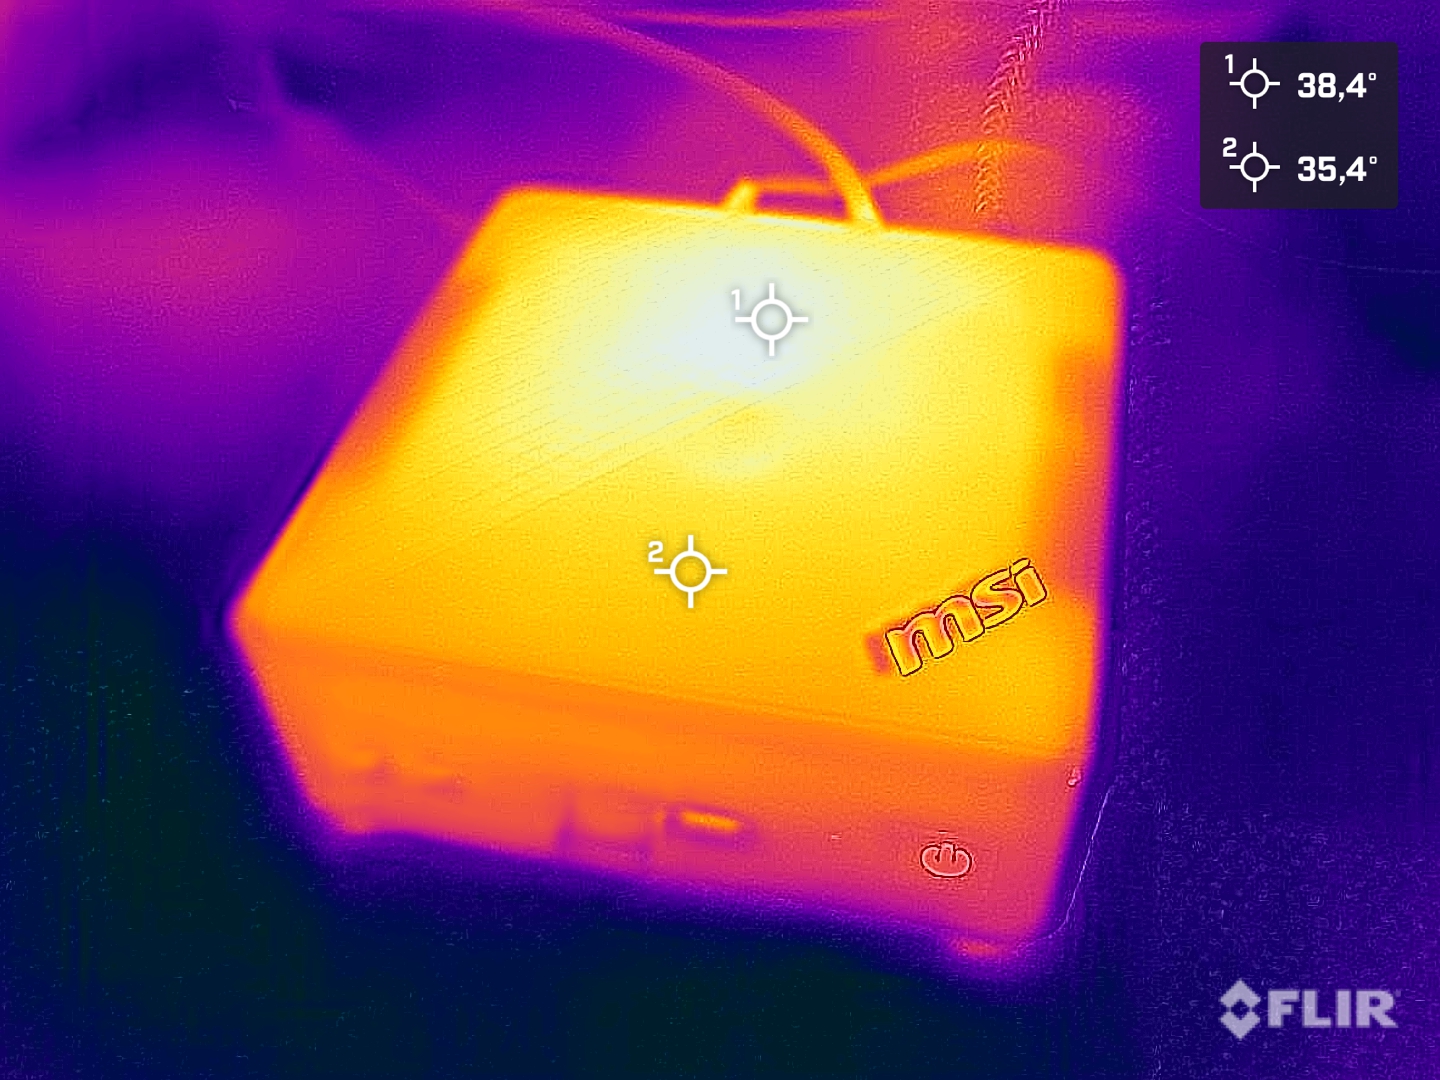
首先,我们可以声明,Cubi 5 10M在安装硬件时没有任何温度问题。外壳只有在负载下才会轻微发热。在Prime95和FurMark的压力测试中,SoC不会变得非常热,最高温度为68℃(154.4°F)。功率限制在这里相当适用,这使SoC的速度稍稍减慢。当CPU和iGPU同时加载时,1.1 GHz的基本时钟无法维持。众所周知,这在Core i3-10110U中是2.1GHz。压力测试并没有对性能产生可持续的影响。3DMark11基准测试的结果与冷启动时相比处于同一水平。我们已经可以在Cinebench R15多循环中确定这一点。在这里,CPU的性能在所有50次运行中也几乎保持不变。
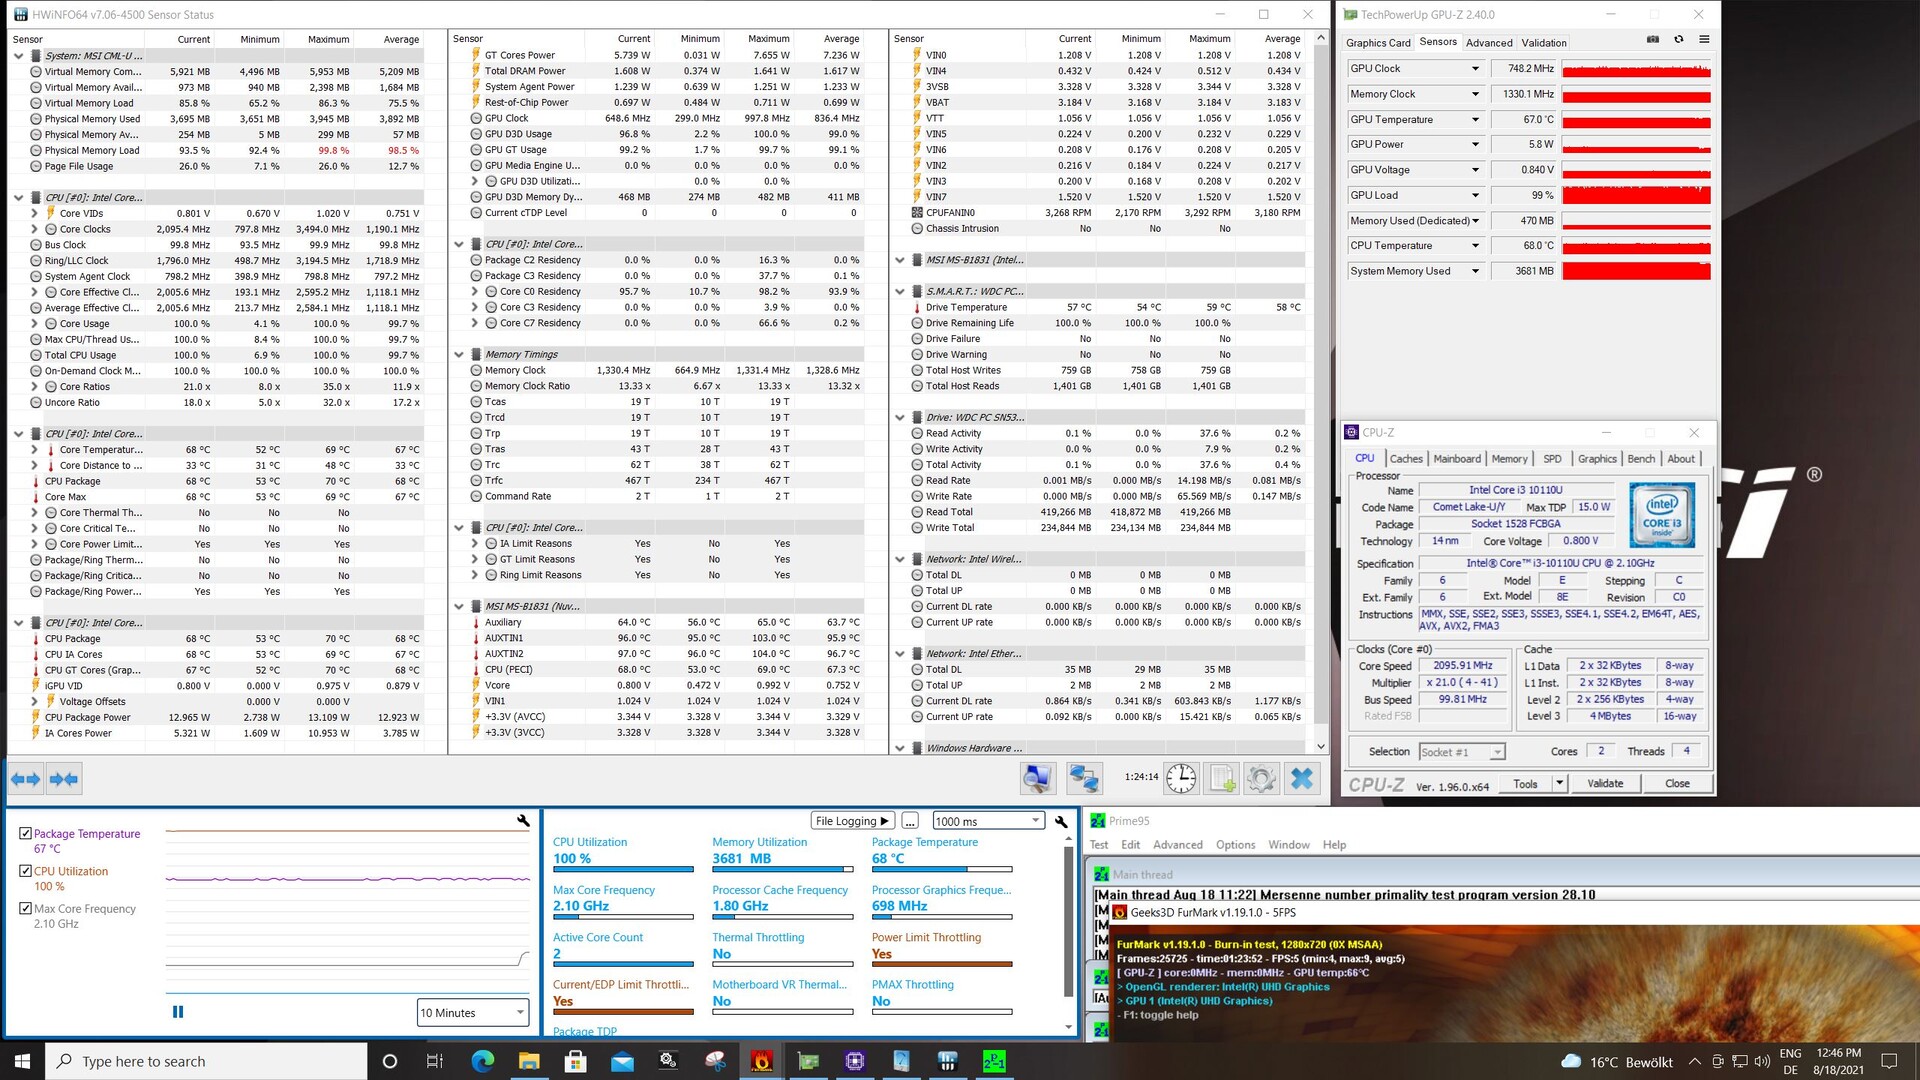
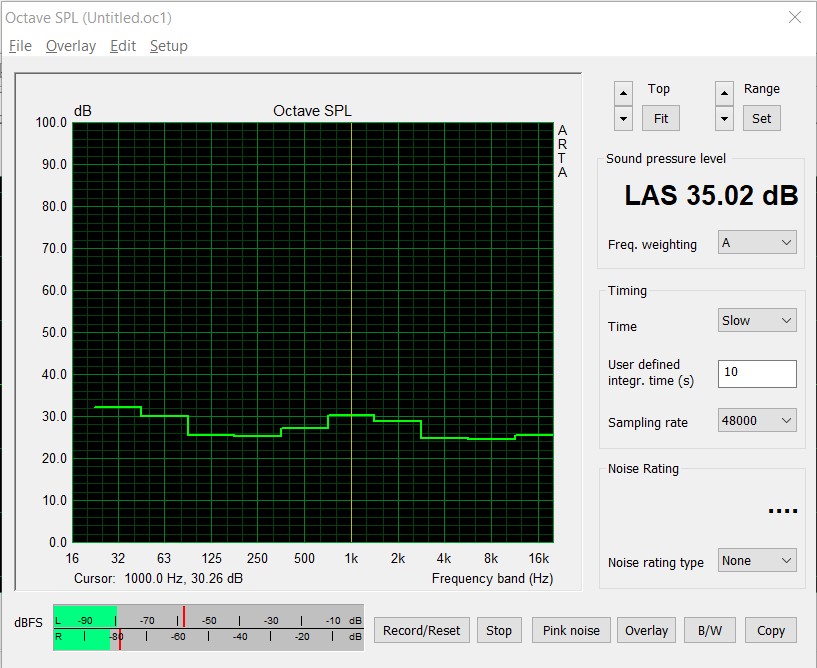
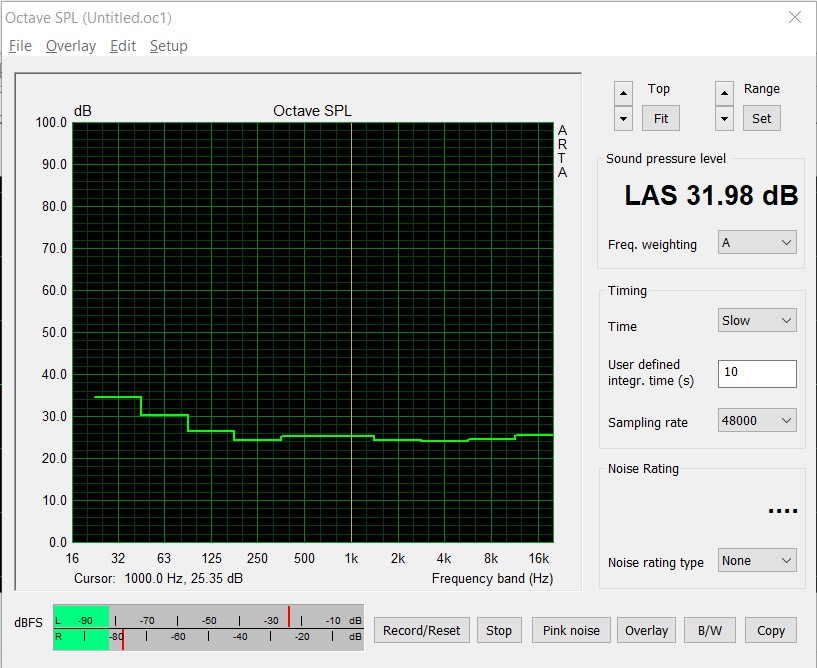
噪声排放
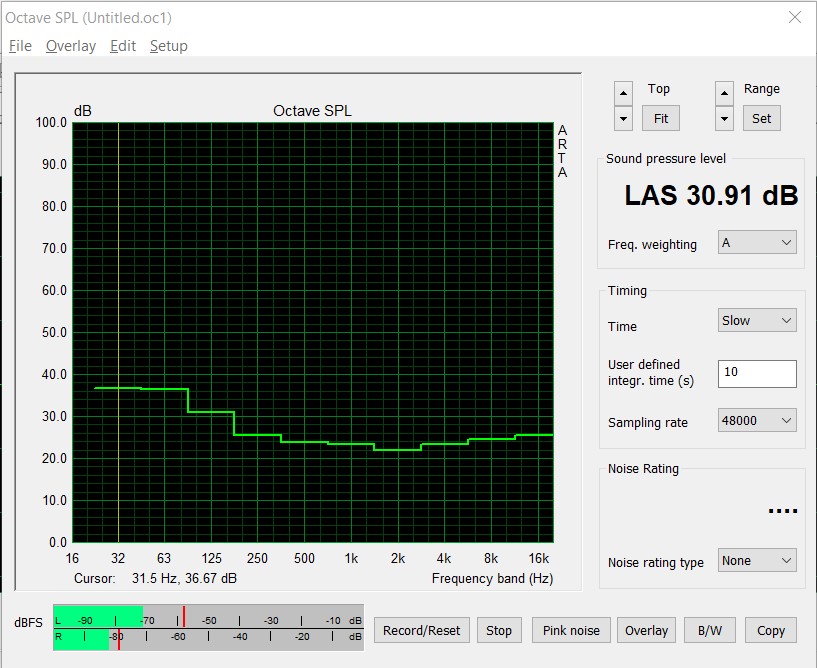
一台办公电脑应该是安静的,高于一切。微星Cubi 5 M10正好可以做到这一点。当空转时,我们测量了30.91 dB(A),这只比在完全安静的房间里(30.5 dB(A))多一点。然而,当我们单独运行Prime95作为压力测试时,明显较高的噪音负荷是明显的。在这里,SoC可以使用其所有的功率,这意味着由于热量的增加,冷却装置也必须更努力地工作。如果同时运行Prime95和FurMark两个应用程序,SoC就不能再使用全部性能,因为CPU和iGPU必须分享15瓦的TDP。在32 dB(A)的情况下,Cubi 5 10M的噪音明显降低,尽管最高35 dB(A)也不被认为是令人讨厌的。风扇是温和的上下调节,不产生任何高频噪音。
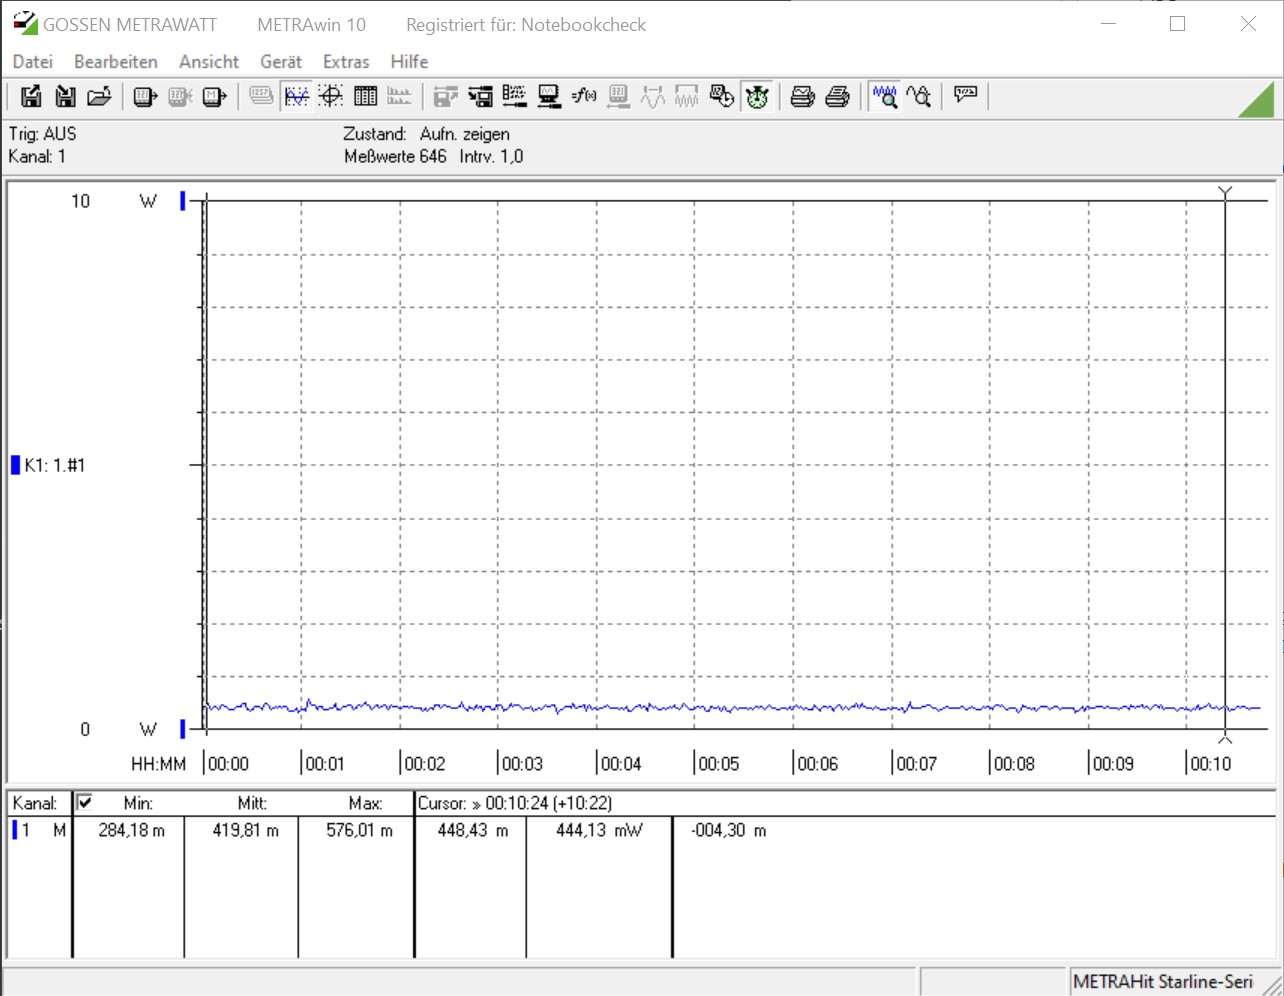
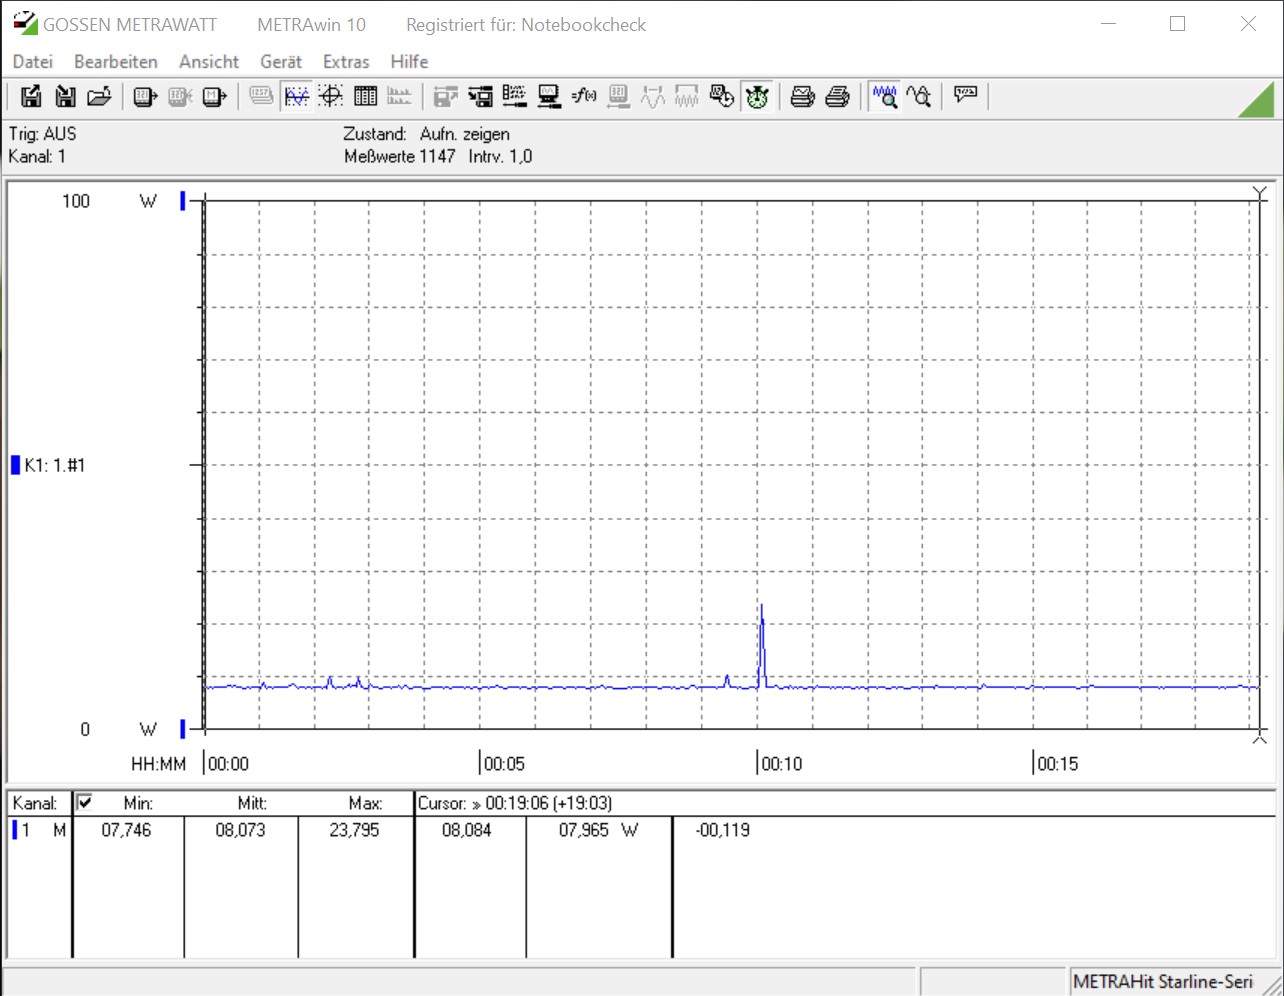
能源消耗
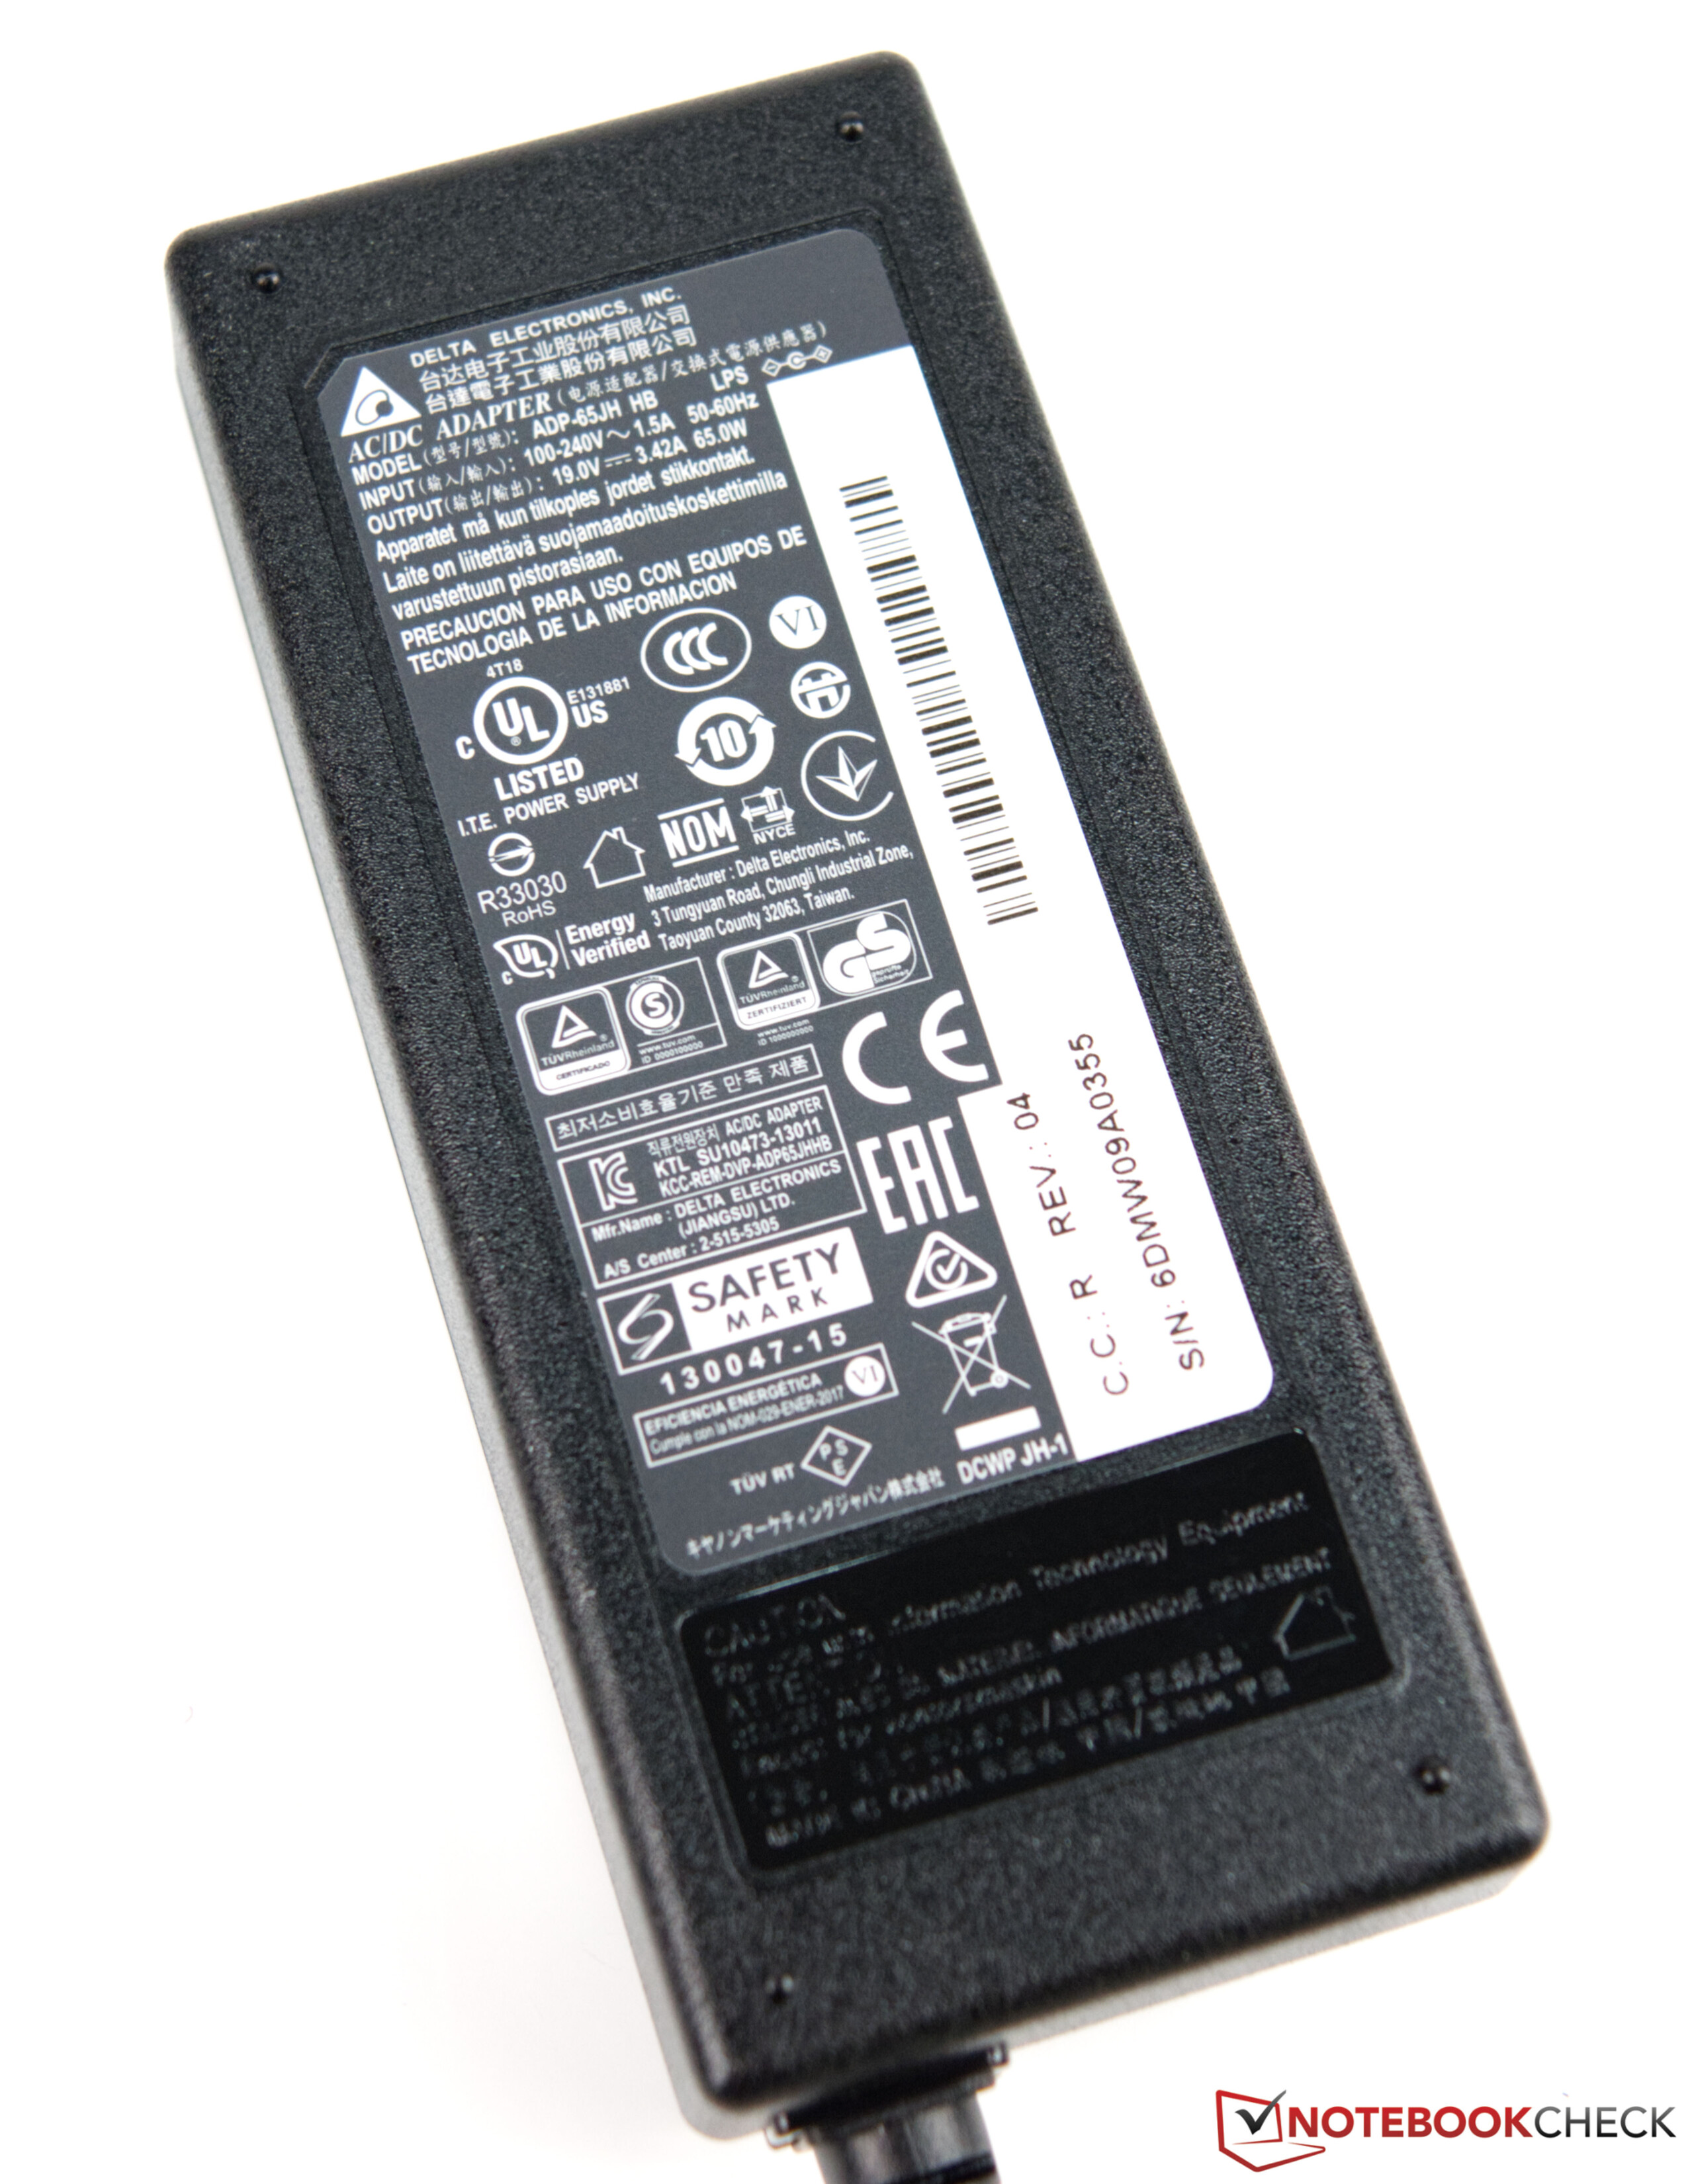
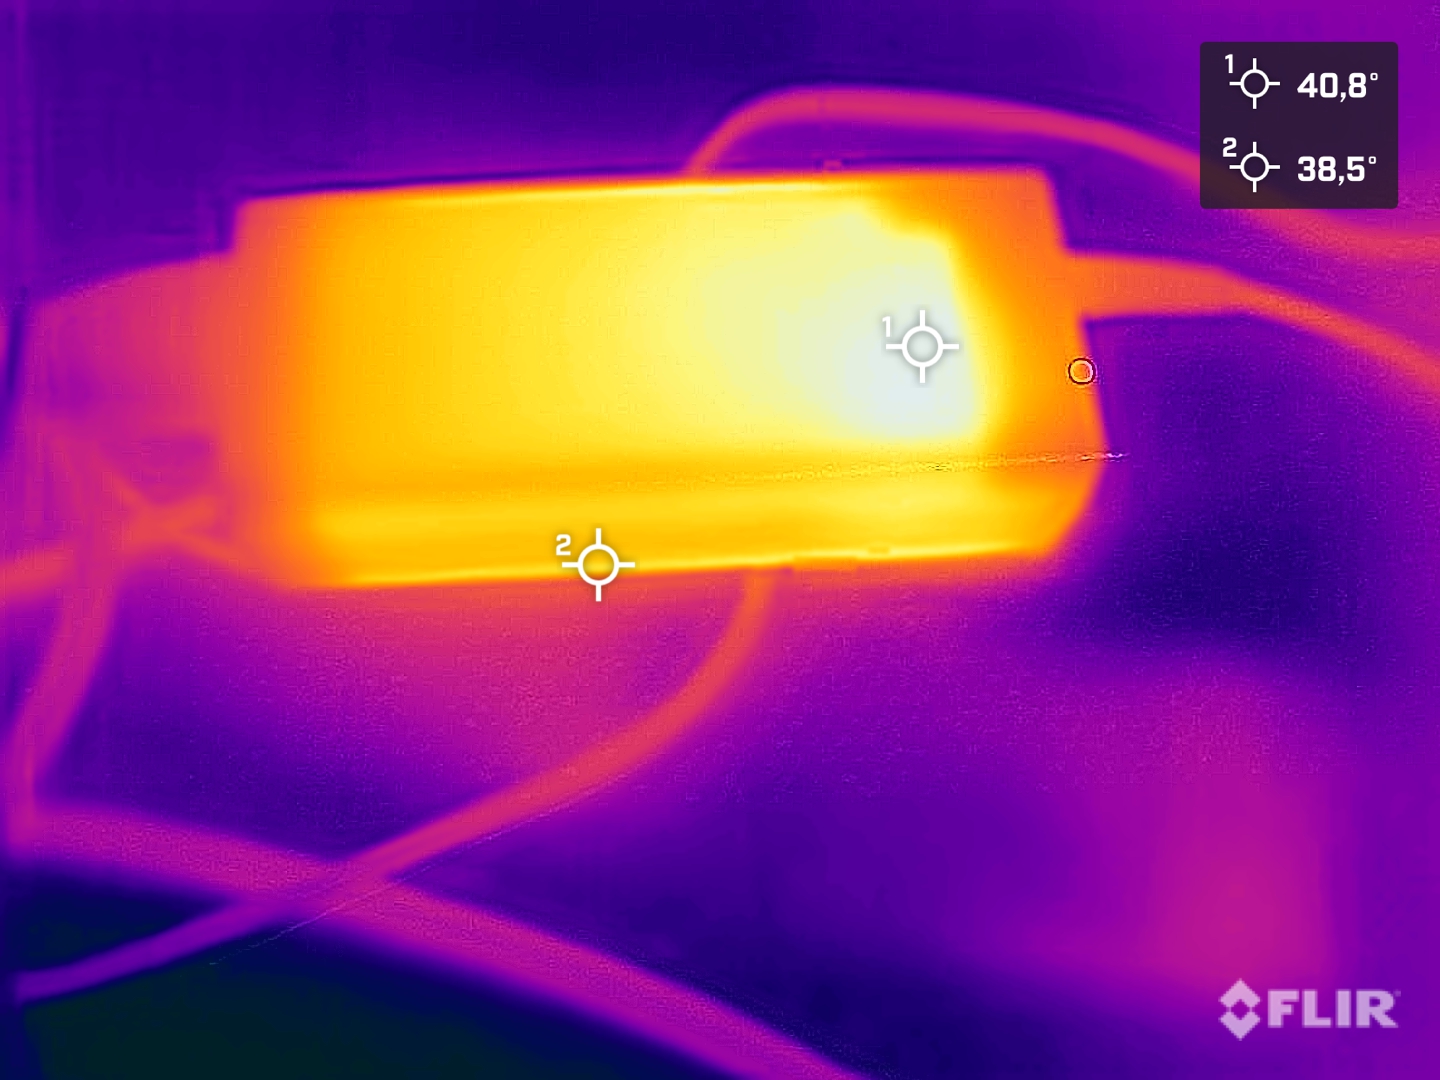
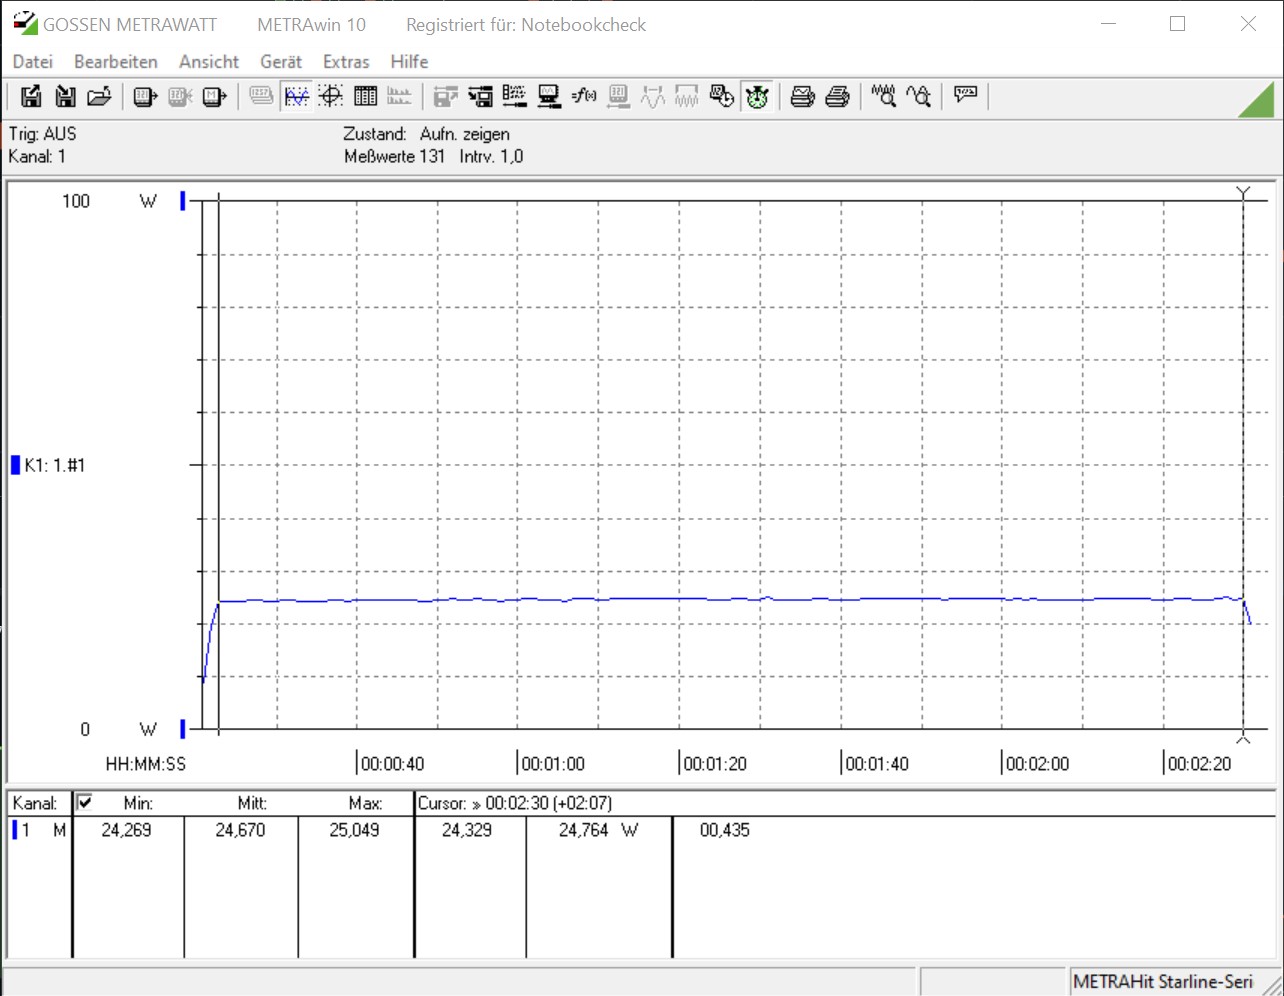
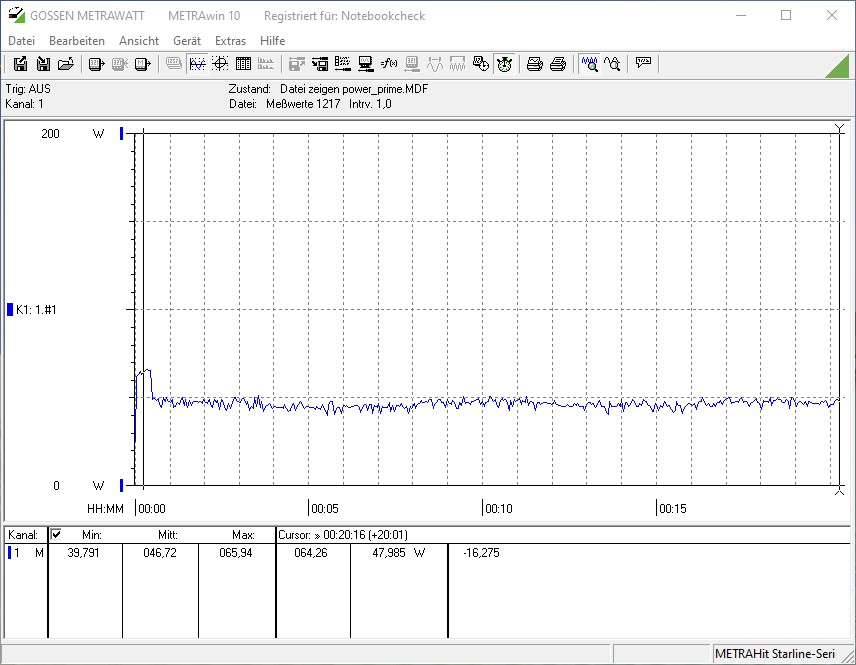
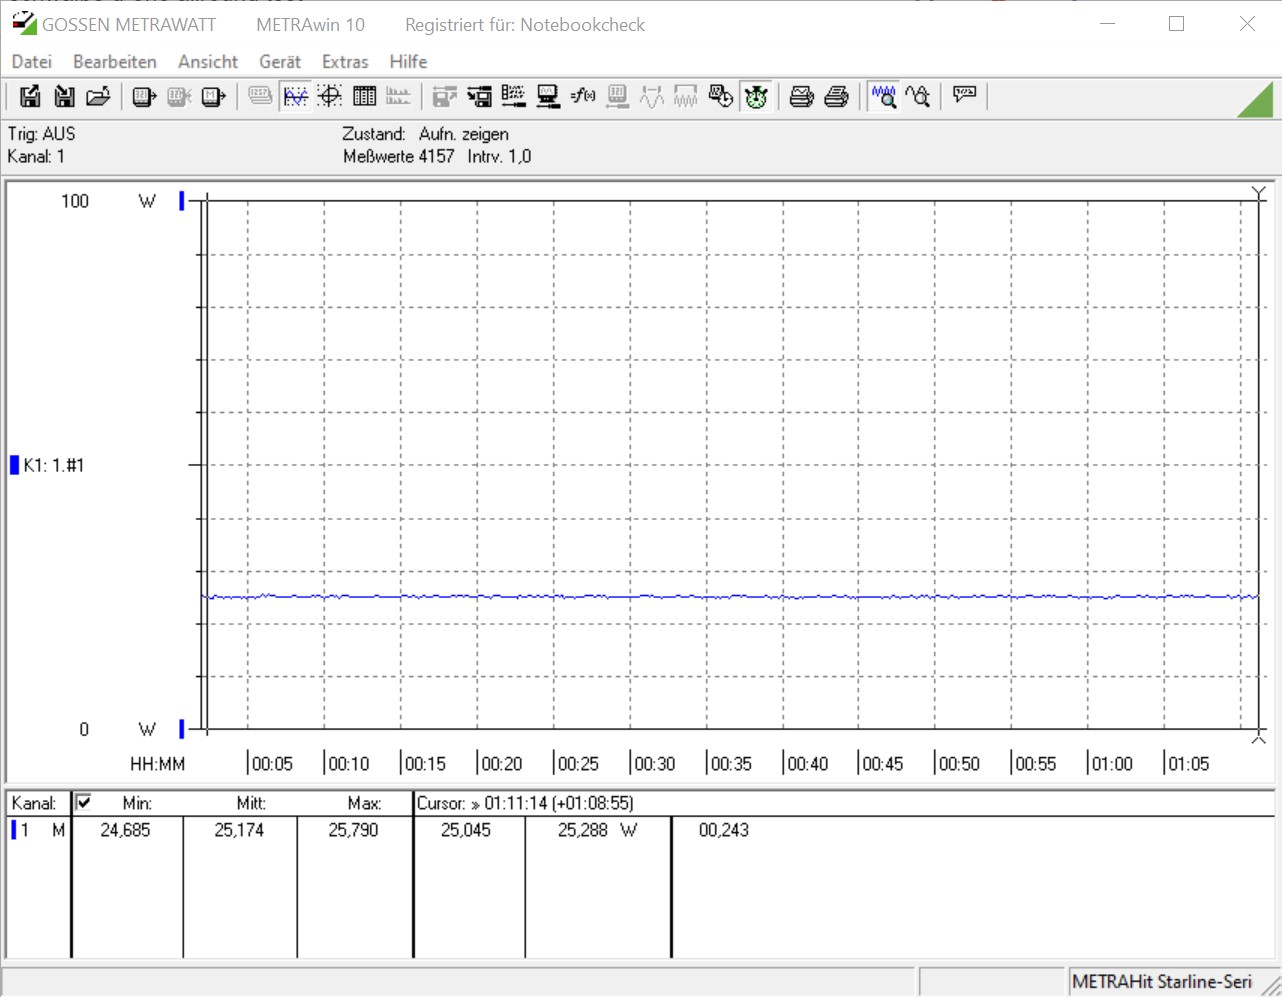
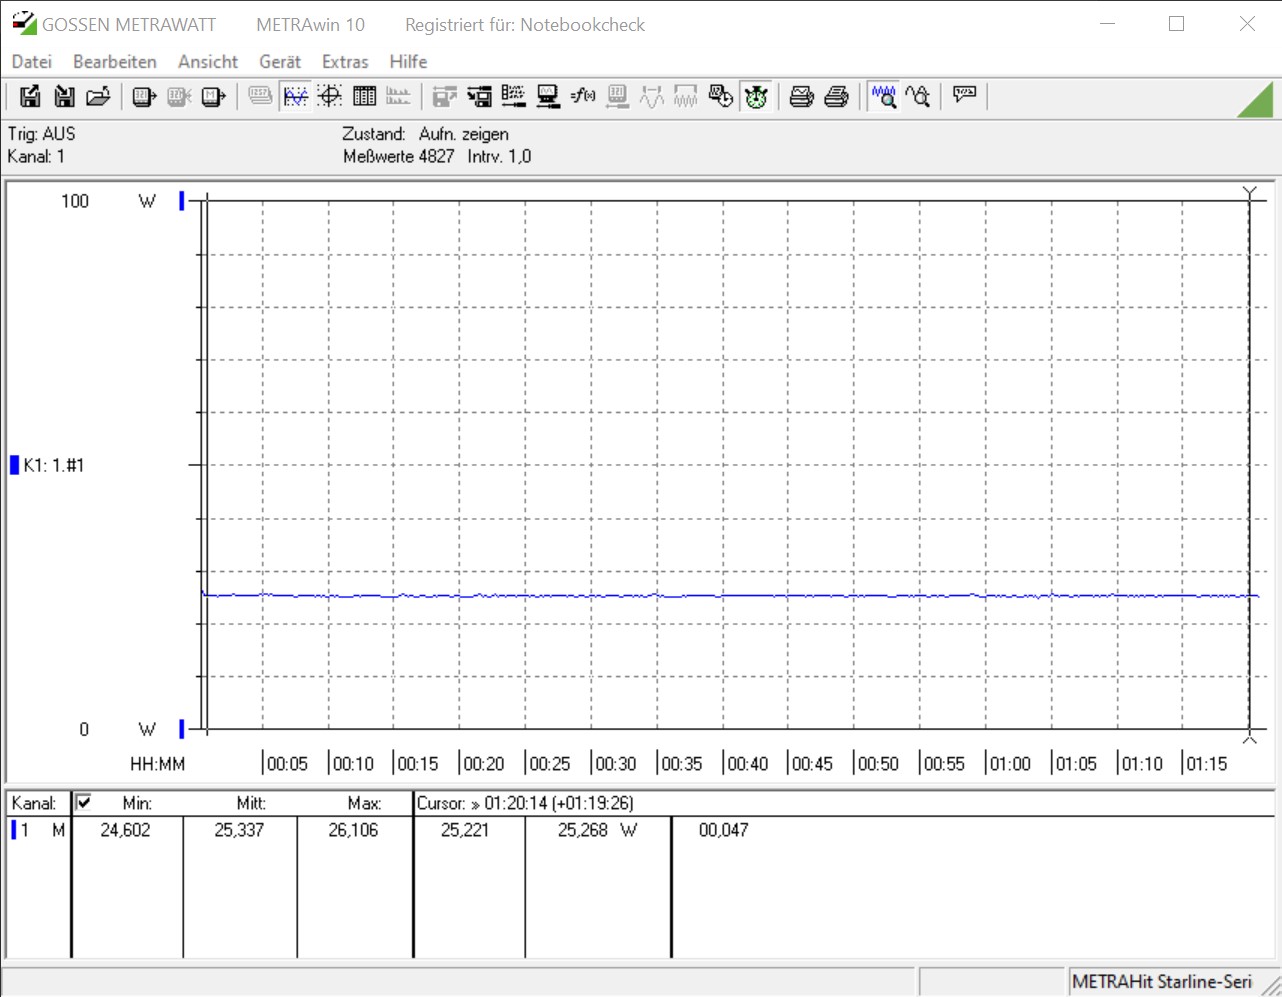
小巧的Cubi 5 10 M由于其节俭的组件,在能源消耗方面可以得分。仪表只显示我们在空闲时的8瓦。尽管如此,在满负荷的情况下,它的平均功率可以达到46瓦。电源必须提供最大66瓦的功率。因此,它的尺寸仍然足够大,有65瓦。
| Power Consumption | |
| Cinebench R15 Multi Efficiency (external Monitor) | |
| MSI Cubi 5 10M | |
| 1280x720 Prime95 28.10 and Furmark 1.25 | |
| MSI Cubi 5 10M | |
| AC6-M Mini-PC | |
| Prime95 V2810 Stress (external Monitor) | |
| Intel NUC10i7FNH (Idle: 8.4 W) | |
| Intel NUC10i5FNK (Idle: 15.7 W) | |
| MSI Cubi 5 10M (Idle: 8 W) | |
| AC6-M Mini-PC | |
| Cinebench R15 Multi (external Monitor) | |
| MSI Cubi 5 10M (Idle: 8 W) | |
| 1280x720 FurMark 1.19 GPU Stress Test (external Monitor) | |
| Intel NUC10i7FNH (Idle: 8.4 W) | |
| Intel NUC10i5FNK (Idle: 15.7 W) | |
| MSI Cubi 5 10M (Idle: 8 W) | |
* ... smaller is better
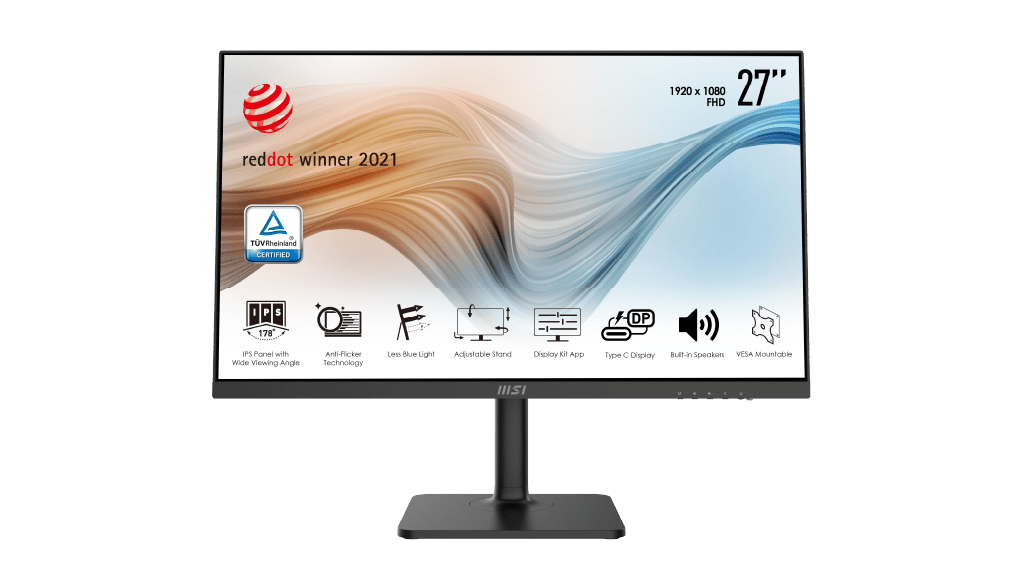
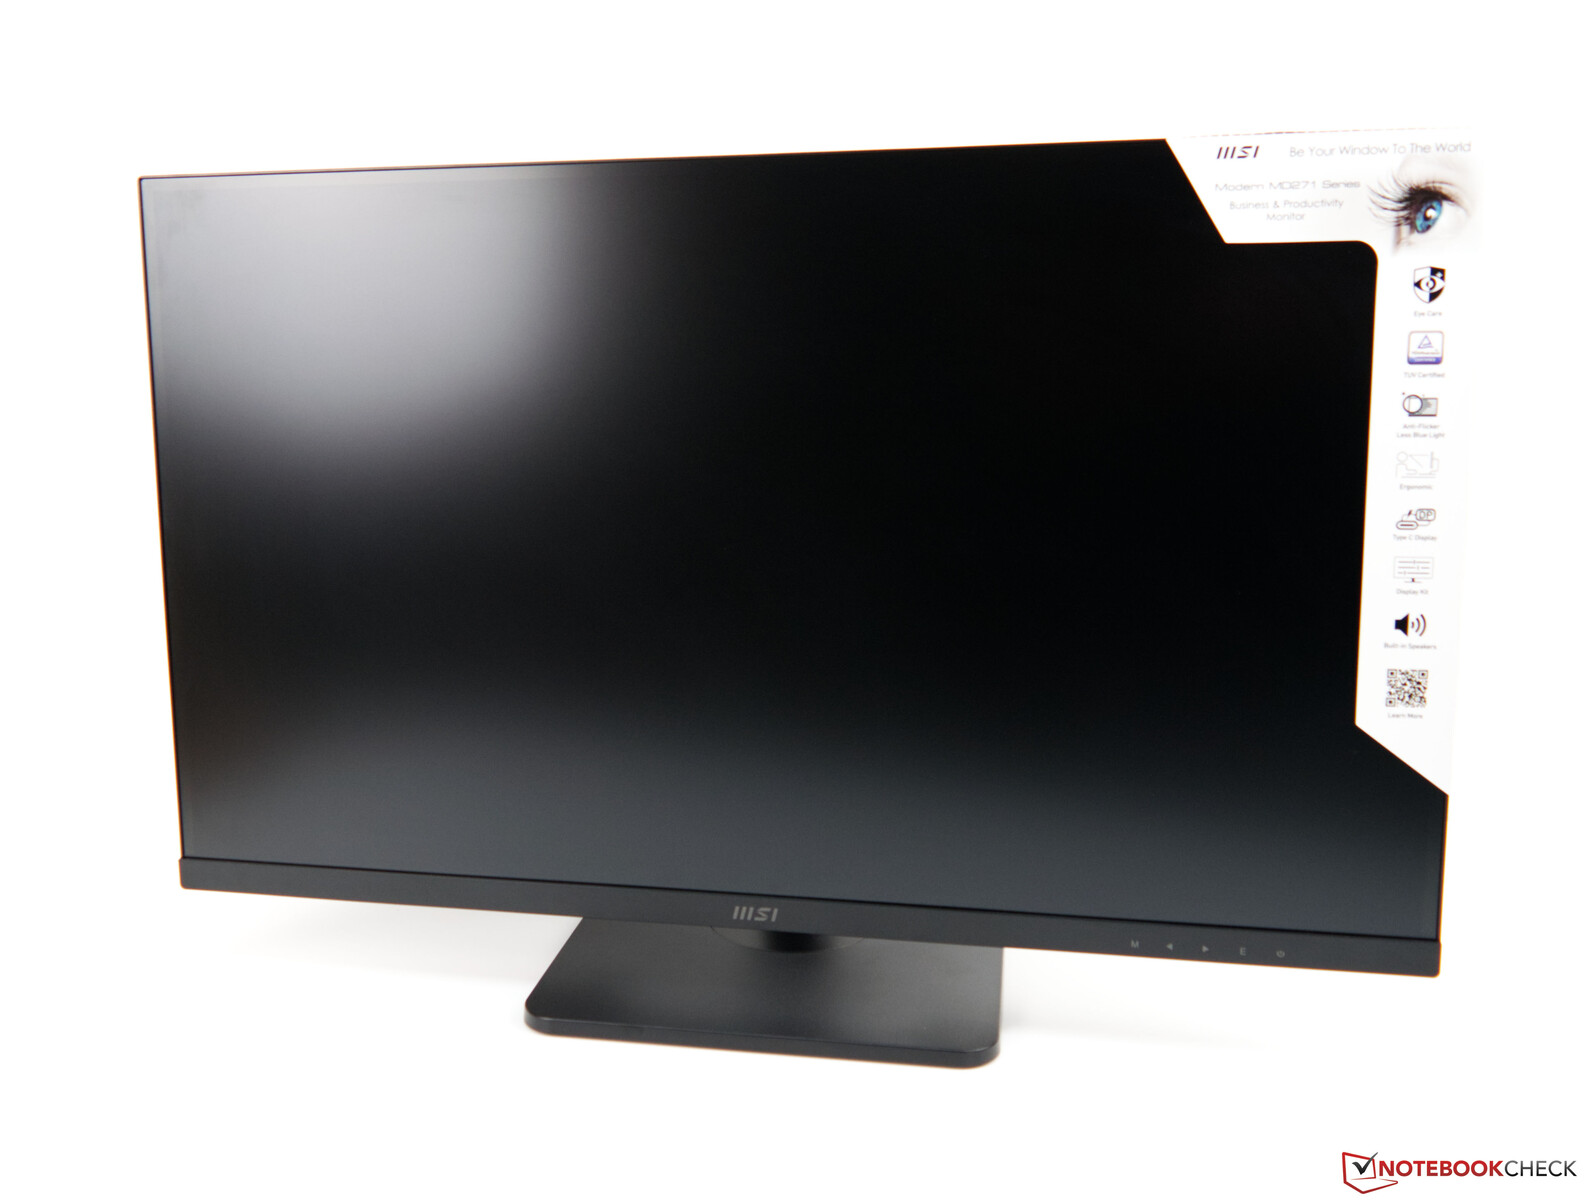
监视器 - MD271系列为内容创造者

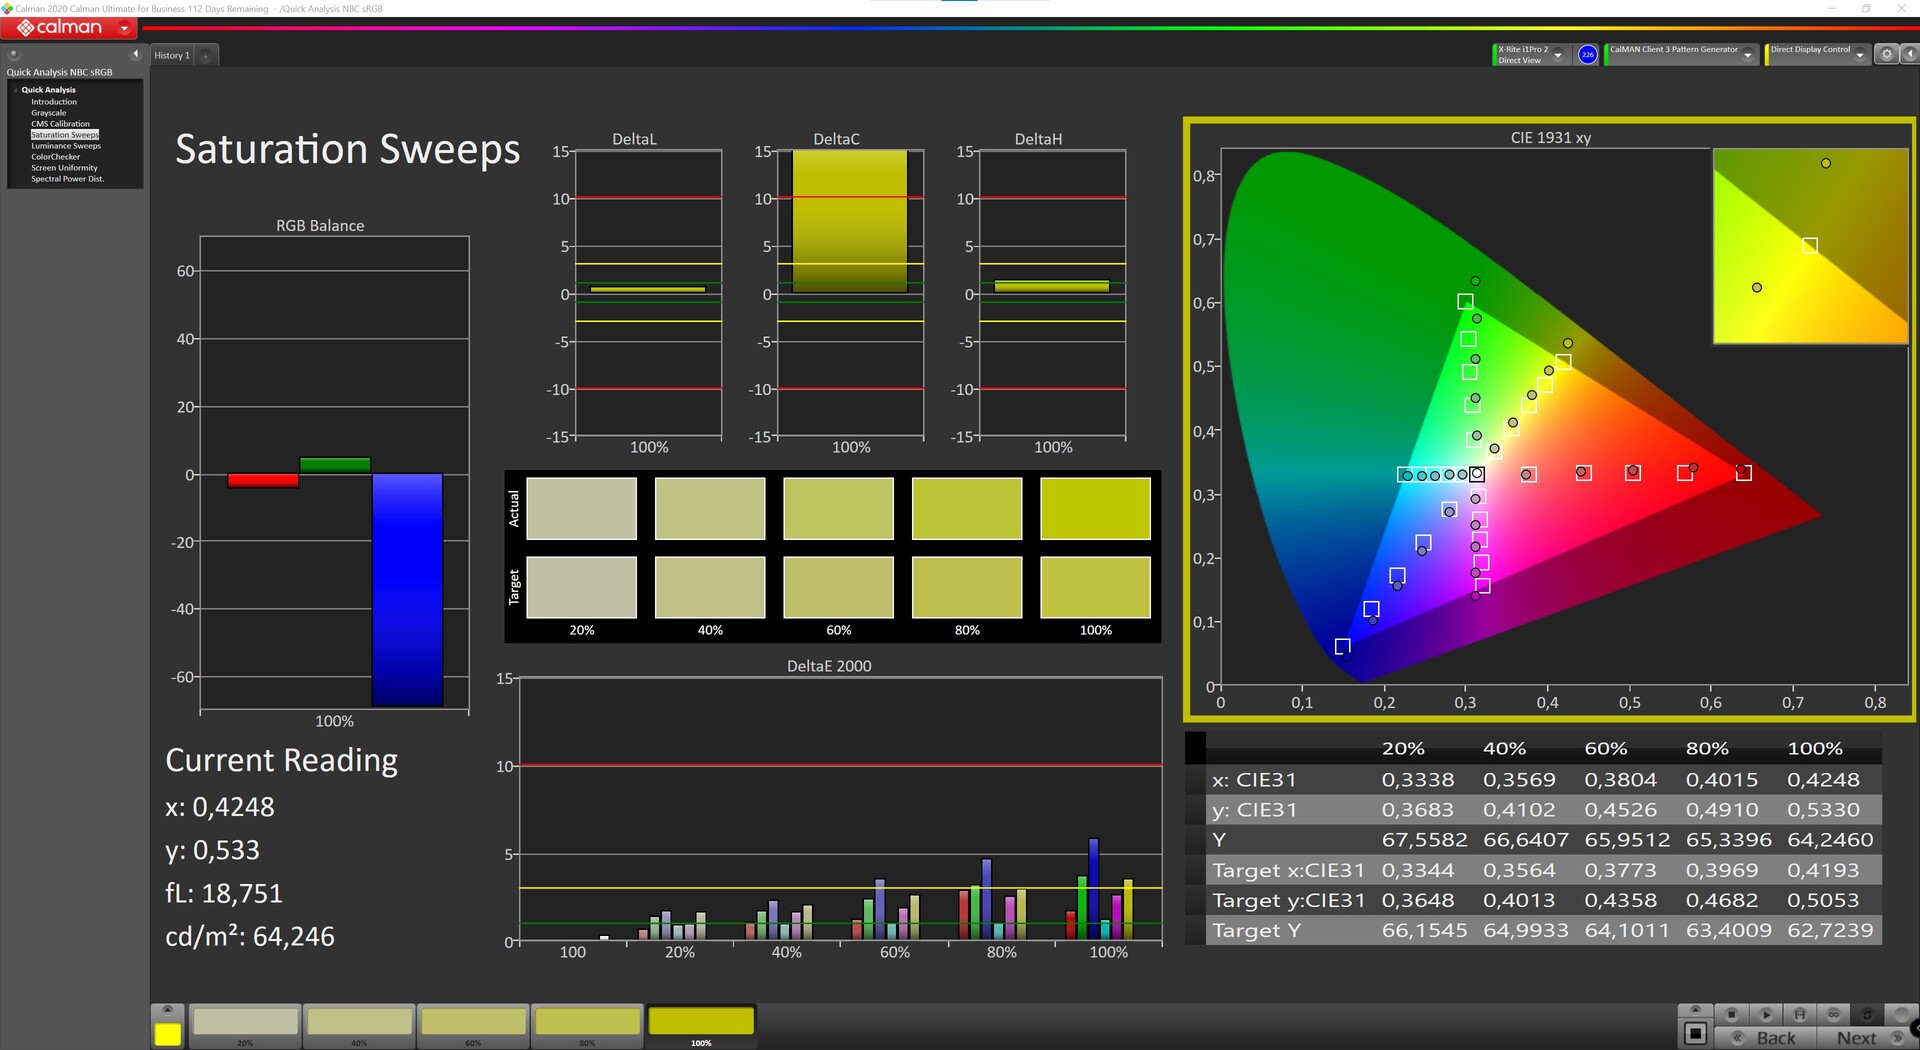
除了微星Cubi 5 10M,微星还为我们提供了新的MD271显示器。这款产品主要针对内容创作者,除了现代设计之外,还提供了WQHD分辨率和哑光IPS面板。测量的亮度为325cd/m²。这比制造商在规格表中所说的(250 cd/m²)要多。MD271的黑值是典型的IPS面板。结合亮度,这导致对比度为1,161:1。86%的照度仍然很好,尽管90%以上的数值应该是目标。毕竟,我们谈论的是一台直接针对内容创作者的显示器,他们通常对质量非常重视。尽管如此,86%的数值在日常使用中并不令人讨厌,这意味着没有明显的阴影。然而,光晕的问题,也被称为混浊,在MD271上已经是一个问题。在黑暗场景中,在屏幕的下边缘有更多明显的明亮区域。测得的响应时间很好,因此在显示器上玩一两个游戏是没有问题的。然而,由于最大的75赫兹,我们不会推荐它作为纯游戏显示器。你更应该寻找一个至少有144赫兹的好显示器。我们无法测量亮度控制中的任何PWM,这无疑是积极的。因此,疲劳的迹象较少。
| |||||||||||||||||||||||||
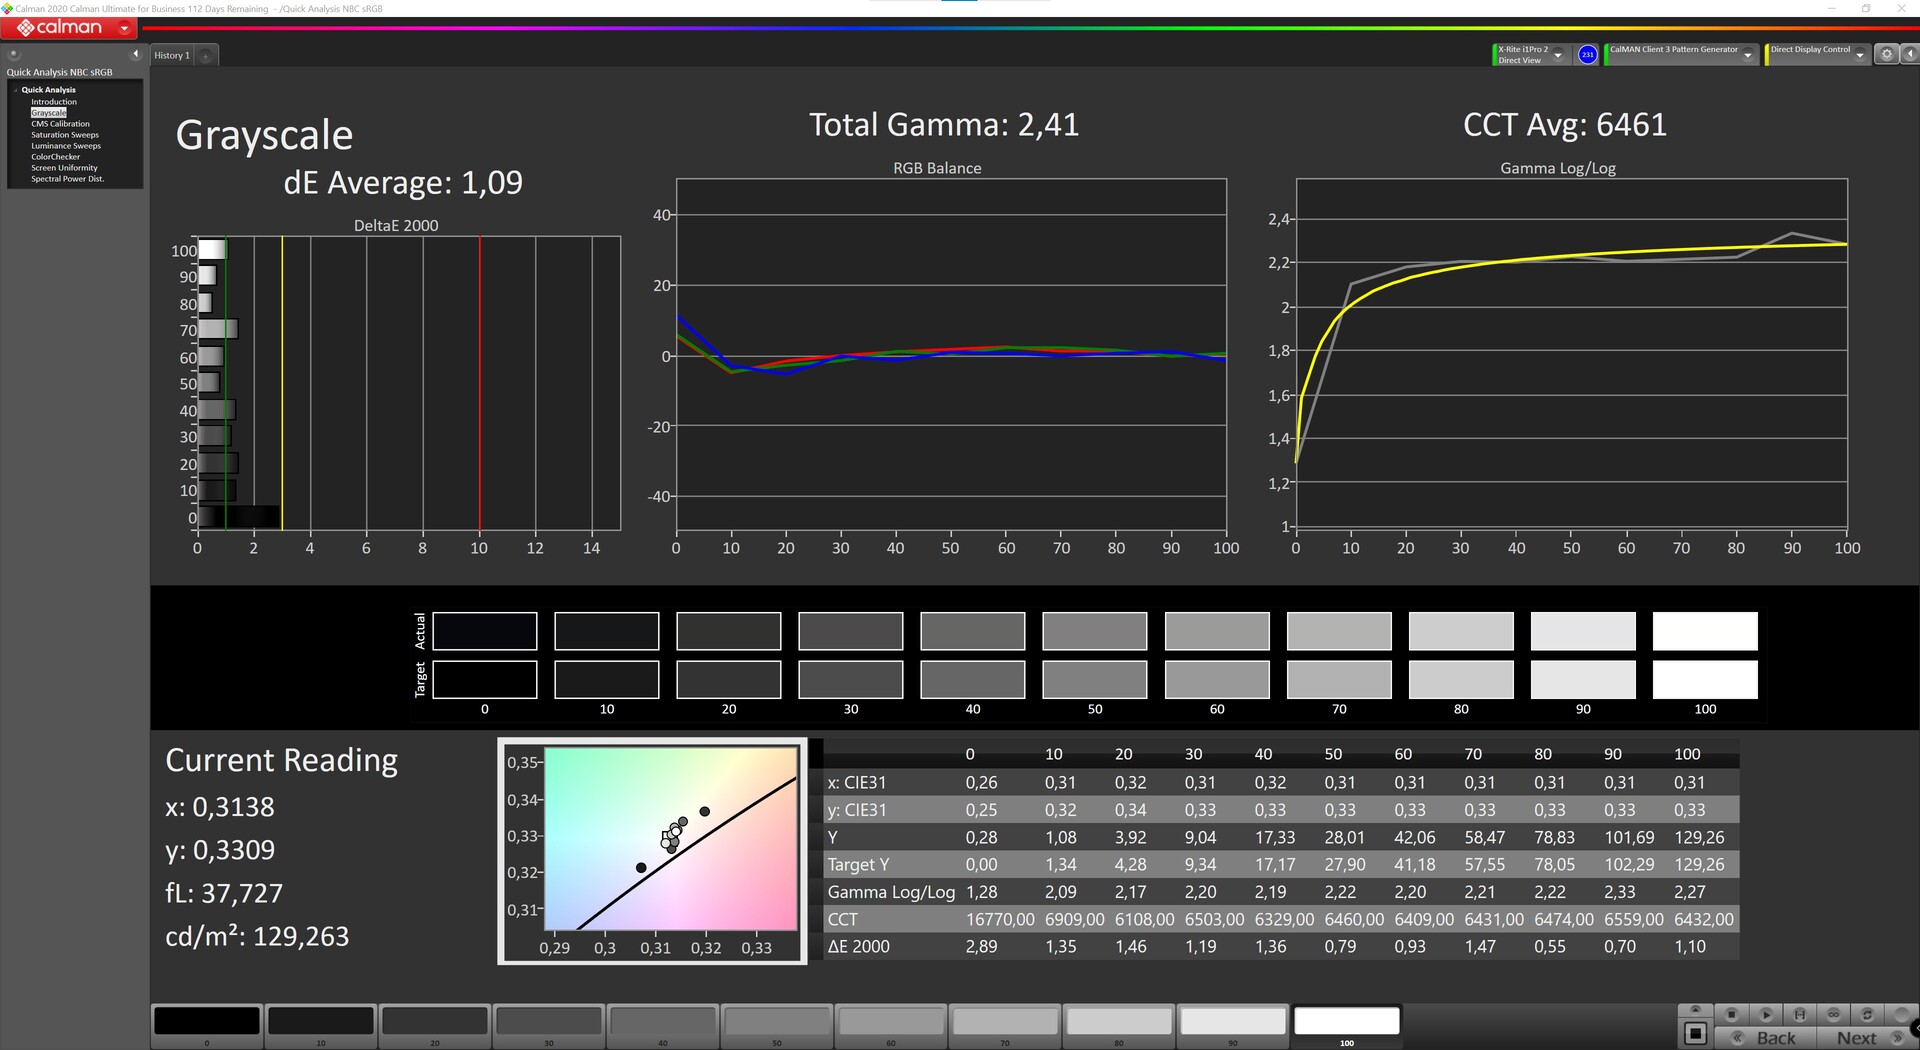
Brightness Distribution: 86 %
Contrast: 1161:1 (Black: 0.28 cd/m²)
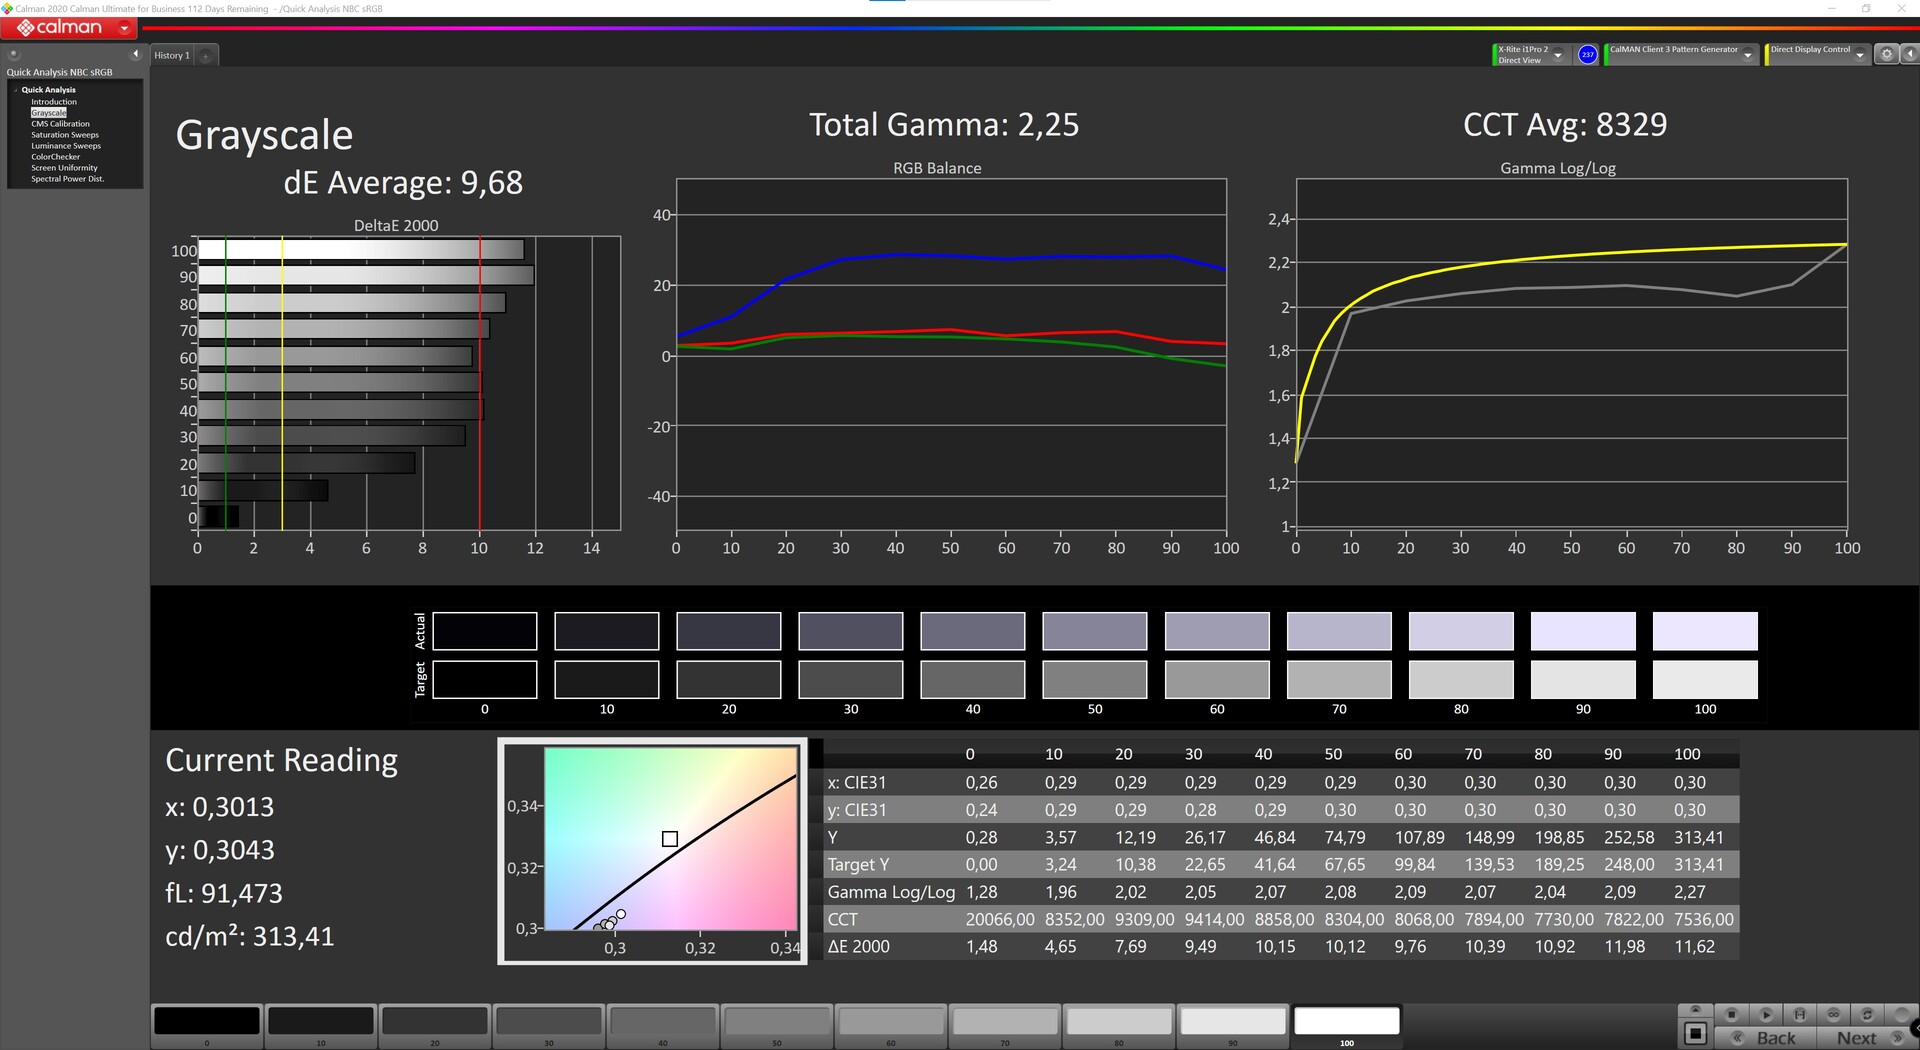
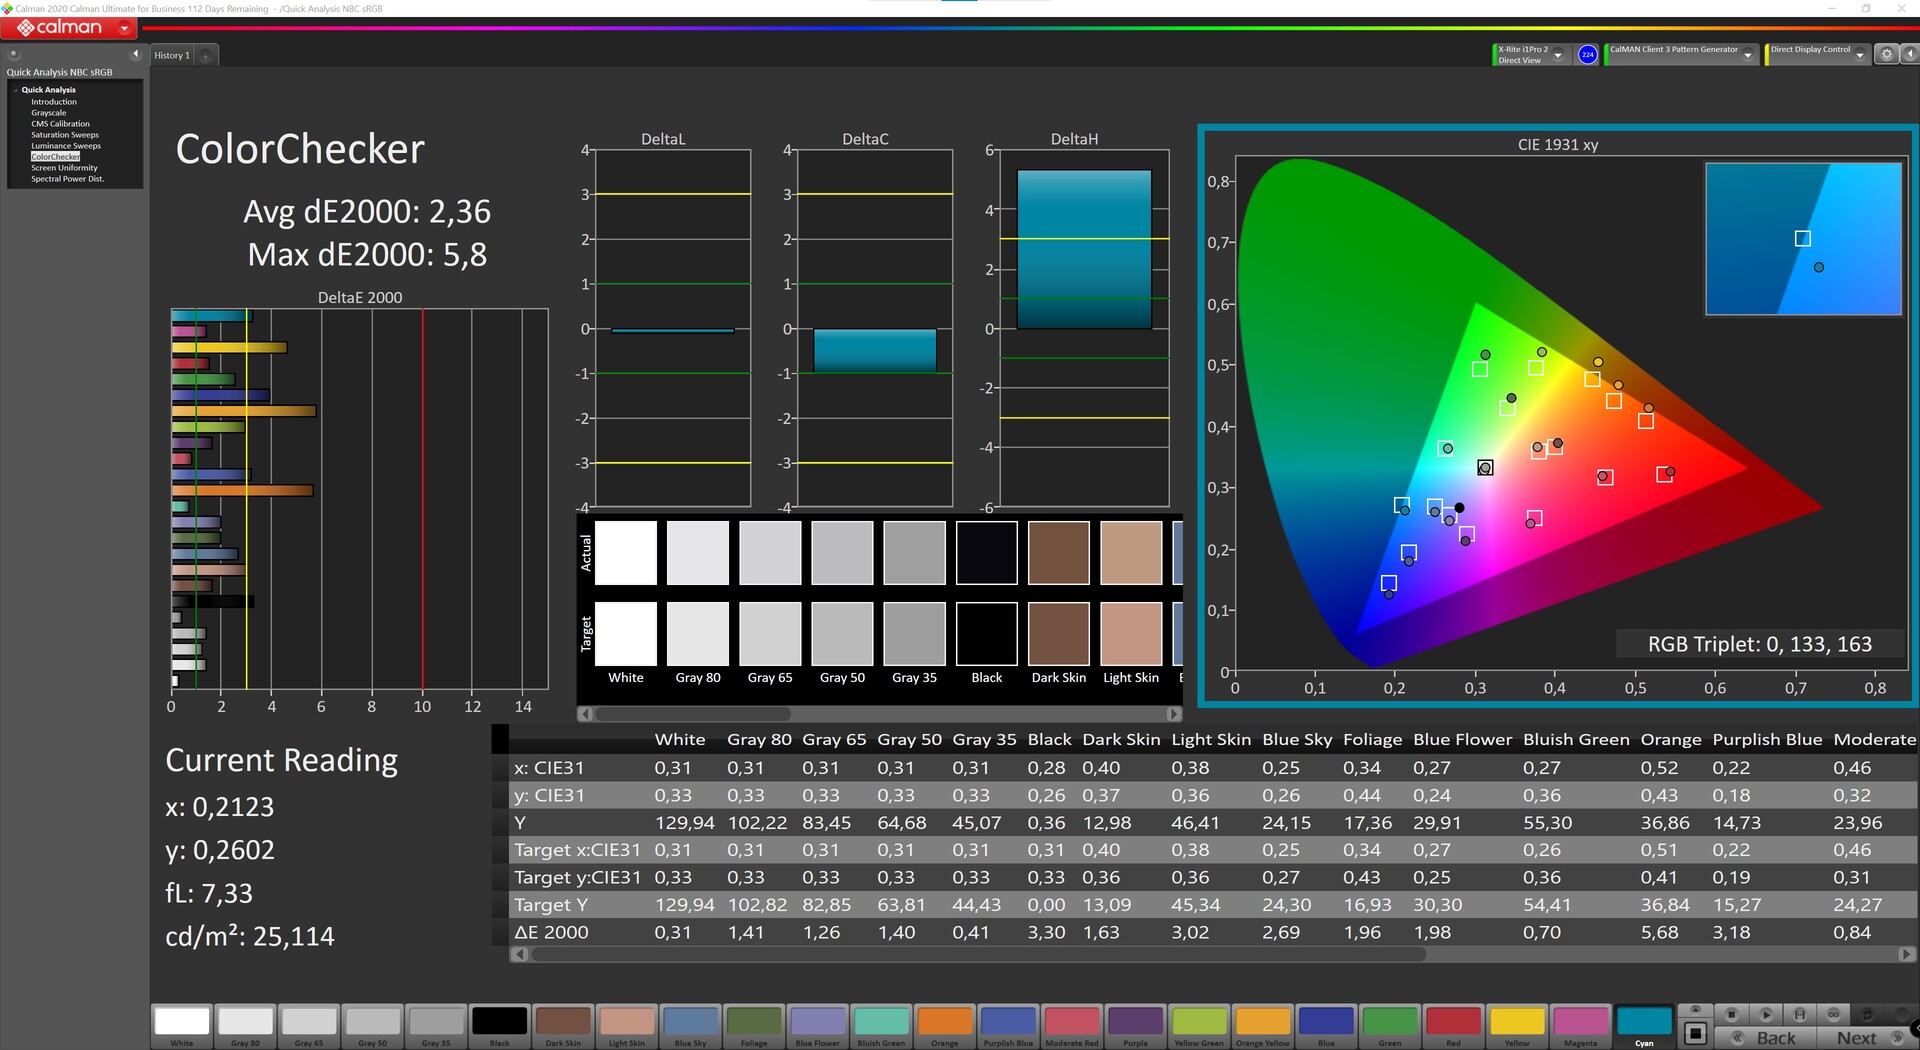
ΔE ColorChecker Calman: 6.87 | ∀{0.5-29.43 Ø4.72}
calibrated: 2.36
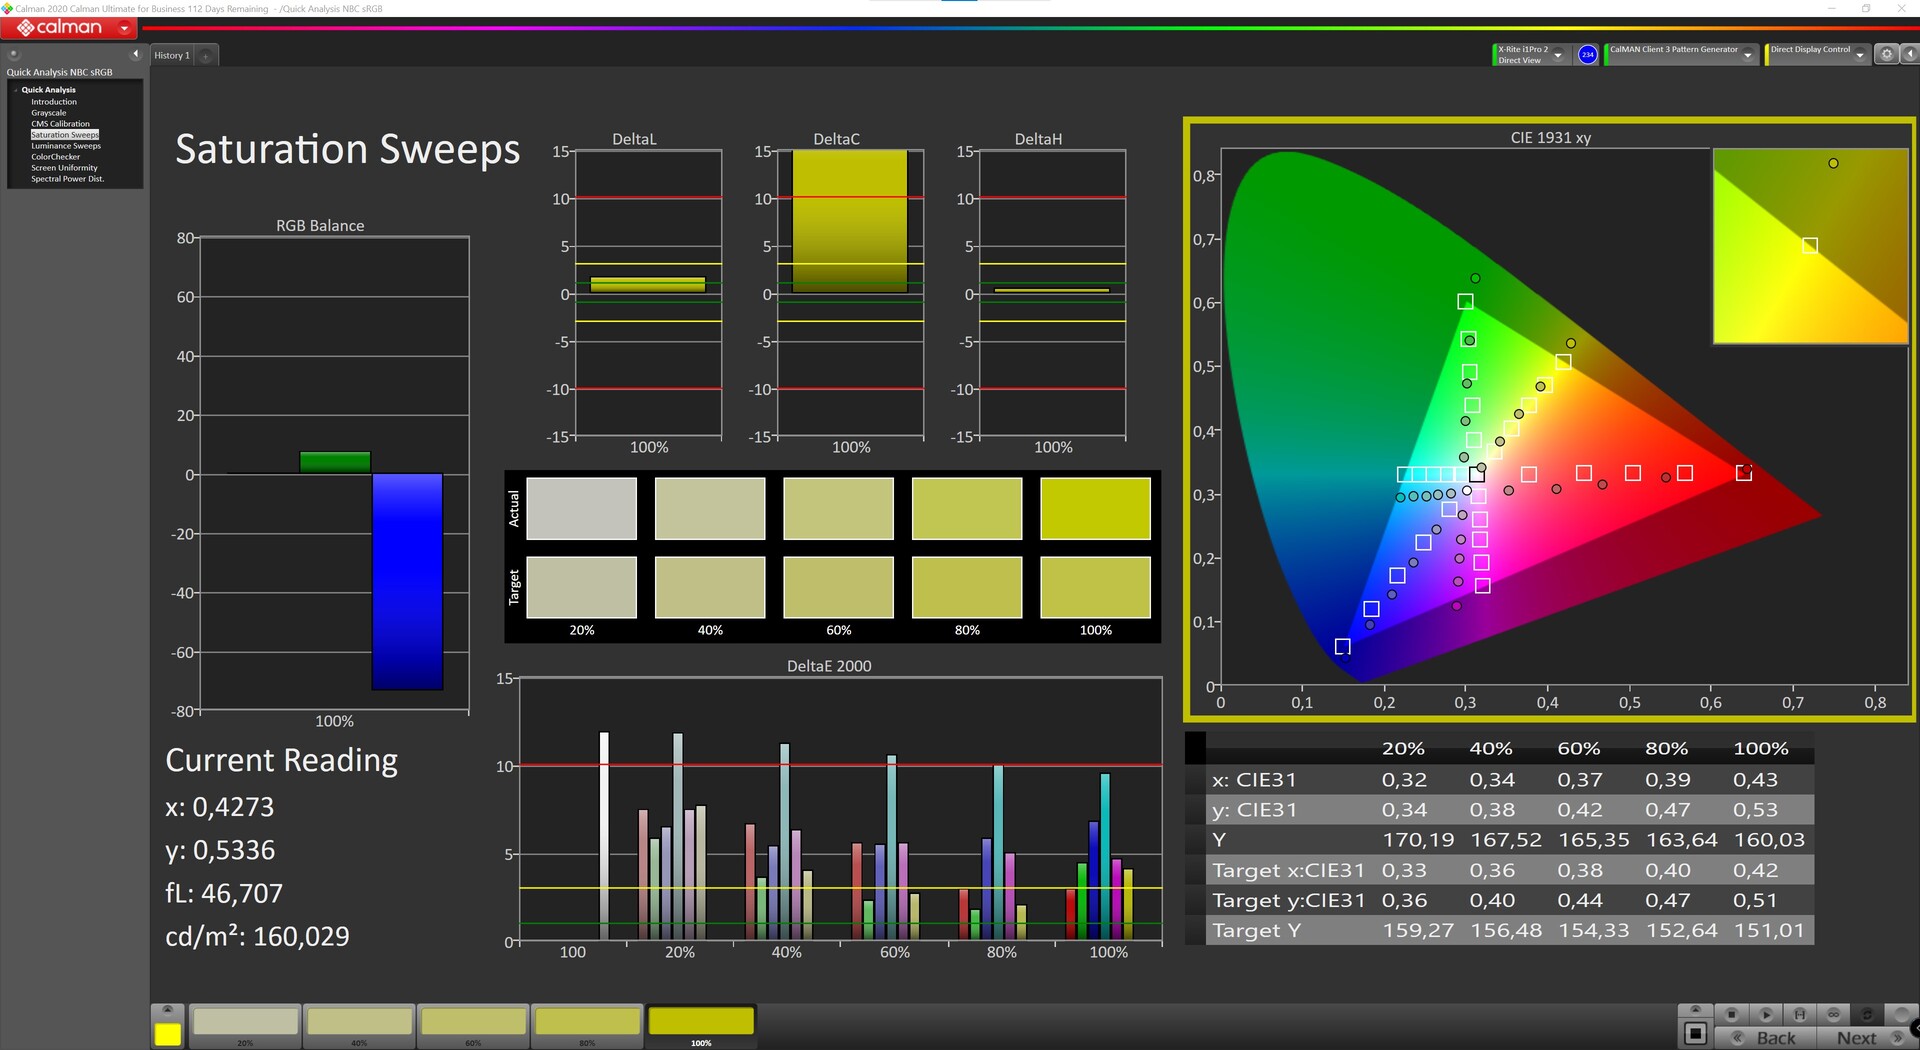
ΔE Greyscale Calman: 9.68 | ∀{0.09-98 Ø4.97}
94.95% sRGB (Argyll 1.6.3 3D)
69.51% AdobeRGB 1998 (Argyll 1.6.3 3D)
69.5% AdobeRGB 1998 (Argyll 3D)
95% sRGB (Argyll 3D)
72.1% Display P3 (Argyll 3D)
Gamma: 2.25
CCT: 8329 K
| MSI Cubi 5 10M 2560x1440, 27" | |
|---|---|
| Display | |
| Display P3 Coverage (%) | 72.1 |
| sRGB Coverage (%) | 95 |
| AdobeRGB 1998 Coverage (%) | 69.5 |
| Response Times | |
| Response Time Grey 50% / Grey 80% * (ms) | 20 ? |
| Response Time Black / White * (ms) | 14 ? |
| PWM Frequency (Hz) | |
| Screen | |
| Brightness middle (cd/m²) | 325 |
| Brightness (cd/m²) | 293 |
| Brightness Distribution (%) | 86 |
| Black Level * (cd/m²) | 0.28 |
| Contrast (:1) | 1161 |
| Colorchecker dE 2000 * | 6.87 |
| Colorchecker dE 2000 max. * | 12.26 |
| Colorchecker dE 2000 calibrated * | 2.36 |
| Greyscale dE 2000 * | 9.68 |
| Gamma | 2.25 98% |
| CCT | 8329 78% |
| Color Space (Percent of AdobeRGB 1998) (%) | 69.51 |
| Color Space (Percent of sRGB) (%) | 94.95 |
| Total Average (Program / Settings) |
* ... smaller is better
Display Response Times
| ↔ Response Time Black to White | ||
|---|---|---|
| 14 ms ... rise ↗ and fall ↘ combined | ↗ 7 ms rise | 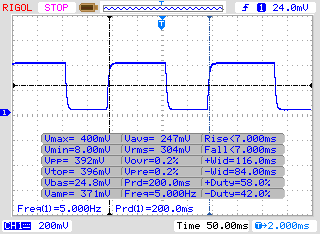 |
| ↘ 7 ms fall | ||
| The screen shows good response rates in our tests, but may be too slow for competitive gamers. In comparison, all tested devices range from 0.1 (minimum) to 240 (maximum) ms. » 34 % of all devices are better. This means that the measured response time is better than the average of all tested devices (19.8 ms). | ||
| ↔ Response Time 50% Grey to 80% Grey | ||
| 20 ms ... rise ↗ and fall ↘ combined | ↗ 9 ms rise | 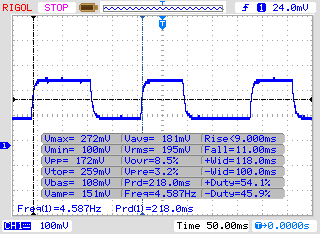 |
| ↘ 11 ms fall | ||
| The screen shows good response rates in our tests, but may be too slow for competitive gamers. In comparison, all tested devices range from 0.165 (minimum) to 636 (maximum) ms. » 33 % of all devices are better. This means that the measured response time is better than the average of all tested devices (31 ms). | ||
Screen Flickering / PWM (Pulse-Width Modulation)
| Screen flickering / PWM not detected | 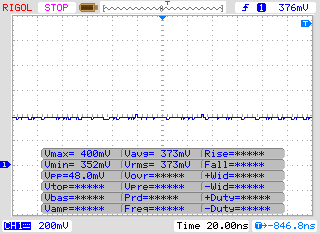 | ||
In comparison: 52 % of all tested devices do not use PWM to dim the display. If PWM was detected, an average of 7763 (minimum: 5 - maximum: 343500) Hz was measured. | |||
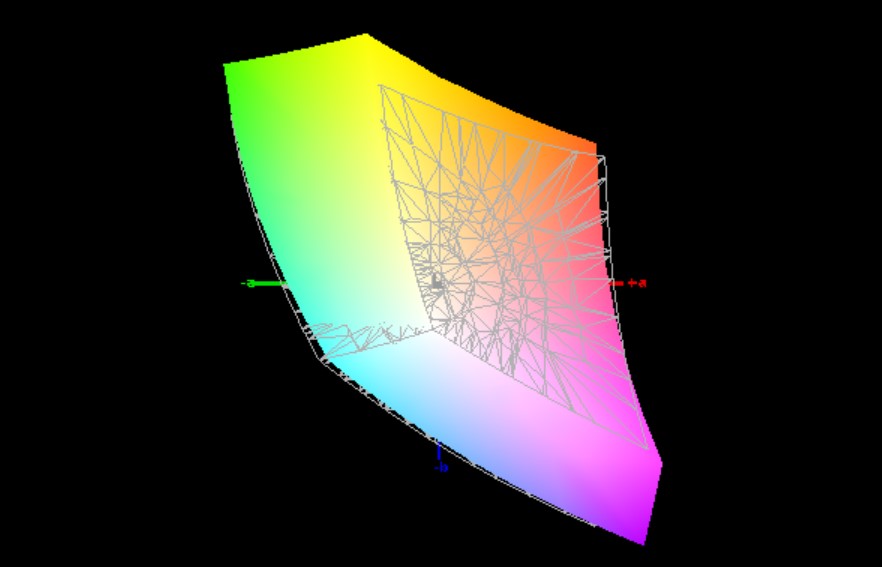
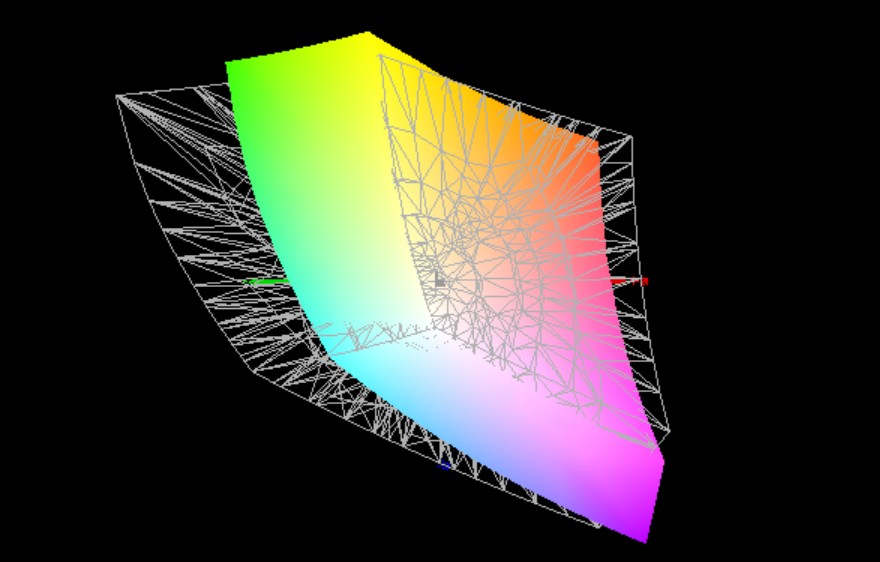
在交付状态下,可以看到与sRGB色彩空间相比,Delta-E-2000色彩偏差明显增加。如果要追求显示器的实际用途,这里肯定要进行校准。经过手动校准后,Delta-E-2000色彩偏差明显得到了改善。然而,即使在我们校准之后,颜色仍然高于目标值3。此外,轻微的蓝色偏移也可以减少一些。在测量的色彩空间覆盖率方面,微星Modern MD271做得相当好,在sRGB中占95%,在Adobe RGB色彩空间中占近70%。因此,在半专业的图像或视频编辑方面没有任何障碍。
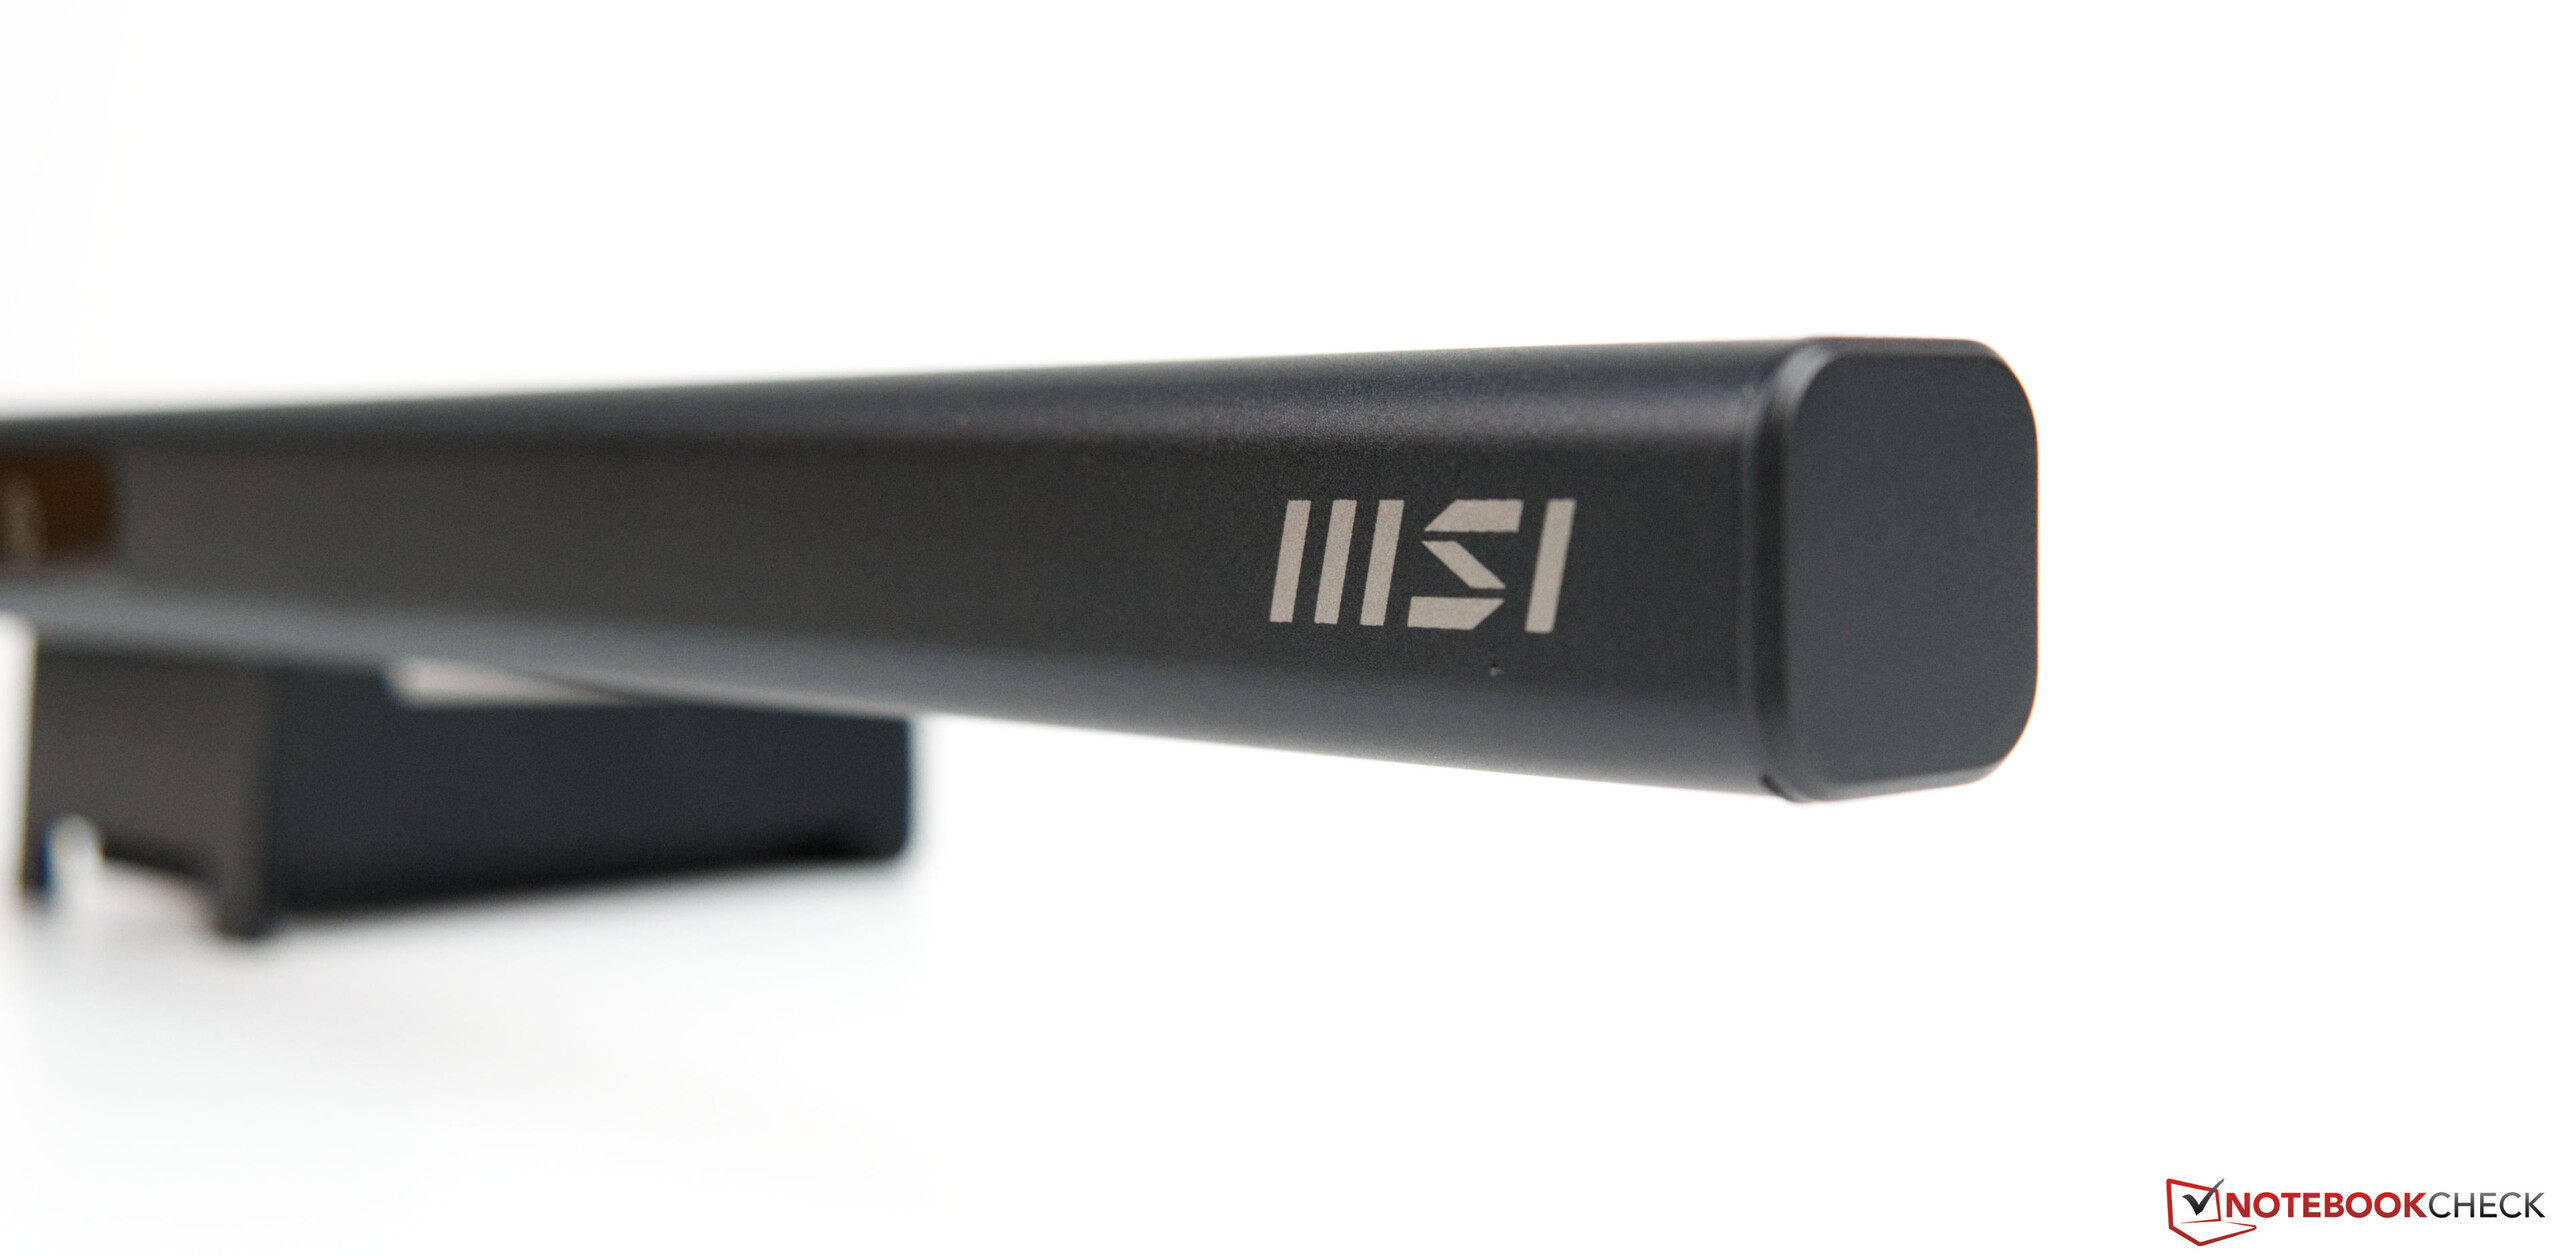
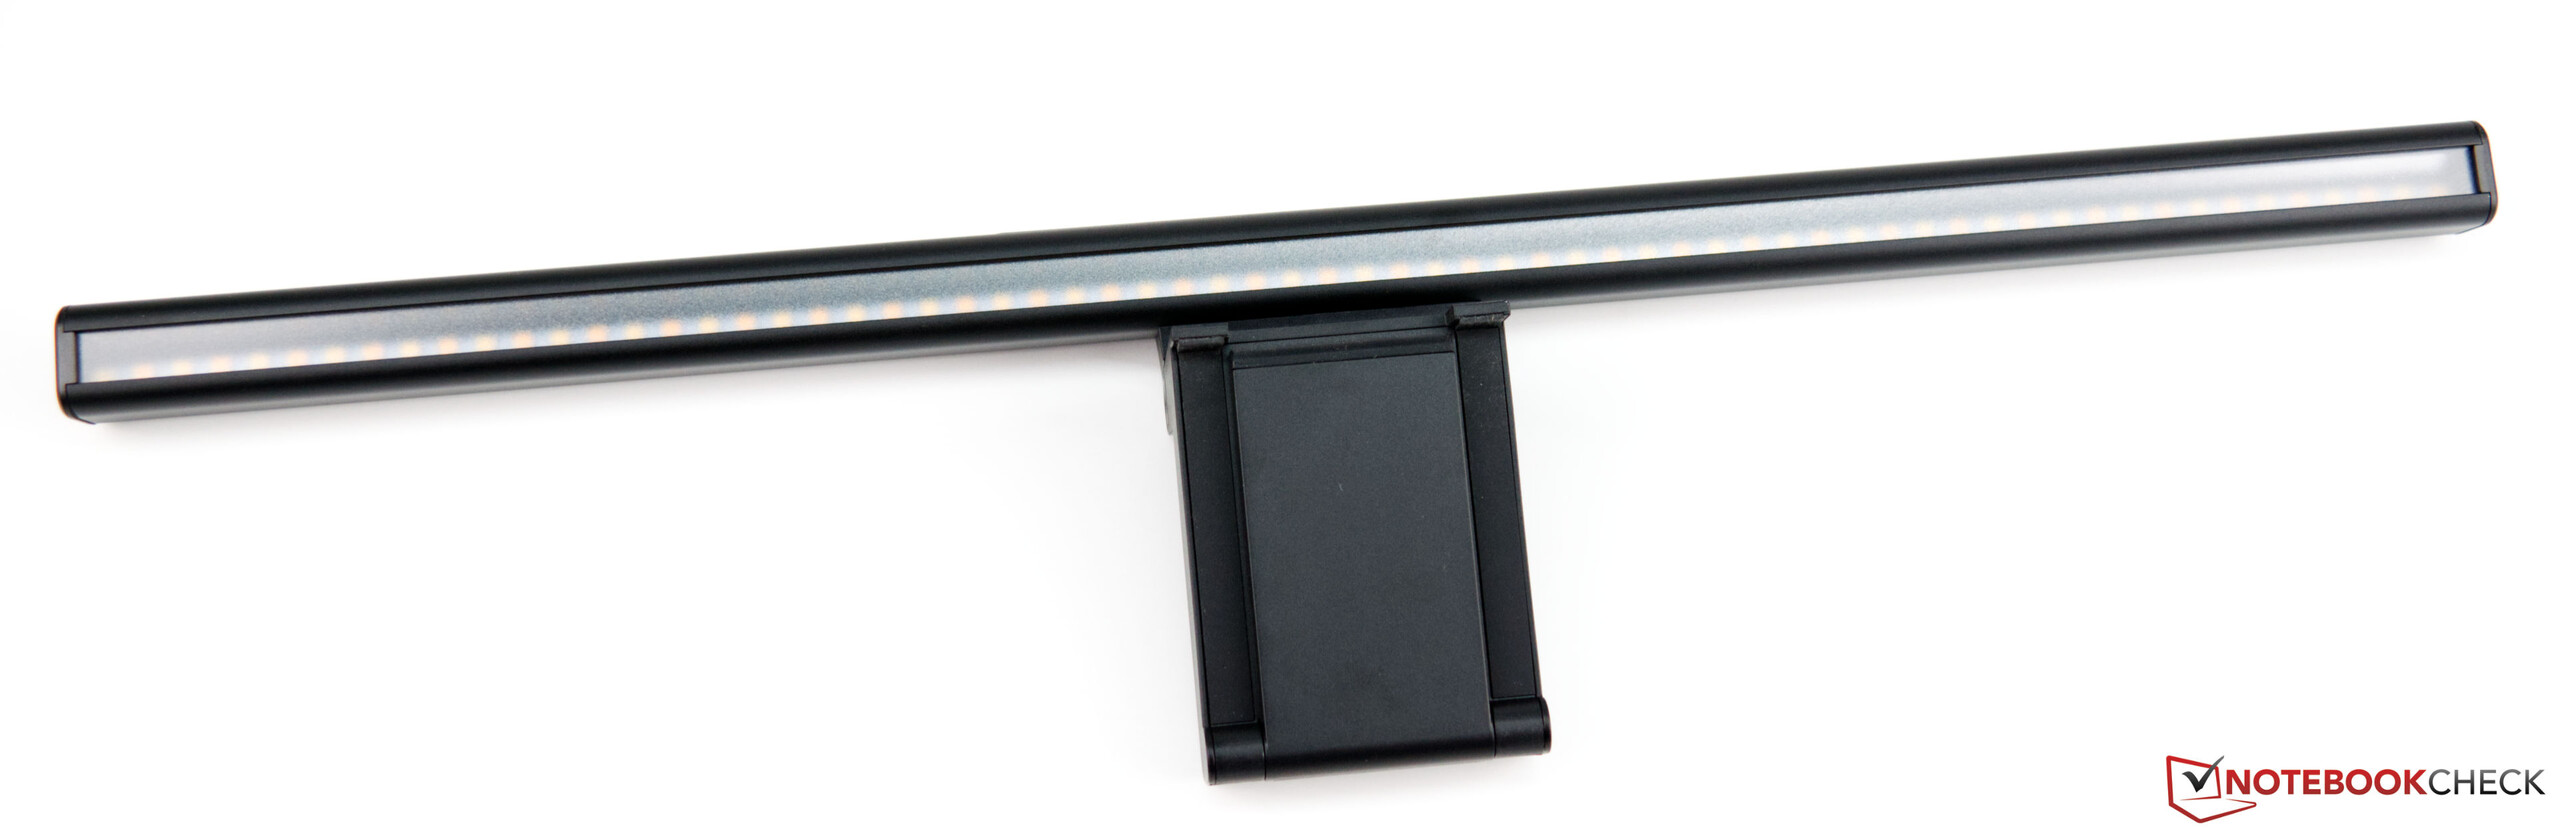
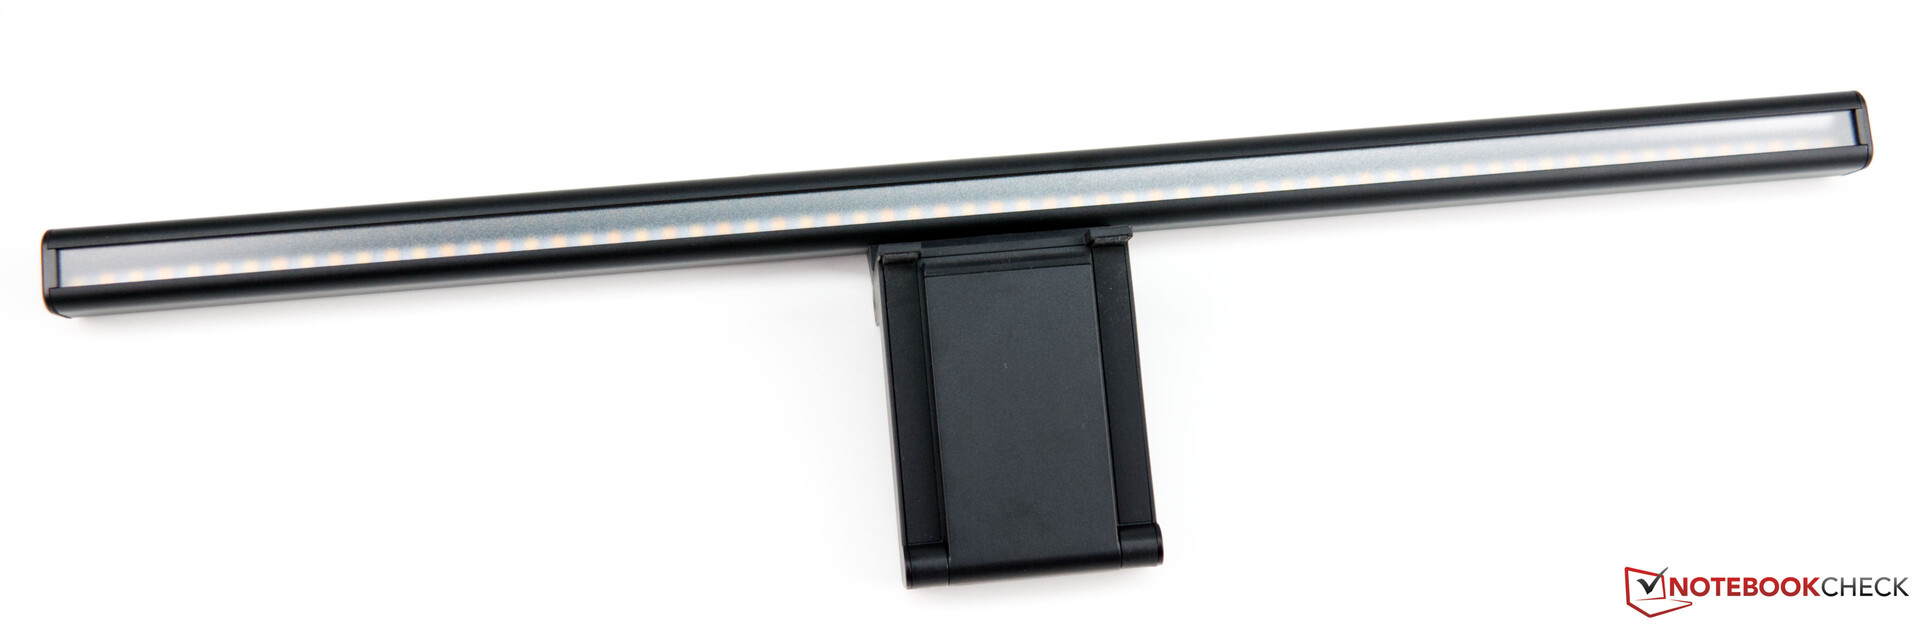
微星现代LED Lux灯条作为附件
通过微星Modern LED Lux Lightbar,制造商为工作站提供了一个合适的扩展,以最佳方式照亮键盘区域。在九月底之前,微星提供了购买指定微星产品的可能性,以获得Modern LED Lux Lightbar。 这里你可以找到更多的细节。.
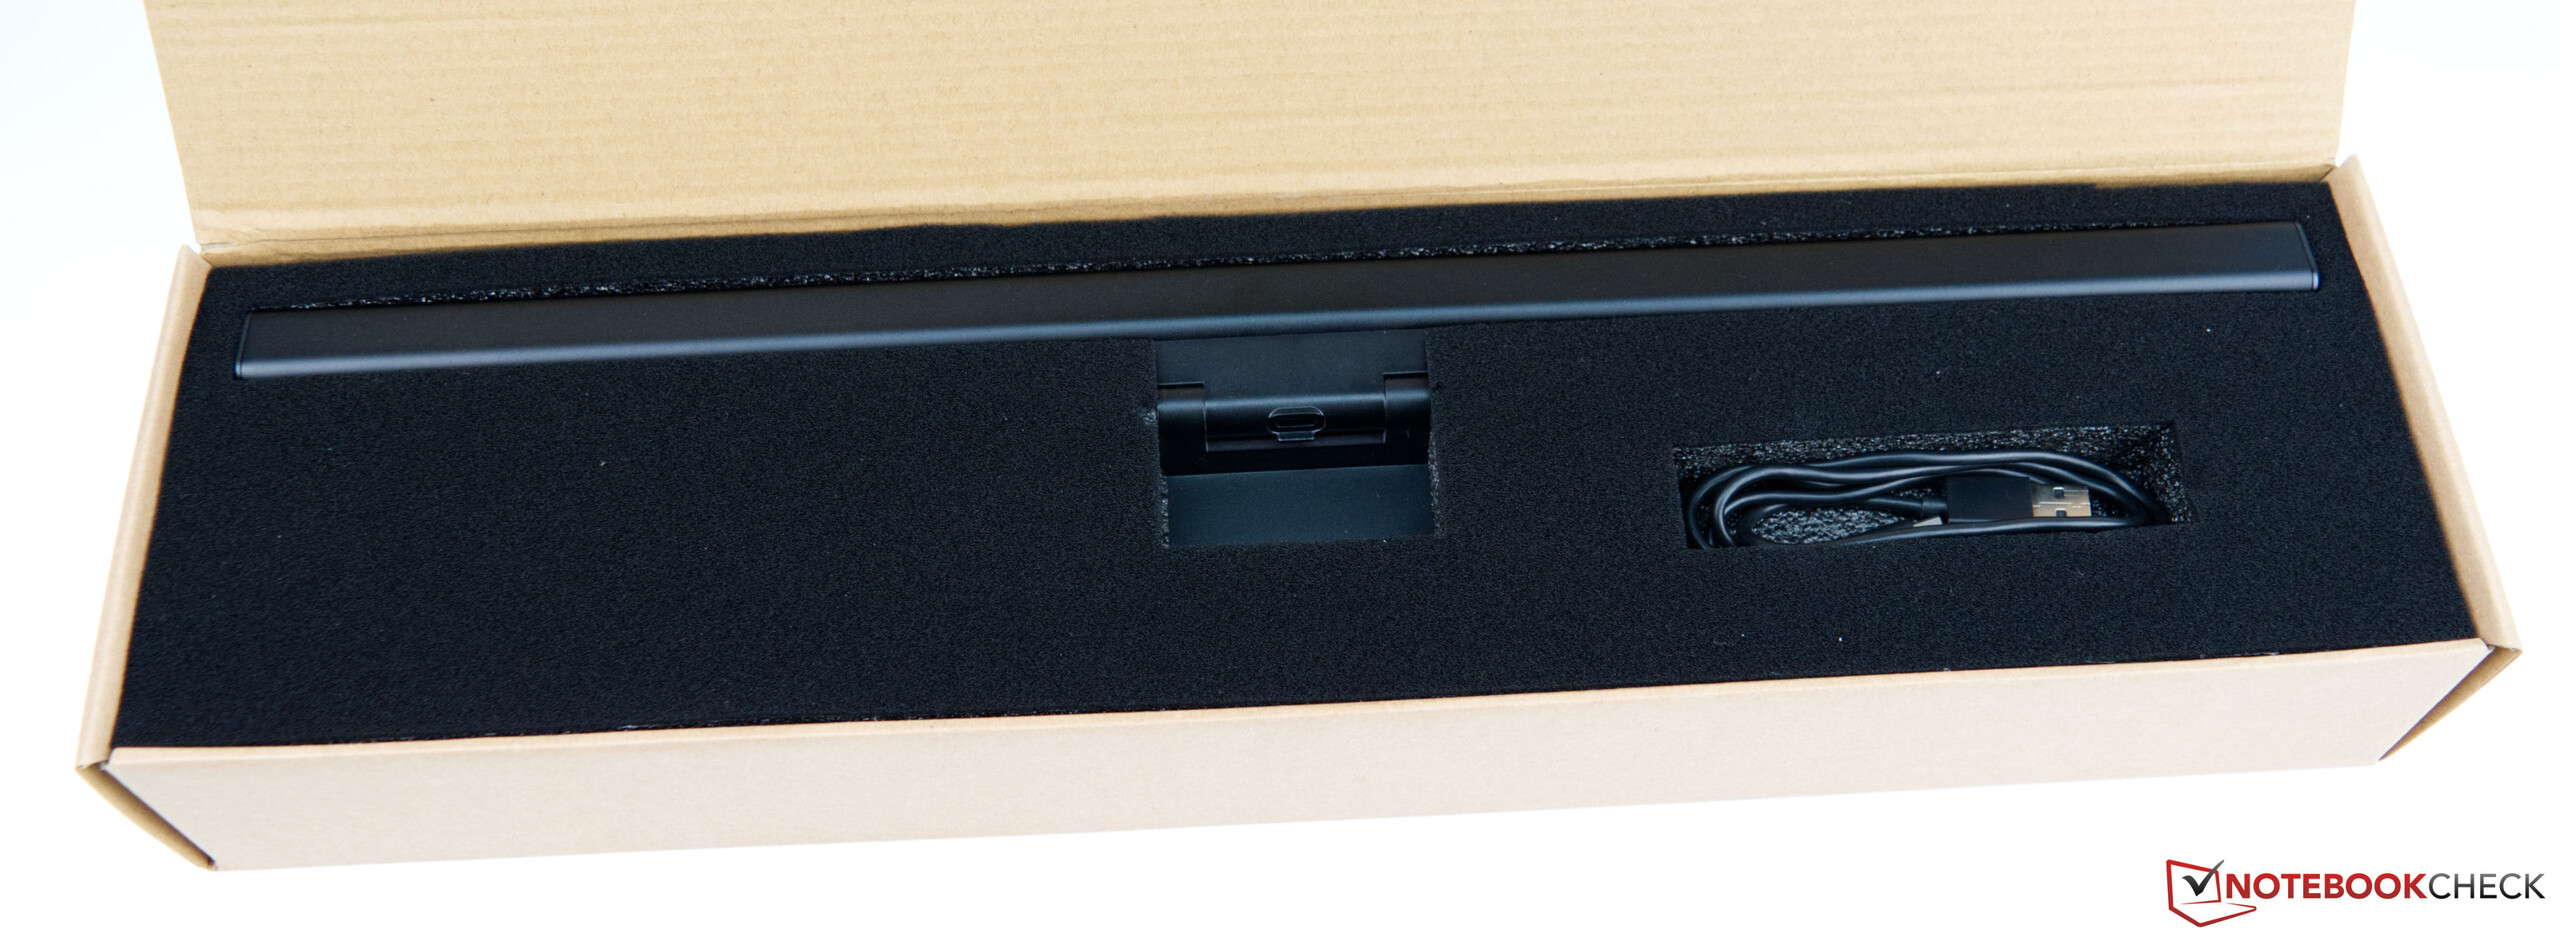
微星也为我们提供了这个灯条。该产品看起来和感觉都非常好。Lightbar可以选择安装在许多不同的显示器上。为此,Lightbar被放置在显示器的顶部,并通过一个弹簧式的对应装置固定在显示器上。电源是通过USB供应的。您可以使用带有USB-A端口的常规电源,或者直接使用显示器(如果它有USB端口)。包括一条相应的连接线(USB-A到USB-C)。
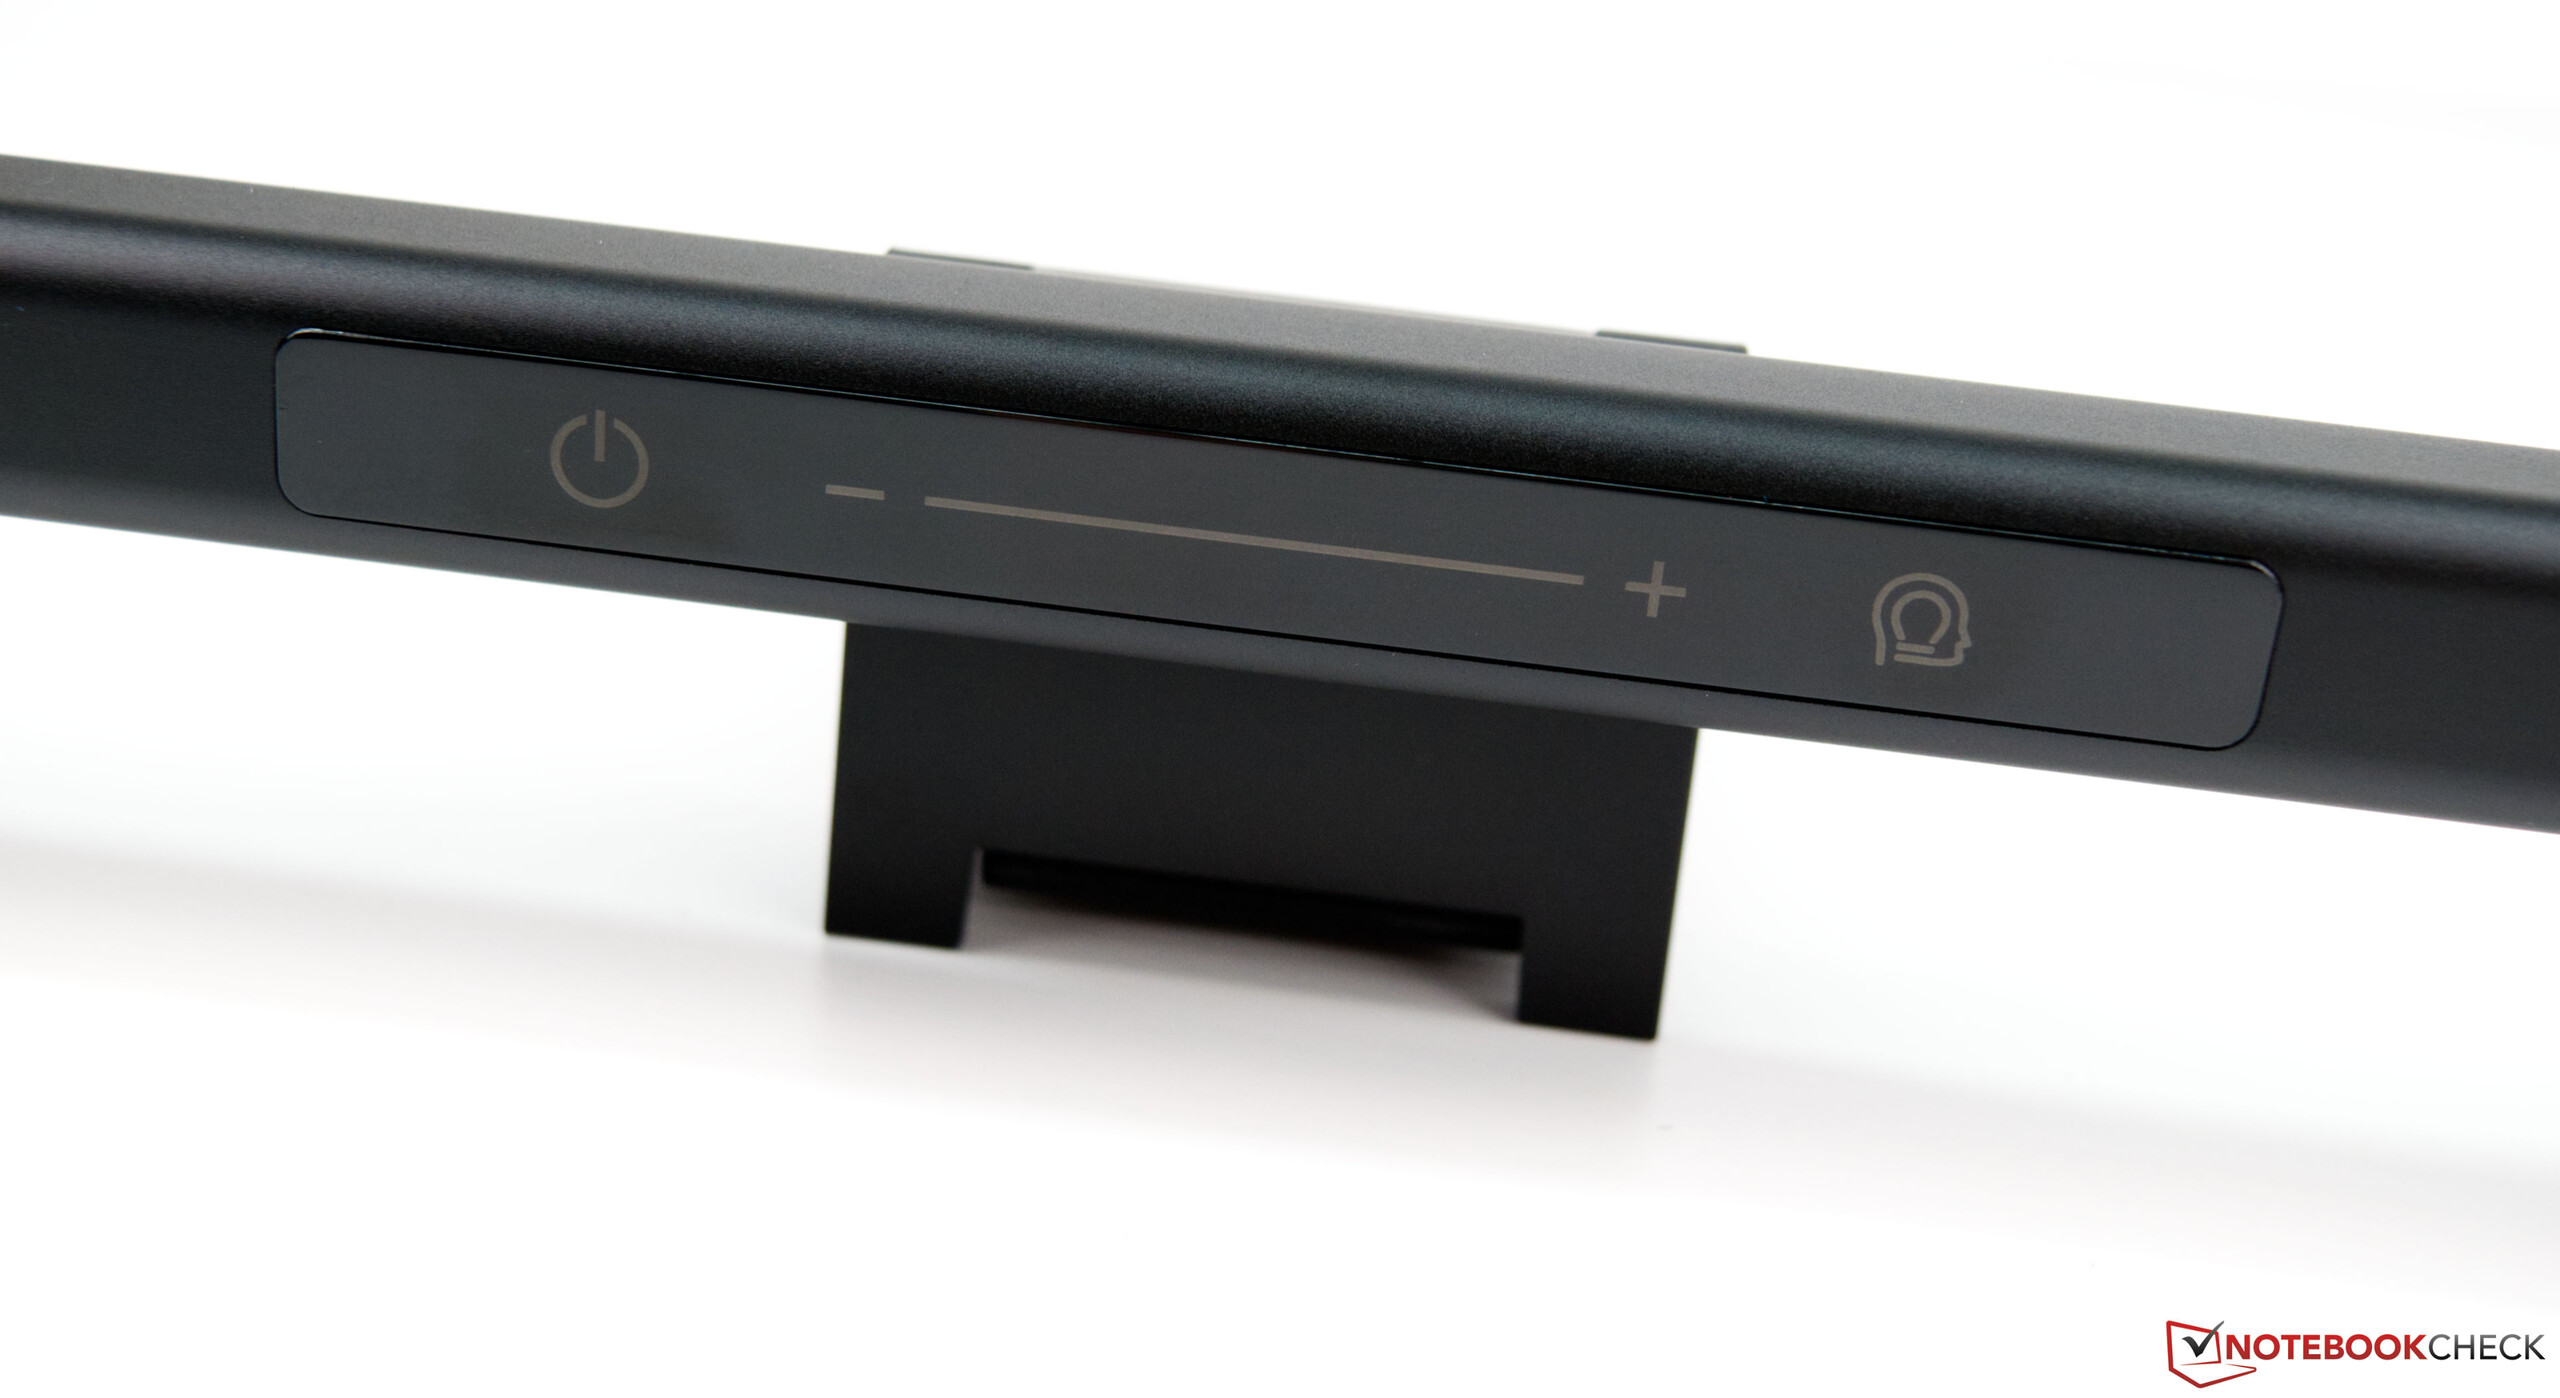
我们可以说,Modern LED Lux Lightbar在测试中以令人愉快的光线说服了我们。工作场所照明良好,即使在完全黑暗的环境中也能很好地工作。在灯光颜色方面,可以选择暖白或冷白。也可以将这两者结合起来。在我们看来,后者提供了最好的选择。同样,现代LED Lux灯条的亮度也可以连续调整。强度和光色可以通过前面的触摸感应表面来选择。
Pros
Cons
结论 - 小型办公电脑,坚实的显示器和有用的灯条
微星Cubi 5 10M是一台小型的办公电脑,但仅此而已。英特尔酷睿i3-10110U作为一个系统芯片,足以满足日常办公和网络浏览。你可以接受工作内存,尽管安装的4GB应该是当今工作电脑的最低限度。8GB的选择并不昂贵,而且可以在短时间内完成。该系统在大容量存储方面的得分更高。在这里,NVMe固态硬盘可以用稳定的性能来说服人。考虑到所安装的组件,一个SATA固态硬盘也可以做到这一点。价格差异可能并不明显。那么为什么不安装更好的产品呢?感谢微星!
微星Cubi 5 M10是一款紧凑型办公电脑。如果你能接受它的弱点,你会得到一台成熟的PC,没有隐藏的额外费用。
从外观上看,该设备相当不显眼,在桌面上有一个很好的形象。然而,人们可以考虑开发一个有点扁平的Cubi 5 10M的版本。英特尔已经在他们的NUC系列中这样做了几年。一个复杂的设计应该仍然能够容纳两个大容量存储设备。它不一定非得是2.5英寸的驱动器。Cubi 5 10M的性能是你根据技术规格所期望的。如果你将Cubi 5 M10直接安装在显示器的VESA支架上,外部启动按钮是一个有用的功能。
微星Cubi 5 10M目前在亚马逊上的售价略低于560欧元(约661美元)。
微星Modern MD271 27英寸显示器在视觉上很现代,提供了良好的设备。测量的亮度高于制造商的规格,这绝对值得称赞。尽管如此,Delta E-2000的颜色偏差在交付状态下太高了。如果显示器要像宣传的那样用于内容创作,你在这里是绕不开校准的。微星现代LED Lux灯条是一个非常有用的功能。它为键盘周围的工作区提供了愉快的照明。而那些在9月底之前购买指定的微星产品的人可以获得它。有关该促销活动的更多信息可以在这里找到https://de.msi.com/Promotion/modern-reddot.
价格和可用性
微星Cubi 5 10M目前在亚马逊上有售。售价630欧元(约合人民币744元)。

