惠普 Pavilion 17z (A12-9720P, Radeon R7 M340) 笔记本电脑简短评测
| SD Card Reader | |
| average JPG Copy Test (av. of 3 runs) | |
| Dell XPS 15 9560 (i7-7700HQ, UHD) | |
| HP Pavilion 17z 1EX13AV | |
| Dell Inspiron 17 5759-5118 | |
| maximum AS SSD Seq Read Test (1GB) | |
| Dell XPS 15 9560 (i7-7700HQ, UHD) | |
| HP Pavilion 17z 1EX13AV | |
| Dell Inspiron 17 5759-5118 | |
| Networking | |
| iperf3 transmit AX12 | |
| Lenovo Ideapad 110-17IKB 80VK0001GE | |
| HP Pavilion 17-x110ng | |
| HP Pavilion 17z 1EX13AV | |
| iperf3 receive AX12 | |
| Lenovo Ideapad 110-17IKB 80VK0001GE | |
| HP Pavilion 17z 1EX13AV | |
| HP Pavilion 17-x110ng | |
| |||||||||||||||||||||||||
Brightness Distribution: 91 %
Center on Battery: 333.5 cd/m²
Contrast: 1042:1 (Black: 0.32 cd/m²)
ΔE ColorChecker Calman: 4 | ∀{0.5-29.43 Ø4.73}
ΔE Greyscale Calman: 4.5 | ∀{0.09-98 Ø4.97}
88.1% sRGB (Argyll 1.6.3 3D)
57.5% AdobeRGB 1998 (Argyll 1.6.3 3D)
64.6% AdobeRGB 1998 (Argyll 3D)
88.5% sRGB (Argyll 3D)
64.3% Display P3 (Argyll 3D)
Gamma: 2.19
CCT: 6386 K
| HP Pavilion 17z 1EX13AV ID: AUO109D, Name: AU Optronics B173HW01 V0, IPS, 17.3", 1920x1080 | HP Pavilion 17-x110ng Chi Mei CMN1738, IPS, WLED, 17.3", 1920x1080 | Lenovo Ideapad 110-17IKB 80VK0001GE AU Optronics B173RTN02.2, TN LED, 17.3", 1600x900 | Asus F756UX-T7013T Chi Mei CMN1735 / N173HGE-E11, TN LED, 17.3", 1920x1080 | Dell Inspiron 17 5759-5118 AU Optronics B173HTN, TN LED, 17.3", 1920x1080 | MSI GL72 7RDX-602 Chi Mei CMN1735 N173HGE-E11, TN LED, 17.3", 1920x1080 | |
|---|---|---|---|---|---|---|
| Display | -2% | -19% | 2% | 4% | 3% | |
| Display P3 Coverage (%) | 64.3 | 63.6 -1% | 51.1 -21% | 63.9 -1% | 69.3 8% | 65.2 1% |
| sRGB Coverage (%) | 88.5 | 86.5 -2% | 73.4 -17% | 93.7 6% | 90.6 2% | 94.3 7% |
| AdobeRGB 1998 Coverage (%) | 64.6 | 63.3 -2% | 52.6 -19% | 64.6 0% | 66.3 3% | 65.6 2% |
| Response Times | -7% | -3% | 9% | -51% | 16% | |
| Response Time Grey 50% / Grey 80% * (ms) | 40.8 ? | 41 ? -0% | 50 ? -23% | 42 ? -3% | 86 ? -111% | 29 ? 29% |
| Response Time Black / White * (ms) | 26.4 ? | 30 ? -14% | 22 ? 17% | 21 ? 20% | 24 ? 9% | 26 ? 2% |
| PWM Frequency (Hz) | 200 ? | 50 ? | 1000 ? | 200 ? | 961 | |
| Screen | -23% | -65% | -17% | -43% | -59% | |
| Brightness middle (cd/m²) | 333.5 | 288 -14% | 231 -31% | 268 -20% | 304 -9% | 299 -10% |
| Brightness (cd/m²) | 323 | 285 -12% | 210 -35% | 255 -21% | 292 -10% | 274 -15% |
| Brightness Distribution (%) | 91 | 88 -3% | 83 -9% | 83 -9% | 84 -8% | 80 -12% |
| Black Level * (cd/m²) | 0.32 | 0.61 -91% | 0.37 -16% | 0.17 47% | 0.37 -16% | 0.25 22% |
| Contrast (:1) | 1042 | 472 -55% | 624 -40% | 1576 51% | 822 -21% | 1196 15% |
| Colorchecker dE 2000 * | 4 | 4.56 -14% | 9.83 -146% | 7.18 -80% | 10.62 -166% | 12.92 -223% |
| Colorchecker dE 2000 max. * | 6.9 | 7.76 -12% | 18.35 -166% | 11.67 -69% | 19.91 -189% | |
| Greyscale dE 2000 * | 4.5 | 4.95 -10% | 12.46 -177% | 7.97 -77% | 11.78 -162% | 13.16 -192% |
| Gamma | 2.19 100% | 2.48 89% | 2.43 91% | 2.34 94% | 2.39 92% | 2.36 93% |
| CCT | 6386 102% | 7669 85% | 13115 50% | 8541 76% | 12997 50% | 15046 43% |
| Color Space (Percent of AdobeRGB 1998) (%) | 57.5 | 48 -17% | 59 3% | 59 3% | 60 4% | |
| Color Space (Percent of sRGB) (%) | 88.1 | 93 6% | 73 -17% | 94 7% | 90 2% | 94 7% |
| Total Average (Program / Settings) | -11% /
-16% | -29% /
-48% | -2% /
-10% | -30% /
-34% | -13% /
-37% |
* ... smaller is better
Display Response Times
| ↔ Response Time Black to White | ||
|---|---|---|
| 26.4 ms ... rise ↗ and fall ↘ combined | ↗ 14 ms rise | 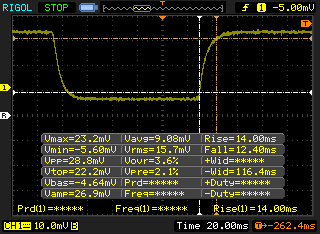 |
| ↘ 12.4 ms fall | ||
| The screen shows relatively slow response rates in our tests and may be too slow for gamers. In comparison, all tested devices range from 0.1 (minimum) to 240 (maximum) ms. » 66 % of all devices are better. This means that the measured response time is worse than the average of all tested devices (19.9 ms). | ||
| ↔ Response Time 50% Grey to 80% Grey | ||
| 40.8 ms ... rise ↗ and fall ↘ combined | ↗ 22 ms rise | 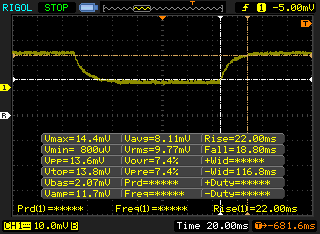 |
| ↘ 18.8 ms fall | ||
| The screen shows slow response rates in our tests and will be unsatisfactory for gamers. In comparison, all tested devices range from 0.165 (minimum) to 636 (maximum) ms. » 64 % of all devices are better. This means that the measured response time is worse than the average of all tested devices (31.1 ms). | ||
Screen Flickering / PWM (Pulse-Width Modulation)
| Screen flickering / PWM not detected | 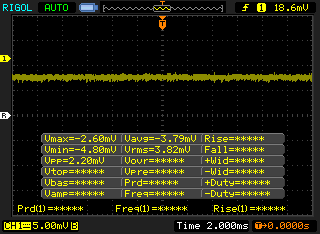 | ||
In comparison: 52 % of all tested devices do not use PWM to dim the display. If PWM was detected, an average of 7798 (minimum: 5 - maximum: 343500) Hz was measured. | |||
| Cinebench R10 | |
| Rendering Multiple CPUs 32Bit | |
| HP Pavilion 17-x110ng | |
| Acer TravelMate P249-M-5452 | |
| HP EliteBook 755 G4 | |
| HP Pavilion 17z 1EX13AV | |
| HP 15-ba077ng | |
| Lenovo Ideapad 110-15ACL 80TJ00H0GE | |
| HP Pavilion 15-aw004ng W8Y60EA | |
| Asus X555LD-XX283H | |
| Asus X555DA-BB11 | |
| Rendering Single 32Bit | |
| HP Pavilion 17-x110ng | |
| Acer TravelMate P249-M-5452 | |
| HP Pavilion 17z 1EX13AV | |
| HP 15-ba077ng | |
| HP EliteBook 755 G4 | |
| HP Pavilion 15-aw004ng W8Y60EA | |
| Asus X555LD-XX283H | |
| Asus X555DA-BB11 | |
| Lenovo Ideapad 110-15ACL 80TJ00H0GE | |
| wPrime 2.10 - 1024m | |
| Lenovo ThinkPad X1 Tablet Gen 2 | |
| HP Pavilion 14t-ab000 K9E07AV | |
| Asus X555DA-BB11 | |
| HP Pavilion 17z 1EX13AV | |
* ... smaller is better
| PCMark 8 - Home Score Accelerated v2 | |
| Asus ASUSPRO B9440UA-GV0101T | |
| Lenovo Ideapad 110-17IKB 80VK0001GE | |
| Dell Inspiron 17 5759-5118 | |
| HP Pavilion 17-x110ng | |
| HP Pavilion 17z 1EX13AV | |
| Lenovo Yoga 510-14AST | |
| HP EliteBook 725 G4 | |
| Lenovo Yoga 3 Pro 13 80HE004LGE | |
| PCMark 8 Home Score Accelerated v2 | 2783 points | |
| PCMark 8 Creative Score Accelerated v2 | 3219 points | |
| PCMark 8 Work Score Accelerated v2 | 3518 points | |
| PCMark 10 Score | 2235 points | |
Help | ||
| HP Pavilion 17z 1EX13AV WDC Scorpio Blue WD10JPVX-60JC3T1 | HP Pavilion 17-x110ng SanDisk Z400s SD8SNAT-256G | Lenovo Ideapad 110-17IKB 80VK0001GE WDC Scorpio Blue WD10JPCX-24UE4T0 | Asus F756UX-T7013T HGST Travelstar 5K1000 HTS541010A9E680 | Dell Inspiron 17 5759-5118 Seagate Momentus SpinPoint M8 ST1000LM024 HN-M101MBB | |
|---|---|---|---|---|---|
| CrystalDiskMark 3.0 | 8313% | 45% | 22% | -9% | |
| Read Seq (MB/s) | 90 | 500 456% | 110.3 23% | 105.8 18% | 91.8 2% |
| Write Seq (MB/s) | 90.3 | 325.1 260% | 109 21% | 105 16% | 84.7 -6% |
| Read 512 (MB/s) | 28.47 | 290.2 919% | 39.19 38% | 33.33 17% | 26.59 -7% |
| Write 512 (MB/s) | 47.07 | 300.3 538% | 52.9 12% | 39.12 -17% | 32.7 -31% |
| Read 4k (MB/s) | 0.31 | 11.24 3526% | 0.45 45% | 0.413 33% | 0.288 -7% |
| Write 4k (MB/s) | 0.3997 | 86 21416% | 1.201 200% | 0.947 137% | 0.638 60% |
| Read 4k QD32 (MB/s) | 1.021 | 145.4 14141% | 1.079 6% | 0.812 -20% | 0.59 -42% |
| Write 4k QD32 (MB/s) | 1.076 | 272.7 25244% | 1.234 15% | 0.968 -10% | 0.642 -40% |

| 3DMark 11 | |
| 1280x720 Performance GPU | |
| Acer Aspire E5-575G-549D | |
| HP Pavilion 17z 1EX13AV | |
| Intel Skull Canyon NUC6i7KYK | |
| Apple MacBook Pro 13 2017 Touchbar i5 | |
| Lenovo Flex 2 Pro-15 | |
| Samsung Notebook 9 NP900X5N-X01US | |
| HP EliteBook 755 G4 | |
| Lenovo IdeaPad 305-15IBD | |
| Lenovo ThinkPad L570 20J80020PB | |
| Acer TravelMate P249-M-5452 | |
| HP 15-bw077ax | |
| Lenovo Ideapad 110-15ACL 80TJ00H0GE | |
| Toshiba Portege Z20t-B-10C | |
| 1280x720 Performance Combined | |
| Acer Aspire E5-575G-549D | |
| Intel Skull Canyon NUC6i7KYK | |
| Apple MacBook Pro 13 2017 Touchbar i5 | |
| Samsung Notebook 9 NP900X5N-X01US | |
| Lenovo Flex 2 Pro-15 | |
| Lenovo ThinkPad L570 20J80020PB | |
| Acer TravelMate P249-M-5452 | |
| Lenovo IdeaPad 305-15IBD | |
| HP Pavilion 17z 1EX13AV | |
| HP EliteBook 755 G4 | |
| Lenovo Ideapad 110-15ACL 80TJ00H0GE | |
| HP 15-bw077ax | |
| Toshiba Portege Z20t-B-10C | |
| 3DMark | |
| 1280x720 Cloud Gate Standard Graphics | |
| Acer Aspire E5-575G-549D | |
| Intel Skull Canyon NUC6i7KYK | |
| Apple MacBook Pro 13 2017 Touchbar i5 | |
| HP Pavilion 17z 1EX13AV | |
| Lenovo ThinkPad L570 20J80020PB | |
| Lenovo Flex 2 Pro-15 | |
| Samsung Notebook 9 NP900X5N-X01US | |
| Acer TravelMate P249-M-5452 | |
| HP EliteBook 755 G4 | |
| Lenovo IdeaPad 305-15IBD | |
| Toshiba Portege Z20t-B-10C | |
| HP 15-bw077ax | |
| 1920x1080 Fire Strike Graphics | |
| Acer Aspire E5-575G-549D | |
| HP Pavilion 17z 1EX13AV | |
| Intel Skull Canyon NUC6i7KYK | |
| Apple MacBook Pro 13 2017 Touchbar i5 | |
| Samsung Notebook 9 NP900X5N-X01US | |
| Lenovo Flex 2 Pro-15 | |
| Lenovo ThinkPad L570 20J80020PB | |
| HP EliteBook 755 G4 | |
| Lenovo IdeaPad 305-15IBD | |
| Acer TravelMate P249-M-5452 | |
| HP 15-bw077ax | |
| Toshiba Portege Z20t-B-10C | |
| 3DMark 11 Performance | 2961 points | |
| 3DMark Ice Storm Standard Score | 41857 points | |
| 3DMark Cloud Gate Standard Score | 5704 points | |
| 3DMark Fire Strike Score | 1407 points | |
Help | ||
| BioShock Infinite - 1366x768 High Preset | |
| Acer Aspire E5-575G-549D | |
| Acer Aspire V17 Nitro VN7-791G-50MV | |
| Samsung Notebook 9 NP900X5N-X01US | |
| Asus X302UV-FN016T | |
| HP Pavilion 17z 1EX13AV | |
| Lenovo ThinkPad X1 Tablet Gen 2 | |
| Dell Latitude 5280 | |
| Toshiba Satellite Pro R50-C-16V | |
| Rise of the Tomb Raider - 1024x768 Lowest Preset | |
| Acer Aspire E5-575G-549D | |
| Samsung Notebook 9 NP900X5N-X01US | |
| HP Pavilion 17z 1EX13AV | |
| Microsoft Surface Pro (2017) i7 | |
| Asus X302UV-FN016T | |
| Dell Latitude 5280 | |
| low | med. | high | ultra | |
|---|---|---|---|---|
| StarCraft II: Heart of the Swarm (2013) | 61 | 35.5 | 21.5 | |
| BioShock Infinite (2013) | 74.5 | 43.5 | 34.1 | 11.8 |
| Metro: Last Light (2013) | 32.6 | 26 | 18.9 | |
| Thief (2014) | 20.3 | |||
| The Witcher 3 (2015) | 19 | |||
| Batman: Arkham Knight (2015) | 19 | |||
| Metal Gear Solid V (2015) | 57 | 40 | 14 | |
| Dota 2 Reborn (2015) | 46 | 38 | 21 | 18 |
| Fallout 4 (2015) | 25.6 | |||
| Rise of the Tomb Raider (2016) | 28.2 | 15 | ||
| Doom (2016) | 20.2 | |||
| Overwatch (2016) | 54.8 | 44.9 | ||
| Prey (2017) | 38.4 | 14.7 |
Noise level
| Idle |
| 30.4 / 30.5 / 30.5 dB(A) |
| Load |
| 41.5 / 48.2 dB(A) |
 | ||
30 dB silent 40 dB(A) audible 50 dB(A) loud |
||
min: | ||
| HP Pavilion 17z 1EX13AV Radeon R7 M340, A12-9720P, WDC Scorpio Blue WD10JPVX-60JC3T1 | HP Pavilion 17-x110ng Radeon R7 M440, i5-7200U, SanDisk Z400s SD8SNAT-256G | Lenovo Ideapad 110-17IKB 80VK0001GE Radeon R5 M430, i5-7200U, WDC Scorpio Blue WD10JPCX-24UE4T0 | Asus F756UX-T7013T GeForce GTX 950M, 6200U, HGST Travelstar 5K1000 HTS541010A9E680 | Dell Inspiron 17 5759-5118 Radeon R5 M335, 6200U, Seagate Momentus SpinPoint M8 ST1000LM024 HN-M101MBB | MSI GL72 7RDX-602 GeForce GTX 1050 Mobile, i7-7700HQ, HGST Travelstar 7K1000 HTS721010A9E630 | |
|---|---|---|---|---|---|---|
| Noise | 3% | 1% | -5% | -6% | -3% | |
| off / environment * (dB) | 28 | 29 -4% | 30.5 -9% | 31.2 -11% | 30.8 -10% | |
| Idle Minimum * (dB) | 30.4 | 31 -2% | 32.5 -7% | 32.4 -7% | 33.9 -12% | 32.4 -7% |
| Idle Average * (dB) | 30.5 | 31 -2% | 32.5 -7% | 32.6 -7% | 33.9 -11% | 32.4 -6% |
| Idle Maximum * (dB) | 30.5 | 31 -2% | 32.5 -7% | 32.6 -7% | 33.9 -11% | 32.8 -8% |
| Load Average * (dB) | 41.5 | 33.8 19% | 34.6 17% | 42 -1% | 43.8 -6% | 40.9 1% |
| Witcher 3 ultra * (dB) | 41.8 | |||||
| Load Maximum * (dB) | 48.2 | 44.8 7% | 38.3 21% | 45.2 6% | 44.2 8% | 43.6 10% |
* ... smaller is better
(±) The maximum temperature on the upper side is 40.8 °C / 105 F, compared to the average of 36.8 °C / 98 F, ranging from 21 to 71 °C for the class Multimedia.
(±) The bottom heats up to a maximum of 41.6 °C / 107 F, compared to the average of 39.1 °C / 102 F
(+) In idle usage, the average temperature for the upper side is 23.3 °C / 74 F, compared to the device average of 31.3 °C / 88 F.
(±) Playing The Witcher 3, the average temperature for the upper side is 33.2 °C / 92 F, compared to the device average of 31.3 °C / 88 F.
(+) The palmrests and touchpad are reaching skin temperature as a maximum (32.8 °C / 91 F) and are therefore not hot.
(-) The average temperature of the palmrest area of similar devices was 28.7 °C / 83.7 F (-4.1 °C / -7.3 F).
HP Pavilion 17z 1EX13AV audio analysis
(-) | not very loud speakers (64.1 dB)
Bass 100 - 315 Hz
(±) | reduced bass - on average 13.7% lower than median
(-) | bass is not linear (16.5% delta to prev. frequency)
Mids 400 - 2000 Hz
(+) | balanced mids - only 3.5% away from median
(-) | mids are not linear (17.3% delta to prev. frequency)
Highs 2 - 16 kHz
(+) | balanced highs - only 4.6% away from median
(-) | highs are not linear (18.5% delta to prev. frequency)
Overall 100 - 16.000 Hz
(±) | linearity of overall sound is average (27.5% difference to median)
Compared to same class
» 93% of all tested devices in this class were better, 2% similar, 5% worse
» The best had a delta of 5%, average was 17%, worst was 45%
Compared to all devices tested
» 84% of all tested devices were better, 3% similar, 13% worse
» The best had a delta of 4%, average was 24%, worst was 134%
Apple MacBook 12 (Early 2016) 1.1 GHz audio analysis
(+) | speakers can play relatively loud (83.6 dB)
Bass 100 - 315 Hz
(±) | reduced bass - on average 11.3% lower than median
(±) | linearity of bass is average (14.2% delta to prev. frequency)
Mids 400 - 2000 Hz
(+) | balanced mids - only 2.4% away from median
(+) | mids are linear (5.5% delta to prev. frequency)
Highs 2 - 16 kHz
(+) | balanced highs - only 2% away from median
(+) | highs are linear (4.5% delta to prev. frequency)
Overall 100 - 16.000 Hz
(+) | overall sound is linear (10.2% difference to median)
Compared to same class
» 7% of all tested devices in this class were better, 2% similar, 91% worse
» The best had a delta of 5%, average was 18%, worst was 53%
Compared to all devices tested
» 5% of all tested devices were better, 1% similar, 94% worse
» The best had a delta of 4%, average was 24%, worst was 134%
| Off / Standby | |
| Idle | |
| Load |
|
Key:
min: | |
| HP Pavilion 17z 1EX13AV A12-9720P, Radeon R7 M340, WDC Scorpio Blue WD10JPVX-60JC3T1, IPS, 1920x1080, 17.3" | HP Pavilion 17-x110ng i5-7200U, Radeon R7 M440, SanDisk Z400s SD8SNAT-256G, IPS, WLED, 1920x1080, 17.3" | Lenovo Ideapad 110-17IKB 80VK0001GE i5-7200U, Radeon R5 M430, WDC Scorpio Blue WD10JPCX-24UE4T0, TN LED, 1600x900, 17.3" | Asus F756UX-T7013T 6200U, GeForce GTX 950M, HGST Travelstar 5K1000 HTS541010A9E680, TN LED, 1920x1080, 17.3" | Dell Inspiron 17 5759-5118 6200U, Radeon R5 M335, Seagate Momentus SpinPoint M8 ST1000LM024 HN-M101MBB, TN LED, 1920x1080, 17.3" | MSI GL72 7RDX-602 i7-7700HQ, GeForce GTX 1050 Mobile, HGST Travelstar 7K1000 HTS721010A9E630, TN LED, 1920x1080, 17.3" | |
|---|---|---|---|---|---|---|
| Power Consumption | 8% | 26% | 5% | 19% | -49% | |
| Idle Minimum * (Watt) | 7.8 | 7.7 1% | 6.9 12% | 5.8 26% | 6.2 21% | 9.6 -23% |
| Idle Average * (Watt) | 11.7 | 14 -20% | 9.6 18% | 11.2 4% | 11.6 1% | 15 -28% |
| Idle Maximum * (Watt) | 15.7 | 15.1 4% | 11.7 25% | 11.9 24% | 12.3 22% | 16.5 -5% |
| Load Average * (Watt) | 57.4 | 33 43% | 29 49% | 54 6% | 36 37% | 104 -81% |
| Witcher 3 ultra * (Watt) | 53.3 | |||||
| Load Maximum * (Watt) | 62.3 | 54.6 12% | 45.4 27% | 84 -35% | 55 12% | 129 -107% |
* ... smaller is better
| HP Pavilion 17z 1EX13AV A12-9720P, Radeon R7 M340, 41.6 Wh | HP Pavilion 17-x110ng i5-7200U, Radeon R7 M440, 41 Wh | Lenovo Ideapad 110-17IKB 80VK0001GE i5-7200U, Radeon R5 M430, 32 Wh | Asus F756UX-T7013T 6200U, GeForce GTX 950M, 38 Wh | Dell Inspiron 17 5759-5118 6200U, Radeon R5 M335, 40 Wh | MSI GL72 7RDX-602 i7-7700HQ, GeForce GTX 1050 Mobile, 43.2 Wh | |
|---|---|---|---|---|---|---|
| Battery runtime | 34% | 5% | 7% | 23% | -25% | |
| Reader / Idle (h) | 6.8 | 8.8 29% | 8.2 21% | 9.6 41% | 5.5 -19% | |
| WiFi v1.3 (h) | 3.9 | 5.8 49% | 4.1 5% | 3.6 -8% | 5 28% | 3.4 -13% |
| Load (h) | 1.2 | 1.5 25% | 1.3 8% | 1.2 0% | 0.7 -42% |
Pros
Cons

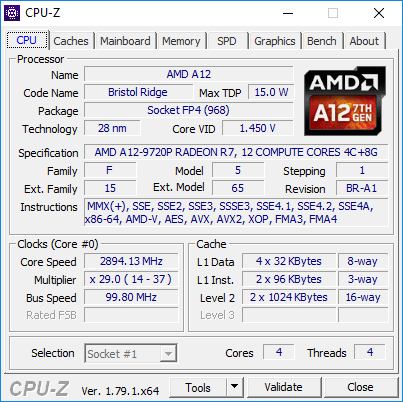
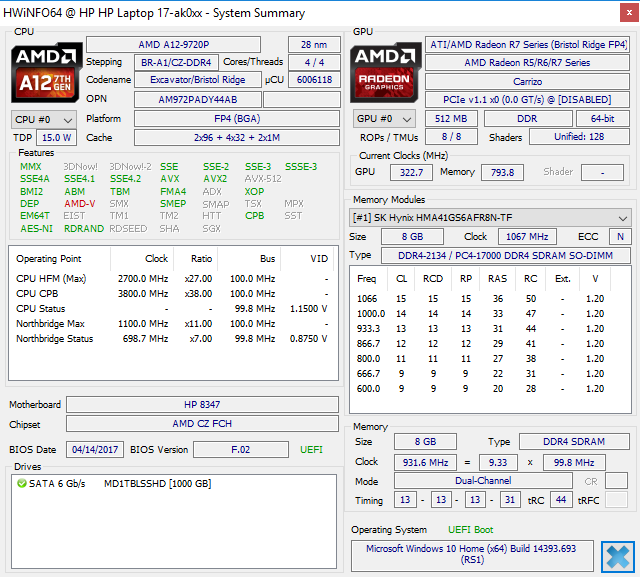
A12-9720P APU是AMD在Ryzen和Zen架构推出前究竟落后多少的有力证据。通常当一颗处理器相比竞争对手更烫更吵时,你会期待它提供更快的速度。而对A12-9720P来说,情况却不是这样,它的发热量更高,噪音更大,但速度却比两代前的酷睿i3-5010U更慢。甚至是对于一个基于机械硬盘的设备来说,程序的载入和安装速度也有些慢得离谱。
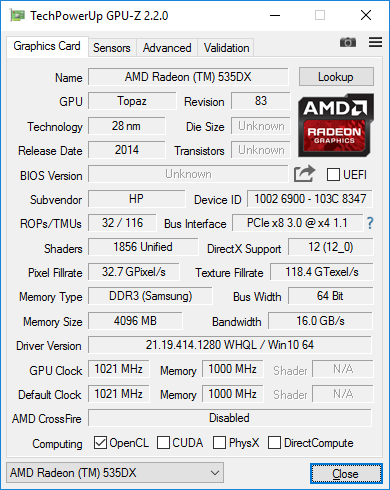
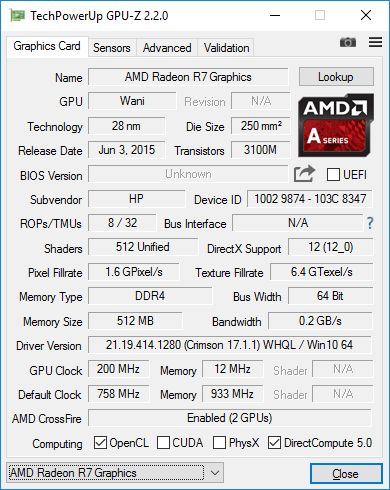
在显卡的方面,Radeon R7 M340的表现不差,由于它的处理性能几乎可以接近GTX 950M。但在实际游戏中,由于搭配速度很慢的处理器,它的表现远远落后于搭配GTX 950M的笔记本电脑。拖累Pavilion 17z与其他实惠型游戏本竞争的处理器甚至让我们怀疑搭配R7 M340究竟是否有必要。一块独立显卡会消耗更多的功率,带来更多发热量,降低电池续航,而无法发挥完全的潜能。遗憾的是,Ryzen处理器笔记本电脑距离正式上市还有一段时间。
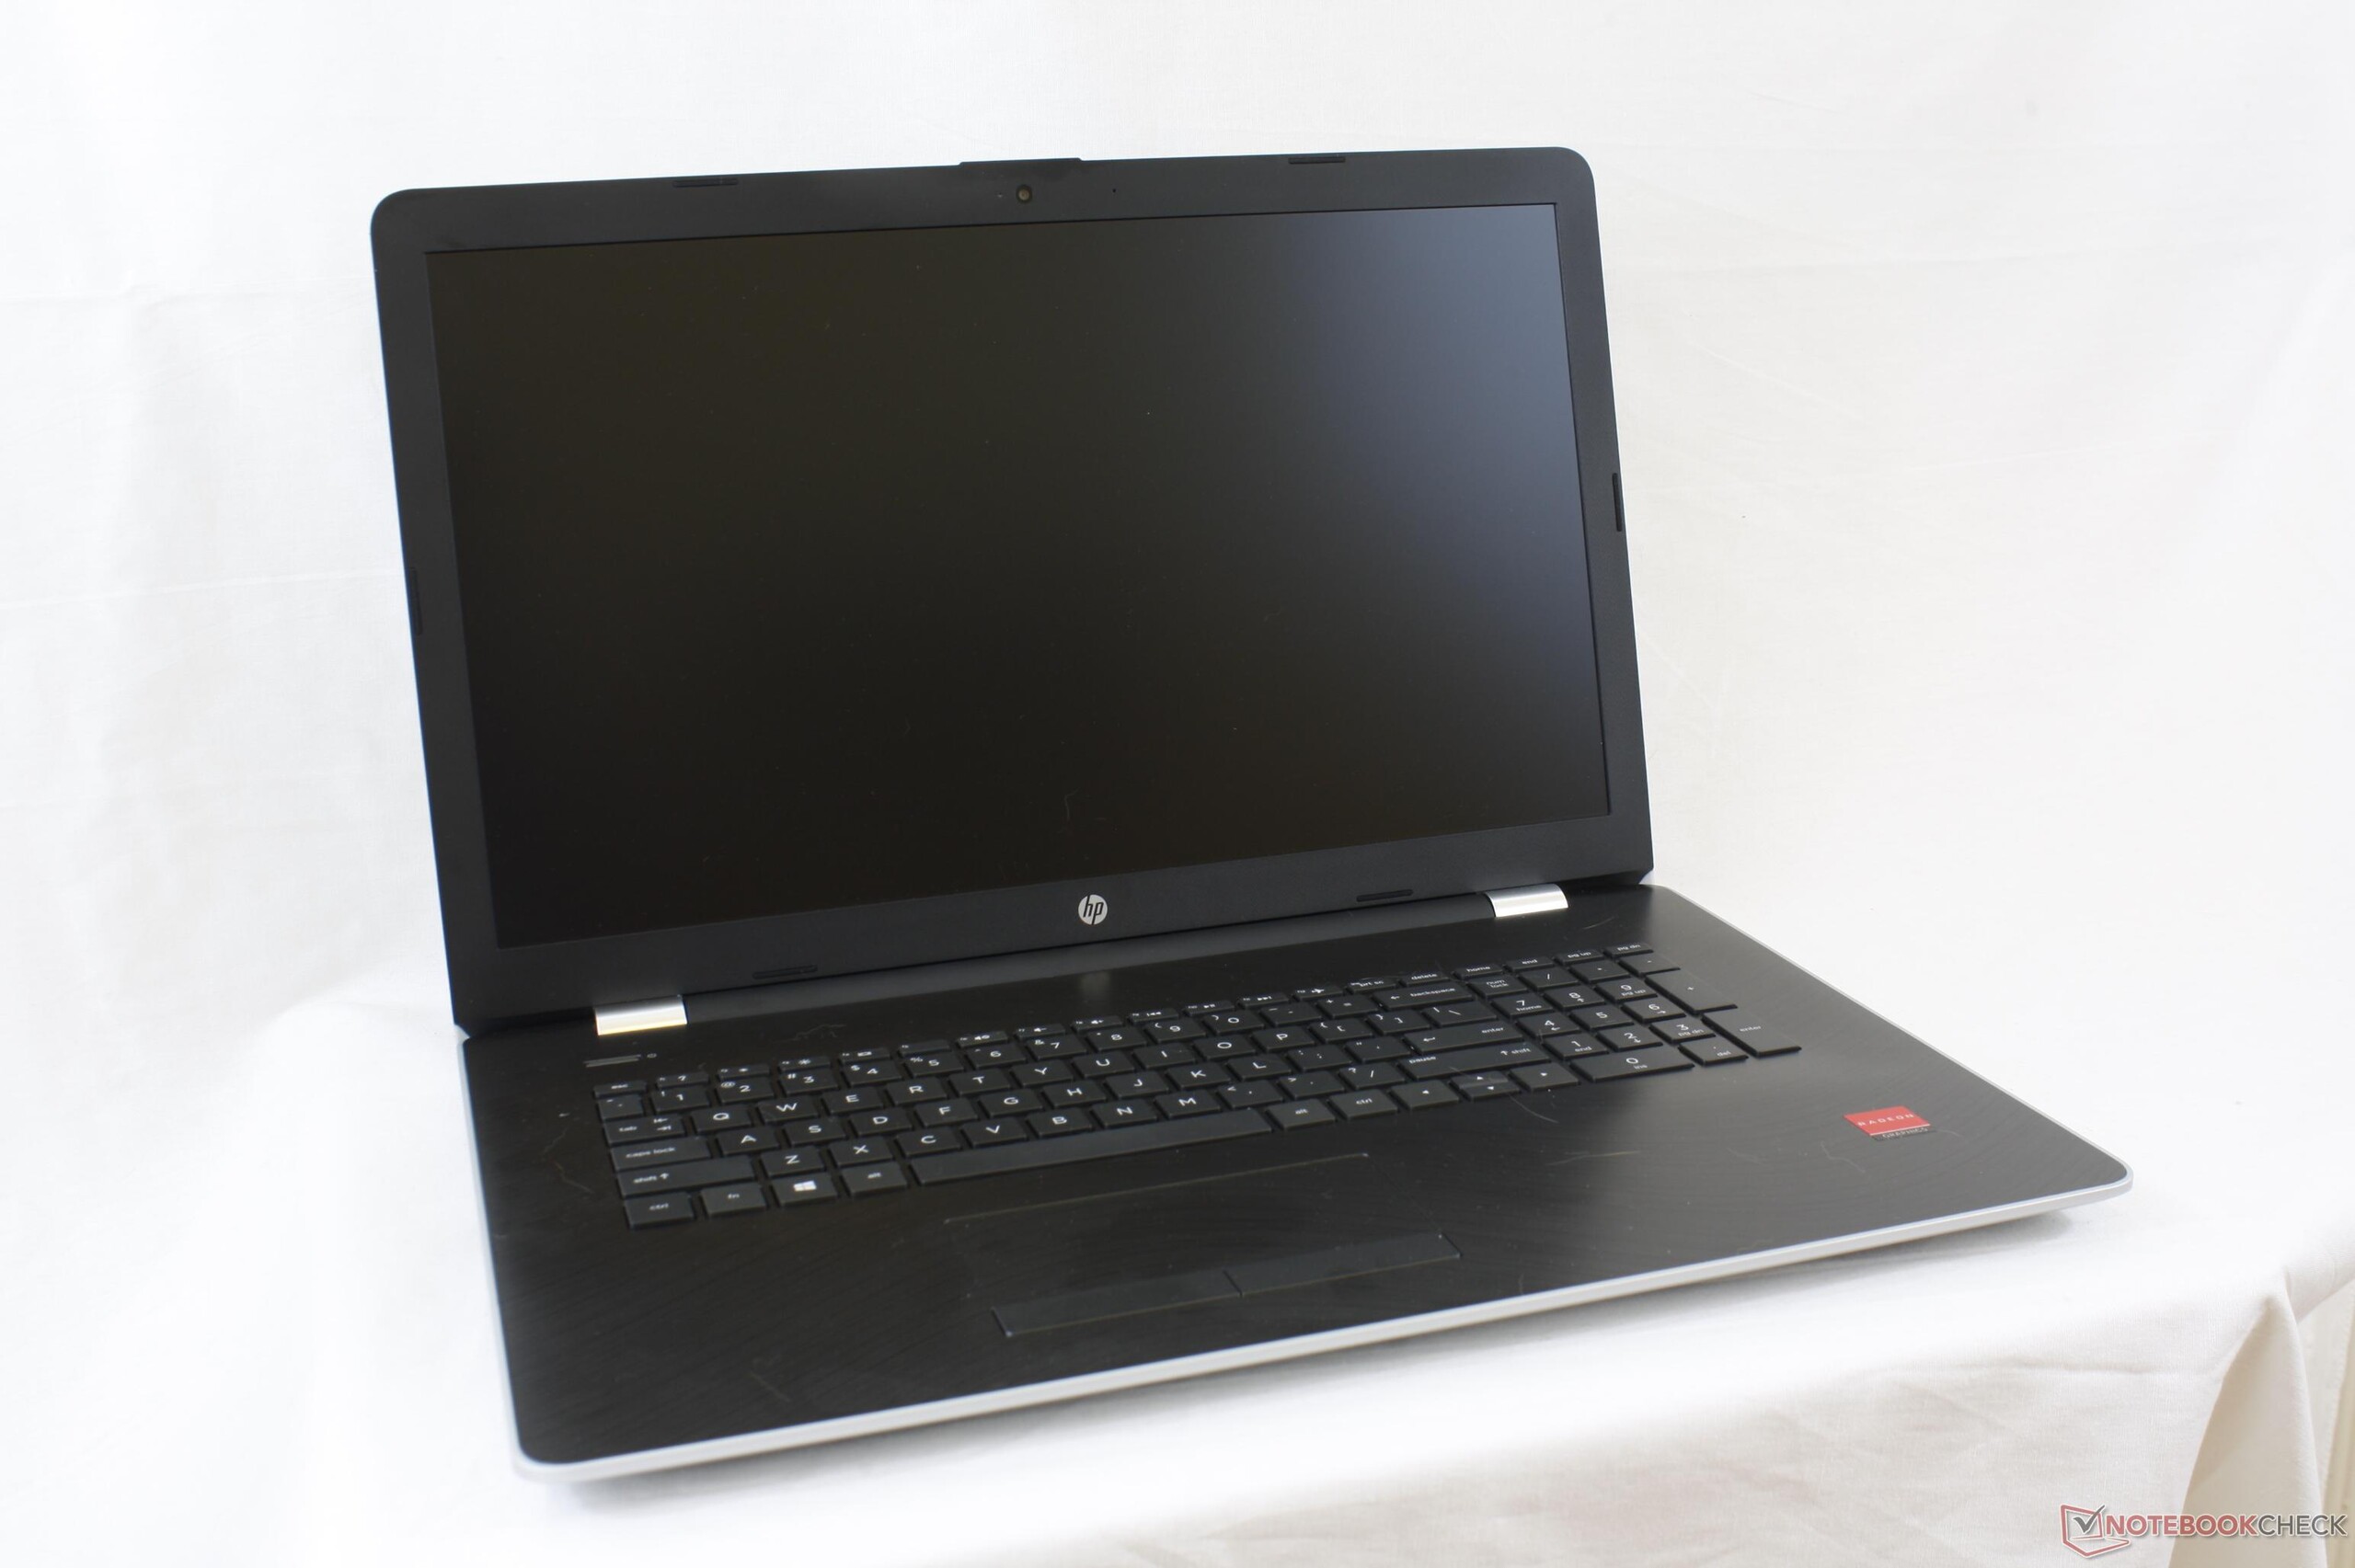
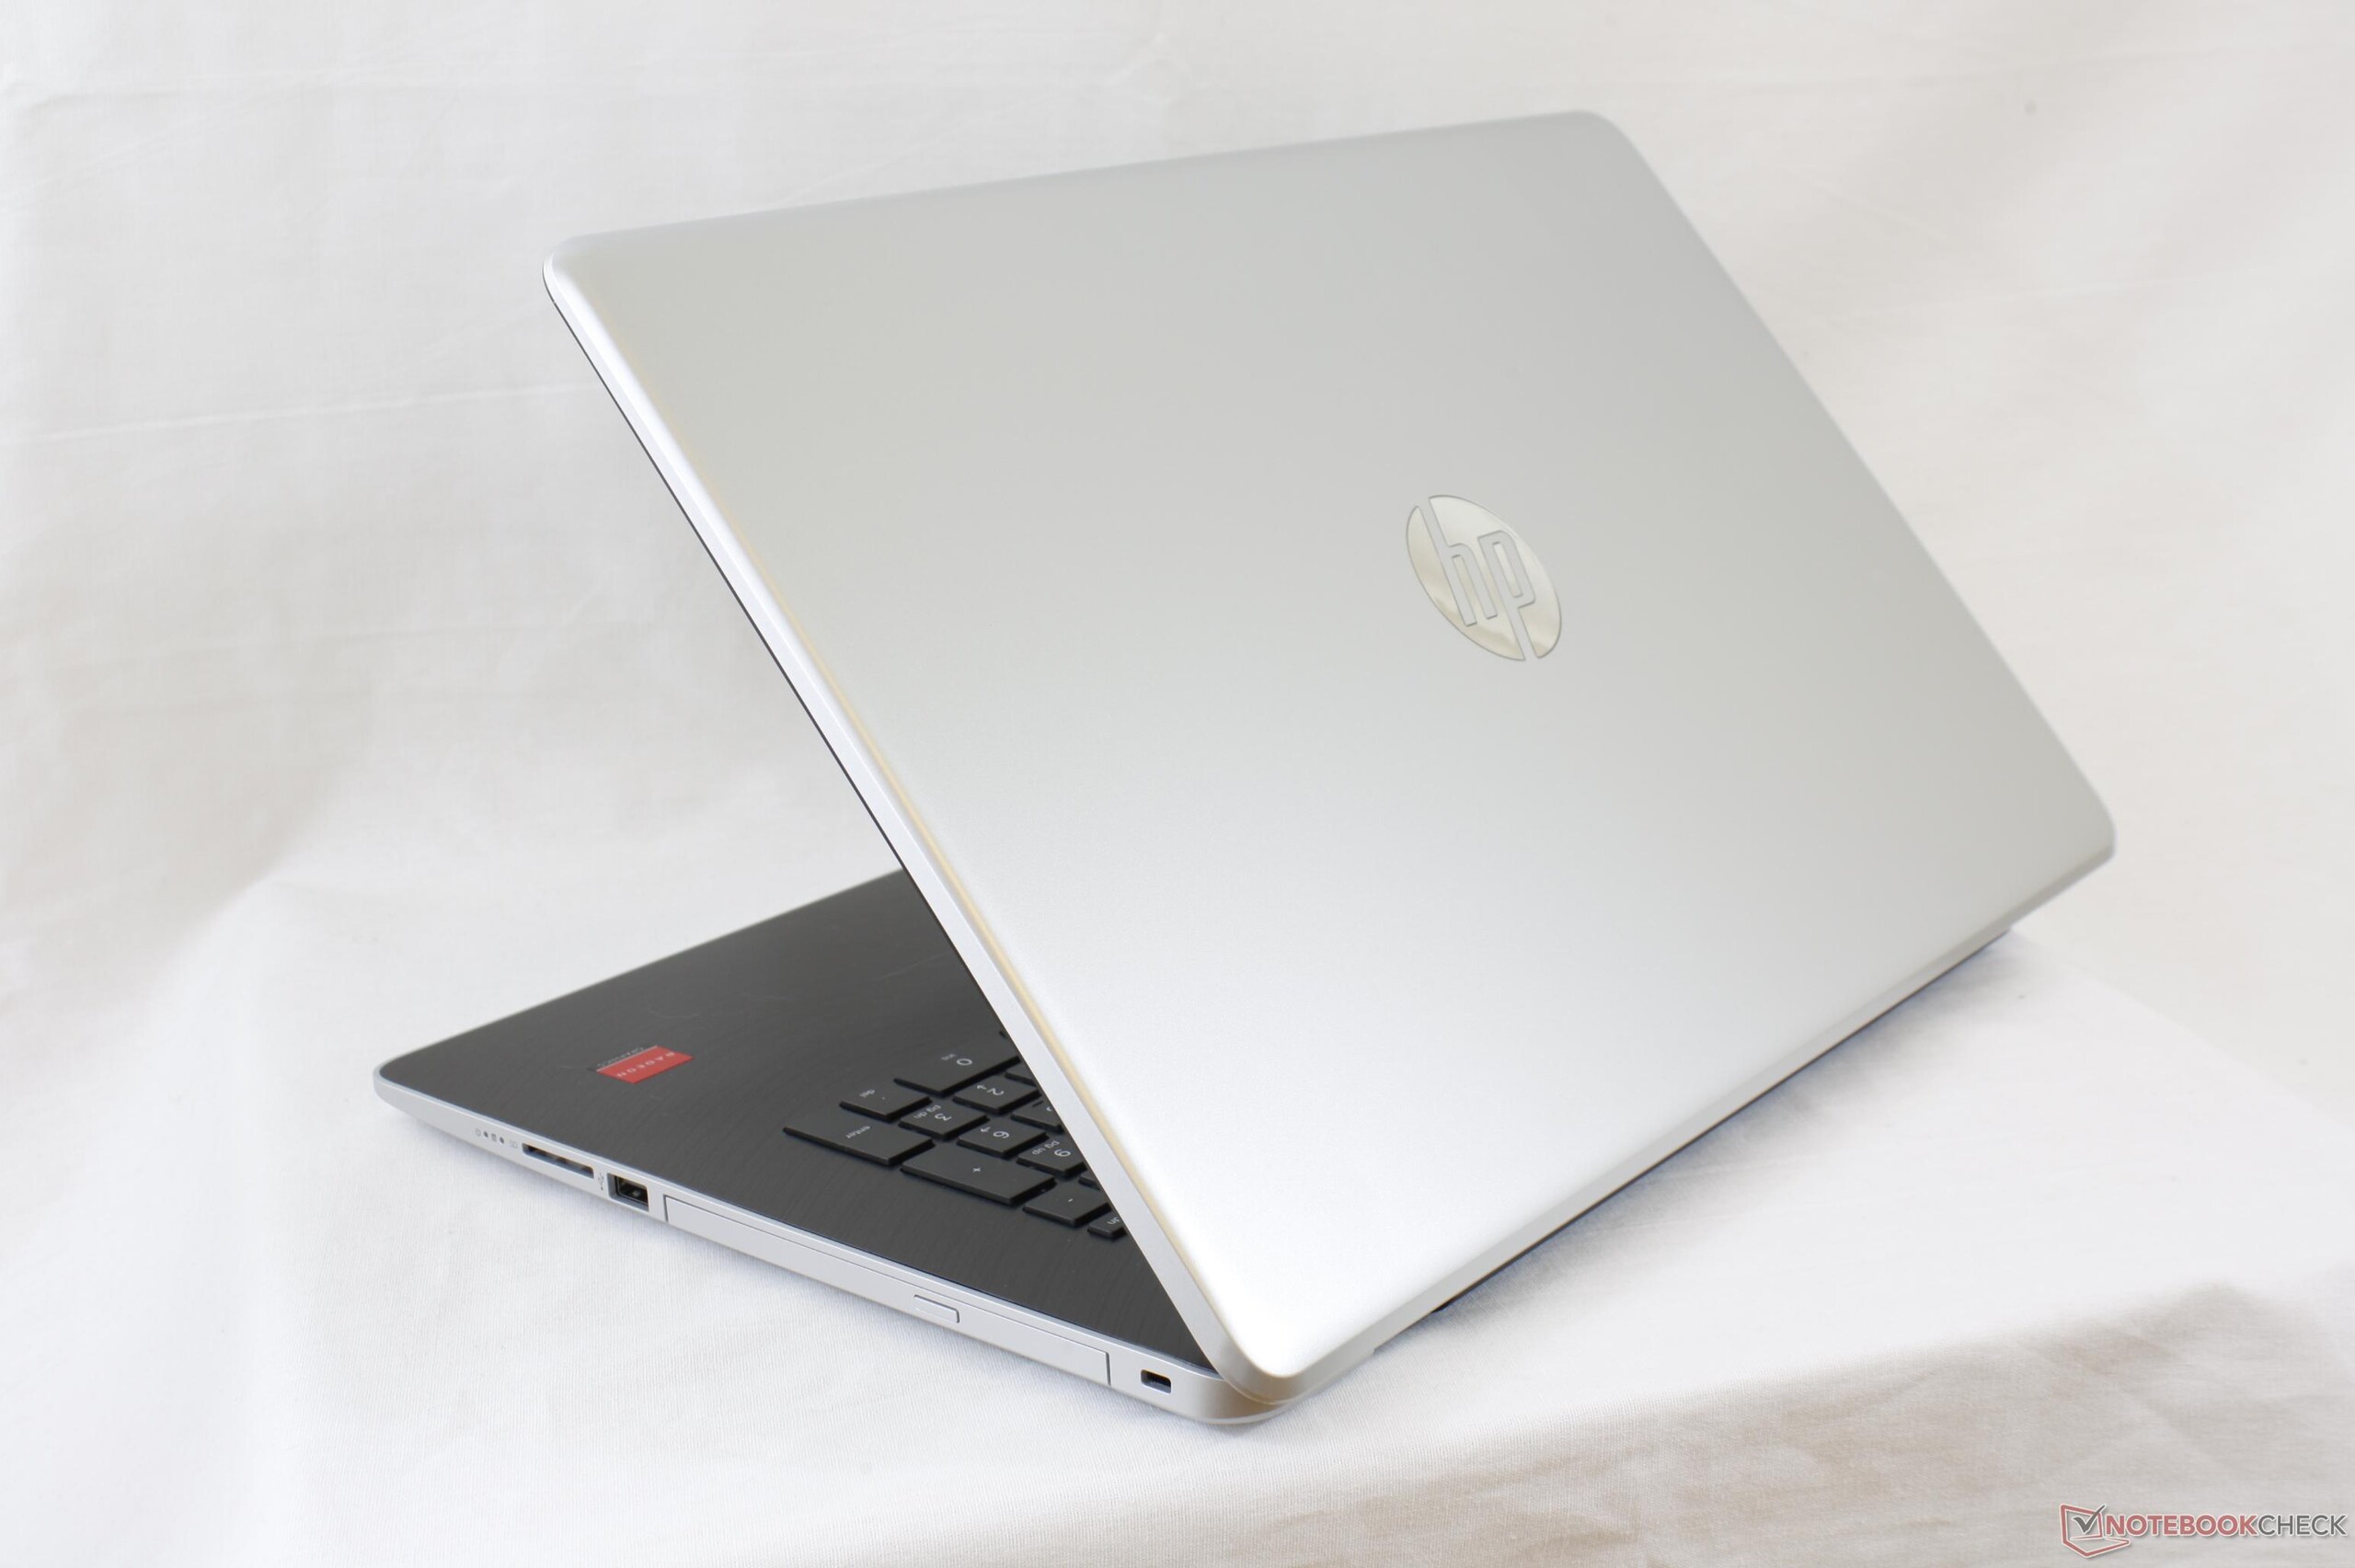
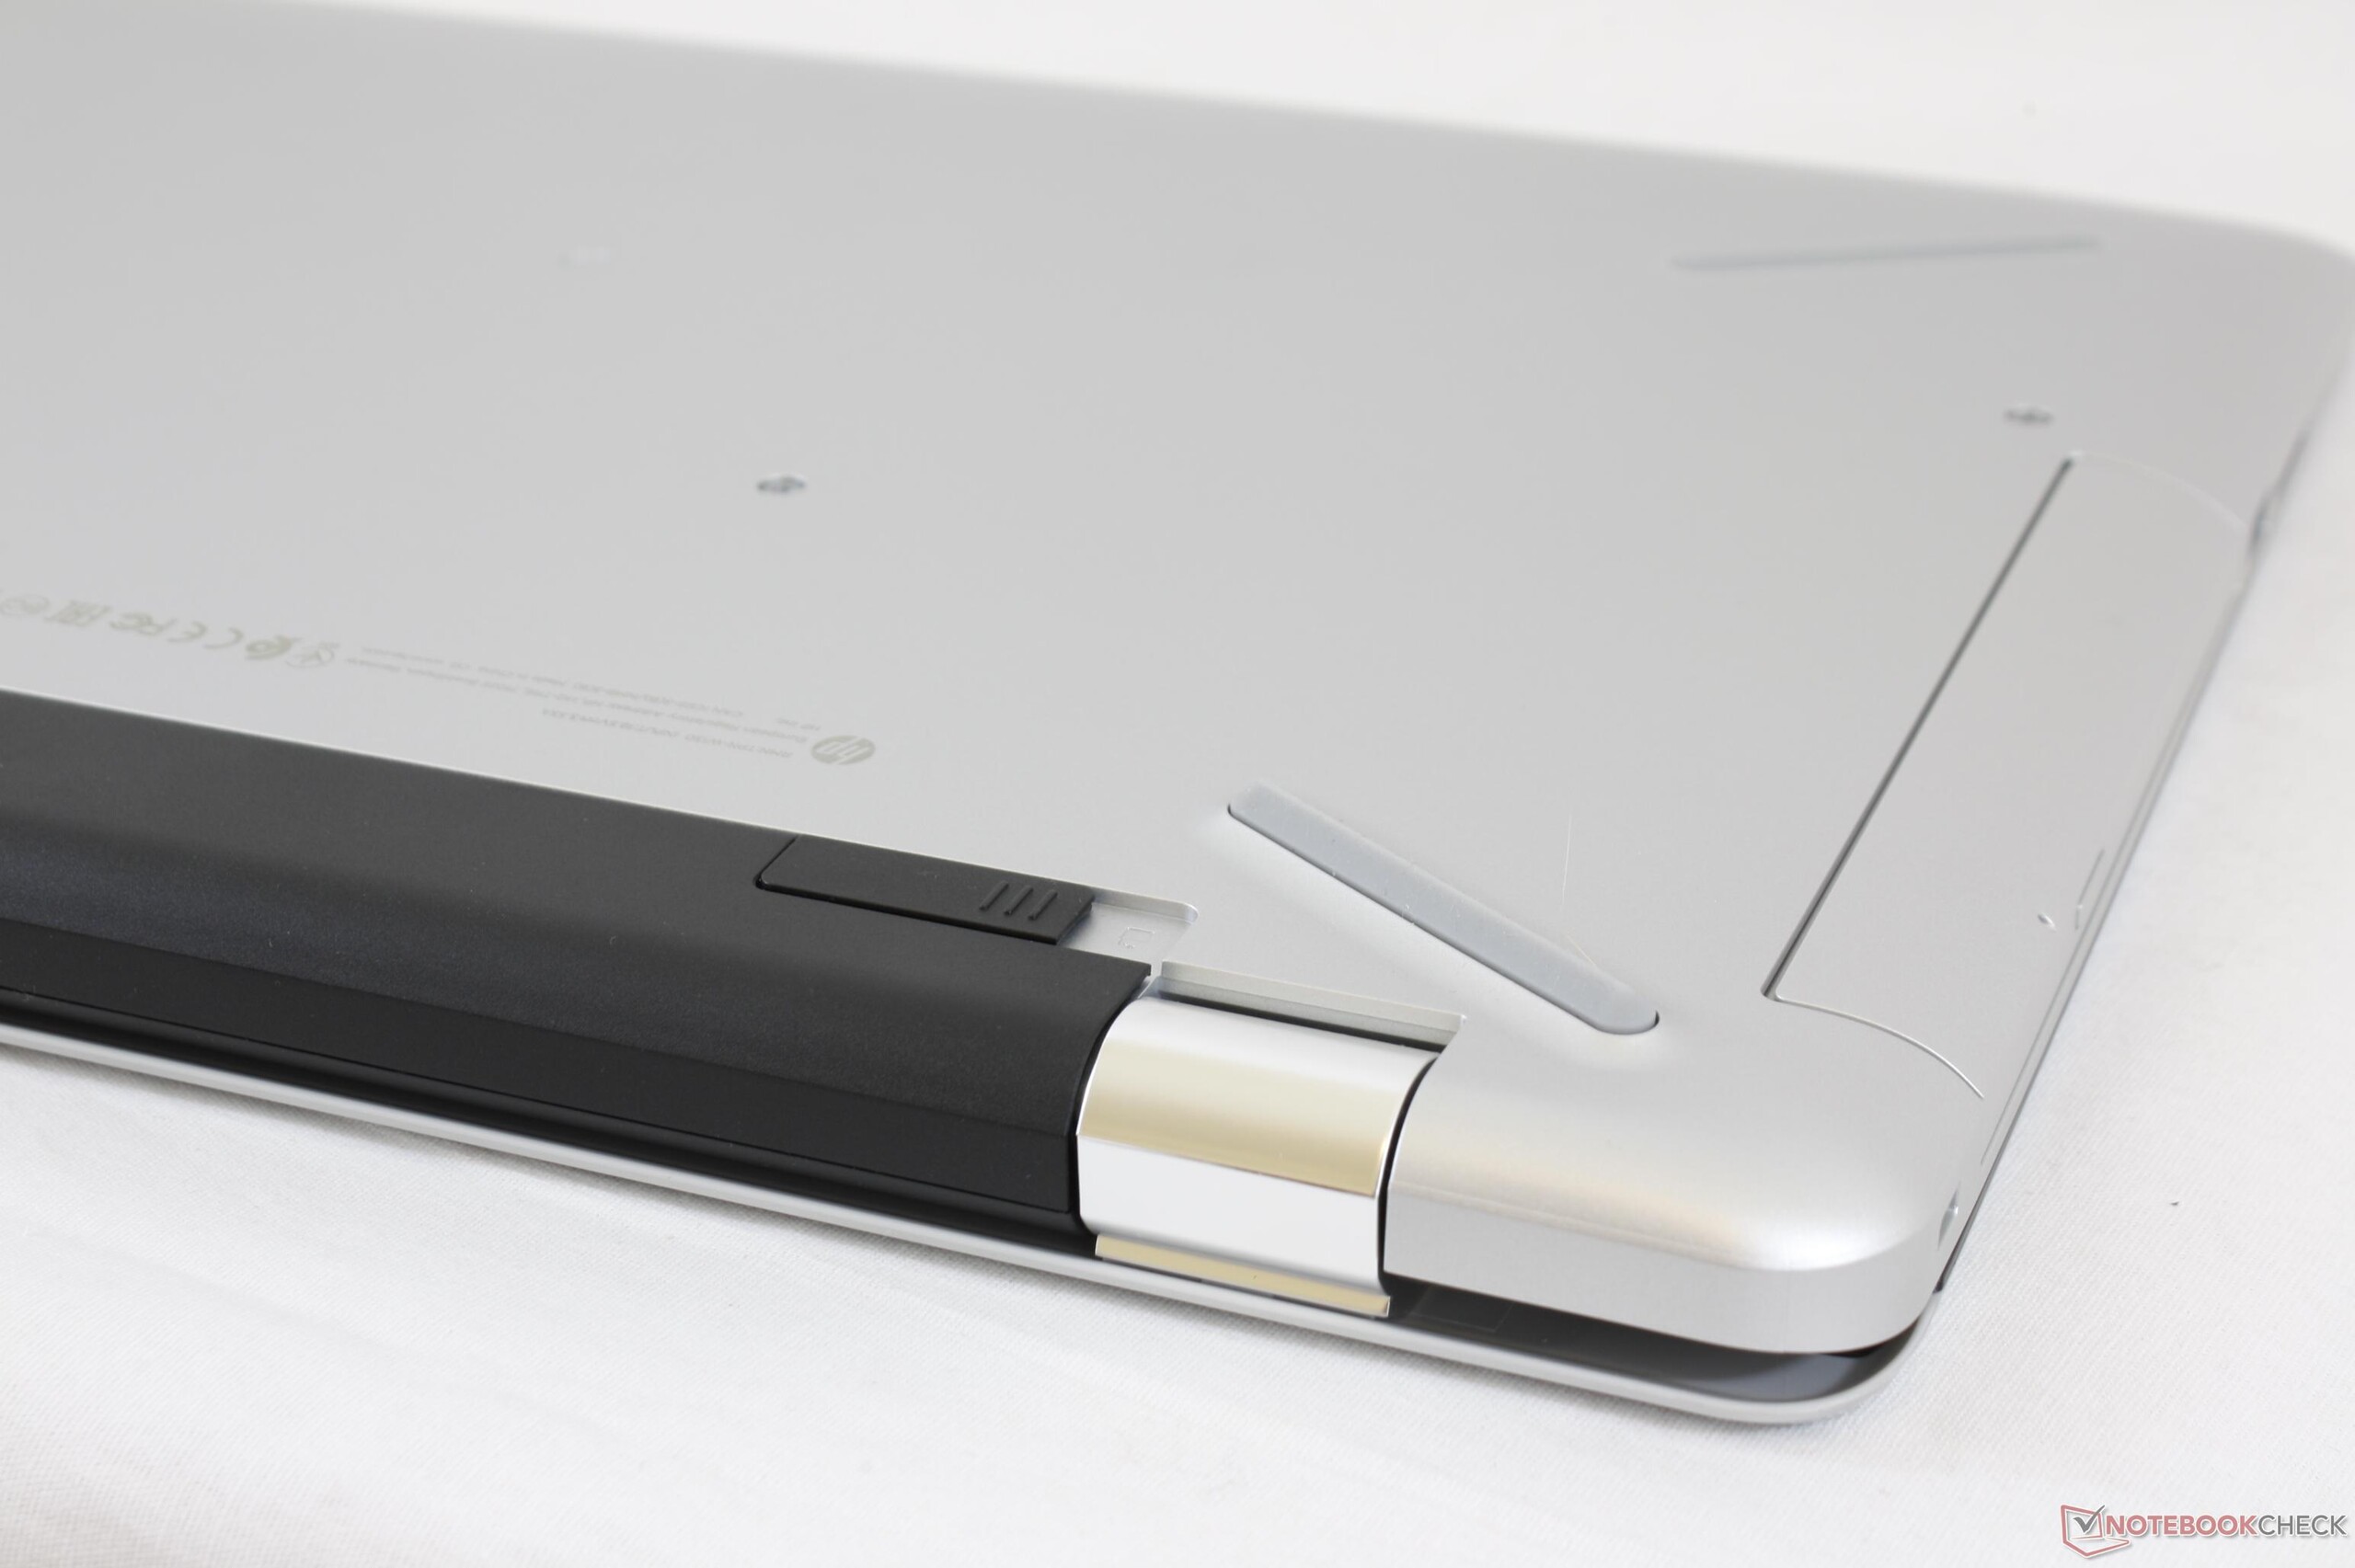
除了对AMD的不满之外,Pavilion 17z的硬件配置可圈可点,特别是考虑到它较低的售价。屏幕的色彩和对比度对于实惠型设备来说都非常优秀,不过颗粒感较强的显示效果和塑料材质机身都让它距离主流设备还有一定距离。
你可以得到物有所值的一台设备。这台搭载AMD平台硬件的Pavilion 17z相比英特尔平台设备明显更便宜,不过在性能和电池续航上付出的代价有些得不偿失。
注:本文是基于完整评测的缩减版本,阅读完整的英文评测,请点击这里。
HP Pavilion 17z 1EX13AV
- 07/14/2017 v6 (old)
Allen Ngo
Price comparison
