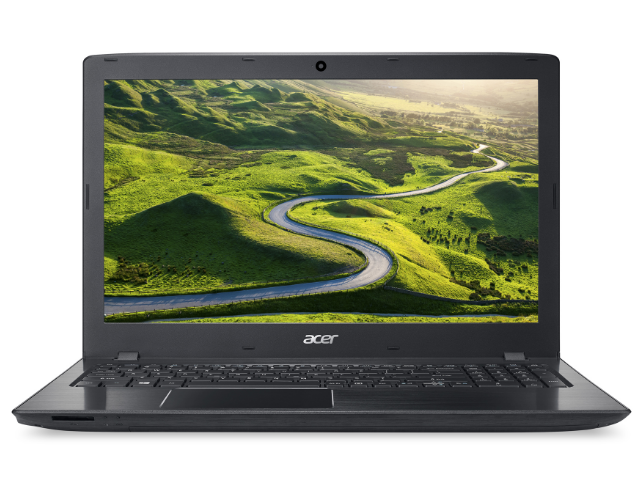
宏碁 Aspire E5-575G (i5-7200U, GTX 950M) 笔记本电脑简短评测
| SD Card Reader | |
| average JPG Copy Test (av. of 3 runs) | |
| HP Pavilion 15 UHD T9Y85AV | |
| Acer Aspire F15 F5-573G-53V1 | |
| Acer Aspire E5-575G-549D | |
| Medion Erazer P6661 MD 99873 | |
| Acer Aspire V5-591G-71K2 | |
| maximum AS SSD Seq Read Test (1GB) | |
| HP Pavilion 15 UHD T9Y85AV | |
| Acer Aspire E5-575G-549D | |
| Medion Erazer P6661 MD 99873 | |
| Acer Aspire V5-591G-71K2 | |
| Networking | |
| iperf Server (receive) TCP 1 m | |
| Acer Aspire E5-575G-549D | |
| iperf Client (transmit) TCP 1 m | |
| Acer Aspire E5-575G-549D | |
| |||||||||||||||||||||||||
Brightness Distribution: 91 %
Center on Battery: 177 cd/m²
Contrast: 374:1 (Black: 0.47 cd/m²)
ΔE ColorChecker Calman: 8.83 | ∀{0.5-29.43 Ø4.72}
ΔE Greyscale Calman: 8.97 | ∀{0.09-98 Ø4.97}
57.3% sRGB (Argyll 1.6.3 3D)
36.8% AdobeRGB 1998 (Argyll 1.6.3 3D)
39.89% AdobeRGB 1998 (Argyll 3D)
57.4% sRGB (Argyll 3D)
38.57% Display P3 (Argyll 3D)
Gamma: 2.43
CCT: 10234 K
| Acer Aspire E5-575G-549D Chi Mei CMN15C4, TN, 1920x1080, 15.6" | Acer Aspire F15 F5-573G-53V1 Innolux N156HGE-EAL, TN WLED, 1920x1080, 15.6" | Acer Aspire V5-591G-71K2 ChiMei N156HGE-EAL, TN LED, 1920x1080, 15.6" | Nexoc M512 III (W650RC) (i7,GTX 950M) CMN15BA, TN, 1920x1080, 15.6" | Medion Erazer P6661 MD 99873 LG LP156WF6-SPK1, AH-IPS, WLED, 1920x1080, 15.6" | |
|---|---|---|---|---|---|
| Display | 100% | 101% | 26% | 2% | |
| Display P3 Coverage (%) | 38.57 | 84.2 118% | 84.9 120% | 48.96 27% | 39.48 2% |
| sRGB Coverage (%) | 57.4 | 99.7 74% | 99.8 74% | 70.9 24% | 59 3% |
| AdobeRGB 1998 Coverage (%) | 39.89 | 82.7 107% | 83.3 109% | 50.3 26% | 40.81 2% |
| Response Times | -5% | -15% | 4% | ||
| Response Time Grey 50% / Grey 80% * (ms) | 39 ? | 44 ? -13% | 44 ? -13% | 36 ? 8% | |
| Response Time Black / White * (ms) | 24 ? | 23 ? 4% | 28 ? -17% | 24 ? -0% | |
| PWM Frequency (Hz) | 1000 ? | 200 ? | 50 ? | ||
| Screen | 13% | 27% | 51% | 22% | |
| Brightness middle (cd/m²) | 176 | 234 33% | 249 41% | 389 121% | 291 65% |
| Brightness (cd/m²) | 169 | 219 30% | 240 42% | 353 109% | 270 60% |
| Brightness Distribution (%) | 91 | 80 -12% | 86 -5% | 83 -9% | 85 -7% |
| Black Level * (cd/m²) | 0.47 | 0.48 -2% | 0.48 -2% | 0.31 34% | 0.38 19% |
| Contrast (:1) | 374 | 488 30% | 519 39% | 1255 236% | 766 105% |
| Colorchecker dE 2000 * | 8.83 | 11.8 -34% | 10.15 -15% | 11.53 -31% | 8.6 3% |
| Colorchecker dE 2000 max. * | 14.01 | 20.69 -48% | 17.39 -24% | ||
| Greyscale dE 2000 * | 8.97 | 13.3 -48% | 12.13 -35% | 13.46 -50% | 8.5 5% |
| Gamma | 2.43 91% | 2.47 89% | 2.48 89% | 2.3 96% | 2.31 95% |
| CCT | 10234 64% | 17098 38% | 13445 48% | 12024 54% | 6184 105% |
| Color Space (Percent of AdobeRGB 1998) (%) | 36.8 | 74 101% | 74 101% | 46 25% | 32 -13% |
| Color Space (Percent of sRGB) (%) | 57.3 | 100 75% | 100 75% | 71 24% | 59 3% |
| Total Average (Program / Settings) | 36% /
28% | 38% /
37% | 39% /
45% | 9% /
15% |
* ... smaller is better
Display Response Times
| ↔ Response Time Black to White | ||
|---|---|---|
| 24 ms ... rise ↗ and fall ↘ combined | ↗ 19 ms rise | |
| ↘ 5 ms fall | ||
| The screen shows good response rates in our tests, but may be too slow for competitive gamers. In comparison, all tested devices range from 0.1 (minimum) to 240 (maximum) ms. » 54 % of all devices are better. This means that the measured response time is worse than the average of all tested devices (19.8 ms). | ||
| ↔ Response Time 50% Grey to 80% Grey | ||
| 39 ms ... rise ↗ and fall ↘ combined | ↗ 21 ms rise | |
| ↘ 18 ms fall | ||
| The screen shows slow response rates in our tests and will be unsatisfactory for gamers. In comparison, all tested devices range from 0.165 (minimum) to 636 (maximum) ms. » 59 % of all devices are better. This means that the measured response time is worse than the average of all tested devices (31 ms). | ||
Screen Flickering / PWM (Pulse-Width Modulation)
| Screen flickering / PWM not detected | ||
In comparison: 52 % of all tested devices do not use PWM to dim the display. If PWM was detected, an average of 7772 (minimum: 5 - maximum: 343500) Hz was measured. | ||
| Cinebench R15 | |
| CPU Single 64Bit | |
| Acer Aspire V5-591G-71K2 | |
| Lenovo ThinkPad T460s-20FA003GGE | |
| Nexoc M512 III (W650RC) (i7,GTX 950M) | |
| Acer Aspire V5-591G-50NC | |
| Medion Erazer P6661 MD 99873 | |
| Acer Aspire E5-575G-549D | |
| Acer Aspire F15 F5-573G-53V1 | |
| HP ProBook 640 G2-T9X60ET | |
| CPU Multi 64Bit | |
| Acer Aspire V5-591G-71K2 | |
| Nexoc M512 III (W650RC) (i7,GTX 950M) | |
| Acer Aspire V5-591G-50NC | |
| Lenovo ThinkPad T460s-20FA003GGE | |
| Acer Aspire E5-575G-549D | |
| Medion Erazer P6661 MD 99873 | |
| Acer Aspire F15 F5-573G-53V1 | |
| HP ProBook 640 G2-T9X60ET | |
| Cinebench R11.5 | |
| CPU Single 64Bit | |
| Nexoc M512 III (W650RC) (i7,GTX 950M) | |
| Acer Aspire V5-591G-71K2 | |
| Lenovo ThinkPad T460s-20FA003GGE | |
| Medion Erazer P6661 MD 99873 | |
| Acer Aspire E5-575G-549D | |
| Acer Aspire V5-591G-50NC | |
| Acer Aspire F15 F5-573G-53V1 | |
| HP ProBook 640 G2-T9X60ET | |
| CPU Multi 64Bit | |
| Acer Aspire V5-591G-71K2 | |
| Nexoc M512 III (W650RC) (i7,GTX 950M) | |
| Acer Aspire V5-591G-50NC | |
| Lenovo ThinkPad T460s-20FA003GGE | |
| Acer Aspire E5-575G-549D | |
| Medion Erazer P6661 MD 99873 | |
| Acer Aspire F15 F5-573G-53V1 | |
| HP ProBook 640 G2-T9X60ET | |
| X264 HD Benchmark 4.0 | |
| Pass 1 | |
| Acer Aspire V5-591G-50NC | |
| Lenovo ThinkPad T460s-20FA003GGE | |
| Acer Aspire E5-575G-549D | |
| HP ProBook 640 G2-T9X60ET | |
| Pass 2 | |
| Acer Aspire V5-591G-50NC | |
| Lenovo ThinkPad T460s-20FA003GGE | |
| Acer Aspire E5-575G-549D | |
| HP ProBook 640 G2-T9X60ET | |
| Acer Aspire E5-575G-549D Toshiba MQ01ABD100 | Medion Erazer P6661 MD 99873 Phison 128GB PS3109-S9 | Acer Aspire F15 F5-573G-53V1 WDC Scorpio Blue WD10JPVX-22JC3T0 | Nexoc M512 III (W650RC) (i7,GTX 950M) Samsung SSD 850 EVO 250GB | Acer Aspire V5-591G-50NC Samsung SSD 850 EVO 250GB | |
|---|---|---|---|---|---|
| CrystalDiskMark 3.0 | 5491% | 29% | 14969% | 15639% | |
| Read Seq (MB/s) | 95.3 | 433.2 355% | 108.1 13% | 503 428% | 509 434% |
| Write Seq (MB/s) | 85.6 | 131.9 54% | 105.6 23% | 302.9 254% | 459.4 437% |
| Read 512 (MB/s) | 29.32 | 250 753% | 35.32 20% | 424.5 1348% | 413.8 1311% |
| Write 512 (MB/s) | 25.93 | 90.6 249% | 46.13 78% | 302.2 1065% | 383.6 1379% |
| Read 4k (MB/s) | 0.366 | 30.69 8285% | 0.413 13% | 33.57 9072% | 45.35 12291% |
| Write 4k (MB/s) | 0.726 | 51.2 6952% | 0.9 24% | 90.6 12379% | 100.1 13688% |
| Read 4k QD32 (MB/s) | 0.647 | 112.2 17242% | 0.895 38% | 353.7 54568% | 356.1 54939% |
| Write 4k QD32 (MB/s) | 0.722 | 73.2 10039% | 0.884 22% | 294.1 40634% | 294.1 40634% |

| PCMark 8 | |
| Home Score Accelerated v2 | |
| Acer Aspire F15 F5-573G-53V1 | |
| Medion Erazer P6661 MD 99873 | |
| Acer Aspire E5-575G-549D | |
| Work Score Accelerated v2 | |
| Medion Erazer P6661 MD 99873 | |
| Acer Aspire E5-575G-549D | |
| Acer Aspire F15 F5-573G-53V1 | |
| PCMark 8 Home Score Accelerated v2 | 3162 points | |
| PCMark 8 Creative Score Accelerated v2 | 3696 points | |
| PCMark 8 Work Score Accelerated v2 | 4047 points | |
Help | ||
| 3DMark 11 - 1280x720 Performance GPU | |
| HP Pavilion 15 UHD T9Y85AV | |
| Acer Aspire V5-591G-71K2 | |
| Medion Erazer P6661 MD 99873 | |
| Acer Aspire E5-575G-549D | |
| Acer Aspire F15 F5-573G-53V1 | |
| Acer Aspire V 15 Nitro VN7-572G-54YG | |
| 3DMark | |
| 1280x720 Cloud Gate Standard Graphics | |
| HP Pavilion 15 UHD T9Y85AV | |
| Acer Aspire E5-575G-549D | |
| Acer Aspire V5-591G-71K2 | |
| Acer Aspire F15 F5-573G-53V1 | |
| Medion Erazer P6661 MD 99873 | |
| Acer Aspire V 15 Nitro VN7-572G-54YG | |
| 1920x1080 Fire Strike Graphics | |
| HP Pavilion 15 UHD T9Y85AV | |
| Acer Aspire E5-575G-549D | |
| Acer Aspire F15 F5-573G-53V1 | |
| Acer Aspire V5-591G-71K2 | |
| Medion Erazer P6661 MD 99873 | |
| Acer Aspire V 15 Nitro VN7-572G-54YG | |
| 3DMark 06 Standard Score | 18647 points | |
| 3DMark 11 Performance | 4212 points | |
| 3DMark Ice Storm Standard Score | 45360 points | |
| 3DMark Cloud Gate Standard Score | 9392 points | |
| 3DMark Fire Strike Score | 3218 points | |
| 3DMark Fire Strike Extreme Score | 1614 points | |
Help | ||
| Rise of the Tomb Raider | |
| 1366x768 Medium Preset AF:2x | |
| Acer Aspire F15 F5-573G-53V1 | |
| Acer Aspire E5-575G-549D | |
| Medion Erazer P6661 MD 99873 | |
| Toshiba Satellite P50-C-188 | |
| 1920x1080 High Preset AA:FX AF:4x | |
| HP Pavilion 15 UHD T9Y85AV | |
| Acer Aspire F15 F5-573G-53V1 | |
| Acer Aspire E5-575G-549D | |
| Medion Erazer P6661 MD 99873 | |
| Toshiba Satellite P50-C-188 | |
| BioShock Infinite | |
| 1366x768 High Preset | |
| HP Pavilion 15 UHD T9Y85AV | |
| Acer Aspire V5-591G-50NC | |
| Acer Aspire E5-575G-549D | |
| Acer Aspire F15 F5-573G-53V1 | |
| Medion Erazer P6661 MD 99873 | |
| 1920x1080 Ultra Preset, DX11 (DDOF) | |
| HP Pavilion 15 UHD T9Y85AV | |
| Acer Aspire F15 F5-573G-53V1 | |
| Acer Aspire E5-575G-549D | |
| Medion Erazer P6661 MD 99873 | |
| Battlefield 4 | |
| 1366x768 High Preset | |
| Acer Aspire F15 F5-573G-53V1 | |
| Acer Aspire E5-575G-549D | |
| Medion Erazer P6661 MD 99873 | |
| 1920x1080 Ultra Preset AA:4x MS | |
| Acer Aspire F15 F5-573G-53V1 | |
| Acer Aspire E5-575G-549D | |
| Medion Erazer P6661 MD 99873 | |
| low | med. | high | ultra | |
|---|---|---|---|---|
| BioShock Infinite (2013) | 126.8 | 96.8 | 86.7 | 35 |
| Battlefield 4 (2013) | 109.7 | 78.6 | 61 | 26.9 |
| Dirt Rally (2015) | 144.1 | 79.3 | 45.2 | 24.6 |
| Assassin's Creed Syndicate (2015) | 33.8 | 30.6 | 18.4 | |
| Rise of the Tomb Raider (2016) | 45.2 | 31.6 | 18.8 | 16.9 |
| The Division (2016) | 63.8 | 41.5 | 20.4 | 15.4 |
| Hitman 2016 (2016) | 34.6 | 34.1 | 11.6 | |
| Overwatch (2016) | 152.7 | 107.4 | 71.5 | 32.8 |
| Mirror's Edge Catalyst (2016) | 69.3 | 51.6 | 23.6 | 18.3 |
| No Man's Sky (2016) | 35.6 | 29.4 | 18.2 | |
| Deus Ex Mankind Divided (2016) | 30.9 | 24.5 | 14.2 |
Noise level
| Idle |
| 30.8 / 30.8 / 30.8 dB(A) |
| HDD |
| 31.2 dB(A) |
| Load |
| 33.4 / 40.1 dB(A) |
 | ||
30 dB silent 40 dB(A) audible 50 dB(A) loud |
||
min: | ||
(-) The maximum temperature on the upper side is 48.1 °C / 119 F, compared to the average of 36.8 °C / 98 F, ranging from 21 to 71 °C for the class Multimedia.
(-) The bottom heats up to a maximum of 60.8 °C / 141 F, compared to the average of 39.1 °C / 102 F
(+) In idle usage, the average temperature for the upper side is 29.8 °C / 86 F, compared to the device average of 31.3 °C / 88 F.
(-) The palmrests and touchpad can get very hot to the touch with a maximum of 41.8 °C / 107.2 F.
(-) The average temperature of the palmrest area of similar devices was 28.7 °C / 83.7 F (-13.1 °C / -23.5 F).
Acer Aspire E5-575G-549D audio analysis
(±) | speaker loudness is average but good (80.2 dB)
Bass 100 - 315 Hz
(-) | nearly no bass - on average 17.8% lower than median
(-) | bass is not linear (16.6% delta to prev. frequency)
Mids 400 - 2000 Hz
(+) | balanced mids - only 4.7% away from median
(±) | linearity of mids is average (10.8% delta to prev. frequency)
Highs 2 - 16 kHz
(+) | balanced highs - only 2.7% away from median
(+) | highs are linear (6.5% delta to prev. frequency)
Overall 100 - 16.000 Hz
(±) | linearity of overall sound is average (25.1% difference to median)
Compared to same class
» 89% of all tested devices in this class were better, 3% similar, 8% worse
» The best had a delta of 5%, average was 17%, worst was 45%
Compared to all devices tested
» 77% of all tested devices were better, 5% similar, 18% worse
» The best had a delta of 4%, average was 24%, worst was 134%
Apple MacBook 12 (Early 2016) 1.1 GHz audio analysis
(+) | speakers can play relatively loud (83.6 dB)
Bass 100 - 315 Hz
(±) | reduced bass - on average 11.3% lower than median
(±) | linearity of bass is average (14.2% delta to prev. frequency)
Mids 400 - 2000 Hz
(+) | balanced mids - only 2.4% away from median
(+) | mids are linear (5.5% delta to prev. frequency)
Highs 2 - 16 kHz
(+) | balanced highs - only 2% away from median
(+) | highs are linear (4.5% delta to prev. frequency)
Overall 100 - 16.000 Hz
(+) | overall sound is linear (10.2% difference to median)
Compared to same class
» 7% of all tested devices in this class were better, 2% similar, 91% worse
» The best had a delta of 5%, average was 18%, worst was 53%
Compared to all devices tested
» 5% of all tested devices were better, 1% similar, 94% worse
» The best had a delta of 4%, average was 24%, worst was 134%
| Off / Standby | |
| Idle | |
| Load |
|
Key:
min: | |
| Acer Aspire E5-575G-549D i5-7200U, GeForce GTX 950M, Toshiba MQ01ABD100, TN, 1920x1080, 15.6" | Acer Aspire F15 F5-573G-53V1 6200U, GeForce GTX 950M, WDC Scorpio Blue WD10JPVX-22JC3T0, TN WLED, 1920x1080, 15.6" | Medion Erazer P6661 MD 99873 6500U, GeForce GTX 950M, Phison 128GB PS3109-S9, AH-IPS, WLED, 1920x1080, 15.6" | Nexoc M512 III (W650RC) (i7,GTX 950M) 6700HQ, GeForce GTX 950M, Samsung SSD 850 EVO 250GB, TN, 1920x1080, 15.6" | Toshiba Satellite P50-C-188 6200U, GeForce GTX 950M, Toshiba MQ01ABD100, IPS, 1920x1080, 15.6" | |
|---|---|---|---|---|---|
| Power Consumption | -27% | -40% | -65% | -5% | |
| Idle Minimum * (Watt) | 6 | 8.3 -38% | 8.7 -45% | 10.2 -70% | 5.6 7% |
| Idle Average * (Watt) | 8.1 | 12.1 -49% | 14.5 -79% | 15.6 -93% | 10.9 -35% |
| Idle Maximum * (Watt) | 9.8 | 15.4 -57% | 15.6 -59% | 17 -73% | 10.6 -8% |
| Load Average * (Watt) | 52.5 | 56 -7% | 61 -16% | 79 -50% | 61 -16% |
| Load Maximum * (Watt) | 81.6 | 70 14% | 82 -0% | 115.2 -41% | 60 26% |
* ... smaller is better
| Acer Aspire E5-575G-549D i5-7200U, GeForce GTX 950M, 62 Wh | Acer Aspire F15 F5-573G-53V1 6200U, GeForce GTX 950M, 62 Wh | Medion Erazer P6661 MD 99873 6500U, GeForce GTX 950M, 44 Wh | Nexoc M512 III (W650RC) (i7,GTX 950M) 6700HQ, GeForce GTX 950M, 62 Wh | Acer Aspire V5-591G-71K2 6700HQ, GeForce GTX 950M, 56 Wh | Toshiba Satellite P50-C-188 6200U, GeForce GTX 950M, 45 Wh | |
|---|---|---|---|---|---|---|
| Battery runtime | 9% | -33% | -40% | -15% | -20% | |
| Reader / Idle (h) | 12.8 | 11.1 -13% | 8.7 -32% | 11.9 -7% | 8.9 -30% | |
| H.264 (h) | 7.7 | 5.6 -27% | 1.9 -75% | 4 -48% | 5.1 -34% | |
| WiFi v1.3 (h) | 7.5 | 6.4 -15% | 3.8 -49% | 4.5 -40% | 4.3 -43% | 5.1 -32% |
| Load (h) | 1.3 | 2.5 92% | 1.6 23% | 1.8 38% | 1.5 15% |
Pros
Cons
当然我们不能期待一台仅仅600欧元(约4499人民币)的笔记本电脑有完美无缺的高端特性。不过宏碁Aspire E15 E5-575G-549D依然是一台配置优秀,适合游戏的主流设备。它较低的售价来自一些让人遗憾的低成本设计。显然它的预算里不会有时尚的金属机身,高速固态硬盘或明亮IPS屏幕——不过最新的Kaby Lake处理器,高速中端显卡和8GB DDR4内存以及大容量硬盘都得到了存身之地。这台Aspire的配置十分适合游戏,不过屏幕原生分辨率只有在一部分情况下可以得到利用。不过,大部分新游戏都可以在降低图形细节后流畅运行,这并不是所有笔记本电脑都可以做到的。
除了机身品质和输入设备品质外,Aspire都可以得到十分不错的分数。除了屏幕过低的亮度,这台设备整体上几乎没有缺陷,在许多方面甚至表现超乎我们的预期:它可以提供7到8小时的实际使用电池续航时间,高速的无线ac连接几乎超过了许多更贵的机型。总结来说:
对于正在寻找一台实惠型多媒体笔记本电脑的用户,Aspire E5-575G是个不错的选择。它可以有足够的性能运行最新游戏,不过较暗的屏幕不太适合在户外使用。
注:本文是基于完整评测的缩减版本,阅读完整的英文评测,请点击这里。
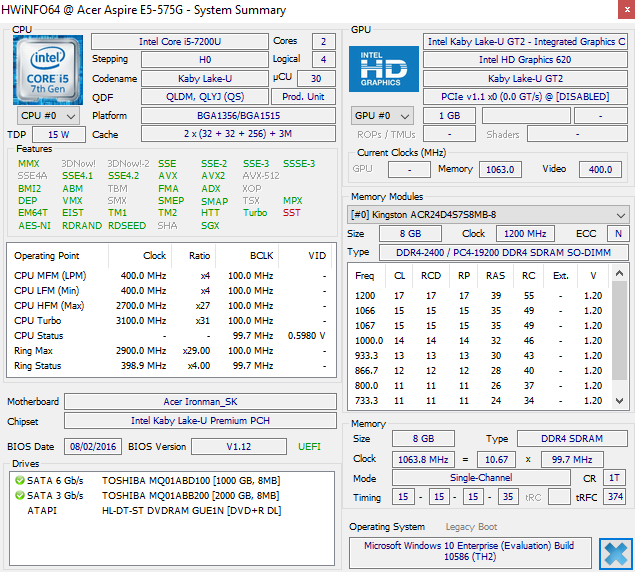
Acer Aspire E5-575G-549D
- 09/23/2016 v5.1 (old)
Till Schönborn