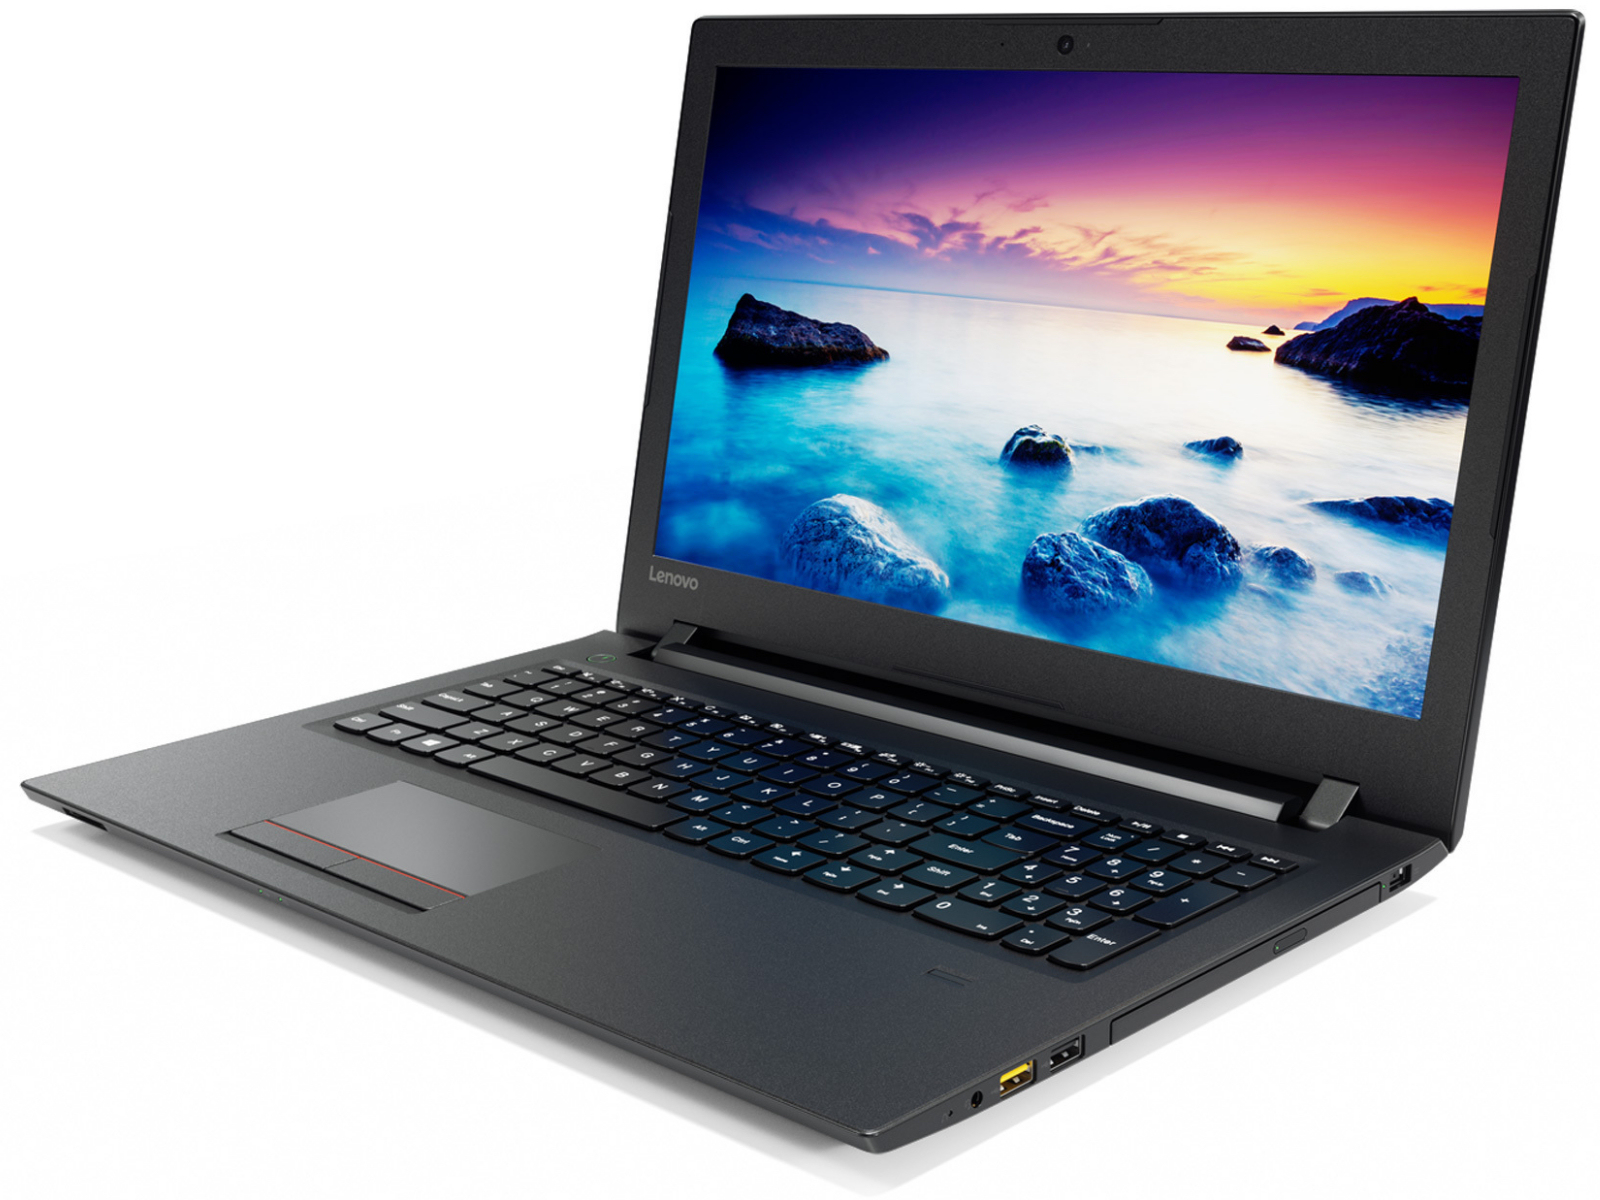
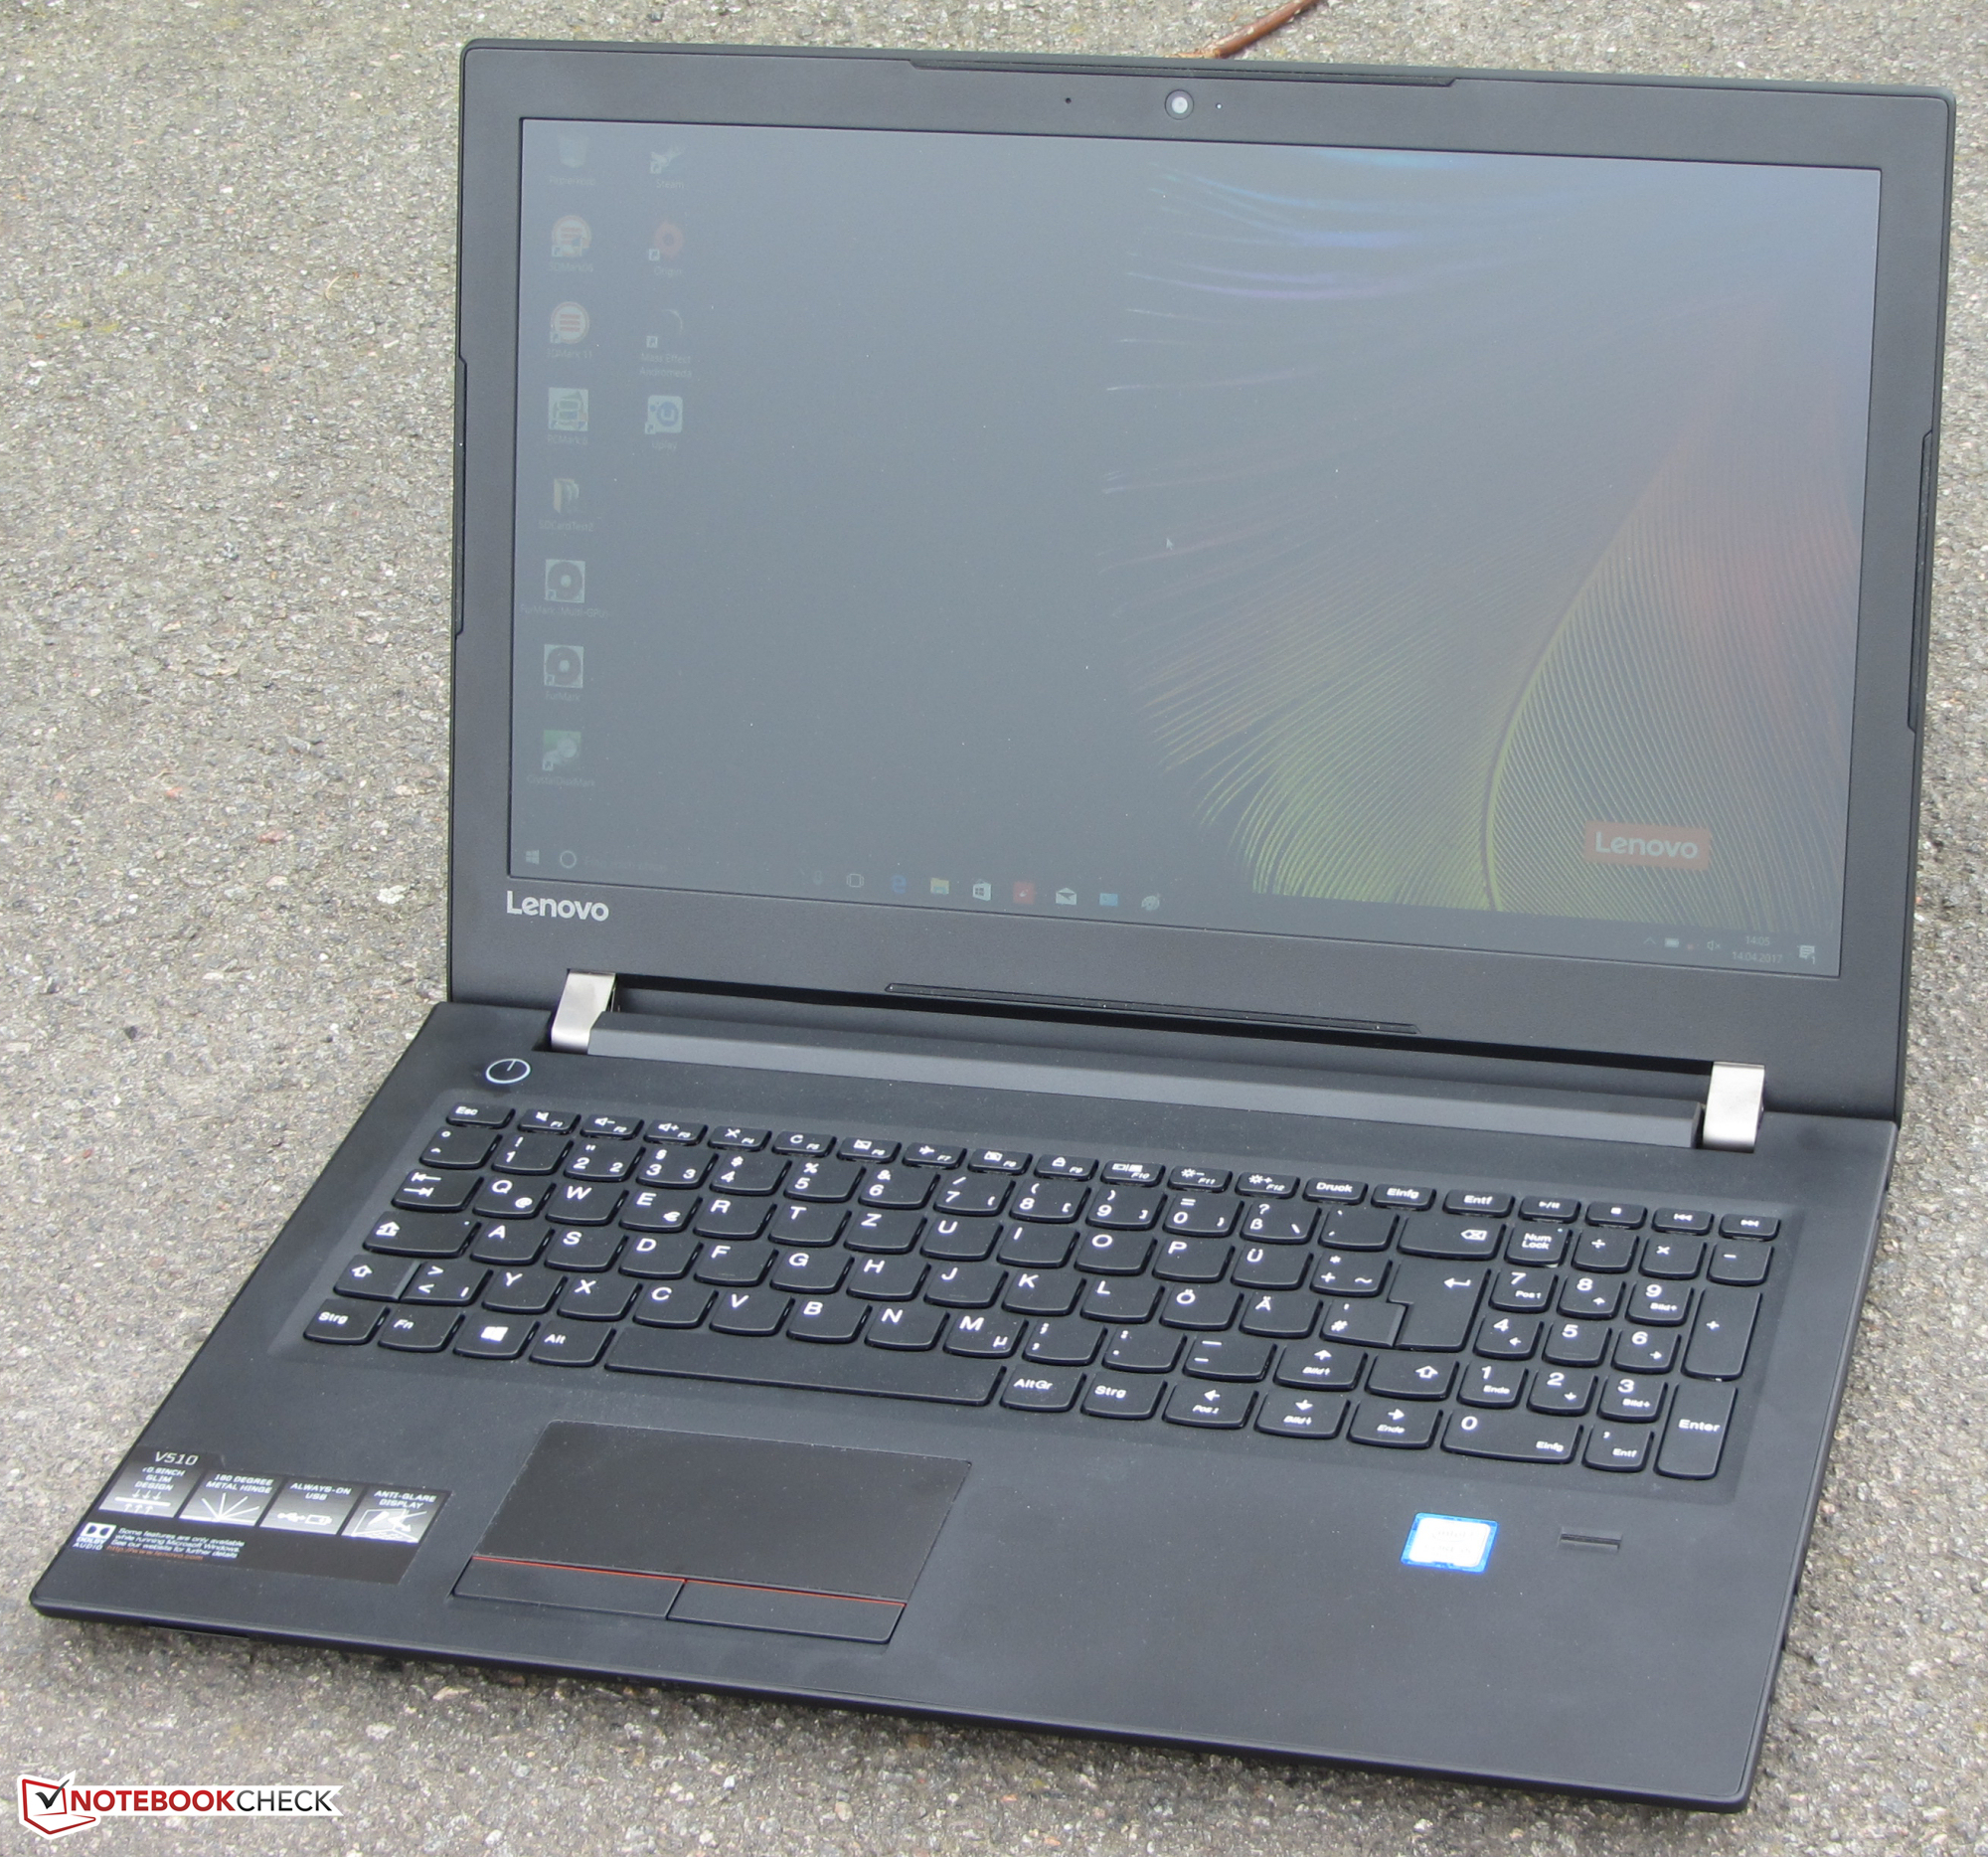
联想 V510-15IKB (7200U, 全高清) 笔记本电脑简短评测
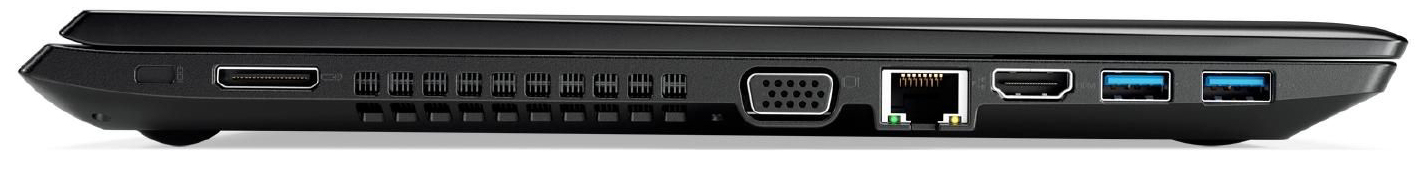
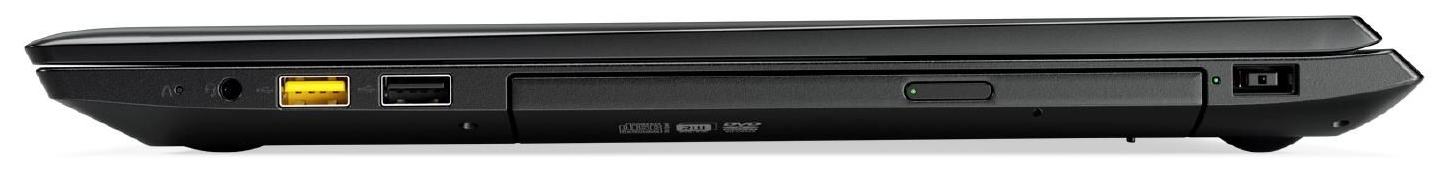
Interfaces

| SD Card Reader | |
| average JPG Copy Test (av. of 3 runs) | |
| Fujitsu Lifebook A557 | |
| Lenovo E51-80 80QB0008GE | |
| HP 15-ba077ng | |
| Dell Vostro 15-5568 | |
| HP 250 G5 SP X0N33EA | |
| Acer Extensa 2520-59CD | |
| HP 15-ay116ng | |
| Lenovo V510-15IKB 80WQ0002GE | |
| maximum AS SSD Seq Read Test (1GB) | |
| Fujitsu Lifebook A557 | |
| HP 15-ba077ng | |
| Lenovo V510-15IKB 80WQ0002GE | |
| Acer Extensa 2520-59CD | |
| HP 15-ay116ng | |
| Dell Vostro 15-5568 | |
| Networking | |
| iperf3 transmit AX12 | |
| Fujitsu Lifebook A557 | |
| Lenovo V510-15IKB 80WQ0002GE | |
| Dell Vostro 15-5568 | |
| HP 15-ba077ng | |
| iperf3 receive AX12 | |
| Fujitsu Lifebook A557 | |
| Lenovo V510-15IKB 80WQ0002GE | |
| Dell Vostro 15-5568 | |
| HP 15-ba077ng | |
| |||||||||||||||||||||||||
Brightness Distribution: 87 %
Center on Battery: 262 cd/m²
Contrast: 853:1 (Black: 0.3 cd/m²)
ΔE ColorChecker Calman: 5.4 | ∀{0.5-29.43 Ø4.73}
ΔE Greyscale Calman: 5.37 | ∀{0.09-98 Ø4.97}
58% sRGB (Argyll 1.6.3 3D)
37% AdobeRGB 1998 (Argyll 1.6.3 3D)
40.12% AdobeRGB 1998 (Argyll 3D)
58.1% sRGB (Argyll 3D)
38.8% Display P3 (Argyll 3D)
Gamma: 2.58
CCT: 6795 K
| Lenovo V510-15IKB 80WQ0002GE IPS, 1920x1080, 15.6" | Fujitsu Lifebook A557 a-Si TFT-LCD , LCM, 1920x1080, 15.6" | Dell Vostro 15-5568 TN LED, 1920x1080, 15.6" | Acer Extensa 2520-59CD TN LED, 1366x768, 15.6" | HP 250 G5 SP X0N33EA TN, 1920x1080, 15.6" | |
|---|---|---|---|---|---|
| Display | 8% | 5% | -6% | ||
| Display P3 Coverage (%) | 38.8 | 41.85 8% | 40.71 5% | 36.51 -6% | |
| sRGB Coverage (%) | 58.1 | 62.9 8% | 61.1 5% | 55 -5% | |
| AdobeRGB 1998 Coverage (%) | 40.12 | 43.24 8% | 42.07 5% | 37.72 -6% | |
| Response Times | -29% | -7% | -18% | 12% | |
| Response Time Grey 50% / Grey 80% * (ms) | 39 ? | 55 ? -41% | 47.6 ? -22% | 52 ? -33% | 40 ? -3% |
| Response Time Black / White * (ms) | 30 ? | 35 ? -17% | 27.2 ? 9% | 31 ? -3% | 22 ? 27% |
| PWM Frequency (Hz) | 20000 ? | 200 ? | 1000 | ||
| Screen | 19% | -42% | -43% | -52% | |
| Brightness middle (cd/m²) | 256 | 287 12% | 229 -11% | 211 -18% | 219 -14% |
| Brightness (cd/m²) | 252 | 260 3% | 222 -12% | 200 -21% | 222 -12% |
| Brightness Distribution (%) | 87 | 83 -5% | 82 -6% | 83 -5% | 85 -2% |
| Black Level * (cd/m²) | 0.3 | 0.22 27% | 0.56 -87% | 0.43 -43% | 0.39 -30% |
| Contrast (:1) | 853 | 1305 53% | 409 -52% | 491 -42% | 562 -34% |
| Colorchecker dE 2000 * | 5.4 | 4.21 22% | 10.36 -92% | 10.53 -95% | 12.67 -135% |
| Colorchecker dE 2000 max. * | 9.36 | 8.81 6% | 14.95 -60% | 17.79 -90% | 20.99 -124% |
| Greyscale dE 2000 * | 5.37 | 2.68 50% | 10.9 -103% | 11.85 -121% | 13.82 -157% |
| Gamma | 2.58 85% | 2.5 88% | 2.21 100% | 2.25 98% | 2.63 84% |
| CCT | 6795 96% | 6066 107% | 10084 64% | 13758 47% | 15633 42% |
| Color Space (Percent of AdobeRGB 1998) (%) | 37 | 40 8% | 37.69 2% | 39 5% | 35 -5% |
| Color Space (Percent of sRGB) (%) | 58 | 63 9% | 57.92 0% | 61 5% | 55 -5% |
| Total Average (Program / Settings) | -1% /
10% | -25% /
-36% | -19% /
-30% | -15% /
-34% |
* ... smaller is better
Screen Flickering / PWM (Pulse-Width Modulation)
| Screen flickering / PWM detected | 20000 Hz | ≤ 90 % brightness setting | 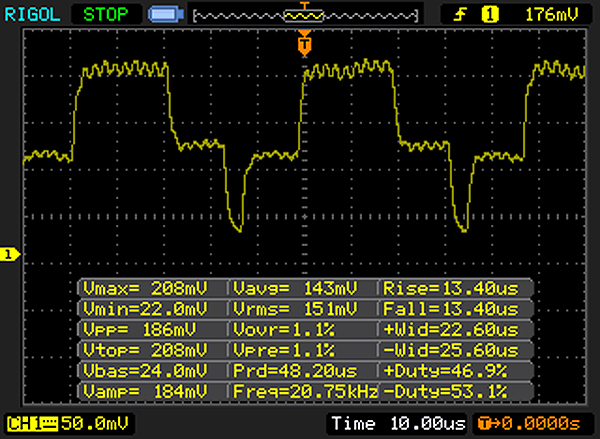 |
The display backlight flickers at 20000 Hz (worst case, e.g., utilizing PWM) Flickering detected at a brightness setting of 90 % and below. There should be no flickering or PWM above this brightness setting. The frequency of 20000 Hz is quite high, so most users sensitive to PWM should not notice any flickering. In comparison: 52 % of all tested devices do not use PWM to dim the display. If PWM was detected, an average of 7798 (minimum: 5 - maximum: 343500) Hz was measured. | |||
Display Response Times
| ↔ Response Time Black to White | ||
|---|---|---|
| 30 ms ... rise ↗ and fall ↘ combined | ↗ 19 ms rise | 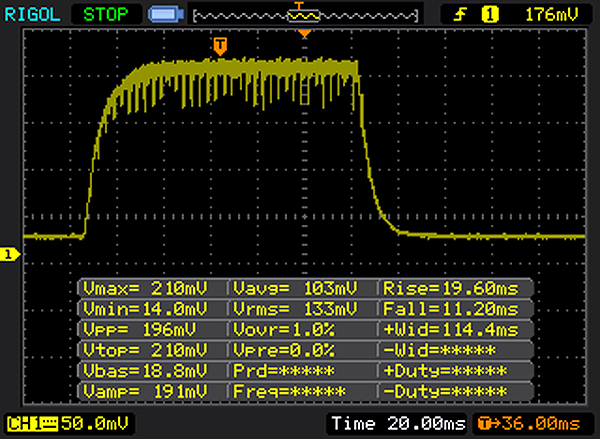 |
| ↘ 11 ms fall | ||
| The screen shows slow response rates in our tests and will be unsatisfactory for gamers. In comparison, all tested devices range from 0.1 (minimum) to 240 (maximum) ms. » 80 % of all devices are better. This means that the measured response time is worse than the average of all tested devices (19.9 ms). | ||
| ↔ Response Time 50% Grey to 80% Grey | ||
| 39 ms ... rise ↗ and fall ↘ combined | ↗ 20 ms rise | 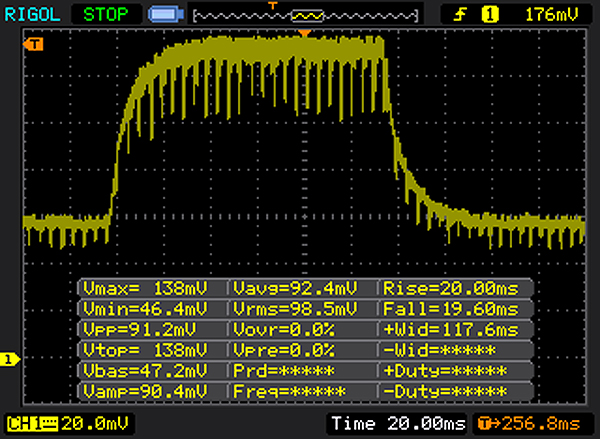 |
| ↘ 19 ms fall | ||
| The screen shows slow response rates in our tests and will be unsatisfactory for gamers. In comparison, all tested devices range from 0.165 (minimum) to 636 (maximum) ms. » 59 % of all devices are better. This means that the measured response time is worse than the average of all tested devices (31.1 ms). | ||
| Cinebench R15 | |
| CPU Single 64Bit | |
| Lenovo E51-80 80QB0008GE | |
| Lenovo V510-15IKB 80WQ0002GE | |
| Dell Vostro 15-5568 | |
| Fujitsu Lifebook A557 | |
| HP 15-ay116ng | |
| HP 250 G5 SP X0N33EA | |
| Acer Extensa 2520-59CD | |
| HP 15-ba077ng | |
| CPU Multi 64Bit | |
| Fujitsu Lifebook A557 | |
| Lenovo V510-15IKB 80WQ0002GE | |
| HP 15-ay116ng | |
| Dell Vostro 15-5568 | |
| Lenovo E51-80 80QB0008GE | |
| HP 250 G5 SP X0N33EA | |
| Acer Extensa 2520-59CD | |
| HP 15-ba077ng | |
| Cinebench R10 | |
| Rendering Multiple CPUs 32Bit | |
| Lenovo V510-15IKB 80WQ0002GE | |
| HP 15-ay116ng | |
| Fujitsu Lifebook A557 | |
| Lenovo E51-80 80QB0008GE | |
| Acer Extensa 2520-59CD | |
| HP 15-ba077ng | |
| Rendering Single 32Bit | |
| Fujitsu Lifebook A557 | |
| Lenovo V510-15IKB 80WQ0002GE | |
| HP 15-ay116ng | |
| Lenovo E51-80 80QB0008GE | |
| Acer Extensa 2520-59CD | |
| HP 15-ba077ng | |
| Geekbench 3 | |
| 32 Bit Multi-Core Score | |
| Lenovo V510-15IKB 80WQ0002GE | |
| HP 15-ay116ng | |
| Lenovo E51-80 80QB0008GE | |
| HP 15-ba077ng | |
| Acer Extensa 2520-59CD | |
| 32 Bit Single-Core Score | |
| Lenovo V510-15IKB 80WQ0002GE | |
| HP 15-ay116ng | |
| Lenovo E51-80 80QB0008GE | |
| Acer Extensa 2520-59CD | |
| HP 15-ba077ng | |
| Geekbench 4.0 | |
| 64 Bit Single-Core Score | |
| Lenovo V510-15IKB 80WQ0002GE | |
| HP 15-ay116ng | |
| HP 15-ba077ng | |
| 64 Bit Multi-Core Score | |
| Lenovo V510-15IKB 80WQ0002GE | |
| HP 15-ay116ng | |
| HP 15-ba077ng | |
| Geekbench 4.4 | |
| 64 Bit Single-Core Score | |
| Lenovo V510-15IKB 80WQ0002GE | |
| 64 Bit Multi-Core Score | |
| Lenovo V510-15IKB 80WQ0002GE | |
| JetStream 1.1 - 1.1 Total | |
| HP 15-ay116ng | |
| Lenovo V510-15IKB 80WQ0002GE | |
| Dell Vostro 15-5568 | |
| Fujitsu Lifebook A557 | |
| HP 250 G5 SP X0N33EA | |
| Acer Extensa 2520-59CD | |
| HP 15-ba077ng | |
| Lenovo E51-80 80QB0008GE | |
| PCMark 8 Home Score Accelerated v2 | 3692 points | |
Help | ||
| PCMark 8 - Home Score Accelerated v2 | |
| Lenovo V510-15IKB 80WQ0002GE | |
| Fujitsu Lifebook A557 | |
| Lenovo E51-80 80QB0008GE | |
| Dell Vostro 15-5568 | |
| HP 250 G5 SP X0N33EA | |
| HP 15-ay116ng | |
| Acer Extensa 2520-59CD | |
| HP 15-ba077ng | |

| Lenovo V510-15IKB 80WQ0002GE Samsung CM871a MZNTY256HDHP | Fujitsu Lifebook A557 Samsung MZ7TN512HDHP-00000 | Dell Vostro 15-5568 SanDisk X400 256GB, SATA (SD8SB8U-256G) | Acer Extensa 2520-59CD Toshiba MQ01ABF050 | HP 250 G5 SP X0N33EA SanDisk Z400s SD8SNAT-256G | HP 15-ay116ng Samsung CM871a MZNTY256HDHP | |
|---|---|---|---|---|---|---|
| CrystalDiskMark 3.0 | -3% | -14% | -92% | -26% | -5% | |
| Read Seq (MB/s) | 532 | 504 -5% | 497.8 -6% | 104.7 -80% | 509 -4% | 501 -6% |
| Write Seq (MB/s) | 511 | 503 -2% | 466.8 -9% | 95.7 -81% | 322.1 -37% | 483.9 -5% |
| Read 512 (MB/s) | 414.8 | 393.6 -5% | 363.4 -12% | 33 -92% | 321.2 -23% | 413.8 0% |
| Write 512 (MB/s) | 307.7 | 413.6 34% | 368.5 20% | 38.3 -88% | 289.4 -6% | 294.9 -4% |
| Read 4k (MB/s) | 39.51 | 36.98 -6% | 29.02 -27% | 0.375 -99% | 20.99 -47% | 34.91 -12% |
| Write 4k (MB/s) | 108.1 | 92.1 -15% | 56 -48% | 0.782 -99% | 88 -19% | 95.7 -11% |
| Read 4k QD32 (MB/s) | 361.6 | 277.6 -23% | 296 -18% | 0.675 -100% | 141.3 -61% | 370.9 3% |
| Write 4k QD32 (MB/s) | 253 | 250.6 -1% | 229.4 -9% | 0.769 -100% | 228.5 -10% | 243.6 -4% |
| 3DMark 11 Performance | 1653 points | |
Help | ||
| 3DMark 11 - 1280x720 Performance GPU | |
| HP 15-ba077ng | |
| Lenovo E51-80 80QB0008GE | |
| Lenovo V510-15IKB 80WQ0002GE | |
| Fujitsu Lifebook A557 | |
| HP 15-ay116ng | |
| Dell Vostro 15-5568 | |
| HP 250 G5 SP X0N33EA | |
| Acer Extensa 2520-59CD | |
| low | med. | high | ultra | |
|---|---|---|---|---|
| BioShock Infinite (2013) | 47.6 | 27.7 | 23 | 7.8 |
| Ghost Recon Wildlands (2017) | 13.2 | 6.1 |
Noise level
| Idle |
| 30.2 / 30.2 / 32 dB(A) |
| DVD |
| 38.3 / dB(A) |
| Load |
| 34.7 / 33.9 dB(A) |
 | ||
30 dB silent 40 dB(A) audible 50 dB(A) loud |
||
min: | ||
(+) The maximum temperature on the upper side is 34.2 °C / 94 F, compared to the average of 34.3 °C / 94 F, ranging from 21.2 to 62.5 °C for the class Office.
(+) The bottom heats up to a maximum of 33.2 °C / 92 F, compared to the average of 36.8 °C / 98 F
(+) In idle usage, the average temperature for the upper side is 26.8 °C / 80 F, compared to the device average of 29.5 °C / 85 F.
(+) The palmrests and touchpad are cooler than skin temperature with a maximum of 31.8 °C / 89.2 F and are therefore cool to the touch.
(-) The average temperature of the palmrest area of similar devices was 27.5 °C / 81.5 F (-4.3 °C / -7.7 F).
Lenovo V510-15IKB 80WQ0002GE audio analysis
(-) | not very loud speakers (71 dB)
Bass 100 - 315 Hz
(±) | reduced bass - on average 11.7% lower than median
(±) | linearity of bass is average (8.8% delta to prev. frequency)
Mids 400 - 2000 Hz
(+) | balanced mids - only 1.8% away from median
(+) | mids are linear (4% delta to prev. frequency)
Highs 2 - 16 kHz
(+) | balanced highs - only 3.5% away from median
(±) | linearity of highs is average (7.2% delta to prev. frequency)
Overall 100 - 16.000 Hz
(+) | overall sound is linear (14.3% difference to median)
Compared to same class
» 11% of all tested devices in this class were better, 4% similar, 86% worse
» The best had a delta of 7%, average was 21%, worst was 53%
Compared to all devices tested
» 17% of all tested devices were better, 4% similar, 79% worse
» The best had a delta of 4%, average was 24%, worst was 134%
Apple MacBook 12 (Early 2016) 1.1 GHz audio analysis
(+) | speakers can play relatively loud (83.6 dB)
Bass 100 - 315 Hz
(±) | reduced bass - on average 11.3% lower than median
(±) | linearity of bass is average (14.2% delta to prev. frequency)
Mids 400 - 2000 Hz
(+) | balanced mids - only 2.4% away from median
(+) | mids are linear (5.5% delta to prev. frequency)
Highs 2 - 16 kHz
(+) | balanced highs - only 2% away from median
(+) | highs are linear (4.5% delta to prev. frequency)
Overall 100 - 16.000 Hz
(+) | overall sound is linear (10.2% difference to median)
Compared to same class
» 7% of all tested devices in this class were better, 2% similar, 91% worse
» The best had a delta of 5%, average was 18%, worst was 53%
Compared to all devices tested
» 5% of all tested devices were better, 1% similar, 94% worse
» The best had a delta of 4%, average was 24%, worst was 134%
| Off / Standby | |
| Idle | |
| Load |
|
Key:
min: | |
| Battery Runtime - WiFi Websurfing | |
| Fujitsu Lifebook A557 | |
| HP 15-ay116ng | |
| Dell Vostro 15-5568 | |
| HP 250 G5 SP X0N33EA | |
| Acer Extensa 2520-59CD | |
| HP 15-ba077ng | |
| Lenovo E51-80 80QB0008GE | |
| Lenovo V510-15IKB 80WQ0002GE | |
Pros
Cons
V510-15IKB是联想推出的一台简洁15.6寸办公笔记本电脑。它的价位低于ThinkPad E系列。Kaby Lake架构酷睿i5处理器可以提供大部分常见用途所需的性能。这台设备在日常使用中几乎不会变热,也十分安静。
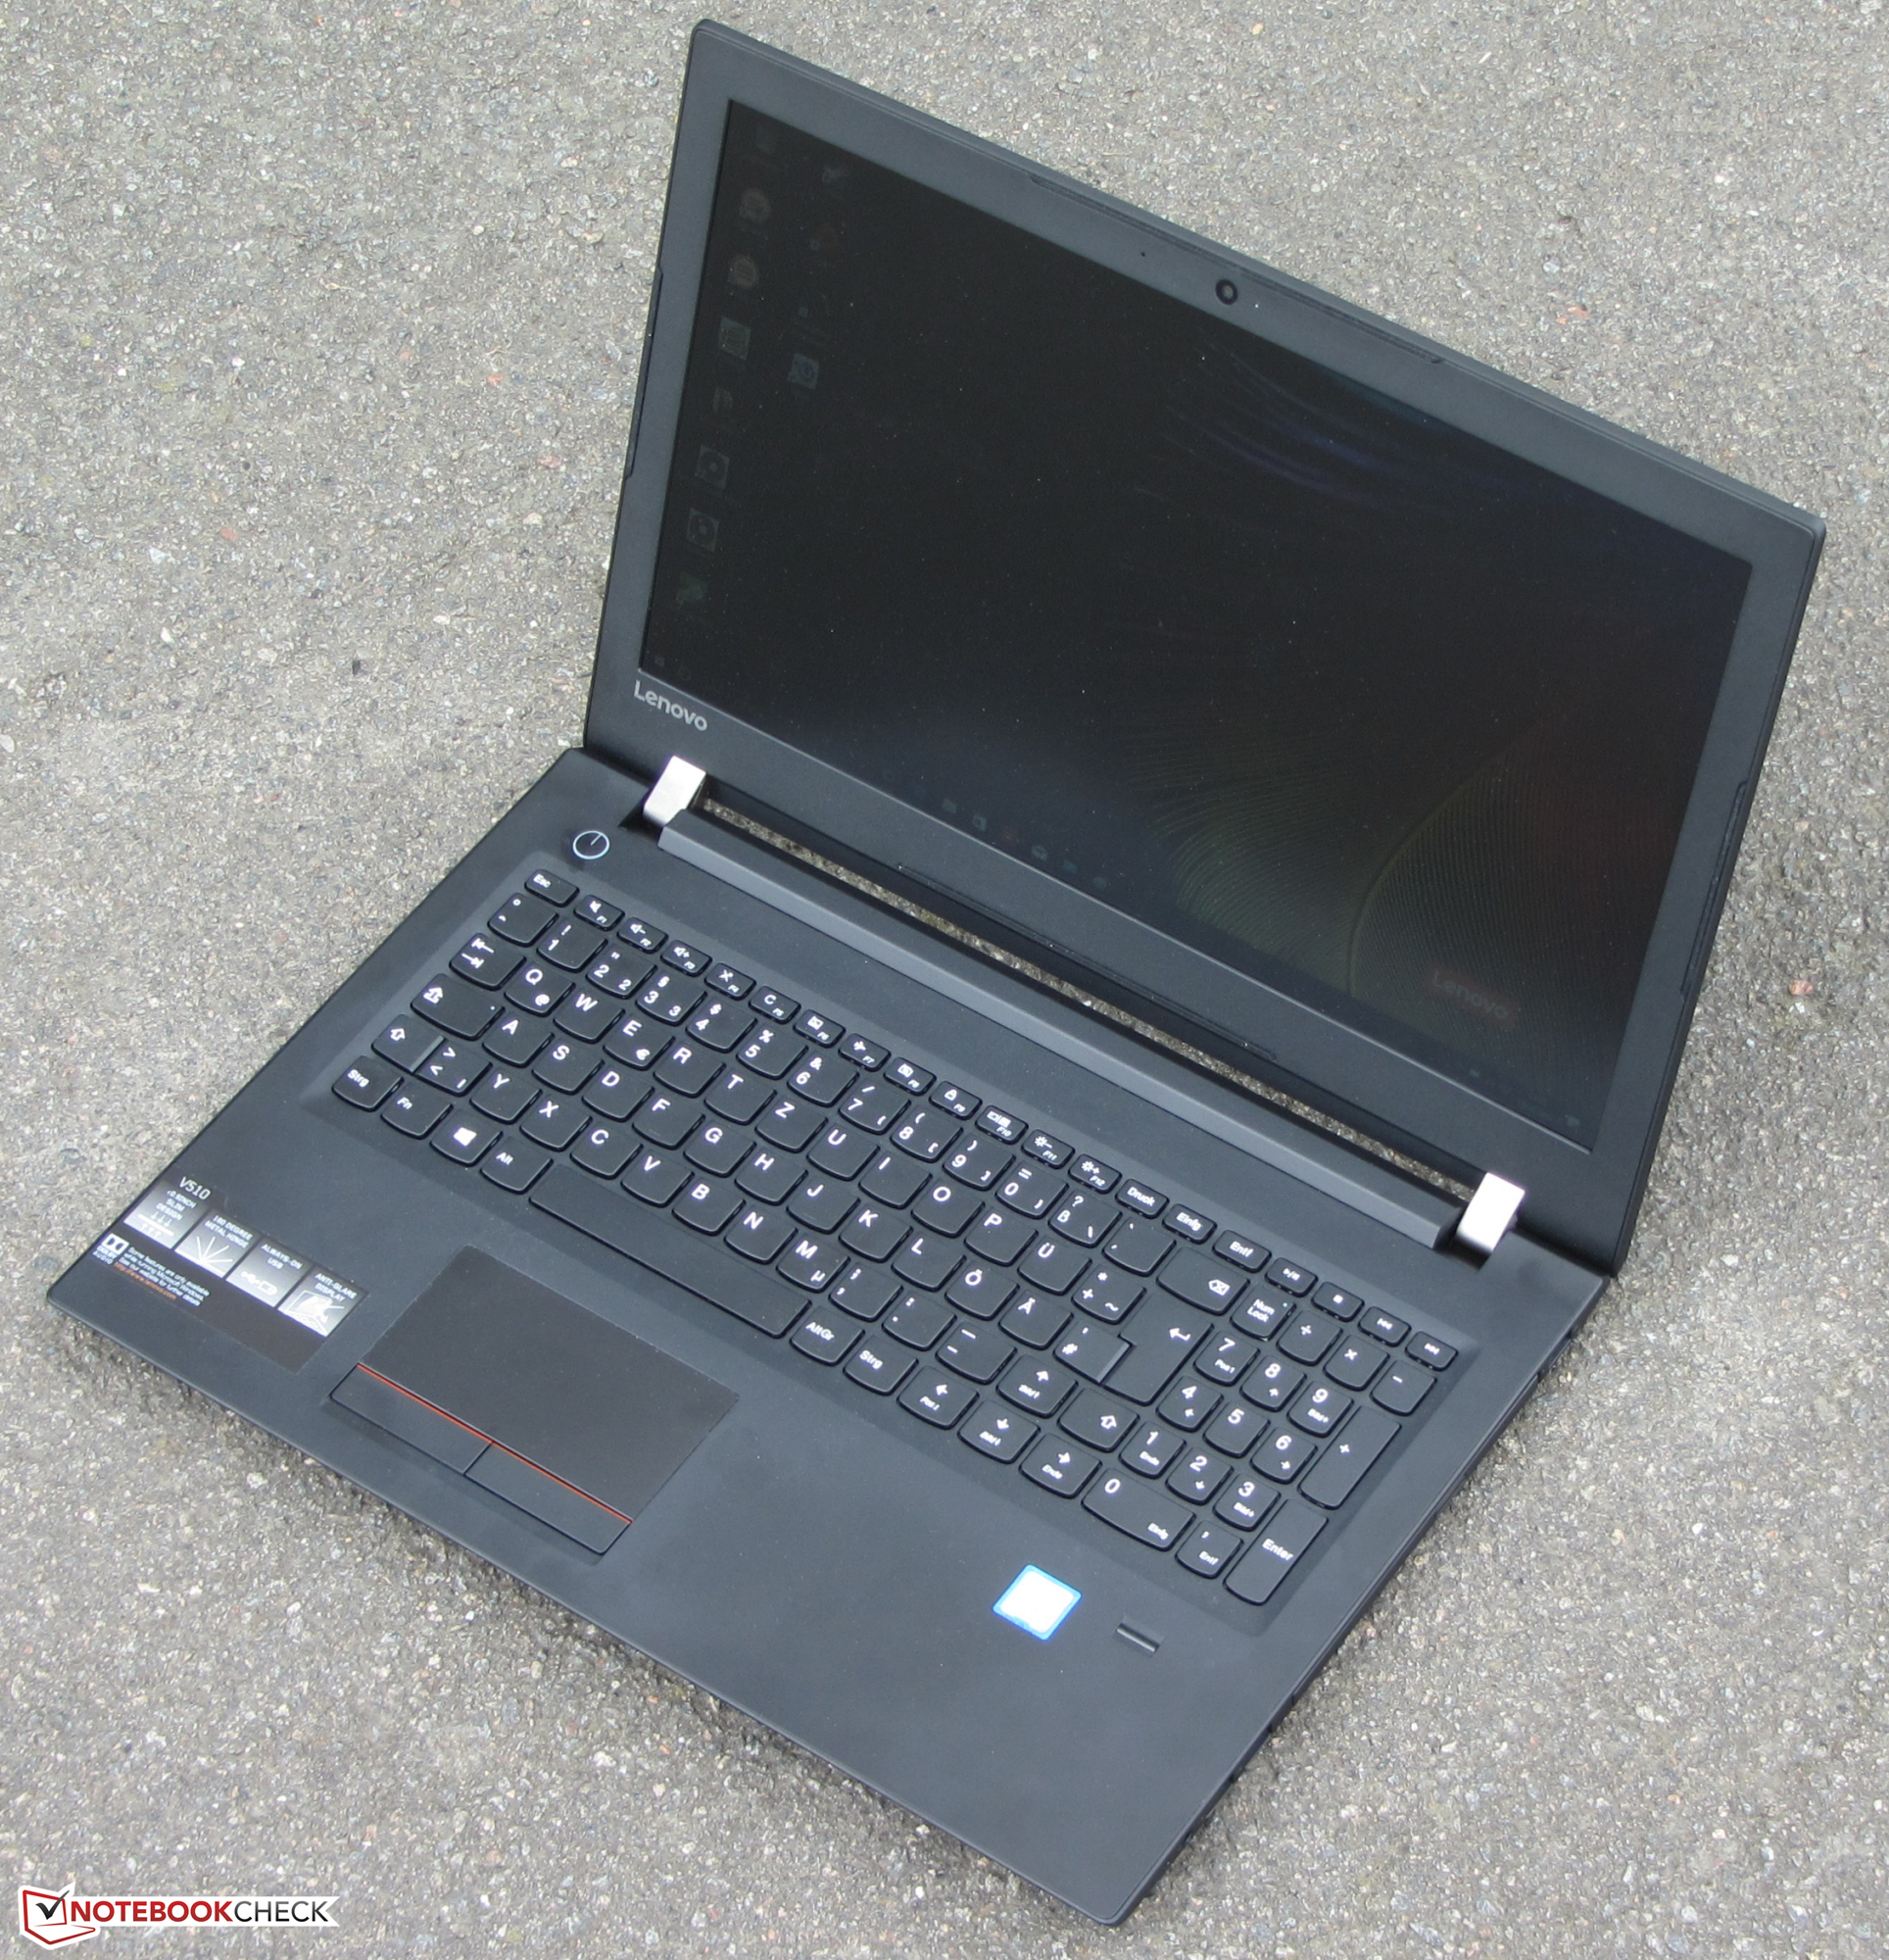
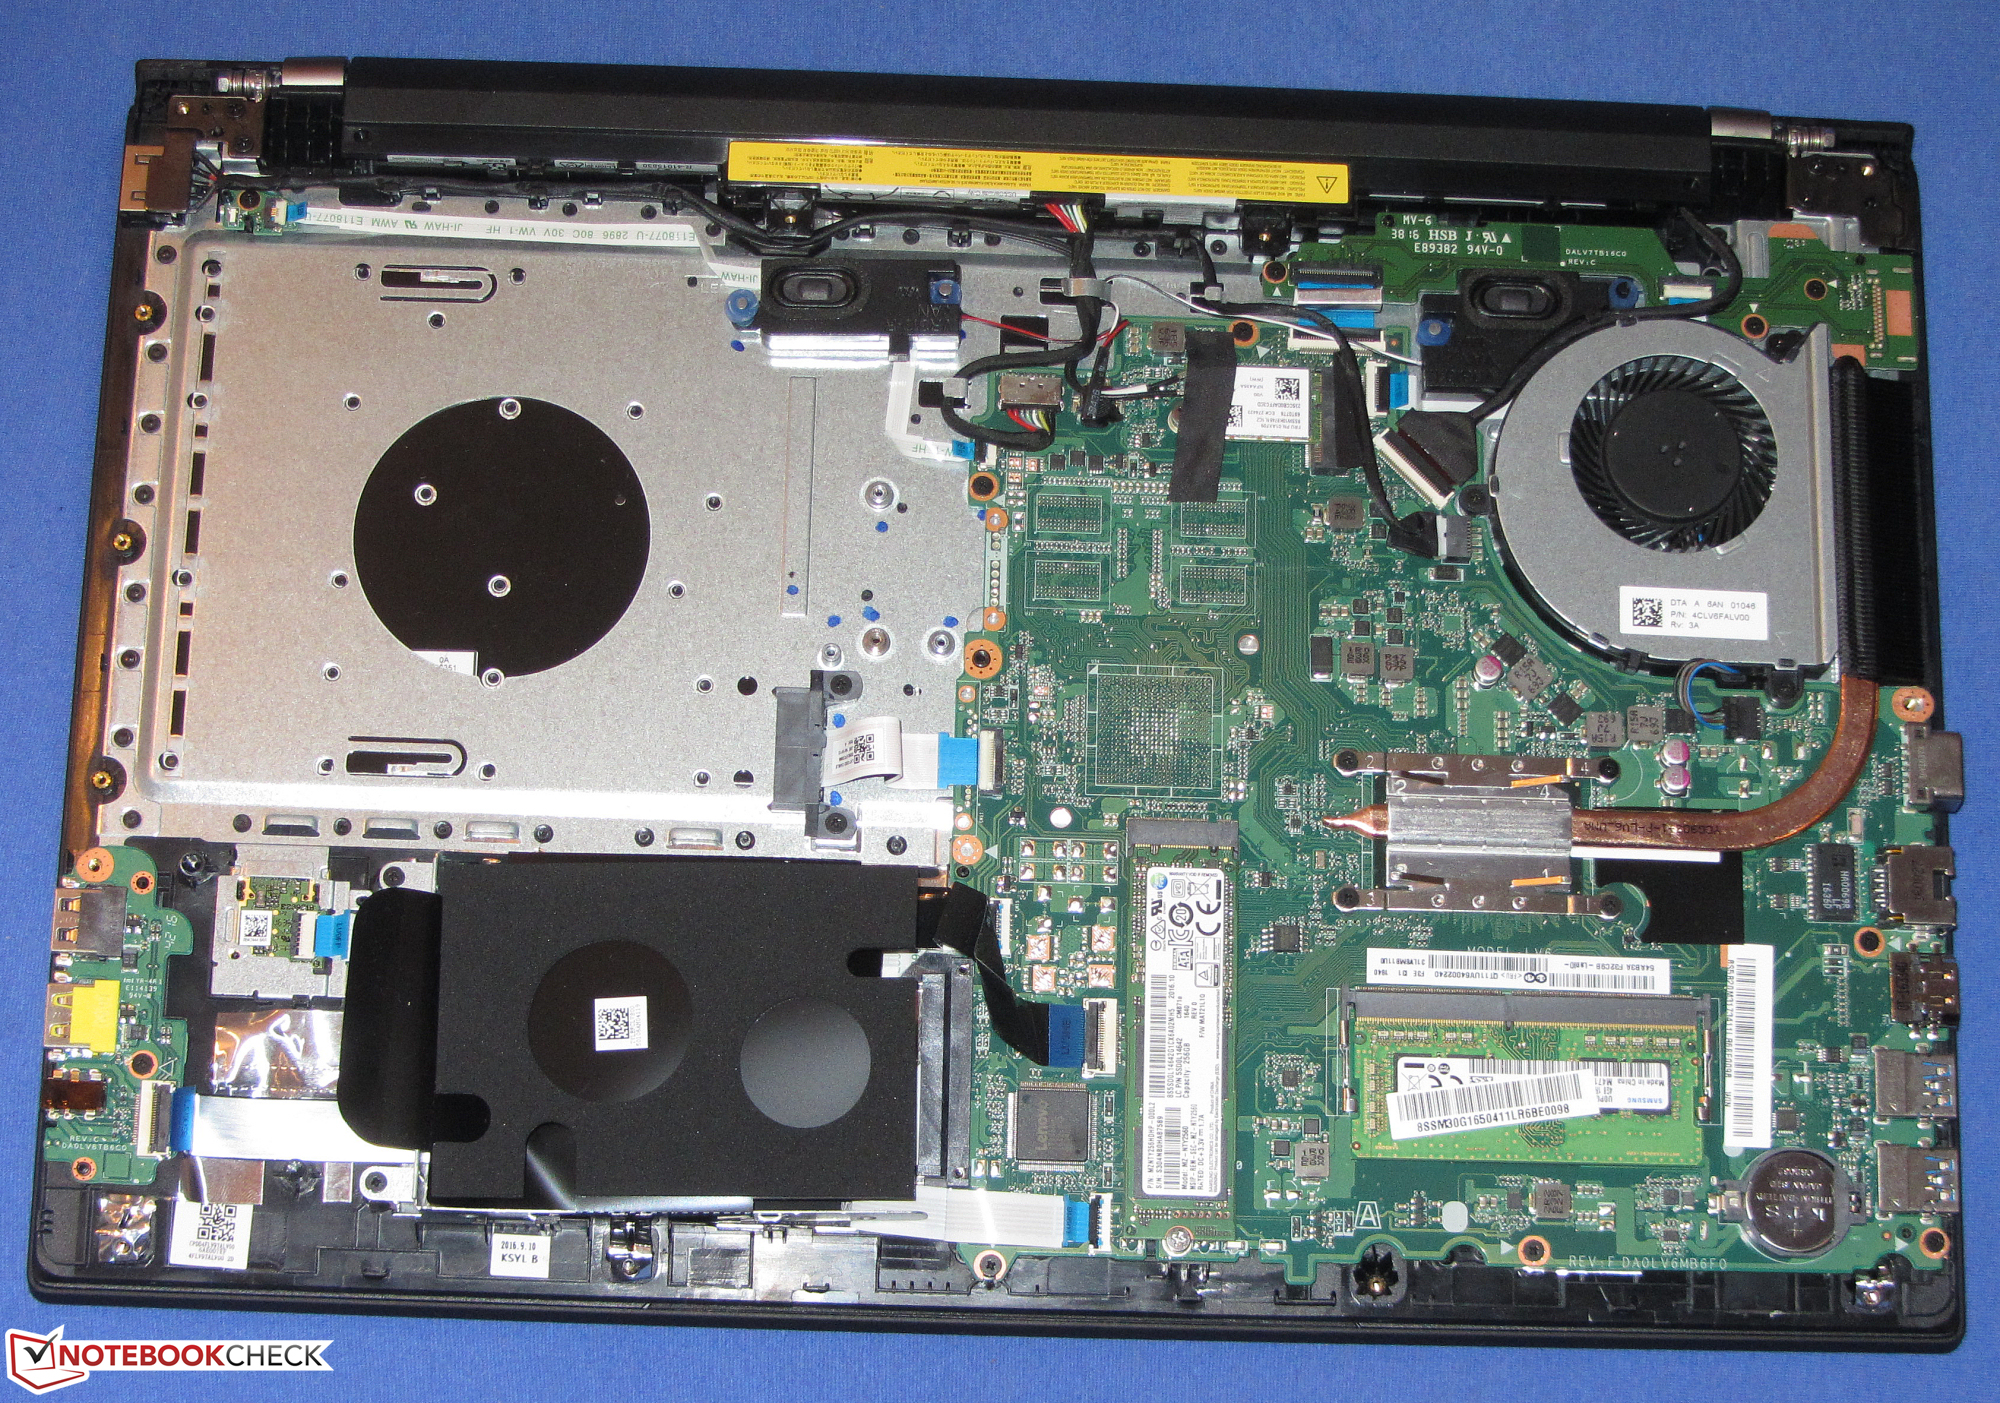
固态硬盘保证了迅捷的系统响应。用户也可以打开机身自行升级更换固态硬盘,它没有采用维护底盖设计。联想为这台设备采用了一块全高清IPS屏幕,它的可视角度广,对比度也不错,同时采用雾面设计。可惜的是在亮度上它稍有不足。这台设备的键盘品质十分优秀,可以适合文字输入的需要。
这台设备的电池续航是它最大的弱点。
它在我们无线上网电池续航测试中得到的结果十分可怜。这在很大程度上要归罪于很低的电池容量(32瓦时)。因此,这台笔记本电脑并不适合移动办公。它的理想用途是作为桌面式设备。另外,仅仅一年的质保也让我们很难接受,两年的保修应该是最低限度。
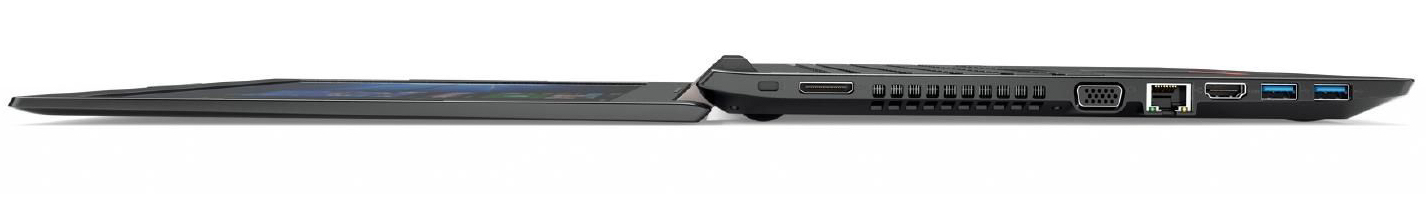
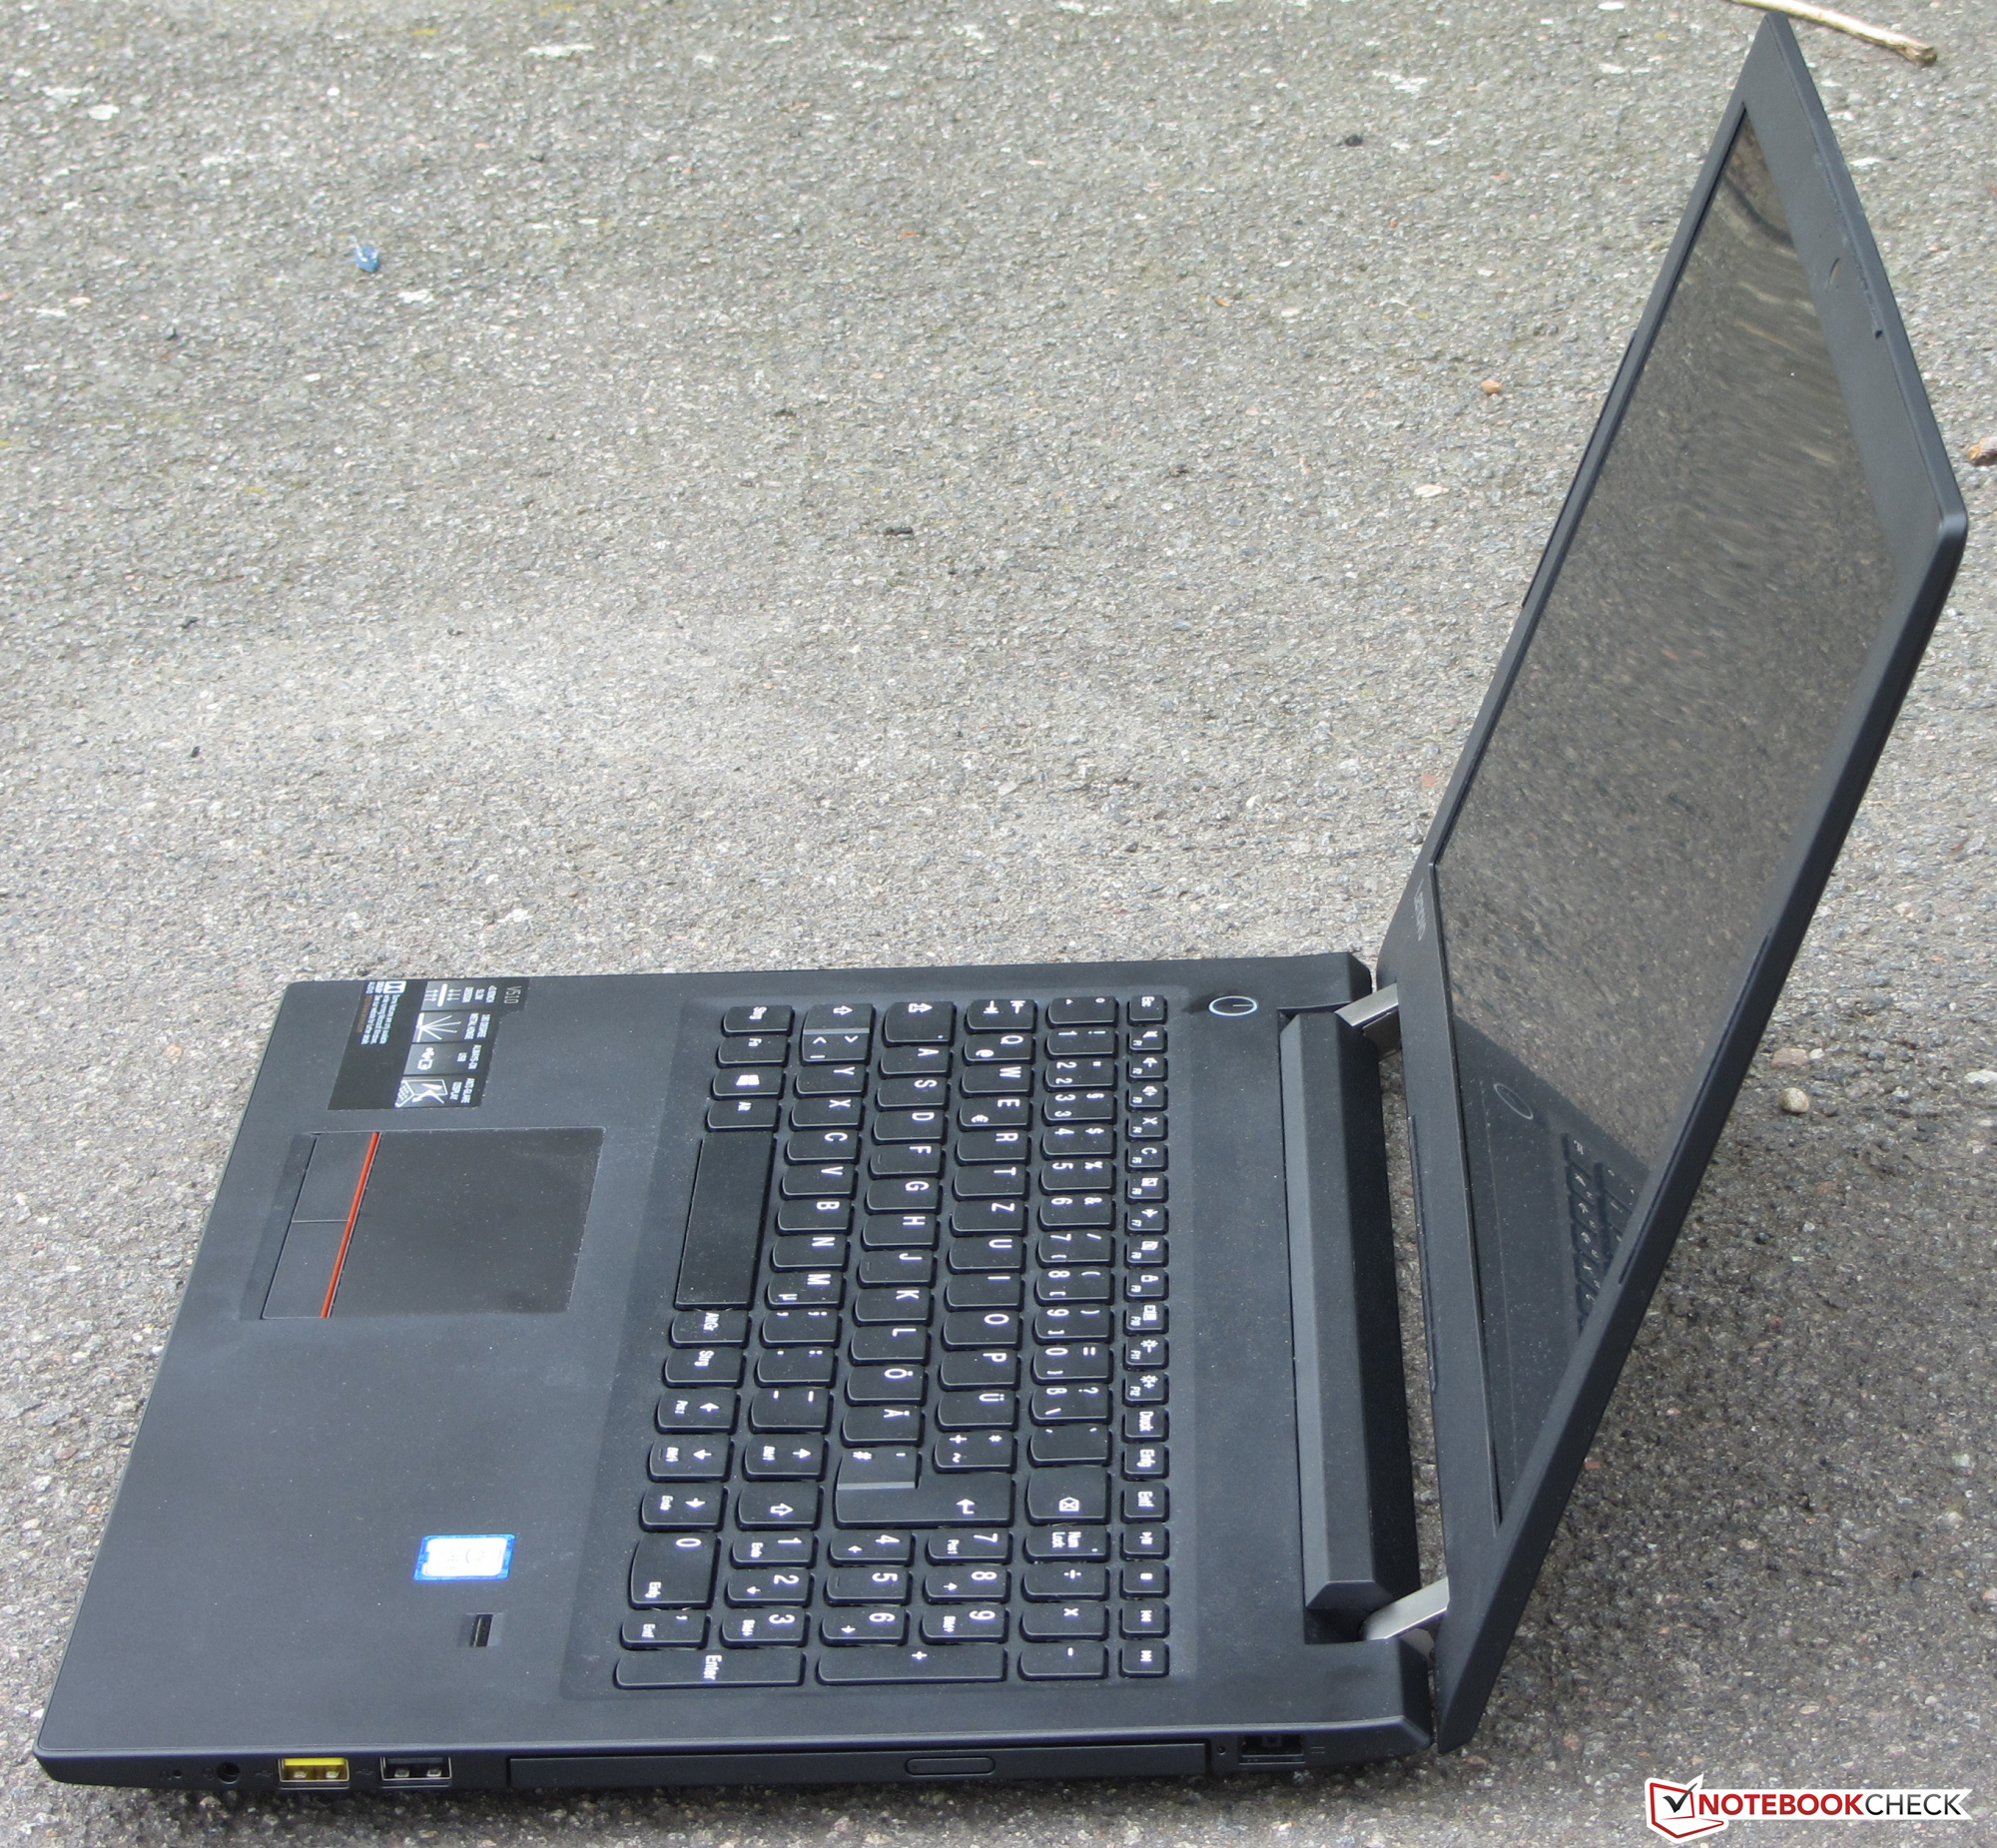
这台笔记本电脑没有提供对USB-C接口的支持。2017年的新机型应该至少提供一个USB-C接口。需要额外接口的用户可以通过OneLink+连接扩展坞,它提供了兼容扩展坞接口。
这台计算机预装的Windows 10专业版提高了它的成本。80WQ005CGE机型可能更加适合预算有限的用户。这款机型和我们测试的机型几乎相同,只是搭配了1TB机械硬盘而非固态硬盘。另外,它没有预装Windows操作系统,售价仅480欧元(约3603人民币)。如果自行购买256GB固态硬盘和正版Winsows 7专业版,总预算也不足600欧元(约4504人民币)。另外,目前用户仍然可以从Windows 7免费升级到Windows 10。
注:本文是基于完整评测的缩减版本,阅读完整的英文评测,请点击这里。
Lenovo V510-15IKB 80WQ0002GE
- 04/19/2017 v6 (old)
Sascha Mölck