Acer Aspire E5-574-53YZ 笔记本电脑简短评测
| SD Card Reader | |
| average JPG Copy Test (av. of 3 runs) | |
| HP ProBook 450 G3 | |
| Toshiba Satellite C55-C-1NE | |
| Lenovo ThinkPad E560 20EV000MGE | |
| Lenovo B50-10 80QR0013GE | |
| Acer Aspire E5-574-53YZ | |
| Acer Aspire V3-372-57CW | |
| maximum AS SSD Seq Read Test (1GB) | |
| Toshiba Satellite C55-C-1NE | |
| Lenovo B50-10 80QR0013GE | |
| HP ProBook 450 G3 | |
| Acer Aspire E5-574-53YZ | |
| Acer Aspire V3-372-57CW | |
| Networking | |
| Wi-Fi Client 1m | |
| Wi-Fi Server 1m |
| |||||||||||||||||||||||||
Brightness Distribution: 86 %
Center on Battery: 213.4 cd/m²
Contrast: 608:1 (Black: 0.351 cd/m²)
ΔE ColorChecker Calman: 13.35 | ∀{0.5-29.43 Ø4.71}
ΔE Greyscale Calman: 13.59 | ∀{0.09-98 Ø4.96}
56.01% sRGB (Argyll 1.6.3 3D)
38.44% AdobeRGB 1998 (Argyll 1.6.3 3D)
38.44% AdobeRGB 1998 (Argyll 3D)
56% sRGB (Argyll 3D)
37.21% Display P3 (Argyll 3D)
Gamma: 2.7
CCT: 18870 K
| Acer Aspire E5-574-53YZ AU Optronics AUO38ED / AUO B156HTN03.8, TN, 15.6", 1920x1080 | HP ProBook 450 G3 AU Optronics, TN LED, 15.6", 1920x1080 | Lenovo ThinkPad E560 20EV000MGE Lenovo N156B6-L07, TN LED, 15.6", 1366x768 | HP Pavilion 15-ab022ng BOE, TN LED, 15.6", 1920x1080 | Lenovo B50-10 80QR0013GE Chi Mei N156BGE-EA2, TN LED, 15.6", 1366x768 | Toshiba Satellite C55-C-1NE 156AT37-T01 (SDC4141), TN, 15.6", 1366x768 | |
|---|---|---|---|---|---|---|
| Display | 2% | 1% | 19% | 8% | -1% | |
| Display P3 Coverage (%) | 37.21 | 38.1 2% | 37.63 1% | 44.11 19% | 40.21 8% | 36.7 -1% |
| sRGB Coverage (%) | 56 | 57.3 2% | 56.7 1% | 66.4 19% | 60.1 7% | 55.3 -1% |
| AdobeRGB 1998 Coverage (%) | 38.44 | 39.37 2% | 38.88 1% | 45.57 19% | 41.56 8% | 37.92 -1% |
| Response Times | -3% | -4% | 28% | 35% | ||
| Response Time Grey 50% / Grey 80% * (ms) | 42.4 ? | 41.2 ? 3% | 50 ? -18% | 28 ? 34% | 22 ? 48% | |
| Response Time Black / White * (ms) | 25.6 ? | 28 ? -9% | 23 ? 10% | 20 ? 22% | 20 ? 22% | |
| PWM Frequency (Hz) | 200 ? | 200 ? | ||||
| Screen | 2% | -2% | -8% | 9% | -6% | |
| Brightness middle (cd/m²) | 213.4 | 211 -1% | 241 13% | 223 4% | 245 15% | 251 18% |
| Brightness (cd/m²) | 209 | 214 2% | 226 8% | 215 3% | 230 10% | 236 13% |
| Brightness Distribution (%) | 86 | 91 6% | 89 3% | 83 -3% | 84 -2% | 85 -1% |
| Black Level * (cd/m²) | 0.351 | 0.43 -23% | 0.48 -37% | 0.76 -117% | 0.46 -31% | 0.44 -25% |
| Contrast (:1) | 608 | 491 -19% | 502 -17% | 293 -52% | 533 -12% | 570 -6% |
| Colorchecker dE 2000 * | 13.35 | 9.25 31% | 12.43 7% | 8.5 36% | 8.34 38% | 14.58 -9% |
| Colorchecker dE 2000 max. * | 21.79 | 21.03 3% | 12.31 44% | 24.59 -13% | ||
| Greyscale dE 2000 * | 13.59 | 9.83 28% | 13.24 3% | 9.35 31% | 9.48 30% | 16.8 -24% |
| Gamma | 2.7 81% | 2.82 78% | 2.61 84% | 2.46 89% | 2.38 92% | 2.33 94% |
| CCT | 18870 34% | 10890 60% | 15733 41% | 10402 62% | 10624 61% | 27039 24% |
| Color Space (Percent of AdobeRGB 1998) (%) | 38.44 | 36.4 -5% | 36 -6% | 42 9% | 38 -1% | 35 -9% |
| Color Space (Percent of sRGB) (%) | 56.01 | 57.3 2% | 57 2% | 66 18% | 57 2% | 56 0% |
| Total Average (Program / Settings) | 0% /
2% | -2% /
-2% | 6% /
-1% | 15% /
11% | 9% /
1% |
* ... smaller is better
Display Response Times
| ↔ Response Time Black to White | ||
|---|---|---|
| 25.6 ms ... rise ↗ and fall ↘ combined | ↗ 8.4 ms rise | 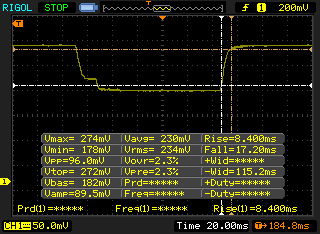 |
| ↘ 17.2 ms fall | ||
| The screen shows relatively slow response rates in our tests and may be too slow for gamers. In comparison, all tested devices range from 0.1 (minimum) to 240 (maximum) ms. » 61 % of all devices are better. This means that the measured response time is worse than the average of all tested devices (19.8 ms). | ||
| ↔ Response Time 50% Grey to 80% Grey | ||
| 42.4 ms ... rise ↗ and fall ↘ combined | ↗ 21.2 ms rise | 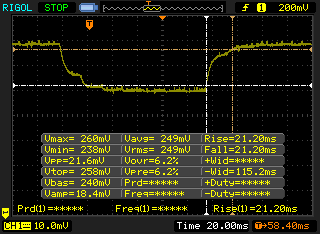 |
| ↘ 21.2 ms fall | ||
| The screen shows slow response rates in our tests and will be unsatisfactory for gamers. In comparison, all tested devices range from 0.165 (minimum) to 636 (maximum) ms. » 70 % of all devices are better. This means that the measured response time is worse than the average of all tested devices (30.9 ms). | ||
Screen Flickering / PWM (Pulse-Width Modulation)
| Screen flickering / PWM not detected | 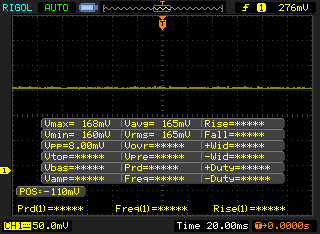 | ||
In comparison: 52 % of all tested devices do not use PWM to dim the display. If PWM was detected, an average of 7748 (minimum: 5 - maximum: 343500) Hz was measured. | |||
| Cinebench R10 | |
| Rendering Multiple CPUs 32Bit | |
| Acer Aspire V3-372-57CW | |
| Acer Aspire E5-574-53YZ | |
| HP ProBook 450 G3 | |
| HP Pavilion 15-ab022ng | |
| Lenovo ThinkPad E560 20EV000MGE | |
| Toshiba Satellite C55-C-1NE | |
| Lenovo B50-10 80QR0013GE | |
| Rendering Single 32Bit | |
| Acer Aspire V3-372-57CW | |
| Acer Aspire E5-574-53YZ | |
| HP Pavilion 15-ab022ng | |
| HP ProBook 450 G3 | |
| Lenovo ThinkPad E560 20EV000MGE | |
| Toshiba Satellite C55-C-1NE | |
| Lenovo B50-10 80QR0013GE | |
| Cinebench R11.5 | |
| CPU Single 64Bit | |
| Acer Aspire V3-372-57CW | |
| Acer Aspire E5-574-53YZ | |
| HP Pavilion 15-ab022ng | |
| HP ProBook 450 G3 | |
| Lenovo ThinkPad E560 20EV000MGE | |
| Toshiba Satellite C55-C-1NE | |
| CPU Multi 64Bit | |
| Acer Aspire V3-372-57CW | |
| Acer Aspire E5-574-53YZ | |
| HP ProBook 450 G3 | |
| HP Pavilion 15-ab022ng | |
| Lenovo ThinkPad E560 20EV000MGE | |
| Toshiba Satellite C55-C-1NE | |
| Cinebench R15 | |
| CPU Single 64Bit | |
| Acer Aspire V3-372-57CW | |
| Acer Aspire E5-574-53YZ | |
| HP ProBook 450 G3 | |
| HP Pavilion 15-ab022ng | |
| Lenovo ThinkPad E560 20EV000MGE | |
| Toshiba Satellite C55-C-1NE | |
| Lenovo B50-10 80QR0013GE | |
| CPU Multi 64Bit | |
| Acer Aspire V3-372-57CW | |
| Acer Aspire E5-574-53YZ | |
| HP Pavilion 15-ab022ng | |
| HP ProBook 450 G3 | |
| Lenovo ThinkPad E560 20EV000MGE | |
| Toshiba Satellite C55-C-1NE | |
| Lenovo B50-10 80QR0013GE | |
| Super Pi Mod 1.5 XS 32M - 32M | |
| Acer Aspire E5-574-53YZ | |
| Acer Aspire V3-372-57CW | |
* ... smaller is better
| PCMark 8 | |
| Home Score Accelerated v2 | |
| Acer Aspire V3-372-57CW | |
| Acer Aspire E5-574-53YZ | |
| HP Pavilion 15-ab022ng | |
| Lenovo ThinkPad E560 20EV000MGE | |
| HP ProBook 450 G3 | |
| Toshiba Satellite C55-C-1NE | |
| Apple MacBook 12 (Early 2016) 1.1 GHz | |
| Lenovo B50-10 80QR0013GE | |
| Work Score Accelerated v2 | |
| Acer Aspire V3-372-57CW | |
| Acer Aspire E5-574-53YZ | |
| Lenovo ThinkPad E560 20EV000MGE | |
| HP Pavilion 15-ab022ng | |
| HP ProBook 450 G3 | |
| Apple MacBook 12 (Early 2016) 1.1 GHz | |
| Toshiba Satellite C55-C-1NE | |
| Lenovo B50-10 80QR0013GE | |
| Creative Score Accelerated v2 | |
| Acer Aspire V3-372-57CW | |
| Acer Aspire E5-574-53YZ | |
| HP Pavilion 15-ab022ng | |
| HP ProBook 450 G3 | |
| Lenovo ThinkPad E560 20EV000MGE | |
| Toshiba Satellite C55-C-1NE | |
| Lenovo B50-10 80QR0013GE | |
| PCMark 8 Home Score Accelerated v2 | 3665 points | |
| PCMark 8 Creative Score Accelerated v2 | 4403 points | |
| PCMark 8 Work Score Accelerated v2 | 4408 points | |
Help | ||
| Acer Aspire E5-574-53YZ Toshiba MQ02ABD100H | HP ProBook 450 G3 Seagate ST500LM021-1KJ15 | Lenovo ThinkPad E560 20EV000MGE Western Digital WD Black Mobile 500GB (WD5000LPLX) | HP Pavilion 15-ab022ng HGST Travelstar 5K1000 HTS541010A9E680 | Lenovo B50-10 80QR0013GE Seagate Momentus Thin ST500LT012-1DG142 | Toshiba Satellite C55-C-1NE Toshiba MQ01ABD100 | Acer Aspire V3-372-57CW Kingston RBU-SNS8152S3256GG2 | |
|---|---|---|---|---|---|---|---|
| CrystalDiskMark 3.0 | 44% | 74% | 26% | 24% | 17% | 20297% | |
| Read Seq (MB/s) | 100.8 | 122.8 22% | 120.4 19% | 93.4 -7% | 103.5 3% | 105.6 5% | 515 411% |
| Write Seq (MB/s) | 57.4 | 123.5 115% | 123.1 114% | 91.1 59% | 91.1 59% | 93.4 63% | 338 489% |
| Read 512 (MB/s) | 31.19 | 33.14 6% | 34.31 10% | 31.42 1% | 33.74 8% | 31.7 2% | 368.1 1080% |
| Write 512 (MB/s) | 38.67 | 56.5 46% | 66.8 73% | 34.81 -10% | 38.77 0% | 27.54 -29% | 338.6 776% |
| Read 4k (MB/s) | 0.509 | 0.341 -33% | 0.373 -27% | 0.384 -25% | 0.374 -27% | 0.374 -27% | 28.88 5574% |
| Write 4k (MB/s) | 0.615 | 0.721 17% | 1.29 110% | 0.85 38% | 0.649 6% | 0.72 17% | 74.2 11965% |
| Read 4k QD32 (MB/s) | 0.351 | 0.897 156% | 0.976 178% | 0.729 108% | 0.818 133% | 0.694 98% | 319.9 91040% |
| Write 4k QD32 (MB/s) | 0.605 | 0.727 20% | 1.285 112% | 0.871 44% | 0.648 7% | 0.646 7% | 309.4 51040% |

| 3DMark 11 | |
| 1280x720 Performance GPU | |
| Acer Aspire V3-372-57CW | |
| Acer Aspire E5-574-53YZ | |
| HP Pavilion 15-ab022ng | |
| Toshiba Satellite C55-C-1NE | |
| HP ProBook 450 G3 | |
| Lenovo ThinkPad E560 20EV000MGE | |
| Lenovo B50-10 80QR0013GE | |
| 1280x720 Performance Combined | |
| Acer Aspire V3-372-57CW | |
| Acer Aspire E5-574-53YZ | |
| HP Pavilion 15-ab022ng | |
| Toshiba Satellite C55-C-1NE | |
| HP ProBook 450 G3 | |
| Lenovo ThinkPad E560 20EV000MGE | |
| Lenovo B50-10 80QR0013GE | |
| 3DMark | |
| 1280x720 Cloud Gate Standard Graphics | |
| Acer Aspire V3-372-57CW | |
| Acer Aspire E5-574-53YZ | |
| HP Pavilion 15-ab022ng | |
| Toshiba Satellite C55-C-1NE | |
| HP ProBook 450 G3 | |
| Lenovo ThinkPad E560 20EV000MGE | |
| Lenovo B50-10 80QR0013GE | |
| 1920x1080 Fire Strike Graphics | |
| HP Pavilion 15-ab022ng | |
| Acer Aspire V3-372-57CW | |
| Toshiba Satellite C55-C-1NE | |
| Acer Aspire E5-574-53YZ | |
| HP ProBook 450 G3 | |
| Lenovo ThinkPad E560 20EV000MGE | |
| 1920x1080 Ice Storm Extreme Graphics | |
| Acer Aspire V3-372-57CW | |
| 3DMark 11 Performance | 2567 points | |
| 3DMark Ice Storm Standard Score | 46105 points | |
| 3DMark Cloud Gate Standard Score | 6995 points | |
| 3DMark Fire Strike Score | 1083 points | |
Help | ||
| BioShock Infinite | |
| 1920x1080 Ultra Preset, DX11 (DDOF) | |
| Acer Aspire V3-372-57CW | |
| Acer Aspire E5-574-53YZ | |
| 1366x768 High Preset | |
| Acer Aspire V3-372-57CW | |
| Acer Aspire E5-574-53YZ | |
| Toshiba Satellite C55-C-1NE | |
| Lenovo ThinkPad E560 20EV000MGE | |
| Lenovo B50-10 80QR0013GE | |
| 1366x768 Medium Preset | |
| Acer Aspire V3-372-57CW | |
| Acer Aspire E5-574-53YZ | |
| Toshiba Satellite C55-C-1NE | |
| Lenovo ThinkPad E560 20EV000MGE | |
| Lenovo B50-10 80QR0013GE | |
| 1280x720 Very Low Preset | |
| Acer Aspire V3-372-57CW | |
| Acer Aspire E5-574-53YZ | |
| Toshiba Satellite C55-C-1NE | |
| Lenovo ThinkPad E560 20EV000MGE | |
| Lenovo B50-10 80QR0013GE | |
| low | med. | high | ultra | |
|---|---|---|---|---|
| Hitman: Absolution (2012) | 35.5 | 26 | 21.8 | 13.6 |
| BioShock Infinite (2013) | 74.2 | 44.8 | 38.2 | 8.9 |
| Middle-earth: Shadow of Mordor (2014) | 41.2 | 26.4 | 14.6 | 11.6 |
Noise level
| Idle |
| 31 / 31 / 31 dB(A) |
| Load |
| 39.1 / 41 dB(A) |
 | ||
30 dB silent 40 dB(A) audible 50 dB(A) loud |
||
min: | ||
| Acer Aspire E5-574-53YZ Iris Graphics 550, 6267U, Toshiba MQ02ABD100H | HP ProBook 450 G3 HD Graphics 520, 6200U, Seagate ST500LM021-1KJ15 | Lenovo ThinkPad E560 20EV000MGE HD Graphics 520, 6100U, Western Digital WD Black Mobile 500GB (WD5000LPLX) | HP Pavilion 15-ab022ng GeForce 940M, 5500U, HGST Travelstar 5K1000 HTS541010A9E680 | Lenovo B50-10 80QR0013GE HD Graphics (Bay Trail), N3540, Seagate Momentus Thin ST500LT012-1DG142 | Toshiba Satellite C55-C-1NE GeForce 920M, 5005U, Toshiba MQ01ABD100 | |
|---|---|---|---|---|---|---|
| Noise | 9% | -1% | -15% | 0% | -2% | |
| off / environment * (dB) | 28.8 | 31.2 -8% | 31.2 -8% | 31.3 -9% | ||
| Idle Minimum * (dB) | 31 | 29.7 4% | 32.3 -4% | 34.5 -11% | 33.5 -8% | 32.1 -4% |
| Idle Average * (dB) | 31 | 29.7 4% | 32.3 -4% | 34.5 -11% | 33.5 -8% | 32.1 -4% |
| Idle Maximum * (dB) | 31 | 29.7 4% | 32.5 -5% | 34.5 -11% | 33.5 -8% | 33.1 -7% |
| Load Average * (dB) | 39.1 | 33.1 15% | 36 8% | 44.1 -13% | 33.5 14% | 37.8 3% |
| Load Maximum * (dB) | 41 | 34.2 17% | 38.8 5% | 52.5 -28% | 33.5 18% | 37.7 8% |
* ... smaller is better
(±) The maximum temperature on the upper side is 43.2 °C / 110 F, compared to the average of 36.8 °C / 98 F, ranging from 21 to 71 °C for the class Multimedia.
(±) The bottom heats up to a maximum of 42 °C / 108 F, compared to the average of 39.1 °C / 102 F
(+) In idle usage, the average temperature for the upper side is 30.1 °C / 86 F, compared to the device average of 31.3 °C / 88 F.
(+) The palmrests and touchpad are reaching skin temperature as a maximum (34.8 °C / 94.6 F) and are therefore not hot.
(-) The average temperature of the palmrest area of similar devices was 28.7 °C / 83.7 F (-6.1 °C / -10.9 F).
Acer Aspire E5-574-53YZ audio analysis
(-) | not very loud speakers (62.7 dB)
Bass 100 - 315 Hz
(-) | nearly no bass - on average 23.2% lower than median
(±) | linearity of bass is average (12% delta to prev. frequency)
Mids 400 - 2000 Hz
(+) | balanced mids - only 4.5% away from median
(±) | linearity of mids is average (7.6% delta to prev. frequency)
Highs 2 - 16 kHz
(±) | higher highs - on average 7.1% higher than median
(±) | linearity of highs is average (9.7% delta to prev. frequency)
Overall 100 - 16.000 Hz
(-) | overall sound is not linear (30.3% difference to median)
Compared to same class
» 96% of all tested devices in this class were better, 2% similar, 3% worse
» The best had a delta of 5%, average was 17%, worst was 45%
Compared to all devices tested
» 89% of all tested devices were better, 3% similar, 9% worse
» The best had a delta of 4%, average was 23%, worst was 134%
Apple MacBook 12 (Early 2016) 1.1 GHz audio analysis
(+) | speakers can play relatively loud (83.6 dB)
Bass 100 - 315 Hz
(±) | reduced bass - on average 11.3% lower than median
(±) | linearity of bass is average (14.2% delta to prev. frequency)
Mids 400 - 2000 Hz
(+) | balanced mids - only 2.4% away from median
(+) | mids are linear (5.5% delta to prev. frequency)
Highs 2 - 16 kHz
(+) | balanced highs - only 2% away from median
(+) | highs are linear (4.5% delta to prev. frequency)
Overall 100 - 16.000 Hz
(+) | overall sound is linear (10.2% difference to median)
Compared to same class
» 7% of all tested devices in this class were better, 2% similar, 90% worse
» The best had a delta of 5%, average was 18%, worst was 53%
Compared to all devices tested
» 5% of all tested devices were better, 1% similar, 94% worse
» The best had a delta of 4%, average was 23%, worst was 134%
| Off / Standby | |
| Idle | |
| Load |
|
Key:
min: | |
| Acer Aspire E5-574-53YZ 6267U, Iris Graphics 550, Toshiba MQ02ABD100H, TN, 1920x1080, 15.6" | HP ProBook 450 G3 6200U, HD Graphics 520, Seagate ST500LM021-1KJ15, TN LED, 1920x1080, 15.6" | Lenovo ThinkPad E560 20EV000MGE 6100U, HD Graphics 520, Western Digital WD Black Mobile 500GB (WD5000LPLX), TN LED, 1366x768, 15.6" | HP Pavilion 15-ab022ng 5500U, GeForce 940M, HGST Travelstar 5K1000 HTS541010A9E680, TN LED, 1920x1080, 15.6" | Lenovo B50-10 80QR0013GE N3540, HD Graphics (Bay Trail), Seagate Momentus Thin ST500LT012-1DG142, TN LED, 1366x768, 15.6" | Toshiba Satellite C55-C-1NE 5005U, GeForce 920M, Toshiba MQ01ABD100, TN, 1366x768, 15.6" | Acer Aspire V3-372-57CW 6267U, Iris Graphics 550, Kingston RBU-SNS8152S3256GG2, IPS, 1920x1080, 13.3" | |
|---|---|---|---|---|---|---|---|
| Power Consumption | 41% | 49% | 26% | 56% | 44% | 37% | |
| Idle Minimum * (Watt) | 11.84 | 4.9 59% | 5.2 56% | 4.8 59% | 4.8 59% | 4.2 65% | 3.4 71% |
| Idle Average * (Watt) | 14.16 | 8.2 42% | 7.25 49% | 8.1 43% | 7.5 47% | 6.6 53% | 6.5 54% |
| Idle Maximum * (Watt) | 14.46 | 9 38% | 7.9 45% | 8.3 43% | 9.2 36% | 7.5 48% | 7 52% |
| Load Average * (Watt) | 51.69 | 30.1 42% | 25.1 51% | 42.5 18% | 16 69% | 36.3 30% | 44.5 14% |
| Load Maximum * (Watt) | 46.56 | 36.1 22% | 25.1 46% | 61.1 -31% | 15.4 67% | 36.5 22% | 49.5 -6% |
* ... smaller is better
| Acer Aspire E5-574-53YZ 6267U, Iris Graphics 550, 37 Wh | HP ProBook 450 G3 6200U, HD Graphics 520, 44 Wh | Lenovo ThinkPad E560 20EV000MGE 6100U, HD Graphics 520, 48 Wh | HP Pavilion 15-ab022ng 5500U, GeForce 940M, 41 Wh | Lenovo B50-10 80QR0013GE N3540, HD Graphics (Bay Trail), 24 Wh | Toshiba Satellite C55-C-1NE 5005U, GeForce 920M, 44 Wh | Acer Aspire V3-372-57CW 6267U, Iris Graphics 550, 51 Wh | |
|---|---|---|---|---|---|---|---|
| Battery runtime | 77% | 198% | 68% | 17% | 103% | 215% | |
| Reader / Idle (h) | 4.6 | 9.6 109% | 14.8 222% | 9.4 104% | 17.3 276% | ||
| WiFi v1.3 (h) | 3 | 5.2 73% | 9.4 213% | 4.5 50% | 3.5 17% | 6.1 103% | 6.9 130% |
| Load (h) | 1 | 1.5 50% | 2.6 160% | 1.5 50% | 3.4 240% |
Pros
Cons
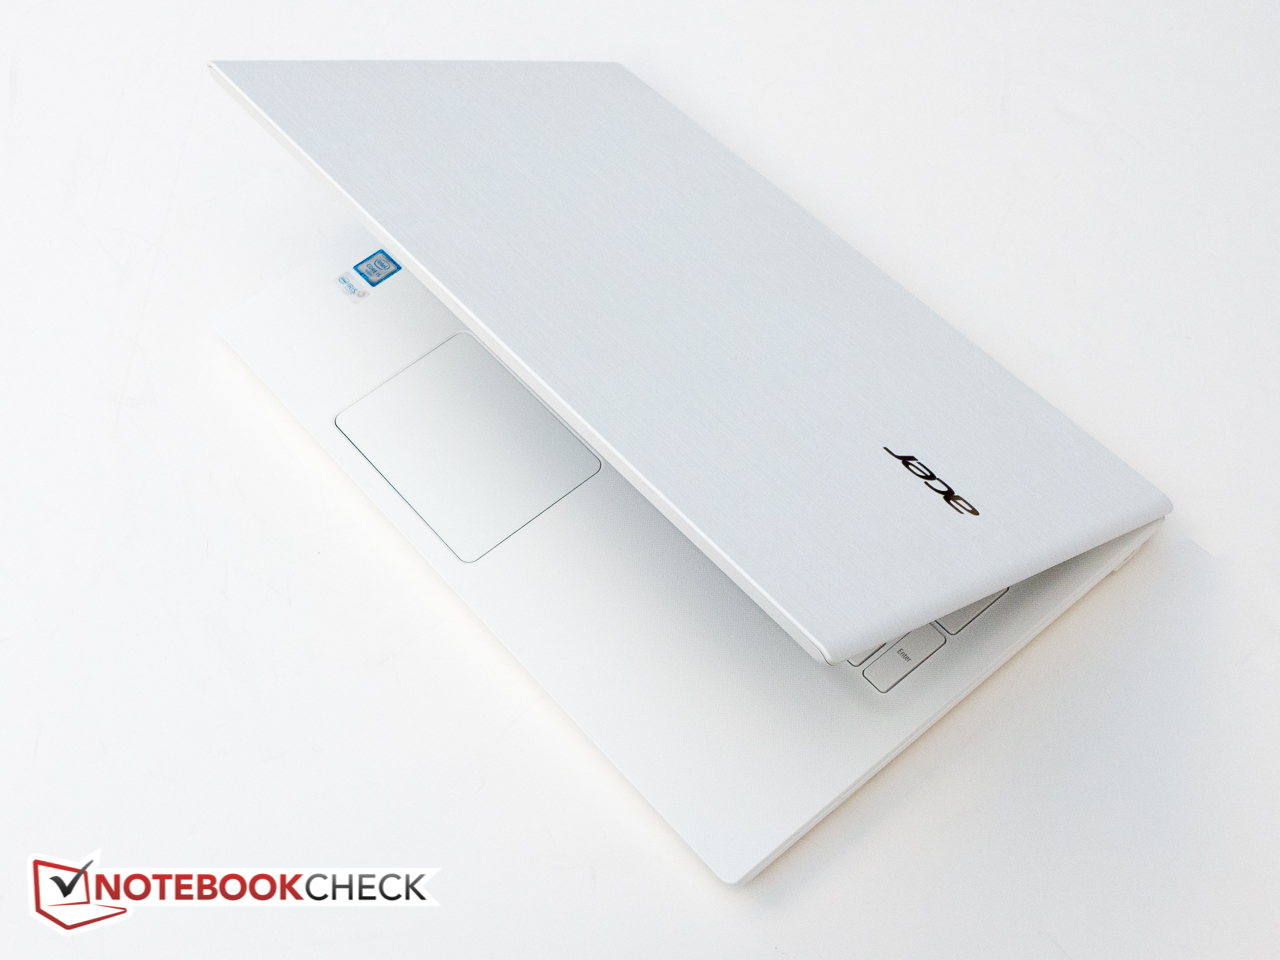
Acer Aspire E5-574-53YZ是一台高性能高品质设备,提供了合理的人体工程学设计,不过它的屏幕上盖略显脆弱。它也有两个明显的缺点,首先它的屏幕色彩十分不准确,同时不具备适合户外使用的亮度。除此之外,它的电池续航也很短。我们不太明白为什么它的功耗相比其他同类机型会如此高,不过Acer肯定需要重新回到设计步骤,改进它的功效。作为桌面式的文字处理和网络浏览设备,同时偶尔玩一玩游戏,E5是个不坏的选择。
正在寻找实惠型设备的用户可能会对Aspire E5十分满意,如果便携型不是特别关键的话。
注:本文是基于完整评测的缩减版本,阅读完整的英文评测,请点击这里。
Acer Aspire E5-574-53YZ
- 09/15/2016 v5.1 (old)
Bernhard Pechlaner
Price comparison
