Apple MacBook Pro 13 (2016年末, 2.9 GHz i5, Touch Bar) 笔记本电脑简短评测
| Networking | |
| iperf3 transmit AX12 | |
| Apple MacBook Pro 15 2016 (2.6 GHz, 450) (Klaus I211) | |
| Apple MacBook Pro 13 2016 (2.9 GHz) | |
| Apple MacBook Pro 13 2016 (Klaus I211) | |
| Dell XPS 13 9360 QHD+ i7 | |
| Lenovo ThinkPad T460s-20FA003GGE | |
| iperf3 receive AX12 | |
| Apple MacBook Pro 13 2016 (2.9 GHz) | |
| Apple MacBook Pro 15 2016 (2.6 GHz, 450) (Klaus I211) | |
| Apple MacBook Pro 13 2016 (Klaus I211) | |
| Dell XPS 13 9360 QHD+ i7 | |
| Lenovo ThinkPad T460s-20FA003GGE | |
| |||||||||||||||||||||||||
Brightness Distribution: 90 %
Center on Battery: 569 cd/m²
Contrast: 1016:1 (Black: 0.56 cd/m²)
ΔE ColorChecker Calman: 1.4 | ∀{0.5-29.43 Ø4.71}
ΔE Greyscale Calman: 1.8 | ∀{0.09-98 Ø4.96}
99.3% sRGB (Argyll 1.6.3 3D)
78.4% AdobeRGB 1998 (Argyll 1.6.3 3D)
87.6% AdobeRGB 1998 (Argyll 3D)
99.9% sRGB (Argyll 3D)
99.2% Display P3 (Argyll 3D)
Gamma: 2.16
CCT: 6877 K
| Apple MacBook Pro 13 2016 (2.9 GHz) APPA033, , 2560x1600, 13.3" | Apple MacBook Pro 13 2016 APPA034, , 2560x1600, 13.3" | Apple MacBook Pro Retina 13 inch 2015-03 APPA02A, , 2560x1600, 13.3" | Dell XPS 13 9360 QHD+ i7 Sharp SHP144A, , 3200x1800, 13.3" | Lenovo ThinkPad X1 Carbon 20FB003RGE VVX14T058J00, , 2560x1440, 14" | |
|---|---|---|---|---|---|
| Display | -1% | -20% | -25% | -20% | |
| Display P3 Coverage (%) | 99.2 | 97.1 -2% | 65.9 -34% | 62.8 -37% | 66.7 -33% |
| sRGB Coverage (%) | 99.9 | 99.8 0% | 97 -3% | 89.4 -11% | 94.7 -5% |
| AdobeRGB 1998 Coverage (%) | 87.6 | 86.7 -1% | 67.4 -23% | 64.6 -26% | 68.4 -22% |
| Response Times | 2% | 27% | 31% | ||
| Response Time Grey 50% / Grey 80% * (ms) | 47.2 ? | 47.2 ? -0% | 43.6 ? 8% | 44 ? 7% | |
| Response Time Black / White * (ms) | 53 ? | 51.6 ? 3% | 29.2 ? 45% | 24 ? 55% | |
| PWM Frequency (Hz) | 220 ? | ||||
| Screen | -2% | -12% | -48% | -39% | |
| Brightness middle (cd/m²) | 569 | 600 5% | 361 -37% | 396.2 -30% | 272 -52% |
| Brightness (cd/m²) | 542 | 564 4% | 342 -37% | 357 -34% | 268 -51% |
| Brightness Distribution (%) | 90 | 89 -1% | 81 -10% | 84 -7% | 95 6% |
| Black Level * (cd/m²) | 0.56 | 0.57 -2% | 0.361 36% | 0.266 52% | 0.32 43% |
| Contrast (:1) | 1016 | 1053 4% | 1000 -2% | 1489 47% | 850 -16% |
| Colorchecker dE 2000 * | 1.4 | 1.5 -7% | 1.82 -30% | 3.9 -179% | 2.61 -86% |
| Colorchecker dE 2000 max. * | 2.9 | 2.9 -0% | 3.26 -12% | 7.58 -161% | 6.43 -122% |
| Greyscale dE 2000 * | 1.8 | 2 -11% | 1.8 -0% | 4.16 -131% | 3.31 -84% |
| Gamma | 2.16 102% | 2.27 97% | 2.49 88% | 2.31 95% | 2.35 94% |
| CCT | 6877 95% | 6855 95% | 6417 101% | 6514 100% | 6360 102% |
| Color Space (Percent of AdobeRGB 1998) (%) | 78.4 | 77 -2% | 61.9 -21% | 57.5 -27% | 63 -20% |
| Color Space (Percent of sRGB) (%) | 99.3 | 92 -7% | 96.9 -2% | 88.7 -11% | 95 -4% |
| Total Average (Program / Settings) | -0% /
-1% | -16% /
-13% | -15% /
-33% | -9% /
-26% |
* ... smaller is better
Display Response Times
| ↔ Response Time Black to White | ||
|---|---|---|
| 53 ms ... rise ↗ and fall ↘ combined | ↗ 10 ms rise | 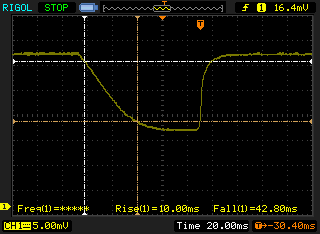 |
| ↘ 43 ms fall | ||
| The screen shows slow response rates in our tests and will be unsatisfactory for gamers. In comparison, all tested devices range from 0.1 (minimum) to 240 (maximum) ms. » 99 % of all devices are better. This means that the measured response time is worse than the average of all tested devices (19.8 ms). | ||
| ↔ Response Time 50% Grey to 80% Grey | ||
| 47.2 ms ... rise ↗ and fall ↘ combined | ↗ 19.6 ms rise | 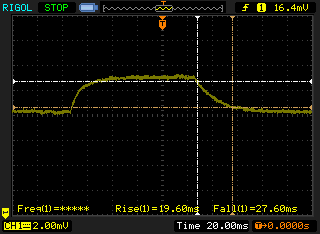 |
| ↘ 27.6 ms fall | ||
| The screen shows slow response rates in our tests and will be unsatisfactory for gamers. In comparison, all tested devices range from 0.165 (minimum) to 636 (maximum) ms. » 82 % of all devices are better. This means that the measured response time is worse than the average of all tested devices (31 ms). | ||
Screen Flickering / PWM (Pulse-Width Modulation)
| Screen flickering / PWM not detected | 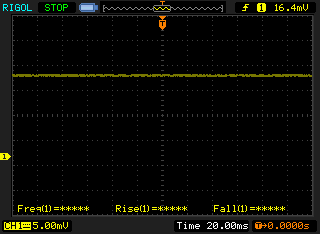 | ||
In comparison: 52 % of all tested devices do not use PWM to dim the display. If PWM was detected, an average of 7754 (minimum: 5 - maximum: 343500) Hz was measured. | |||
| PCMark 8 Home Score Accelerated v2 | 3738 points | |
| PCMark 8 Work Score Accelerated v2 | 4218 points | |
Help | ||

| 3DMark 06 Standard Score | 15951 points | |
| 3DMark 11 Performance | 2881 points | |
| 3DMark Cloud Gate Standard Score | 8105 points | |
| 3DMark Fire Strike Score | 1550 points | |
| 3DMark Time Spy Score | 620 points | |
Help | ||
| The Witcher 3 - 1024x768 Low Graphics & Postprocessing | |
| Asus Zenbook UX310UQ-GL011T | |
| Apple MacBook Pro 13 2016 (2.9 GHz) | |
| Apple MacBook Pro 13 2016 | |
| Dell XPS 13 9360 QHD+ i7 | |
| Razer Blade Stealth QHD i7-7500U | |
| Rise of the Tomb Raider - 1024x768 Lowest Preset | |
| Apple MacBook Pro 13 2016 (2.9 GHz) | |
| Apple MacBook Pro 13 2016 | |
| Dell XPS 13 9360 QHD+ i7 | |
| Razer Blade Stealth QHD i7-7500U | |
| Deus Ex Mankind Divided - 1280x720 Low Preset AF:1x | |
| Apple MacBook Pro 13 2016 (2.9 GHz) | |
| Apple MacBook Pro 13 2016 | |
| Apple MacBook Pro 13 2016 | |
| low | med. | high | ultra | |
|---|---|---|---|---|
| BioShock Infinite (2013) | 103 | 56.2 | 47.9 | 13.8 |
| The Witcher 3 (2015) | 21.6 | 14.9 | ||
| Dota 2 Reborn (2015) | 40.3 | 33.6 | ||
| Rainbow Six Siege (2015) | 52.9 | 32.3 | 19 | 14.6 |
| Rise of the Tomb Raider (2016) | 27.3 | 21.9 | ||
| Far Cry Primal (2016) | 27 | 14 | ||
| Overwatch (2016) | 86 | 58.8 | 26.2 | |
| Deus Ex Mankind Divided (2016) | 26 | |||
| Battlefield 1 (2016) | 49.6 | 29.8 | 15.1 | |
| Farming Simulator 17 (2016) | 93 | 34.7 | 20.8 | |
| Titanfall 2 (2016) | 65 | 45.2 | 17.7 | |
| Watch Dogs 2 (2016) | 23.4 | 19.9 |
Noise level
| Idle |
| 30.2 / 30.2 / 30.2 dB(A) |
| Load |
| 33 / 36.2 dB(A) |
 | ||
30 dB silent 40 dB(A) audible 50 dB(A) loud |
||
min: | ||
(±) The maximum temperature on the upper side is 45 °C / 113 F, compared to the average of 35.9 °C / 97 F, ranging from 21.4 to 59 °C for the class Subnotebook.
(+) The bottom heats up to a maximum of 39 °C / 102 F, compared to the average of 39.2 °C / 103 F
(+) In idle usage, the average temperature for the upper side is 23.9 °C / 75 F, compared to the device average of 30.8 °C / 87 F.
(+) The palmrests and touchpad are cooler than skin temperature with a maximum of 29 °C / 84.2 F and are therefore cool to the touch.
(±) The average temperature of the palmrest area of similar devices was 28.2 °C / 82.8 F (-0.8 °C / -1.4 F).
Apple MacBook Pro 13 2016 (2.9 GHz) audio analysis
(+) | speakers can play relatively loud (86.9 dB)
Bass 100 - 315 Hz
(±) | reduced bass - on average 13.2% lower than median
(±) | linearity of bass is average (10.7% delta to prev. frequency)
Mids 400 - 2000 Hz
(+) | balanced mids - only 4.1% away from median
(+) | mids are linear (6.3% delta to prev. frequency)
Highs 2 - 16 kHz
(+) | balanced highs - only 2.9% away from median
(+) | highs are linear (4% delta to prev. frequency)
Overall 100 - 16.000 Hz
(+) | overall sound is linear (12.2% difference to median)
Compared to same class
» 15% of all tested devices in this class were better, 5% similar, 80% worse
» The best had a delta of 5%, average was 18%, worst was 53%
Compared to all devices tested
» 10% of all tested devices were better, 2% similar, 88% worse
» The best had a delta of 4%, average was 23%, worst was 134%
Apple MacBook Pro 13 2016 audio analysis
(+) | speakers can play relatively loud (83.2 dB)
Bass 100 - 315 Hz
(±) | reduced bass - on average 8.4% lower than median
(-) | bass is not linear (16.7% delta to prev. frequency)
Mids 400 - 2000 Hz
(+) | balanced mids - only 4.7% away from median
(+) | mids are linear (6.3% delta to prev. frequency)
Highs 2 - 16 kHz
(+) | balanced highs - only 1.1% away from median
(+) | highs are linear (2.6% delta to prev. frequency)
Overall 100 - 16.000 Hz
(+) | overall sound is linear (9.8% difference to median)
Compared to same class
» 6% of all tested devices in this class were better, 2% similar, 92% worse
» The best had a delta of 5%, average was 18%, worst was 53%
Compared to all devices tested
» 4% of all tested devices were better, 1% similar, 95% worse
» The best had a delta of 4%, average was 23%, worst was 134%
Apple MacBook Pro 15 2016 (2.6 GHz, 450) audio analysis
(+) | speakers can play relatively loud (86 dB)
Bass 100 - 315 Hz
(±) | reduced bass - on average 6.9% lower than median
(±) | linearity of bass is average (12.7% delta to prev. frequency)
Mids 400 - 2000 Hz
(±) | higher mids - on average 5% higher than median
(±) | linearity of mids is average (9.5% delta to prev. frequency)
Highs 2 - 16 kHz
(+) | balanced highs - only 2% away from median
(+) | highs are linear (4.3% delta to prev. frequency)
Overall 100 - 16.000 Hz
(+) | overall sound is linear (9.7% difference to median)
Compared to same class
» 13% of all tested devices in this class were better, 1% similar, 85% worse
» The best had a delta of 5%, average was 17%, worst was 45%
Compared to all devices tested
» 4% of all tested devices were better, 1% similar, 95% worse
» The best had a delta of 4%, average was 23%, worst was 134%
| Off / Standby | |
| Idle | |
| Load |
|
Key:
min: | |
| Apple MacBook Pro 13 2016 (2.9 GHz) 6267U, Iris Graphics 550, 2560x1600, 13.3" | Apple MacBook Pro 13 2016 6360U, Iris Graphics 540, 2560x1600, 13.3" | Apple MacBook Pro Retina 13 inch 2015-03 5257U, Iris Graphics 6100, 2560x1600, 13.3" | Apple MacBook Air 13 inch 2015-03 5650U, HD Graphics 6000, 1440x900, 13.3" | Dell XPS 13 9360 QHD+ i7 i7-7500U, HD Graphics 620, 3200x1800, 13.3" | Lenovo ThinkPad X1 Carbon 20FB003RGE 6500U, HD Graphics 520, 2560x1440, 14" | Lenovo ThinkPad T460s-20FA003GGE 6600U, HD Graphics 520, 2560x1440, 14" | |
|---|---|---|---|---|---|---|---|
| Power Consumption | -3% | -7% | 21% | -16% | 1% | -2% | |
| Idle Minimum * (Watt) | 2.1 | 3 -43% | 2.8 -33% | 2.7 -29% | 6.4 -205% | 3.8 -81% | 3.8 -81% |
| Idle Average * (Watt) | 7.6 | 8.9 -17% | 7.8 -3% | 5.7 25% | 6.6 13% | 7.1 7% | 7.1 7% |
| Idle Maximum * (Watt) | 8.2 | 8.9 -9% | 8.1 1% | 6 27% | 6.8 17% | 7.7 6% | 7.8 5% |
| Load Average * (Watt) | 56.4 | 43.4 23% | 52.4 7% | 32.1 43% | 27.5 51% | 30.2 46% | 36.3 36% |
| Load Maximum * (Watt) | 59.8 | 42.1 30% | 62.8 -5% | 36.2 39% | 32.4 46% | 44.7 25% | 46 23% |
* ... smaller is better
| Apple MacBook Pro 13 2016 (2.9 GHz) 6267U, Iris Graphics 550, 49.2 Wh | Apple MacBook Pro 13 2016 6360U, Iris Graphics 540, 54 Wh | Apple MacBook Pro Retina 13 inch 2015-03 5257U, Iris Graphics 6100, 75 Wh | Apple MacBook Air 13 inch 2015-03 5650U, HD Graphics 6000, 54 Wh | Dell XPS 13 9360 QHD+ i7 i7-7500U, HD Graphics 620, 60 Wh | Lenovo ThinkPad X1 Carbon 20FB003RGE 6500U, HD Graphics 520, 52 Wh | Lenovo ThinkPad T460s-20FA003GGE 6600U, HD Graphics 520, 49 Wh | |
|---|---|---|---|---|---|---|---|
| Battery runtime | 34% | 20% | 28% | 46% | 18% | -22% | |
| H.264 (h) | 8.1 | 10.3 27% | 9.7 20% | 8.5 5% | 6.6 -19% | ||
| WiFi v1.3 (h) | 9.4 | 11.4 21% | 9 -4% | 10.3 10% | 8.6 -9% | 7.2 -23% | 5.7 -39% |
| Load (h) | 1.1 | 1.7 55% | 1.6 45% | 1.6 45% | 2.2 100% | 1.9 73% | 1 -9% |
Pros
Cons
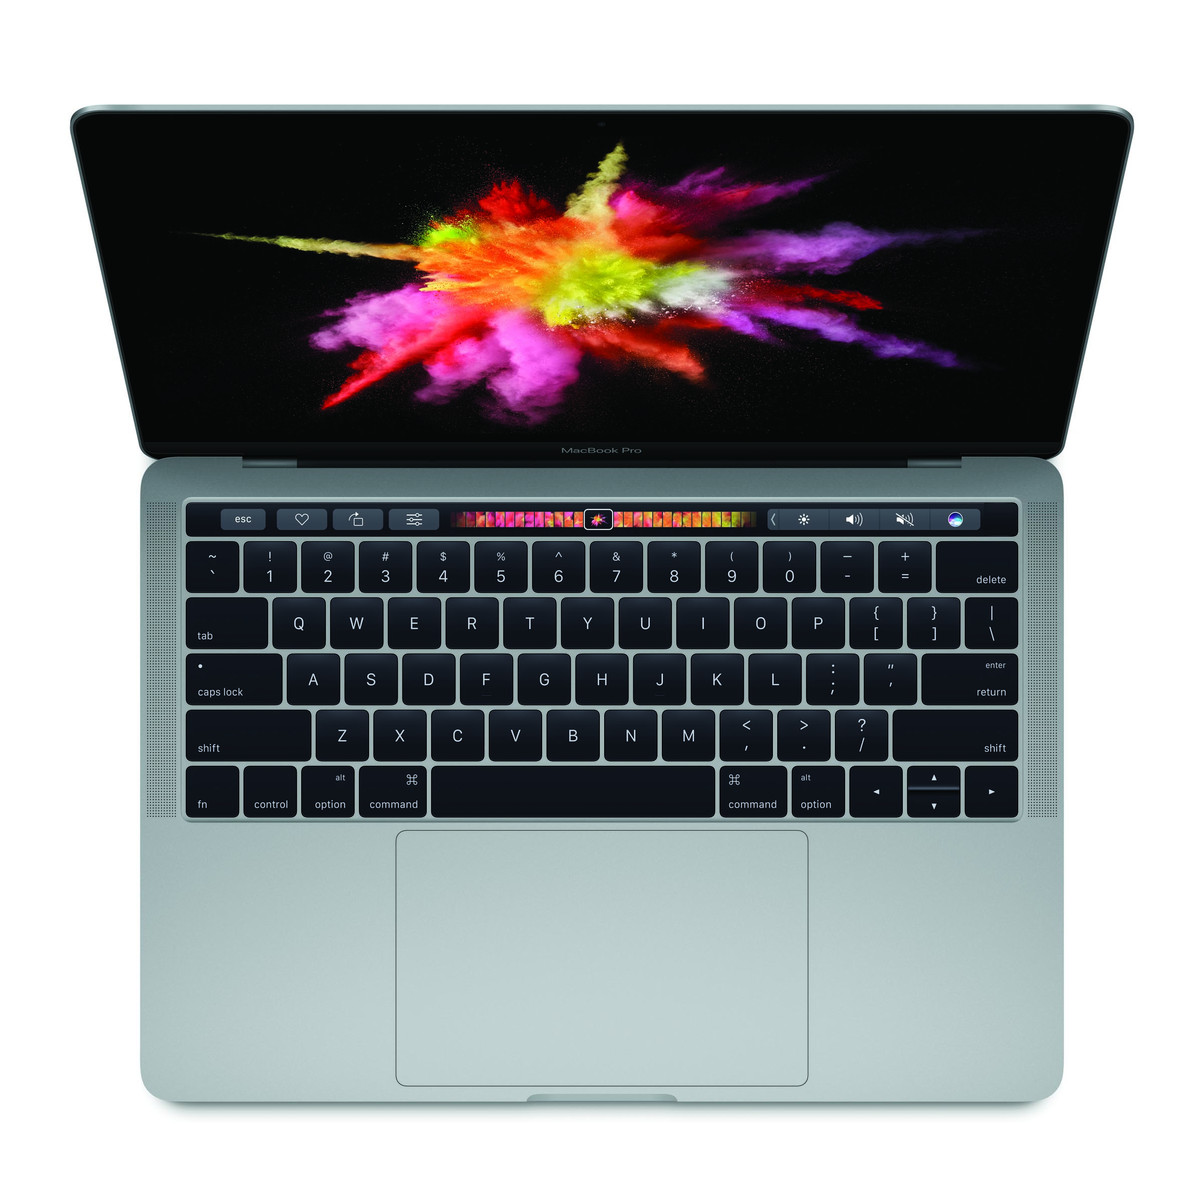
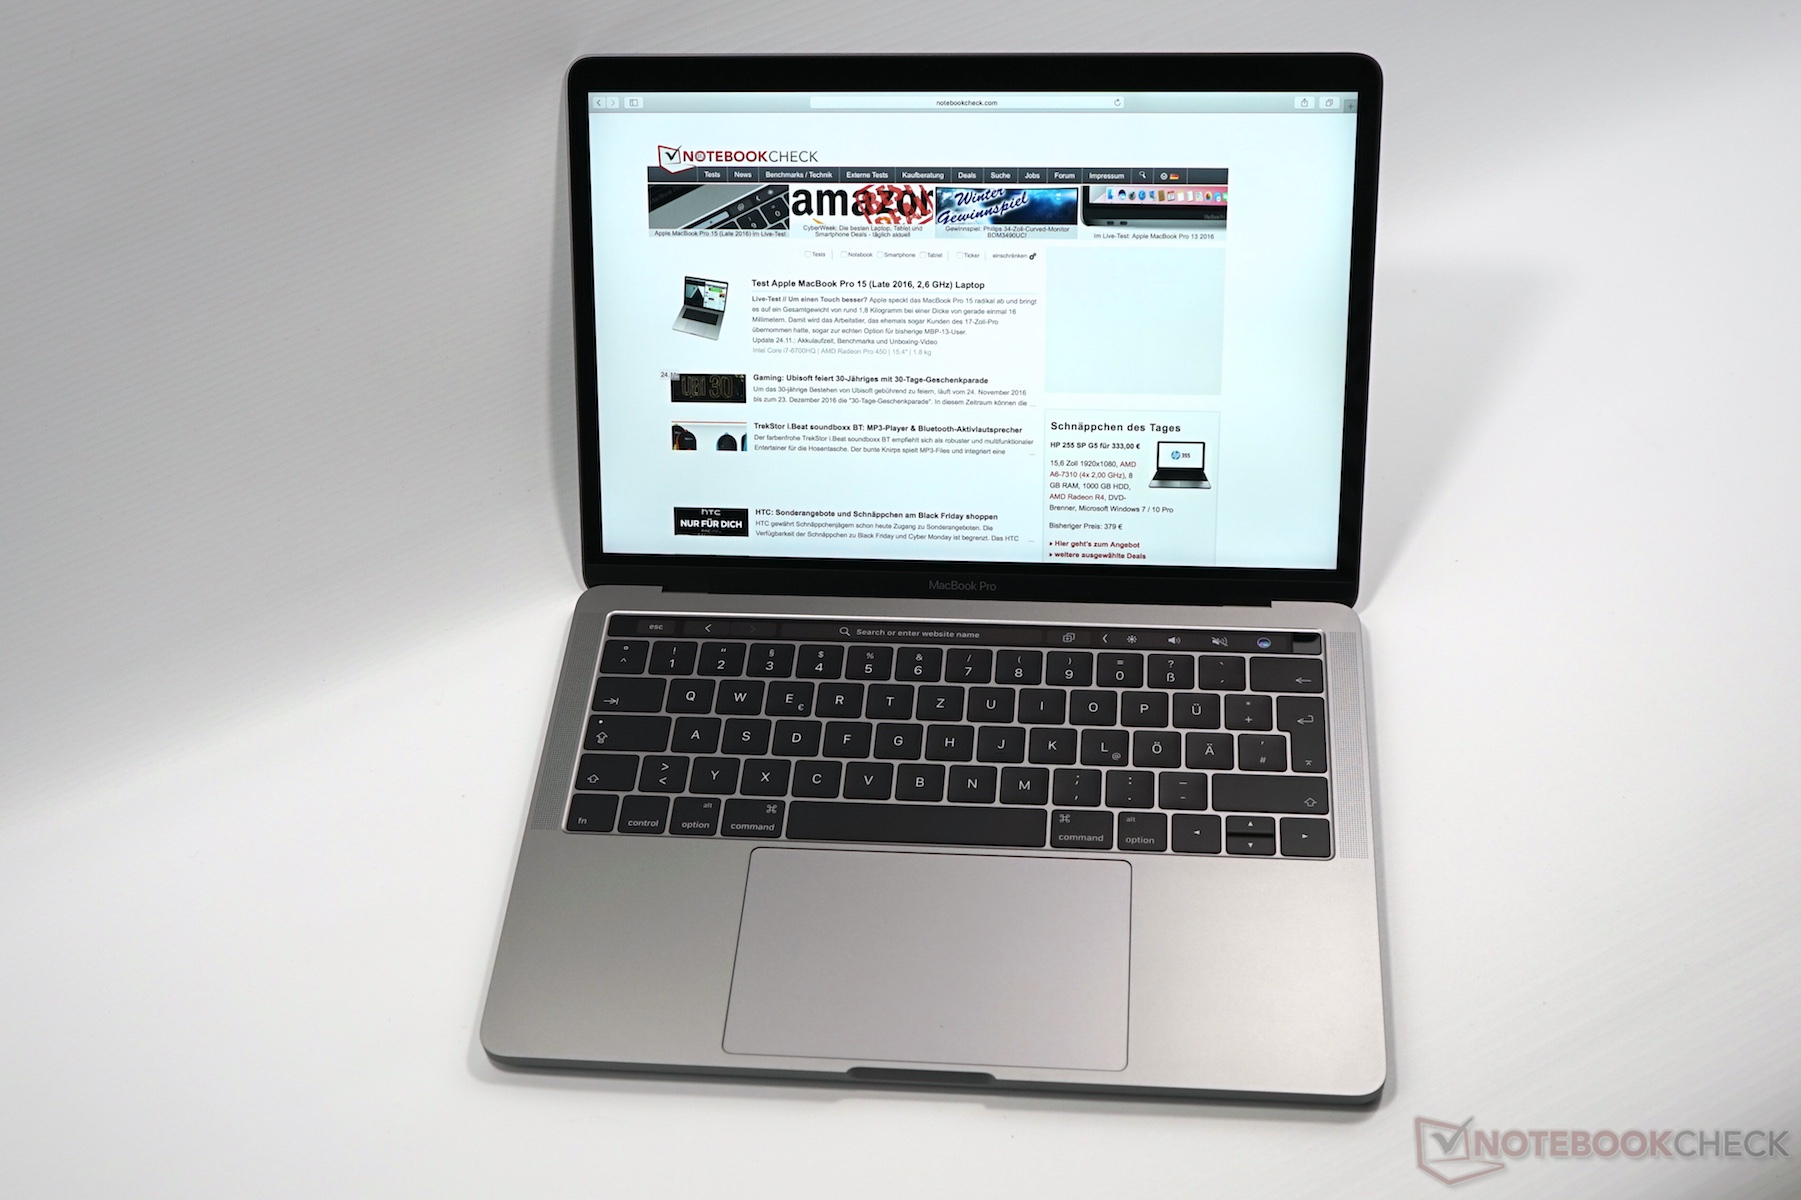
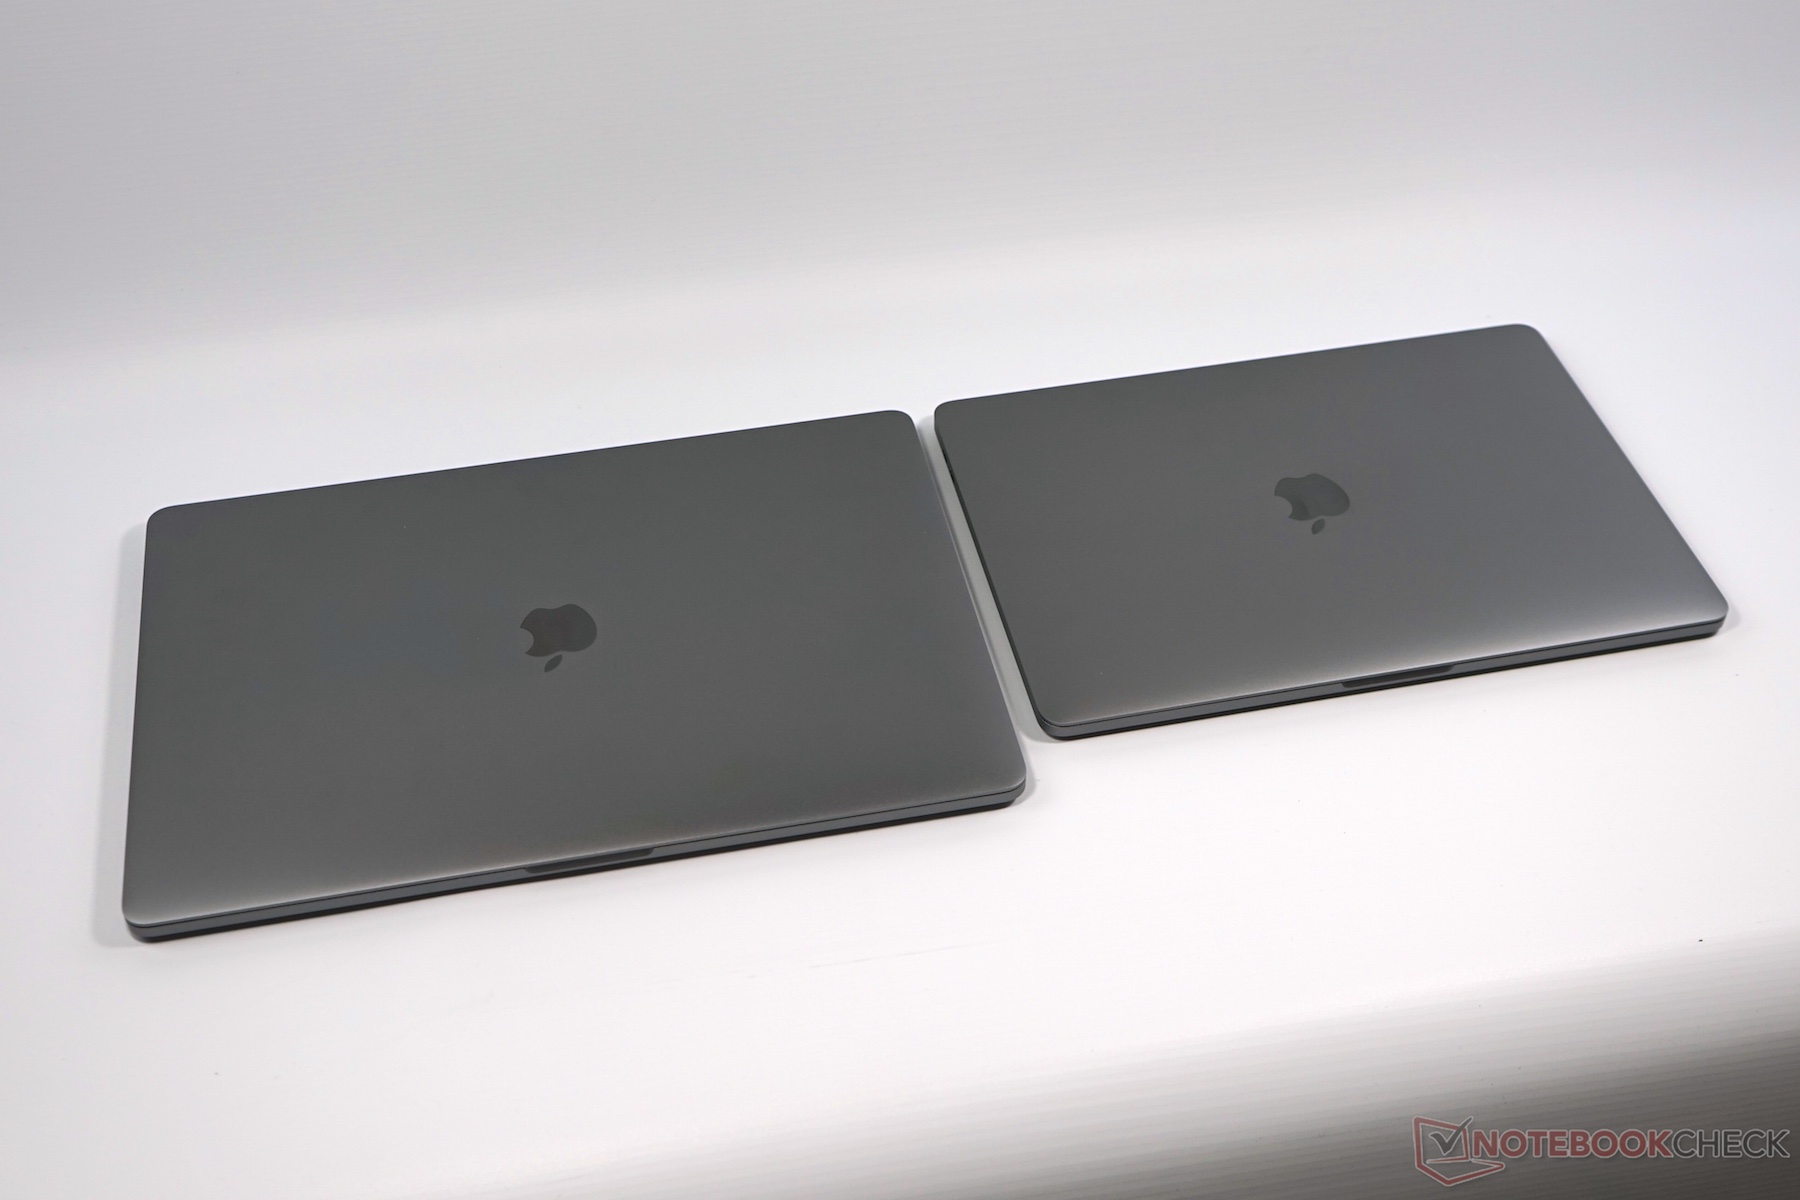
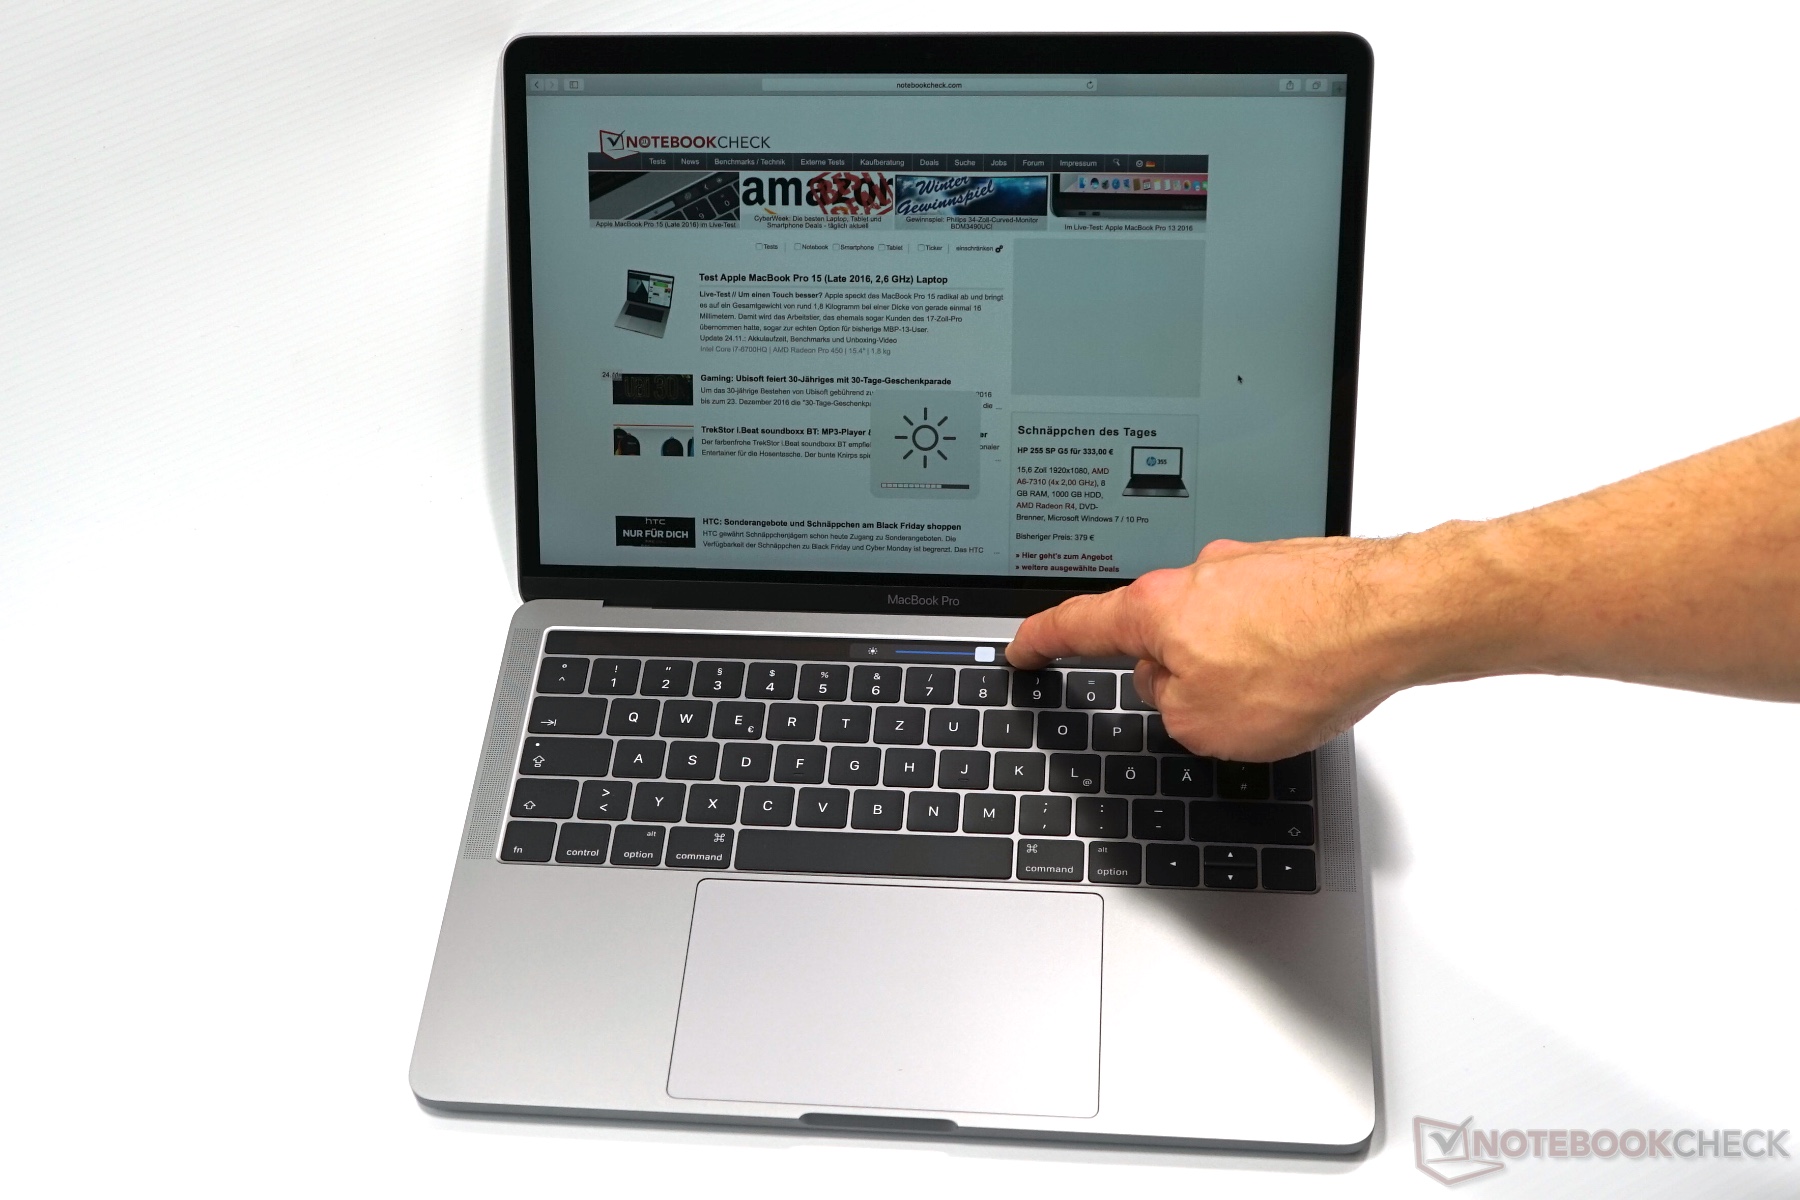
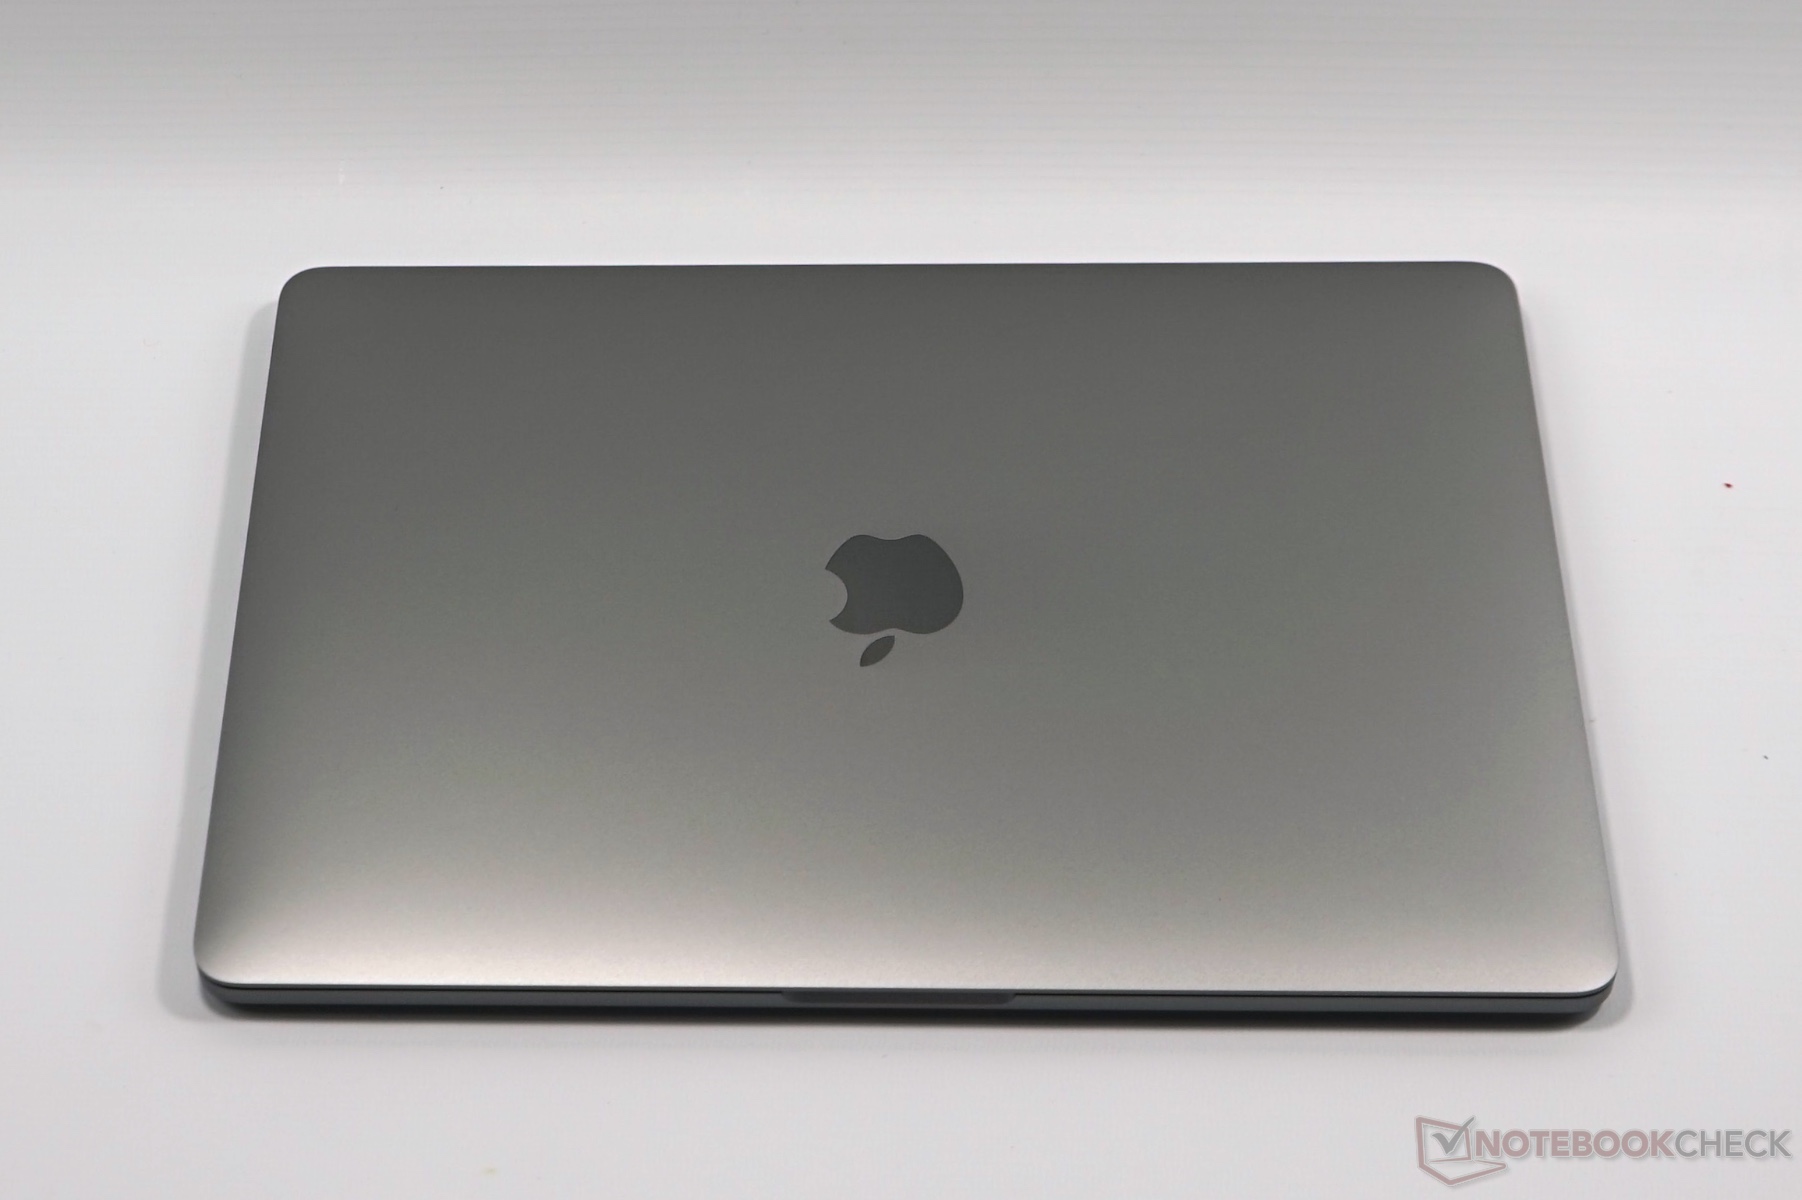
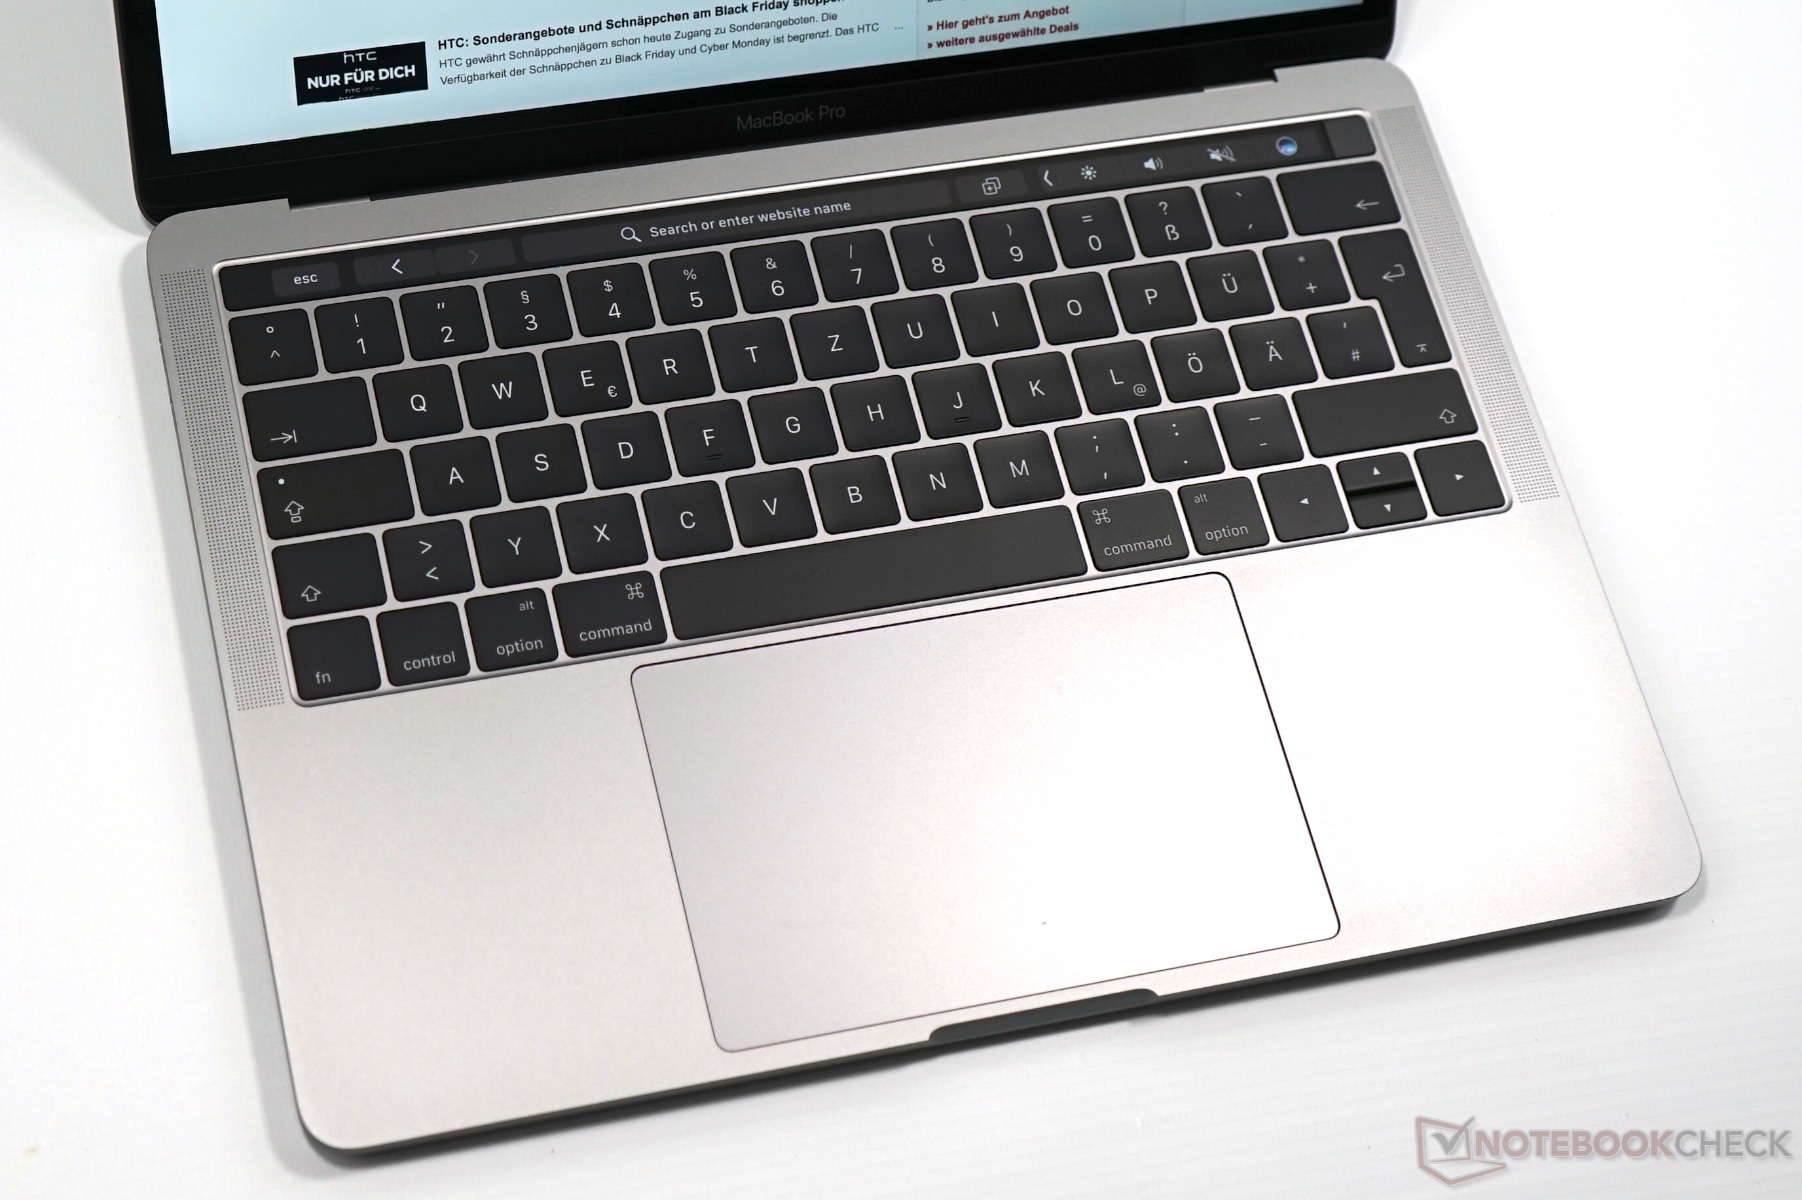
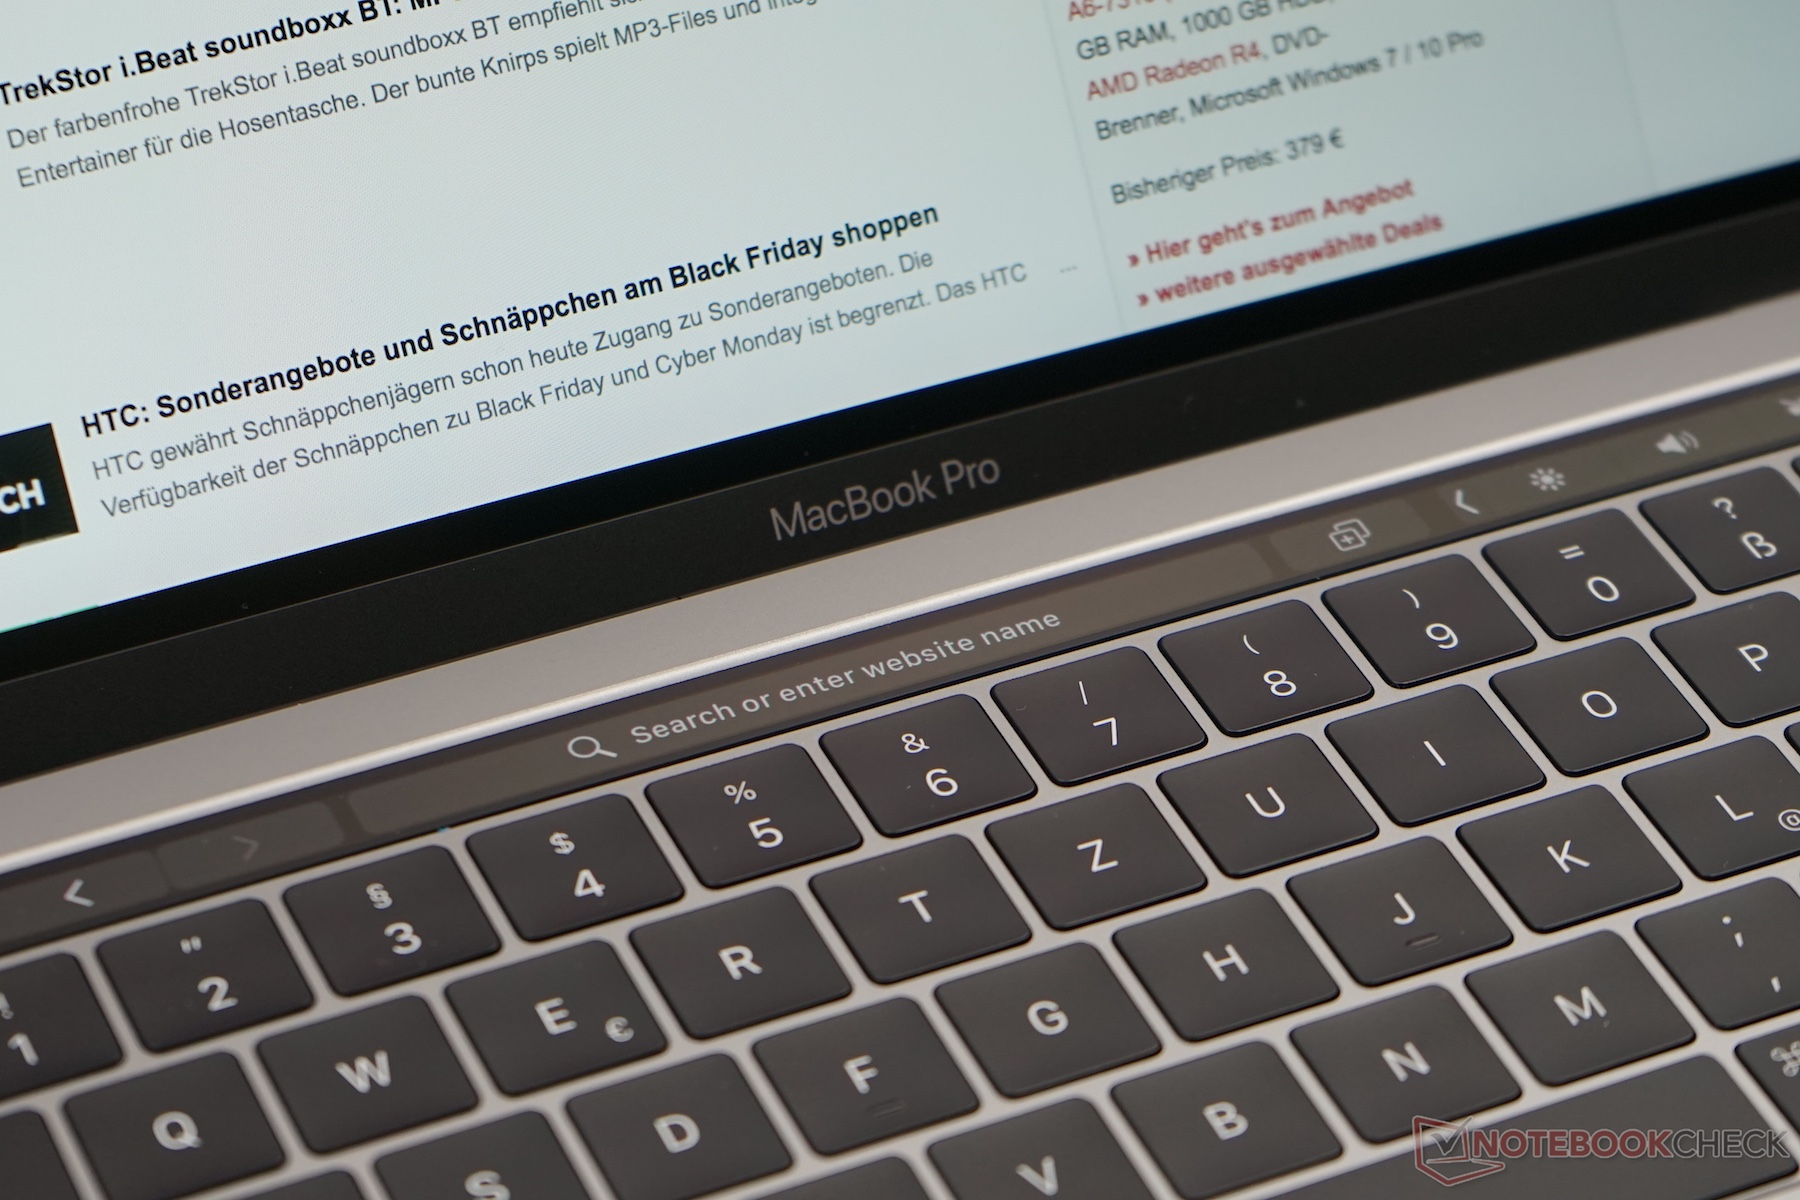
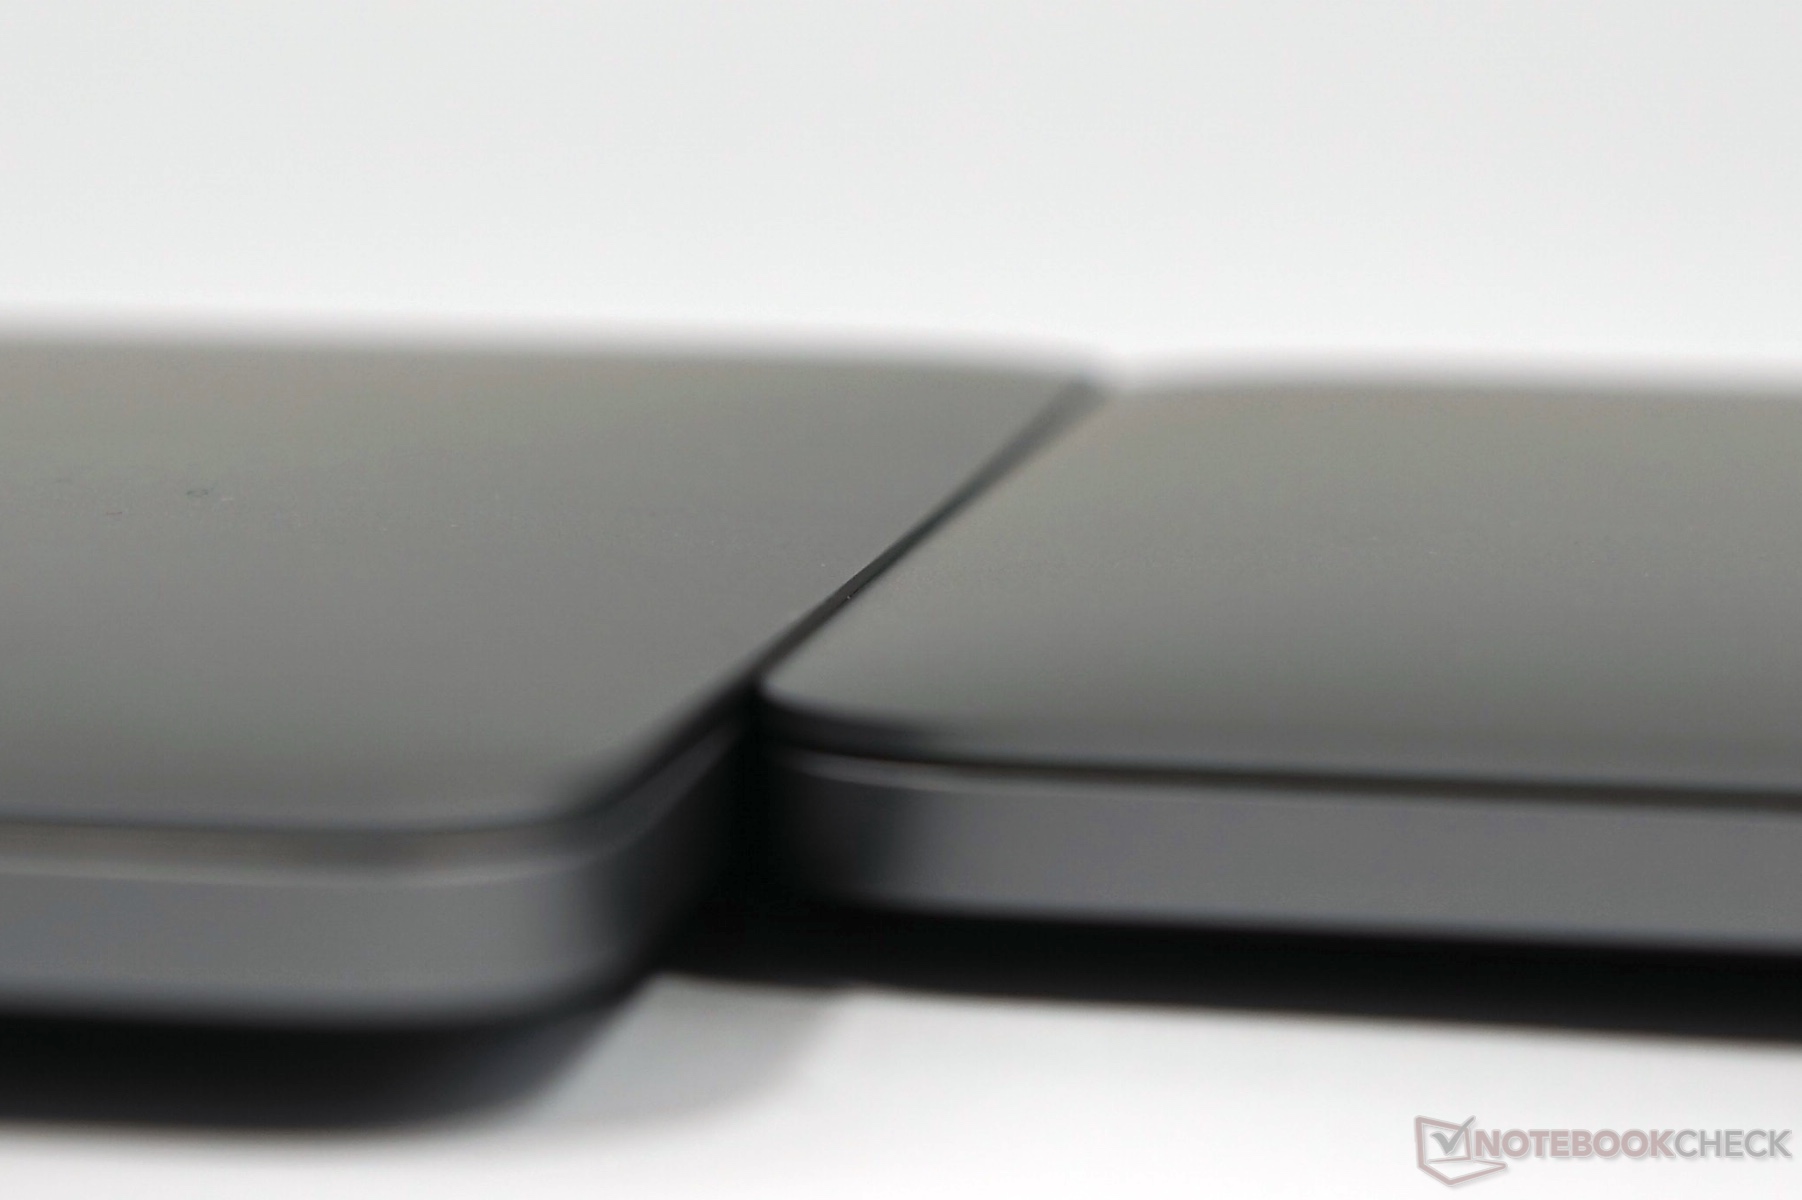
最新的Apple MacBook Pro 13的两个机型和我们预期的一样有很多相似之处。包括出色的机身,尽管减了肥仍然可以保持坚固。同时它们也都为用户带来了市场上最绚丽的最明亮的屏幕之一。它们的触控版也相比以前尺寸更大。除了Touch Bar之外,它们的键盘也一样。由于键程有所缩短,用户需要花一些时间适应,不过它在实际使用中响应准确,可以让人满意。Apple对Touch Bar的设计显得十分成熟,不过它能否成功还要看软件支持的情况。目前我们感觉它最多只能算是个噱头,如果你只是想要普通功能键的功能的话,如改变屏幕亮度,它反而会让使用变得更加复杂。而在电源键中集成Touch ID感应器则毋庸置疑是个实用的创意。
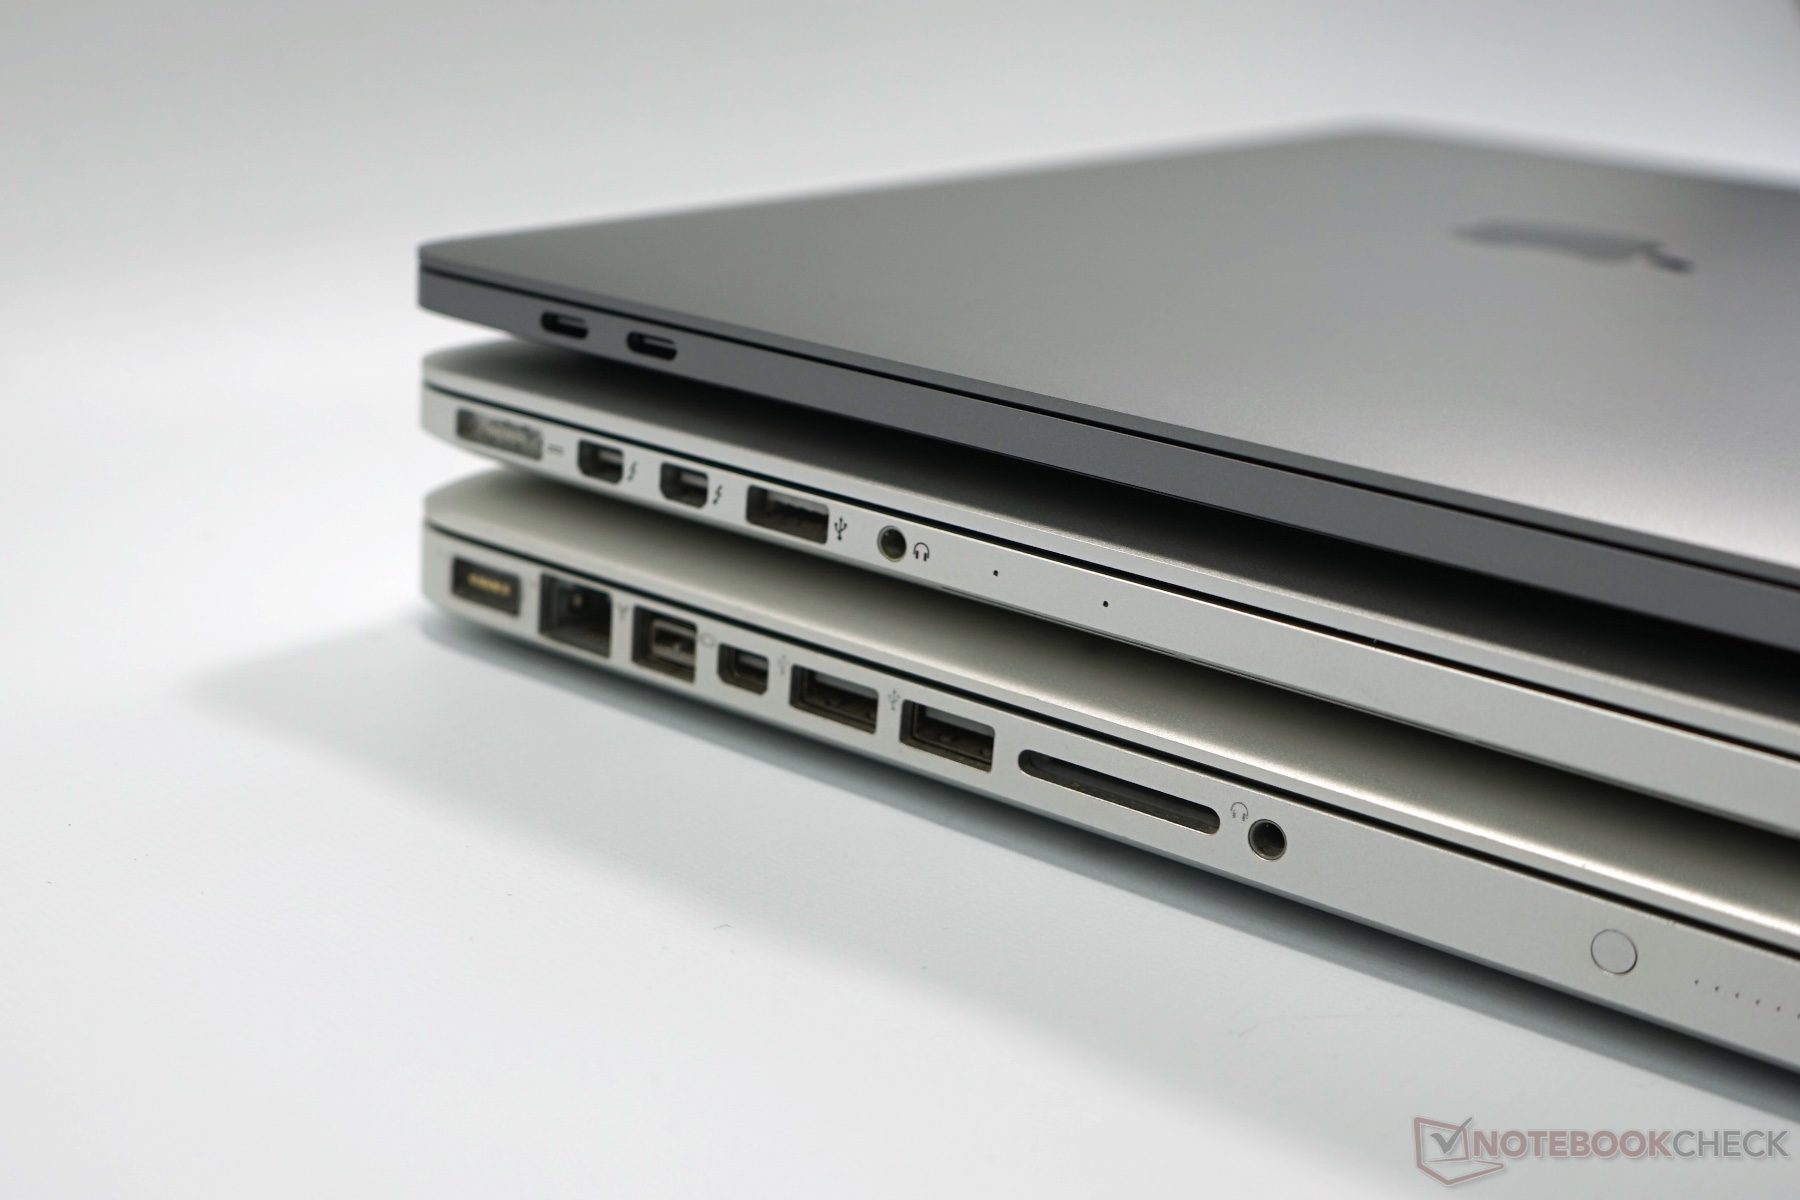
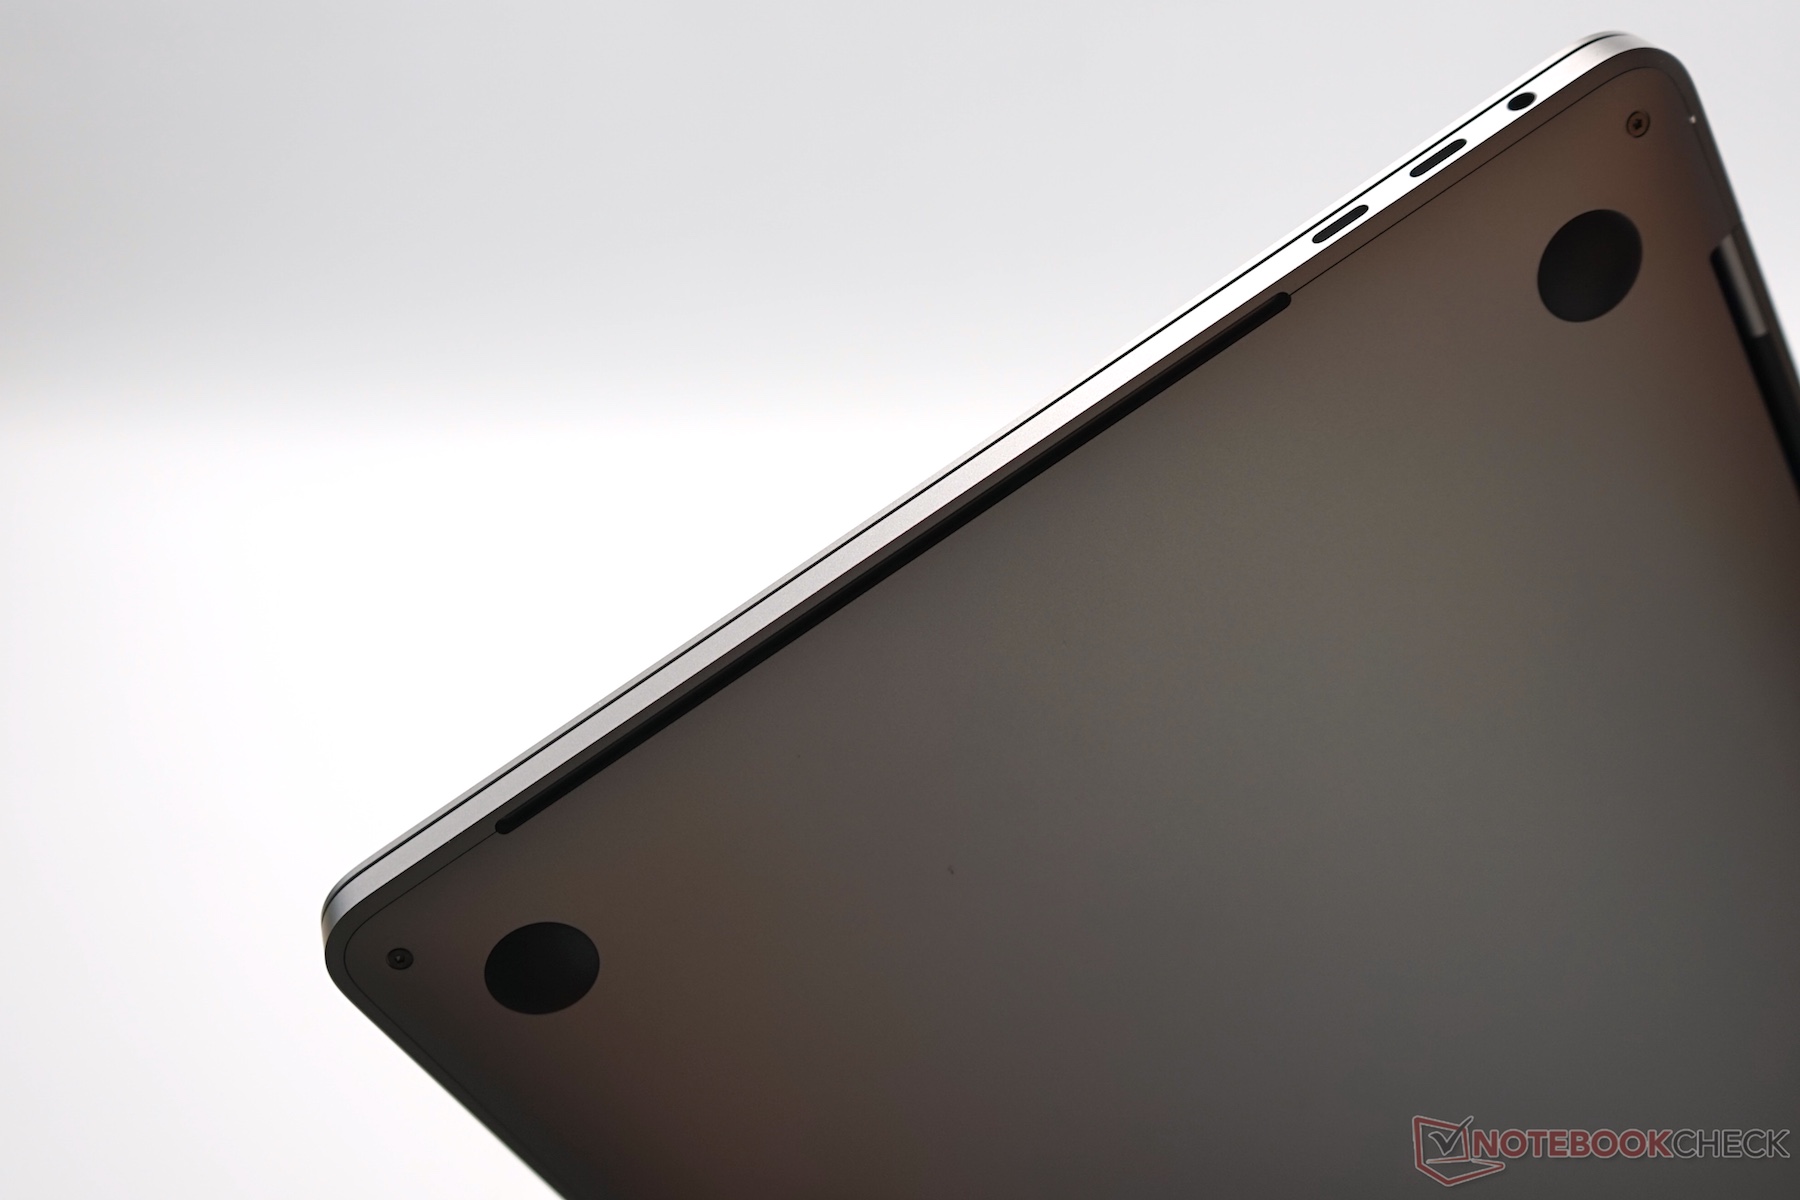
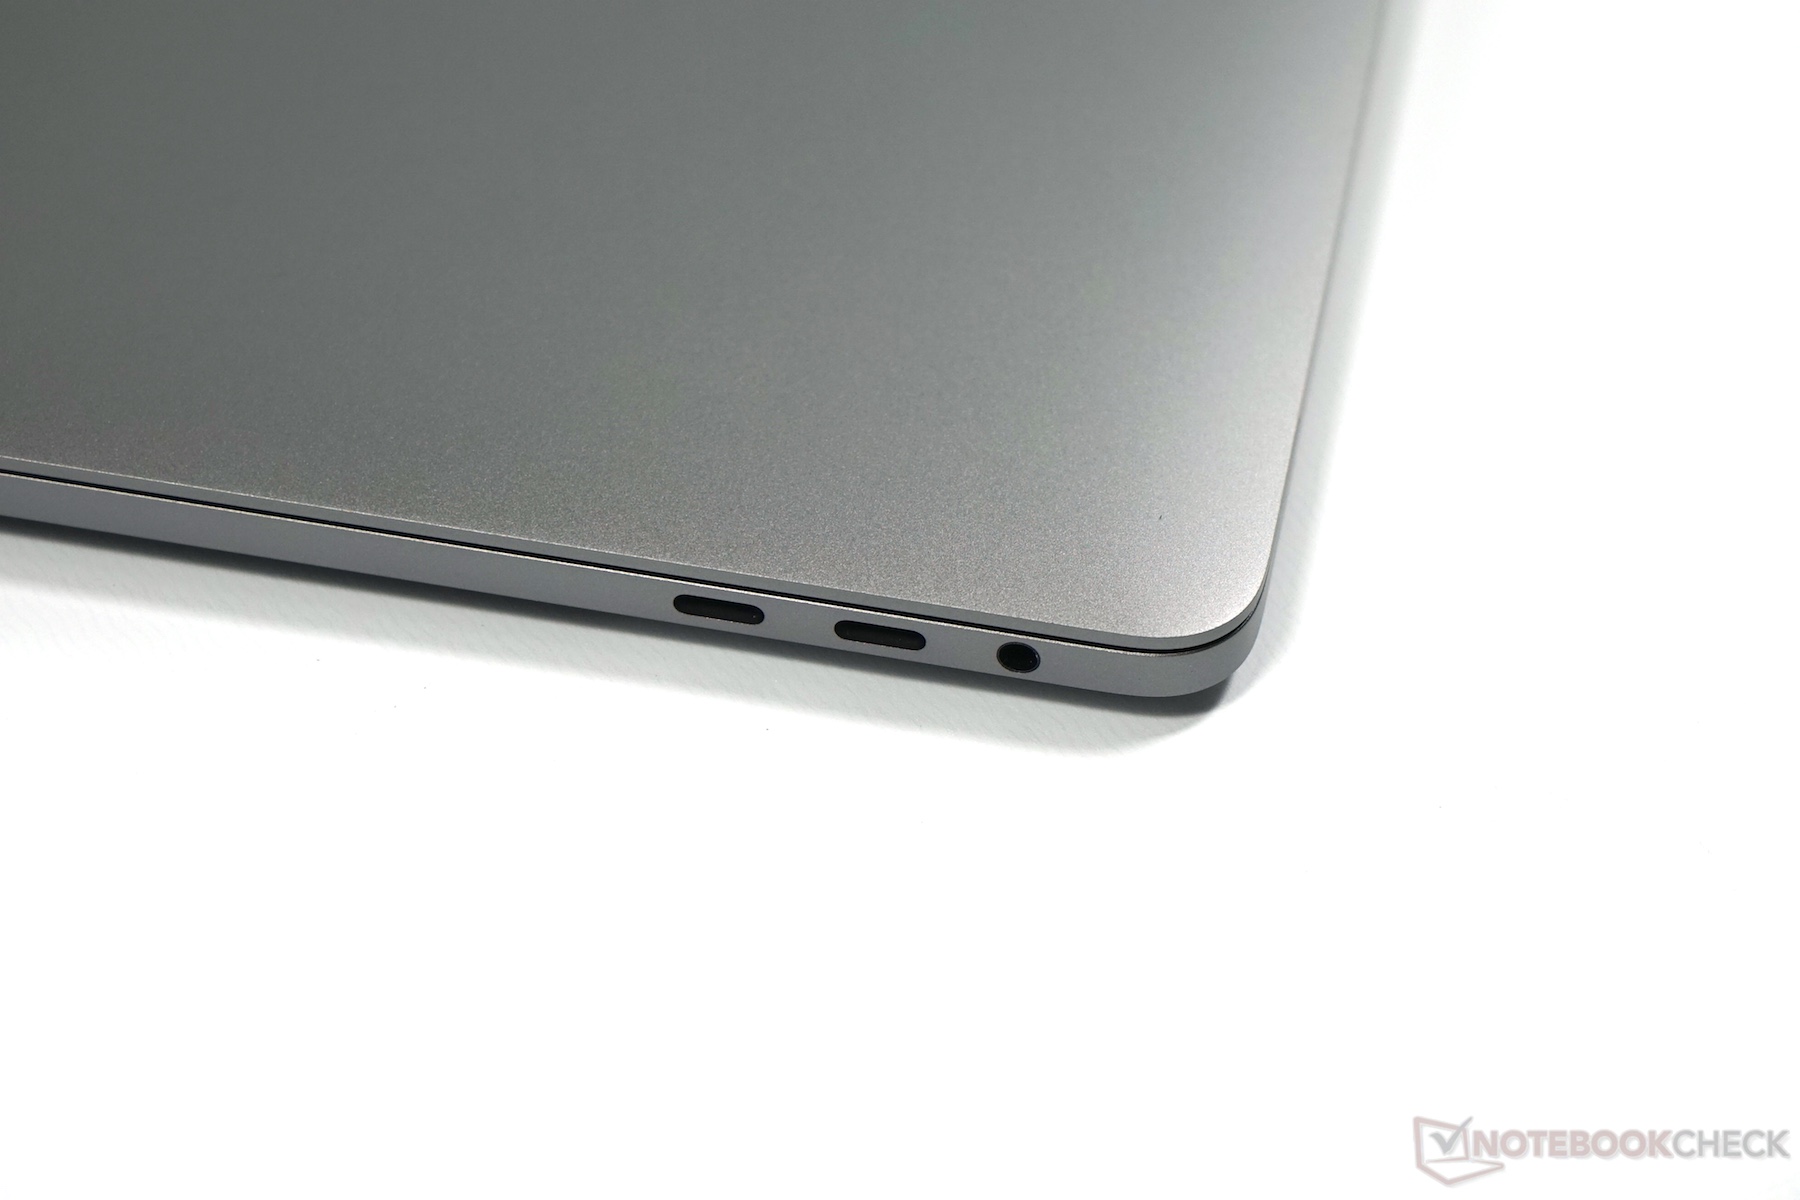
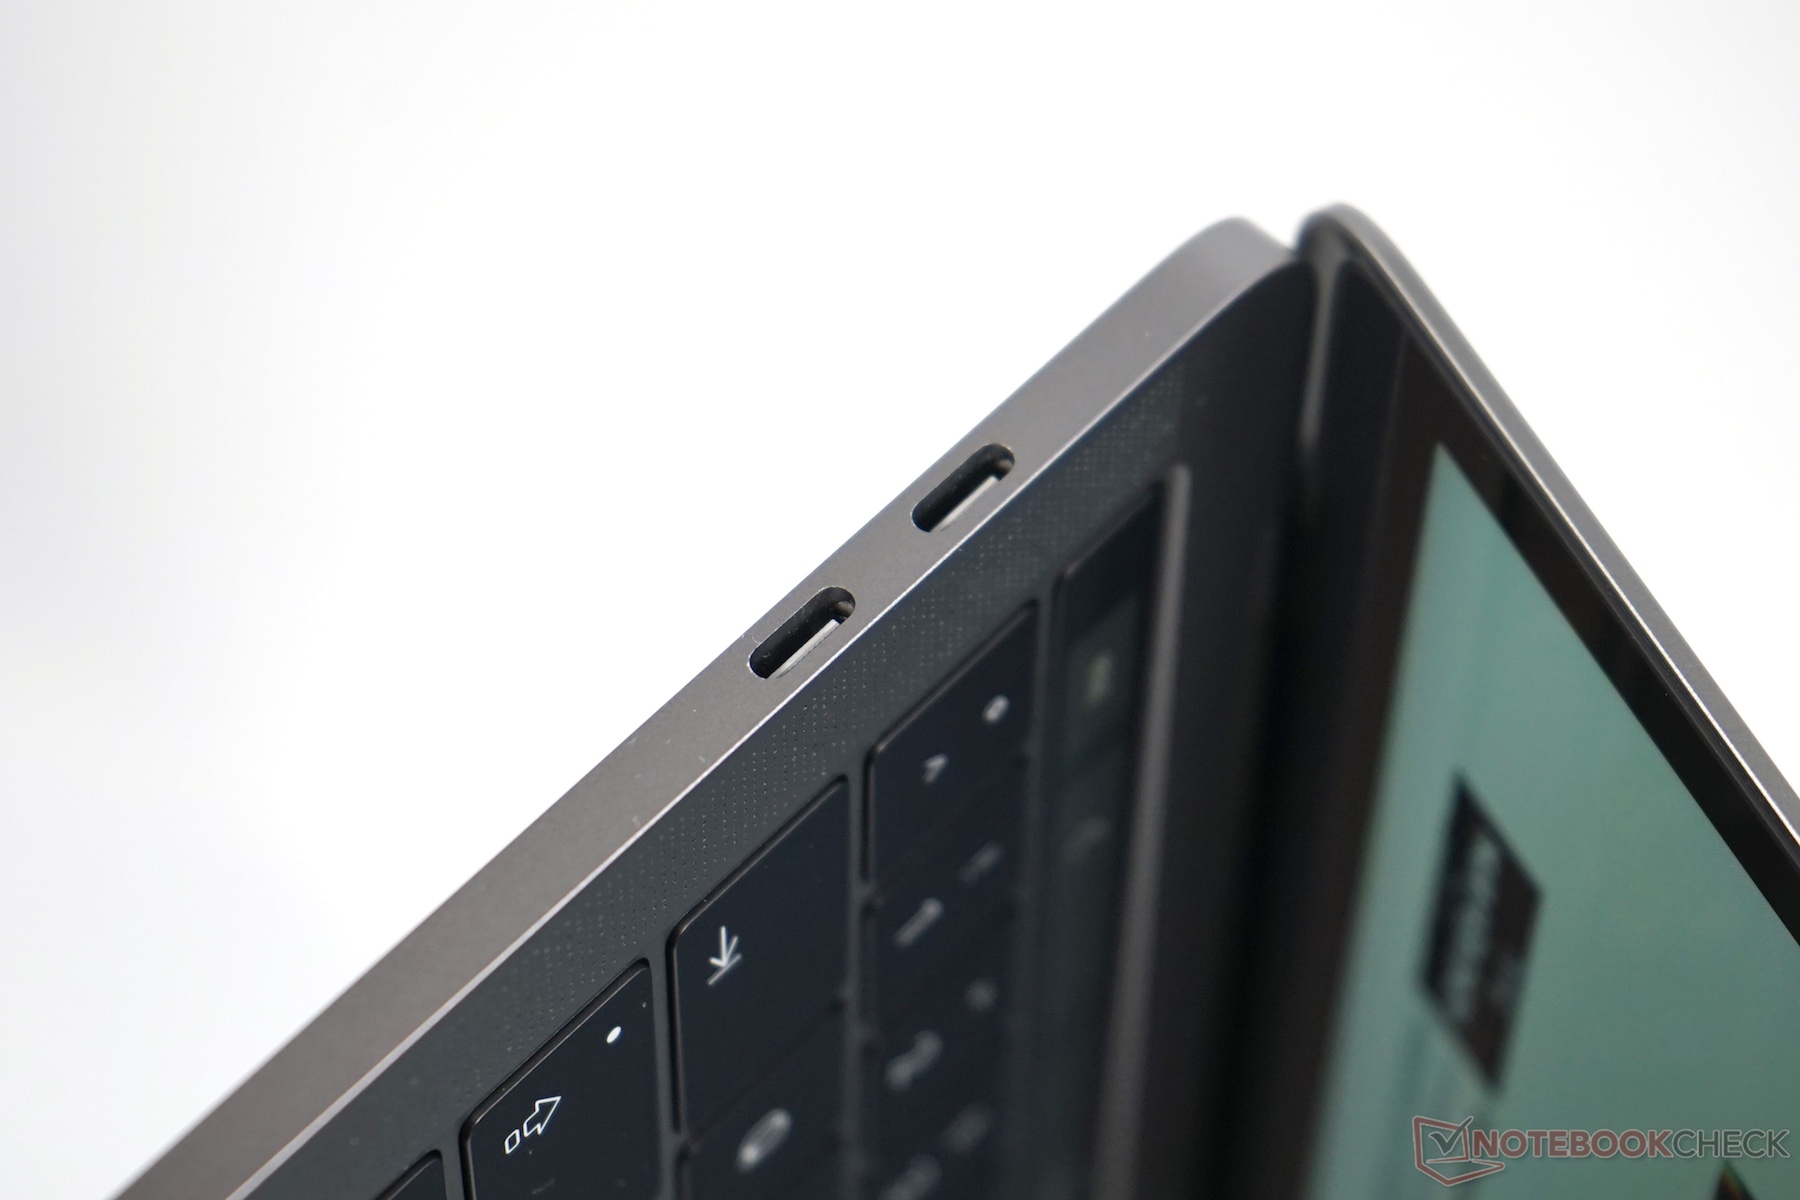
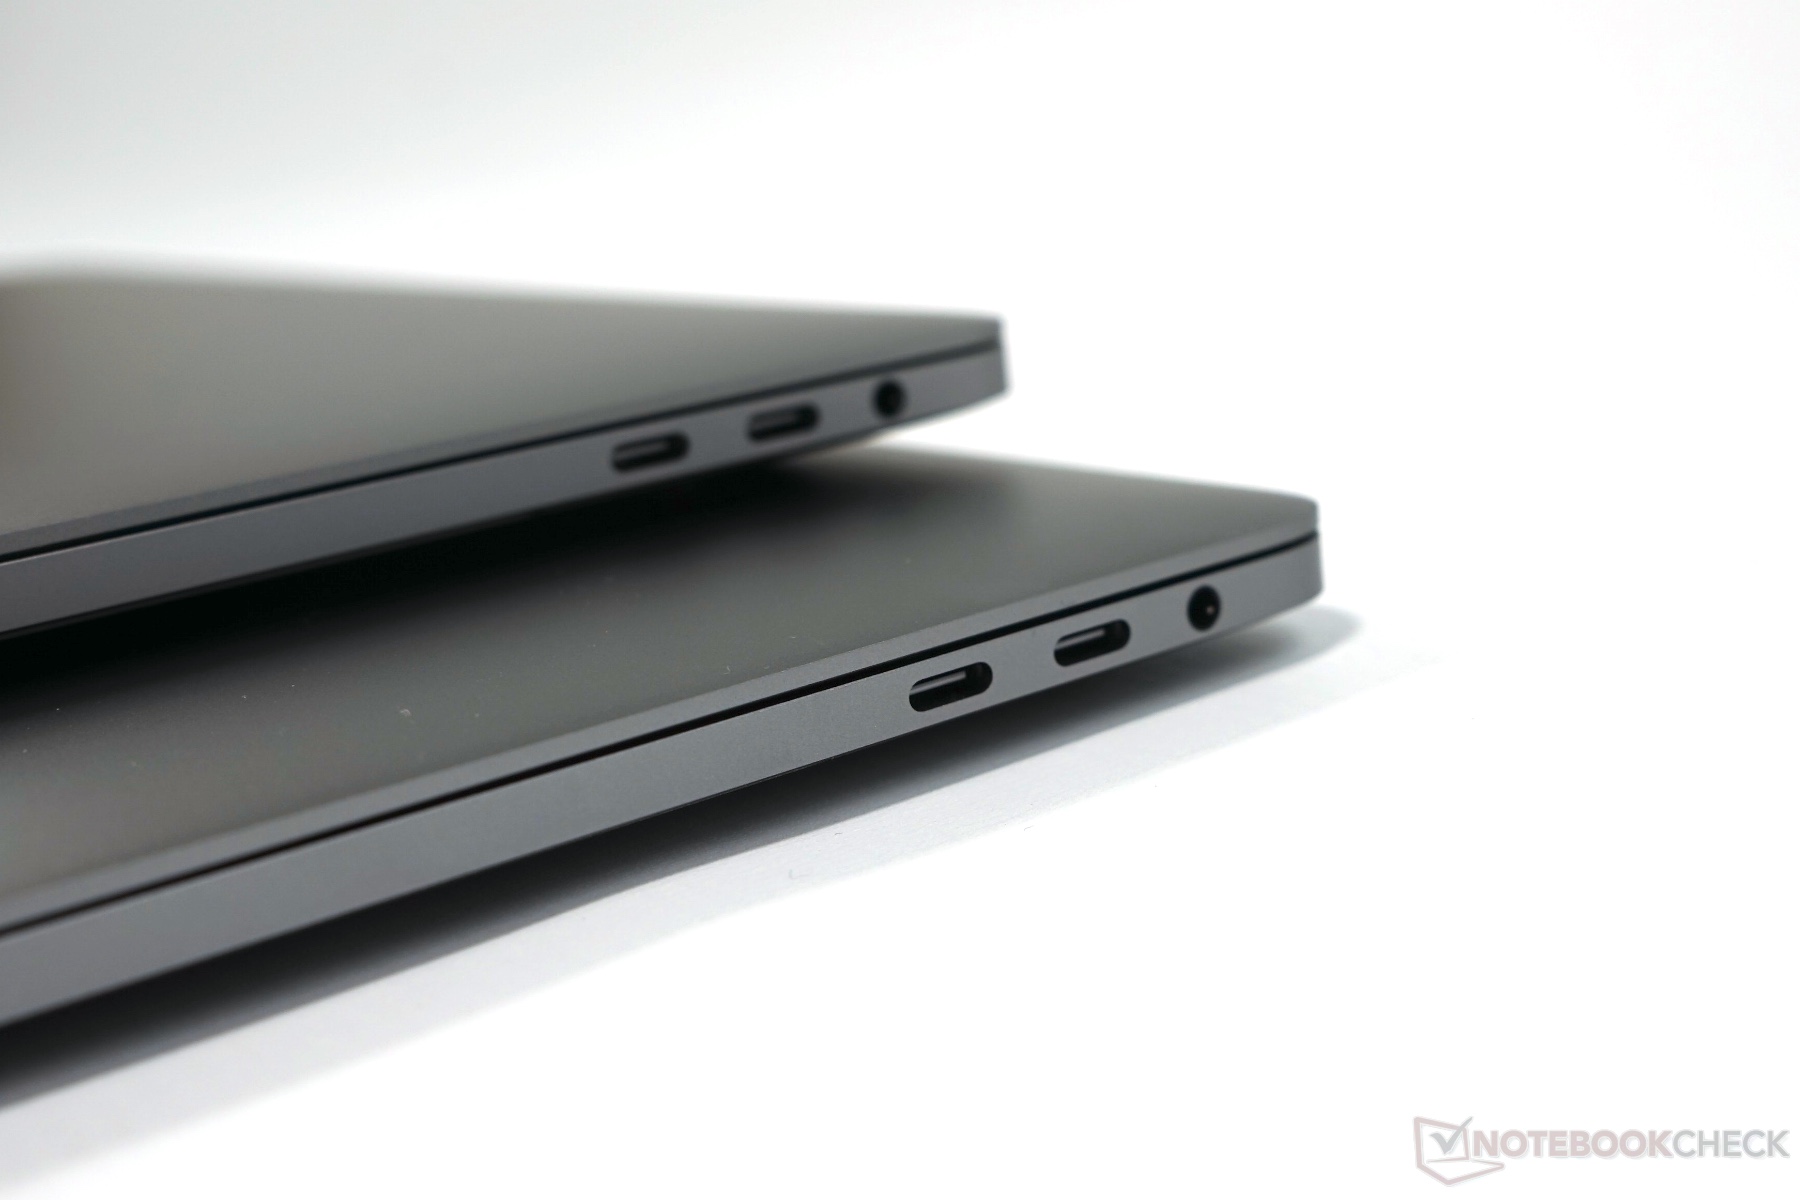
Apple为售价更高的机型以是否搭配Touch Bar作为区分。但如果你打开机身的话,会发现它几乎完全不同。散热系统得到了增强以适合更强劲的硬件(28瓦vs.15瓦热设计功率),我们对此十分欣赏。也因此其他组件位置有所改变,同时电池容量有所降低。这在一定程度上影响了电池续航,特别是在负载下它只能坚持一个小时多一点。在实际使用电池续航测试中,搭配Touch Bar的更贵机型也被无Touch Bar机型击败,不过它在同类设备中依然属于领先水平。但是两个额外Thunderbolt 3接口的设计有些不够负责,和尺寸更大的MacBook Pro 15不同,你将无法使用最高带宽,我们感觉在这个情况下还不如搭配一些其他接口。
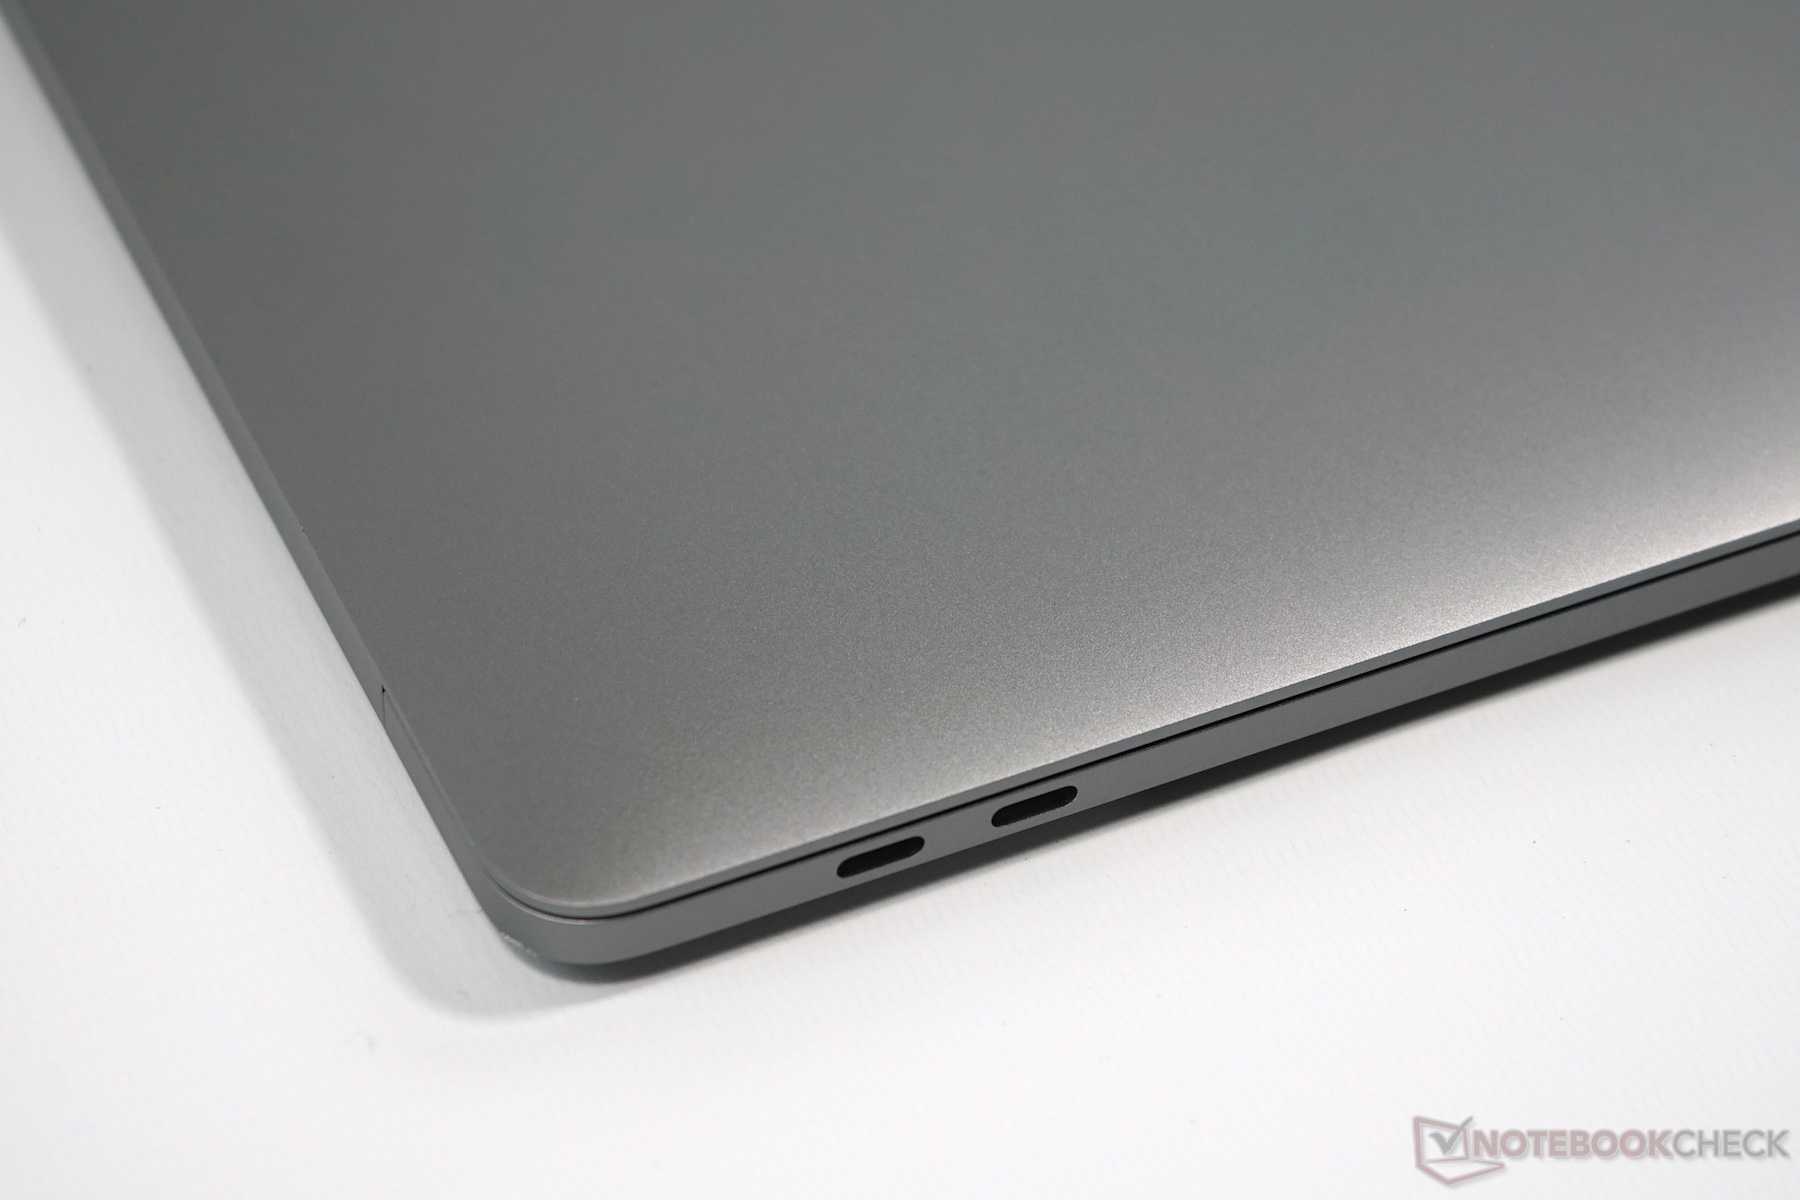
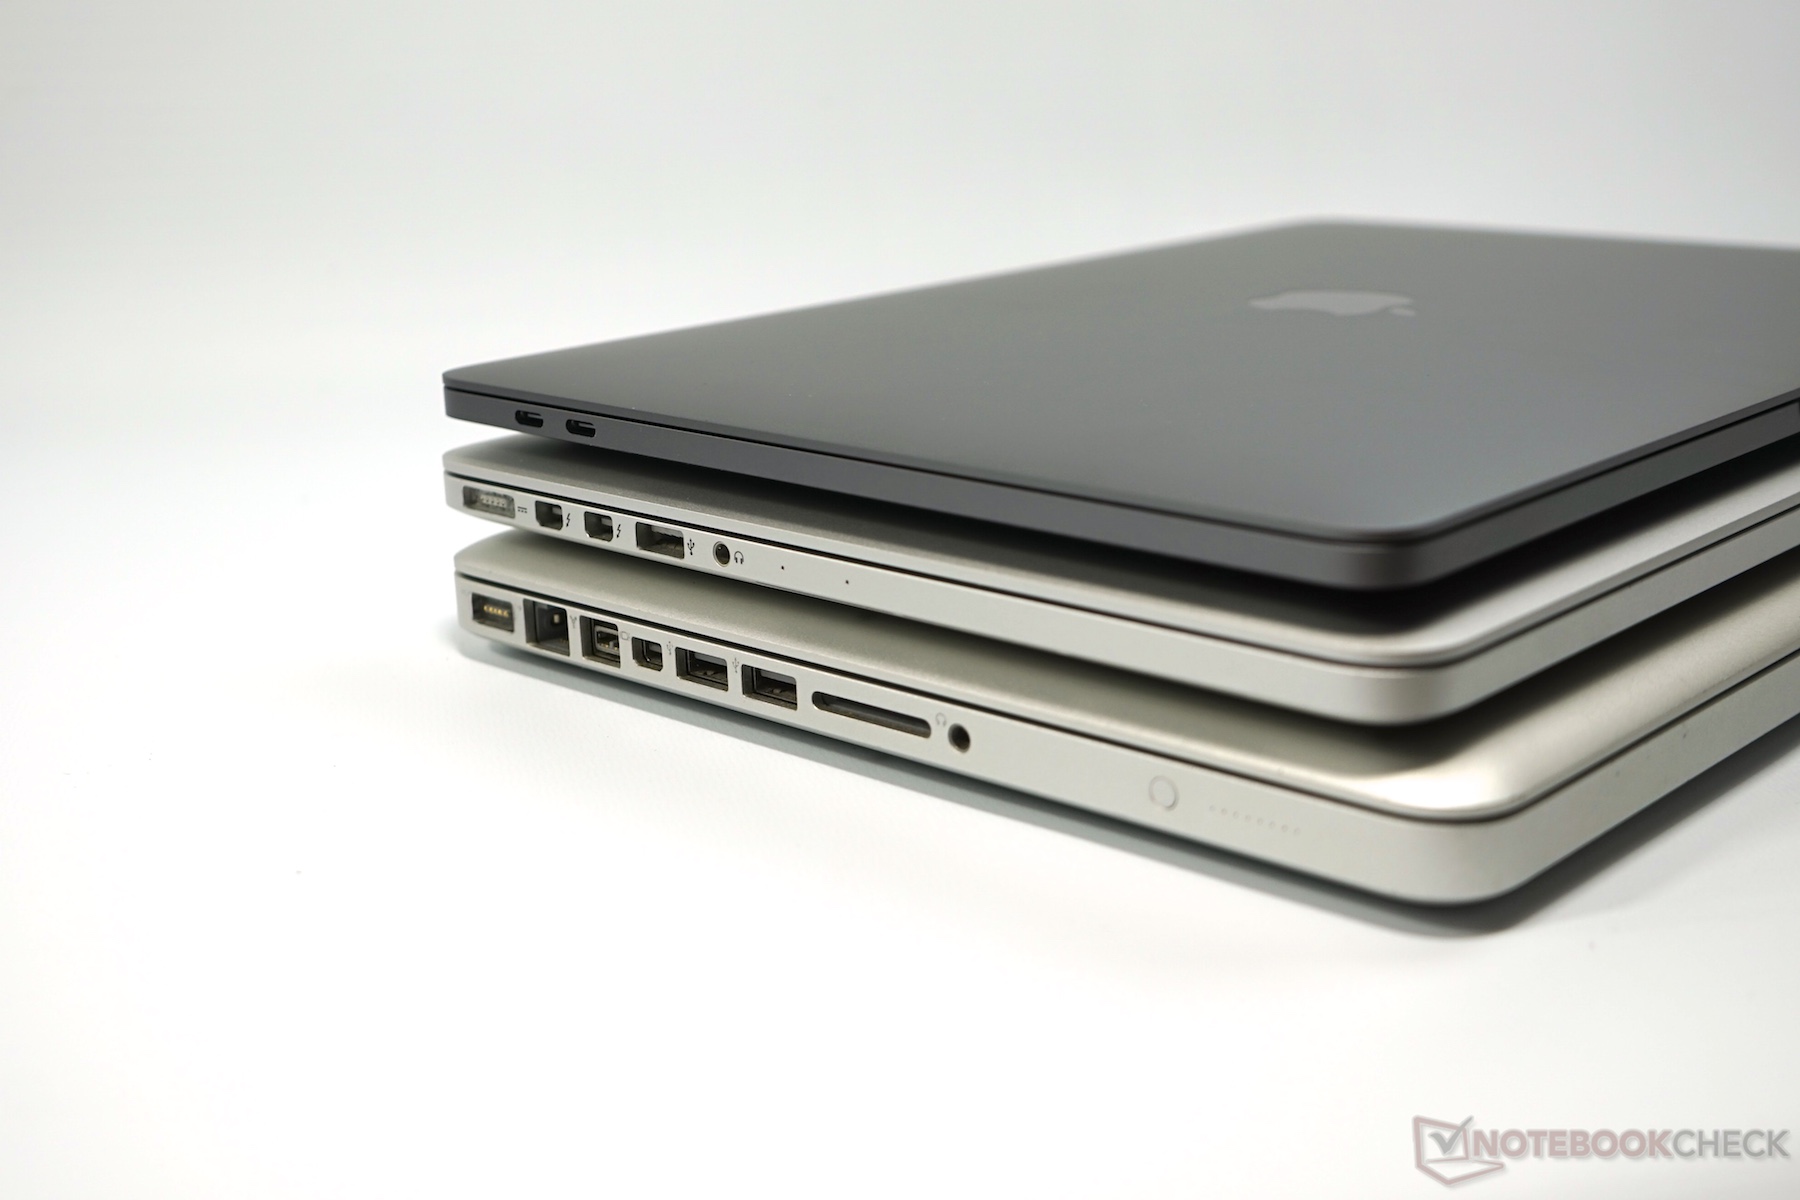
说到这里,我们就很接近它的潜在问题了。目前要正常使用MacBook Pro 13的话,几乎无法避免使用转接器。毋庸置疑的是,这四个通用接口让这台设备与未来更加接轨,不过我们认为两个可能就够了。特别是缺少SD读卡器对于一些摄影师来说就是一种否决。同时它的接口还有和2.4GHz无线网的干扰问题,在连接USB-C设备后用户可能会遇到网络连接的问题。这是否可以通过软件更新得到解决还十分值得质疑。和同门师弟一样,我们因此为它降低了2%的分数。这让人感到十分遗憾,因为它的无线网卡提供了非常优秀的传输速度。
最后需要说到的是它的售价,或者相比入门机型的额外价码。1799美元(约12394人民币)的起售价已经很高了,Touch Bar机型略高的性能是否值得额外的300美元(约2066人民币)十分值得质疑。这两台设备在日常使用中速度都已经很快,专业用户是否会对些许的性能优势(非四核处理器,无独立显卡)感到满意也是个问题。
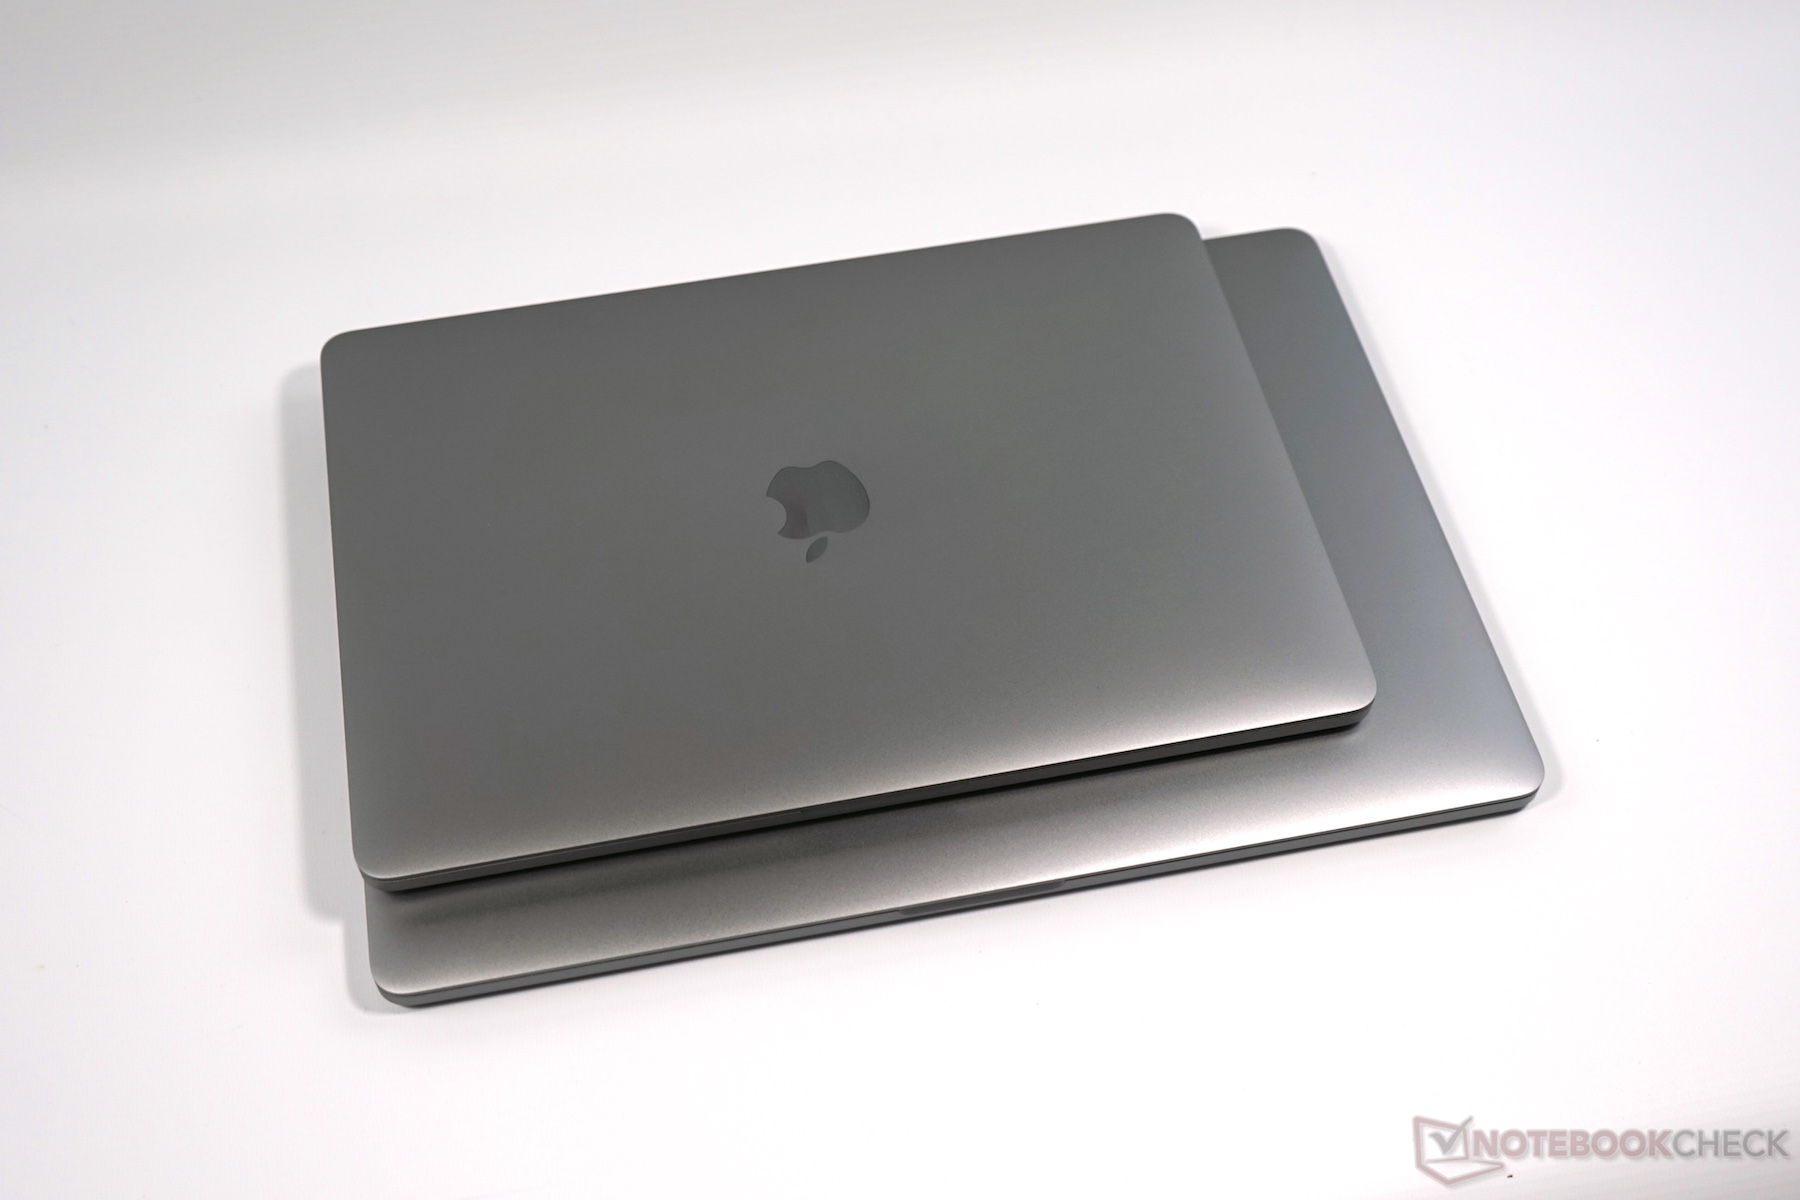
整体上,Apple最新的MacBook Pro 13 Touch Bar是一台非常优秀的亚笔记本电脑。不过它的“Pro”头衔是否名副其实?这大概要看你的使用需要了,在一些方面它已经是业内的最高标准,但大部分用户可能很难找到合适的(现代)标准来衡量它。
注:本文是基于完整评测的缩减版本,阅读完整的英文评测,请点击这里。
Apple MacBook Pro 13 2016 (2.9 GHz)
- 12/07/2016 v6 (old)
Klaus Hinum, Andreas Osthoff
Price comparison
