惠普 Pavilion 15z-bw000 (A10-9620P, HD) 笔记本简短评测
| SD Card Reader | |
| average JPG Copy Test (av. of 3 runs) | |
| Lenovo ThinkPad E570-20H6S00000 | |
| Acer Aspire E15 E5-553G-109A | |
| HP 15-ba077ng | |
| HP Pavilion 15z-bw000 | |
| Asus X555DA-BB11 | |
| Dell Inspiron 15 5000 5567-1753 | |
| maximum AS SSD Seq Read Test (1GB) | |
| Acer Aspire E15 E5-553G-109A | |
| Lenovo ThinkPad E570-20H6S00000 | |
| HP 15-ba077ng | |
| HP Pavilion 15z-bw000 | |
| Dell Inspiron 15 5000 5567-1753 | |
| Asus X555DA-BB11 | |
| |||||||||||||||||||||||||
Brightness Distribution: 83 %
Center on Battery: 251.3 cd/m²
Contrast: 524:1 (Black: 0.48 cd/m²)
ΔE ColorChecker Calman: 9.9 | ∀{0.5-29.43 Ø4.71}
ΔE Greyscale Calman: 11.7 | ∀{0.09-98 Ø4.96}
56.8% sRGB (Argyll 1.6.3 3D)
39.17% AdobeRGB 1998 (Argyll 1.6.3 3D)
39.17% AdobeRGB 1998 (Argyll 3D)
56.8% sRGB (Argyll 3D)
37.92% Display P3 (Argyll 3D)
Gamma: 2.05
CCT: 11713 K
| HP Pavilion 15z-bw000 BOE06A4, TN LED, 15.6", 1366x768 | Asus X555DA-BB11 TN LED, 15.6", 1920x1080 | Dell Inspiron 15 5000 5567-1753 BOE NT15N41, TN LED, 15.6", 1920x1080 | Acer Aspire E15 E5-553G-109A Chi Mei CMN15C4 / N156HGE-EAB, TN LED, 15.6", 1920x1080 | Lenovo ThinkPad E570-20H6S00000 AUO B156HAN04.4, IPS LED, 15.6", 1920x1080 | Lenovo Ideapad 110-15ACL 15.6", 1366x768 | |
|---|---|---|---|---|---|---|
| Display | -7% | -4% | 5% | 2% | -1% | |
| Display P3 Coverage (%) | 37.92 | 35.12 -7% | 36.24 -4% | 39.72 5% | 38.65 2% | 37.39 -1% |
| sRGB Coverage (%) | 56.8 | 52.7 -7% | 54.6 -4% | 59.2 4% | 58 2% | 56.2 -1% |
| AdobeRGB 1998 Coverage (%) | 39.17 | 36.29 -7% | 37.44 -4% | 41.07 5% | 39.94 2% | 38.63 -1% |
| Response Times | -2% | 17% | 16% | -12% | -22% | |
| Response Time Grey 50% / Grey 80% * (ms) | 41.6 ? | 42 ? -1% | 43 ? -3% | 42.4 ? -2% | 44.8 ? -8% | 58 ? -39% |
| Response Time Black / White * (ms) | 22 ? | 22.4 ? -2% | 14 ? 36% | 14.6 ? 34% | 25.6 ? -16% | 23 ? -5% |
| PWM Frequency (Hz) | 198.4 ? | 28740 | 200 ? | |||
| Screen | 10% | -11% | -2% | 31% | 6% | |
| Brightness middle (cd/m²) | 251.3 | 242.7 -3% | 145 -42% | 224 -11% | 242 -4% | 253 1% |
| Brightness (cd/m²) | 243 | 232 -5% | 144 -41% | 201 -17% | 243 0% | 246 1% |
| Brightness Distribution (%) | 83 | 88 6% | 90 8% | 75 -10% | 75 -10% | 86 4% |
| Black Level * (cd/m²) | 0.48 | 0.52 -8% | 0.49 -2% | 0.46 4% | 0.24 50% | 0.43 10% |
| Contrast (:1) | 524 | 467 -11% | 296 -44% | 487 -7% | 1008 92% | 588 12% |
| Colorchecker dE 2000 * | 9.9 | 4.9 51% | 9.27 6% | 10.5 -6% | 4.65 53% | |
| Colorchecker dE 2000 max. * | 22.9 | 20.3 11% | 16.9 26% | 16.8 27% | 9.64 58% | |
| Greyscale dE 2000 * | 11.7 | 2.7 77% | 12.28 -5% | 11.23 4% | 3.39 71% | |
| Gamma | 2.05 107% | 2.34 94% | 2.03 108% | 2.12 104% | 2.7 81% | |
| CCT | 11713 55% | 6876 95% | 10732 61% | 11096 59% | 6246 104% | |
| Color Space (Percent of AdobeRGB 1998) (%) | 39.17 | 33.5 -14% | 35 -11% | 38 -3% | 36.69 -6% | |
| Color Space (Percent of sRGB) (%) | 56.8 | 52.5 -8% | 55 -3% | 59 4% | 57.66 2% | |
| Total Average (Program / Settings) | 0% /
5% | 1% /
-6% | 6% /
2% | 7% /
19% | -6% /
-2% |
* ... smaller is better
Display Response Times
| ↔ Response Time Black to White | ||
|---|---|---|
| 22 ms ... rise ↗ and fall ↘ combined | ↗ 16 ms rise | 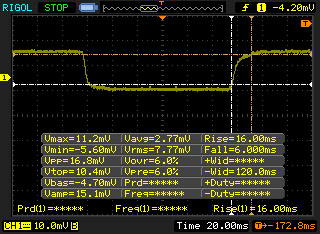 |
| ↘ 6 ms fall | ||
| The screen shows good response rates in our tests, but may be too slow for competitive gamers. In comparison, all tested devices range from 0.1 (minimum) to 240 (maximum) ms. » 49 % of all devices are better. This means that the measured response time is worse than the average of all tested devices (19.8 ms). | ||
| ↔ Response Time 50% Grey to 80% Grey | ||
| 41.6 ms ... rise ↗ and fall ↘ combined | ↗ 14.8 ms rise | 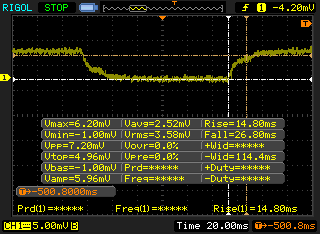 |
| ↘ 26.8 ms fall | ||
| The screen shows slow response rates in our tests and will be unsatisfactory for gamers. In comparison, all tested devices range from 0.165 (minimum) to 636 (maximum) ms. » 67 % of all devices are better. This means that the measured response time is worse than the average of all tested devices (30.9 ms). | ||
Screen Flickering / PWM (Pulse-Width Modulation)
| Screen flickering / PWM detected | 198.4 Hz | ≤ 99 % brightness setting | 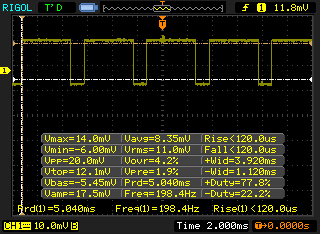 |
The display backlight flickers at 198.4 Hz (worst case, e.g., utilizing PWM) Flickering detected at a brightness setting of 99 % and below. There should be no flickering or PWM above this brightness setting. The frequency of 198.4 Hz is relatively low, so sensitive users will likely notice flickering and experience eyestrain at the stated brightness setting and below. In comparison: 52 % of all tested devices do not use PWM to dim the display. If PWM was detected, an average of 7748 (minimum: 5 - maximum: 343500) Hz was measured. | |||
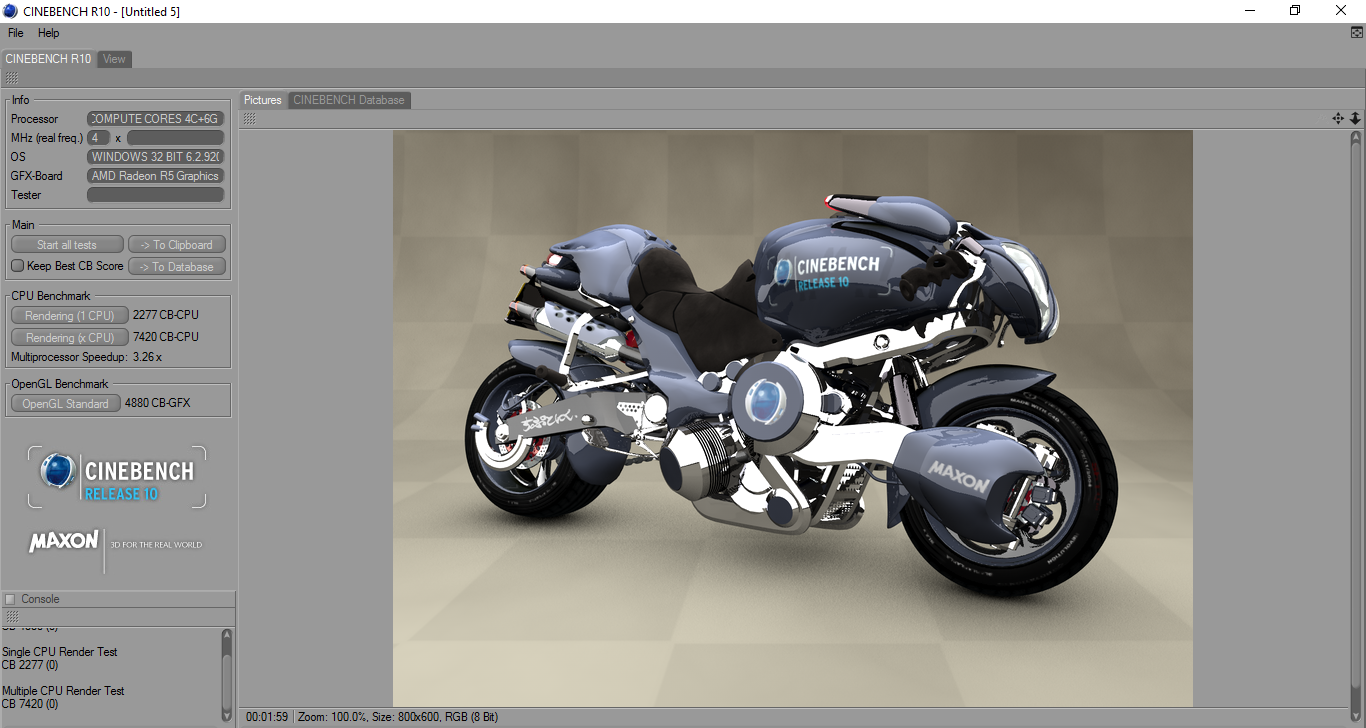
| Cinebench R10 | |
| Rendering Multiple CPUs 32Bit | |
| Dell Inspiron 15 5000 5567-1753 | |
| HP Pavilion 15z-bw000 | |
| HP 15-ba077ng | |
| Acer Aspire E15 E5-553G-109A | |
| Asus X555DA-BB11 | |
| Rendering Single 32Bit | |
| Dell Inspiron 15 5000 5567-1753 | |
| HP 15-ba077ng | |
| HP Pavilion 15z-bw000 | |
| Acer Aspire E15 E5-553G-109A | |
| Asus X555DA-BB11 | |
| wPrime 2.10 - 1024m | |
| Asus X555DA-BB11 | |
| HP Pavilion 15z-bw000 | |
* ... smaller is better
| PCMark 8 Home Score Accelerated v2 | 2624 points | |
| PCMark 8 Creative Score Accelerated v2 | 3075 points | |
| PCMark 8 Work Score Accelerated v2 | 3669 points | |
| PCMark 10 Score | 2080 points | |
Help | ||
| HP Pavilion 15z-bw000 Avolusion MD1TBLSSHD | Asus X555DA-BB11 Seagate Momentus SpinPoint M8 ST1000LM024 HN-M101MBB | Dell Inspiron 15 5000 5567-1753 SanDisk X400 SED 256GB, SATA (SD8TB8U-256G) | HP 15-ba077ng SanDisk Z400s SD8SNAT-256G | Acer Aspire E15 E5-553G-109A Liteonit CV3-8D128 | Lenovo ThinkPad E570-20H6S00000 Toshiba THNSF5256GPUK | |
|---|---|---|---|---|---|---|
| CrystalDiskMark 3.0 | -26% | 6943% | 4243% | 4443% | 11273% | |
| Read Seq (MB/s) | 109.6 | 106.9 -2% | 502 358% | 447.4 308% | 348.6 218% | 1140 940% |
| Write Seq (MB/s) | 104.6 | 97.5 -7% | 458.1 338% | 243.3 133% | 311.8 198% | 468.1 348% |
| Read 512 (MB/s) | 36.88 | 32.28 -12% | 382.8 938% | 333.4 804% | 295.9 702% | 759 1958% |
| Write 512 (MB/s) | 56.3 | 35.39 -37% | 385.7 585% | 283.1 403% | 185.8 230% | 414 635% |
| Read 4k (MB/s) | 0.436 | 0.373 -14% | 29.25 6609% | 20.99 4714% | 23.76 5350% | 34.3 7767% |
| Write 4k (MB/s) | 1.212 | 0.636 -48% | 55.9 4512% | 62.7 5073% | 44.94 3608% | 123.4 10082% |
| Read 4k QD32 (MB/s) | 1.234 | 0.694 -44% | 285.2 23012% | 143.1 11496% | 171.6 13806% | 530 42850% |
| Write 4k QD32 (MB/s) | 1.242 | 0.682 -45% | 239.6 19191% | 138 11011% | 143.2 11430% | 319.2 25600% |

| 3DMark | |
| 1280x720 Cloud Gate Standard Graphics | |
| Lenovo ThinkPad E570-20H6S00000 | |
| Acer Aspire E15 E5-553G-109A | |
| Dell Inspiron 15 5000 5567-1753 | |
| HP Pavilion 15z-bw000 | |
| Asus X555DA-BB11 | |
| 1920x1080 Fire Strike Graphics | |
| Lenovo ThinkPad E570-20H6S00000 | |
| Acer Aspire E15 E5-553G-109A | |
| Dell Inspiron 15 5000 5567-1753 | |
| HP Pavilion 15z-bw000 | |
| Asus X555DA-BB11 | |
| 1920x1080 Ice Storm Extreme Graphics | |
| Dell Inspiron 15 5000 5567-1753 | |
| HP Pavilion 15z-bw000 | |
| Asus X555DA-BB11 | |
| 3DMark 11 Performance | 1686 points | |
| 3DMark Ice Storm Standard Score | 37793 points | |
| 3DMark Cloud Gate Standard Score | 4365 points | |
| 3DMark Fire Strike Score | 898 points | |
| 3DMark Fire Strike Extreme Score | 464 points | |
Help | ||
| low | med. | high | ultra | |
|---|---|---|---|---|
| Tomb Raider (2013) | 51.8 | 29.1 | 21.3 | |
| BioShock Infinite (2013) | 45.9 | 28.7 | 21.8 | |
| Rise of the Tomb Raider (2016) | 19 | 12.2 |
Noise level
| Idle |
| 31 / 31.2 / 31.3 dB(A) |
| Load |
| 34.4 / 38.9 dB(A) |
 | ||
30 dB silent 40 dB(A) audible 50 dB(A) loud |
||
min: | ||
| HP Pavilion 15z-bw000 Radeon R5 (Carrizo), A10-9620P, Avolusion MD1TBLSSHD | Asus X555DA-BB11 Radeon R6 (Carrizo), A10-8700P, Seagate Momentus SpinPoint M8 ST1000LM024 HN-M101MBB | Dell Inspiron 15 5000 5567-1753 Radeon R7 M445, i7-7500U, SanDisk X400 SED 256GB, SATA (SD8TB8U-256G) | HP 15-ba077ng Radeon R7 (Bristol Ridge), A12-9700P, SanDisk Z400s SD8SNAT-256G | Acer Aspire E15 E5-553G-109A Radeon R8 M445DX, A12-9700P, Liteonit CV3-8D128 | Lenovo ThinkPad E570-20H6S00000 GeForce GTX 950M, i5-7200U, Toshiba THNSF5256GPUK | Lenovo Ideapad 110-15ACL Radeon R5 (Beema/Carrizo-L), A8-7410 | Acer Aspire E5-774-54HJ HD Graphics 620, i5-7200U, Western Digital Scorpio Blue WD5000LPCX-24C6HT0 | Apple MacBook 12 (Early 2016) 1.1 GHz HD Graphics 515, 6Y30, Apple SSD AP0256 | |
|---|---|---|---|---|---|---|---|---|---|
| Noise | 0% | -5% | 2% | 1% | 3% | 4% | 3% | ||
| off / environment * (dB) | 28.3 | 28.9 -2% | 30.6 -8% | 30.6 -8% | 30.5 -8% | 29 -2% | 30.4 -7% | 30.5 -8% | |
| Idle Minimum * (dB) | 31 | 31.6 -2% | 30.6 1% | 31.5 -2% | 31.4 -1% | 29 6% | 30.9 -0% | 30.8 1% | |
| Idle Average * (dB) | 31.2 | 32 -3% | 30.6 2% | 31.8 -2% | 31.4 -1% | 29 7% | 30.9 1% | 30.8 1% | |
| Idle Maximum * (dB) | 31.3 | 32.4 -4% | 30.6 2% | 31.8 -2% | 31.9 -2% | 29 7% | 31 1% | 30.8 2% | |
| Load Average * (dB) | 34.4 | 33.3 3% | 41.9 -22% | 31.4 9% | 33.7 2% | 34.3 -0% | 31.8 8% | 32.1 7% | |
| Load Maximum * (dB) | 38.9 | 35.5 9% | 41.8 -7% | 33.4 14% | 33.8 13% | 40.1 -3% | 31.9 18% | 33.8 13% | |
| Witcher 3 ultra * (dB) | 40.6 |
* ... smaller is better
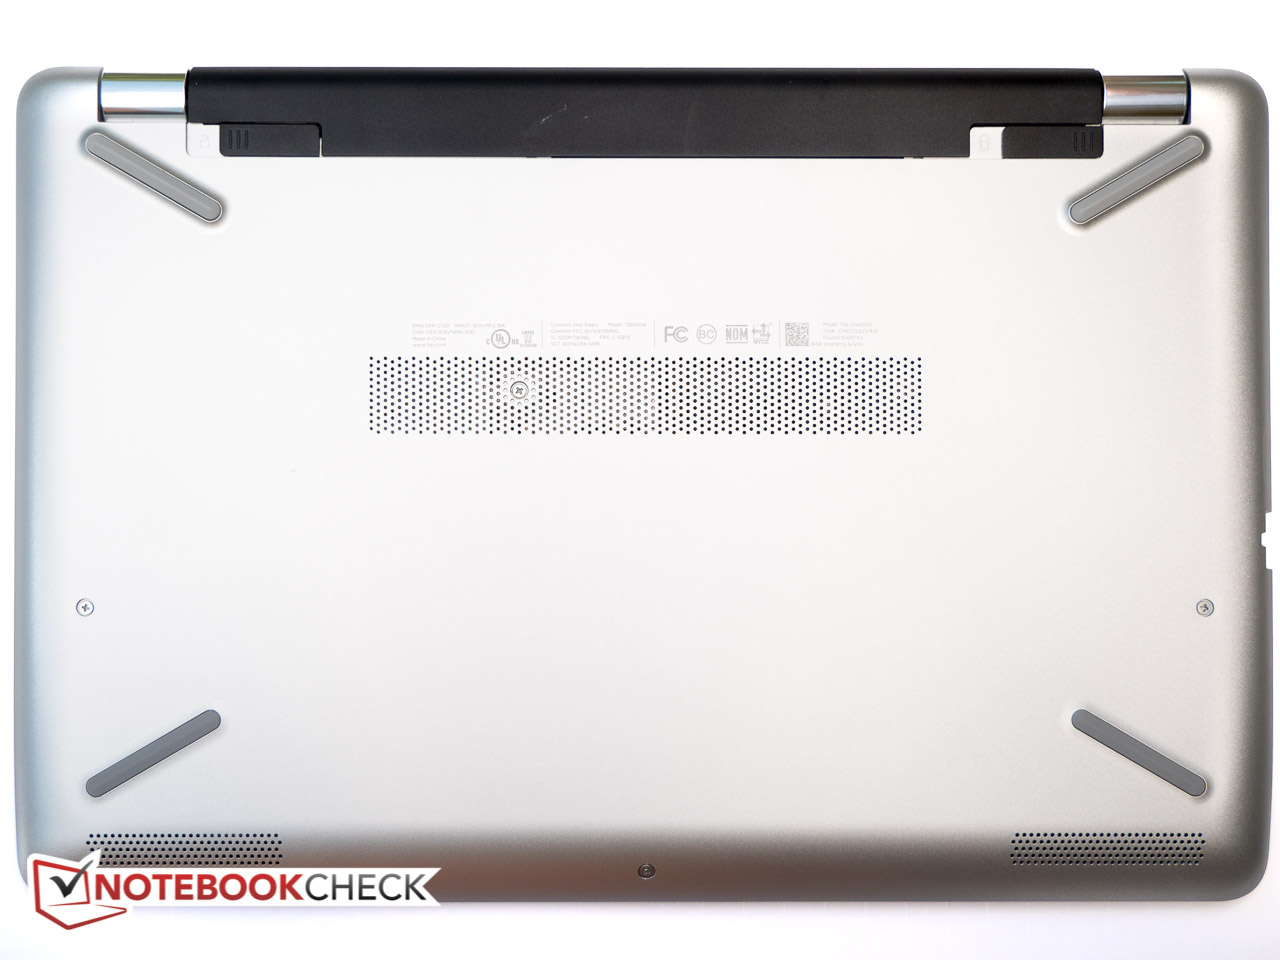
(+) The maximum temperature on the upper side is 38 °C / 100 F, compared to the average of 36.8 °C / 98 F, ranging from 21 to 71 °C for the class Multimedia.
(±) The bottom heats up to a maximum of 40.8 °C / 105 F, compared to the average of 39.1 °C / 102 F
(+) In idle usage, the average temperature for the upper side is 26.2 °C / 79 F, compared to the device average of 31.3 °C / 88 F.
(±) The palmrests and touchpad can get very hot to the touch with a maximum of 36 °C / 96.8 F.
(-) The average temperature of the palmrest area of similar devices was 28.7 °C / 83.7 F (-7.3 °C / -13.1 F).
HP Pavilion 15z-bw000 audio analysis
(±) | speaker loudness is average but good (75 dB)
Bass 100 - 315 Hz
(-) | nearly no bass - on average 17.5% lower than median
(-) | bass is not linear (16.2% delta to prev. frequency)
Mids 400 - 2000 Hz
(+) | balanced mids - only 2.6% away from median
(±) | linearity of mids is average (10.4% delta to prev. frequency)
Highs 2 - 16 kHz
(+) | balanced highs - only 1.9% away from median
(±) | linearity of highs is average (9.1% delta to prev. frequency)
Overall 100 - 16.000 Hz
(±) | linearity of overall sound is average (18.8% difference to median)
Compared to same class
» 58% of all tested devices in this class were better, 8% similar, 34% worse
» The best had a delta of 5%, average was 17%, worst was 45%
Compared to all devices tested
» 43% of all tested devices were better, 8% similar, 49% worse
» The best had a delta of 4%, average was 23%, worst was 134%
Apple MacBook 12 (Early 2016) 1.1 GHz audio analysis
(+) | speakers can play relatively loud (83.6 dB)
Bass 100 - 315 Hz
(±) | reduced bass - on average 11.3% lower than median
(±) | linearity of bass is average (14.2% delta to prev. frequency)
Mids 400 - 2000 Hz
(+) | balanced mids - only 2.4% away from median
(+) | mids are linear (5.5% delta to prev. frequency)
Highs 2 - 16 kHz
(+) | balanced highs - only 2% away from median
(+) | highs are linear (4.5% delta to prev. frequency)
Overall 100 - 16.000 Hz
(+) | overall sound is linear (10.2% difference to median)
Compared to same class
» 7% of all tested devices in this class were better, 2% similar, 90% worse
» The best had a delta of 5%, average was 18%, worst was 53%
Compared to all devices tested
» 5% of all tested devices were better, 1% similar, 94% worse
» The best had a delta of 4%, average was 23%, worst was 134%
| Off / Standby | |
| Idle | |
| Load |
|
Key:
min: | |
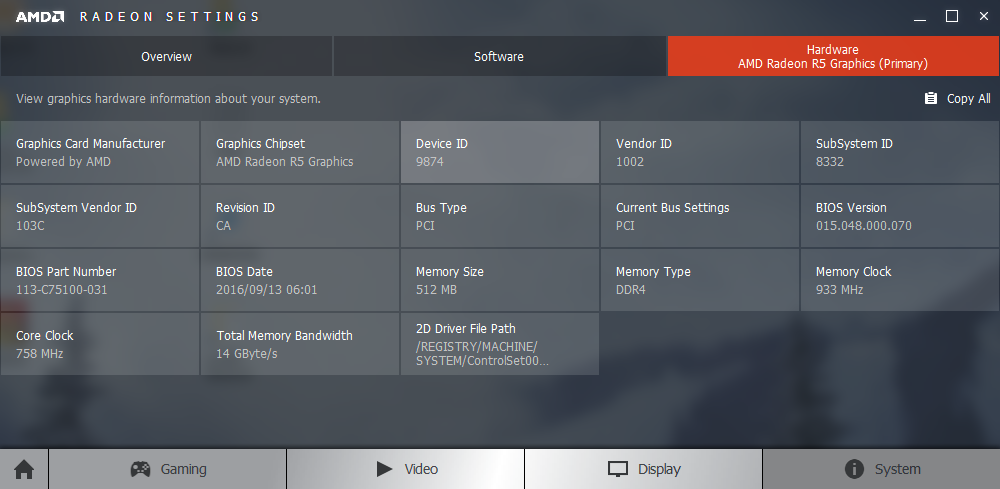
| HP Pavilion 15z-bw000 A10-9620P, Radeon R5 (Carrizo), Avolusion MD1TBLSSHD, TN LED, 1366x768, 15.6" | Asus X555DA-BB11 A10-8700P, Radeon R6 (Carrizo), Seagate Momentus SpinPoint M8 ST1000LM024 HN-M101MBB, TN LED, 1920x1080, 15.6" | Dell Inspiron 15 5000 5567-1753 i7-7500U, Radeon R7 M445, SanDisk X400 SED 256GB, SATA (SD8TB8U-256G), TN LED, 1920x1080, 15.6" | HP 15-ba077ng A12-9700P, Radeon R7 (Bristol Ridge), SanDisk Z400s SD8SNAT-256G, TN LED, 1920x1080, 15.6" | Acer Aspire E15 E5-553G-109A A12-9700P, Radeon R8 M445DX, Liteonit CV3-8D128, TN LED, 1920x1080, 15.6" | Lenovo ThinkPad E570-20H6S00000 i5-7200U, GeForce GTX 950M, Toshiba THNSF5256GPUK, IPS LED, 1920x1080, 15.6" | Acer Aspire E5-774-54HJ i5-7200U, HD Graphics 620, Western Digital Scorpio Blue WD5000LPCX-24C6HT0, TN LED, 1920x1080, 17.3" | |
|---|---|---|---|---|---|---|---|
| Power Consumption | -21% | -4% | 14% | -37% | -4% | -6% | |
| Idle Minimum * (Watt) | 5.38 | 8.3 -54% | 4 26% | 4.4 18% | 7.2 -34% | 2.8 48% | 5.3 1% |
| Idle Average * (Watt) | 7.9 | 8.6 -9% | 5.4 32% | 6.8 14% | 10.3 -30% | 6.3 20% | 10.1 -28% |
| Idle Maximum * (Watt) | 8.98 | 13.1 -46% | 8.3 8% | 8.9 1% | 11.9 -33% | 6.9 23% | 10.5 -17% |
| Load Average * (Watt) | 34.74 | 31.2 10% | 54 -55% | 30.9 11% | 48.2 -39% | 51.6 -49% | 34.3 1% |
| Load Maximum * (Watt) | 42.41 | 43.9 -4% | 55.4 -31% | 31 27% | 63 -49% | 69.7 -64% | 37 13% |
| Witcher 3 ultra * (Watt) | 51.8 |
* ... smaller is better
| HP Pavilion 15z-bw000 A10-9620P, Radeon R5 (Carrizo), 31 Wh | Asus X555DA-BB11 A10-8700P, Radeon R6 (Carrizo), 37 Wh | Dell Inspiron 15 5000 5567-1753 i7-7500U, Radeon R7 M445, 42 Wh | Acer Aspire E15 E5-553G-109A A12-9700P, Radeon R8 M445DX, 40 Wh | Lenovo ThinkPad E570-20H6S00000 i5-7200U, GeForce GTX 950M, 41 Wh | Acer Aspire E5-774-54HJ i5-7200U, HD Graphics 620, 41 Wh | |
|---|---|---|---|---|---|---|
| Battery runtime | 0% | 52% | -3% | 113% | 43% | |
| Reader / Idle (h) | 6.4 | 7.3 14% | 7.8 22% | 6 -6% | 14.7 130% | |
| WiFi v1.3 (h) | 3.7 | 2.9 -22% | 7 89% | 4.3 16% | 7.7 108% | 5.3 43% |
| Load (h) | 1.1 | 1.2 9% | 1.6 45% | 0.9 -18% | 2.2 100% |
Pros
Cons


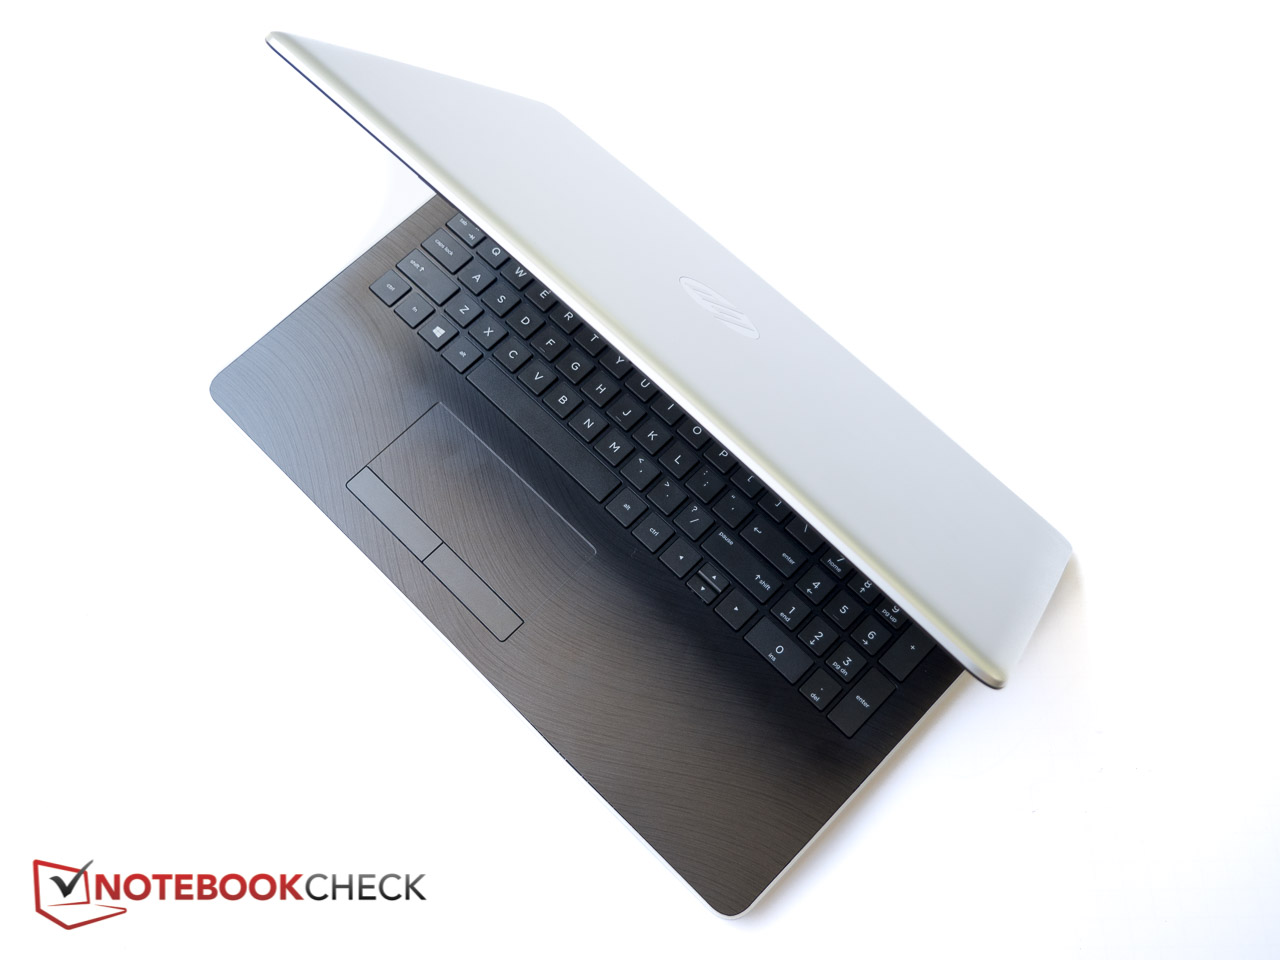
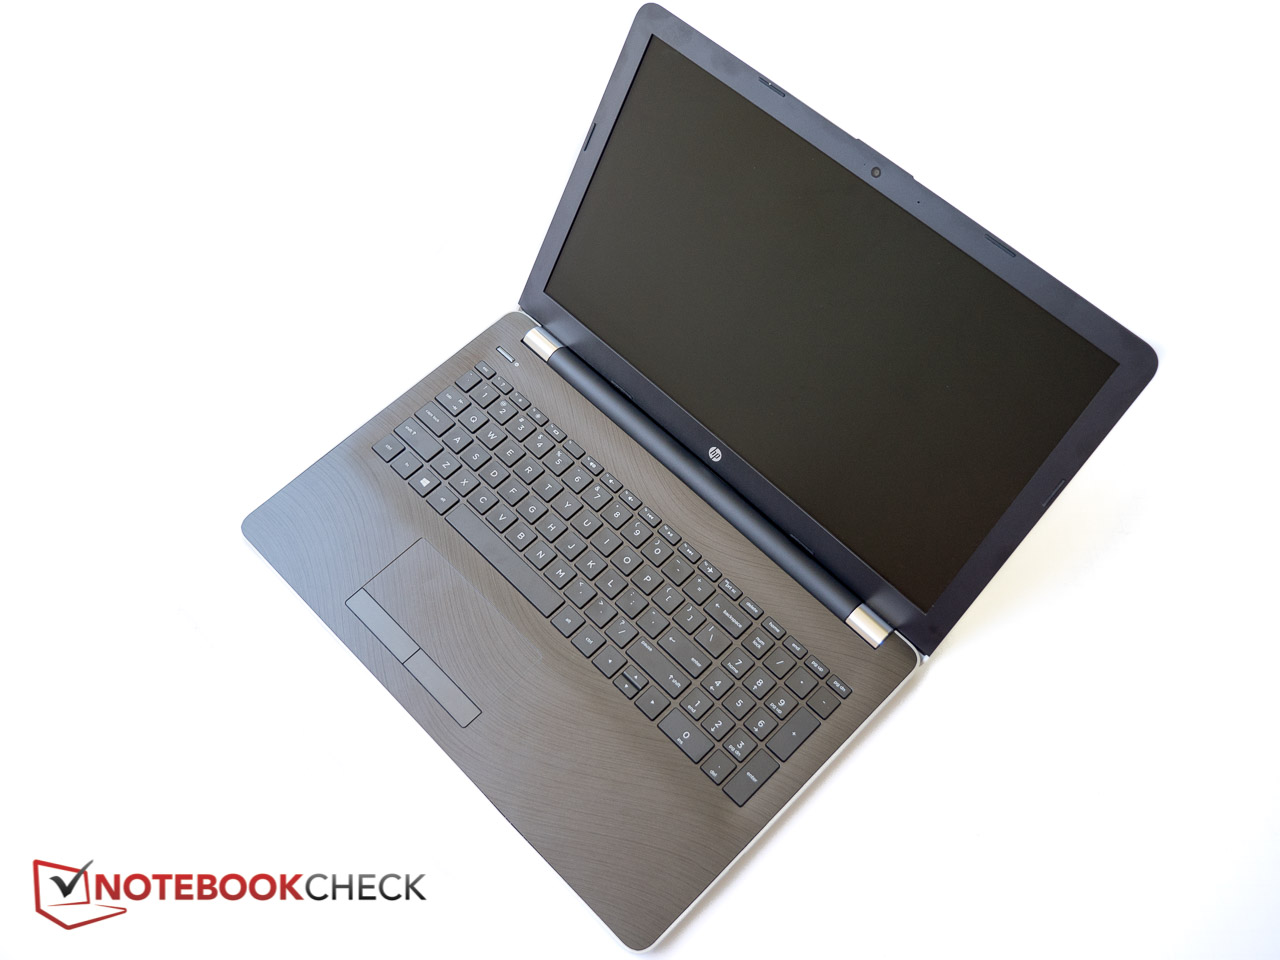
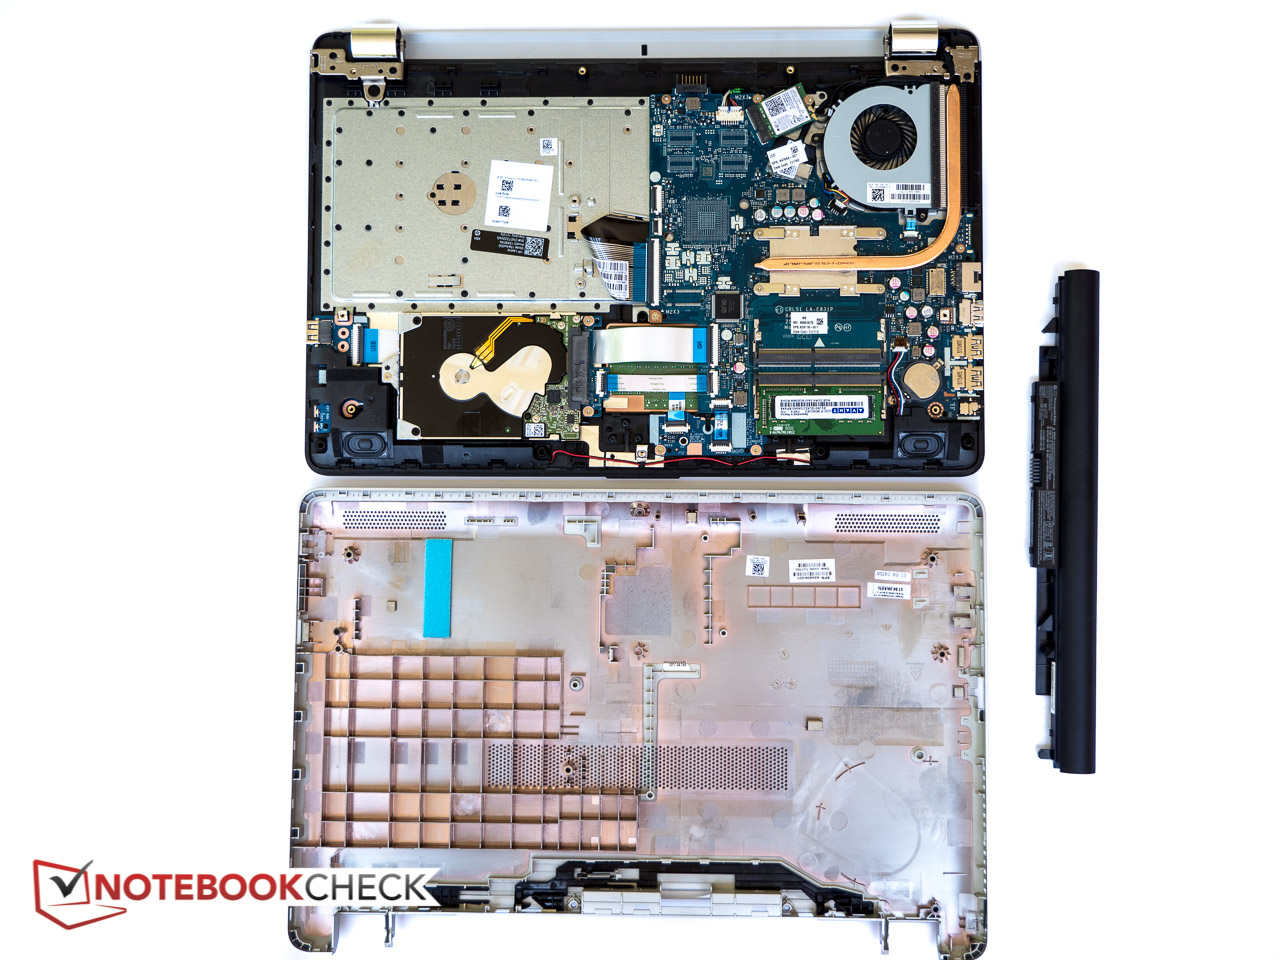
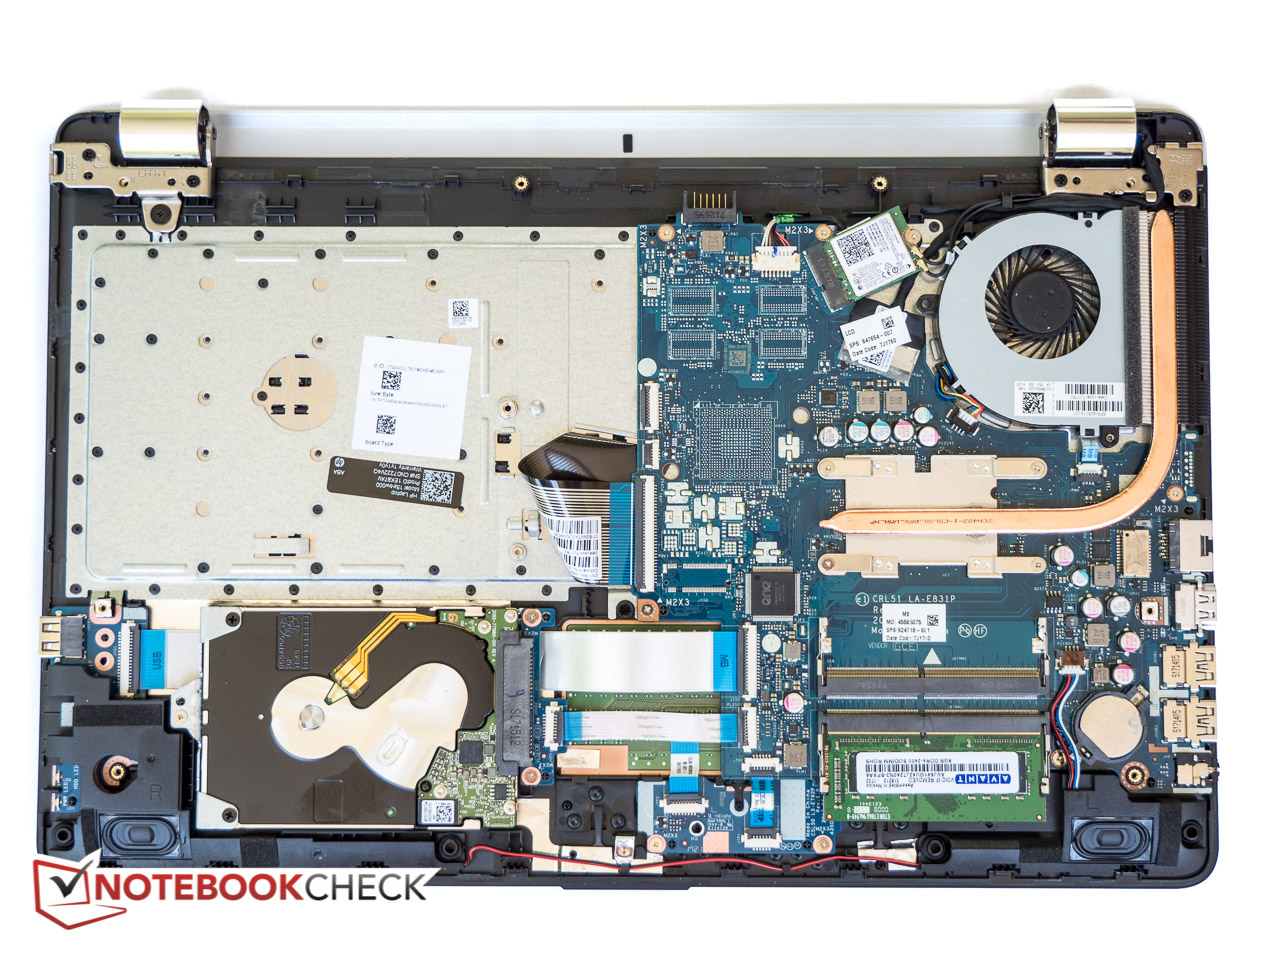
Pavilion 15z是一款相当轻便,不引人注意,但也是无可比拟的入门级15.6英寸笔记本。Radeon R5 iGP提供了足够的性能来处理一些较低分辨率和质量设置的老游戏,但AMD APU的处理器组件还是达不到当前的英特尔ULV 中央处理器一样的水平。系统被慢速的机械硬盘、低可视角度稳定性的高清TN 屏幕以及惨淡的电池续航所拖累
伴随着市面上大量的入门级设备,HP Pavilion 15z很难有所表现——简而言之,难以做到鹤立鸡群。
注:本文是基于完整评测的缩减版本,阅读完整的英文评测,请点击这里。
HP Pavilion 15z-bw000
- 07/15/2017 v6 (old)
Bernie Pechlaner
Price comparison
