惠普 Omen 15t 2017 (7700HQ, GTX 1050 Ti, Full HD) 笔记本电脑简短评测

| SD Card Reader | |
| average JPG Copy Test (av. of 3 runs) | |
| Asus FX502VM-AS73 | |
| HP Omen 15-ax007ng | |
| HP Omen 15-ax213ng | |
| Lenovo Legion Y520-15IKBN-80WK001KUS | |
| Acer Aspire VX5-591G-75C4 VX15 | |
| Dell Inspiron 15 7000 7567 | |
| maximum AS SSD Seq Read Test (1GB) | |
| Lenovo Legion Y520-15IKBN-80WK001KUS | |
| HP Omen 15-ax213ng | |
| Asus FX502VM-AS73 | |
| HP Omen 15-ax007ng | |
| Acer Aspire VX5-591G-75C4 VX15 | |
| Dell Inspiron 15 7000 7567 | |
| Networking | |
| iperf3 transmit AX12 | |
| Acer Aspire VX5-591G-75C4 VX15 | |
| HP Omen 15-ax213ng | |
| Asus FX502VM-AS73 | |
| Dell Inspiron 15 7000 7567 (jseb) | |
| Lenovo Legion Y520-15IKBN-80WK001KUS | |
| iperf3 receive AX12 | |
| HP Omen 15-ax213ng | |
| Asus FX502VM-AS73 | |
| Acer Aspire VX5-591G-75C4 VX15 | |
| Lenovo Legion Y520-15IKBN-80WK001KUS | |
| Dell Inspiron 15 7000 7567 (jseb) | |
| |||||||||||||||||||||||||
Brightness Distribution: 88 %
Center on Battery: 230 cd/m²
Contrast: 1095:1 (Black: 0.21 cd/m²)
ΔE ColorChecker Calman: 4.01 | ∀{0.5-29.43 Ø4.71}
ΔE Greyscale Calman: 3.18 | ∀{0.09-98 Ø4.96}
58% sRGB (Argyll 1.6.3 3D)
37% AdobeRGB 1998 (Argyll 1.6.3 3D)
39.87% AdobeRGB 1998 (Argyll 3D)
58% sRGB (Argyll 3D)
38.59% Display P3 (Argyll 3D)
Gamma: 2.52
CCT: 6814 K
| HP Omen 15-ax213ng AU Optronics AUO41ED, 1920x1080, 15.6" | HP Omen 15-ax007ng LGD0519, 1920x1080, 15.6" | Acer Aspire VX5-591G-75C4 VX15 LG Philips LGD0550 / LP156WF6-SPK4, 1920x1080, 15.6" | Dell Inspiron 15 7000 7567 AU Optronics AUO38ED B156HTN 28H80, 1920x1080, 15.6" | Lenovo Legion Y520-15IKBN-80WK001KUS LP156WF6-SPK3, 1920x1080, 15.6" | Asus FX502VM-AS73 1920x1080, 15.6" | |
|---|---|---|---|---|---|---|
| Display | 29% | 1% | -6% | -1% | ||
| Display P3 Coverage (%) | 38.59 | 59.9 55% 40.34 5% | 38.88 1% | 36.42 -6% | 38.28 -1% | |
| sRGB Coverage (%) | 58 | 85.9 48% 60.3 4% | 58.2 0% | 54.9 -5% | 56.9 -2% | |
| AdobeRGB 1998 Coverage (%) | 39.87 | 61.6 55% 41.73 5% | 40.2 1% | 37.62 -6% | 39.47 -1% | |
| Response Times | -21% | 33% | -8% | -35% | 26% | |
| Response Time Grey 50% / Grey 80% * (ms) | 42 ? | 55 ? -31% | 22 ? 48% | 36 ? 14% | 58.8 ? -40% | 28.4 ? 32% |
| Response Time Black / White * (ms) | 28 ? | 31 ? -11% | 23 ? 18% | 36 ? -29% | 36 ? -29% | 22.4 ? 20% |
| PWM Frequency (Hz) | 21550 ? | |||||
| Screen | -29% | -14% | -84% | -48% | -46% | |
| Brightness middle (cd/m²) | 230 | 214 -7% | 281 22% | 246 7% | 239 4% | 209.5 -9% |
| Brightness (cd/m²) | 228 | 203 -11% | 257 13% | 235 3% | 244 7% | 205 -10% |
| Brightness Distribution (%) | 88 | 79 -10% | 85 -3% | 75 -15% | 88 0% | 92 5% |
| Black Level * (cd/m²) | 0.21 | 0.28 -33% | 0.32 -52% | 0.55 -162% | 0.35 -67% | 0.69 -229% |
| Contrast (:1) | 1095 | 764 -30% | 878 -20% | 447 -59% | 683 -38% | 304 -72% |
| Colorchecker dE 2000 * | 4.01 | 6.04 -51% | 5.16 -29% | 10.97 -174% | 7.3 -82% | 4.7 -17% |
| Colorchecker dE 2000 max. * | 7.26 | 12 -65% | 9.09 -25% | 24.7 -240% | 19.7 -171% | |
| Greyscale dE 2000 * | 3.18 | 5.91 -86% | 4.57 -44% | 14.25 -348% | 4.9 -54% | 1.8 43% |
| Gamma | 2.52 87% | 2.44 90% | 2.59 85% | 1.83 120% | 2.19 100% | 2.23 99% |
| CCT | 6814 95% | 7362 88% | 6931 94% | 11200 58% | 7332 89% | 6975 93% |
| Color Space (Percent of AdobeRGB 1998) (%) | 37 | 38 3% | 37 0% | 35 -5% | 35 -5% | 36.2 -2% |
| Color Space (Percent of sRGB) (%) | 58 | 60 3% | 58 0% | 55 -5% | 55 -5% | 56.6 -2% |
| Total Average (Program / Settings) | -7% /
-9% | 7% /
-5% | -33% /
-56% | -42% /
-46% | -7% /
-28% |
* ... smaller is better
Display Response Times
| ↔ Response Time Black to White | ||
|---|---|---|
| 28 ms ... rise ↗ and fall ↘ combined | ↗ 16.4 ms rise | 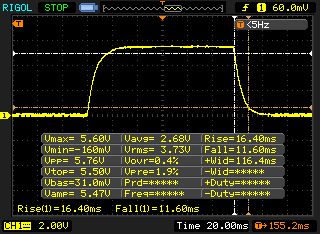 |
| ↘ 11.6 ms fall | ||
| The screen shows relatively slow response rates in our tests and may be too slow for gamers. In comparison, all tested devices range from 0.1 (minimum) to 240 (maximum) ms. » 71 % of all devices are better. This means that the measured response time is worse than the average of all tested devices (19.8 ms). | ||
| ↔ Response Time 50% Grey to 80% Grey | ||
| 42 ms ... rise ↗ and fall ↘ combined | ↗ 20.4 ms rise | 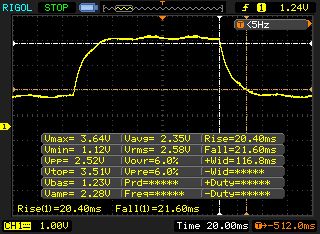 |
| ↘ 21.6 ms fall | ||
| The screen shows slow response rates in our tests and will be unsatisfactory for gamers. In comparison, all tested devices range from 0.165 (minimum) to 636 (maximum) ms. » 67 % of all devices are better. This means that the measured response time is worse than the average of all tested devices (31 ms). | ||
Screen Flickering / PWM (Pulse-Width Modulation)
| Screen flickering / PWM not detected | 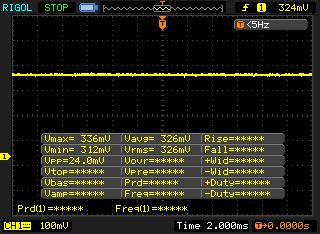 | ||
In comparison: 52 % of all tested devices do not use PWM to dim the display. If PWM was detected, an average of 7754 (minimum: 5 - maximum: 343500) Hz was measured. | |||
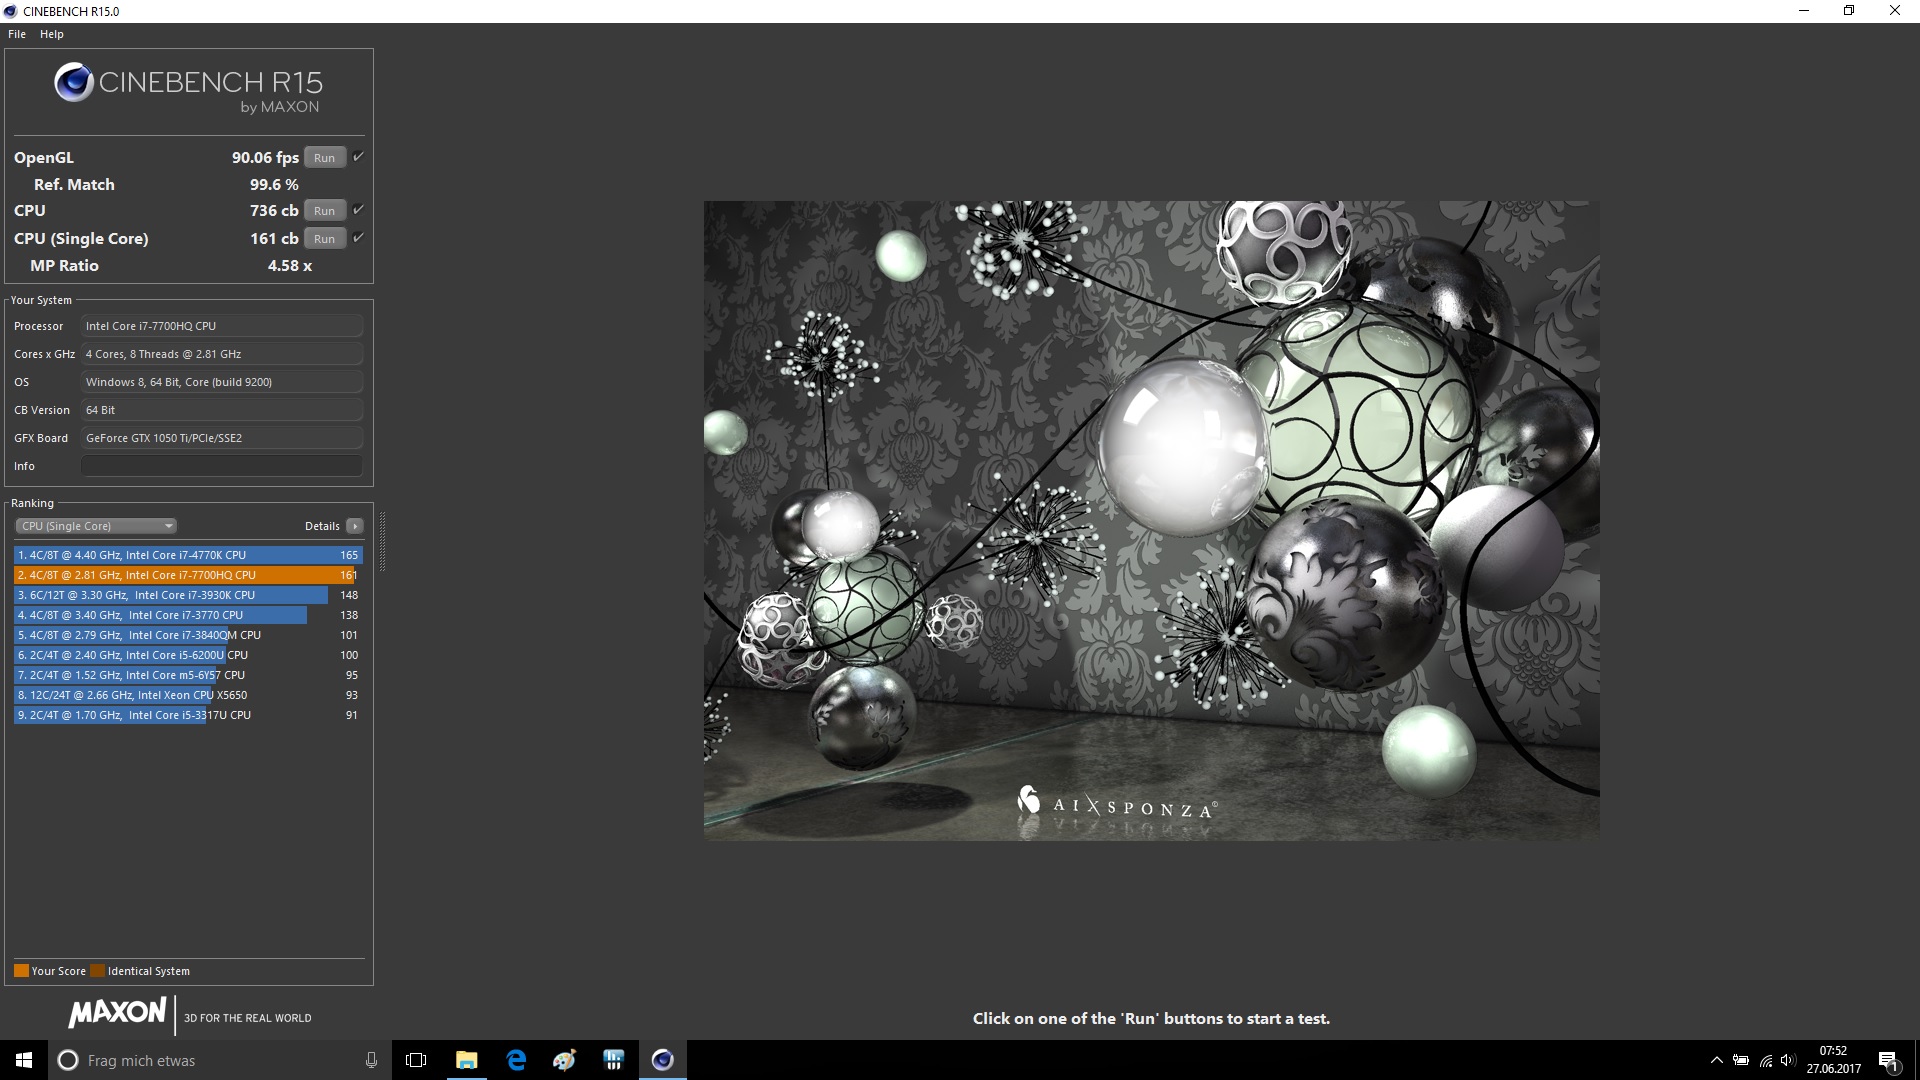
| Cinebench R15 | |
| CPU Single 64Bit | |
| MSI GS63VR 7RF-228US | |
| HP Omen 15-ax213ng | |
| Dell Inspiron 15 7000 7567 | |
| Lenovo Legion Y520-15IKBN-80WK001KUS | |
| Acer Aspire VX5-591G-75C4 VX15 | |
| HP Omen 15-ax007ng | |
| Asus FX502VM-AS73 | |
| CPU Multi 64Bit | |
| MSI GS63VR 7RF-228US | |
| HP Omen 15-ax213ng | |
| Asus FX502VM-AS73 | |
| Dell Inspiron 15 7000 7567 | |
| Acer Aspire VX5-591G-75C4 VX15 | |
| HP Omen 15-ax007ng | |
| Lenovo Legion Y520-15IKBN-80WK001KUS | |
| Cinebench R11.5 | |
| CPU Single 64Bit | |
| HP Omen 15-ax213ng | |
| MSI GS63VR 7RF-228US | |
| Lenovo Legion Y520-15IKBN-80WK001KUS | |
| HP Omen 15-ax007ng | |
| Asus FX502VM-AS73 | |
| CPU Multi 64Bit | |
| MSI GS63VR 7RF-228US | |
| HP Omen 15-ax213ng | |
| Asus FX502VM-AS73 | |
| HP Omen 15-ax007ng | |
| Lenovo Legion Y520-15IKBN-80WK001KUS | |
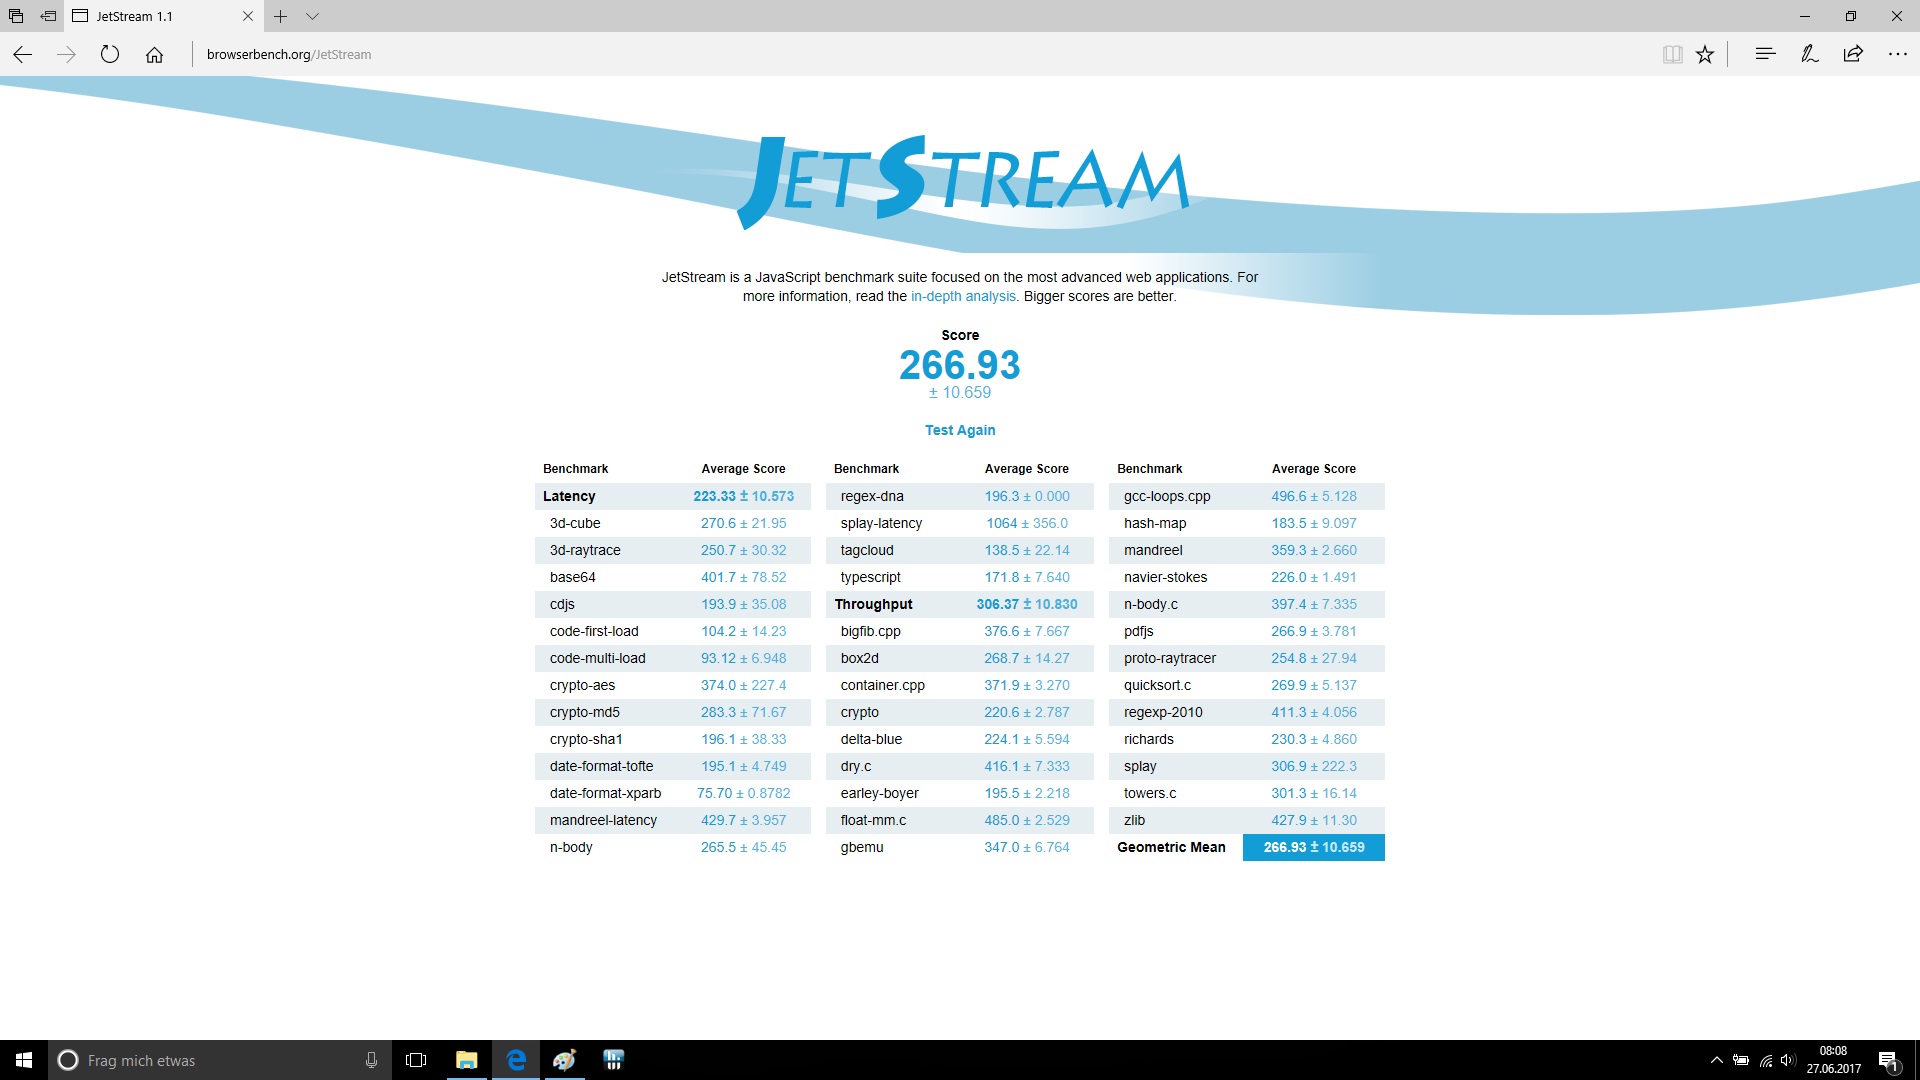
| JetStream 1.1 - 1.1 Total | |
| HP Omen 15-ax213ng | |
| Lenovo Legion Y520-15IKBN-80WK001KUS | |
| Dell Inspiron 15 7000 7567 | |
| MSI GS63VR 7RF-228US | |
| Asus FX502VM-AS73 | |
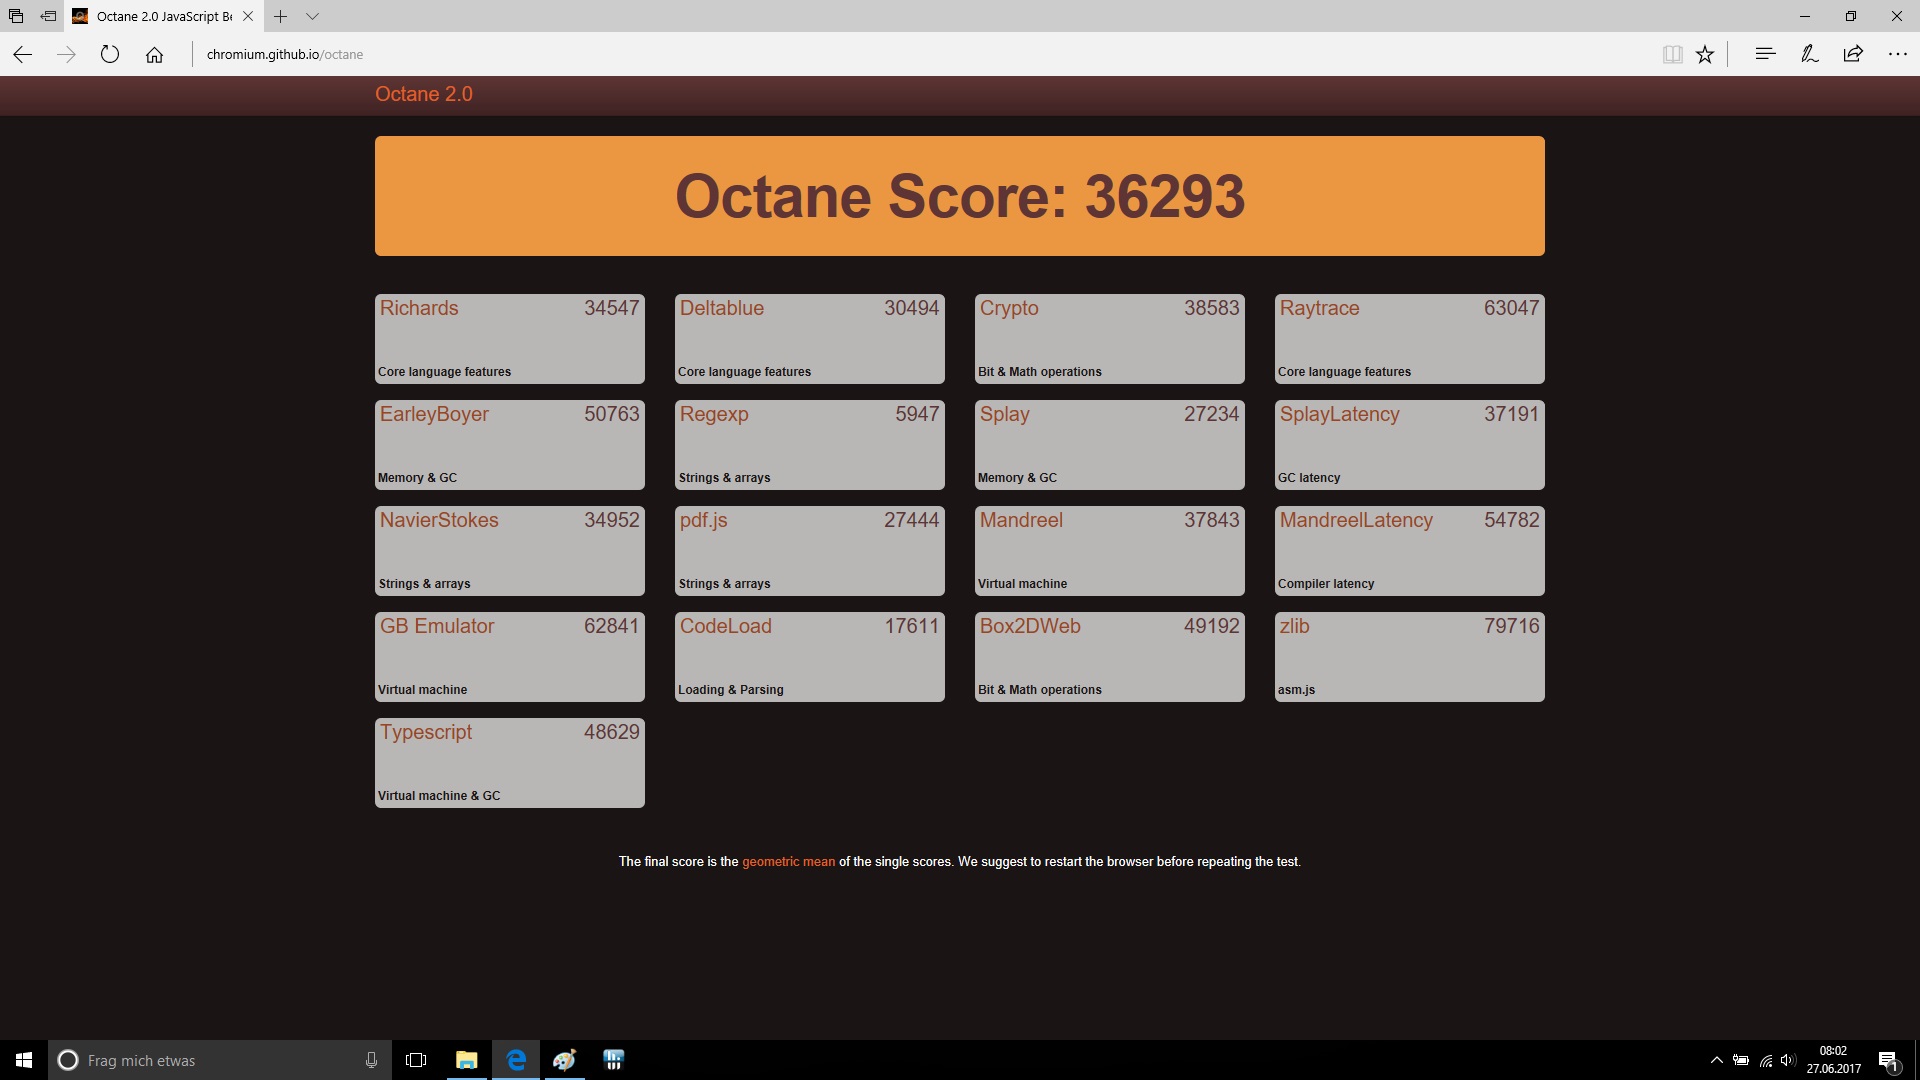
| Octane V2 - Total Score | |
| Dell Inspiron 15 7000 7567 | |
| Asus FX502VM-AS73 | |
| HP Omen 15-ax213ng | |
| Lenovo Legion Y520-15IKBN-80WK001KUS | |
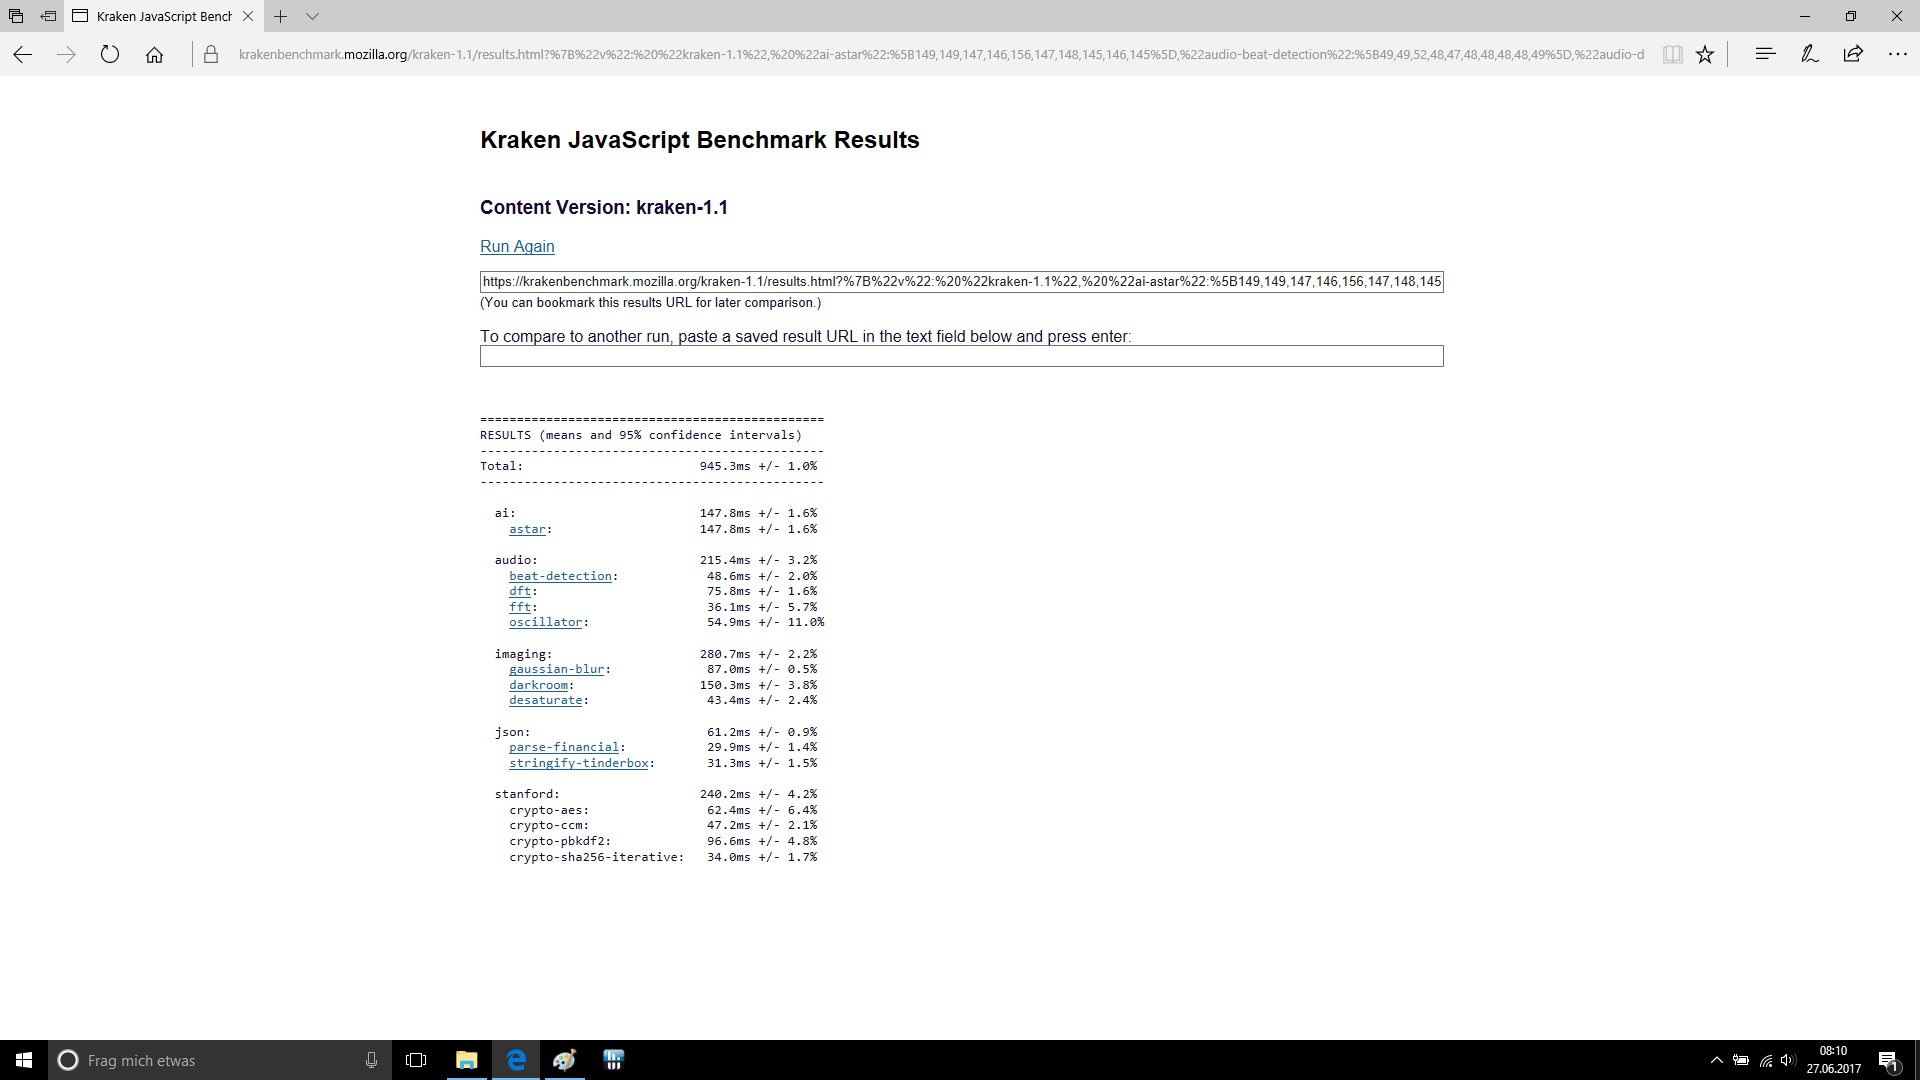
| Mozilla Kraken 1.1 - Total | |
| Acer Aspire VX5-591G-75C4 VX15 | |
| MSI GS63VR 7RF-228US | |
| Dell Inspiron 15 7000 7567 | |
| Lenovo Legion Y520-15IKBN-80WK001KUS | |
| HP Omen 15-ax213ng | |
* ... smaller is better
| PCMark 8 | |
| Home Score Accelerated v2 | |
| Asus FX502VM-AS73 | |
| HP Omen 15-ax213ng | |
| MSI GS63VR 7RF-228US | |
| HP Omen 15-ax007ng | |
| Dell Inspiron 15 7000 7567 | |
| Acer Aspire VX5-591G-75C4 VX15 | |
| Work Score Accelerated v2 | |
| MSI GS63VR 7RF-228US | |
| Dell Inspiron 15 7000 7567 | |
| HP Omen 15-ax007ng | |
| Acer Aspire VX5-591G-75C4 VX15 | |
| HP Omen 15-ax213ng | |
| Asus FX502VM-AS73 | |
| Creative Score Accelerated v2 | |
| Asus FX502VM-AS73 | |
| HP Omen 15-ax213ng | |
| MSI GS63VR 7RF-228US | |
| HP Omen 15-ax007ng | |
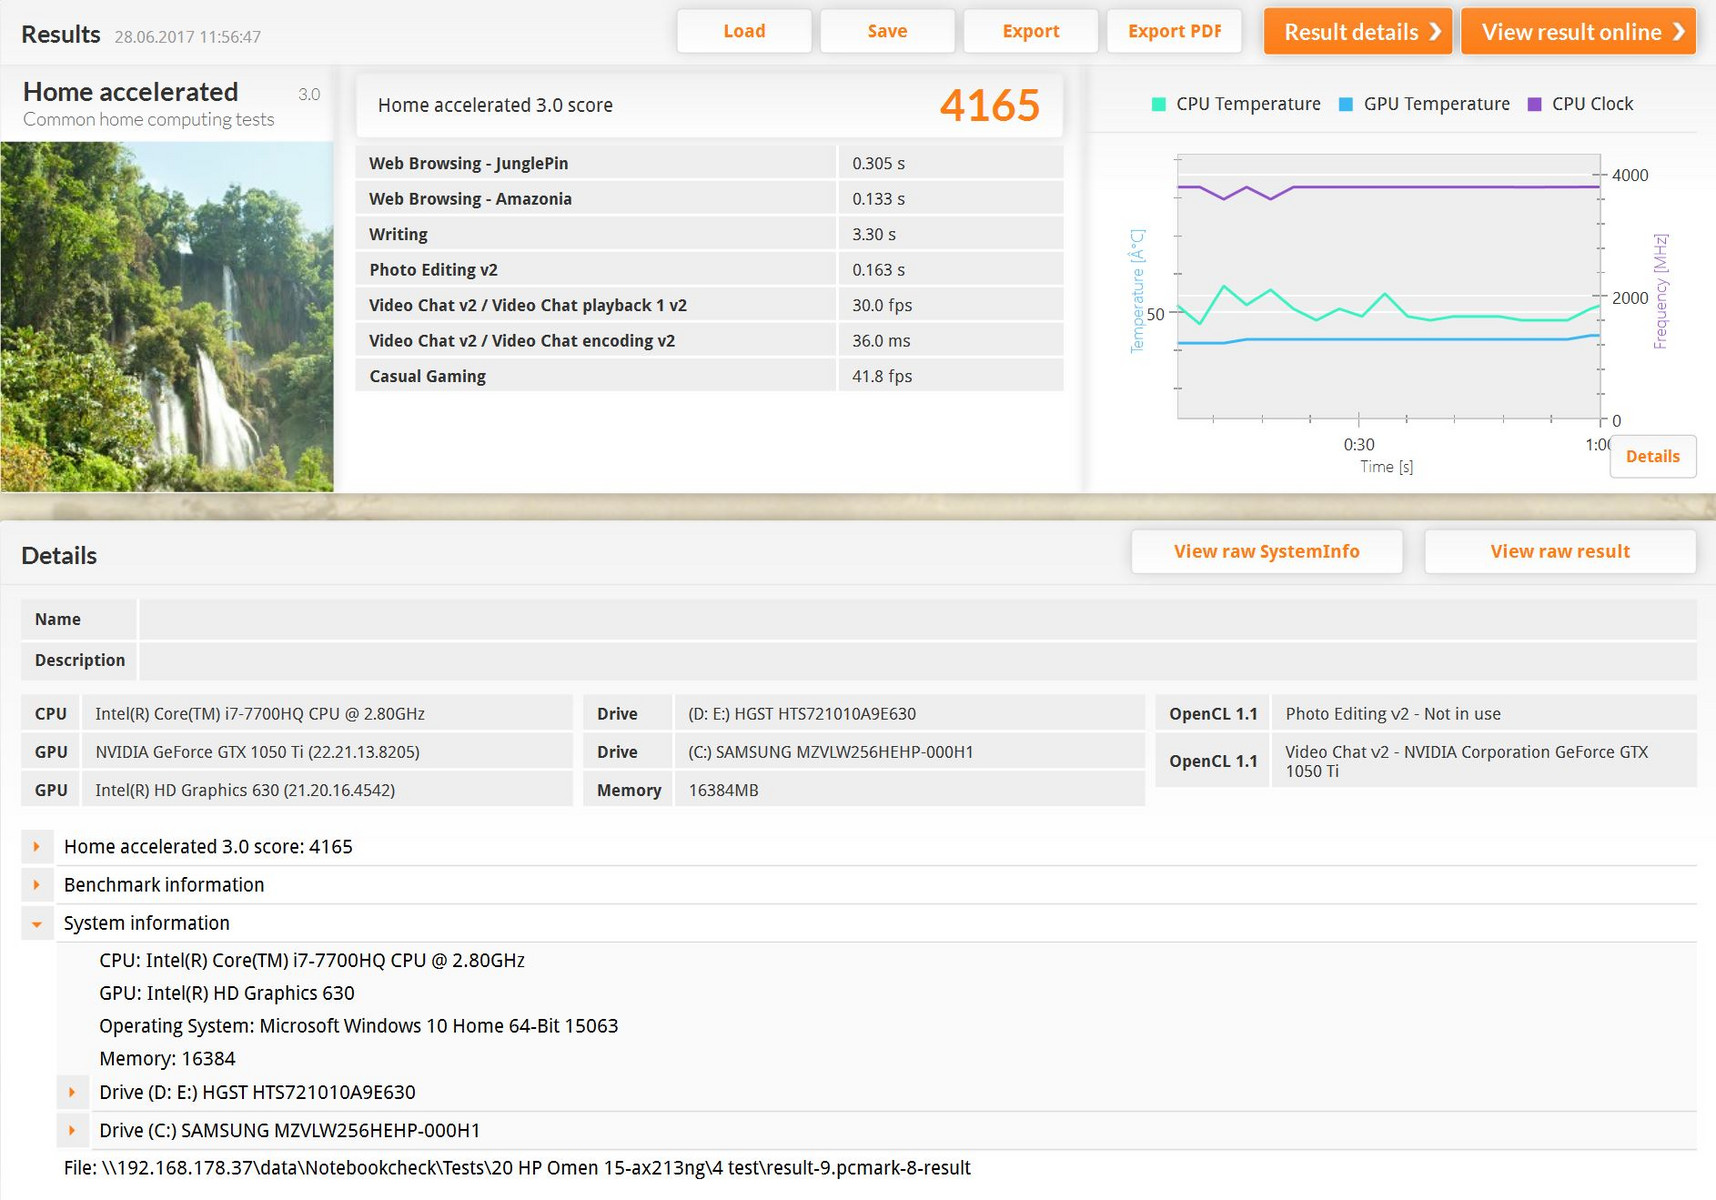
| PCMark 8 Home Score Accelerated v2 | 4165 points | |
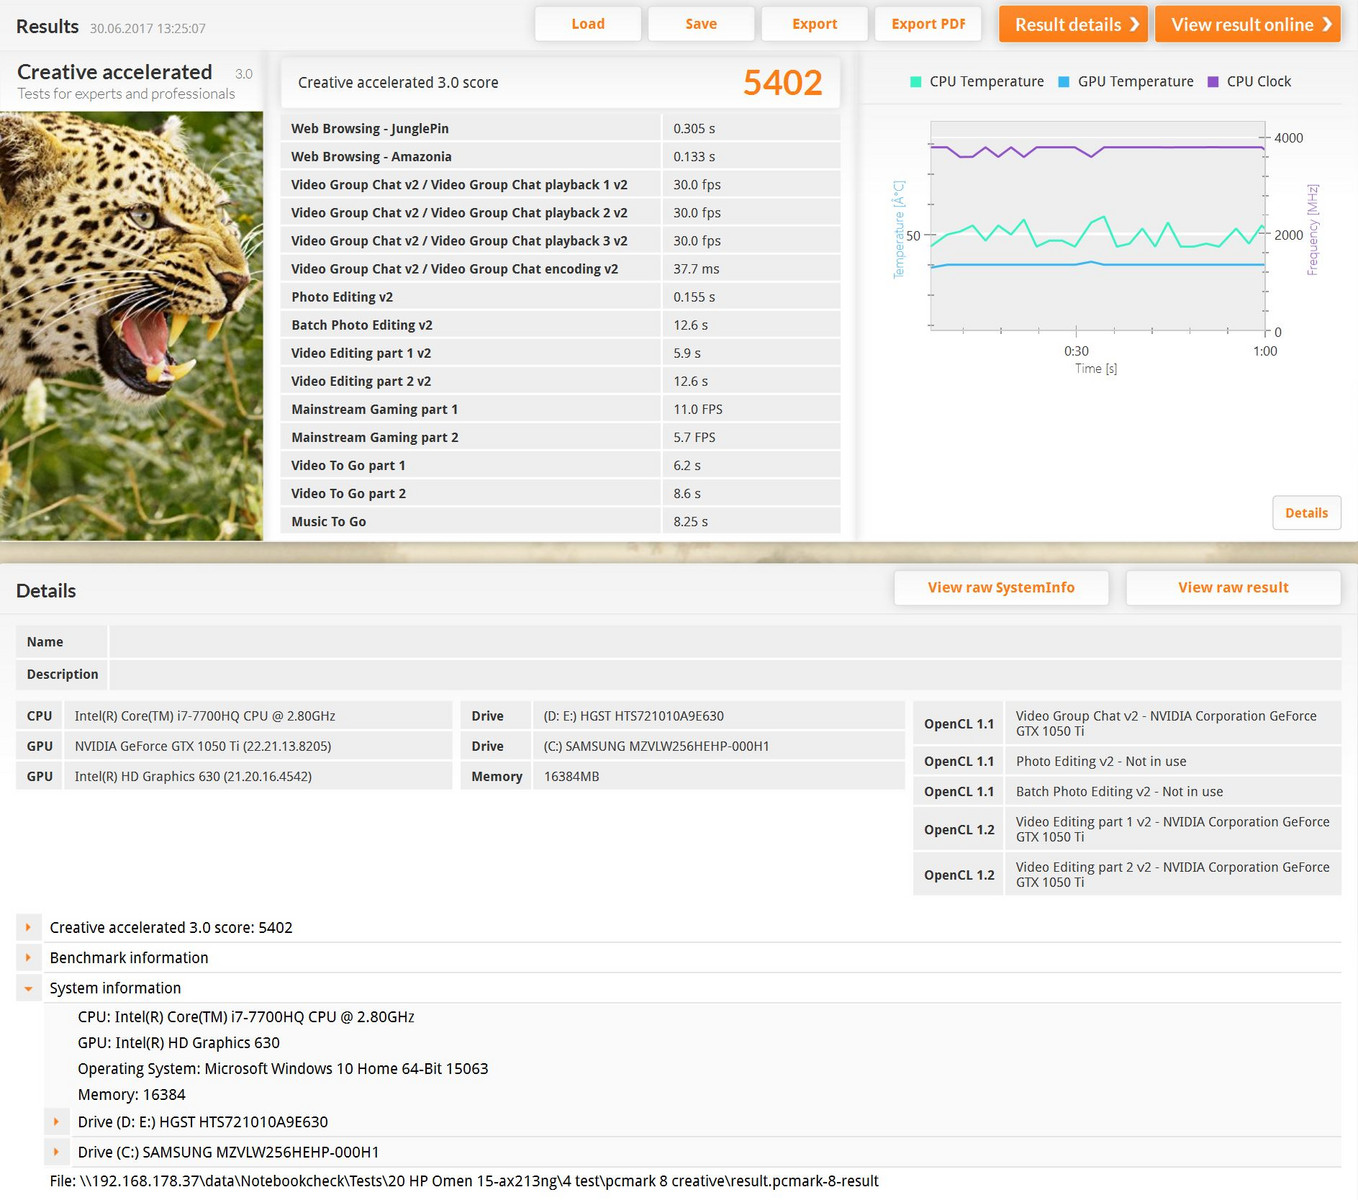
| PCMark 8 Creative Score Accelerated v2 | 5402 points | |
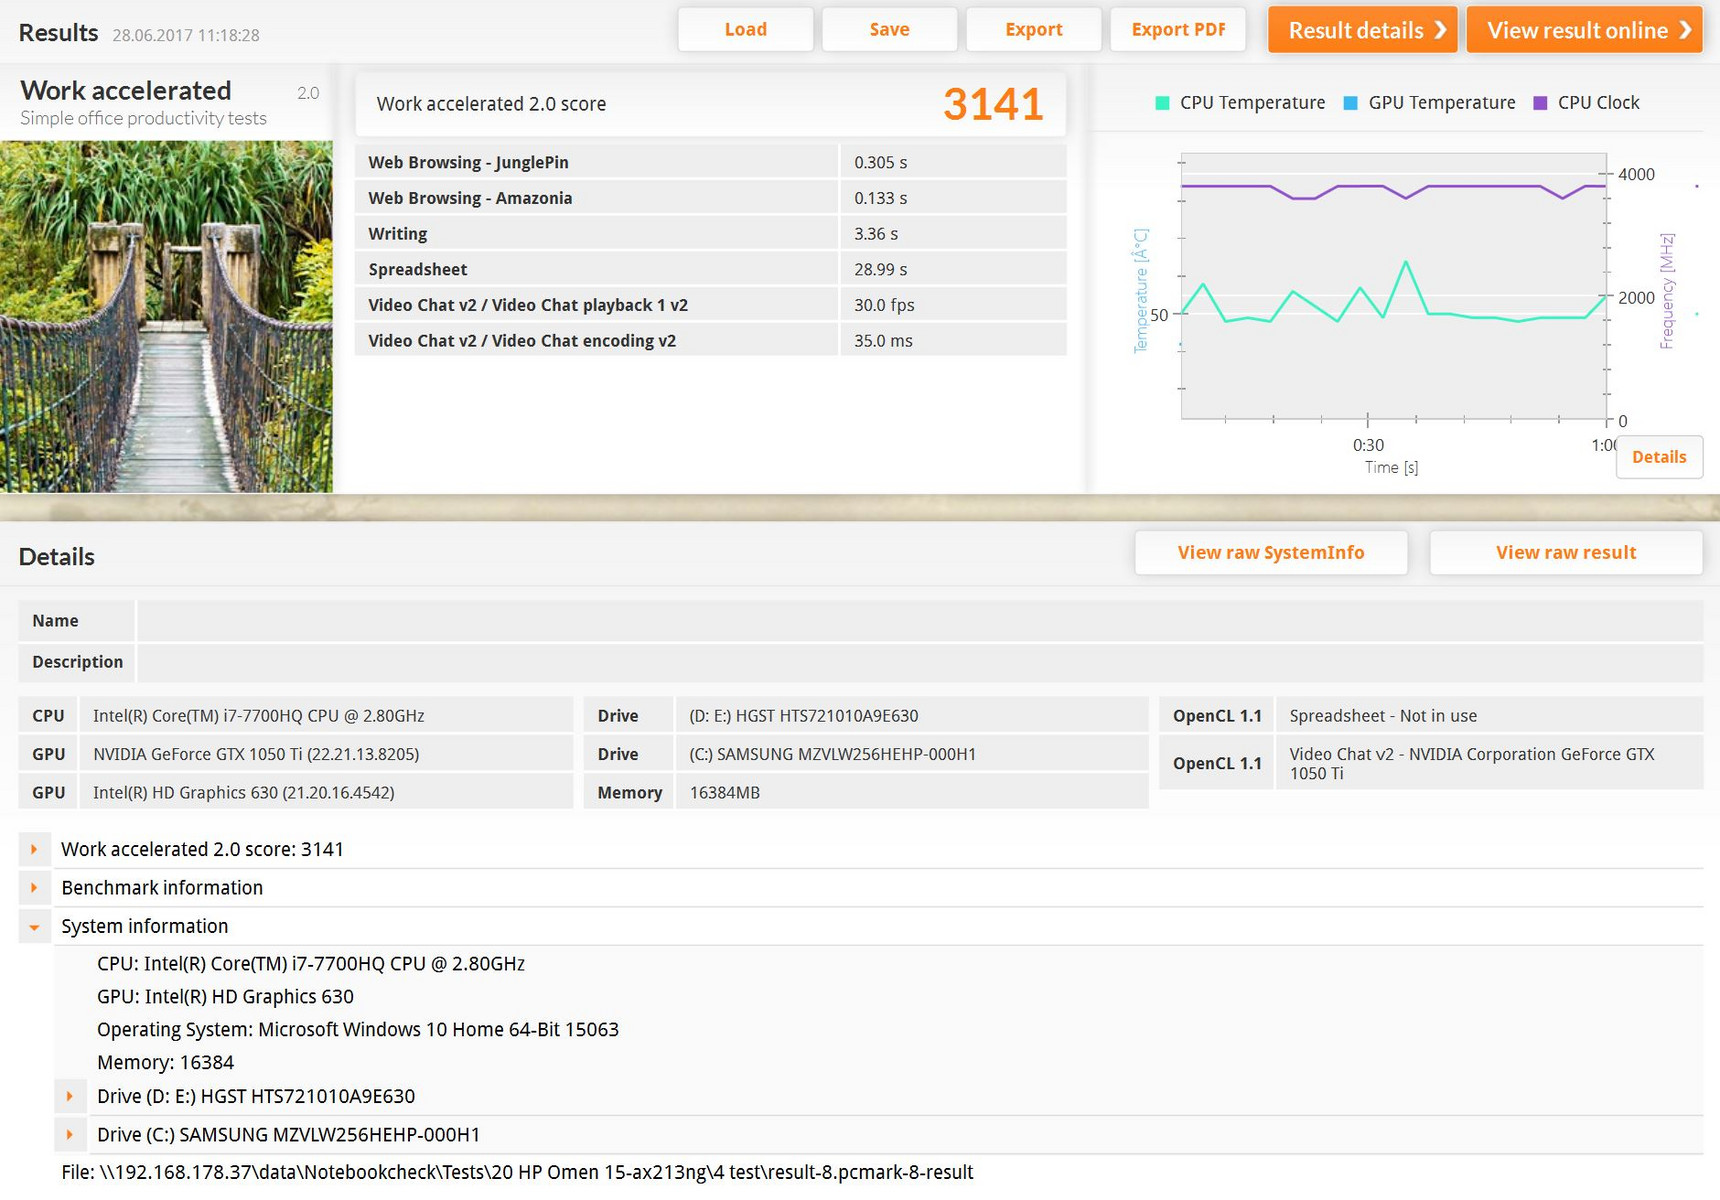
| PCMark 8 Work Score Accelerated v2 | 3141 points | |
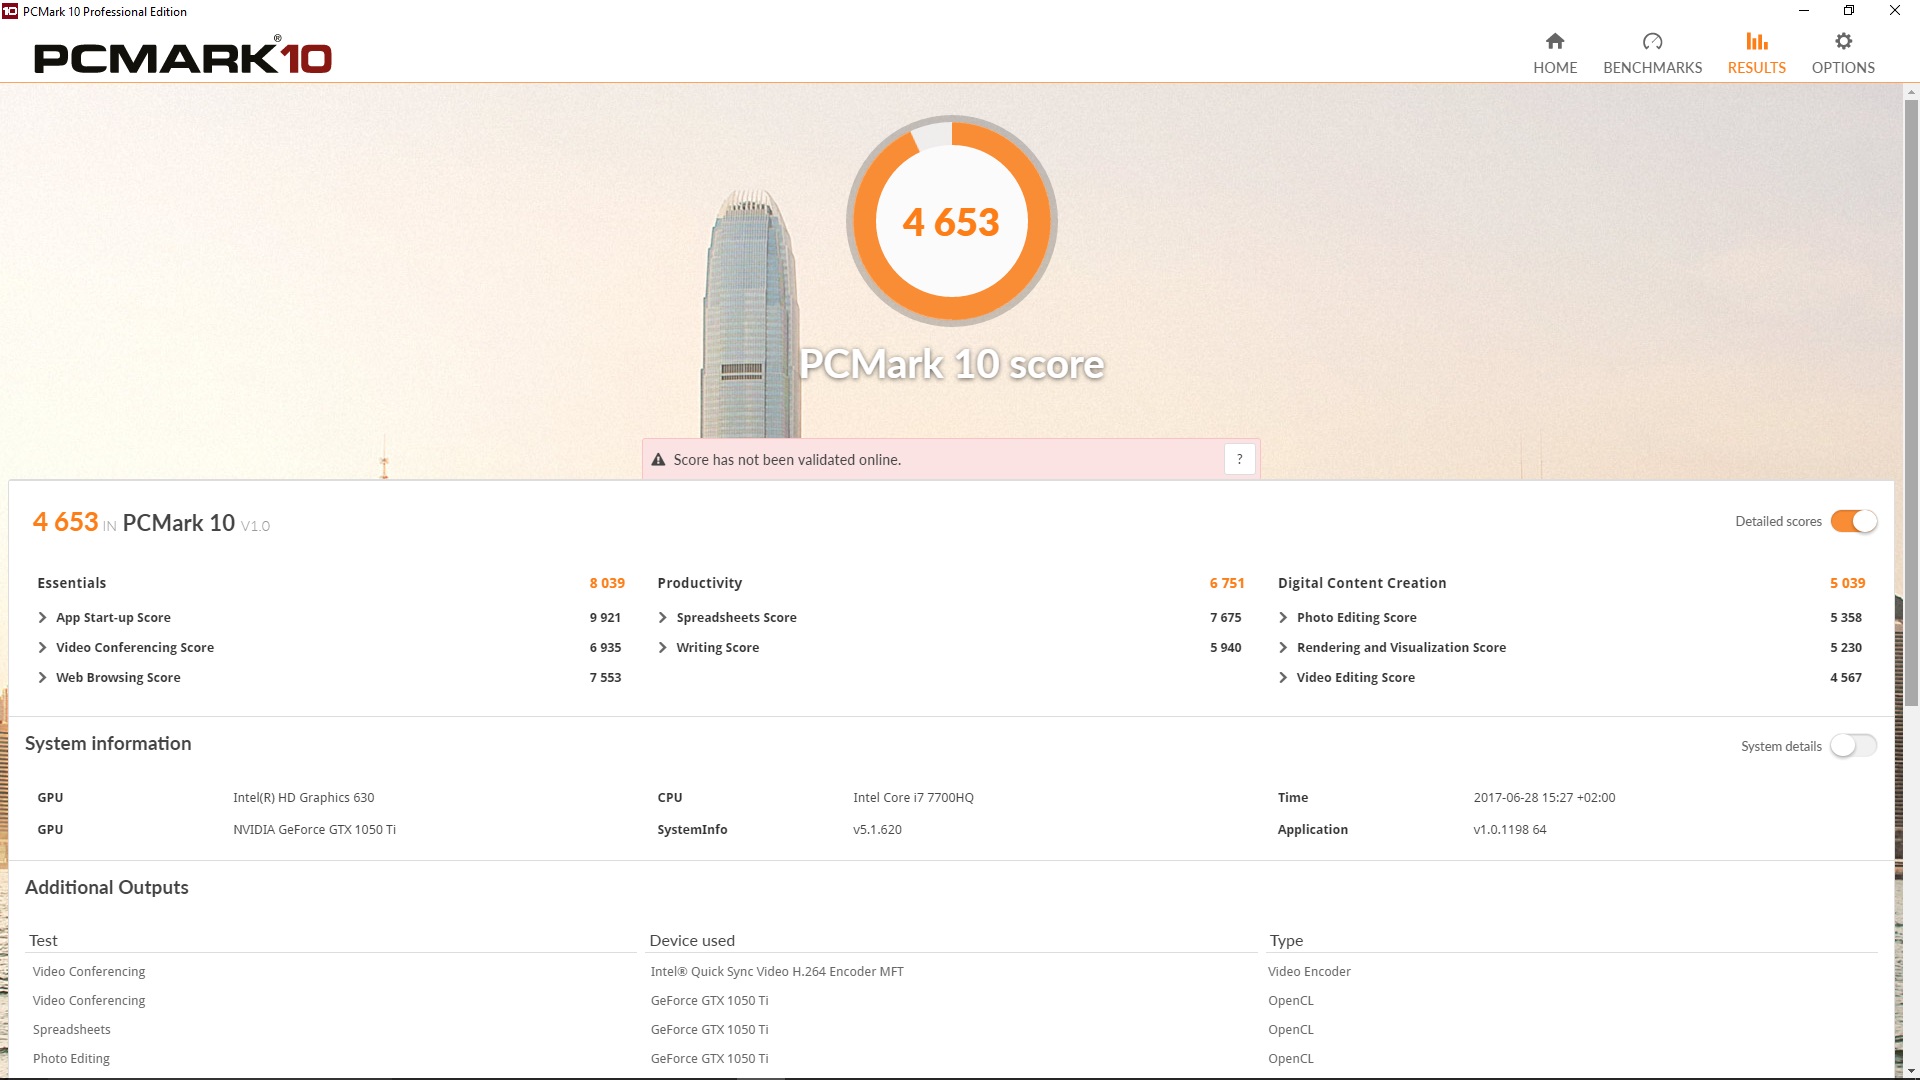
| PCMark 10 Score | 4653 points | |
Help | ||
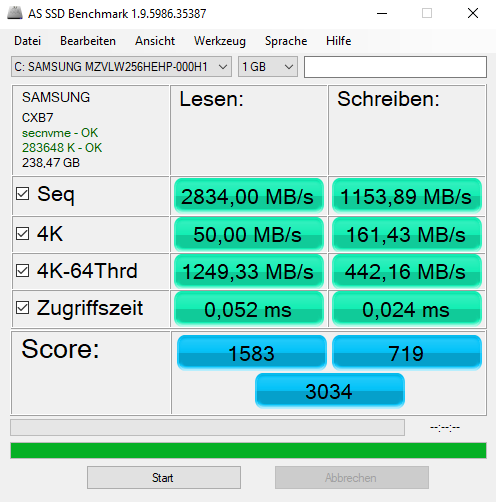
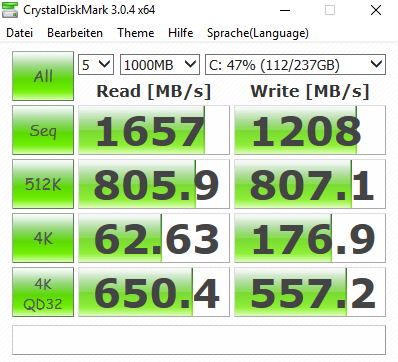
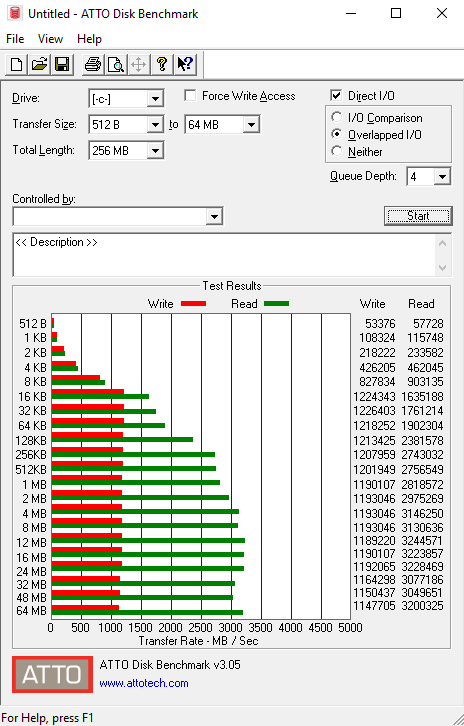
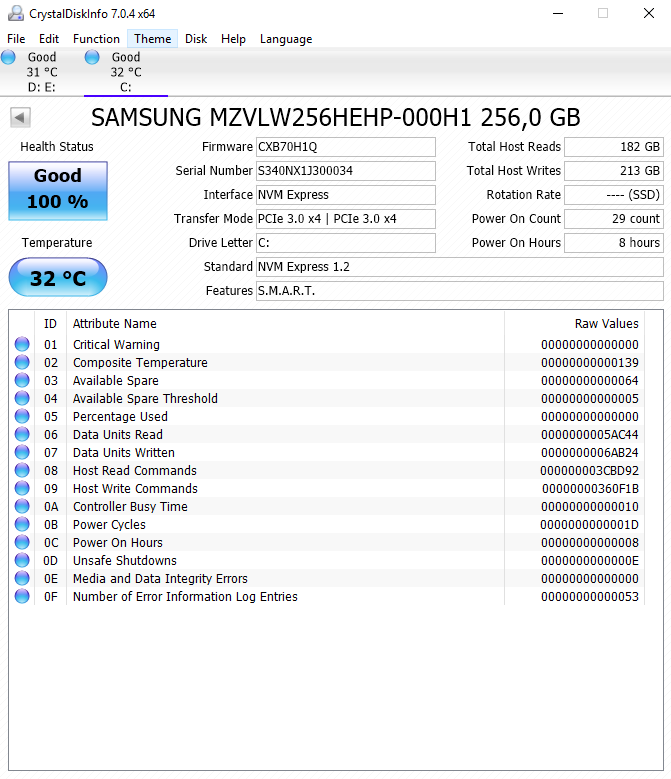
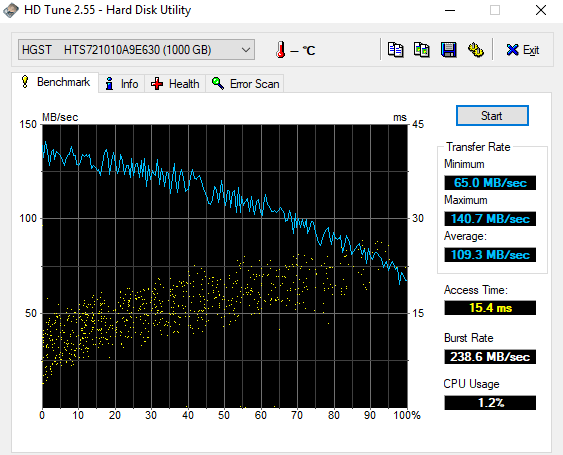
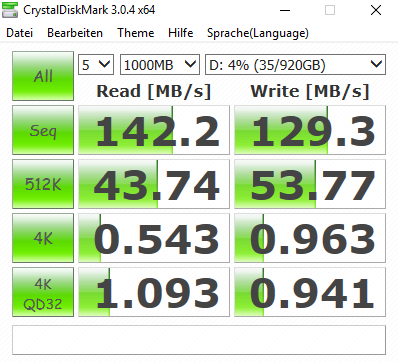
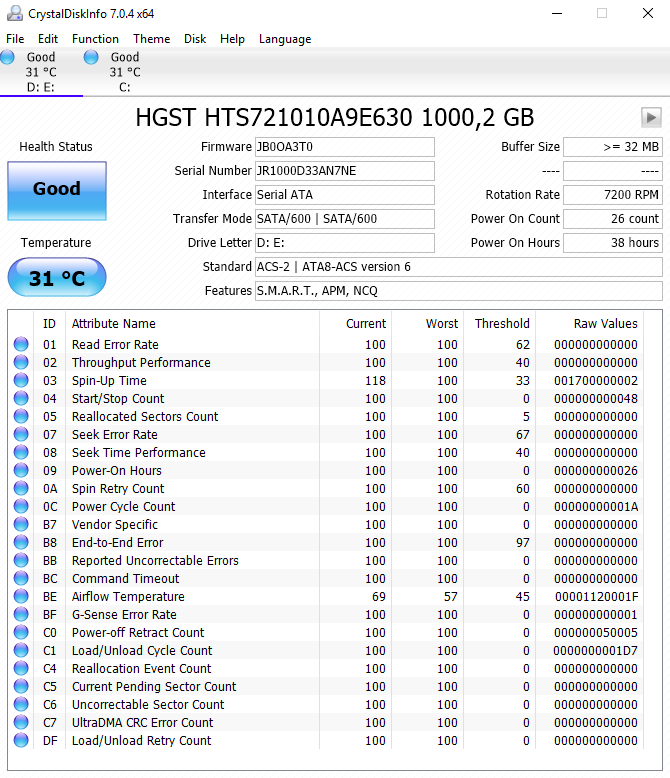
| HP Omen 15-ax213ng Samsung PM961 MZVLW256HEHP | HP Omen 15-ax007ng Adata IM2S3138E-128GM-B | Acer Aspire VX5-591G-75C4 VX15 Toshiba MQ01ABD100 | Dell Inspiron 15 7000 7567 Intel SSDSCKKF256H6 | Lenovo Legion Y520-15IKBN-80WK001KUS Samsung PM961 MZVLW256HEHP | Asus FX502VM-AS73 SK Hynix HFS256G39TND-N210A | MSI GS63VR 7RF-228US Samsung SM961 MZVKW512HMJP m.2 PCI-e | |
|---|---|---|---|---|---|---|---|
| CrystalDiskMark 3.0 | -65% | -97% | -60% | -6% | -67% | 10% | |
| Read Seq (MB/s) | 1657 | 475.7 -71% | 101.5 -94% | 485.8 -71% | 2170 31% | 503 -70% | 2141 29% |
| Write Seq (MB/s) | 1208 | 169.2 -86% | 100.6 -92% | 422.8 -65% | 1202 0% | 138.2 -89% | 1621 34% |
| Read 512 (MB/s) | 806 | 327.6 -59% | 28.33 -96% | 338.9 -58% | 786 -2% | 343.5 -57% | 499.7 -38% |
| Write 512 (MB/s) | 807 | 169.6 -79% | 28.31 -96% | 304 -62% | 822 2% | 137.8 -83% | 1531 90% |
| Read 4k (MB/s) | 62.6 | 33.14 -47% | 0.327 -99% | 27.11 -57% | 58.9 -6% | 29.36 -53% | 54.2 -13% |
| Write 4k (MB/s) | 176.9 | 81.4 -54% | 0.846 -100% | 85.4 -52% | 146.4 -17% | 70.9 -60% | 158.2 -11% |
| Read 4k QD32 (MB/s) | 650 | 276.8 -57% | 0.718 -100% | 279.6 -57% | 457.7 -30% | 369.9 -43% | 632 -3% |
| Write 4k QD32 (MB/s) | 557 | 168 -70% | 0.893 -100% | 255.1 -54% | 392.9 -29% | 99.7 -82% | 527 -5% |

| 3DMark | |
| 1280x720 Cloud Gate Standard Graphics | |
| Asus FX502VM-AS73 | |
| Lenovo Legion Y520-15IKBN-80WK001KUS | |
| Dell Inspiron 15 7000 7567 | |
| HP Omen 15-ax213ng | |
| Acer Aspire VX5-591G-75C4 VX15 | |
| HP Omen 15-ax007ng | |
| 1920x1080 Fire Strike Graphics | |
| Asus FX502VM-AS73 | |
| HP Omen 15-ax213ng | |
| Acer Aspire VX5-591G-75C4 VX15 | |
| Lenovo Legion Y520-15IKBN-80WK001KUS | |
| Dell Inspiron 15 7000 7567 | |
| HP Omen 15-ax007ng | |
| 3DMark 11 - 1280x720 Performance GPU | |
| Asus FX502VM-AS73 | |
| HP Omen 15-ax213ng | |
| Acer Aspire VX5-591G-75C4 VX15 | |
| Dell Inspiron 15 7000 7567 | |
| HP Omen 15-ax007ng | |
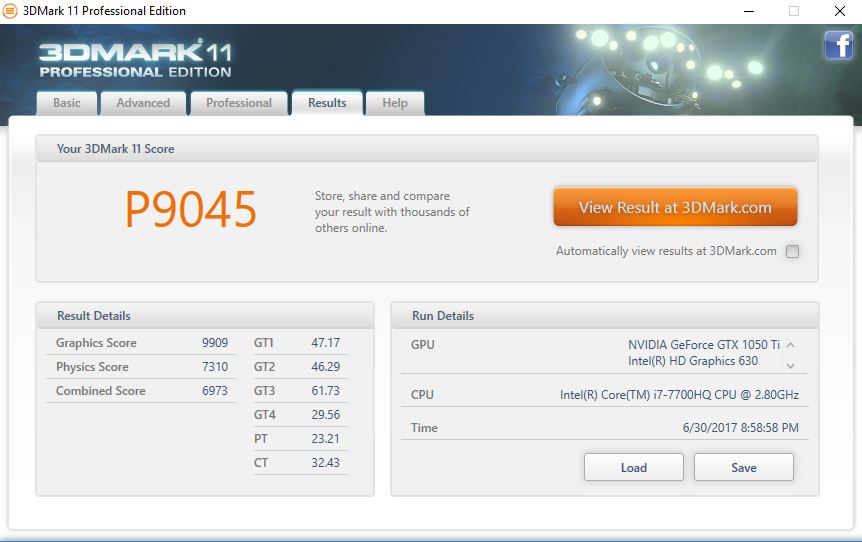
| 3DMark 11 Performance | 9045 points | |
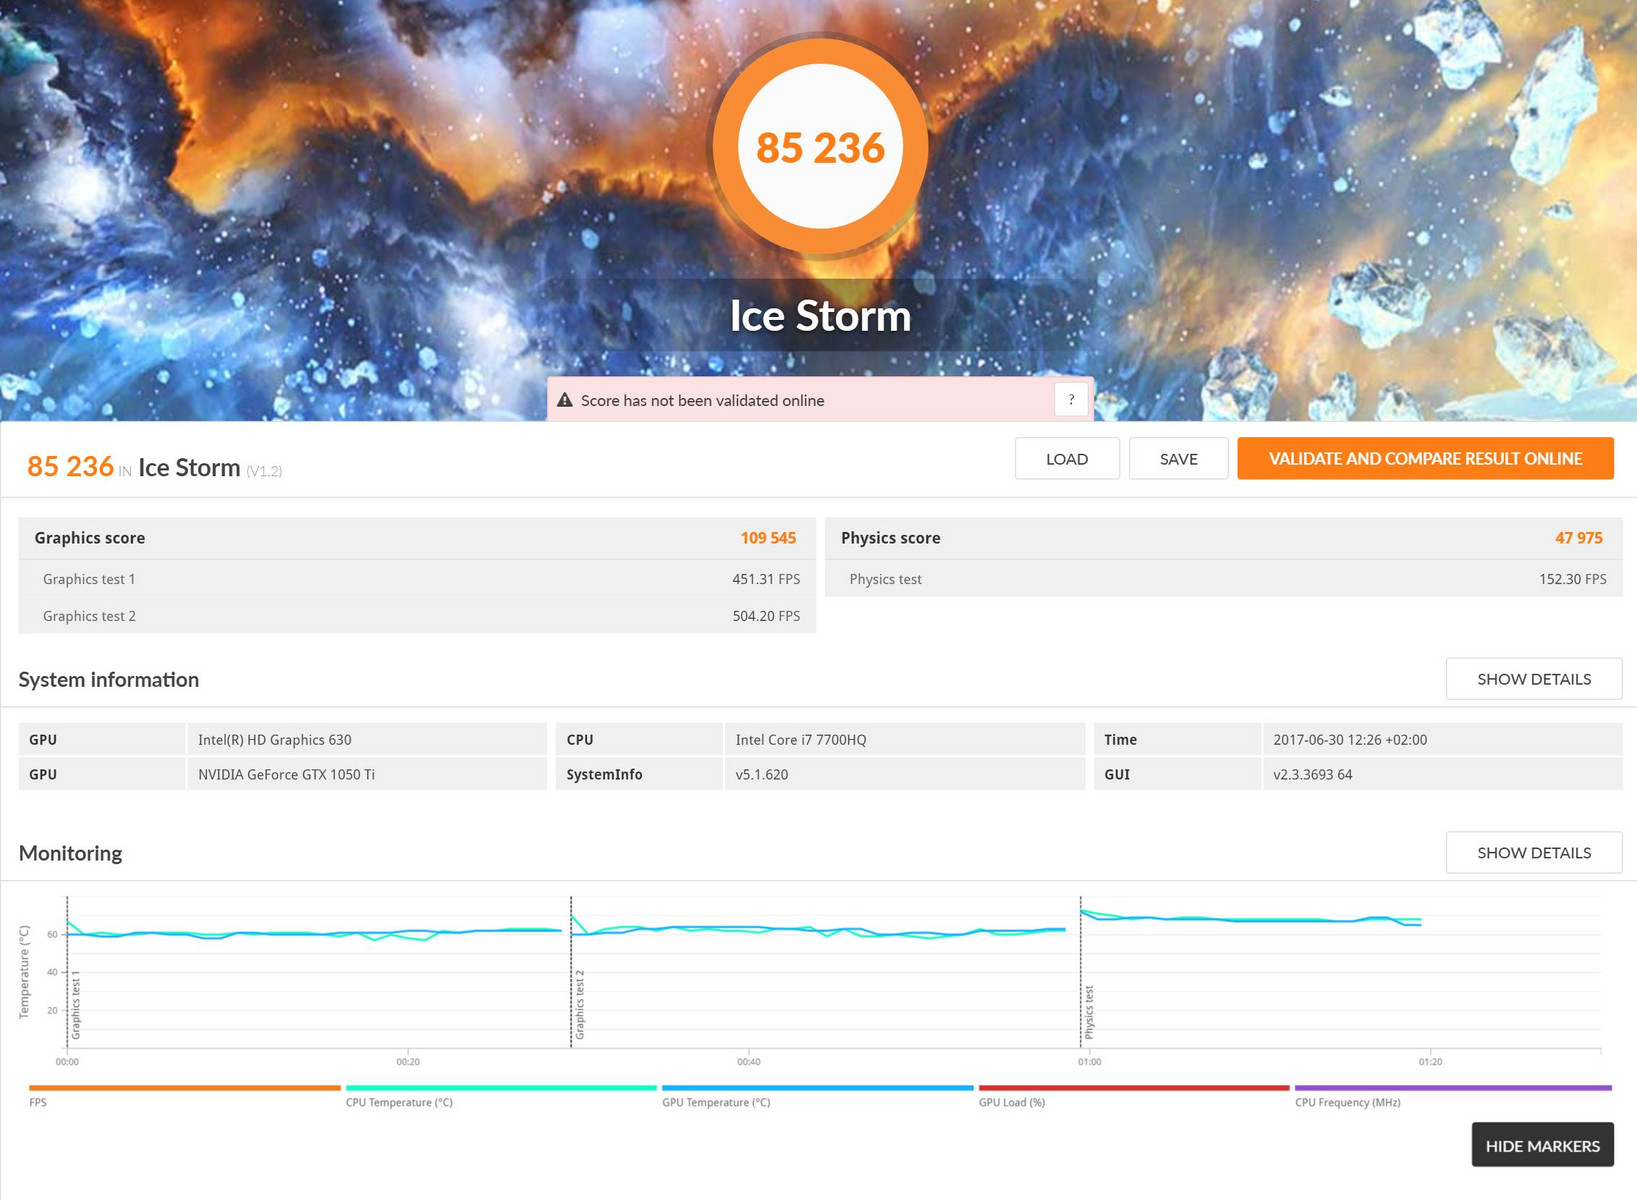
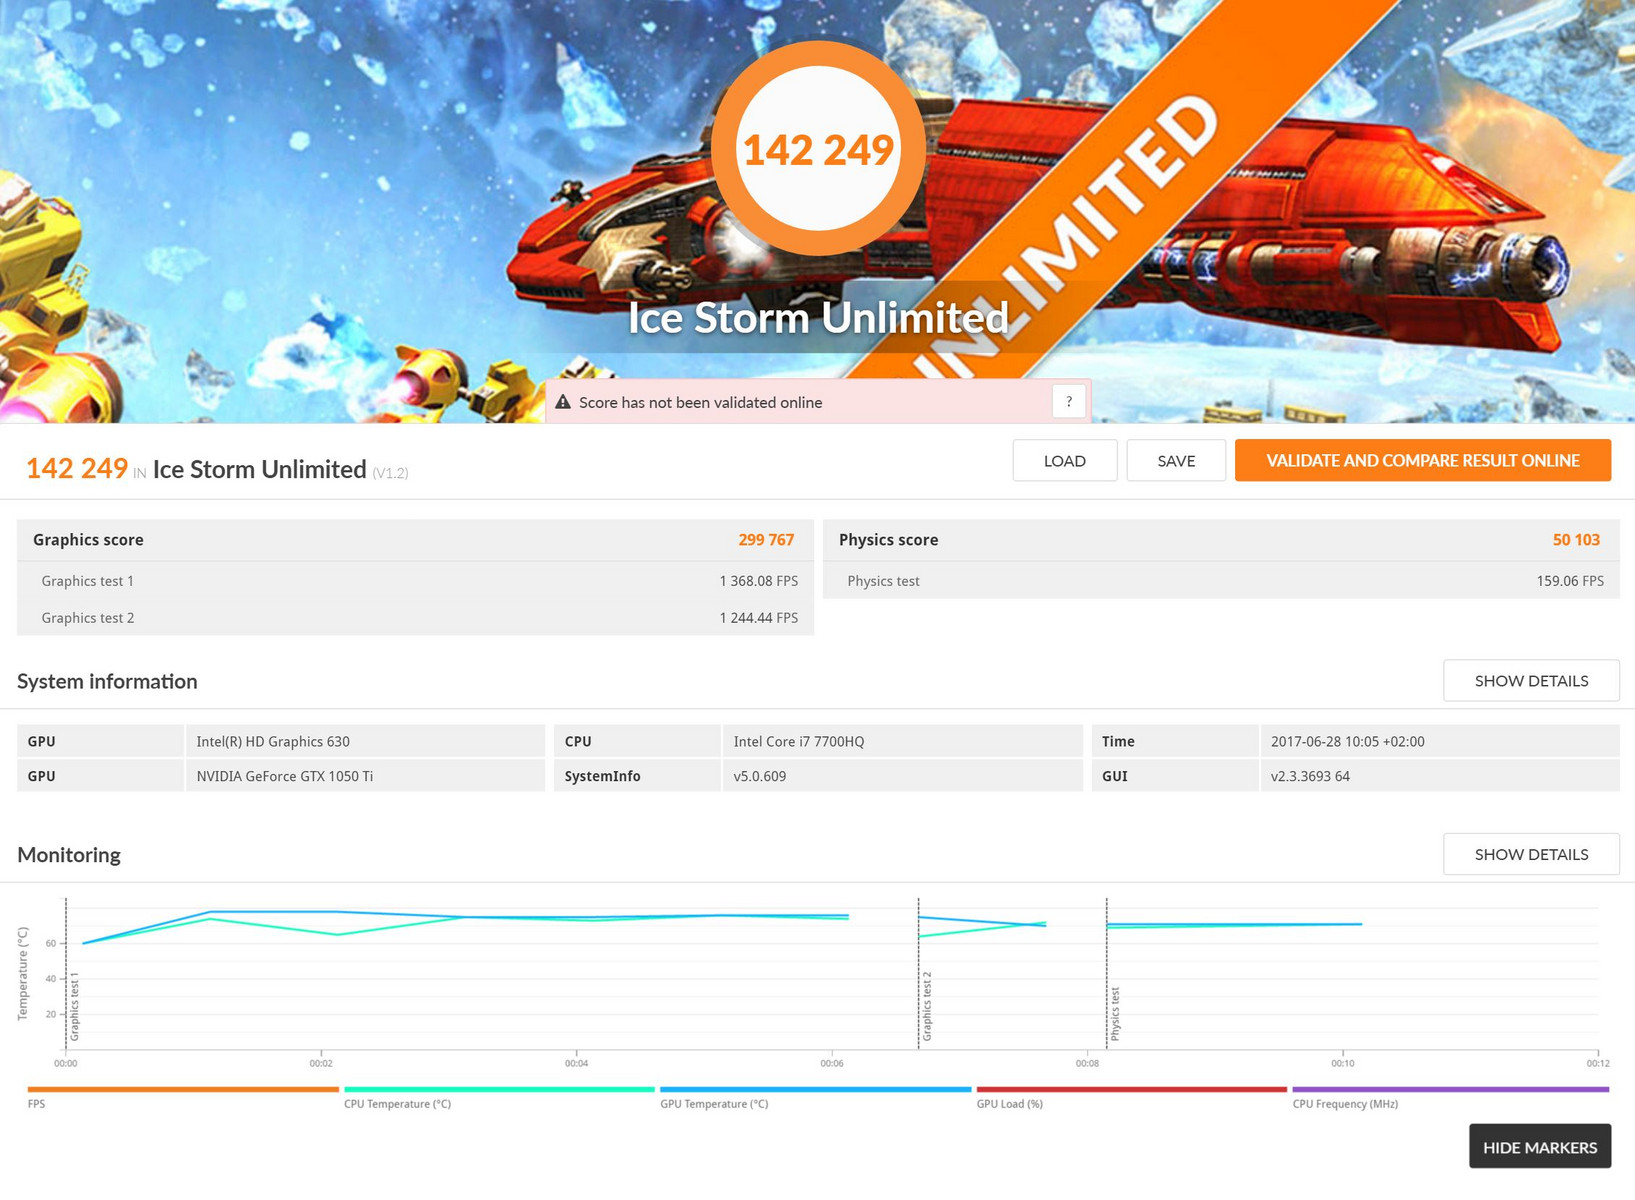
| 3DMark Ice Storm Standard Score | 85236 points | |
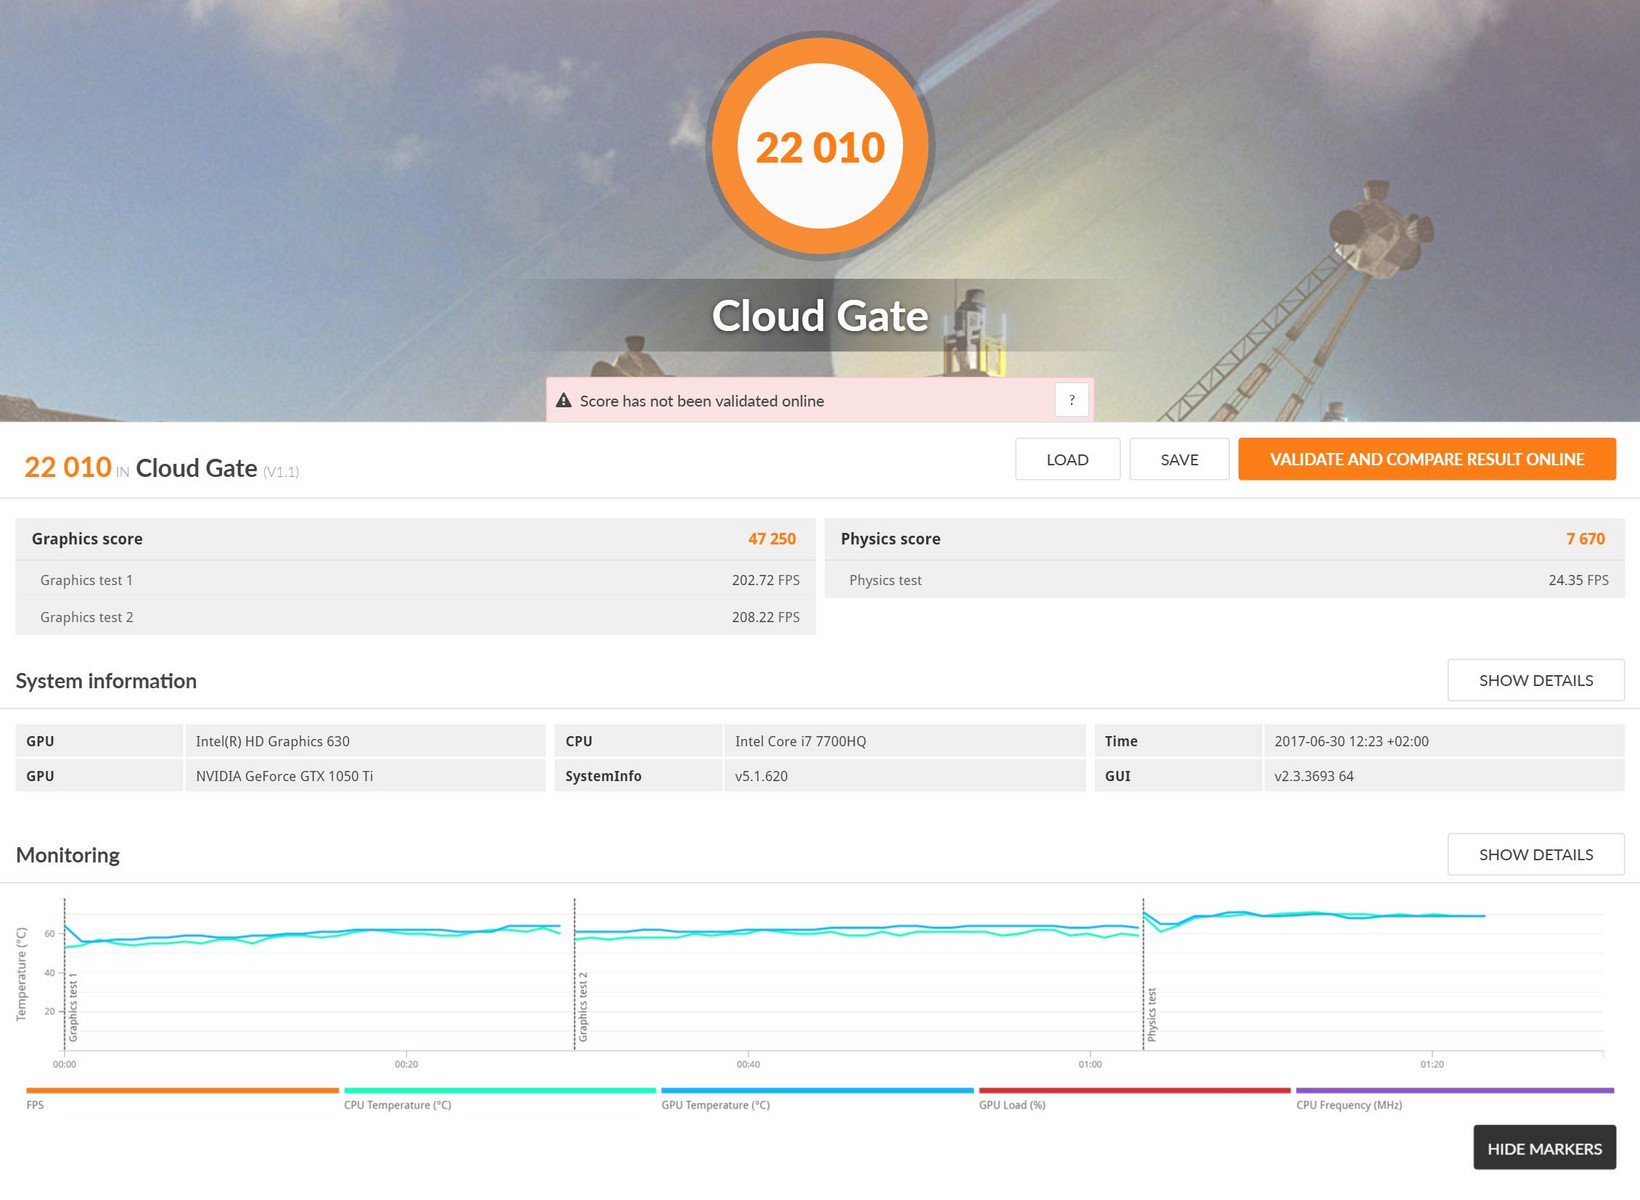
| 3DMark Cloud Gate Standard Score | 22010 points | |
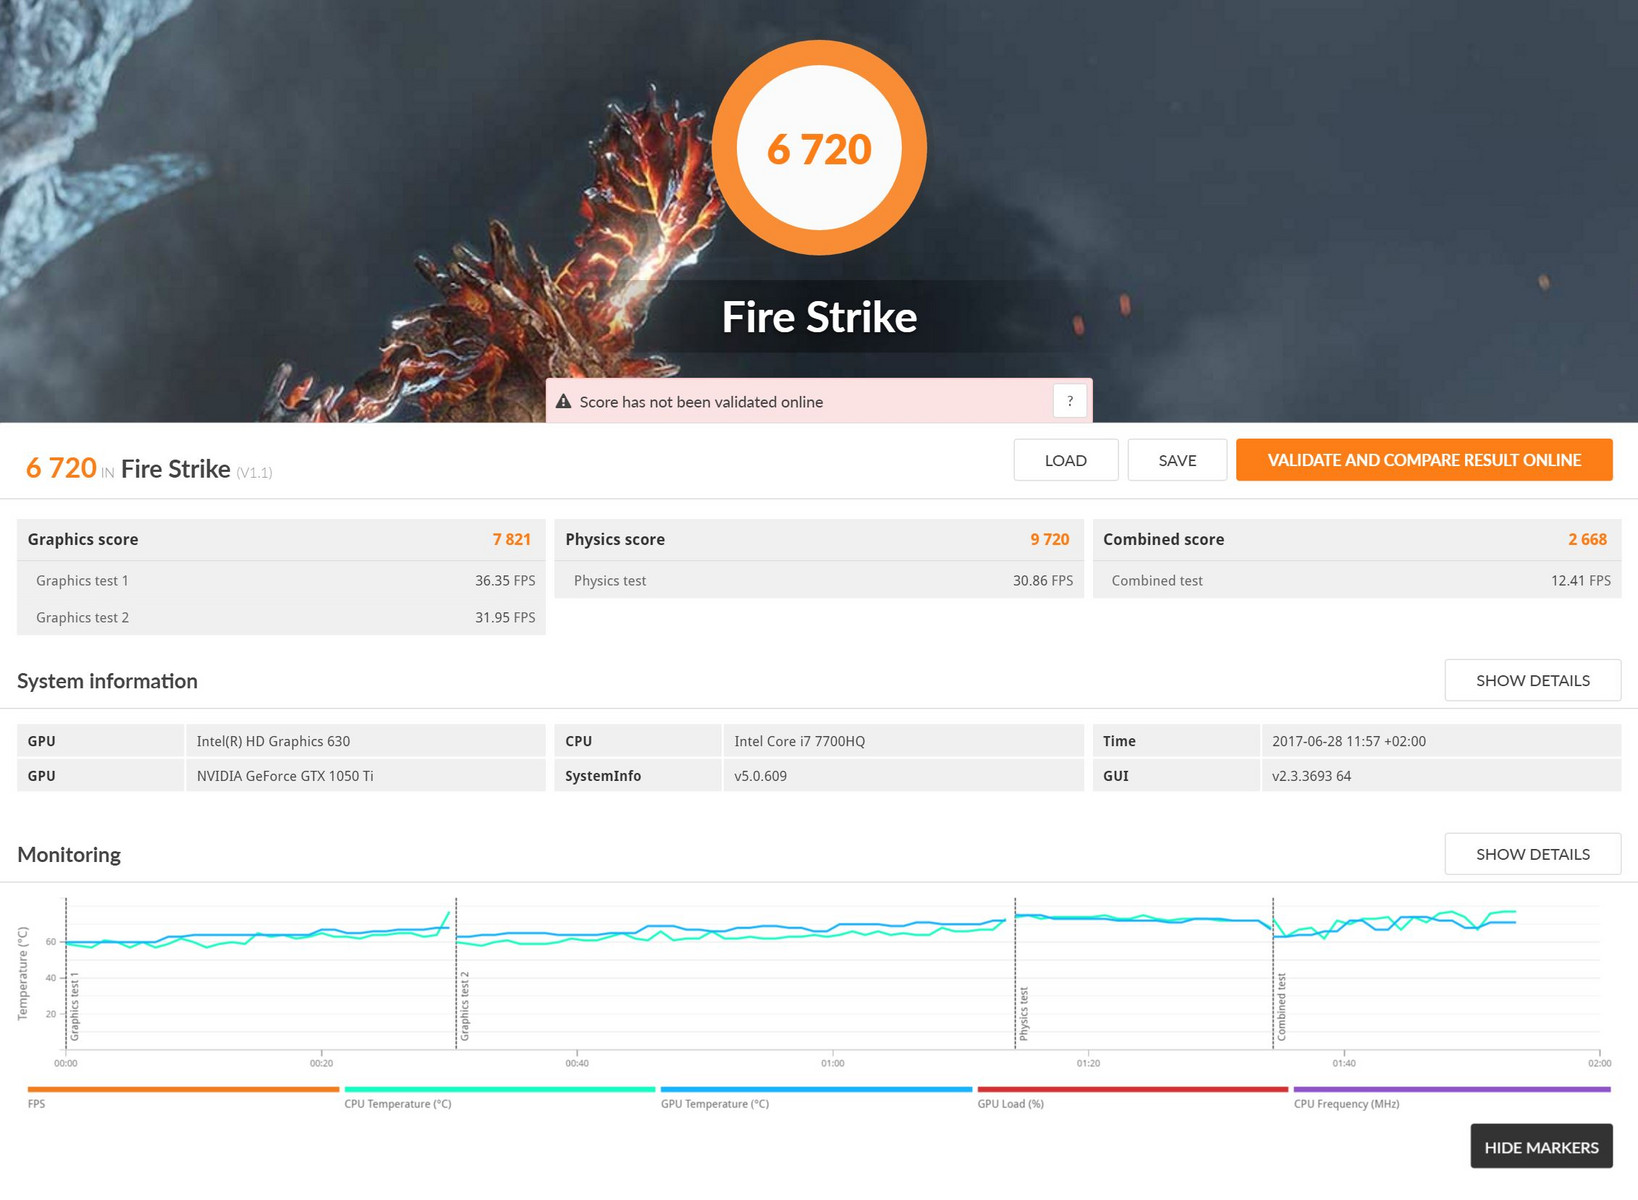
| 3DMark Fire Strike Score | 6720 points | |
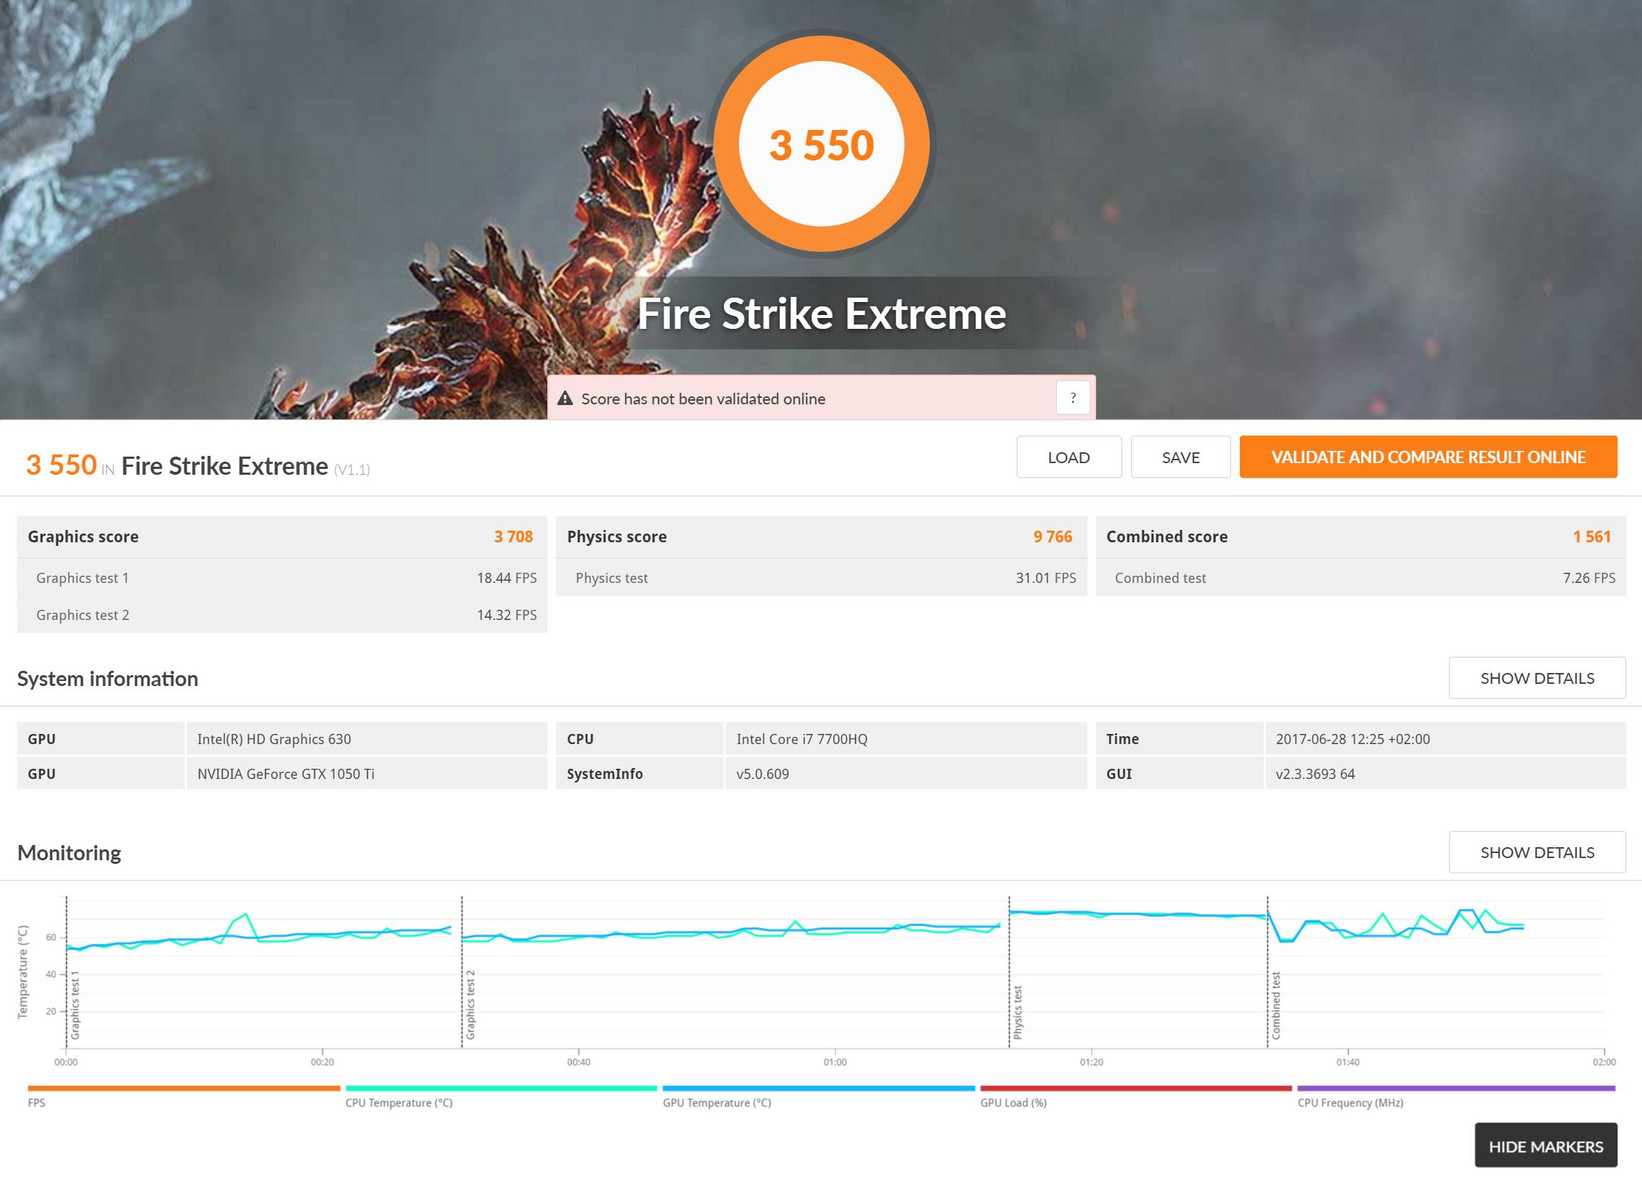
| 3DMark Fire Strike Extreme Score | 3550 points | |
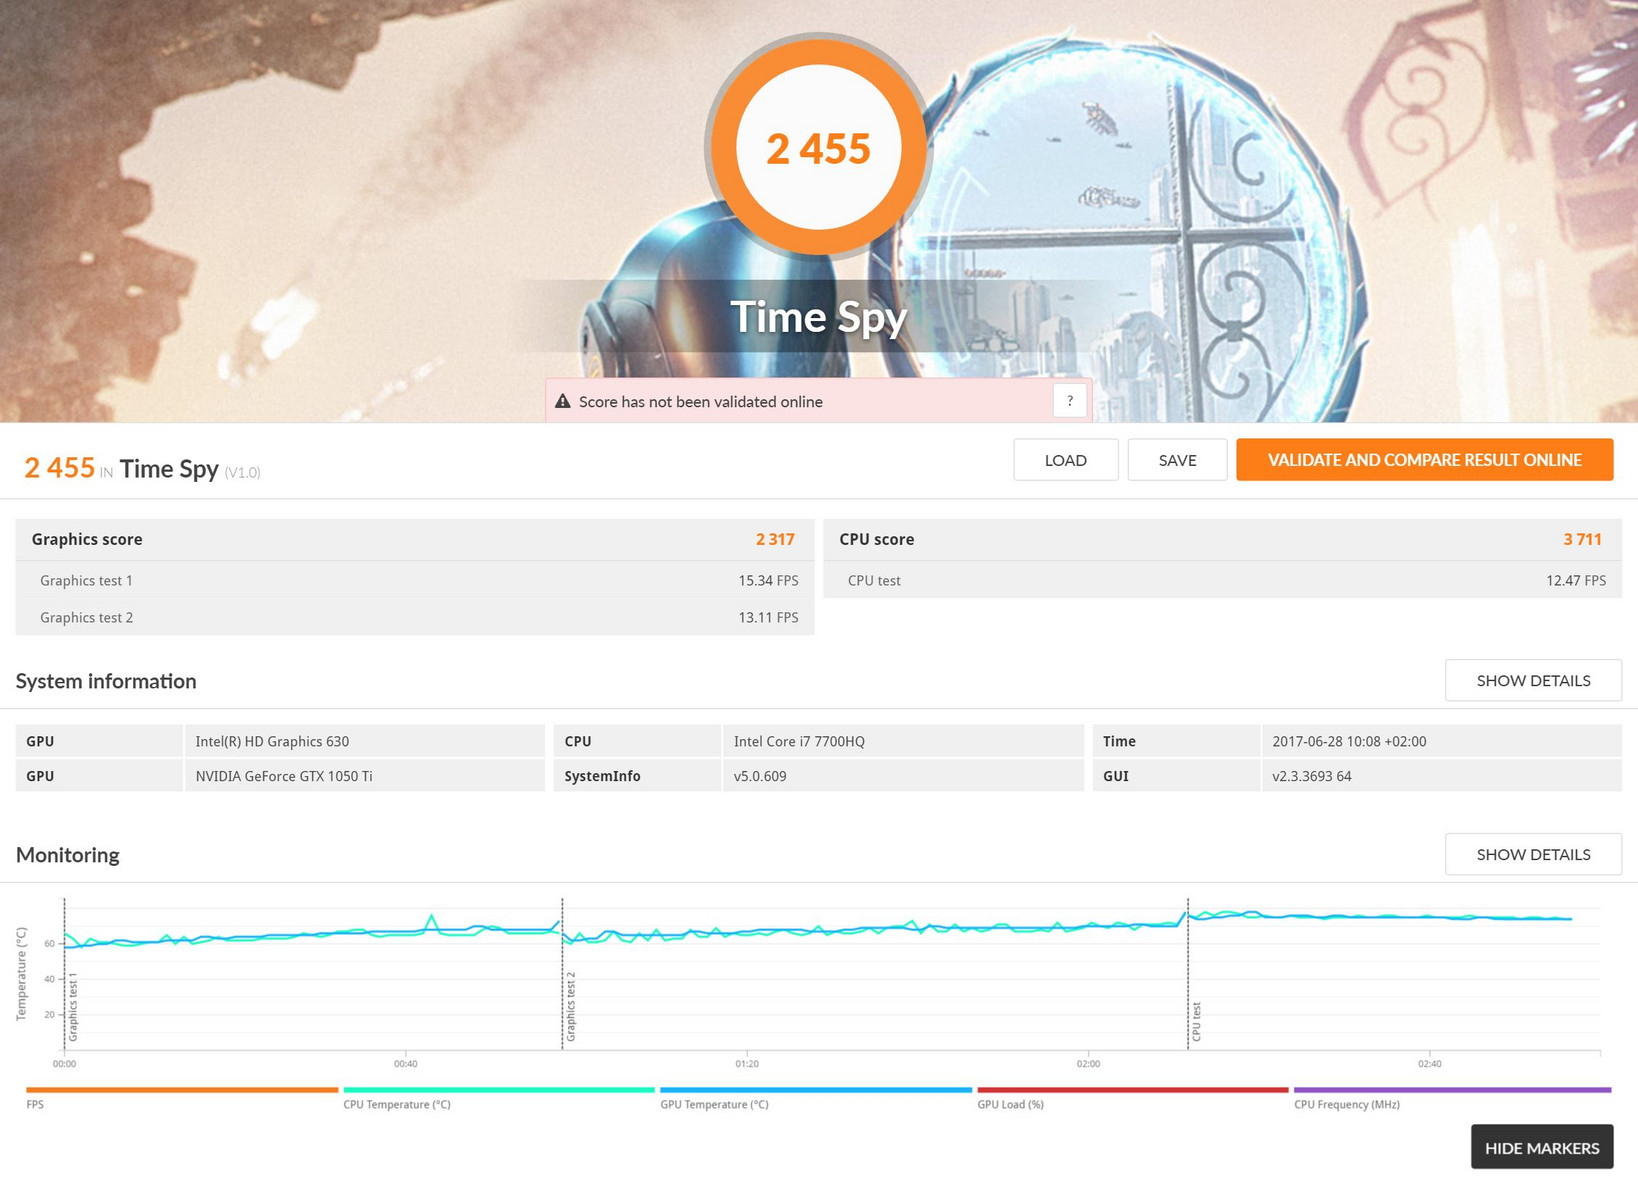
| 3DMark Time Spy Score | 2455 points | |
Help | ||
| low | med. | high | ultra | |
|---|---|---|---|---|
| BioShock Infinite (2013) | 216 | 176.8 | 163.4 | 70.7 |
| Battlefield 4 (2013) | 180.2 | 176.4 | 146 | 71.3 |
| The Witcher 3 (2015) | 128.1 | 86.2 | 48.3 | 26.6 |
| Rise of the Tomb Raider (2016) | 115.4 | 68.2 | 38.9 | 32.5 |
Noise level
| Idle |
| 32 / 34 / 36 dB(A) |
| HDD |
| 34 dB(A) |
| Load |
| 48 / 51 dB(A) |
 | ||
30 dB silent 40 dB(A) audible 50 dB(A) loud |
||
min: | ||
| HP Omen 15-ax213ng GeForce GTX 1050 Ti Mobile, i7-7700HQ | HP Omen 15-ax007ng GeForce GTX 965M, 6700HQ | Acer Aspire VX5-591G-75C4 VX15 GeForce GTX 1050 Ti Mobile, i7-7700HQ | Dell Inspiron 15 7000 7567 GeForce GTX 1050 Ti Mobile, i7-7700HQ | Lenovo Legion Y520-15IKBN-80WK001KUS GeForce GTX 1050 Ti Mobile, i7-7700HQ | Asus FX502VM-AS73 GeForce GTX 1060 Mobile, i7-7700HQ | MSI GS63VR 7RF-228US GeForce GTX 1060 Mobile, i7-7700HQ | |
|---|---|---|---|---|---|---|---|
| Noise | 3% | 11% | 6% | 13% | 6% | 7% | |
| off / environment * (dB) | 30 | 30 -0% | 30.4 -1% | 30.3 -1% | 27.7 8% | 28.7 4% | 28.8 4% |
| Idle Minimum * (dB) | 32 | 32 -0% | 31.4 2% | 30.9 3% | 30.5 5% | 30.6 4% | 33.1 -3% |
| Idle Average * (dB) | 34 | 33 3% | 31.4 8% | 30.9 9% | 30.5 10% | 30.6 10% | 33.1 3% |
| Idle Maximum * (dB) | 36 | 36 -0% | 31.4 13% | 31 14% | 30.6 15% | 31 14% | 34 6% |
| Load Average * (dB) | 48 | 43 10% | 36.8 23% | 46.5 3% | 40 17% | 46.2 4% | 37.2 22% |
| Witcher 3 ultra * (dB) | 49 | 40 18% | 46.1 6% | ||||
| Load Maximum * (dB) | 51 | 49 4% | 41.3 19% | 46.8 8% | 42.6 16% | 52.3 -3% | 47.1 8% |
* ... smaller is better
| HP Omen 15-ax213ng GeForce GTX 1050 Ti Mobile, i7-7700HQ | HP Omen 15-ax007ng GeForce GTX 965M, 6700HQ | Acer Aspire VX5-591G-75C4 VX15 GeForce GTX 1050 Ti Mobile, i7-7700HQ | Dell Inspiron 15 7000 7567 GeForce GTX 1050 Ti Mobile, i7-7700HQ | Lenovo Legion Y520-15IKBN-80WK001KUS GeForce GTX 1050 Ti Mobile, i7-7700HQ | Asus FX502VM-AS73 GeForce GTX 1060 Mobile, i7-7700HQ | MSI GS63VR 7RF-228US GeForce GTX 1060 Mobile, i7-7700HQ | |
|---|---|---|---|---|---|---|---|
| Heat | 3% | 9% | 21% | 4% | -3% | 1% | |
| Maximum Upper Side * (°C) | 52.4 | 48.5 7% | 47 10% | 43.4 17% | 46.8 11% | 53.2 -2% | |
| Maximum Bottom * (°C) | 54.2 | 59 -9% | 47 13% | 37.7 30% | 55.8 -3% | 56.8 -5% | |
| Idle Upper Side * (°C) | 30.5 | 28.7 6% | 28.4 7% | 24.3 20% | 27.6 10% | 28.8 6% | 28.4 7% |
| Idle Bottom * (°C) | 28.2 | 25.7 9% | 27.1 4% | 23.6 16% | 28.4 -1% | 31.4 -11% | 29.6 -5% |
* ... smaller is better
(-) The maximum temperature on the upper side is 52.4 °C / 126 F, compared to the average of 36.8 °C / 98 F, ranging from 21 to 71 °C for the class Multimedia.
(-) The bottom heats up to a maximum of 54.2 °C / 130 F, compared to the average of 39.1 °C / 102 F
(+) In idle usage, the average temperature for the upper side is 28.5 °C / 83 F, compared to the device average of 31.3 °C / 88 F.
(-) Playing The Witcher 3, the average temperature for the upper side is 38.9 °C / 102 F, compared to the device average of 31.3 °C / 88 F.
(-) The palmrests and touchpad can get very hot to the touch with a maximum of 45.4 °C / 113.7 F.
(-) The average temperature of the palmrest area of similar devices was 28.7 °C / 83.7 F (-16.7 °C / -30 F).
HP Omen 15-ax213ng audio analysis
(±) | speaker loudness is average but good (80 dB)
Bass 100 - 315 Hz
(-) | nearly no bass - on average 18.2% lower than median
(±) | linearity of bass is average (11.8% delta to prev. frequency)
Mids 400 - 2000 Hz
(+) | balanced mids - only 4.3% away from median
(+) | mids are linear (4.2% delta to prev. frequency)
Highs 2 - 16 kHz
(+) | balanced highs - only 4.2% away from median
(+) | highs are linear (5.8% delta to prev. frequency)
Overall 100 - 16.000 Hz
(±) | linearity of overall sound is average (20.6% difference to median)
Compared to same class
» 70% of all tested devices in this class were better, 8% similar, 22% worse
» The best had a delta of 5%, average was 17%, worst was 45%
Compared to all devices tested
» 55% of all tested devices were better, 8% similar, 37% worse
» The best had a delta of 4%, average was 23%, worst was 134%
MSI GS63VR 7RF-228US audio analysis
(±) | speaker loudness is average but good (75 dB)
Bass 100 - 315 Hz
(-) | nearly no bass - on average 25.3% lower than median
(±) | linearity of bass is average (12.4% delta to prev. frequency)
Mids 400 - 2000 Hz
(+) | balanced mids - only 3.3% away from median
(±) | linearity of mids is average (7% delta to prev. frequency)
Highs 2 - 16 kHz
(±) | higher highs - on average 8.1% higher than median
(±) | linearity of highs is average (8.6% delta to prev. frequency)
Overall 100 - 16.000 Hz
(±) | linearity of overall sound is average (28.4% difference to median)
Compared to same class
» 94% of all tested devices in this class were better, 1% similar, 4% worse
» The best had a delta of 6%, average was 18%, worst was 132%
Compared to all devices tested
» 86% of all tested devices were better, 3% similar, 12% worse
» The best had a delta of 4%, average was 23%, worst was 134%
| Off / Standby | |
| Idle | |
| Load |
|
Key:
min: | |
| HP Omen 15-ax213ng GeForce GTX 1050 Ti Mobile, i7-7700HQ | HP Omen 15-ax007ng GeForce GTX 965M, 6700HQ | Acer Aspire VX5-591G-75C4 VX15 GeForce GTX 1050 Ti Mobile, i7-7700HQ | Dell Inspiron 15 7000 7567 GeForce GTX 1050 Ti Mobile, i7-7700HQ | Lenovo Legion Y520-15IKBN-80WK001KUS GeForce GTX 1050 Ti Mobile, i7-7700HQ | Asus FX502VM-AS73 GeForce GTX 1060 Mobile, i7-7700HQ | MSI GS63VR 7RF-228US GeForce GTX 1060 Mobile, i7-7700HQ | |
|---|---|---|---|---|---|---|---|
| Power Consumption | -1% | 6% | 26% | 5% | -40% | -51% | |
| Idle Minimum * (Watt) | 6 | 7 -17% | 7 -17% | 4.4 27% | 8.5 -42% | 14.9 -148% | 14.5 -142% |
| Idle Average * (Watt) | 11 | 11 -0% | 10.2 7% | 6.8 38% | 9.1 17% | 15.1 -37% | 17.3 -57% |
| Idle Maximum * (Watt) | 18 | 19 -6% | 14 22% | 8.3 54% | 9.7 46% | 15.2 16% | 17.4 3% |
| Load Average * (Watt) | 81 | 79 2% | 78 4% | 81 -0% | 79.9 1% | 105.8 -31% | 93 -15% |
| Witcher 3 ultra * (Watt) | 90 | 97.7 -9% | 128.8 -43% | ||||
| Load Maximum * (Watt) | 146 | 119 18% | 127 13% | 127 13% | 121.5 17% | 148.8 -2% |
* ... smaller is better
| HP Omen 15-ax213ng i7-7700HQ, GeForce GTX 1050 Ti Mobile, 63.3 Wh | HP Omen 15-ax007ng 6700HQ, GeForce GTX 965M, 61.5 Wh | Acer Aspire VX5-591G-75C4 VX15 i7-7700HQ, GeForce GTX 1050 Ti Mobile, 52.5 Wh | Dell Inspiron 15 7000 7567 i7-7700HQ, GeForce GTX 1050 Ti Mobile, 74 Wh | Lenovo Legion Y520-15IKBN-80WK001KUS i7-7700HQ, GeForce GTX 1050 Ti Mobile, 45 Wh | Asus FX502VM-AS73 i7-7700HQ, GeForce GTX 1060 Mobile, 64 Wh | MSI GS63VR 7RF-228US i7-7700HQ, GeForce GTX 1060 Mobile, 65 Wh | |
|---|---|---|---|---|---|---|---|
| Battery runtime | -13% | -34% | 54% | -43% | -39% | -38% | |
| Reader / Idle (h) | 12.8 | 7.8 -39% | 5.4 -58% | 19.6 53% | 8.5 -34% | 6.1 -52% | 6.4 -50% |
| H.264 (h) | 3.3 | 4.1 24% | 7.6 130% | ||||
| WiFi v1.3 (h) | 7.1 | 4.5 -37% | 5 -30% | 10.4 46% | 4 -44% | 4.6 -35% | 3.9 -45% |
| Load (h) | 1.6 | 1.6 0% | 1.4 -13% | 1.4 -13% | 0.8 -50% | 1.1 -31% | 1.3 -19% |
Pros
Cons
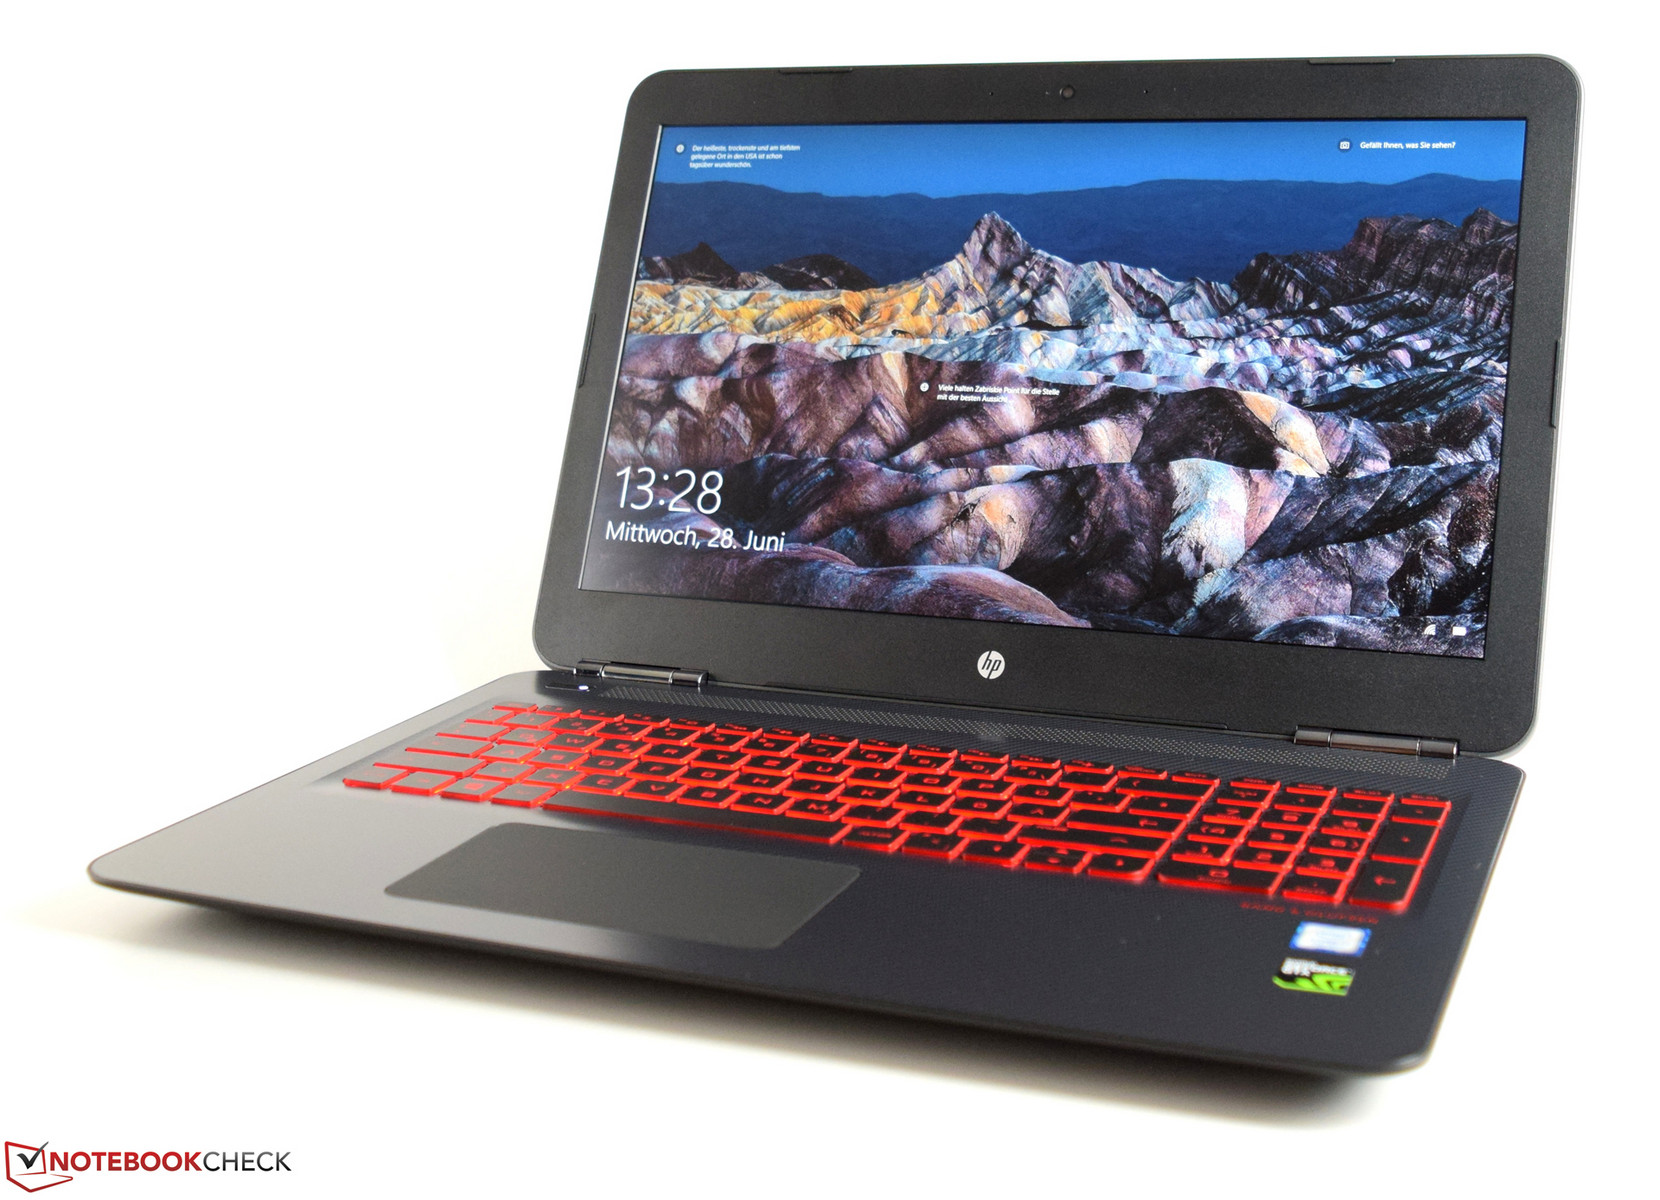
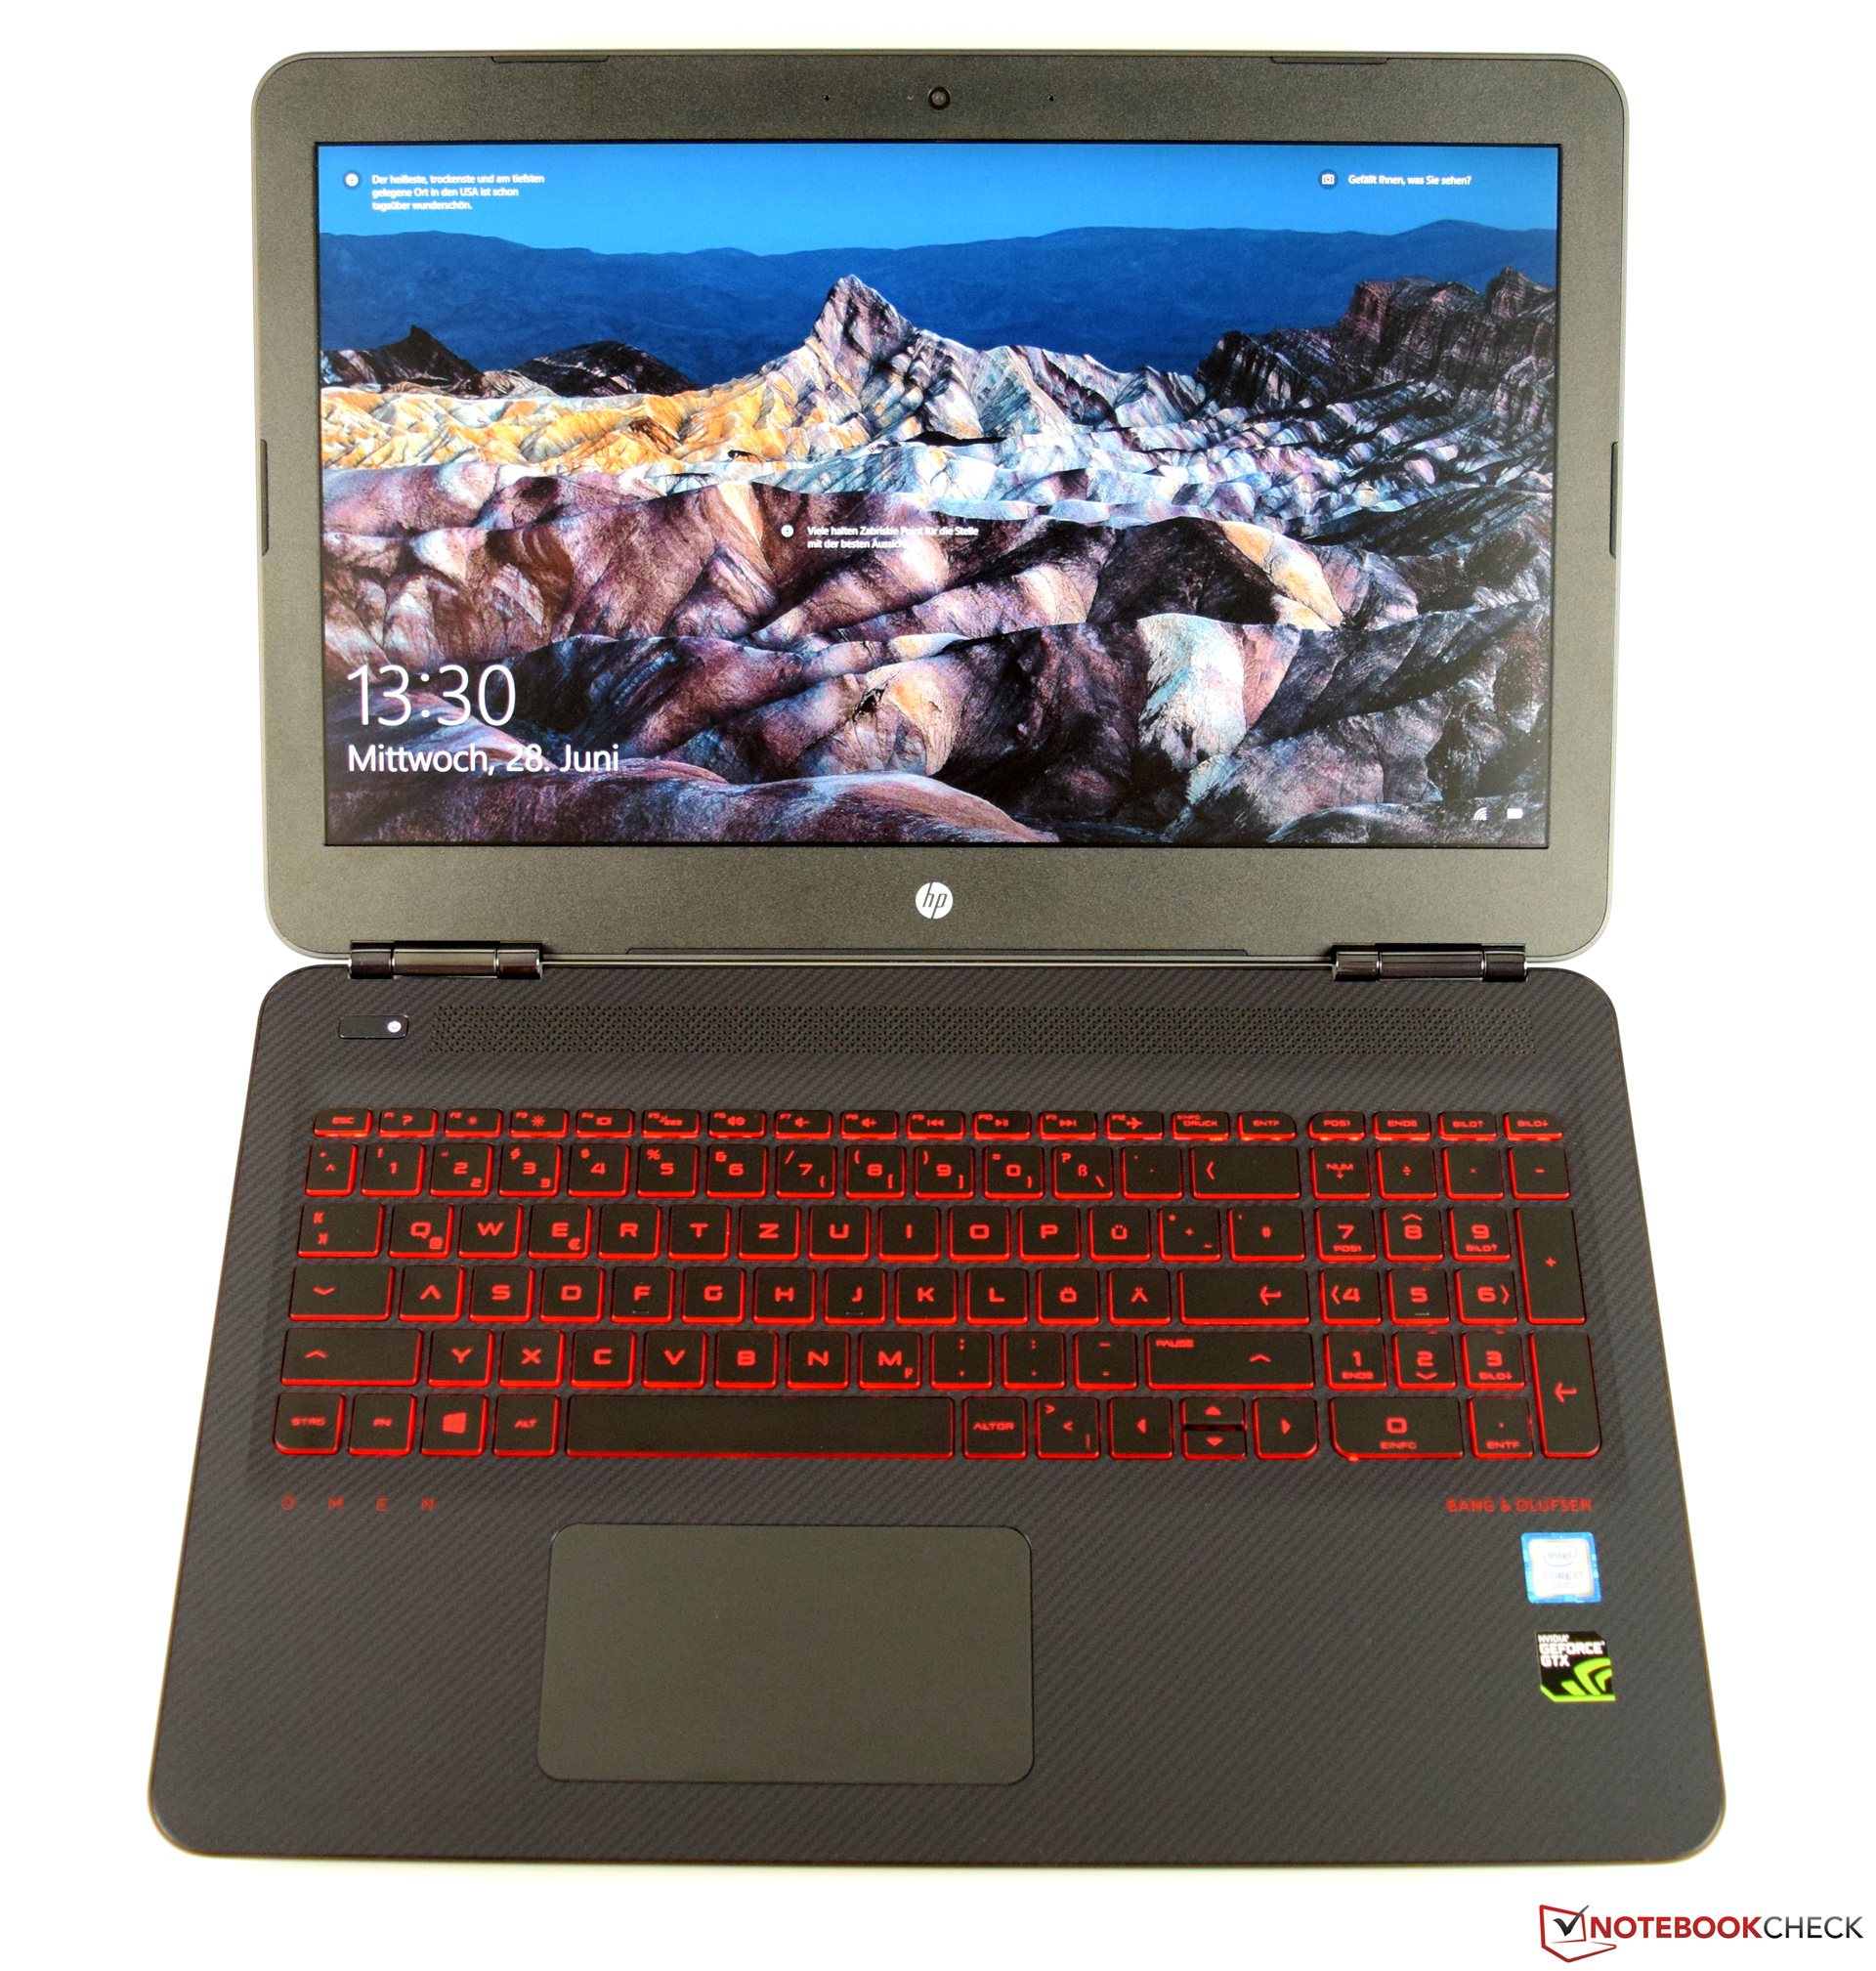
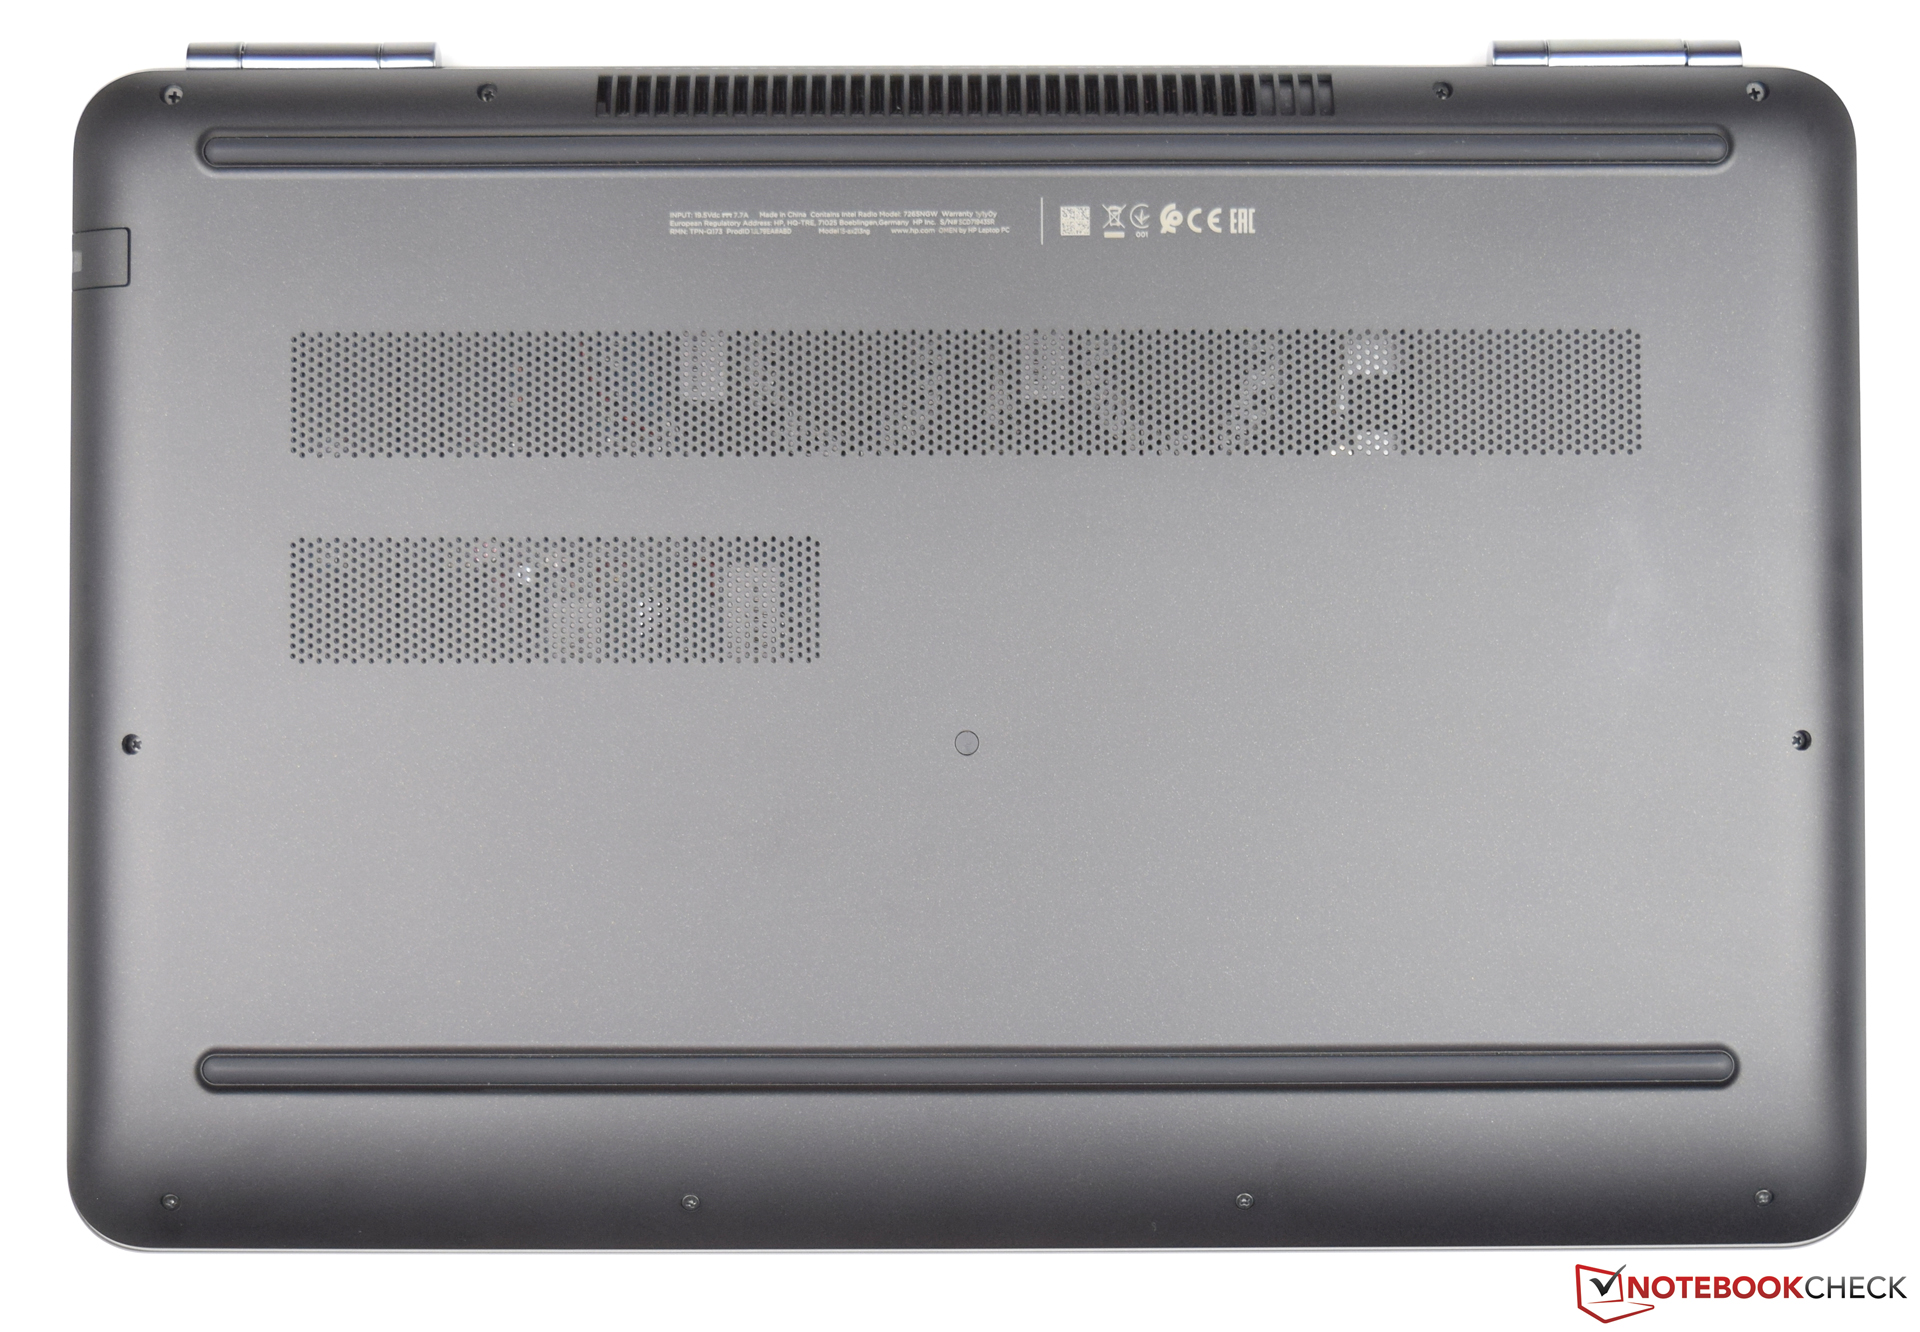
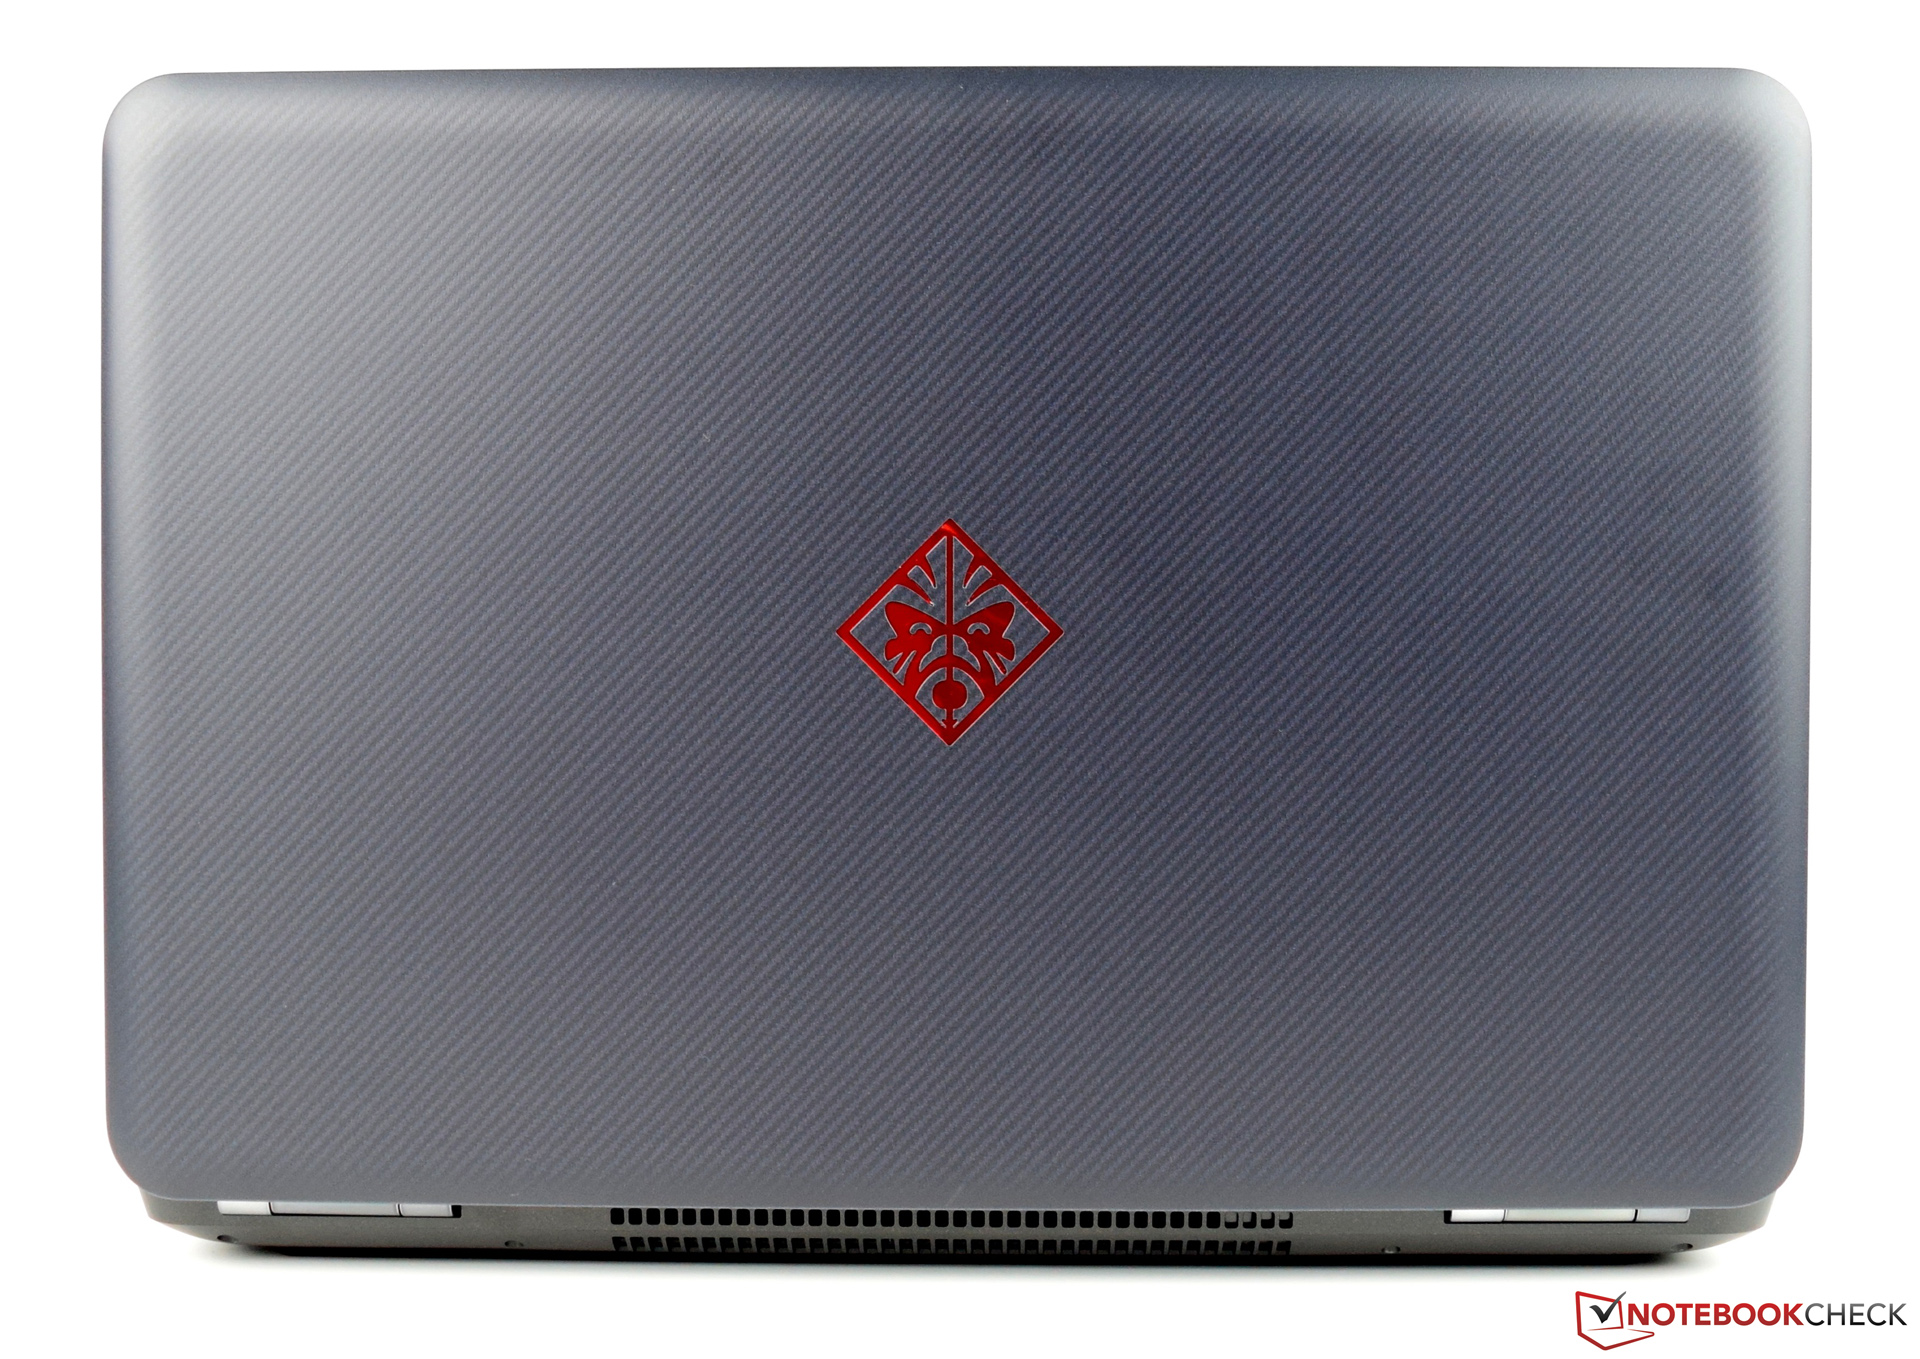
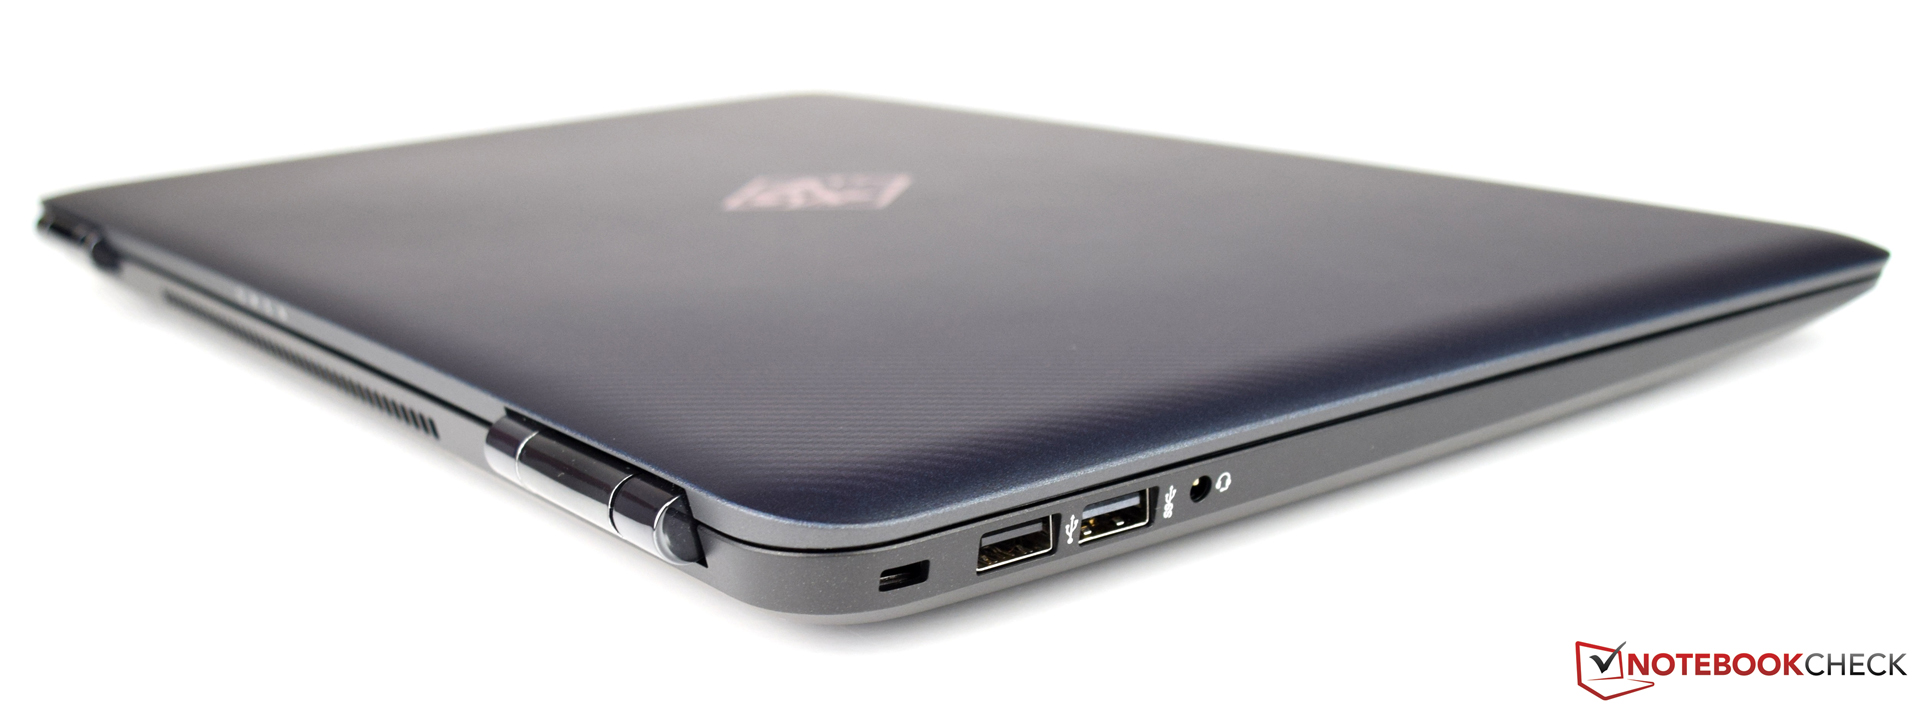
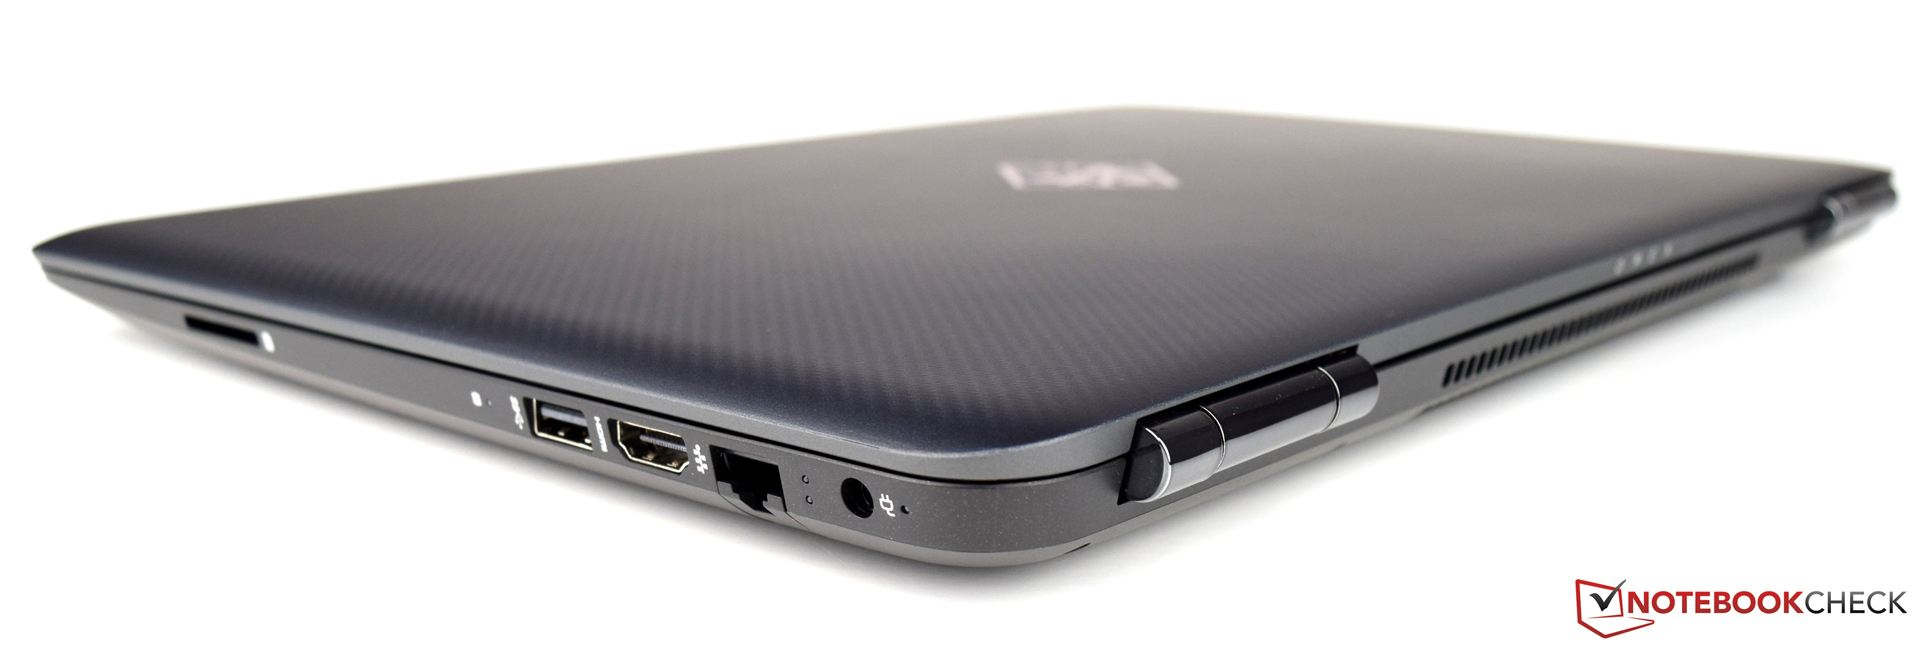
惠普 Omen 15t(2017)将不会太好受,特别是当竞争对手一直在为新的Pascal架构提供各种设备时。该15英寸的设备有很好的设计,虽说作为一个1500美元的设备,它的做工可以更好。我们也不明白为什么它会缺少最新的端口,如DisplayPort或USB 3.1 Gen2。它的连接性不适用于未来。
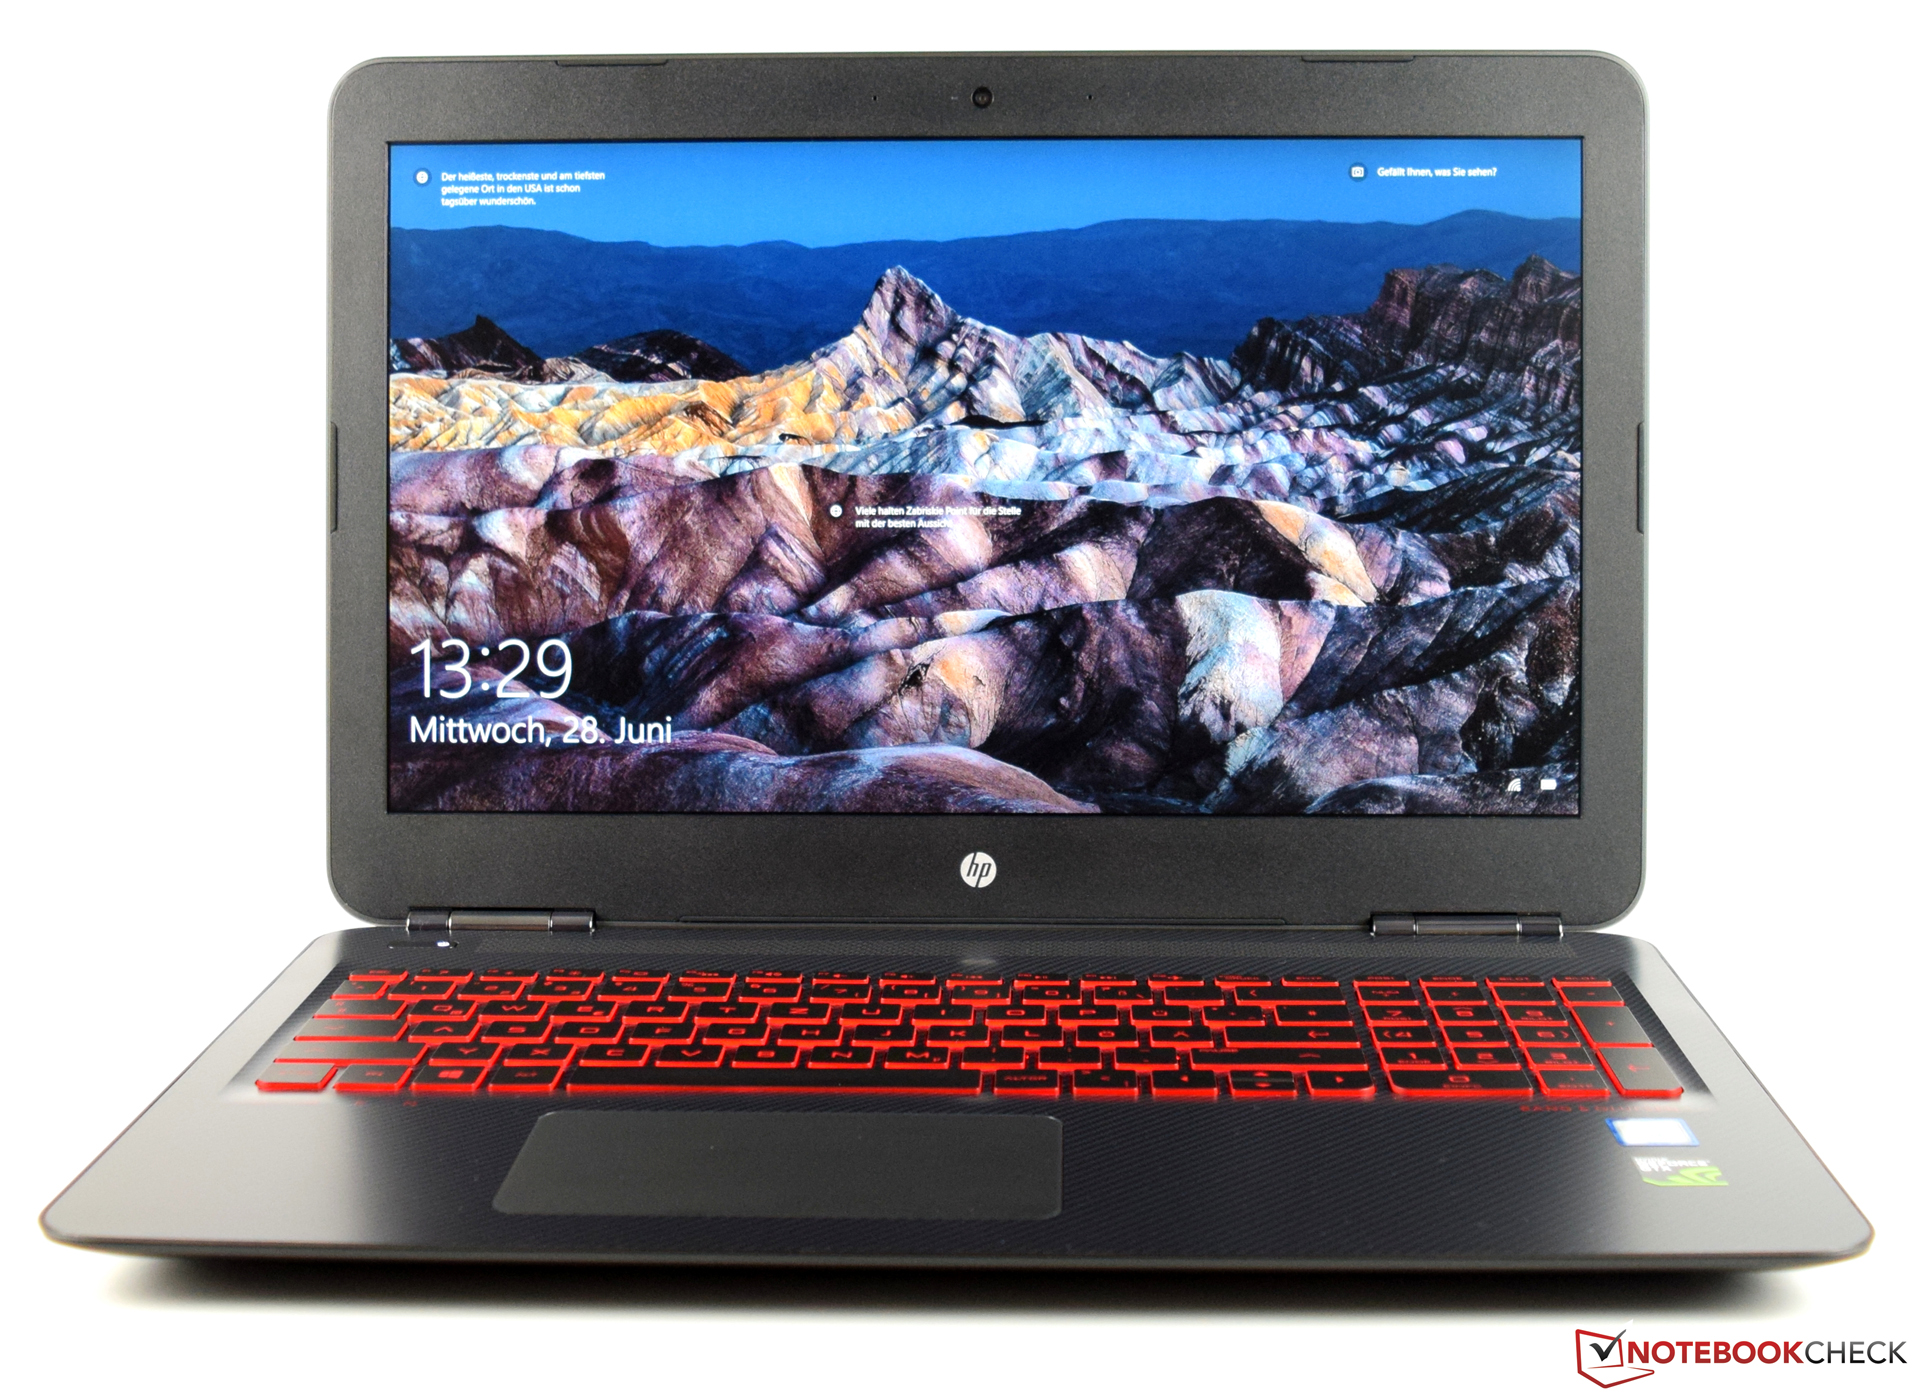
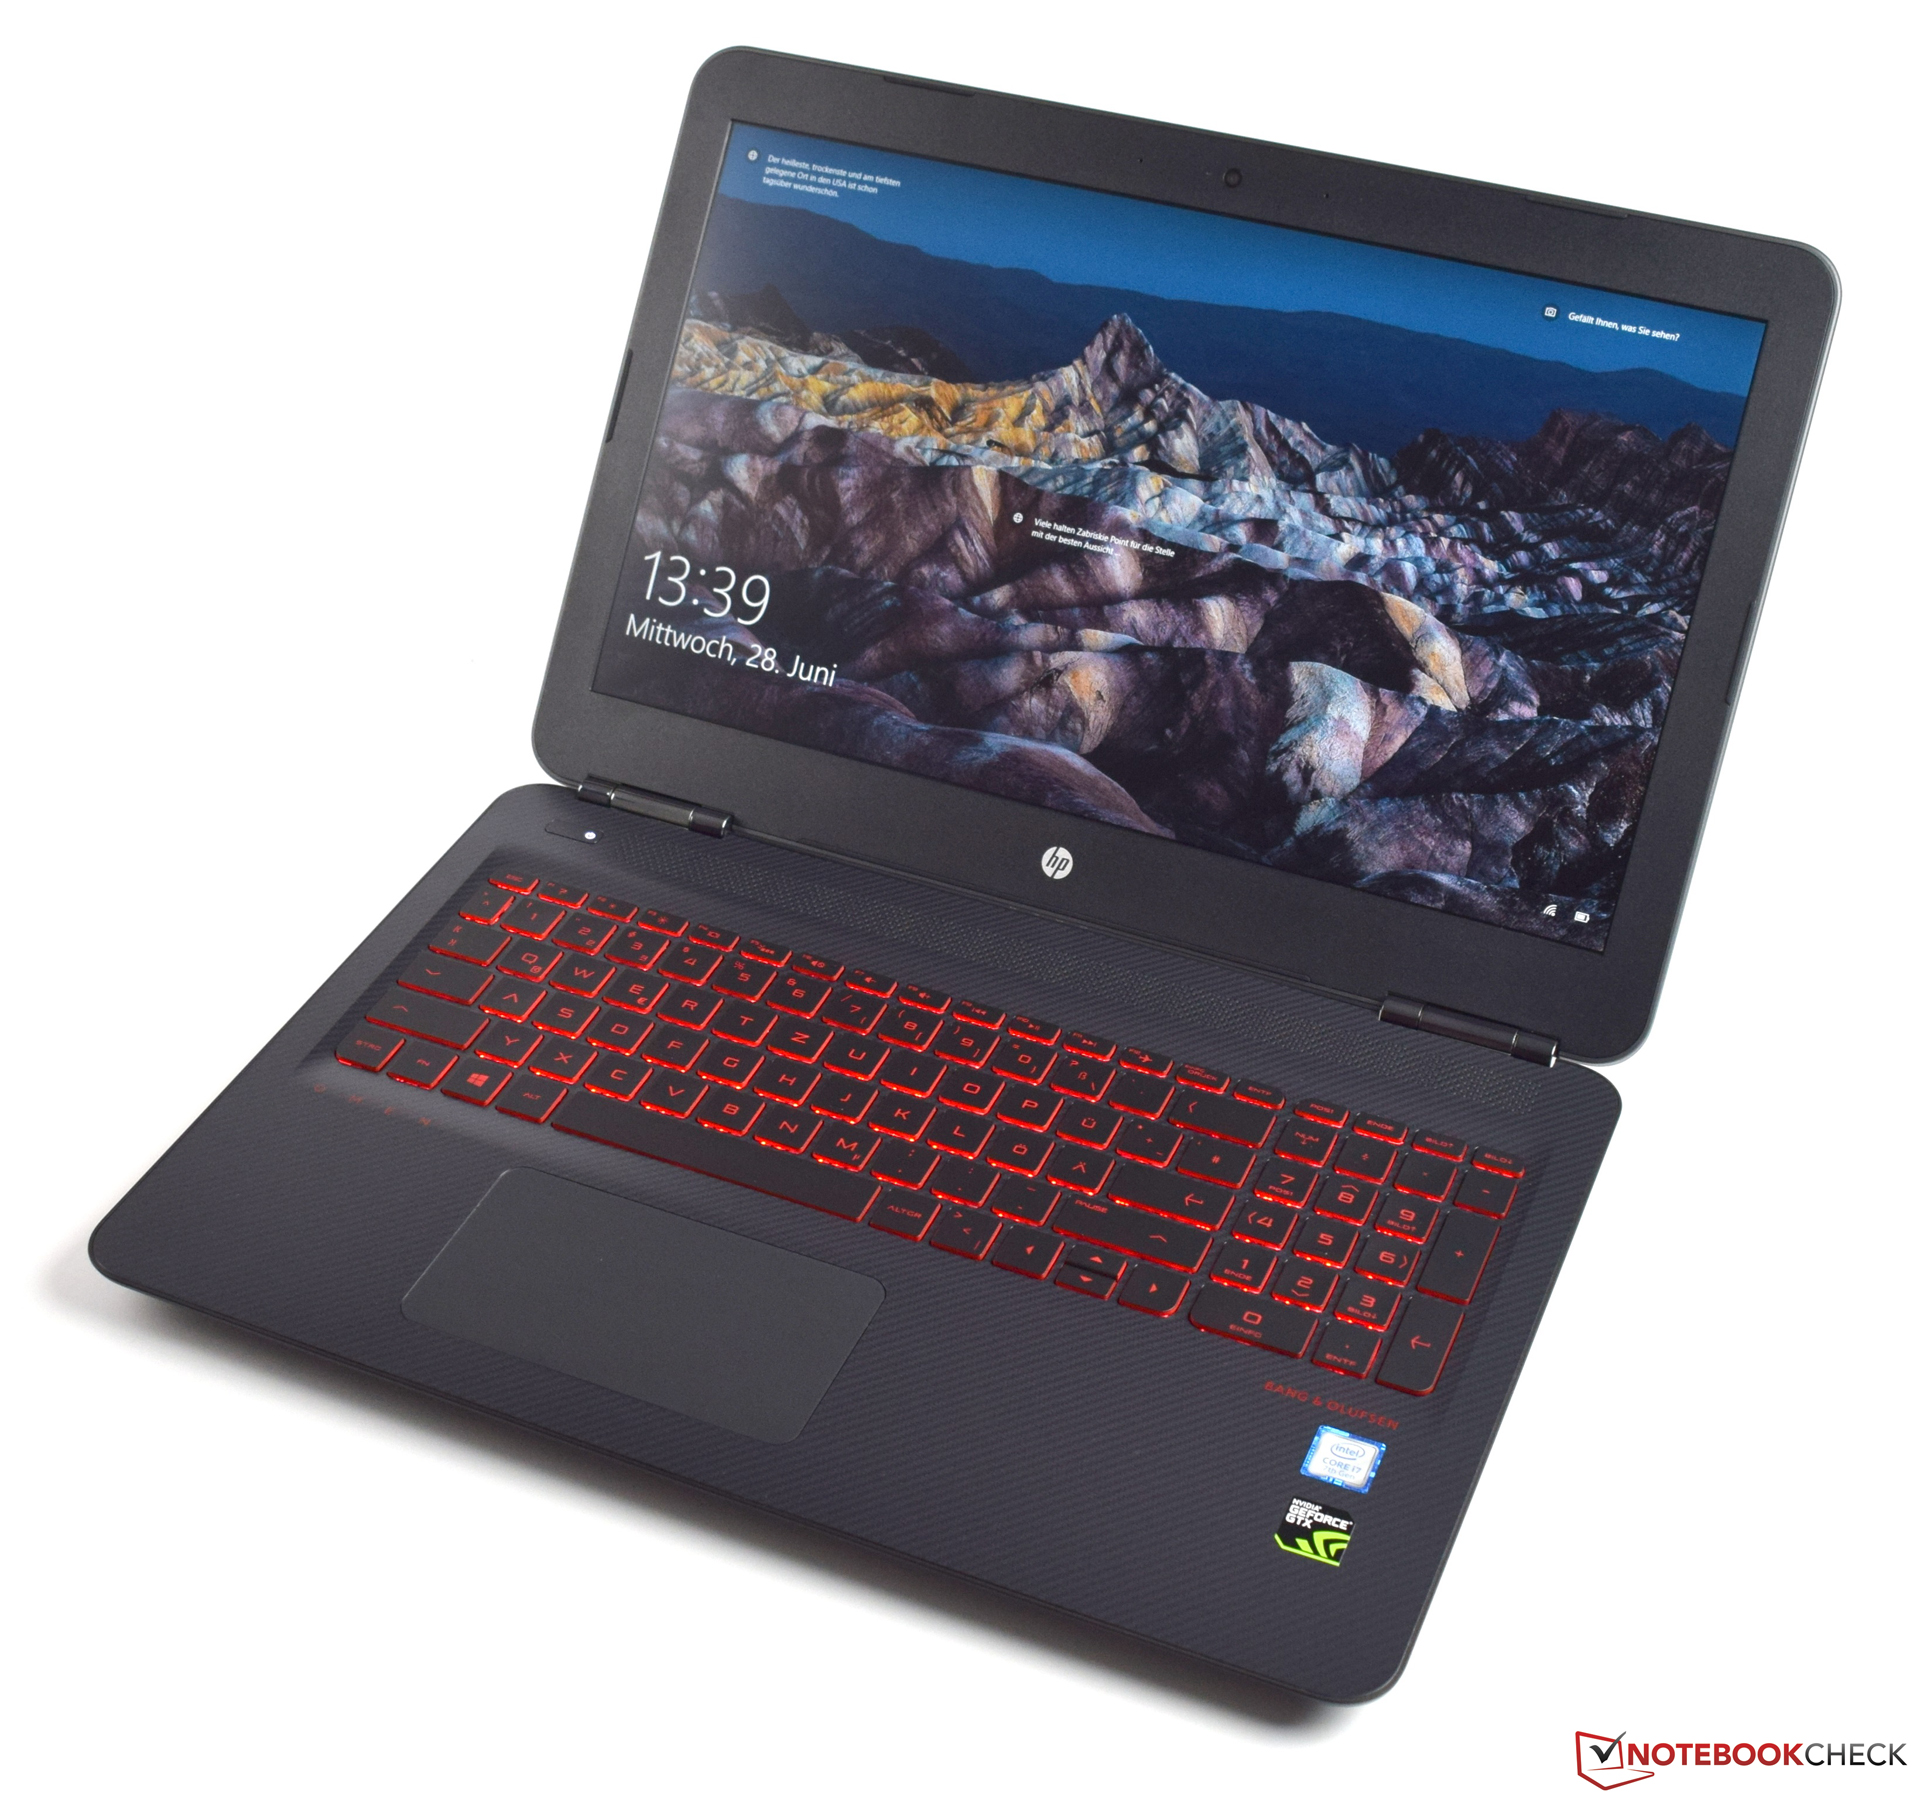
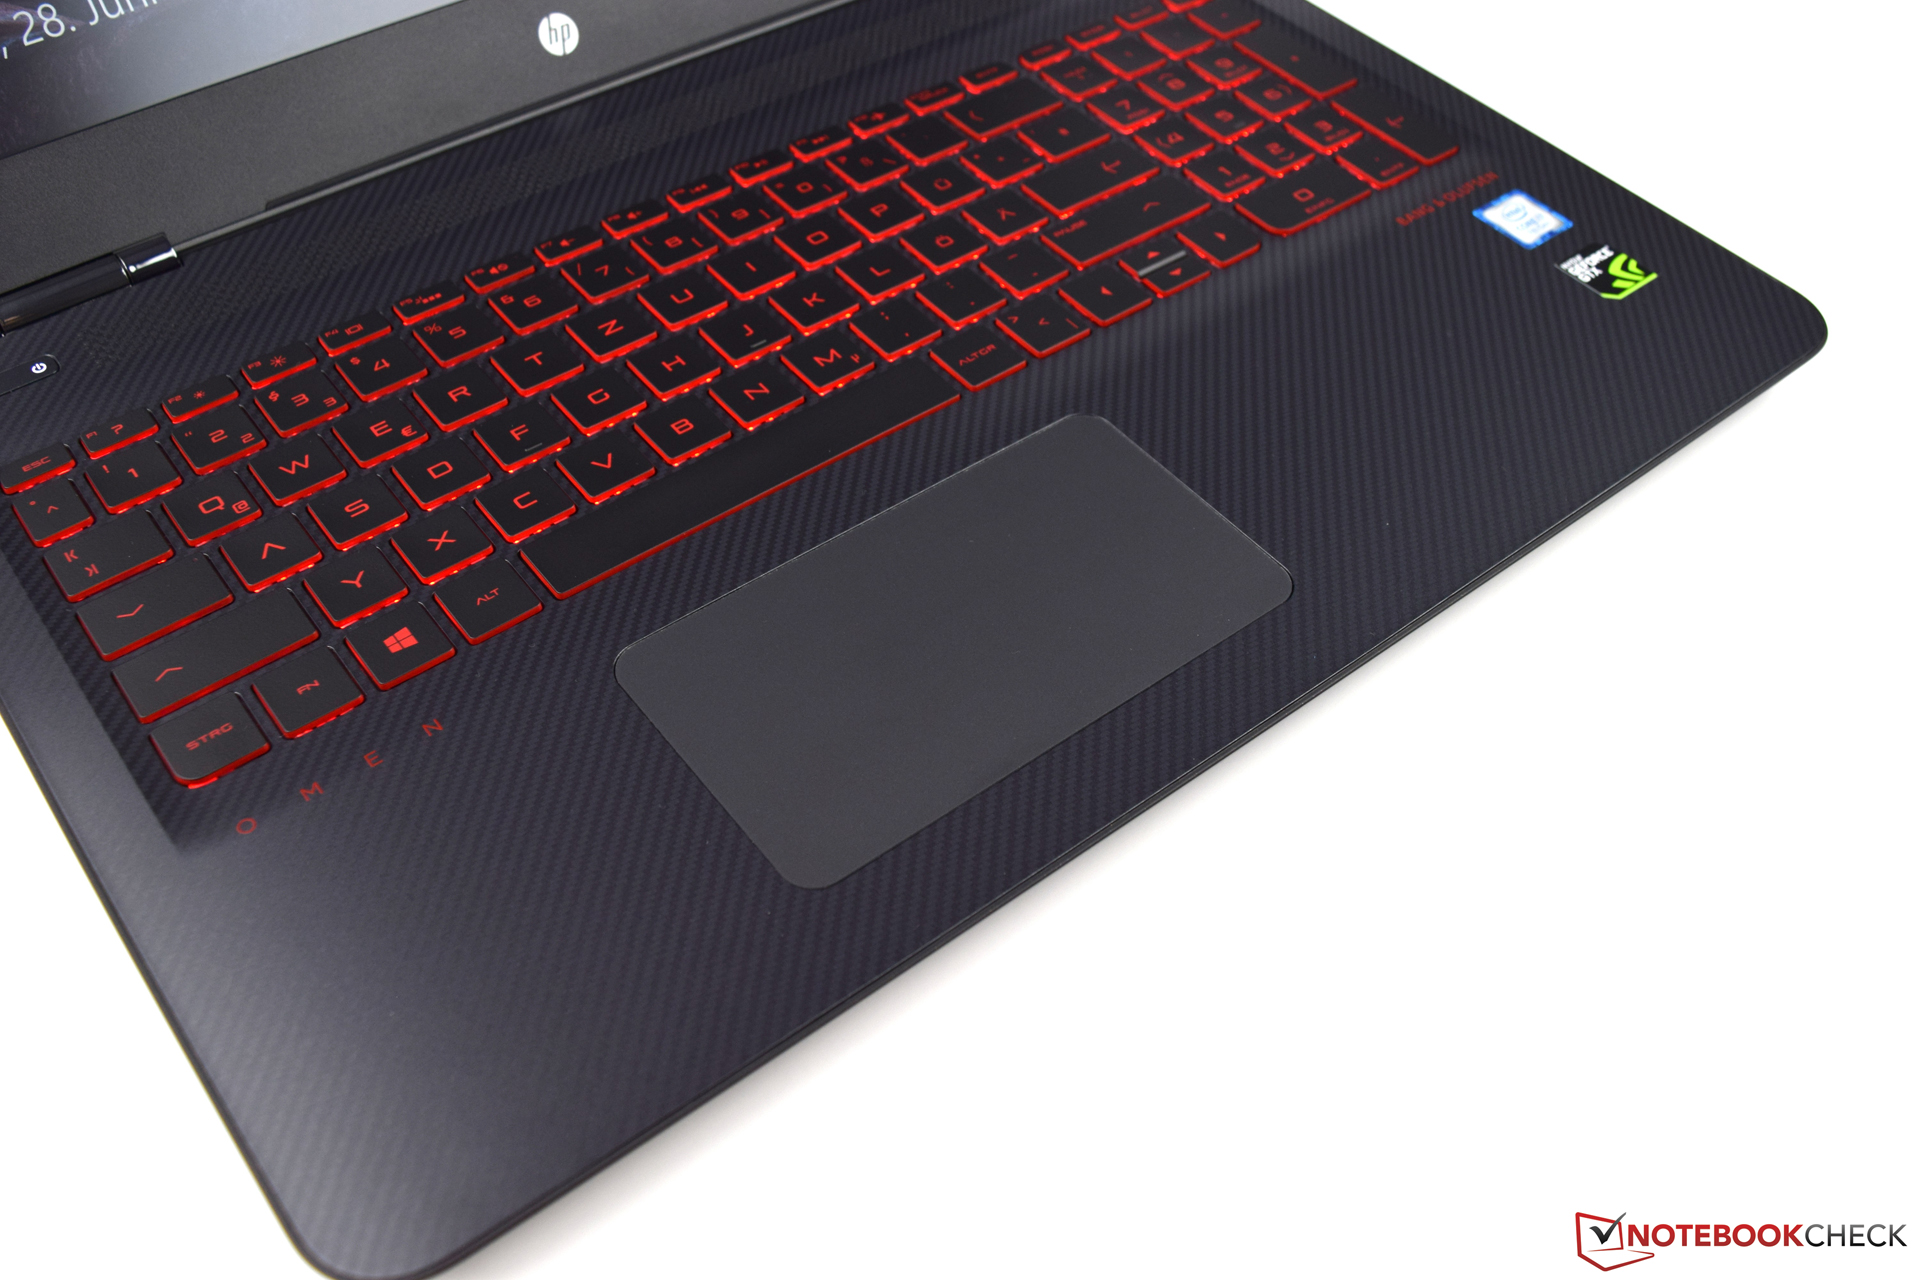
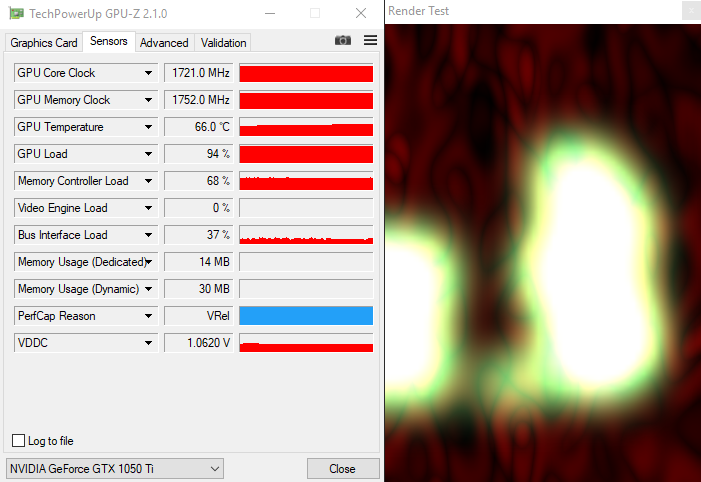
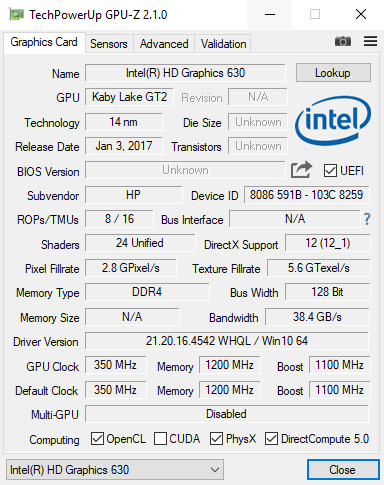
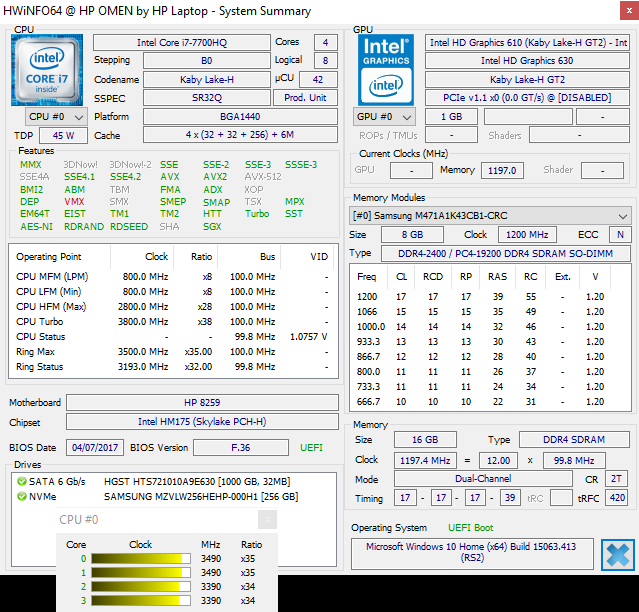
惠普 Omen 15t(2017)表现出了坚实性能。这一点,在我们的评级中发挥了重要作用。该设备配备了Nvidia GeForce GTX 1050 Ti和强大的Intel Core i7-7700HQ。这种由16 GB 运行内存支持的配件组合,可让您以高清晰度顺利播放时下的游戏。
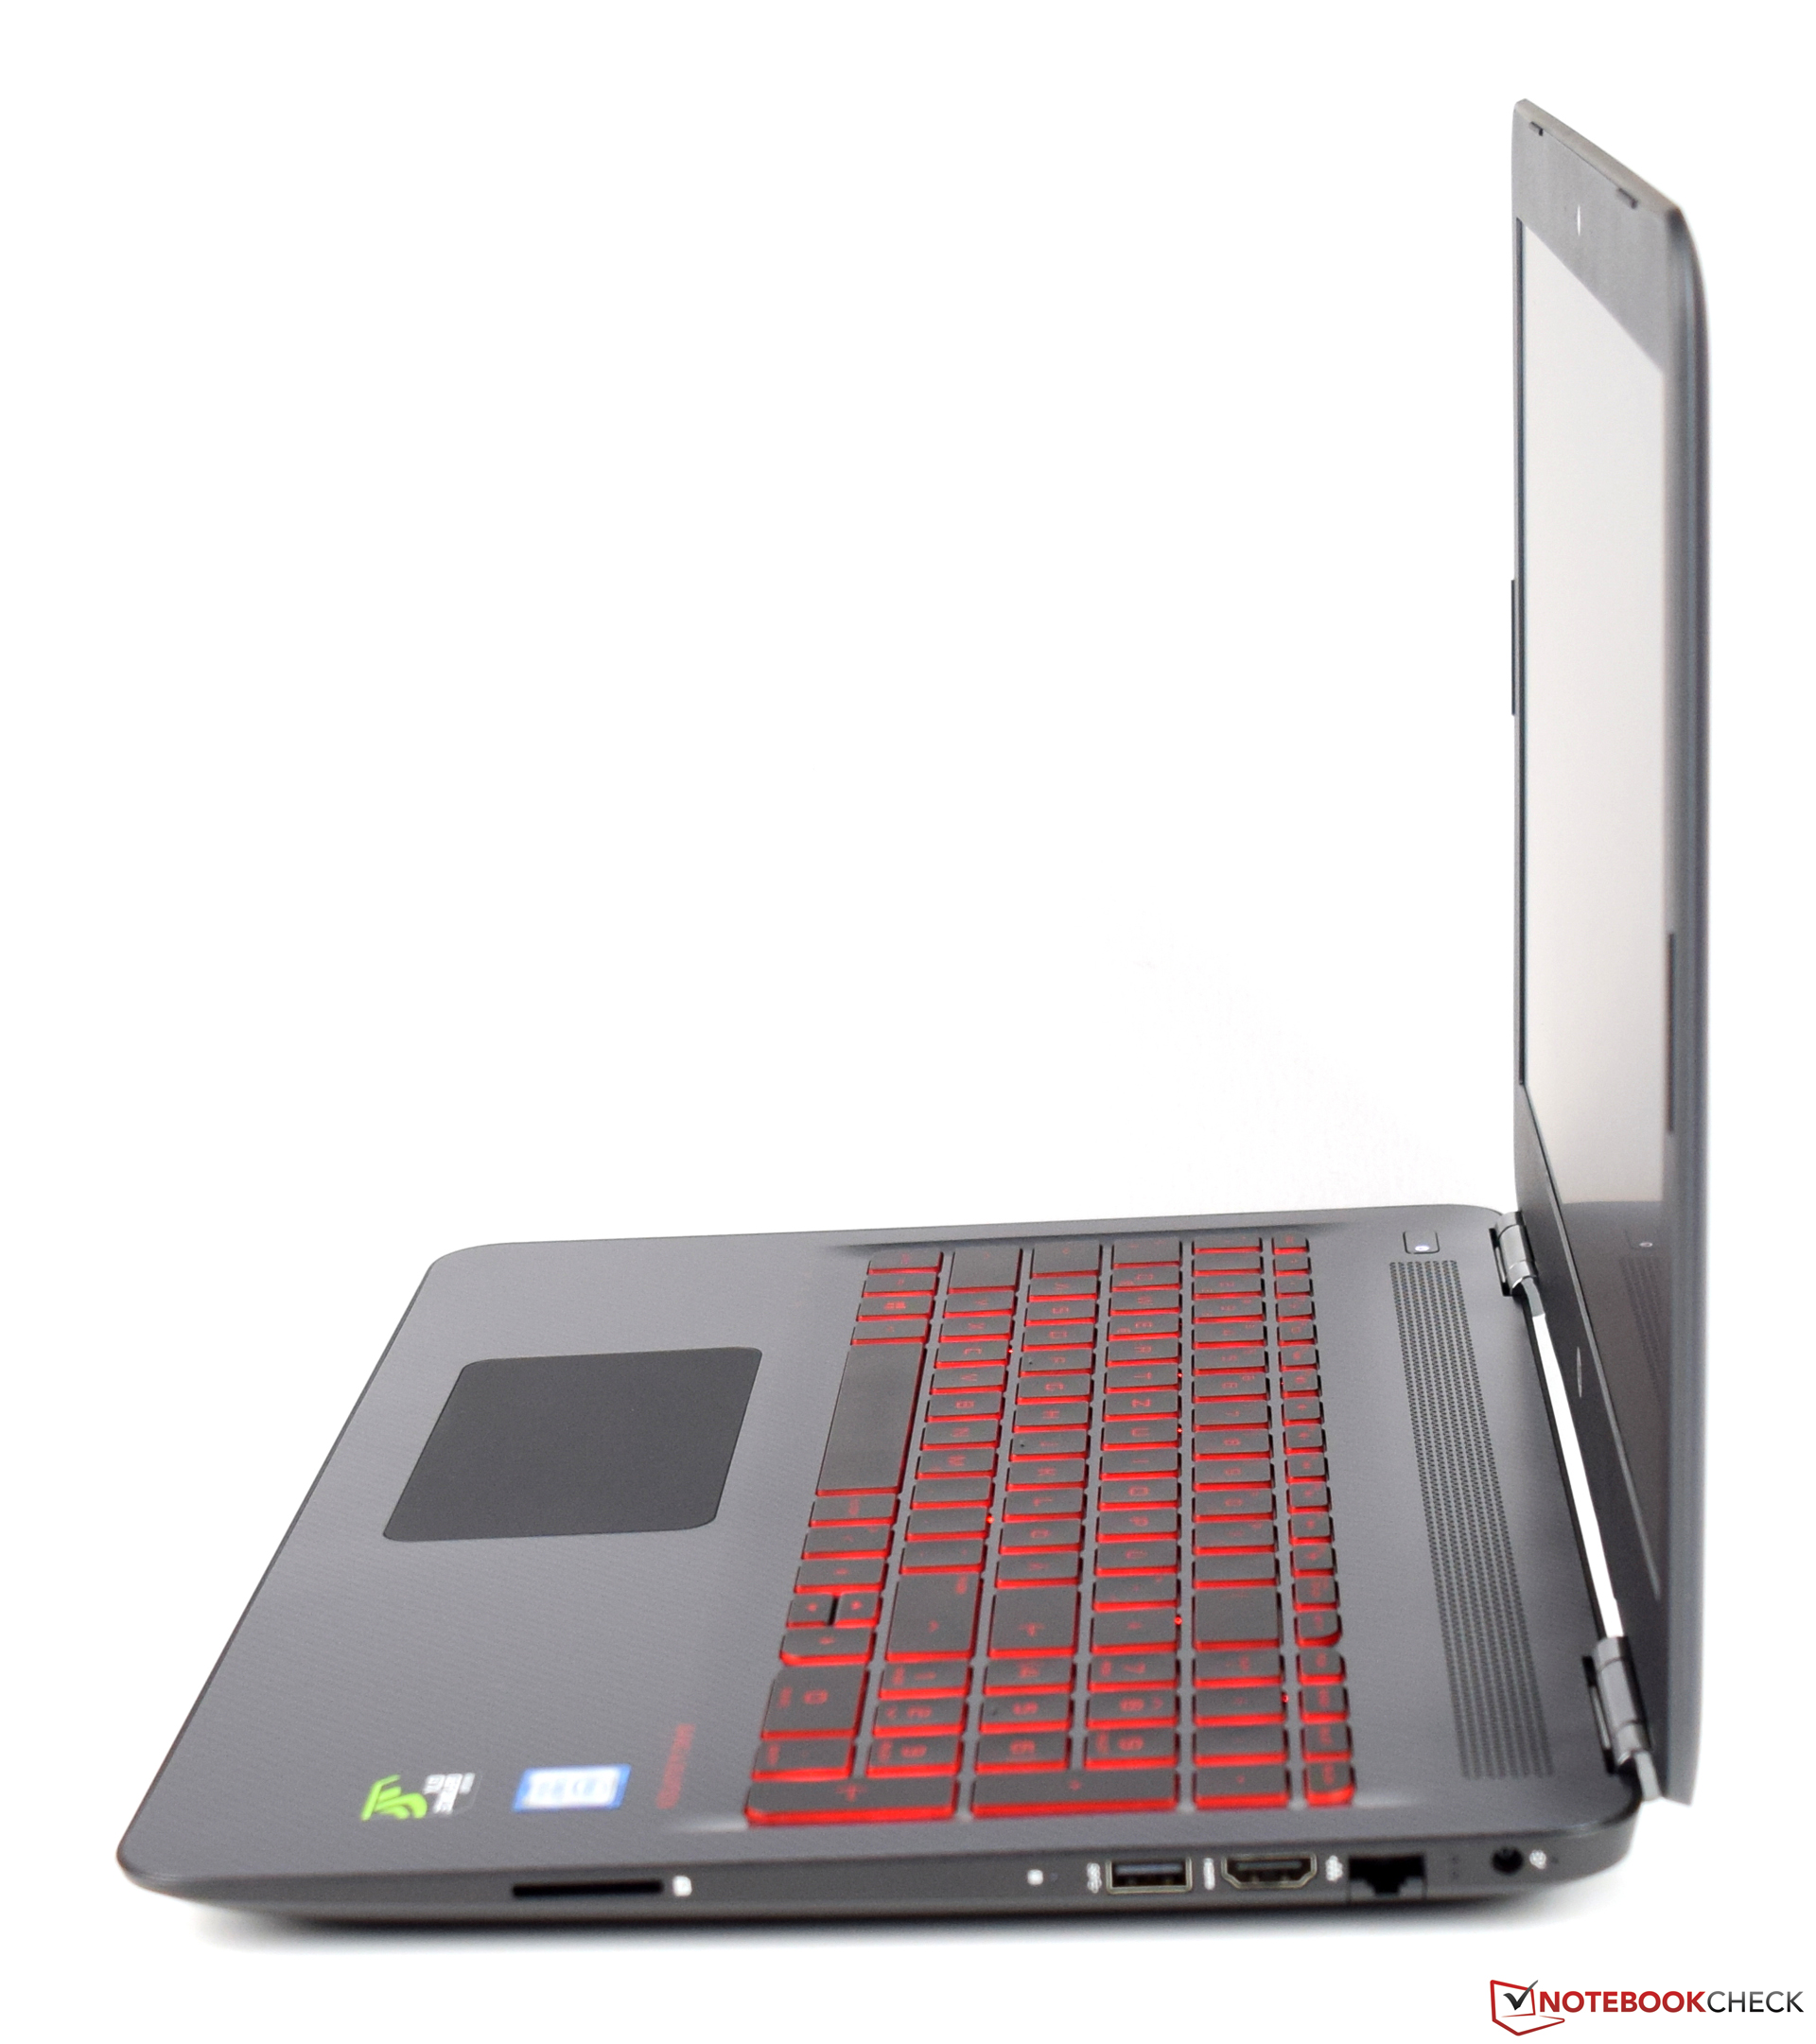
如果您一直在期待着惠普 Omen 15t(2017),那么现在您将获得可靠的游戏表现。然而,制造商决定不更新其端口并坚持原貌。
此外,惠普也因为其屏幕不够亮而失分。色彩空间覆盖率同样令人失望。尽管如此,我们喜欢Omen HP15的系统性能,NVMe SSD也进一步增强了它。
HP Omen 15-ax213ng
- 07/03/2017 v6 (old)
Sebastian Bade