判决
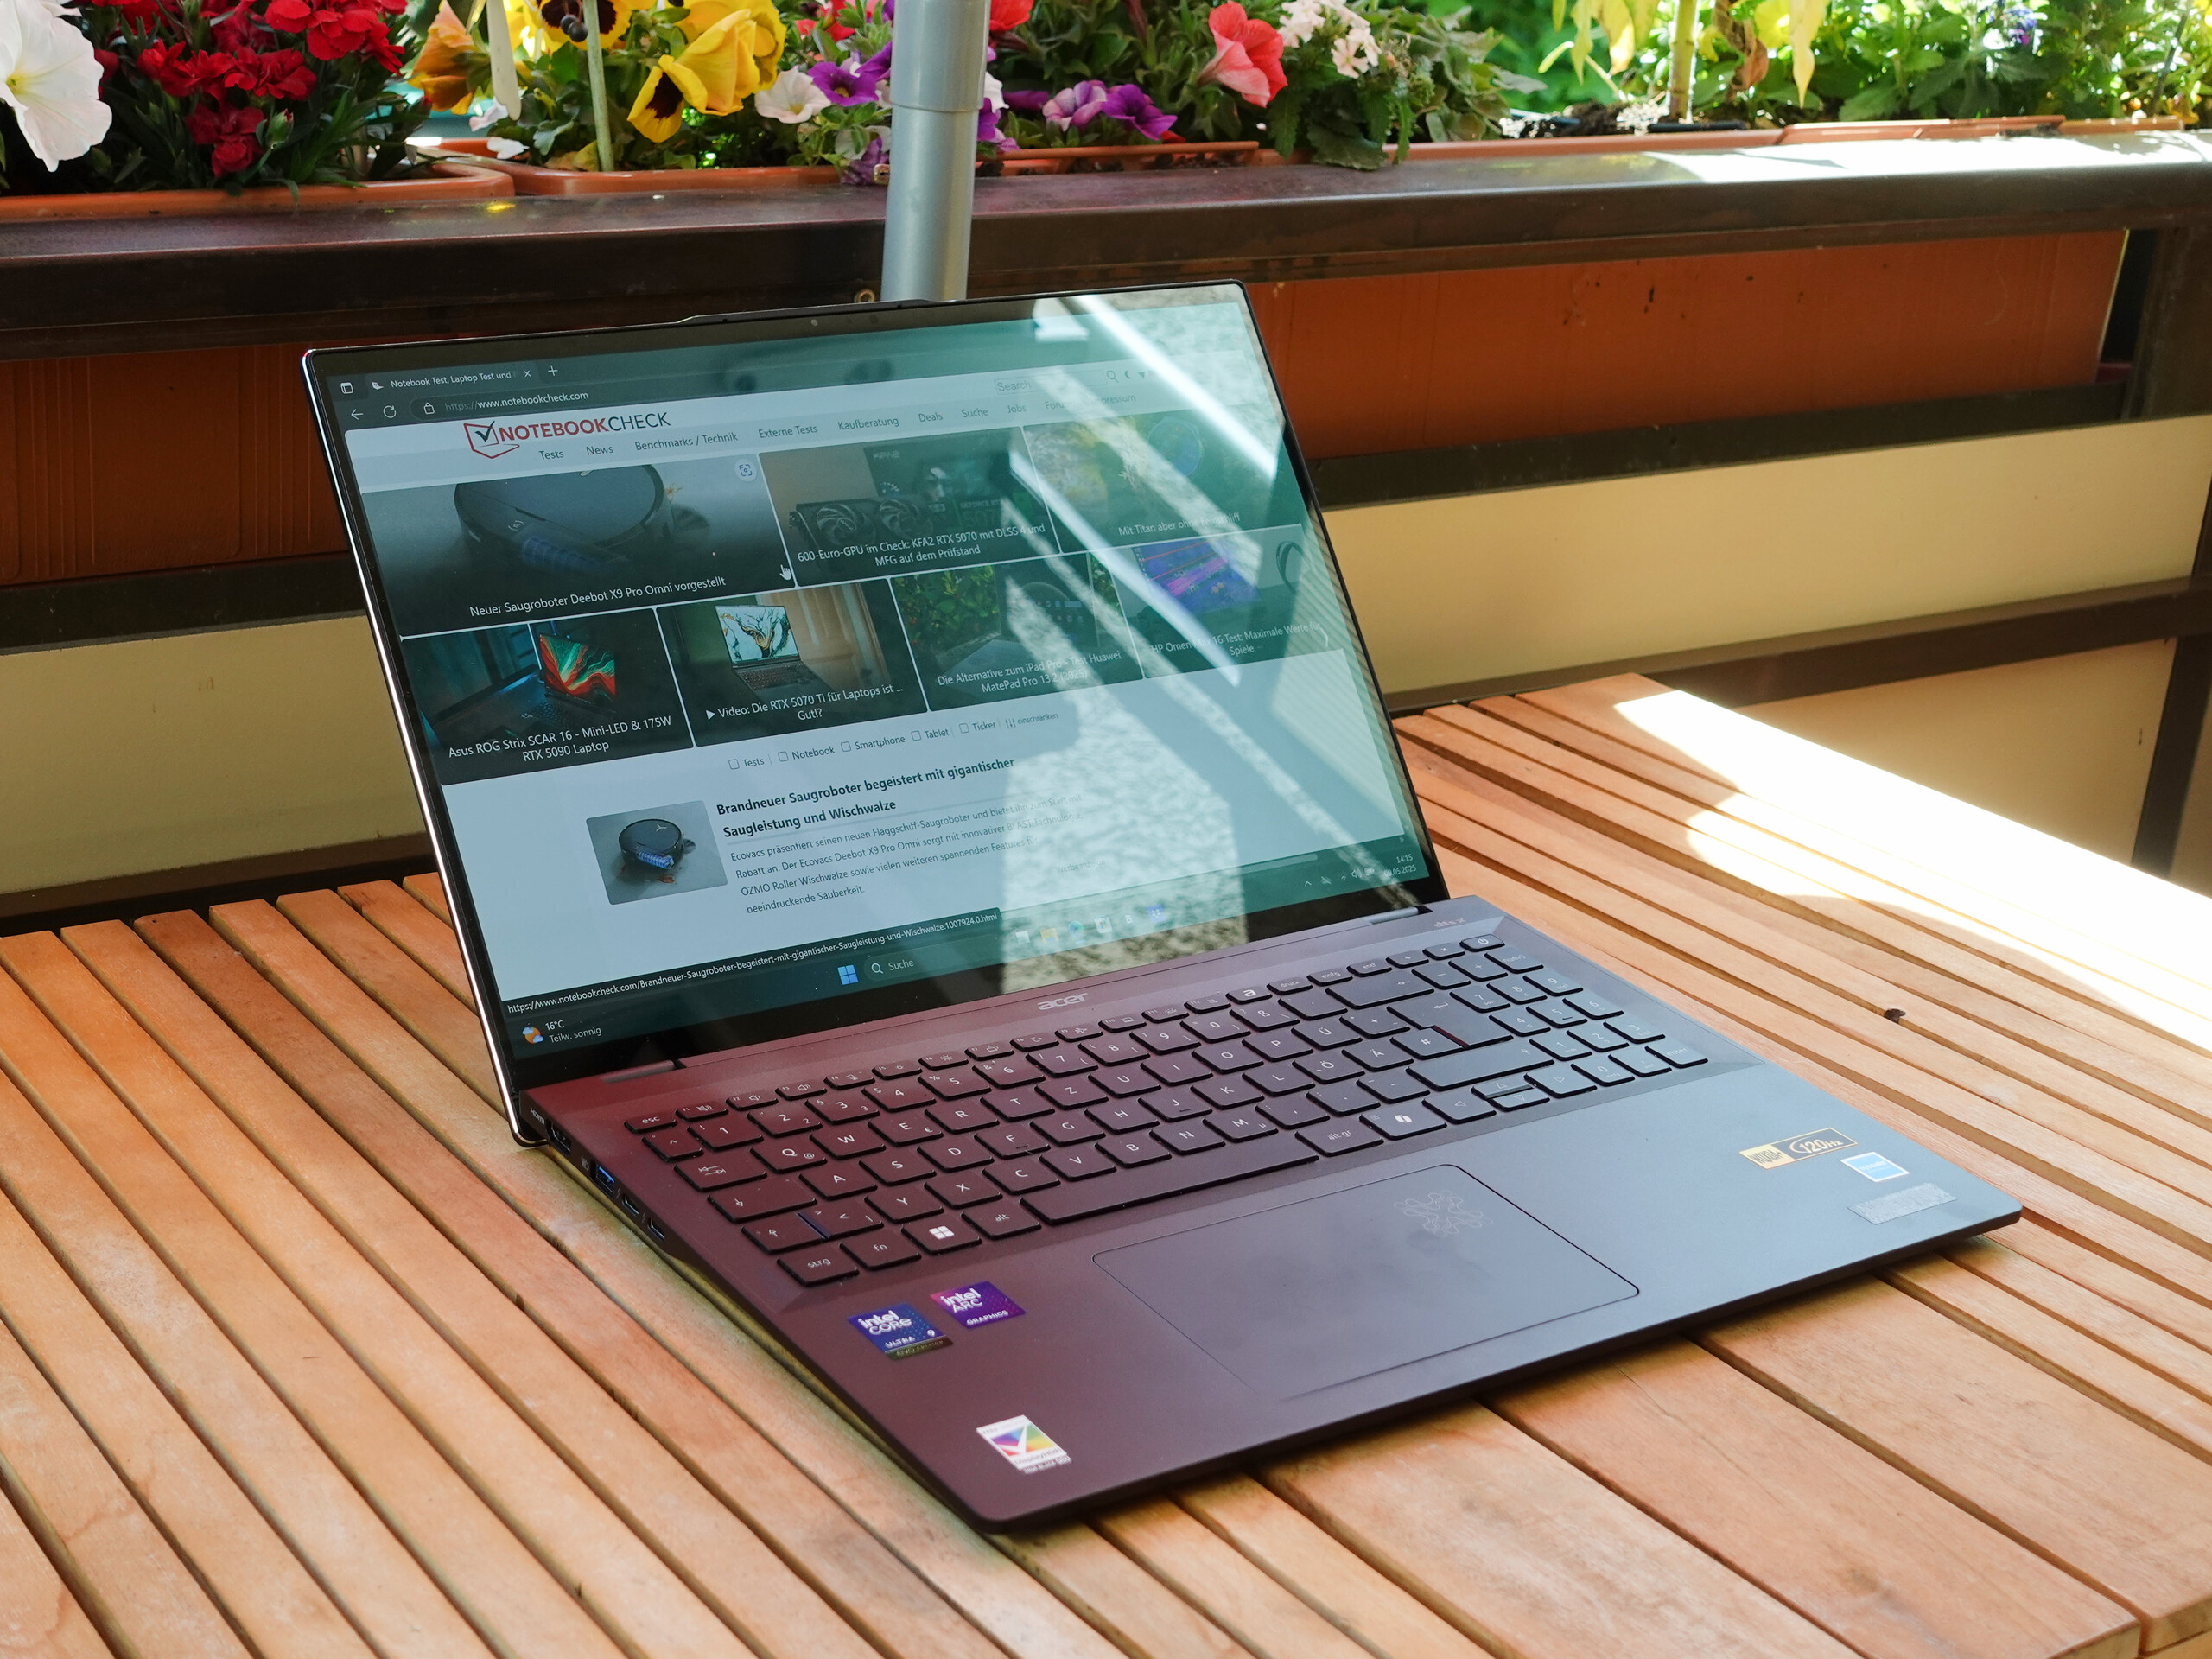
宏碁 Swift 16 AI(SF16-51T-932H)是一款时尚而功能强大的笔记本电脑,其出色的 OLED 显示屏和英特尔酷睿 Ultra 9 288V 处理器的快速性能使其表现尤为突出。它是完成日常任务、创意工作,甚至是一些游戏回合的理想装备。高品质的铝合金和玻璃外壳、良好的电池续航能力以及 Wi-Fi 7 和 Thunderbolt 等面向未来的功能,使其整体表现更加出色。
由于端口分布有些不均衡,扬声器也只能算一般,因此只能略作扣分。尽管在纯多核性能方面,Swift 16 AI 的 CPU 还不能与 AMD 的最佳性能相提并论,而且在负载情况下风扇会发出声音,但对于重视出色显示屏和面向未来的 AI 性能的高要求用户来说,Swift 16 AI 是一款令人信服的全能型产品。
Pros
Cons
价格和供应情况
诚然,我们的测试设备并不便宜,宏碁售价 1700 欧元,但配备酷睿 Ultra 7 和 1 TB 内存的配置还不到 1500 欧元。这使它成为采用 Lunar Lake 技术的最便宜的 16 英寸笔记本电脑之一。
人工智能时代正在如火如荼地进行,移动计算也不例外。宏碁 Swift 16 AI 就是人工智能设备的代表之一:这款笔记本不仅如其名称所示,承诺为人工智能应用优化性能,而且还采用了英特尔的 Lunar Lake 处理器,特别是酷睿 Ultra 9 288V。
规格
箱子和设备
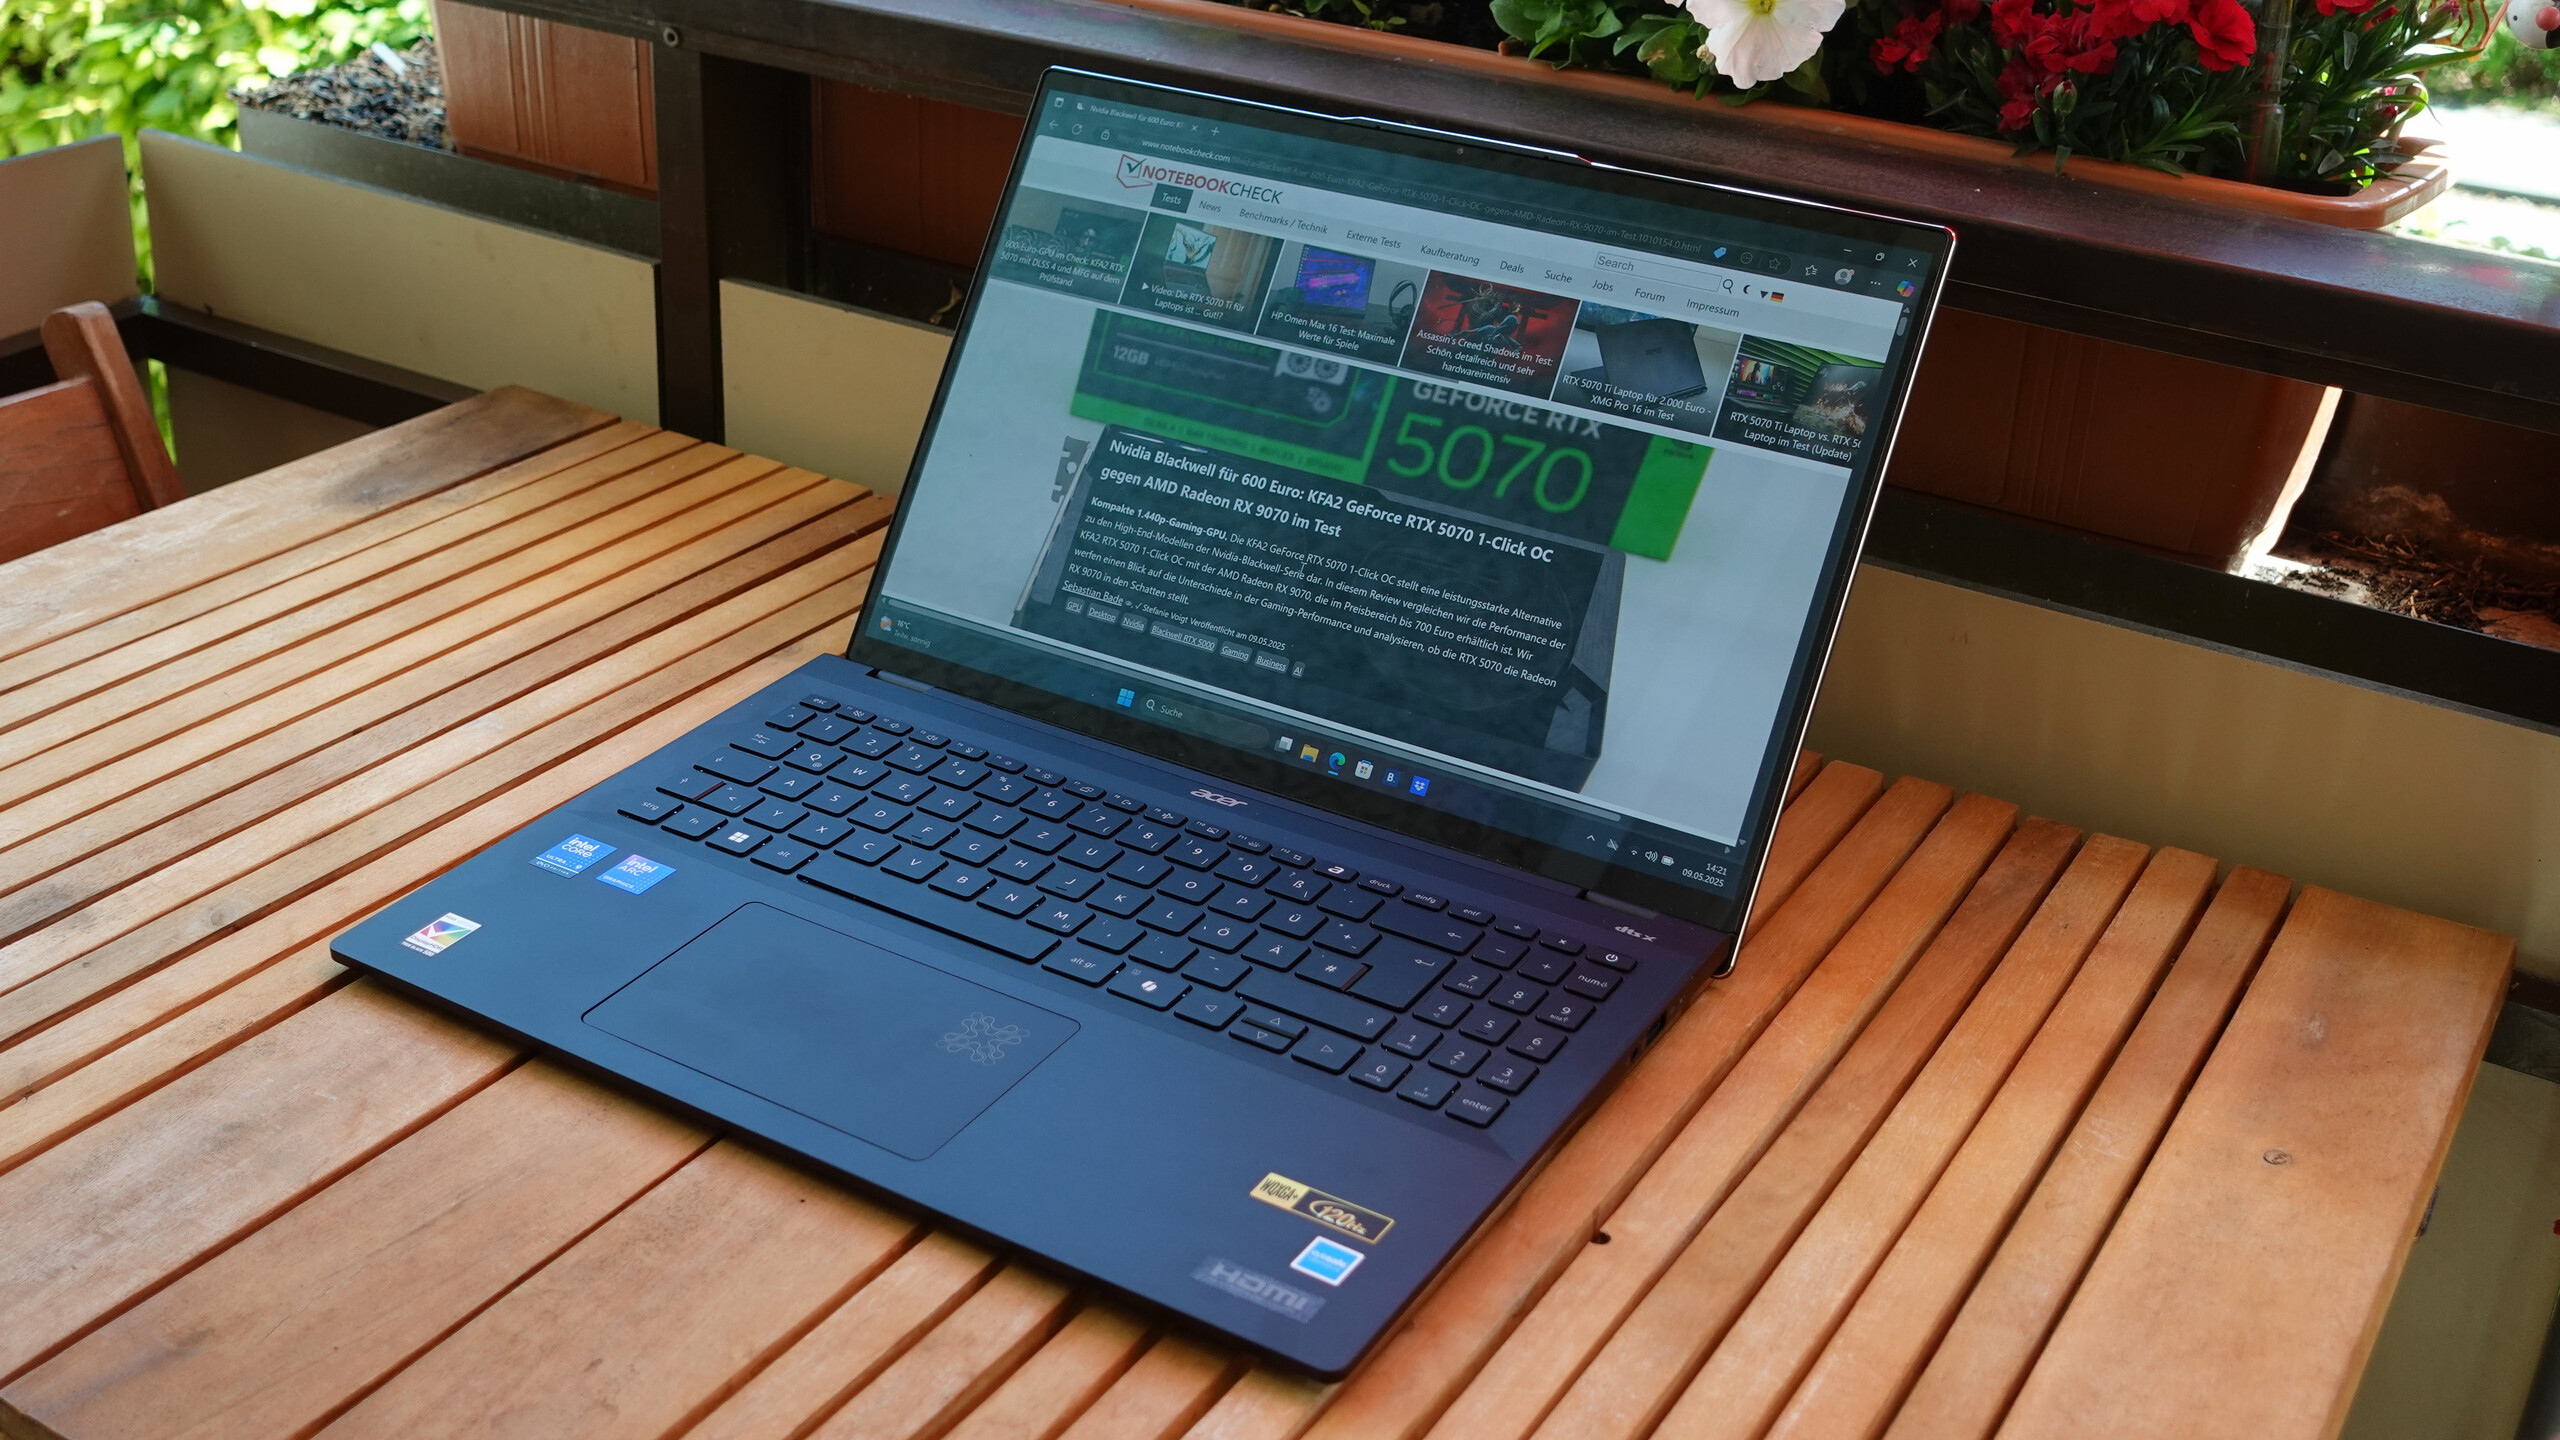
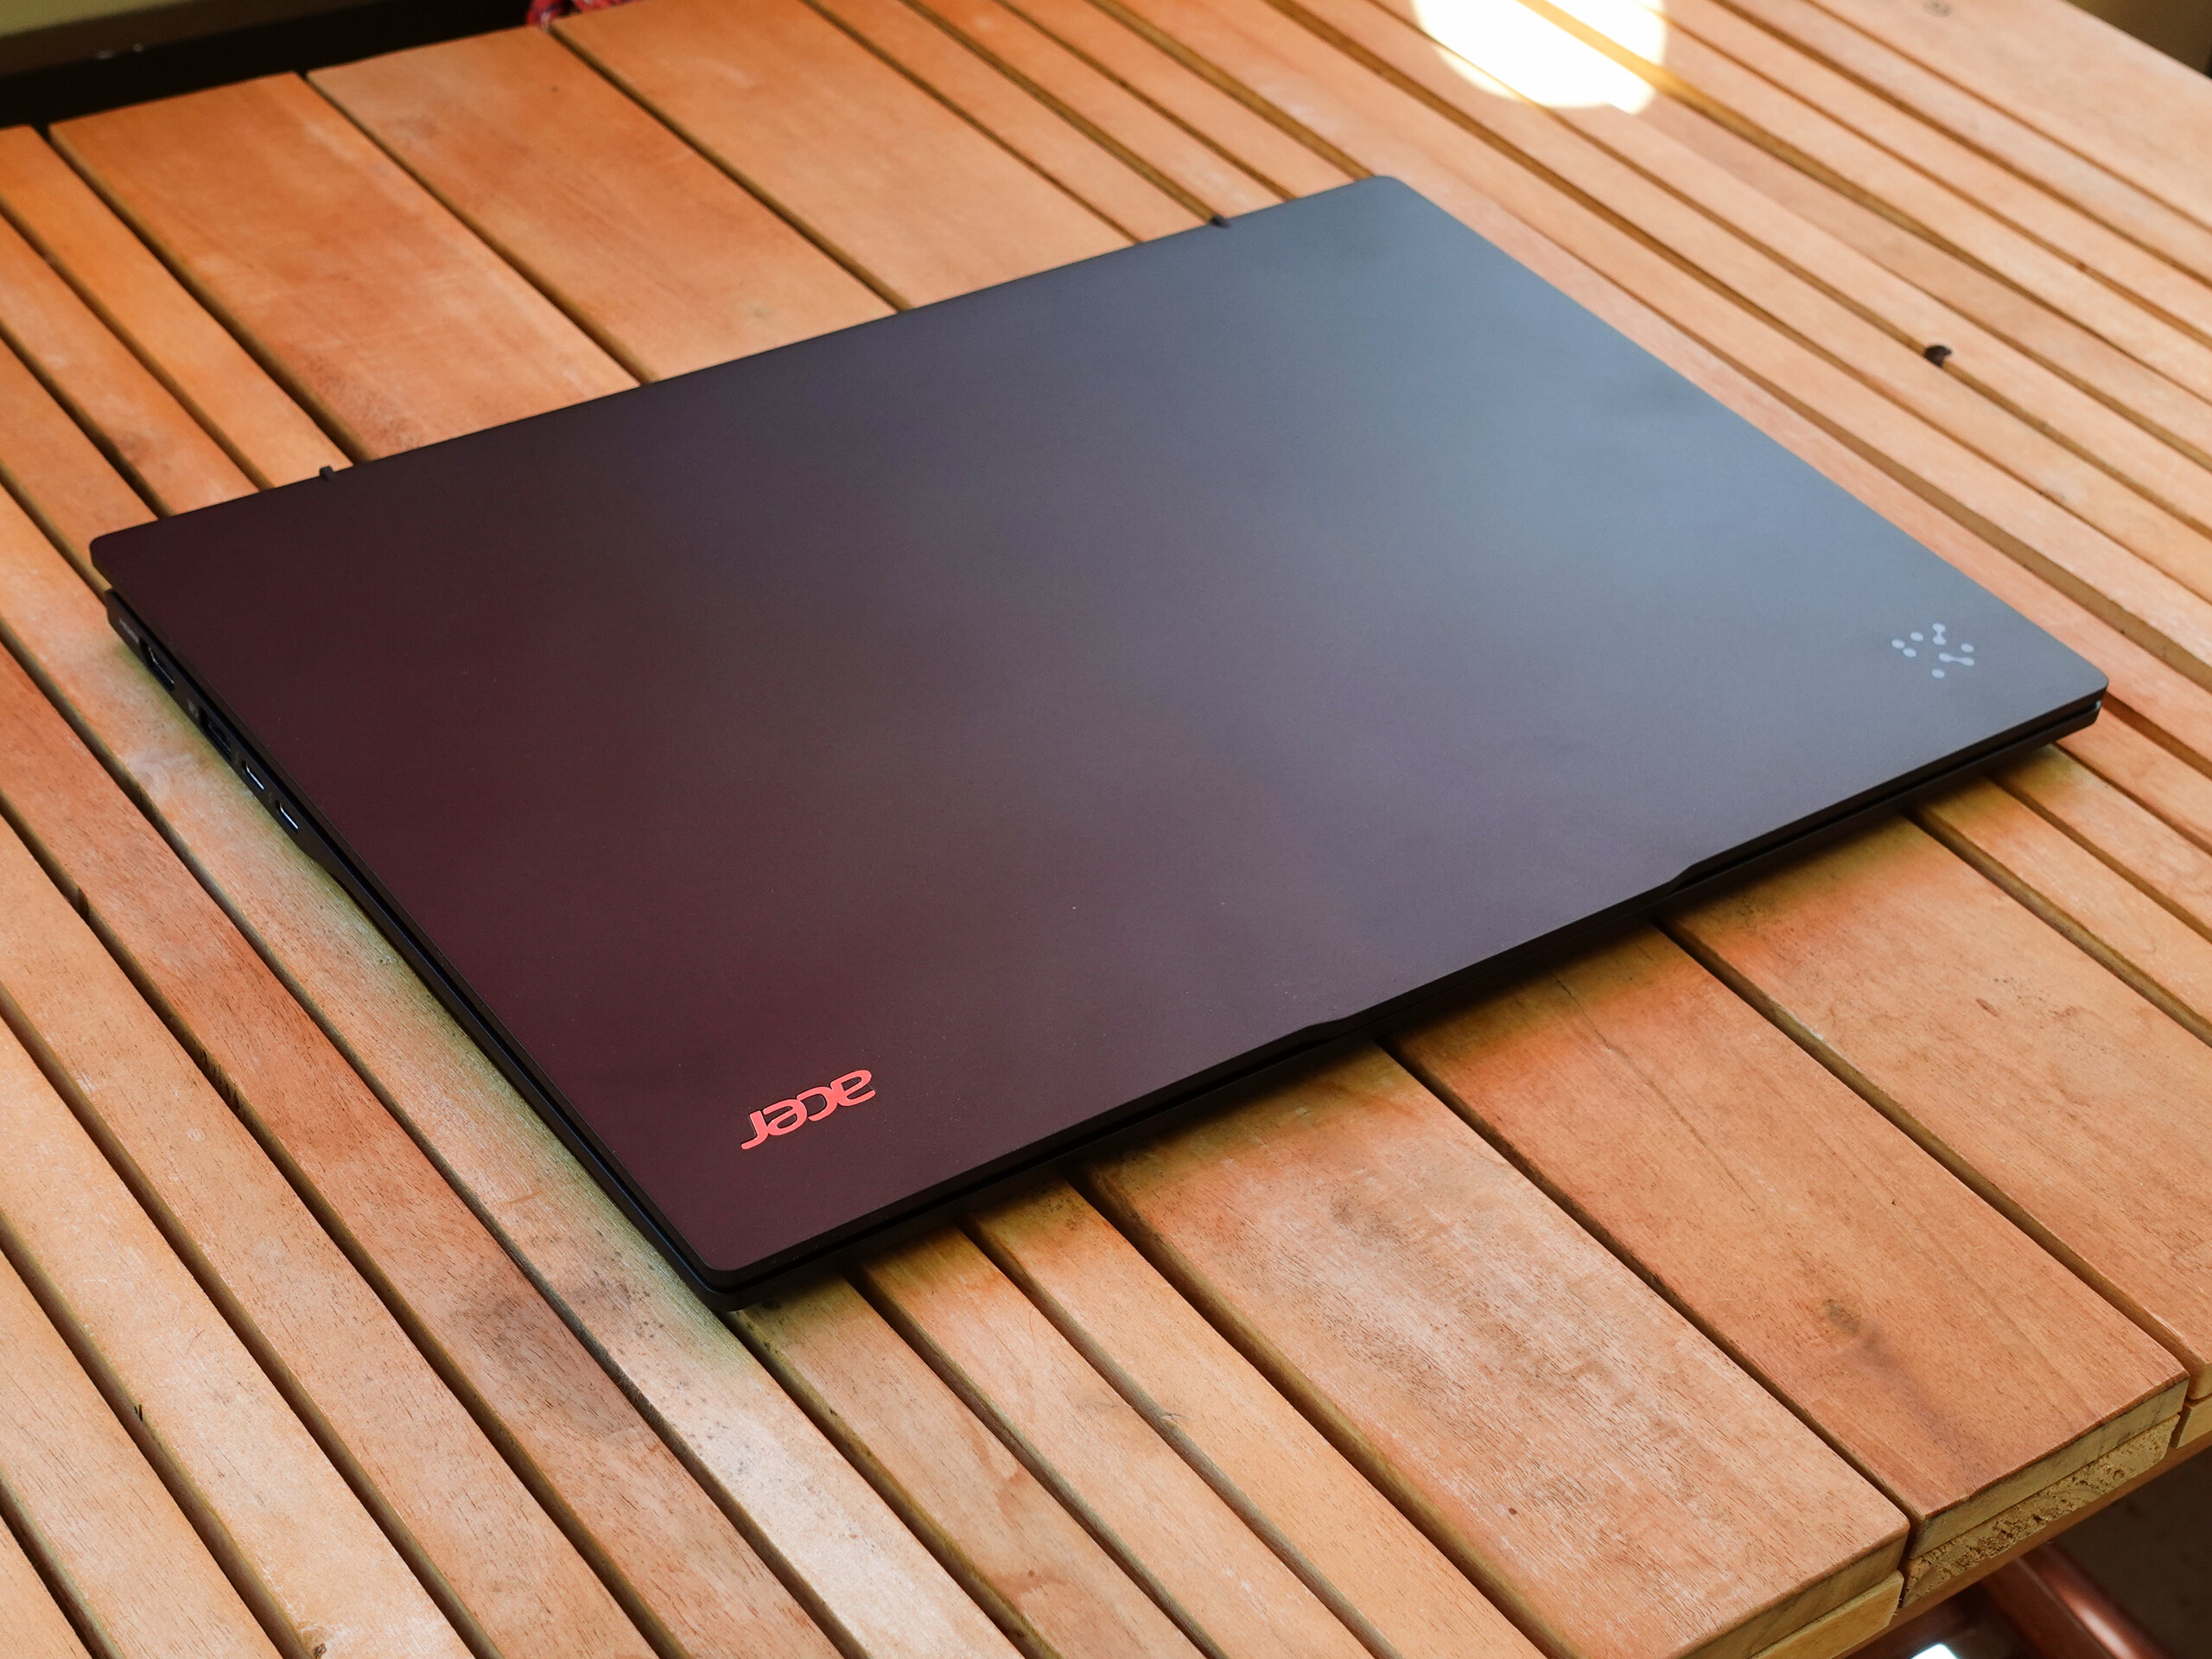
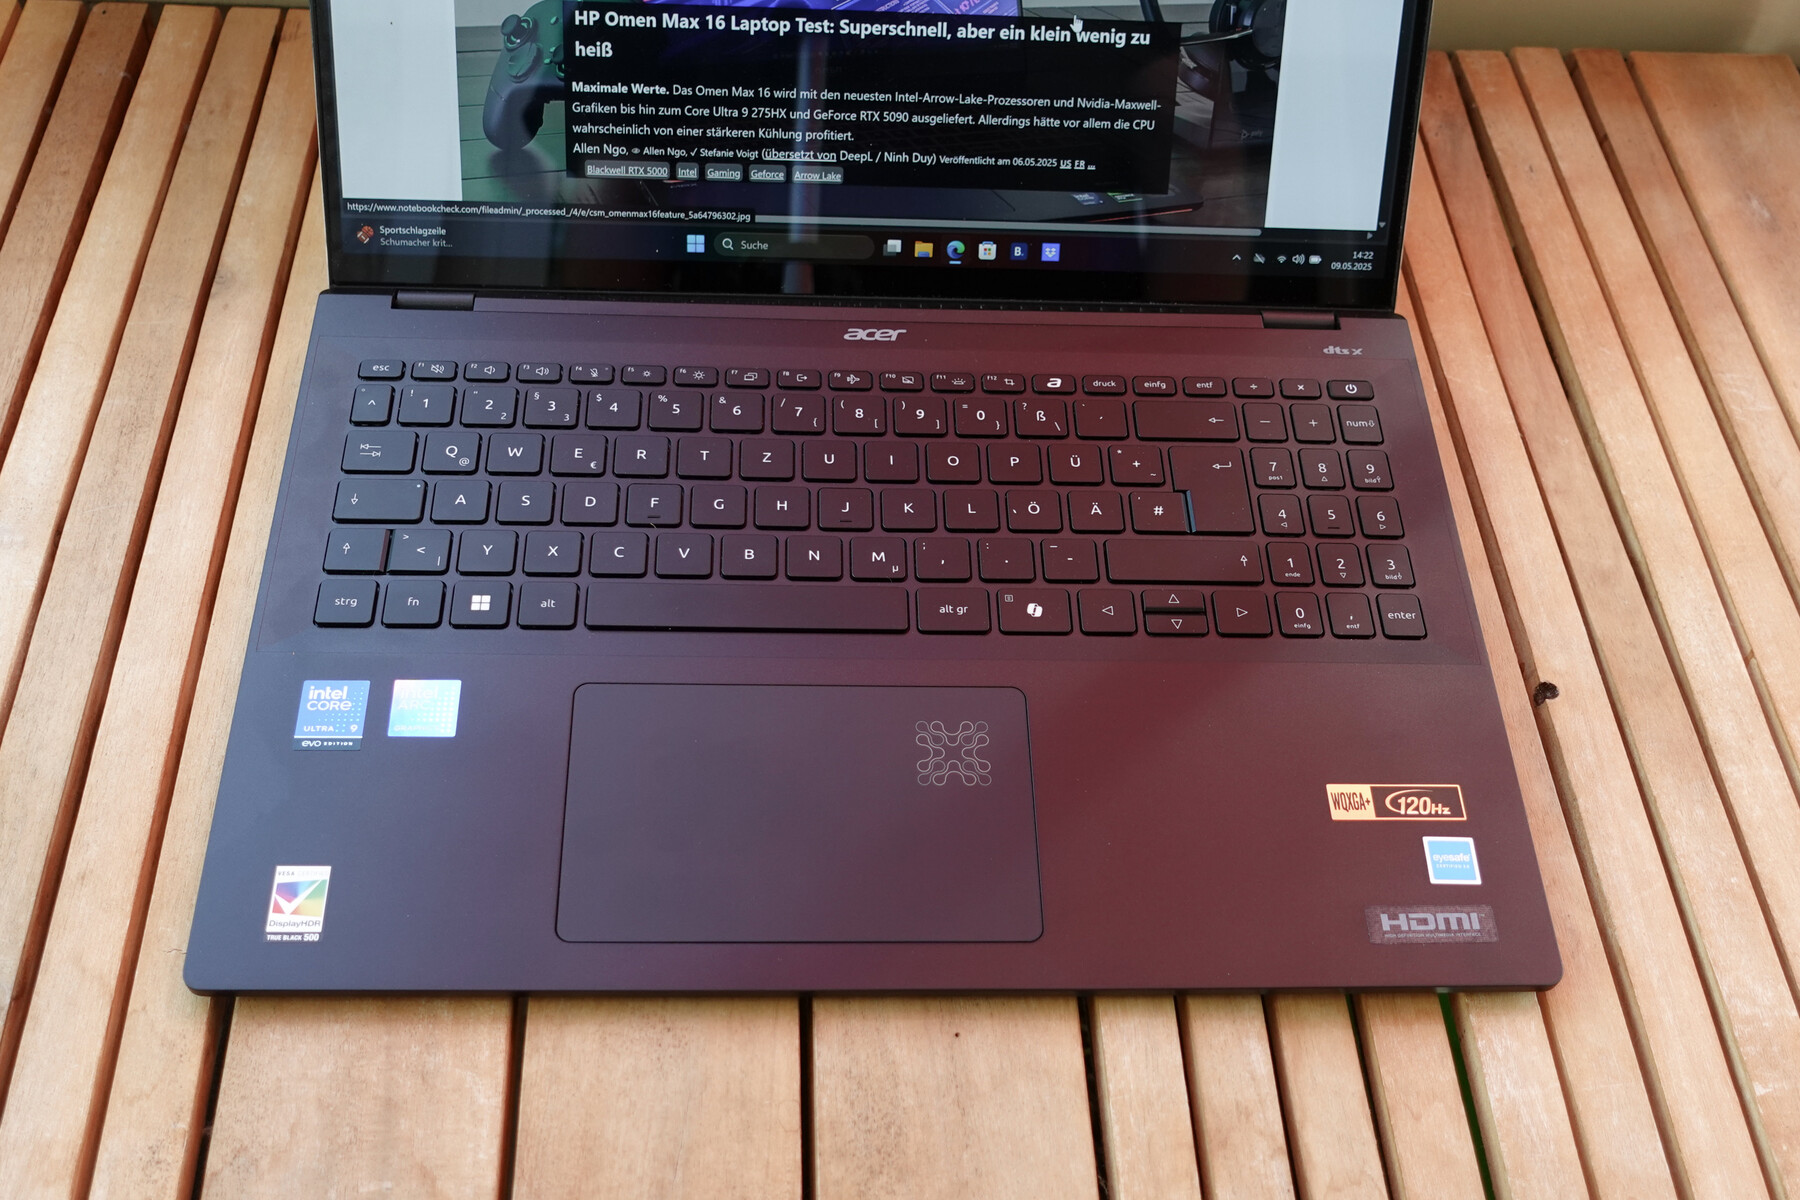
当你触摸它时,你会立即发现宏碁在这方面毫不吝啬。铝合金和玻璃外壳给人的感觉非常优质坚固--没有任何吱吱作响的声音,表面处理也很整洁。它的手感非常好,给人一种坚固而不浮夸的印象--简单而现代。
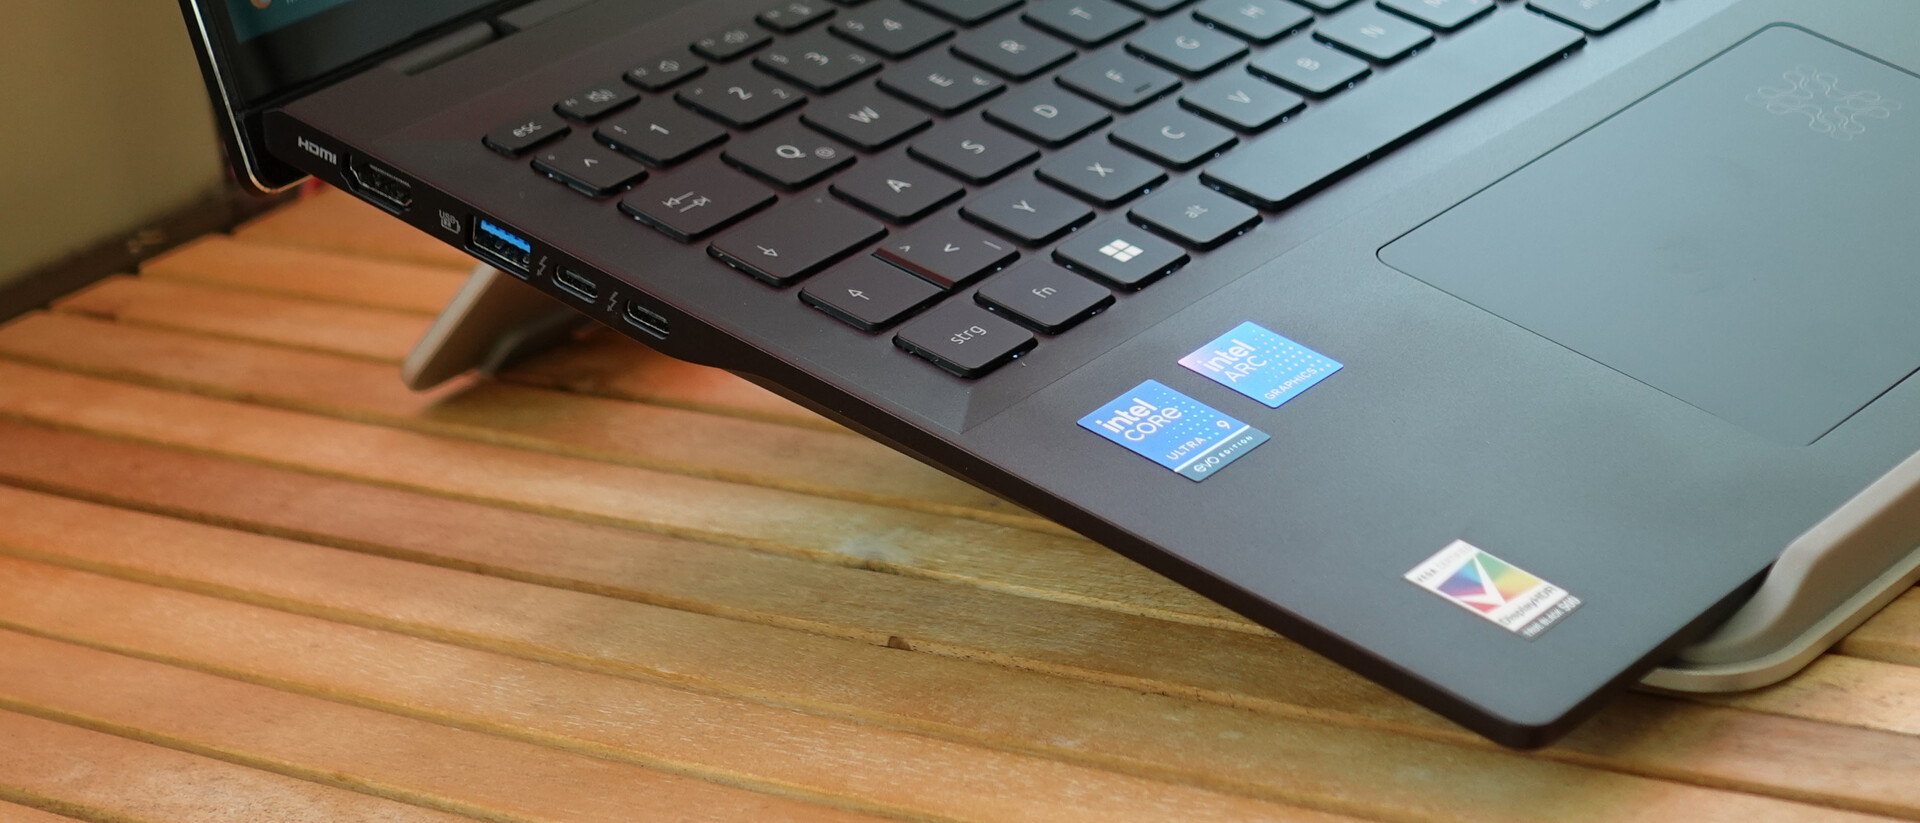
Swift 16 AI 在连接性方面的配备相当齐全。标准 USB-A 端口可连接旧配件,HDMI 端口可连接外接显示器。一个小缺点是端口的位置:包括两个 USB-C 接口在内的大部分接口都在左侧。最新的 Wi-Fi 7 和蓝牙 5.4 也提供了快速上网和无线配件支持。此外,还配备了用于视频通话的 370 万像素网络摄像头。


可持续性
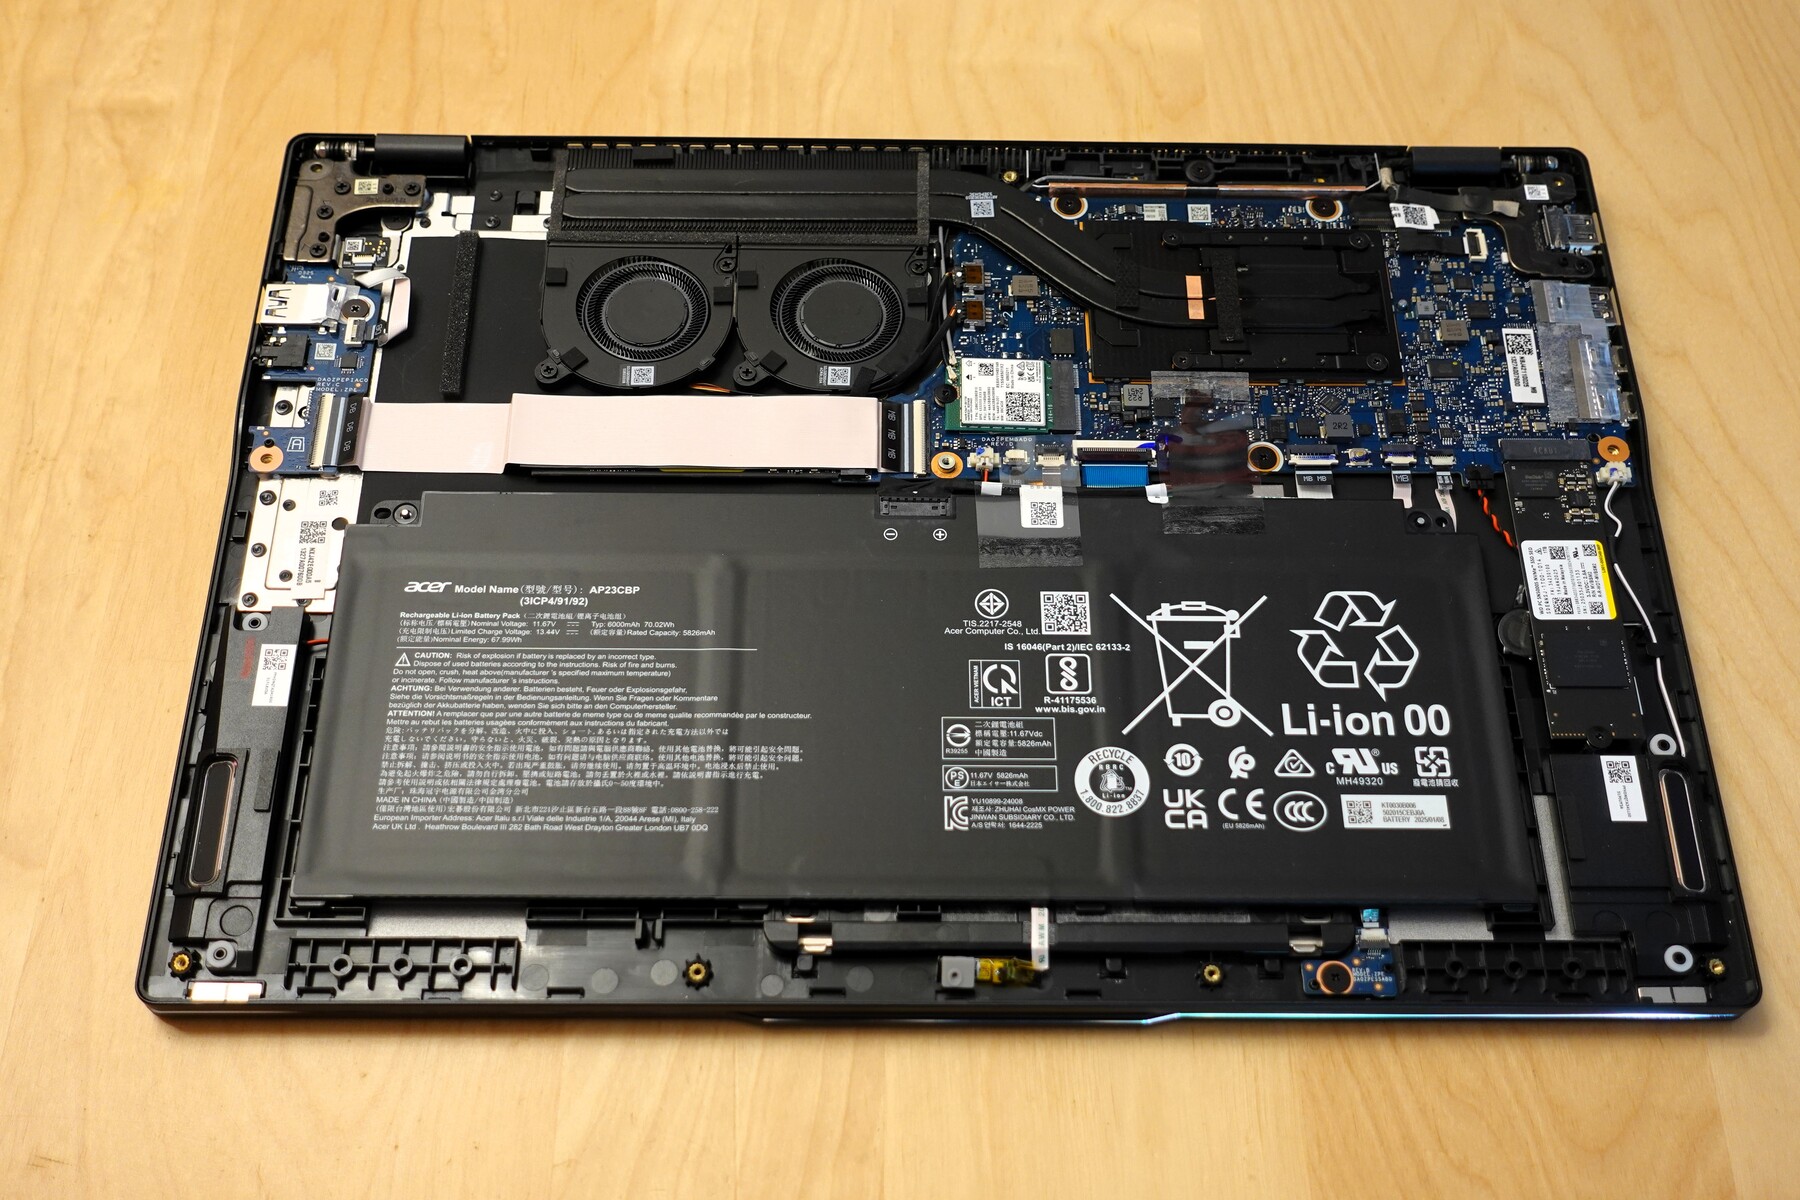
在对环境的影响方面,Swift 16 AI 的表现不俗。其包装几乎不使用塑料,宏碁甚至在PDF 文档中披露了该设备的二氧化碳排放量。.此外,笔记本易于打开,固态硬盘和 WLAN 卡等重要部件可以更换,这一点也很不错。
输入设备
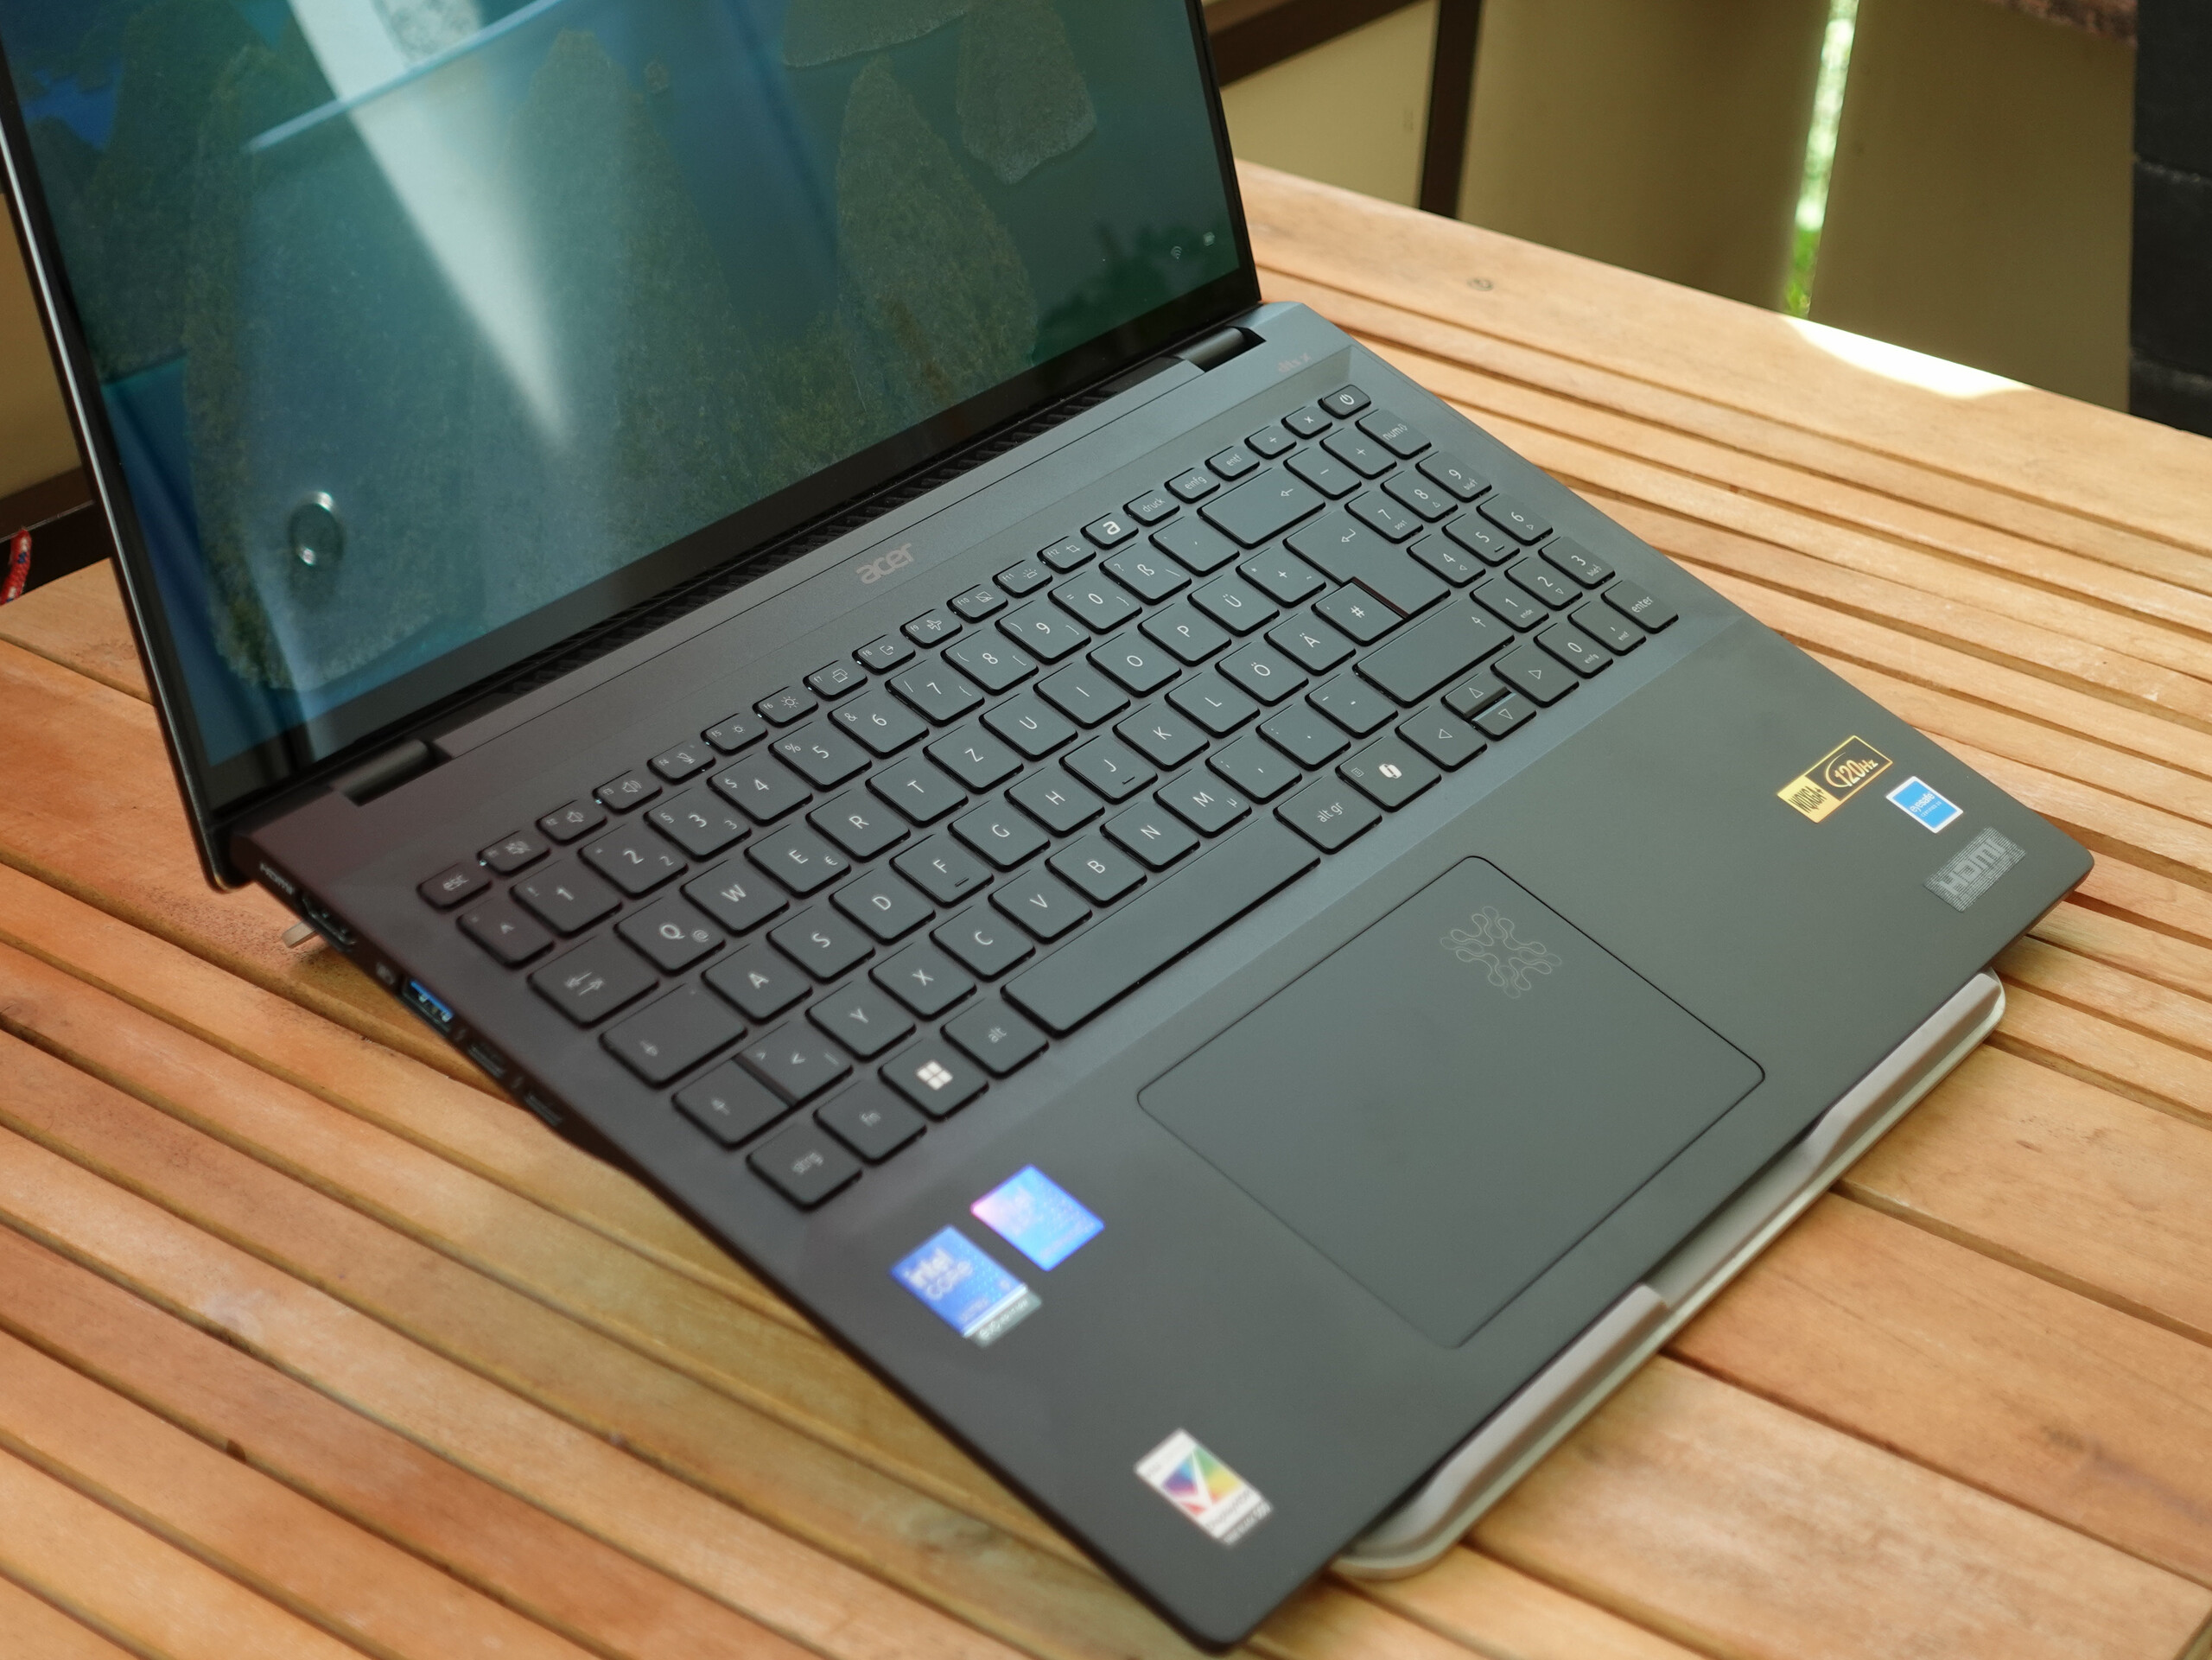
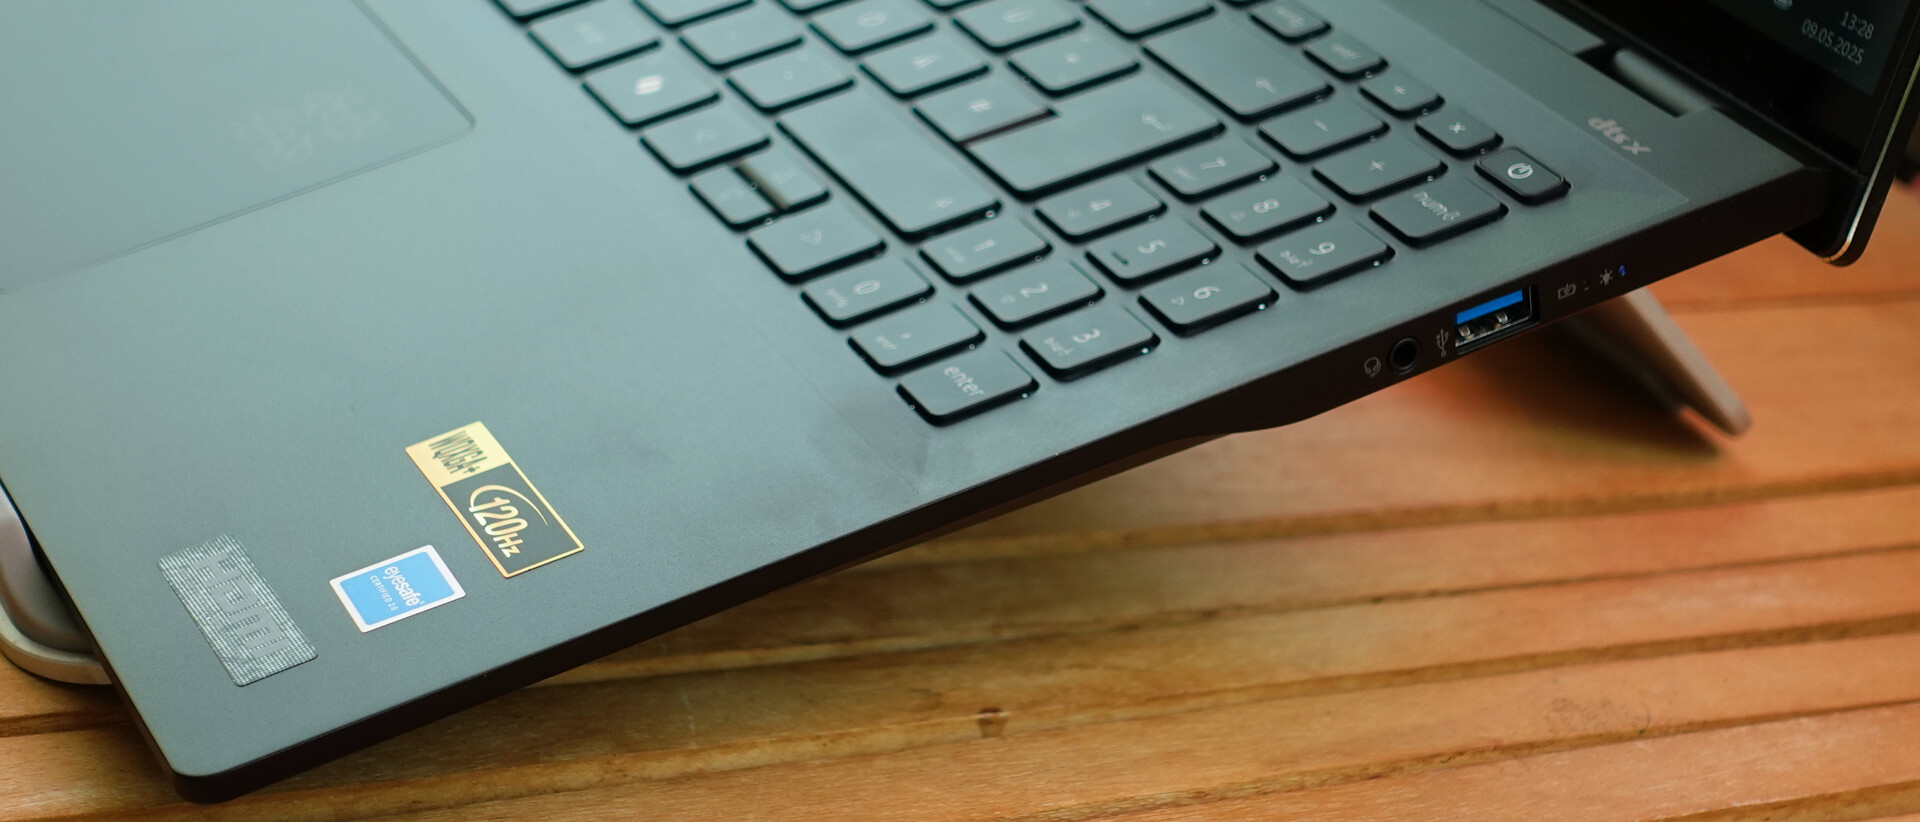
触摸板很大,使用起来很舒适,在背光键盘上打字的感觉也不错。不过,出于节省空间的考虑,数字键盘有点拥挤,你需要适应一下。反应灵敏的触摸屏让整体体验更加完美。
显示屏
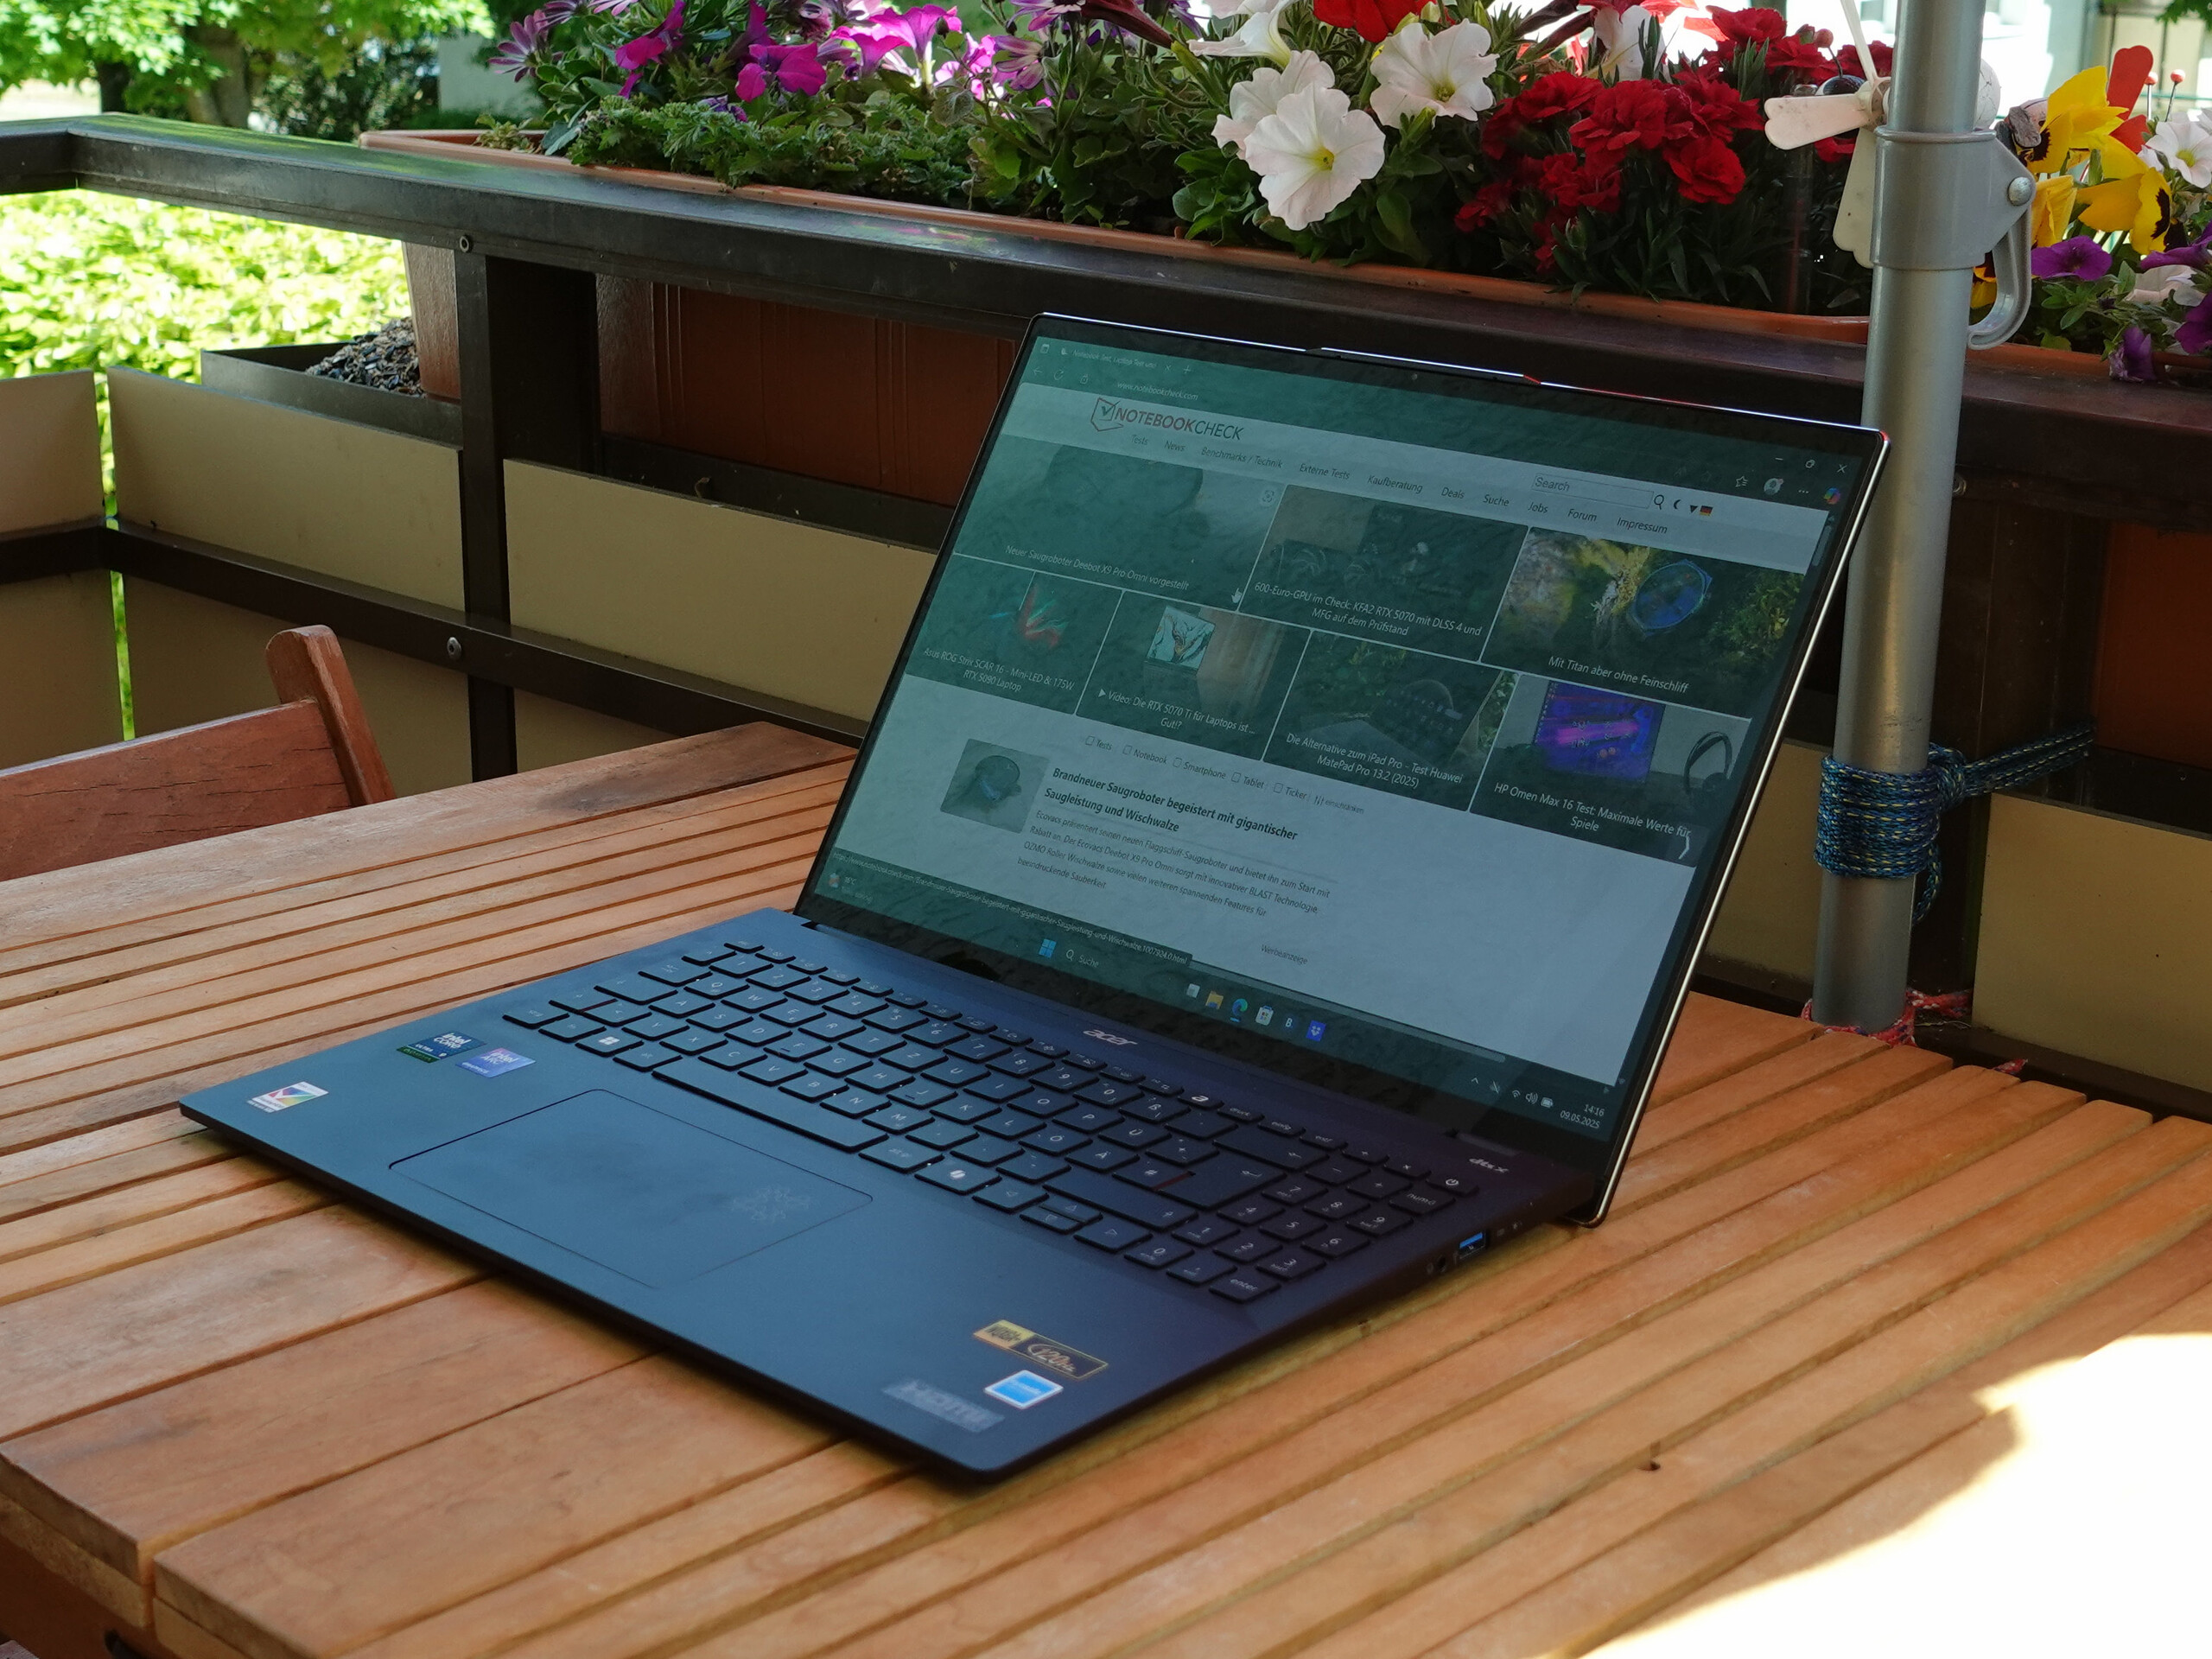
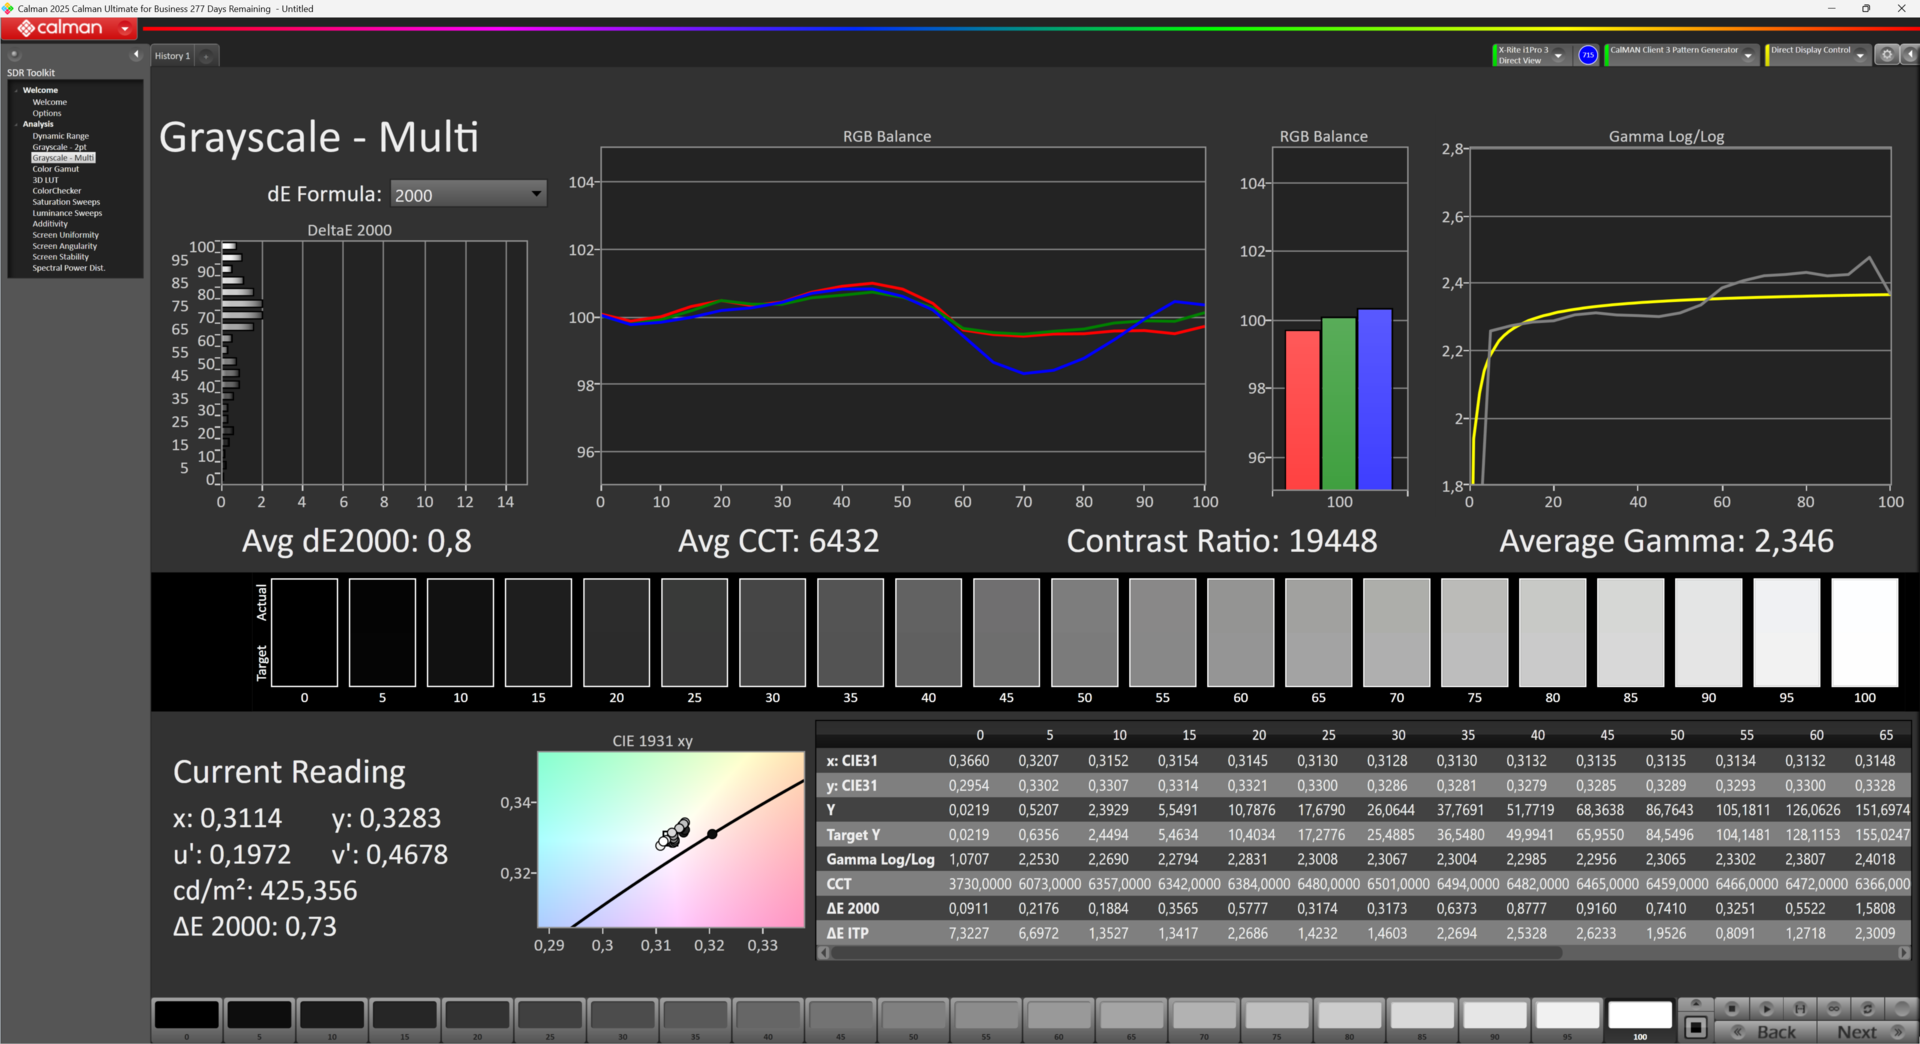
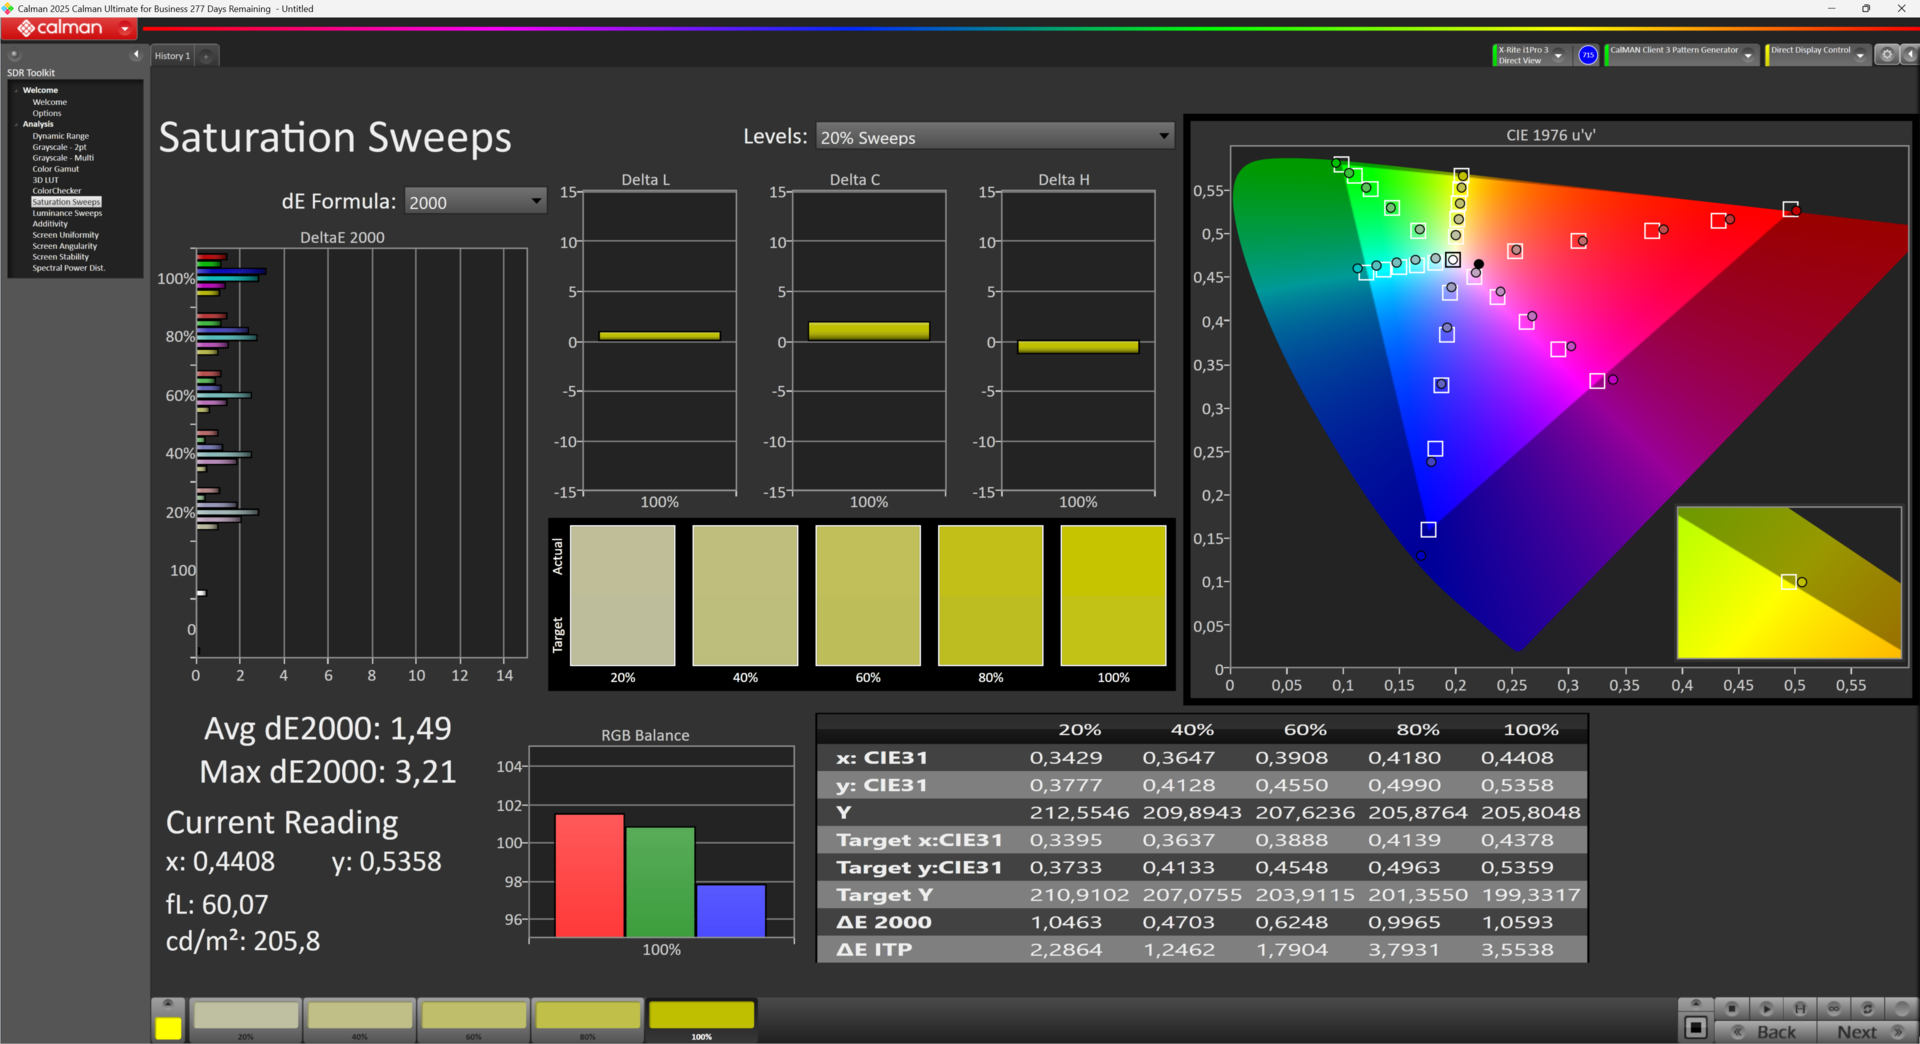
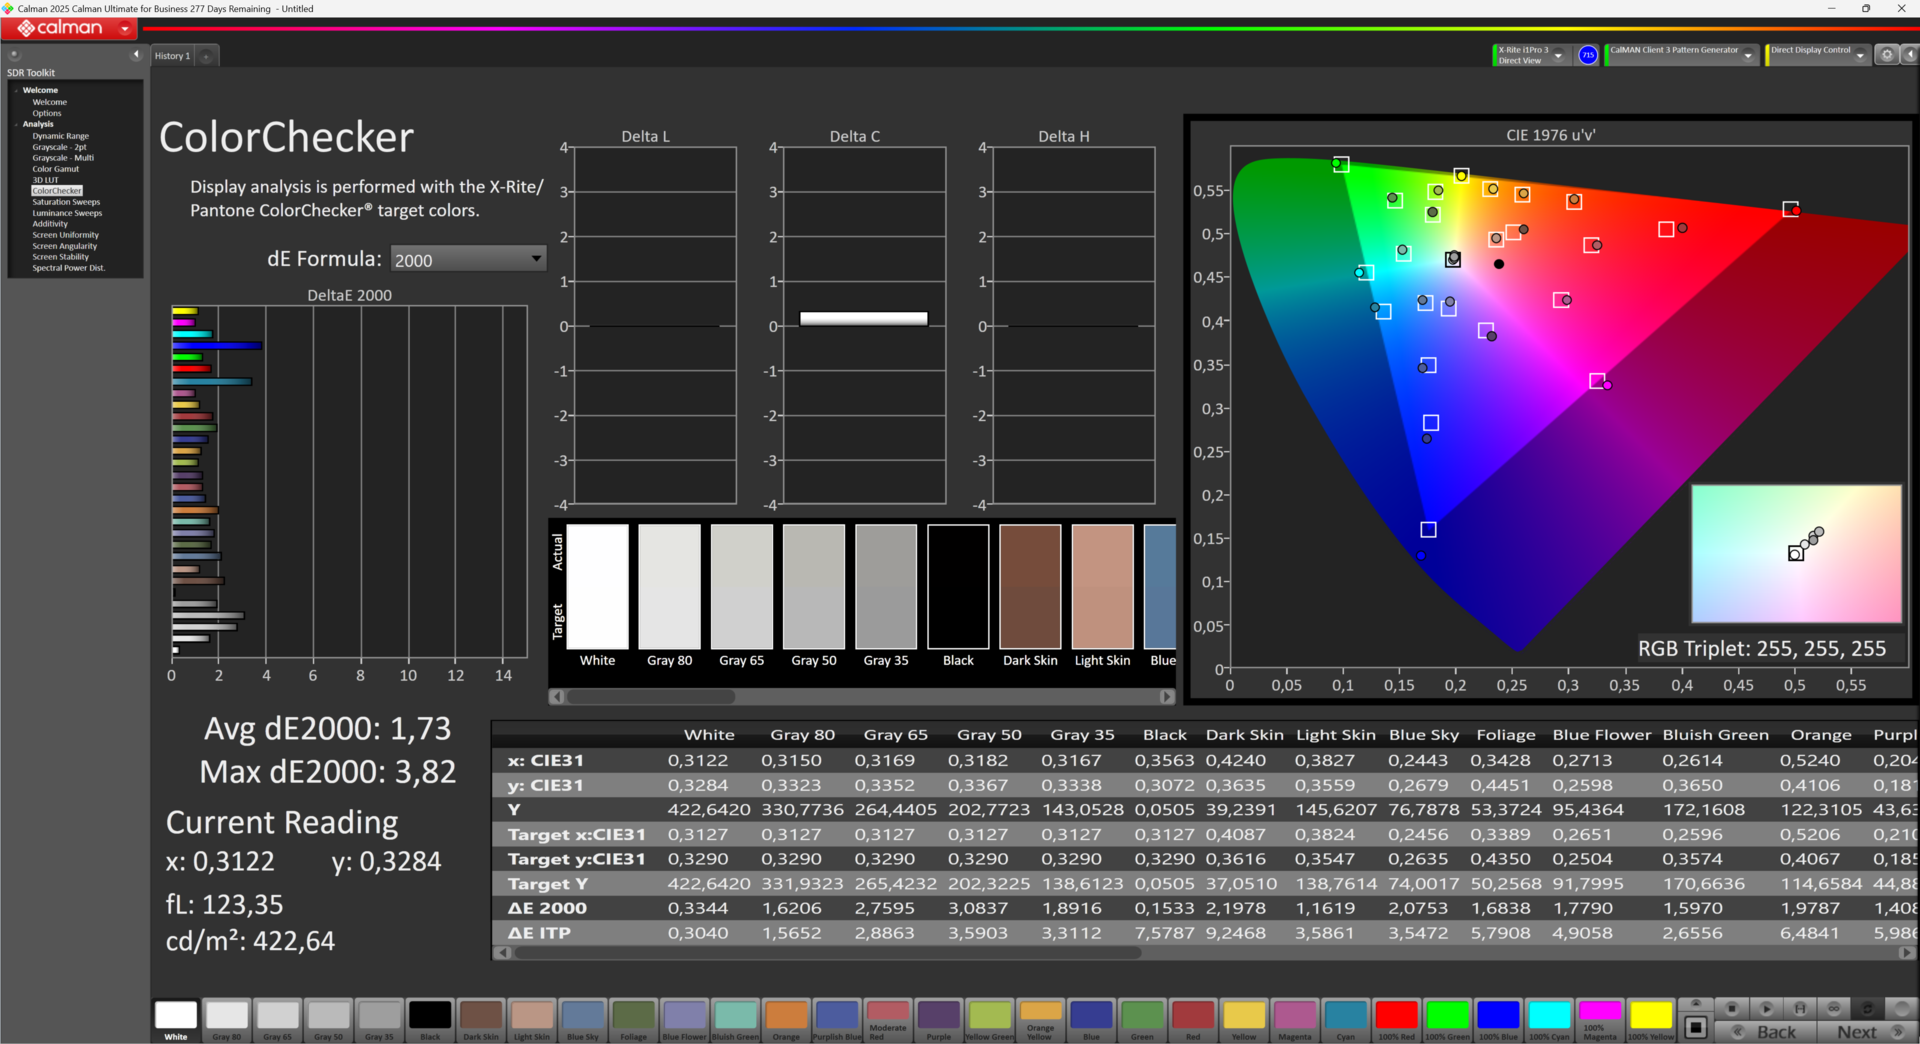
Swift 16 的 OLED 显示屏功能强大:完美的黑色、超高的对比度、清晰锐利的 2,880 × 1,800 分辨率,让色彩熠熠生辉。几乎 100% 的 P3 色彩空间覆盖率和高色彩保真度(DeltaE 1.73)会让专业人士欣喜若狂。约 420 cd/m² 的亮度也令人愉悦。不过,在户外使用时,反光显示屏上的阳光可能会让人分心。


| |||||||||||||||||||||||||
Brightness Distribution: 98 %
Center on Battery: 424 cd/m²
Contrast: 19406:1 (Black: 0.0219 cd/m²)
ΔE ColorChecker Calman: 1.73 | ∀{0.5-29.43 Ø4.73}
ΔE Greyscale Calman: 0.09 | ∀{0.09-98 Ø4.97}
94.6% AdobeRGB 1998 (Argyll 3D)
100% sRGB (Argyll 3D)
99.9% Display P3 (Argyll 3D)
Gamma: 2.346
CCT: 6432 K
| Acer Swift 16 AI SF16-51T-932H, Ultra 9 288V SDC41B6, OLED, 2880x1800, 16", 120 Hz | Lenovo Yoga 7 2-in-1 16ILL10 LEN160WUM, IPS, 1920x1200, 16", 60 Hz | LG Gram Pro 16Z90TS-G.AU89G LG DISPLAY LP160WQ2-SPF1, IPS, 2560x1600, 16", 144 Hz | Samsung Galaxy Book5 Pro 360 ATNA60CL09-0, OLED, 2880x1800, 16", 120 Hz | MSI Summit A16 AI Plus A3HMTG AU Optronics B16QAN02.N, IPS, 2560x1600, 16", 165 Hz | Ninkear A16 Pro cso1623, IPS, 2560x1600, 16", 120 Hz | |
|---|---|---|---|---|---|---|
| Display | -53% | -3% | 1% | -4% | -19% | |
| Display P3 Coverage (%) | 99.9 | 39.7 -60% | 97.96 -2% | 99.9 0% | 96.8 -3% | 68.7 -31% |
| sRGB Coverage (%) | 100 | 57.9 -42% | 100 0% | 100 0% | 99.8 0% | 97.6 -2% |
| AdobeRGB 1998 Coverage (%) | 94.6 | 41 -57% | 86.65 -8% | 96.6 2% | 84.7 -10% | 71.1 -25% |
| Response Times | -275% | -473% | 61% | -59% | -102% | |
| Response Time Grey 50% / Grey 80% * (ms) | 4.8 ? | 30 ? -525% | 47 ? -879% | 0.48 ? 90% | 12.9 ? -169% | 16.4 ? -242% |
| Response Time Black / White * (ms) | 18 ? | 22.5 ? -25% | 30 ? -67% | 0.64 ? 96% | 8.9 ? 51% | 11.2 ? 38% |
| PWM Frequency (Hz) | 481 | 240 ? | ||||
| PWM Amplitude * (%) | 39 | 40 -3% | ||||
| Screen | -1138% | -283% | -286% | -616% | -618% | |
| Brightness middle (cd/m²) | 425 | 317.9 -25% | 442 4% | 387 -9% | 475.4 12% | 393.6 -7% |
| Brightness (cd/m²) | 421 | 304 -28% | 406 -4% | 392 -7% | 440 5% | 398 -5% |
| Brightness Distribution (%) | 98 | 90 -8% | 86 -12% | 98 0% | 89 -9% | 91 -7% |
| Black Level * (cd/m²) | 0.0219 | 0.25 -1042% | 0.17 -676% | 0.36 -1544% | 0.44 -1909% | |
| Contrast (:1) | 19406 | 1272 -93% | 2600 -87% | 1321 -93% | 895 -95% | |
| Colorchecker dE 2000 * | 1.73 | 7.39 -327% | 0.84 51% | 1 42% | 2.99 -73% | 2.32 -34% |
| Colorchecker dE 2000 max. * | 3.82 | 21.43 -461% | 1.62 58% | 1.9 50% | 7.64 -100% | 3.72 3% |
| Greyscale dE 2000 * | 0.09 | 6.5 -7122% | 1.53 -1600% | 1.7 -1789% | 2.9 -3122% | 2.69 -2889% |
| Gamma | 2.346 94% | 2.22 99% | 2.173 101% | 2.25 98% | 2.31 95% | 2.38 92% |
| CCT | 6432 101% | 6140 106% | 6496 100% | 6325 103% | 6472 100% | 6086 107% |
| Colorchecker dE 2000 calibrated * | 3.06 | 0.88 | 0.74 | 1.05 | ||
| Total Average (Program / Settings) | -489% /
-755% | -253% /
-248% | -75% /
-127% | -226% /
-389% | -246% /
-400% |
* ... smaller is better
Display Response Times
| ↔ Response Time Black to White | ||
|---|---|---|
| 18 ms ... rise ↗ and fall ↘ combined | ↗ 17.4 ms rise |  |
| ↘ 0.6 ms fall | ||
| The screen shows good response rates in our tests, but may be too slow for competitive gamers. In comparison, all tested devices range from 0.1 (minimum) to 240 (maximum) ms. » 40 % of all devices are better. This means that the measured response time is similar to the average of all tested devices (19.9 ms). | ||
| ↔ Response Time 50% Grey to 80% Grey | ||
| 4.8 ms ... rise ↗ and fall ↘ combined | ↗ 2.6 ms rise |  |
| ↘ 2.2 ms fall | ||
| The screen shows very fast response rates in our tests and should be very well suited for fast-paced gaming. In comparison, all tested devices range from 0.165 (minimum) to 636 (maximum) ms. » 16 % of all devices are better. This means that the measured response time is better than the average of all tested devices (31.1 ms). | ||
Screen Flickering / PWM (Pulse-Width Modulation)
| Screen flickering / PWM detected | 481 Hz Amplitude: 39 % | | |
The display backlight flickers at 481 Hz (worst case, e.g., utilizing PWM) . The frequency of 481 Hz is relatively high, so most users sensitive to PWM should not notice any flickering. However, there are reports that some users are still sensitive to PWM at 500 Hz and above, so be aware. In comparison: 52 % of all tested devices do not use PWM to dim the display. If PWM was detected, an average of 7798 (minimum: 5 - maximum: 343500) Hz was measured. | |||
性能
测试设备使用了英特尔的新款酷睿 Ultra 9 288V("Lunar Lake")。它配备 32GB DDR5 内存和英特尔 Arc 140V GPU。我们的机型有两个快速的 1TB NVMe 固态硬盘。也有配备酷睿 Ultra 7 和空间较小的固态硬盘的机型。

测试条件
AcerSense 提供从静音到超频四种性能方案。我们选择了 "性能 "计划来运行所有基准测试。
处理器
英特尔 英特尔酷睿至尊 9 288VSwift 16 AI 中安装的英特尔酷睿 Ultra 9 288V,提供了新一代 Lunar Lake 处理器的预期性能--稳定,但没有任何重大惊喜。直接比较显示,虽然单核性能与竞争对手(如 AMD Ryzen AI 9 365中的 微星巅峰 A16 AI Plus在多核任务中,AMD 芯片明显领先。
Cinebench R15 Multi loop
Cinebench R23: Multi Core | Single Core
Cinebench R20: CPU (Multi Core) | CPU (Single Core)
Cinebench R15: CPU Multi 64Bit | CPU Single 64Bit
Blender: v2.79 BMW27 CPU
7-Zip 18.03: 7z b 4 | 7z b 4 -mmt1
Geekbench 6.7: Multi-Core | Single-Core
Geekbench 5.5: Multi-Core | Single-Core
HWBOT x265 Benchmark v2.2: 4k Preset
LibreOffice : 20 Documents To PDF
R Benchmark 2.5: Overall mean
| CPU Performance rating | |
| MSI Summit A16 AI Plus A3HMTG | |
| Ninkear A16 Pro | |
| Average Intel Core Ultra 9 288V | |
| Lenovo Yoga 7 2-in-1 16ILL10 | |
| Acer Swift 16 AI SF16-51T-932H, Ultra 9 288V | |
| LG Gram Pro 16Z90TS-G.AU89G | |
| Samsung Galaxy Book5 Pro 360 | |
| Average of class Office | |
| Cinebench R23 / Multi Core | |
| MSI Summit A16 AI Plus A3HMTG | |
| Ninkear A16 Pro | |
| Average of class Office (1673 - 22808, n=73, last 2 years) | |
| LG Gram Pro 16Z90TS-G.AU89G | |
| LG Gram Pro 16Z90TS-G.AU89G | |
| Acer Swift 16 AI SF16-51T-932H, Ultra 9 288V | |
| Lenovo Yoga 7 2-in-1 16ILL10 | |
| Average Intel Core Ultra 9 288V (9091 - 10941, n=4) | |
| Samsung Galaxy Book5 Pro 360 | |
| Cinebench R23 / Single Core | |
| MSI Summit A16 AI Plus A3HMTG | |
| Acer Swift 16 AI SF16-51T-932H, Ultra 9 288V | |
| Average Intel Core Ultra 9 288V (1794 - 2013, n=5) | |
| LG Gram Pro 16Z90TS-G.AU89G | |
| LG Gram Pro 16Z90TS-G.AU89G | |
| Lenovo Yoga 7 2-in-1 16ILL10 | |
| Samsung Galaxy Book5 Pro 360 | |
| Ninkear A16 Pro | |
| Average of class Office (708 - 2130, n=73, last 2 years) | |
| Cinebench R20 / CPU (Multi Core) | |
| MSI Summit A16 AI Plus A3HMTG | |
| Ninkear A16 Pro | |
| Average of class Office (648 - 8840, n=72, last 2 years) | |
| Average Intel Core Ultra 9 288V (4091 - 4230, n=3) | |
| LG Gram Pro 16Z90TS-G.AU89G | |
| Acer Swift 16 AI SF16-51T-932H, Ultra 9 288V | |
| Lenovo Yoga 7 2-in-1 16ILL10 | |
| Samsung Galaxy Book5 Pro 360 | |
| Cinebench R20 / CPU (Single Core) | |
| MSI Summit A16 AI Plus A3HMTG | |
| Acer Swift 16 AI SF16-51T-932H, Ultra 9 288V | |
| Average Intel Core Ultra 9 288V (703 - 777, n=3) | |
| LG Gram Pro 16Z90TS-G.AU89G | |
| Lenovo Yoga 7 2-in-1 16ILL10 | |
| Samsung Galaxy Book5 Pro 360 | |
| Ninkear A16 Pro | |
| Average of class Office (345 - 816, n=72, last 2 years) | |
| Cinebench R15 / CPU Multi 64Bit | |
| MSI Summit A16 AI Plus A3HMTG | |
| Ninkear A16 Pro | |
| Average of class Office (250 - 3380, n=74, last 2 years) | |
| LG Gram Pro 16Z90TS-G.AU89G | |
| Lenovo Yoga 7 2-in-1 16ILL10 | |
| Acer Swift 16 AI SF16-51T-932H, Ultra 9 288V | |
| Average Intel Core Ultra 9 288V (1500 - 1640, n=3) | |
| Samsung Galaxy Book5 Pro 360 | |
| Cinebench R15 / CPU Single 64Bit | |
| MSI Summit A16 AI Plus A3HMTG | |
| Average Intel Core Ultra 9 288V (294 - 309, n=2) | |
| Acer Swift 16 AI SF16-51T-932H, Ultra 9 288V | |
| Lenovo Yoga 7 2-in-1 16ILL10 | |
| LG Gram Pro 16Z90TS-G.AU89G | |
| Ninkear A16 Pro | |
| Samsung Galaxy Book5 Pro 360 | |
| Average of class Office (99.5 - 312, n=74, last 2 years) | |
| Blender / v2.79 BMW27 CPU | |
| Average Intel Core Ultra 9 288V (310 - 441, n=4) | |
| Average of class Office (158 - 1940, n=73, last 2 years) | |
| Samsung Galaxy Book5 Pro 360 | |
| Lenovo Yoga 7 2-in-1 16ILL10 | |
| Acer Swift 16 AI SF16-51T-932H, Ultra 9 288V | |
| LG Gram Pro 16Z90TS-G.AU89G | |
| Ninkear A16 Pro | |
| MSI Summit A16 AI Plus A3HMTG | |
| 7-Zip 18.03 / 7z b 4 | |
| MSI Summit A16 AI Plus A3HMTG | |
| Ninkear A16 Pro | |
| Average of class Office (7098 - 76886, n=75, last 2 years) | |
| Lenovo Yoga 7 2-in-1 16ILL10 | |
| Acer Swift 16 AI SF16-51T-932H, Ultra 9 288V | |
| LG Gram Pro 16Z90TS-G.AU89G | |
| Average Intel Core Ultra 9 288V (32105 - 36683, n=5) | |
| Samsung Galaxy Book5 Pro 360 | |
| 7-Zip 18.03 / 7z b 4 -mmt1 | |
| Average Intel Core Ultra 9 288V (5734 - 5993, n=5) | |
| MSI Summit A16 AI Plus A3HMTG | |
| LG Gram Pro 16Z90TS-G.AU89G | |
| Acer Swift 16 AI SF16-51T-932H, Ultra 9 288V | |
| Lenovo Yoga 7 2-in-1 16ILL10 | |
| Ninkear A16 Pro | |
| Average of class Office (3387 - 6469, n=74, last 2 years) | |
| Samsung Galaxy Book5 Pro 360 | |
| Geekbench 6.7 / Multi-Core | |
| MSI Summit A16 AI Plus A3HMTG | |
| Ninkear A16 Pro | |
| Average Intel Core Ultra 9 288V (10969 - 11190, n=5) | |
| LG Gram Pro 16Z90TS-G.AU89G | |
| Acer Swift 16 AI SF16-51T-932H, Ultra 9 288V | |
| Lenovo Yoga 7 2-in-1 16ILL10 | |
| Average of class Office (757 - 17846, n=82, last 2 years) | |
| Samsung Galaxy Book5 Pro 360 | |
| Geekbench 6.7 / Single-Core | |
| Average Intel Core Ultra 9 288V (2797 - 2887, n=4) | |
| MSI Summit A16 AI Plus A3HMTG | |
| Acer Swift 16 AI SF16-51T-932H, Ultra 9 288V | |
| LG Gram Pro 16Z90TS-G.AU89G | |
| Lenovo Yoga 7 2-in-1 16ILL10 | |
| Ninkear A16 Pro | |
| Samsung Galaxy Book5 Pro 360 | |
| Average of class Office (462 - 2894, n=83, last 2 years) | |
| Geekbench 5.5 / Multi-Core | |
| MSI Summit A16 AI Plus A3HMTG | |
| Ninkear A16 Pro | |
| Lenovo Yoga 7 2-in-1 16ILL10 | |
| Average Intel Core Ultra 9 288V (9588 - 9745, n=3) | |
| Acer Swift 16 AI SF16-51T-932H, Ultra 9 288V | |
| LG Gram Pro 16Z90TS-G.AU89G | |
| Samsung Galaxy Book5 Pro 360 | |
| Average of class Office (1483 - 16999, n=71, last 2 years) | |
| Geekbench 5.5 / Single-Core | |
| Average Intel Core Ultra 9 288V (2024 - 2114, n=3) | |
| MSI Summit A16 AI Plus A3HMTG | |
| Acer Swift 16 AI SF16-51T-932H, Ultra 9 288V | |
| Lenovo Yoga 7 2-in-1 16ILL10 | |
| LG Gram Pro 16Z90TS-G.AU89G | |
| Samsung Galaxy Book5 Pro 360 | |
| Ninkear A16 Pro | |
| Average of class Office (811 - 2128, n=71, last 2 years) | |
| HWBOT x265 Benchmark v2.2 / 4k Preset | |
| MSI Summit A16 AI Plus A3HMTG | |
| Ninkear A16 Pro | |
| Acer Swift 16 AI SF16-51T-932H, Ultra 9 288V | |
| LG Gram Pro 16Z90TS-G.AU89G | |
| Average Intel Core Ultra 9 288V (11.2 - 14.3, n=3) | |
| Lenovo Yoga 7 2-in-1 16ILL10 | |
| Average of class Office (2.21 - 26, n=73, last 2 years) | |
| Samsung Galaxy Book5 Pro 360 | |
| LibreOffice / 20 Documents To PDF | |
| Average of class Office (41.5 - 102.3, n=73, last 2 years) | |
| Acer Swift 16 AI SF16-51T-932H, Ultra 9 288V | |
| MSI Summit A16 AI Plus A3HMTG | |
| Ninkear A16 Pro | |
| LG Gram Pro 16Z90TS-G.AU89G | |
| Average Intel Core Ultra 9 288V (39.9 - 56.9, n=4) | |
| Samsung Galaxy Book5 Pro 360 | |
| Lenovo Yoga 7 2-in-1 16ILL10 | |
| R Benchmark 2.5 / Overall mean | |
| Average of class Office (0.4098 - 0.888, n=73, last 2 years) | |
| Ninkear A16 Pro | |
| Samsung Galaxy Book5 Pro 360 | |
| LG Gram Pro 16Z90TS-G.AU89G | |
| Lenovo Yoga 7 2-in-1 16ILL10 | |
| Acer Swift 16 AI SF16-51T-932H, Ultra 9 288V | |
| Average Intel Core Ultra 9 288V (0.4218 - 0.4503, n=4) | |
| MSI Summit A16 AI Plus A3HMTG | |
* ... smaller is better
AIDA64: FP32 Ray-Trace | FPU Julia | CPU SHA3 | CPU Queen | FPU SinJulia | FPU Mandel | CPU AES | CPU ZLib | FP64 Ray-Trace | CPU PhotoWorxx
| Performance rating | |
| MSI Summit A16 AI Plus A3HMTG | |
| Ninkear A16 Pro | |
| Average of class Office | |
| Acer Swift 16 AI SF16-51T-932H, Ultra 9 288V | |
| LG Gram Pro 16Z90TS-G.AU89G | |
| Average Intel Core Ultra 9 288V | |
| Lenovo Yoga 7 2-in-1 16ILL10 | |
| Samsung Galaxy Book5 Pro 360 | |
| AIDA64 / FP32 Ray-Trace | |
| MSI Summit A16 AI Plus A3HMTG | |
| Ninkear A16 Pro | |
| Average of class Office (2083 - 31245, n=79, last 2 years) | |
| Acer Swift 16 AI SF16-51T-932H, Ultra 9 288V | |
| LG Gram Pro 16Z90TS-G.AU89G | |
| Average Intel Core Ultra 9 288V (9953 - 13061, n=5) | |
| Samsung Galaxy Book5 Pro 360 | |
| Lenovo Yoga 7 2-in-1 16ILL10 | |
| AIDA64 / FPU Julia | |
| MSI Summit A16 AI Plus A3HMTG | |
| Ninkear A16 Pro | |
| Acer Swift 16 AI SF16-51T-932H, Ultra 9 288V | |
| LG Gram Pro 16Z90TS-G.AU89G | |
| Average Intel Core Ultra 9 288V (49602 - 64847, n=5) | |
| Samsung Galaxy Book5 Pro 360 | |
| Average of class Office (8191 - 125394, n=79, last 2 years) | |
| Lenovo Yoga 7 2-in-1 16ILL10 | |
| AIDA64 / CPU SHA3 | |
| MSI Summit A16 AI Plus A3HMTG | |
| Ninkear A16 Pro | |
| Average of class Office (433 - 5755, n=79, last 2 years) | |
| Acer Swift 16 AI SF16-51T-932H, Ultra 9 288V | |
| Lenovo Yoga 7 2-in-1 16ILL10 | |
| Average Intel Core Ultra 9 288V (2285 - 2855, n=5) | |
| LG Gram Pro 16Z90TS-G.AU89G | |
| Samsung Galaxy Book5 Pro 360 | |
| AIDA64 / CPU Queen | |
| Ninkear A16 Pro | |
| MSI Summit A16 AI Plus A3HMTG | |
| Average of class Office (22784 - 115197, n=69, last 2 years) | |
| LG Gram Pro 16Z90TS-G.AU89G | |
| Acer Swift 16 AI SF16-51T-932H, Ultra 9 288V | |
| Lenovo Yoga 7 2-in-1 16ILL10 | |
| Average Intel Core Ultra 9 288V (49591 - 49785, n=4) | |
| Samsung Galaxy Book5 Pro 360 | |
| AIDA64 / FPU SinJulia | |
| MSI Summit A16 AI Plus A3HMTG | |
| Ninkear A16 Pro | |
| Average of class Office (1378 - 18321, n=79, last 2 years) | |
| LG Gram Pro 16Z90TS-G.AU89G | |
| Lenovo Yoga 7 2-in-1 16ILL10 | |
| Average Intel Core Ultra 9 288V (4421 - 4429, n=5) | |
| Acer Swift 16 AI SF16-51T-932H, Ultra 9 288V | |
| Samsung Galaxy Book5 Pro 360 | |
| AIDA64 / FPU Mandel | |
| MSI Summit A16 AI Plus A3HMTG | |
| Ninkear A16 Pro | |
| LG Gram Pro 16Z90TS-G.AU89G | |
| Acer Swift 16 AI SF16-51T-932H, Ultra 9 288V | |
| Samsung Galaxy Book5 Pro 360 | |
| Average Intel Core Ultra 9 288V (26344 - 34507, n=5) | |
| Average of class Office (4601 - 66922, n=79, last 2 years) | |
| Lenovo Yoga 7 2-in-1 16ILL10 | |
| AIDA64 / CPU AES | |
| Ninkear A16 Pro | |
| MSI Summit A16 AI Plus A3HMTG | |
| Average of class Office (4854 - 155900, n=79, last 2 years) | |
| Acer Swift 16 AI SF16-51T-932H, Ultra 9 288V | |
| Average Intel Core Ultra 9 288V (35250 - 40542, n=5) | |
| LG Gram Pro 16Z90TS-G.AU89G | |
| Lenovo Yoga 7 2-in-1 16ILL10 | |
| Samsung Galaxy Book5 Pro 360 | |
| AIDA64 / CPU ZLib | |
| MSI Summit A16 AI Plus A3HMTG | |
| Ninkear A16 Pro | |
| Average of class Office (114.6 - 1366, n=79, last 2 years) | |
| Lenovo Yoga 7 2-in-1 16ILL10 | |
| LG Gram Pro 16Z90TS-G.AU89G | |
| Average Intel Core Ultra 9 288V (527 - 629, n=5) | |
| Acer Swift 16 AI SF16-51T-932H, Ultra 9 288V | |
| Samsung Galaxy Book5 Pro 360 | |
| AIDA64 / FP64 Ray-Trace | |
| MSI Summit A16 AI Plus A3HMTG | |
| Ninkear A16 Pro | |
| Average of class Office (1109 - 17834, n=79, last 2 years) | |
| Acer Swift 16 AI SF16-51T-932H, Ultra 9 288V | |
| LG Gram Pro 16Z90TS-G.AU89G | |
| Samsung Galaxy Book5 Pro 360 | |
| Average Intel Core Ultra 9 288V (4862 - 7164, n=5) | |
| Lenovo Yoga 7 2-in-1 16ILL10 | |
| AIDA64 / CPU PhotoWorxx | |
| Acer Swift 16 AI SF16-51T-932H, Ultra 9 288V | |
| Average Intel Core Ultra 9 288V (50790 - 59848, n=5) | |
| LG Gram Pro 16Z90TS-G.AU89G | |
| Lenovo Yoga 7 2-in-1 16ILL10 | |
| MSI Summit A16 AI Plus A3HMTG | |
| Samsung Galaxy Book5 Pro 360 | |
| Ninkear A16 Pro | |
| Average of class Office (11090 - 65229, n=79, last 2 years) | |
系统性能
有趣的是,从整体系统性能来看,AMD Ryzen AI 9 的领先优势并不明显。特别是在模拟日常应用的 Crossmark 等基准测试中,Swift 16 AI 与英特尔酷睿 Ultra 9 的差距逐渐缩小。这表明 AMD 处理器在实际应用中的优势并不明显。
PCMark 10: Score | Essentials | Productivity | Digital Content Creation
CrossMark: Overall | Productivity | Creativity | Responsiveness
WebXPRT 3: Overall
WebXPRT 4: Overall
Mozilla Kraken 1.1: Total
| Performance rating | |
| MSI Summit A16 AI Plus A3HMTG | |
| Average Intel Core Ultra 9 288V, Intel Arc Graphics 140V | |
| Lenovo Yoga 7 2-in-1 16ILL10 | |
| Acer Swift 16 AI SF16-51T-932H, Ultra 9 288V | |
| Ninkear A16 Pro | |
| LG Gram Pro 16Z90TS-G.AU89G | |
| Samsung Galaxy Book5 Pro 360 | |
| Average of class Office | |
| PCMark 10 / Score | |
| MSI Summit A16 AI Plus A3HMTG | |
| Lenovo Yoga 7 2-in-1 16ILL10 | |
| Ninkear A16 Pro | |
| Acer Swift 16 AI SF16-51T-932H, Ultra 9 288V | |
| Average Intel Core Ultra 9 288V, Intel Arc Graphics 140V (6954 - 7155, n=2) | |
| LG Gram Pro 16Z90TS-G.AU89G | |
| Samsung Galaxy Book5 Pro 360 | |
| Average of class Office (2601 - 9298, n=63, last 2 years) | |
| PCMark 10 / Essentials | |
| Lenovo Yoga 7 2-in-1 16ILL10 | |
| MSI Summit A16 AI Plus A3HMTG | |
| Ninkear A16 Pro | |
| Acer Swift 16 AI SF16-51T-932H, Ultra 9 288V | |
| Average Intel Core Ultra 9 288V, Intel Arc Graphics 140V (9779 - 10549, n=2) | |
| Samsung Galaxy Book5 Pro 360 | |
| Average of class Office (3245 - 11594, n=63, last 2 years) | |
| LG Gram Pro 16Z90TS-G.AU89G | |
| PCMark 10 / Productivity | |
| Ninkear A16 Pro | |
| MSI Summit A16 AI Plus A3HMTG | |
| Acer Swift 16 AI SF16-51T-932H, Ultra 9 288V | |
| Lenovo Yoga 7 2-in-1 16ILL10 | |
| Average Intel Core Ultra 9 288V, Intel Arc Graphics 140V (9256 - 9452, n=2) | |
| Average of class Office (5336 - 17243, n=63, last 2 years) | |
| Samsung Galaxy Book5 Pro 360 | |
| LG Gram Pro 16Z90TS-G.AU89G | |
| PCMark 10 / Digital Content Creation | |
| MSI Summit A16 AI Plus A3HMTG | |
| Lenovo Yoga 7 2-in-1 16ILL10 | |
| Average Intel Core Ultra 9 288V, Intel Arc Graphics 140V (9970 - 10085, n=2) | |
| Acer Swift 16 AI SF16-51T-932H, Ultra 9 288V | |
| LG Gram Pro 16Z90TS-G.AU89G | |
| Ninkear A16 Pro | |
| Samsung Galaxy Book5 Pro 360 | |
| Average of class Office (2049 - 13541, n=63, last 2 years) | |
| CrossMark / Overall | |
| MSI Summit A16 AI Plus A3HMTG | |
| Acer Swift 16 AI SF16-51T-932H, Ultra 9 288V | |
| Lenovo Yoga 7 2-in-1 16ILL10 | |
| Average Intel Core Ultra 9 288V, Intel Arc Graphics 140V (1654 - 1740, n=4) | |
| Ninkear A16 Pro | |
| LG Gram Pro 16Z90TS-G.AU89G | |
| Samsung Galaxy Book5 Pro 360 | |
| Average of class Office (381 - 2010, n=74, last 2 years) | |
| CrossMark / Productivity | |
| Acer Swift 16 AI SF16-51T-932H, Ultra 9 288V | |
| Average Intel Core Ultra 9 288V, Intel Arc Graphics 140V (1609 - 1693, n=4) | |
| Lenovo Yoga 7 2-in-1 16ILL10 | |
| MSI Summit A16 AI Plus A3HMTG | |
| LG Gram Pro 16Z90TS-G.AU89G | |
| Ninkear A16 Pro | |
| Samsung Galaxy Book5 Pro 360 | |
| Average of class Office (464 - 1880, n=74, last 2 years) | |
| CrossMark / Creativity | |
| MSI Summit A16 AI Plus A3HMTG | |
| Acer Swift 16 AI SF16-51T-932H, Ultra 9 288V | |
| Lenovo Yoga 7 2-in-1 16ILL10 | |
| Average Intel Core Ultra 9 288V, Intel Arc Graphics 140V (1862 - 1966, n=4) | |
| LG Gram Pro 16Z90TS-G.AU89G | |
| Ninkear A16 Pro | |
| Samsung Galaxy Book5 Pro 360 | |
| Average of class Office (319 - 2361, n=74, last 2 years) | |
| CrossMark / Responsiveness | |
| Ninkear A16 Pro | |
| MSI Summit A16 AI Plus A3HMTG | |
| Acer Swift 16 AI SF16-51T-932H, Ultra 9 288V | |
| Lenovo Yoga 7 2-in-1 16ILL10 | |
| Samsung Galaxy Book5 Pro 360 | |
| Average Intel Core Ultra 9 288V, Intel Arc Graphics 140V (1259 - 1314, n=4) | |
| Average of class Office (360 - 1690, n=74, last 2 years) | |
| LG Gram Pro 16Z90TS-G.AU89G | |
| WebXPRT 3 / Overall | |
| Average Intel Core Ultra 9 288V, Intel Arc Graphics 140V (297 - 421, n=2) | |
| MSI Summit A16 AI Plus A3HMTG | |
| Lenovo Yoga 7 2-in-1 16ILL10 | |
| Ninkear A16 Pro | |
| Acer Swift 16 AI SF16-51T-932H, Ultra 9 288V | |
| Average of class Office (129.9 - 455, n=73, last 2 years) | |
| Samsung Galaxy Book5 Pro 360 | |
| LG Gram Pro 16Z90TS-G.AU89G | |
| WebXPRT 4 / Overall | |
| Average Intel Core Ultra 9 288V, Intel Arc Graphics 140V (282 - 342, n=2) | |
| Lenovo Yoga 7 2-in-1 16ILL10 | |
| Acer Swift 16 AI SF16-51T-932H, Ultra 9 288V | |
| LG Gram Pro 16Z90TS-G.AU89G | |
| MSI Summit A16 AI Plus A3HMTG | |
| Samsung Galaxy Book5 Pro 360 | |
| Ninkear A16 Pro | |
| Average of class Office (104.2 - 313, n=75, last 2 years) | |
| Mozilla Kraken 1.1 / Total | |
| Average of class Office (391 - 1297, n=76, last 2 years) | |
| Ninkear A16 Pro | |
| Samsung Galaxy Book5 Pro 360 | |
| LG Gram Pro 16Z90TS-G.AU89G | |
| Lenovo Yoga 7 2-in-1 16ILL10 | |
| Acer Swift 16 AI SF16-51T-932H, Ultra 9 288V | |
| Average Intel Core Ultra 9 288V, Intel Arc Graphics 140V (n=1) | |
| MSI Summit A16 AI Plus A3HMTG | |
* ... smaller is better
| PCMark 10 Score | 7155 points | |
Help | ||
| AIDA64 / Memory Copy | |
| Average Intel Core Ultra 9 288V (108104 - 109734, n=5) | |
| Acer Swift 16 AI SF16-51T-932H, Ultra 9 288V | |
| LG Gram Pro 16Z90TS-G.AU89G | |
| Samsung Galaxy Book5 Pro 360 | |
| Lenovo Yoga 7 2-in-1 16ILL10 | |
| MSI Summit A16 AI Plus A3HMTG | |
| Ninkear A16 Pro | |
| Average of class Office (20075 - 110930, n=76, last 2 years) | |
| AIDA64 / Memory Read | |
| MSI Summit A16 AI Plus A3HMTG | |
| Lenovo Yoga 7 2-in-1 16ILL10 | |
| Average Intel Core Ultra 9 288V (86694 - 89573, n=5) | |
| Acer Swift 16 AI SF16-51T-932H, Ultra 9 288V | |
| LG Gram Pro 16Z90TS-G.AU89G | |
| Samsung Galaxy Book5 Pro 360 | |
| Average of class Office (10084 - 128030, n=77, last 2 years) | |
| Ninkear A16 Pro | |
| AIDA64 / Memory Write | |
| Lenovo Yoga 7 2-in-1 16ILL10 | |
| Average Intel Core Ultra 9 288V (113427 - 117889, n=5) | |
| Acer Swift 16 AI SF16-51T-932H, Ultra 9 288V | |
| LG Gram Pro 16Z90TS-G.AU89G | |
| Samsung Galaxy Book5 Pro 360 | |
| MSI Summit A16 AI Plus A3HMTG | |
| Ninkear A16 Pro | |
| Average of class Office (20073 - 119858, n=77, last 2 years) | |
| AIDA64 / Memory Latency | |
| MSI Summit A16 AI Plus A3HMTG | |
| Ninkear A16 Pro | |
| Average of class Office (7.6 - 162.9, n=72, last 2 years) | |
| Lenovo Yoga 7 2-in-1 16ILL10 | |
| Average Intel Core Ultra 9 288V (97.9 - 99, n=5) | |
| Acer Swift 16 AI SF16-51T-932H, Ultra 9 288V | |
| LG Gram Pro 16Z90TS-G.AU89G | |
| Samsung Galaxy Book5 Pro 360 | |
* ... smaller is better
DPC 延迟
在短时间内 检查 DPC 延迟在 LatencyMon 的帮助下,可以发现实时音频处理可能存在的问题。
| DPC Latencies / LatencyMon - interrupt to process latency (max), Web, Youtube, Prime95 | |
| MSI Summit A16 AI Plus A3HMTG | |
| Acer Swift 16 AI SF16-51T-932H, Ultra 9 288V | |
| Ninkear A16 Pro | |
| Samsung Galaxy Book5 Pro 360 | |
| Lenovo Yoga 7 2-in-1 16ILL10 | |
* ... smaller is better
存储
测试设备配备了两块 1 TB Western Digital PC SN5000S 固态硬盘,数据传输速度相当不错。我们确实注意到在长时间大负荷运行时会出现轻微的热节流现象,但由此导致的性能下降并不明显。

* ... smaller is better
Continuous read: DiskSpd Read Loop, Queue Depth 8
GPU
集成 英特尔弧形图形 140V是目前同类产品中最强大的图形解决方案之一,这一点在 Swift 16 AI 中也很明显。与其他 iGPU 相比,它在合成基准测试和游戏中都能提供出色的性能。在全高清分辨率(1920x1080 像素)、中高画质设置下,其性能通常足以应付游戏。Core Ultra 9 288V 的 32 GB 内存 酷睿至尊 9 288V的 32GB 内存在这方面也有积极作用,因为 iGPU 占用了部分内存用于图形计算。
| 3DMark 11 Performance | 11856 points | |
| 3DMark Cloud Gate Standard Score | 33467 points | |
| 3DMark Fire Strike Score | 9218 points | |
| 3DMark Time Spy Score | 4539 points | |
| 3DMark Steel Nomad Light Score | 3407 points | |
Help | ||
| Baldur's Gate 3 - 1920x1080 Ultra Preset AA:T | |
| Lenovo Yoga 7 2-in-1 16ILL10 | |
| MSI Summit A16 AI Plus A3HMTG | |
| Ninkear A16 Pro | |
| LG Gram Pro 16Z90TS-G.AU89G | |
| Samsung Galaxy Book5 Pro 360 | |
| Average of class Office (3.5 - 65.2, n=62, last 2 years) | |
| GTA V - 1920x1080 Highest AA:4xMSAA + FX AF:16x | |
| MSI Summit A16 AI Plus A3HMTG | |
| Acer Swift 16 AI SF16-51T-932H, Ultra 9 288V | |
| Ninkear A16 Pro | |
| Samsung Galaxy Book5 Pro 360 | |
| LG Gram Pro 16Z90TS-G.AU89G | |
| Average of class Office (5.77 - 45.3, n=65, last 2 years) | |
| low | med. | high | ultra | |
|---|---|---|---|---|
| GTA V (2015) | 156.2 | 149.3 | 74.5 | 28.9 |
| Dota 2 Reborn (2015) | 101.4 | 91.6 | 67.1 | 83.6 |
| Final Fantasy XV Benchmark (2018) | 86.3 | 48.1 | 34.4 | |
| X-Plane 11.11 (2018) | 48.6 | 39.3 | 37.2 | |
| Strange Brigade (2018) | 194.7 | 80.2 | 67.7 | 58 |
| Cyberpunk 2077 (2023) | 41.6 | 38.3 | 31.9 | 26.9 |
排放与能源
噪音排放
宏碁 Swift 16 AI 在日常使用中非常安静,甚至经常保持几乎无声的状态。在压力测试等情况下,当系统处于极度紧张状态时,风扇音量可达到 41.1 dB(A)。如果切换到 Turbo 模式,最高音量可达 44.4 dB(A)。
Noise level
| Idle |
| 25.8 / 25.8 / 26.7 dB(A) |
| Load |
| / 41.1 dB(A) |
 | ||
30 dB silent 40 dB(A) audible 50 dB(A) loud |
||
min: | ||
| Acer Swift 16 AI SF16-51T-932H, Ultra 9 288V Arc 140V, Core Ultra 9 288V, Western Digital PC SN5000S SDEQNSJ-1T00 | Lenovo Yoga 7 2-in-1 16ILL10 Arc 140V, Core Ultra 7 256V, WD PC SN7100S SDFPMSL-512G-1101 | LG Gram Pro 16Z90TS-G.AU89G Arc 140V, Core Ultra 7 256V, Samsung PM9A1a MZVL21T0HDLU | Samsung Galaxy Book5 Pro 360 Arc 130V, Core Ultra 5 226V, Samsung PM9B1 512GB MZVL4512HBLU | MSI Summit A16 AI Plus A3HMTG Radeon 880M, Ryzen AI 9 365, Samsung PM9C1 MZVL81T0HELB-00BTW | Ninkear A16 Pro Radeon 780M, R7 8845HS, Authorain NV900-1T | |
|---|---|---|---|---|---|---|
| Noise | 7% | 0% | 8% | -6% | 12% | |
| off / environment * (dB) | 25.8 | 23.3 10% | 25.2 2% | 23.6 9% | 23.8 8% | 23 11% |
| Idle Minimum * (dB) | 25.8 | 23.3 10% | 25.2 2% | 23.6 9% | 25 3% | 23 11% |
| Idle Average * (dB) | 25.8 | 23.3 10% | 25.2 2% | 23.6 9% | 25 3% | 23 11% |
| Idle Maximum * (dB) | 26.7 | 25.7 4% | 27.7 -4% | 23.6 12% | 29.5 -10% | 23 14% |
| Cyberpunk 2077 ultra * (dB) | 44.4 | 41.6 6% | 42.6 4% | 40.6 9% | 46.5 -5% | 37.68 15% |
| Load Maximum * (dB) | 41.1 | 41.6 -1% | 42.7 -4% | 40.6 1% | 56.1 -36% | 37.41 9% |
| Load Average * (dB) | 40.2 | 29.4 | 37.5 | 37.68 |
* ... smaller is better
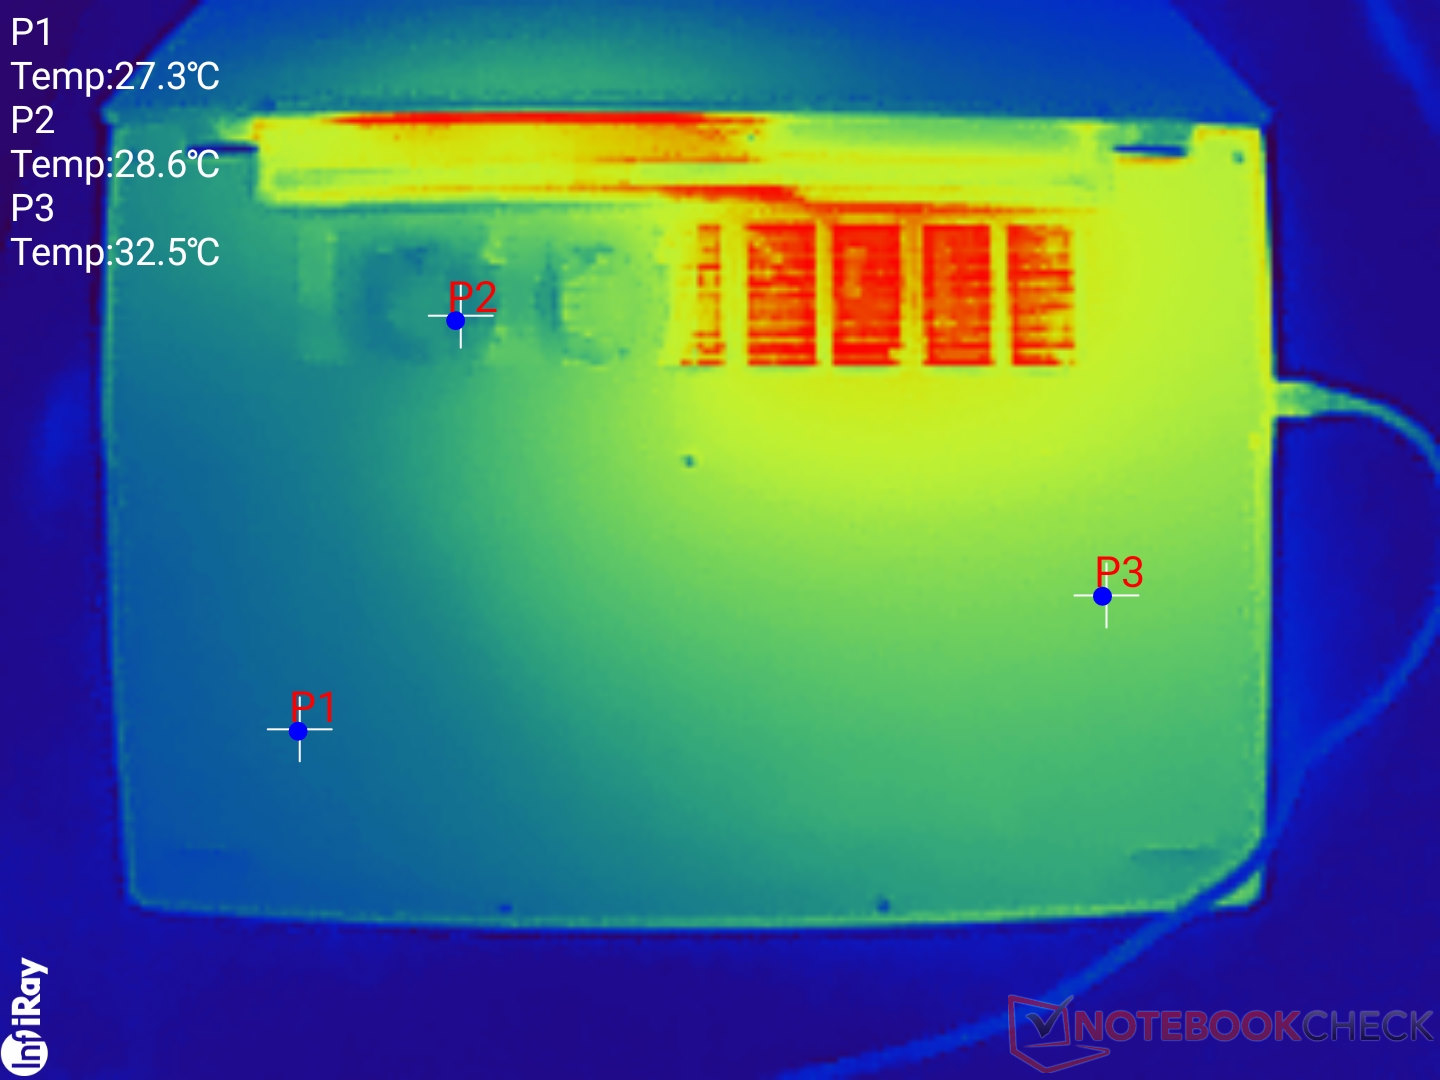
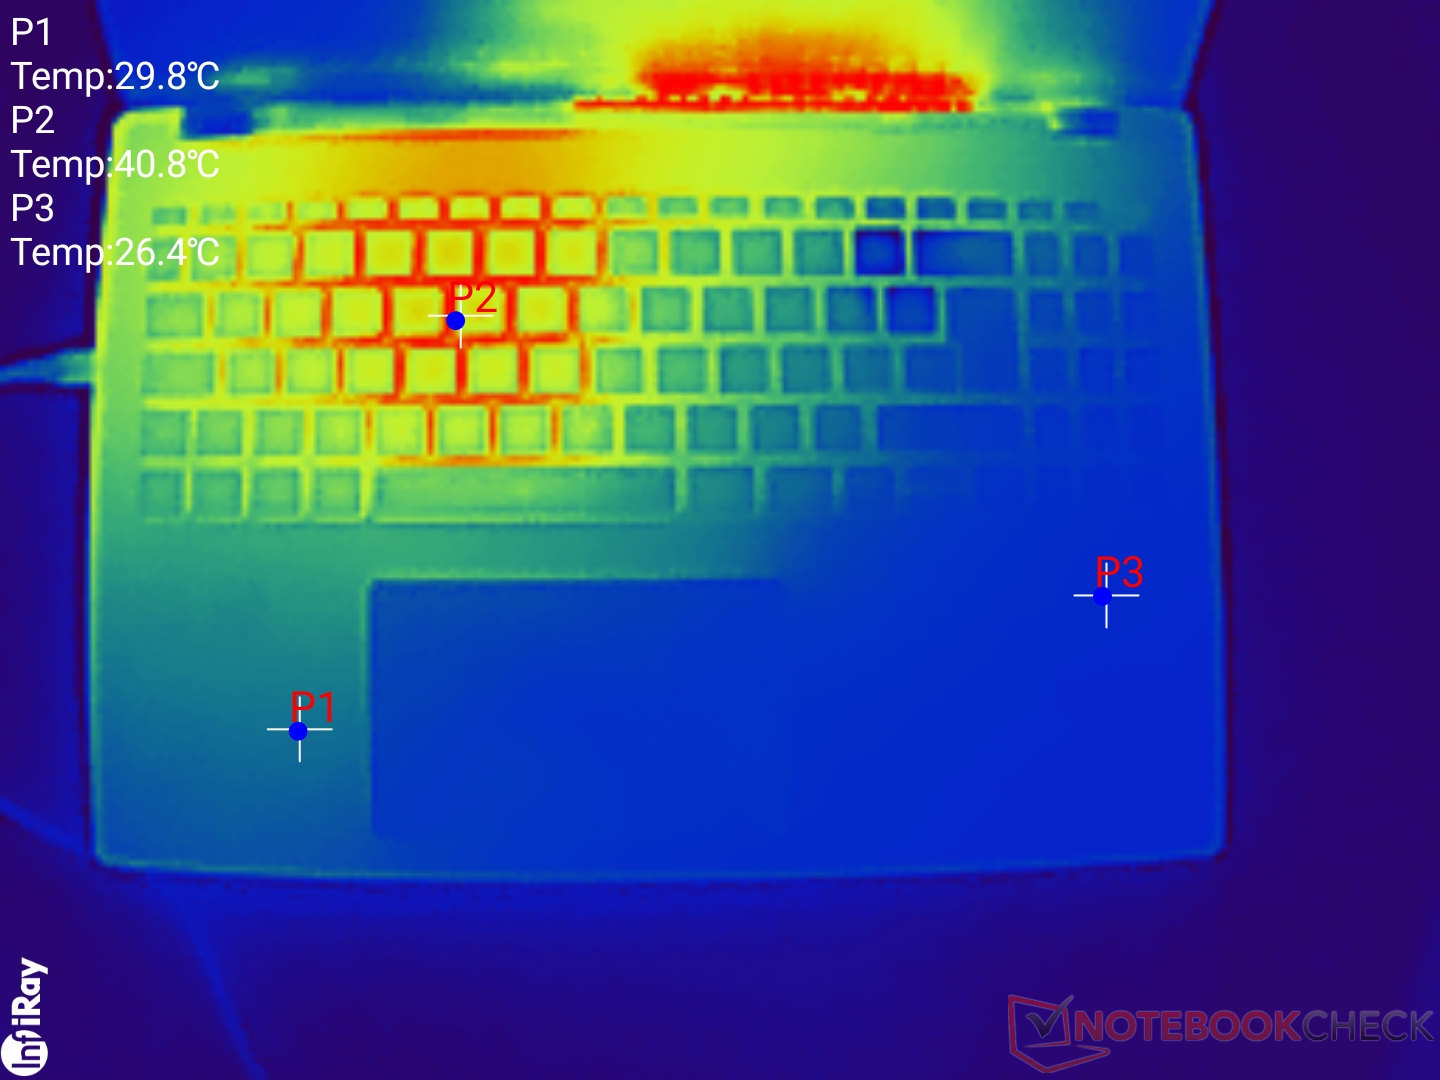
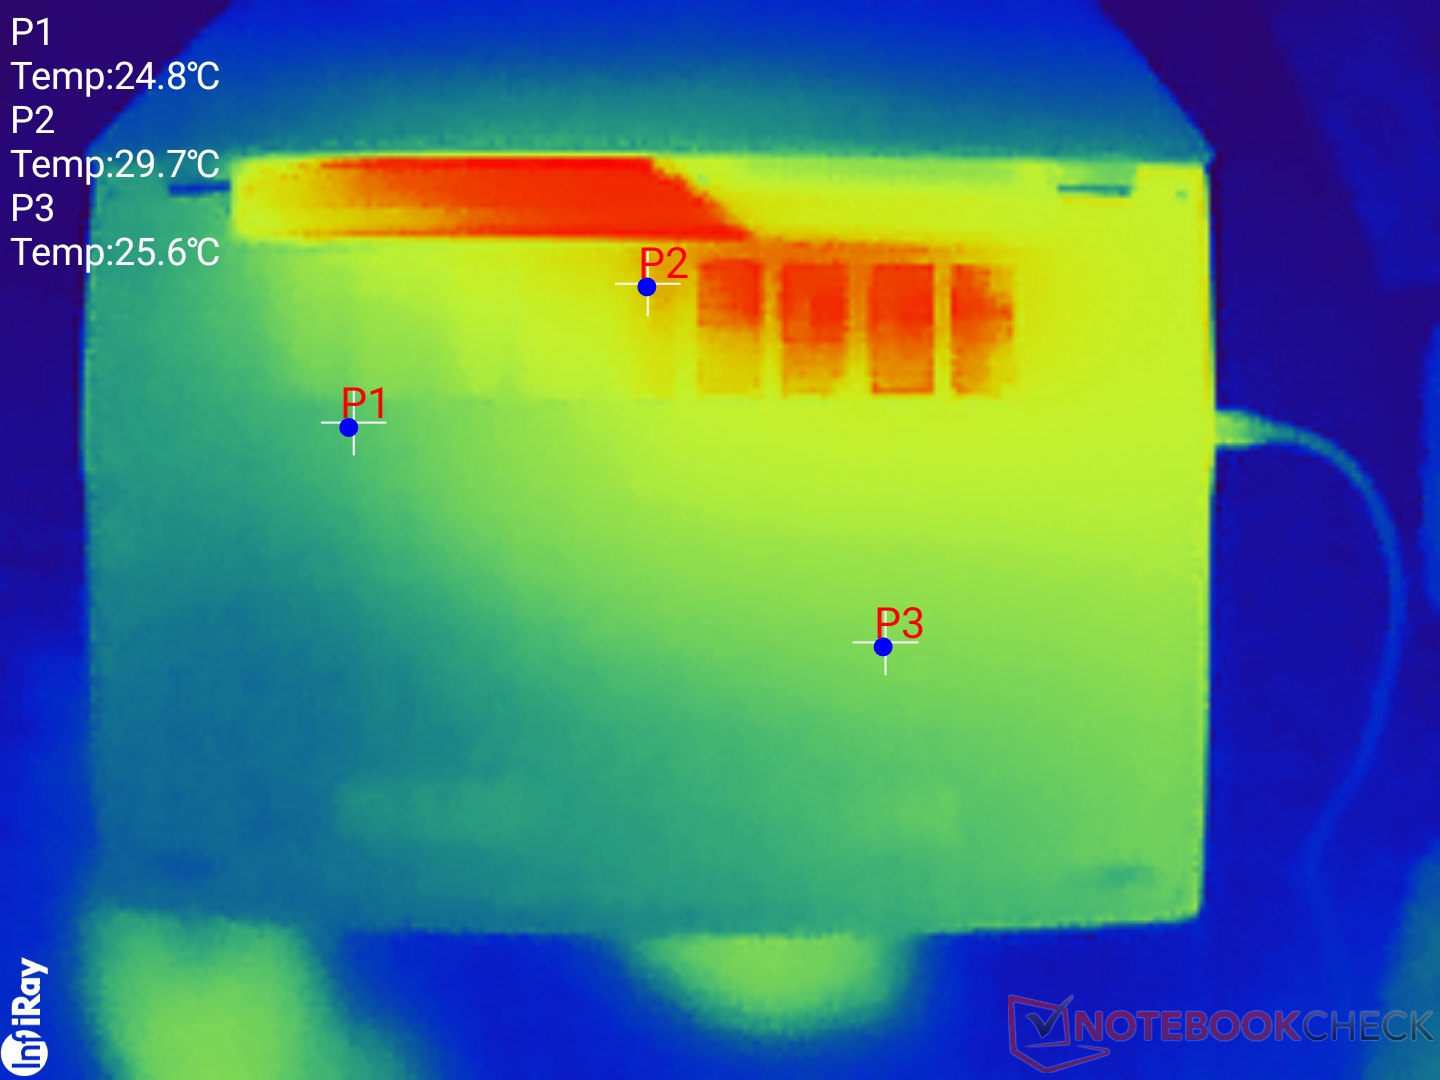
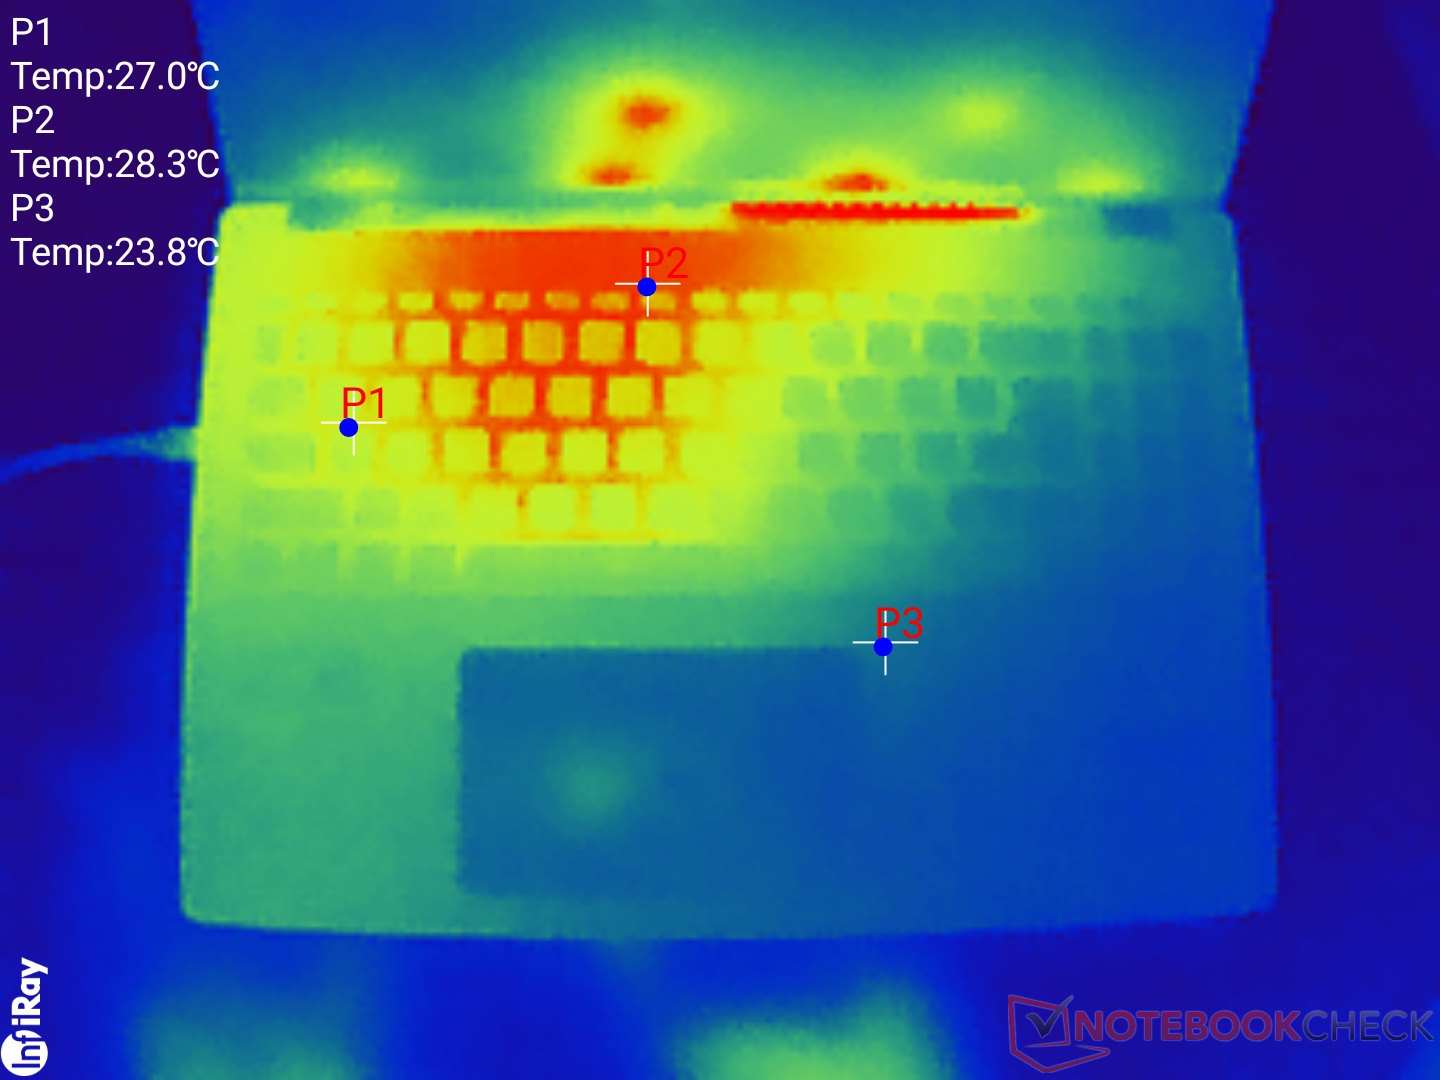
温度
就机箱温度而言,Swift 16 AI 在空转时已经明显发热。在压力测试中,当满负荷运行时,机箱温度会升高,但不会热得让人不舒服。
(+) The maximum temperature on the upper side is 37.9 °C / 100 F, compared to the average of 34.3 °C / 94 F, ranging from 21.2 to 62.5 °C for the class Office.
(+) The bottom heats up to a maximum of 31.5 °C / 89 F, compared to the average of 36.8 °C / 98 F
(+) In idle usage, the average temperature for the upper side is 25.2 °C / 77 F, compared to the device average of 29.5 °C / 85 F.
(+) The palmrests and touchpad are cooler than skin temperature with a maximum of 27.1 °C / 80.8 F and are therefore cool to the touch.
(±) The average temperature of the palmrest area of similar devices was 27.5 °C / 81.5 F (+0.4 °C / 0.7 F).
| Acer Swift 16 AI SF16-51T-932H, Ultra 9 288V Intel Core Ultra 9 288V, Intel Arc Graphics 140V | Lenovo Yoga 7 2-in-1 16ILL10 Intel Core Ultra 7 256V, Intel Arc Graphics 140V | LG Gram Pro 16Z90TS-G.AU89G Intel Core Ultra 7 256V, Intel Arc Graphics 140V | Samsung Galaxy Book5 Pro 360 Intel Core Ultra 5 226V, Intel Arc Graphics 130V | MSI Summit A16 AI Plus A3HMTG AMD Ryzen AI 9 365, AMD Radeon 880M | Ninkear A16 Pro AMD Ryzen 7 8845HS, AMD Radeon 780M | |
|---|---|---|---|---|---|---|
| Heat | -3% | -11% | -4% | -20% | -36% | |
| Maximum Upper Side * (°C) | 37.9 | 42.6 -12% | 40.5 -7% | 40.9 -8% | 52.8 -39% | 43 -13% |
| Maximum Bottom * (°C) | 31.5 | 36.8 -17% | 45 -43% | 45.1 -43% | 42 -33% | 50 -59% |
| Idle Upper Side * (°C) | 28.3 | 26.4 7% | 27.1 4% | 23.8 16% | 30.6 -8% | |
| Idle Bottom * (°C) | 29.7 | 26.6 10% | 28.8 3% | 23.5 21% | 29.6 -0% |
* ... smaller is better
发言人
内置扬声器音质不错,但并不出众。它们足以满足日常使用,声音清晰可辨,可听频率范围相当线性,即相当平衡。只有低频略显克制。
Acer Swift 16 AI SF16-51T-932H, Ultra 9 288V audio analysis
(+) | speakers can play relatively loud (87.1 dB)
Bass 100 - 315 Hz
(-) | nearly no bass - on average 20.9% lower than median
(±) | linearity of bass is average (11.3% delta to prev. frequency)
Mids 400 - 2000 Hz
(±) | higher mids - on average 5.5% higher than median
(+) | mids are linear (5.7% delta to prev. frequency)
Highs 2 - 16 kHz
(+) | balanced highs - only 2.7% away from median
(+) | highs are linear (5% delta to prev. frequency)
Overall 100 - 16.000 Hz
(±) | linearity of overall sound is average (16.4% difference to median)
Compared to same class
» 19% of all tested devices in this class were better, 7% similar, 74% worse
» The best had a delta of 7%, average was 21%, worst was 53%
Compared to all devices tested
» 27% of all tested devices were better, 6% similar, 67% worse
» The best had a delta of 4%, average was 24%, worst was 134%
Apple MacBook Pro 16 2021 M1 Pro audio analysis
(+) | speakers can play relatively loud (84.7 dB)
Bass 100 - 315 Hz
(+) | good bass - only 3.8% away from median
(+) | bass is linear (5.2% delta to prev. frequency)
Mids 400 - 2000 Hz
(+) | balanced mids - only 1.3% away from median
(+) | mids are linear (2.1% delta to prev. frequency)
Highs 2 - 16 kHz
(+) | balanced highs - only 1.9% away from median
(+) | highs are linear (2.7% delta to prev. frequency)
Overall 100 - 16.000 Hz
(+) | overall sound is linear (4.6% difference to median)
Compared to same class
» 0% of all tested devices in this class were better, 0% similar, 100% worse
» The best had a delta of 5%, average was 17%, worst was 45%
Compared to all devices tested
» 0% of all tested devices were better, 0% similar, 100% worse
» The best had a delta of 4%, average was 24%, worst was 134%
耗电量
功耗符合对所安装硬件和所提供性能的预期。Swift 16 既不过分经济,也不异常耗电。待机模式下的功耗偶尔相对较高,为 1.1 瓦。
| Off / Standby | |
| Idle | |
| Load |
|
Key:
min: | |
| Acer Swift 16 AI SF16-51T-932H, Ultra 9 288V Core Ultra 9 288V, Arc 140V, Western Digital PC SN5000S SDEQNSJ-1T00, OLED, 2880x1800, 16" | Lenovo Yoga 7 2-in-1 16ILL10 Core Ultra 7 256V, Arc 140V, WD PC SN7100S SDFPMSL-512G-1101, IPS, 1920x1200, 16" | LG Gram Pro 16Z90TS-G.AU89G Core Ultra 7 256V, Arc 140V, Samsung PM9A1a MZVL21T0HDLU, IPS, 2560x1600, 16" | Samsung Galaxy Book5 Pro 360 Core Ultra 5 226V, Arc 130V, Samsung PM9B1 512GB MZVL4512HBLU, OLED, 2880x1800, 16" | MSI Summit A16 AI Plus A3HMTG Ryzen AI 9 365, Radeon 880M, Samsung PM9C1 MZVL81T0HELB-00BTW, IPS, 2560x1600, 16" | Ninkear A16 Pro R7 8845HS, Radeon 780M, Authorain NV900-1T, IPS, 2560x1600, 16" | Average Intel Arc Graphics 140V | Average of class Office | |
|---|---|---|---|---|---|---|---|---|
| Power Consumption | 2% | 2% | 7% | -30% | -42% | 14% | 5% | |
| Idle Minimum * (Watt) | 5.7 | 4.2 26% | 4.15 27% | 5.3 7% | 5.4 5% | 6.5 -14% | 3.72 ? 35% | 4.4 ? 23% |
| Idle Average * (Watt) | 7.4 | 8.3 -12% | 5.4 27% | 6.7 9% | 11 -49% | 10.7 -45% | 6.2 ? 16% | 7.32 ? 1% |
| Idle Maximum * (Watt) | 7.9 | 9.5 -20% | 12.4 -57% | 7.3 8% | 11.2 -42% | 11.1 -41% | 8.14 ? -3% | 8.56 ? -8% |
| Cyberpunk 2077 ultra * (Watt) | 49.8 | 47.4 5% | 48.2 3% | 44.6 10% | 61.1 -23% | 72.8 -46% | ||
| Load Maximum * (Watt) | 65.41 | 59 10% | 60.049 8% | 64.1 2% | 91.8 -40% | 107 -64% | 60.3 ? 8% | 64.1 ? 2% |
| Load Average * (Watt) | 40.3 | 37.6 | 76.6 | 68.5 | 39.2 ? | 42.5 ? | ||
| Cyberpunk 2077 ultra external monitor * (Watt) | 40.8 | 48.1 | 42.8 | 49.2 | 104.4 |
* ... smaller is better
Power consumtion Cyberpunk / Stresstest
电池寿命
宏碁 Swift 16 AI 的 70 Wh 电池确保了良好的续航能力。在 Wi-Fi 网上冲浪测试中,这款笔记本的续航时间达到了 13 小时。这是一款物有所值的产品,可以满足一天的工作或学习需求。
| Acer Swift 16 AI SF16-51T-932H, Ultra 9 288V Core Ultra 9 288V, Arc 140V, 70 Wh | Lenovo Yoga 7 2-in-1 16ILL10 Core Ultra 7 256V, Arc 140V, 70 Wh | LG Gram Pro 16Z90TS-G.AU89G Core Ultra 7 256V, Arc 140V, 77 Wh | Samsung Galaxy Book5 Pro 360 Core Ultra 5 226V, Arc 130V, 76 Wh | MSI Summit A16 AI Plus A3HMTG Ryzen AI 9 365, Radeon 880M, 82 Wh | Ninkear A16 Pro R7 8845HS, Radeon 780M, 80 Wh | Average of class Office | |
|---|---|---|---|---|---|---|---|
| Battery runtime | 52% | 48% | -18% | -31% | -43% | -2% | |
| WiFi v1.3 (h) | 13.2 | 20 52% | 19.6 48% | 10.8 -18% | 9.1 -31% | 7.5 -43% | 12.9 ? -2% |
| H.264 (h) | 19.7 | 15 ? | |||||
| Load (h) | 2.1 | 1.5 | 1.807 ? |
Notebookcheck 总体评分
宏碁 Swift 16 AI 是一款功能强大的笔记本电脑,其出色的外壳和绚丽的 OLED 显示屏让人眼前一亮。如果有什么值得批评的地方,那很可能就是扬声器了。
Acer Swift 16 AI SF16-51T-932H, Ultra 9 288V
- 05/09/2025 v8
Marc Herter
 Total Sustainability Score:
 可能的替代方案
Transparency
The selection of devices to be reviewed is made by our editorial team. The test sample was provided to the author as a loan by the manufacturer or retailer for the purpose of this review. The lender had no influence on this review, nor did the manufacturer receive a copy of this review before publication. There was no obligation to publish this review. As an independent media company, Notebookcheck is not subjected to the authority of manufacturers, retailers or publishers.
This is how Notebookcheck is testing
Every year, Notebookcheck independently reviews hundreds of laptops and smartphones using standardized procedures to ensure that all results are comparable. We have continuously developed our test methods for around 20 years and set industry standards in the process. In our test labs, high-quality measuring equipment is utilized by experienced technicians and editors. These tests involve a multi-stage validation process. Our complex rating system is based on hundreds of well-founded measurements and benchmarks, which maintains objectivity. Further information on our test methods can be found here.
