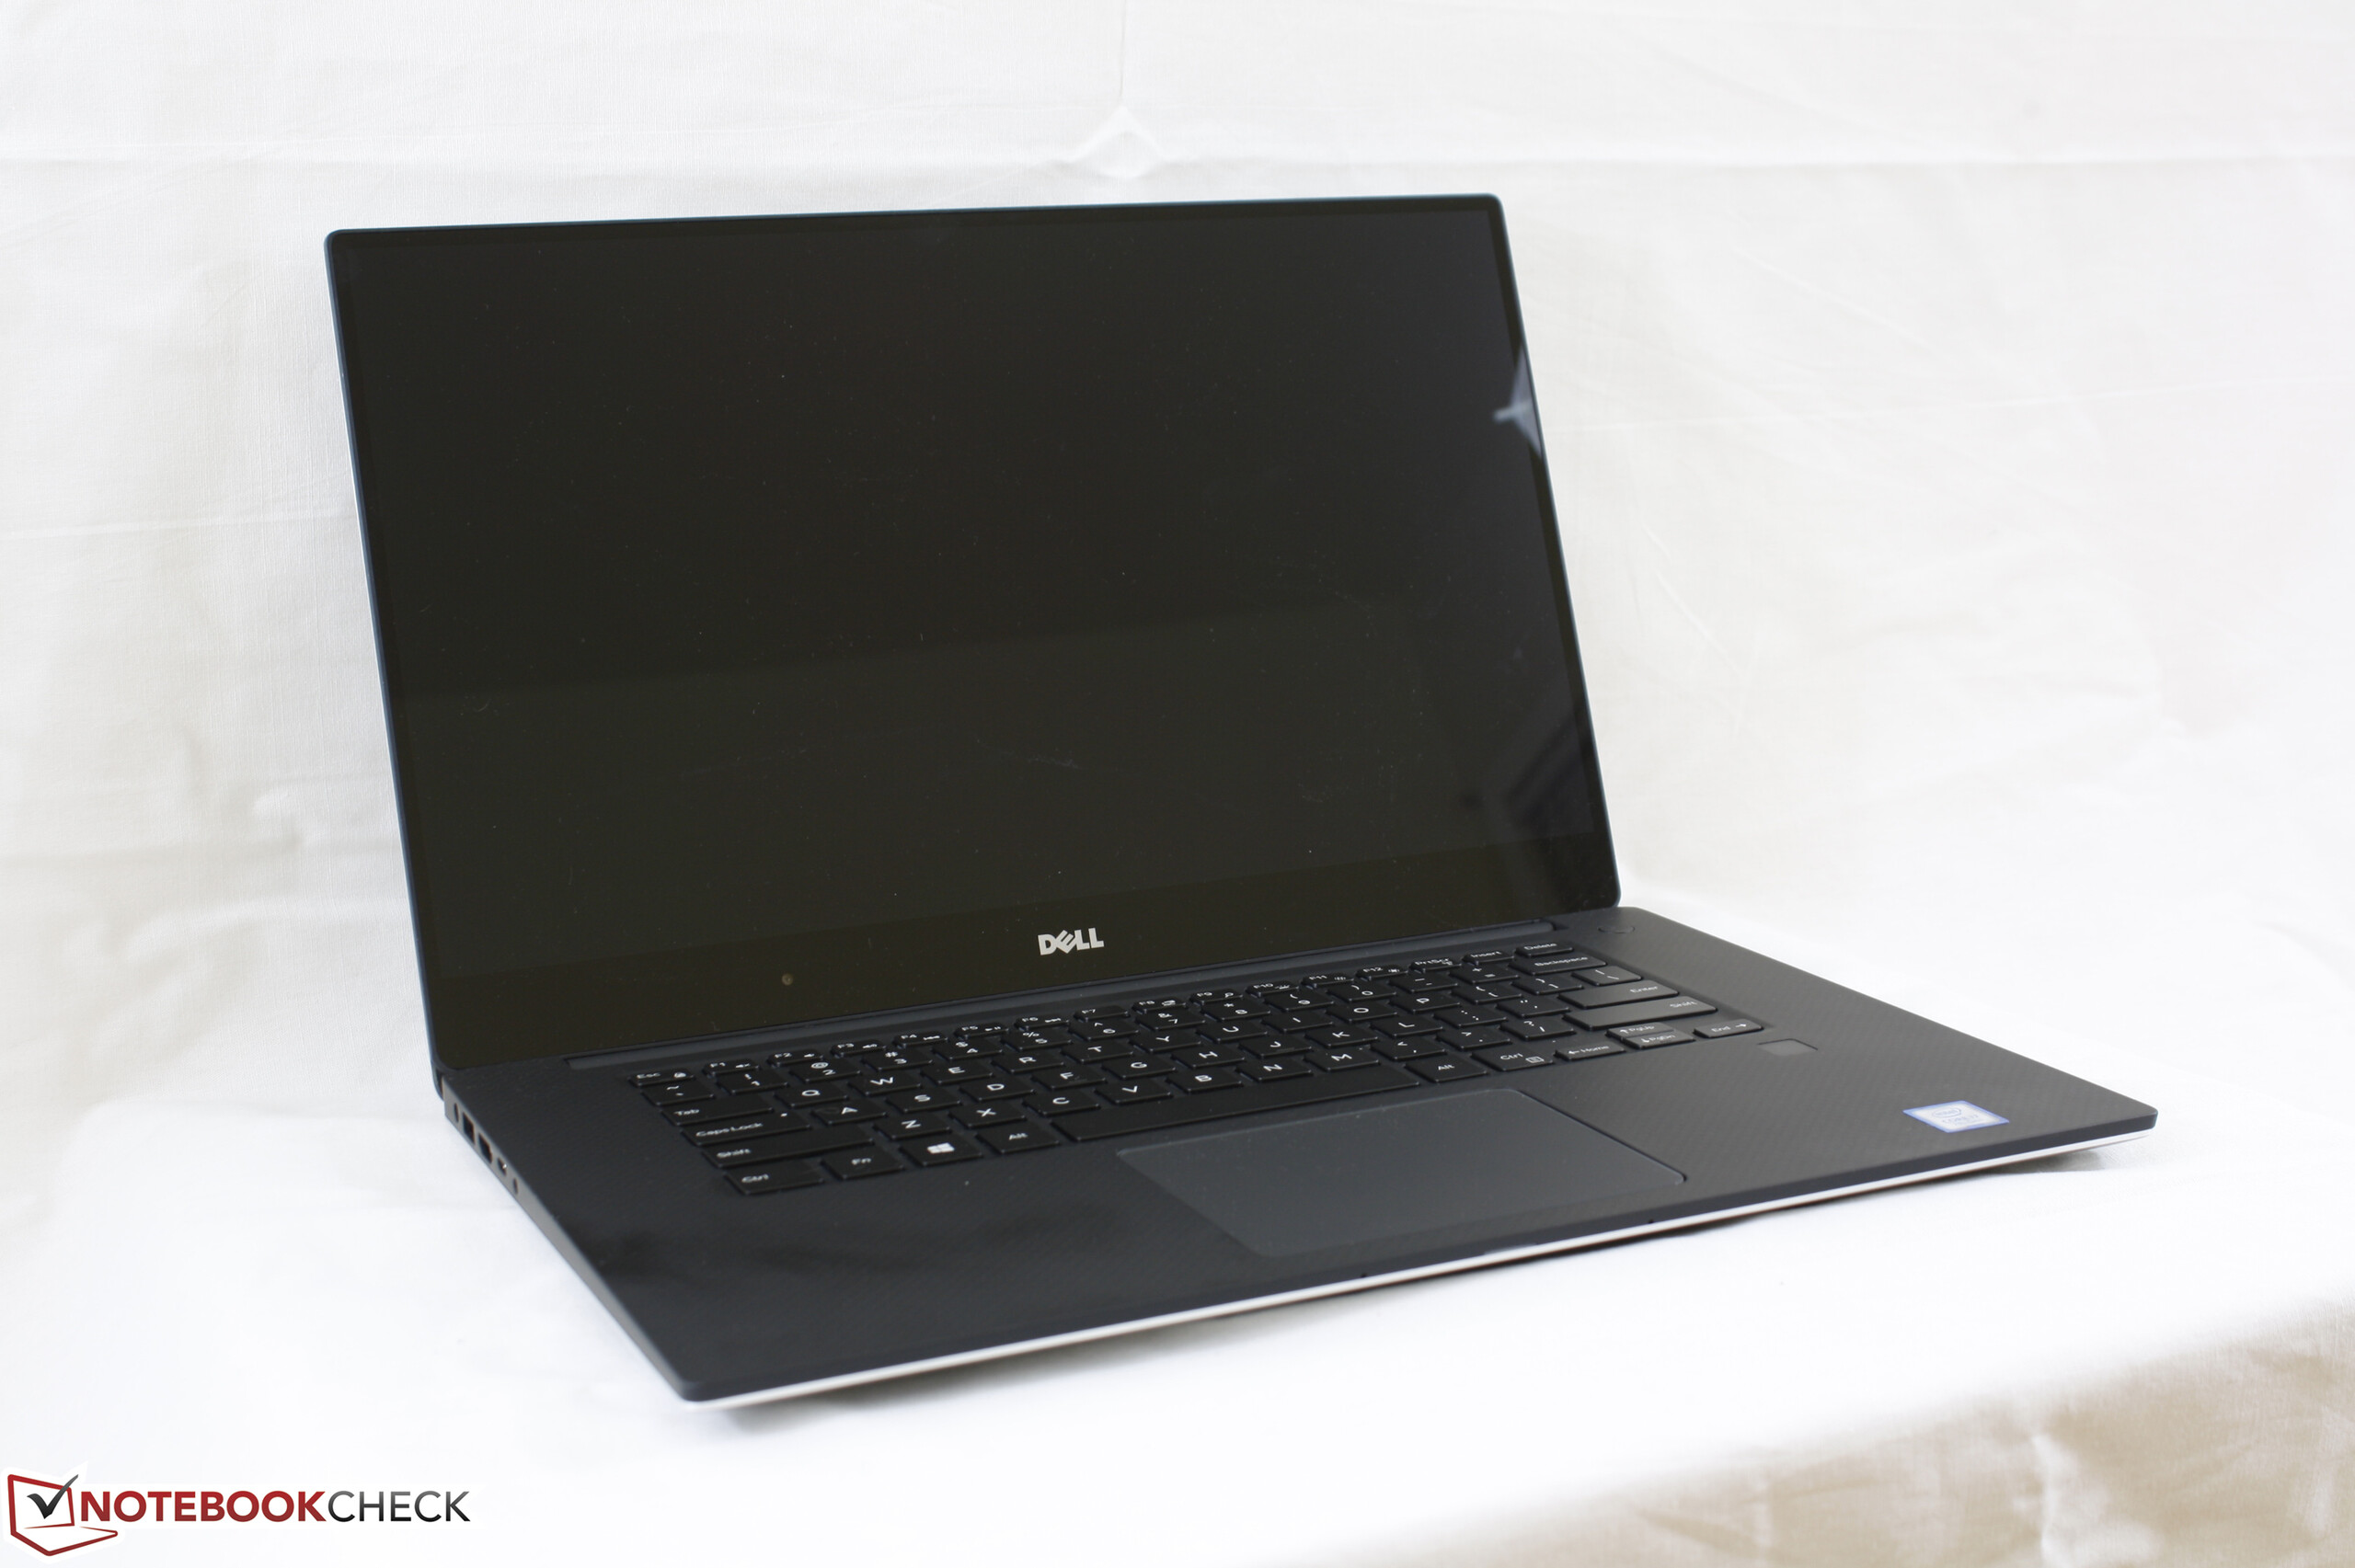
戴尔 XPS 15 9560 (i7-7700HQ, UHD) 笔记本简短评测


| SD Card Reader | |
| average JPG Copy Test (av. of 3 runs) | |
| HP Spectre x360 15-bl002xx | |
| Dell XPS 15 9560 (i7-7700HQ, UHD) | |
| Asus FX502VM-AS73 | |
| maximum AS SSD Seq Read Test (1GB) | |
| Dell XPS 15 9560 (i7-7700HQ, UHD) | |
| HP Spectre x360 15-bl002xx | |
| Asus FX502VM-AS73 | |
| Networking | |
| iperf3 transmit AX12 | |
| Dell XPS 15 9560 (i7-7700HQ, UHD) | |
| Asus FX502VM-AS73 | |
| HP Spectre x360 15-bl002xx | |
| iperf3 receive AX12 | |
| Dell XPS 15 9560 (i7-7700HQ, UHD) | |
| HP Spectre x360 15-bl002xx | |
| Asus FX502VM-AS73 | |
| |||||||||||||||||||||||||
Brightness Distribution: 87 %
Center on Battery: 370.1 cd/m²
Contrast: 1000:1 (Black: 0.37 cd/m²)
ΔE ColorChecker Calman: 5.3 | ∀{0.5-29.43 Ø4.71}
ΔE Greyscale Calman: 4.6 | ∀{0.09-98 Ø4.96}
100% sRGB (Argyll 1.6.3 3D)
88.3% AdobeRGB 1998 (Argyll 1.6.3 3D)
100% AdobeRGB 1998 (Argyll 3D)
100% sRGB (Argyll 3D)
89.7% Display P3 (Argyll 3D)
Gamma: 2.31
CCT: 6284 K
| Dell XPS 15 9560 (i7-7700HQ, UHD) IGZO IPS, 15.6", 3840x2160 | Asus FX502VM-AS73 TN LED, 15.6", 1920x1080 | Apple MacBook Pro 15 2016 (2.9 GHz, 460) Apple APPA030, IPS, 15.4", 2880x1800 | HP Spectre x360 15-bl002xx UHD UWVA eDP BrightView WLED-backlit , IPS, 15.6", 3840x2160 | Dell XPS 15 2017 9560 (7300HQ, Full-HD) Sharp SHP1453 LQ156M1, LED IGZO IPS InfinityEdge, 15.6", 1920x1080 | |
|---|---|---|---|---|---|
| Display | -54% | -1% | -24% | -18% | |
| Display P3 Coverage (%) | 89.7 | 38.28 -57% | 99 10% | 67.9 -24% | 68.9 -23% |
| sRGB Coverage (%) | 100 | 56.9 -43% | 100 0% | 88.2 -12% | 98.9 -1% |
| AdobeRGB 1998 Coverage (%) | 100 | 39.47 -61% | 87.3 -13% | 64.4 -36% | 70.9 -29% |
| Response Times | 47% | -12% | 12% | -14% | |
| Response Time Grey 50% / Grey 80% * (ms) | 57.2 ? | 28.4 ? 50% | 46 ? 20% | 44 ? 23% | 54 ? 6% |
| Response Time Black / White * (ms) | 39.2 ? | 22.4 ? 43% | 56 ? -43% | 38.8 ? 1% | 52.4 ? -34% |
| PWM Frequency (Hz) | 962 | 119000 ? | 1000 ? | ||
| Screen | -36% | 20% | 15% | 2% | |
| Brightness middle (cd/m²) | 370.1 | 209.5 -43% | 420 13% | 351.5 -5% | 400 8% |
| Brightness (cd/m²) | 356 | 205 -42% | 401 13% | 336 -6% | 392 10% |
| Brightness Distribution (%) | 87 | 92 6% | 90 3% | 83 -5% | 89 2% |
| Black Level * (cd/m²) | 0.37 | 0.69 -86% | 0.3 19% | 0.24 35% | 0.26 30% |
| Contrast (:1) | 1000 | 304 -70% | 1400 40% | 1465 47% | 1538 54% |
| Colorchecker dE 2000 * | 5.3 | 4.7 11% | 3.33 37% | 3.3 38% | 4.9 8% |
| Colorchecker dE 2000 max. * | 9.9 | 19.7 -99% | 5.11 48% | 7.3 26% | 11 -11% |
| Greyscale dE 2000 * | 4.6 | 1.8 61% | 2.73 41% | 1.9 59% | 7.2 -57% |
| Gamma | 2.31 95% | 2.23 99% | 2.48 89% | 2.09 105% | 2.11 104% |
| CCT | 6284 103% | 6975 93% | 6457 101% | 6784 96% | 6911 94% |
| Color Space (Percent of AdobeRGB 1998) (%) | 88.3 | 36.2 -59% | 78.09 -12% | 64.4 -27% | 64.2 -27% |
| Color Space (Percent of sRGB) (%) | 100 | 56.6 -43% | 99.97 0% | 88.2 -12% | 98.9 -1% |
| Total Average (Program / Settings) | -14% /
-29% | 2% /
12% | 1% /
7% | -10% /
-4% |
* ... smaller is better
Display Response Times
| ↔ Response Time Black to White | ||
|---|---|---|
| 39.2 ms ... rise ↗ and fall ↘ combined | ↗ 23.6 ms rise | 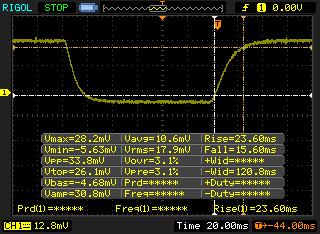 |
| ↘ 15.6 ms fall | ||
| The screen shows slow response rates in our tests and will be unsatisfactory for gamers. In comparison, all tested devices range from 0.1 (minimum) to 240 (maximum) ms. » 97 % of all devices are better. This means that the measured response time is worse than the average of all tested devices (19.8 ms). | ||
| ↔ Response Time 50% Grey to 80% Grey | ||
| 57.2 ms ... rise ↗ and fall ↘ combined | ↗ 27.2 ms rise | 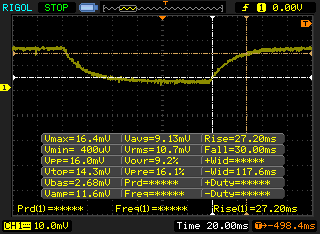 |
| ↘ 30 ms fall | ||
| The screen shows slow response rates in our tests and will be unsatisfactory for gamers. In comparison, all tested devices range from 0.165 (minimum) to 636 (maximum) ms. » 94 % of all devices are better. This means that the measured response time is worse than the average of all tested devices (31 ms). | ||
Screen Flickering / PWM (Pulse-Width Modulation)
| Screen flickering / PWM detected | 962 Hz | 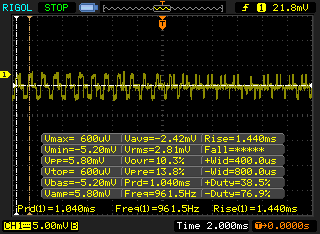 | |
The display backlight flickers at 962 Hz (worst case, e.g., utilizing PWM) . The frequency of 962 Hz is quite high, so most users sensitive to PWM should not notice any flickering. In comparison: 52 % of all tested devices do not use PWM to dim the display. If PWM was detected, an average of 7757 (minimum: 5 - maximum: 343500) Hz was measured. | |||
| Cinebench R11.5 | |
| CPU Single 64Bit | |
| Apple MacBook Pro 15 2016 (2.9 GHz, 460) | |
| MSI GT62VR 7RE-223 | |
| Dell XPS 15 9560 (i7-7700HQ, UHD) | |
| Eurocom Sky X7E2 | |
| MSI GE62 2QC-468XPL | |
| Asus GL702VM-GC102D | |
| Toshiba Satellite S70-B-106 | |
| CPU Multi 64Bit | |
| Eurocom Sky X7E2 | |
| MSI GT62VR 7RE-223 | |
| Dell XPS 15 9560 (i7-7700HQ, UHD) | |
| MSI GE62 2QC-468XPL | |
| Apple MacBook Pro 15 2016 (2.9 GHz, 460) | |
| Asus GL702VM-GC102D | |
| Toshiba Satellite S70-B-106 | |
| Cinebench R10 | |
| Rendering Multiple CPUs 32Bit | |
| Eurocom Sky X7E2 | |
| Apple MacBook Pro 15 2016 (2.9 GHz, 460) | |
| MSI GT62VR 7RE-223 | |
| MSI GE62 2QC-468XPL | |
| Dell XPS 15 9560 (i7-7700HQ, UHD) | |
| Asus GL702VM-GC102D | |
| Rendering Single 32Bit | |
| Eurocom Sky X7E2 | |
| Apple MacBook Pro 15 2016 (2.9 GHz, 460) | |
| MSI GT62VR 7RE-223 | |
| Dell XPS 15 9560 (i7-7700HQ, UHD) | |
| MSI GE62 2QC-468XPL | |
| Asus GL702VM-GC102D | |
| wPrime 2.10 - 1024m | |
| Apple MacBook Pro 15 2016 (2.9 GHz, 460) | |
| Dell XPS 15 9560 (i7-7700HQ, UHD) | |
| MSI GE62 2QC-468XPL | |
| Eurocom Sky X7E2 | |
* ... smaller is better
| PCMark 8 Home Score Accelerated v2 | 3588 points | |
| PCMark 8 Creative Score Accelerated v2 | 5114 points | |
| PCMark 8 Work Score Accelerated v2 | 4422 points | |
Help | ||
| Dell XPS 15 9560 (i7-7700HQ, UHD) Lite-On CX2-8B512-Q11 | Asus FX502VM-AS73 SK Hynix HFS256G39TND-N210A | Apple MacBook Pro 15 2016 (2.9 GHz, 460) Apple SSD SM1024L | HP Spectre x360 15-bl002xx Toshiba XG4 NVMe (THNSN5512GPUK) | Dell Latitude 15 E5570 Samsung SSD PM871 MZ7LN128HCHP | |
|---|---|---|---|---|---|
| CrystalDiskMark 3.0 | -62% | -11% | -11% | -58% | |
| Read Seq (MB/s) | 1684 | 503 -70% | 1458 -13% | 1266 -25% | 474.7 -72% |
| Write Seq (MB/s) | 1106 | 138.2 -88% | 1440 30% | 982 -11% | 155 -86% |
| Read 512 (MB/s) | 977 | 343.5 -65% | 914 -6% | 834 -15% | 393.6 -60% |
| Write 512 (MB/s) | 1119 | 137.8 -88% | 1058 -5% | 714 -36% | 119.7 -89% |
| Read 4k (MB/s) | 45.14 | 29.36 -35% | 9.786 -78% | 40.72 -10% | 34 -25% |
| Write 4k (MB/s) | 134.1 | 70.9 -47% | 10.9 -92% | 139.4 4% | 96.6 -28% |
| Read 4k QD32 (MB/s) | 509 | 369.9 -27% | 679 33% | 527 4% | 383.3 -25% |
| Write 4k QD32 (MB/s) | 398.1 | 99.7 -75% | 562 41% | 395.2 -1% | 100.2 -75% |

| 3DMark Ice Storm Standard Score | 31054 points | |
| 3DMark Cloud Gate Standard Score | 18212 points | |
| 3DMark Fire Strike Score | 5524 points | |
| 3DMark Fire Strike Extreme Score | 2686 points | |
Help | ||
| Rise of the Tomb Raider - 1920x1080 Very High Preset AA:FX AF:16x | |
| Asus FX502VM-AS73 | |
| MSI GE72 7RE-046 | |
| Zotac GeForce GTX 1050 2GB | |
| Dell XPS 15 9560 (i7-7700HQ, UHD) | |
| Dell XPS 15 9550 i7 FHD | |
| Metro: Last Light - 1920x1080 Very High (DX11) AF:16x | |
| Asus FX502VM-AS73 | |
| Aorus X3 Plus v5 | |
| Zotac GeForce GTX 1050 2GB | |
| Dell XPS 15 9560 (i7-7700HQ, UHD) | |
| Dell XPS 15 9550 i7 FHD | |
| BioShock Infinite - 1920x1080 Ultra Preset, DX11 (DDOF) | |
| Asus FX502VM-AS73 | |
| Aorus X3 Plus v5 | |
| Zotac GeForce GTX 1050 2GB | |
| Dell XPS 15 9560 (i7-7700HQ, UHD) | |
| Dell XPS 15 9550 i7 FHD | |
| Thief - 1920x1080 Very High Preset AA:FXAA & High SS AF:8x | |
| Asus FX502VM-AS73 | |
| Aorus X3 Plus v5 | |
| Dell XPS 15 9560 (i7-7700HQ, UHD) | |
| Dell XPS 15 9550 i7 FHD | |
| Batman: Arkham Knight - 1920x1080 High / On AA:SM AF:16x | |
| MSI GE72 7RE-046 | |
| Dell XPS 15 9560 (i7-7700HQ, UHD) | |
| Dell XPS 15 9550 i7 FHD | |
| Fallout 4 - 1920x1080 Ultra Preset AA:T AF:16x | |
| Asus FX502VM-AS73 | |
| MSI GE72 7RE-046 | |
| Aorus X3 Plus v5 | |
| Zotac GeForce GTX 1050 2GB | |
| Dell XPS 15 9560 (i7-7700HQ, UHD) | |
| Dell XPS 15 9550 i7 FHD | |
| Doom - 1920x1080 Ultra Preset AA:SM | |
| Asus FX502VM-AS73 | |
| MSI GE72 7RE-046 | |
| Dell XPS 15 9560 (i7-7700HQ, UHD) | |
| Zotac GeForce GTX 1050 2GB | |
| Overwatch - 1920x1080 Epic (Render Scale 100 %) AA:SM AF:16x | |
| Asus FX502VM-AS73 | |
| MSI GE72 7RE-046 | |
| Zotac GeForce GTX 1050 2GB | |
| Dell XPS 15 9560 (i7-7700HQ, UHD) | |
| Mafia 3 - 1920x1080 High Preset | |
| Asus FX502VM-AS73 | |
| MSI GE72 7RE-046 | |
| Zotac GeForce GTX 1050 2GB | |
| Dell XPS 15 9560 (i7-7700HQ, UHD) | |
| low | med. | high | ultra | 4K | |
|---|---|---|---|---|---|
| StarCraft II: Heart of the Swarm (2013) | 71 | ||||
| BioShock Infinite (2013) | 152.5 | 66 | |||
| Metro: Last Light (2013) | 83.9 | 45.1 | |||
| Thief (2014) | 76 | 41.9 | |||
| The Witcher 3 (2015) | 64.9 | 38.2 | 19.8 | ||
| Batman: Arkham Knight (2015) | 83 | 48 | 33 | 15 | |
| Metal Gear Solid V (2015) | 60 | 53.4 | 24.8 | ||
| Dota 2 Reborn (2015) | 34 | ||||
| Fallout 4 (2015) | 41.7 | 34.6 | 14 | ||
| Rise of the Tomb Raider (2016) | 71.9 | 39.8 | 32.9 | 13.1 | |
| Ashes of the Singularity (2016) | 34.9 | 29.8 | |||
| Doom (2016) | 57 | 53.8 | 17.5 | ||
| Overwatch (2016) | 90.7 | 54.5 | 30.2 | ||
| Mafia 3 (2016) | 21 |
Noise level
| Idle |
| 29 / 29 / 32.2 dB(A) |
| Load |
| 47.1 / 47.1 dB(A) |
 | ||
30 dB silent 40 dB(A) audible 50 dB(A) loud |
||
min: | ||
| Dell XPS 15 9560 (i7-7700HQ, UHD) | Asus FX502VM-AS73 | Apple MacBook Pro 15 2016 (2.9 GHz, 460) | Dell XPS 15 2017 9560 (7300HQ, Full-HD) | Dell XPS 15 9550 i7 FHD | |
|---|---|---|---|---|---|
| Noise | -3% | 4% | -5% | 6% | |
| off / environment * (dB) | 28.4 | 28.7 -1% | 29 -2% | 30.3 -7% | |
| Idle Minimum * (dB) | 29 | 30.6 -6% | 30.3 -4% | 31.6 -9% | 29.2 -1% |
| Idle Average * (dB) | 29 | 30.6 -6% | 30.3 -4% | 31.6 -9% | 29.3 -1% |
| Idle Maximum * (dB) | 32.2 | 31 4% | 30.3 6% | 33.4 -4% | 29.5 8% |
| Load Average * (dB) | 47.1 | 46.2 2% | 35.1 25% | 47.8 -1% | 36.5 23% |
| Witcher 3 ultra * (dB) | 52 | ||||
| Load Maximum * (dB) | 47.1 | 52.3 -11% | 46 2% | 47.8 -1% | 47.7 -1% |
* ... smaller is better
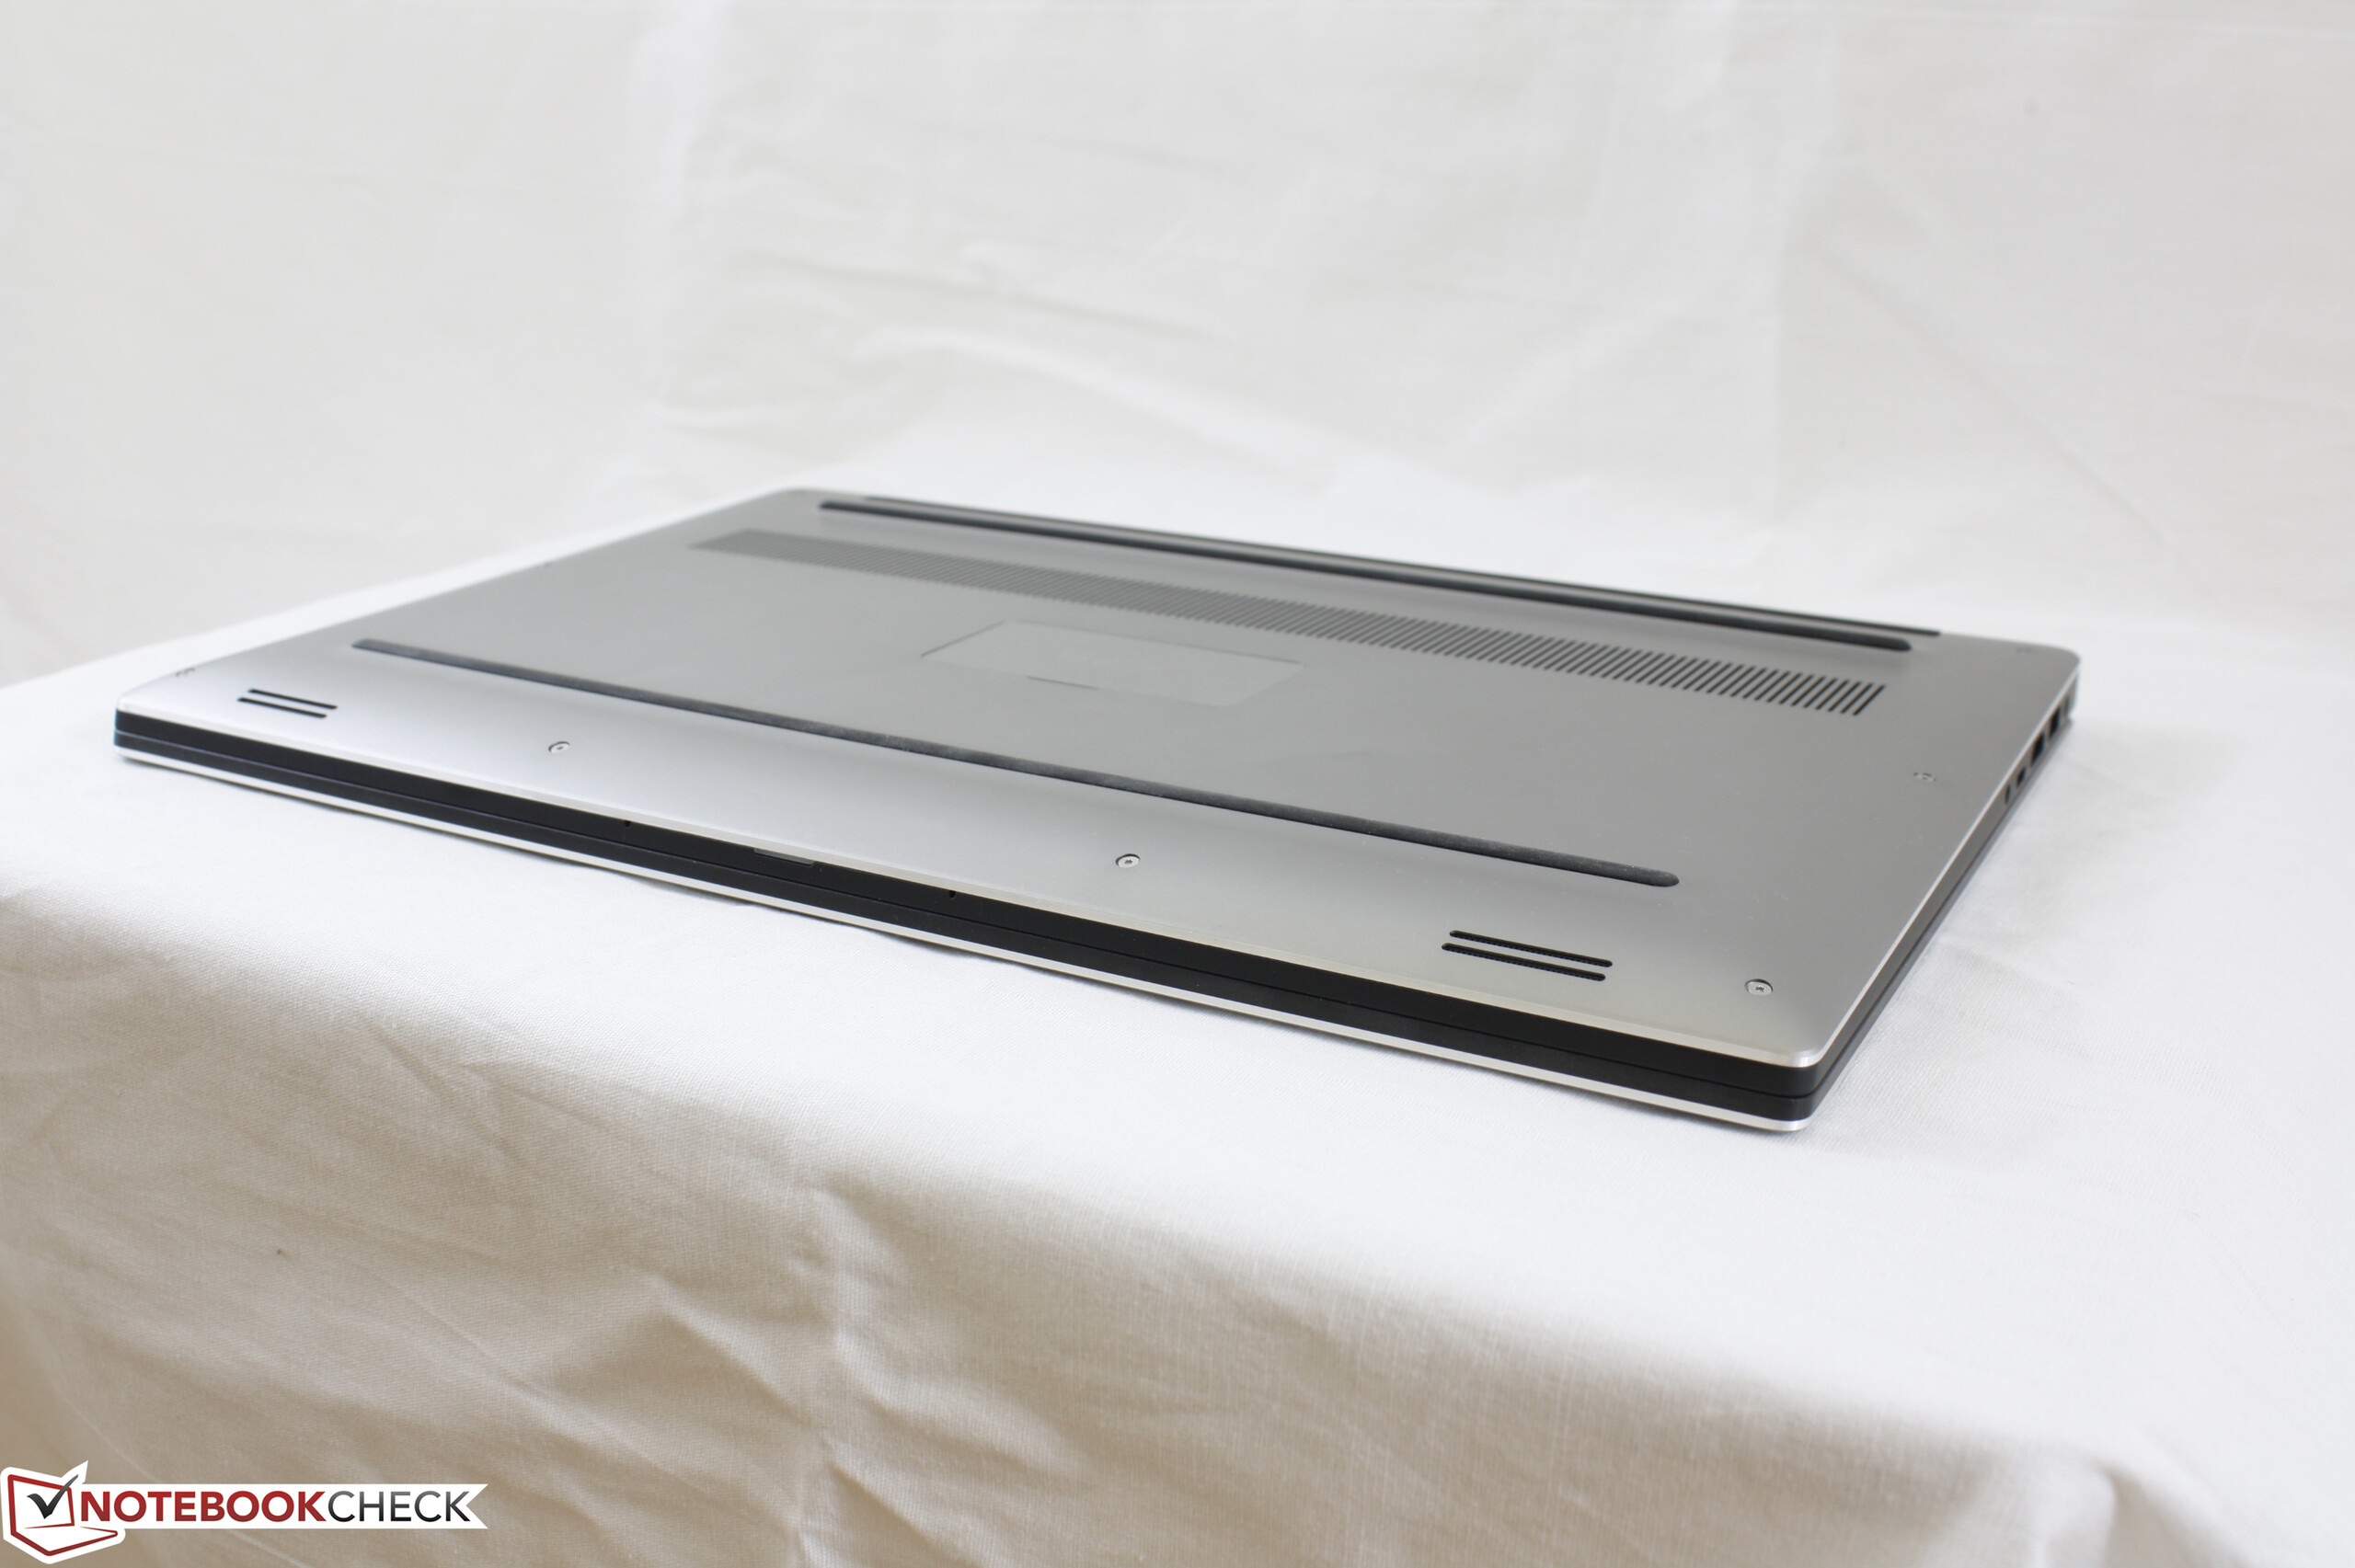
(-) The maximum temperature on the upper side is 48.8 °C / 120 F, compared to the average of 36.8 °C / 98 F, ranging from 21 to 71 °C for the class Multimedia.
(±) The bottom heats up to a maximum of 42.6 °C / 109 F, compared to the average of 39.1 °C / 102 F
(+) In idle usage, the average temperature for the upper side is 24.6 °C / 76 F, compared to the device average of 31.3 °C / 88 F.
(±) Playing The Witcher 3, the average temperature for the upper side is 36.8 °C / 98 F, compared to the device average of 31.3 °C / 88 F.
(+) The palmrests and touchpad are cooler than skin temperature with a maximum of 30.2 °C / 86.4 F and are therefore cool to the touch.
(±) The average temperature of the palmrest area of similar devices was 28.7 °C / 83.7 F (-1.5 °C / -2.7 F).
Dell XPS 15 9560 (i7-7700HQ, UHD) audio analysis
(-) | not very loud speakers (70.9 dB)
Bass 100 - 315 Hz
(±) | reduced bass - on average 12.9% lower than median
(±) | linearity of bass is average (14.3% delta to prev. frequency)
Mids 400 - 2000 Hz
(+) | balanced mids - only 3.5% away from median
(±) | linearity of mids is average (8.9% delta to prev. frequency)
Highs 2 - 16 kHz
(+) | balanced highs - only 2.3% away from median
(±) | linearity of highs is average (7.3% delta to prev. frequency)
Overall 100 - 16.000 Hz
(±) | linearity of overall sound is average (16.2% difference to median)
Compared to same class
» 41% of all tested devices in this class were better, 7% similar, 51% worse
» The best had a delta of 5%, average was 17%, worst was 45%
Compared to all devices tested
» 26% of all tested devices were better, 6% similar, 68% worse
» The best had a delta of 4%, average was 23%, worst was 134%
Apple MacBook 12 (Early 2016) 1.1 GHz audio analysis
(+) | speakers can play relatively loud (83.6 dB)
Bass 100 - 315 Hz
(±) | reduced bass - on average 11.3% lower than median
(±) | linearity of bass is average (14.2% delta to prev. frequency)
Mids 400 - 2000 Hz
(+) | balanced mids - only 2.4% away from median
(+) | mids are linear (5.5% delta to prev. frequency)
Highs 2 - 16 kHz
(+) | balanced highs - only 2% away from median
(+) | highs are linear (4.5% delta to prev. frequency)
Overall 100 - 16.000 Hz
(+) | overall sound is linear (10.2% difference to median)
Compared to same class
» 7% of all tested devices in this class were better, 2% similar, 90% worse
» The best had a delta of 5%, average was 18%, worst was 53%
Compared to all devices tested
» 5% of all tested devices were better, 1% similar, 94% worse
» The best had a delta of 4%, average was 23%, worst was 134%
| Off / Standby | |
| Idle | |
| Load |
|
Key:
min: | |
| Dell XPS 15 9560 (i7-7700HQ, UHD) i7-7700HQ, GeForce GTX 1050 Mobile, Lite-On CX2-8B512-Q11, IGZO IPS, 3840x2160, 15.6" | Asus FX502VM-AS73 i7-7700HQ, GeForce GTX 1060 Mobile, SK Hynix HFS256G39TND-N210A, TN LED, 1920x1080, 15.6" | Apple MacBook Pro 15 2016 (2.9 GHz, 460) 6920HQ, Radeon Pro 460, Apple SSD SM1024L, IPS, 2880x1800, 15.4" | HP Spectre x360 15-bl002xx i7-7500U, GeForce 940MX, Toshiba XG4 NVMe (THNSN5512GPUK), IPS, 3840x2160, 15.6" | Dell XPS 15 2017 9560 (7300HQ, Full-HD) i5-7300HQ, GeForce GTX 1050 Mobile, WDC WD10SPCX-75KHST0 + SanDisk Z400s M.2 2242 32 GB Cache, LED IGZO IPS InfinityEdge, 1920x1080, 15.6" | |
|---|---|---|---|---|---|
| Power Consumption | -7% | 39% | 38% | 28% | |
| Idle Minimum * (Watt) | 11.9 | 14.9 -25% | 3 75% | 8.14 32% | 6.6 45% |
| Idle Average * (Watt) | 17.1 | 15.1 12% | 9.9 42% | 10.91 36% | 9 47% |
| Idle Maximum * (Watt) | 17.3 | 15.2 12% | 12.5 28% | 12.26 29% | 10.7 38% |
| Load Average * (Watt) | 94.7 | 105.8 -12% | 70.6 25% | 45.67 52% | 77.5 18% |
| Witcher 3 ultra * (Watt) | 104.8 | ||||
| Load Maximum * (Watt) | 122 | 148.8 -22% | 90.8 26% | 74.94 39% | 130 -7% |
* ... smaller is better
| Dell XPS 15 9560 (i7-7700HQ, UHD) i7-7700HQ, GeForce GTX 1050 Mobile, 97 Wh | Asus FX502VM-AS73 i7-7700HQ, GeForce GTX 1060 Mobile, 64 Wh | Apple MacBook Pro 15 2016 (2.9 GHz, 460) 6920HQ, Radeon Pro 460, 76 Wh | HP Spectre x360 15-bl002xx i7-7500U, GeForce 940MX, 79.2 Wh | Dell XPS 15 2017 9560 (7300HQ, Full-HD) i5-7300HQ, GeForce GTX 1050 Mobile, 56 Wh | |
|---|---|---|---|---|---|
| Battery runtime | -42% | -2% | 25% | -24% | |
| Reader / Idle (h) | 13.9 | 6.1 -56% | 14.4 4% | 9.4 -32% | |
| WiFi v1.3 (h) | 7.2 | 4.6 -36% | 10.3 43% | 8.9 24% | 5.6 -22% |
| Load (h) | 1.7 | 1.1 -35% | 0.9 -47% | 2.5 47% | 1.4 -18% |
Pros
Cons
在我们关于配有Kaby Lake 处理器的XPS 9360的评测中,我们提及的关于其性能与电池续航相较于Skylake提升些微,致使用户可能考虑节省数百美元来购买前代产品。情况同样适用于XPS 9560,配备的 i7-7700HQ相较于XPS 9550配备的i7-6700HQ仅提供非常有限的增益,但有着不小的价格差距。
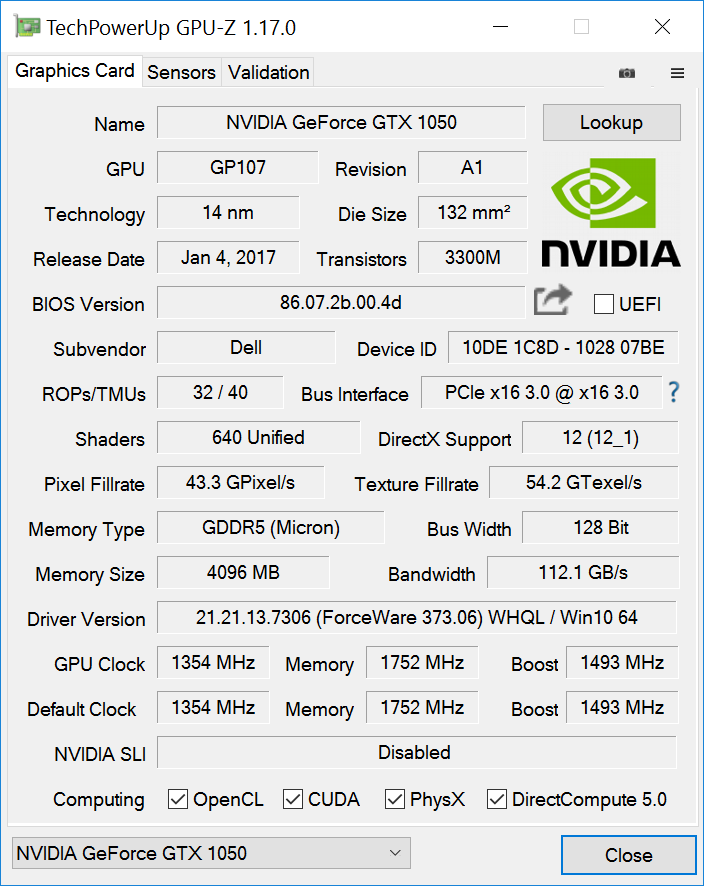
一个主要的取舍项目是在最新一代 XPS 15 中的GTX 1050。相比起XPS 15 9550 中GTX 960M,图形性能有着极大的提升。对于那些只想把笔记本用于文本处理以及观看在线视频的用户来说甚至有些多余。对于那些被这台笔记本制造工艺和设计吸引的用户来说,入门级不带独立显卡的$999美元的型号十分有吸引力。一般的有游戏玩家会发现在这个时间点,XPS 9560相比起XPS 9550,MacBook Pro 15, 和其他在这个特殊分类下竞品来说有着强得多游戏性能。的确有廉价的替代品,例如 Pavilion 15 UHD (搭载GTX 1050),但制造质量就完全无法比较了。。
XPS 15 9560相较于XPS 15 9550最显著区分的特性就是图形性能的巨大提升。如果对这额外的图形性能没有需求,那么入门级的9560 SKU 甚至是前一代9550会是更加实惠的选择。
注:本文是基于完整评测的缩减版本,阅读完整的英文评测,请点击这里。
Dell XPS 15 9560 (i7-7700HQ, UHD)
- 03/15/2017 v6 (old)
Allen Ngo
Price comparison
