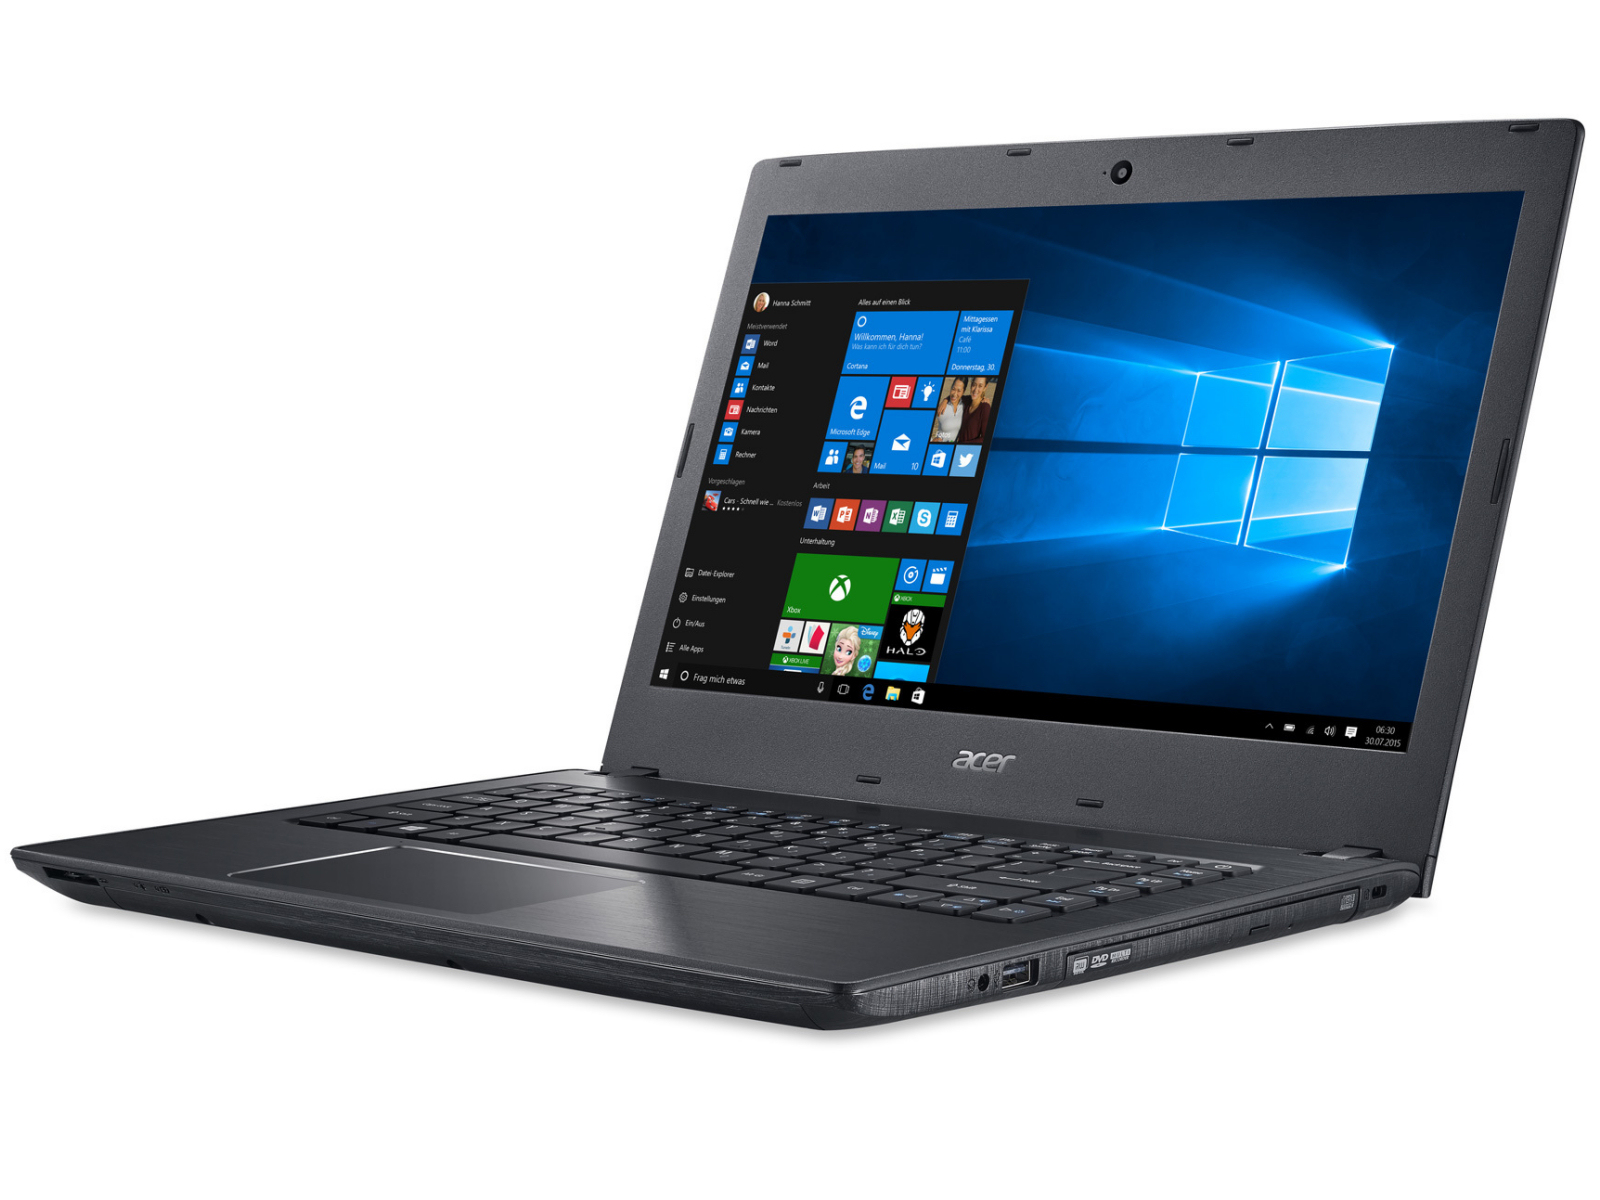
宏碁 TravelMate P249-M-5452 (Core i5, 全高清) 笔记本电脑简短评测


| SD Card Reader | |
| average JPG Copy Test (av. of 3 runs) | |
| Lenovo ThinkPad E460-20EUS00000 | |
| HP ProBook 440 G3 | |
| Dell Latitude 14 3470 | |
| Acer TravelMate X3 X349-M-7261 | |
| Acer TravelMate P249-M-5452 | |
| maximum AS SSD Seq Read Test (1GB) | |
| HP ProBook 440 G3 | |
| Lenovo ThinkPad E460-20EUS00000 | |
| Dell Latitude 14 3470 | |
| Acer TravelMate X3 X349-M-7261 | |
| Networking | |
| iperf Server (receive) TCP 1 m | |
| Acer TravelMate X3 X349-M-7261 (jseb) | |
| Dell Latitude 14 3470 | |
| Acer TravelMate P249-M-5452 | |
| iperf Client (transmit) TCP 1 m | |
| Acer TravelMate X3 X349-M-7261 (jseb) | |
| Dell Latitude 14 3470 | |
| Acer TravelMate P249-M-5452 | |
| |||||||||||||||||||||||||
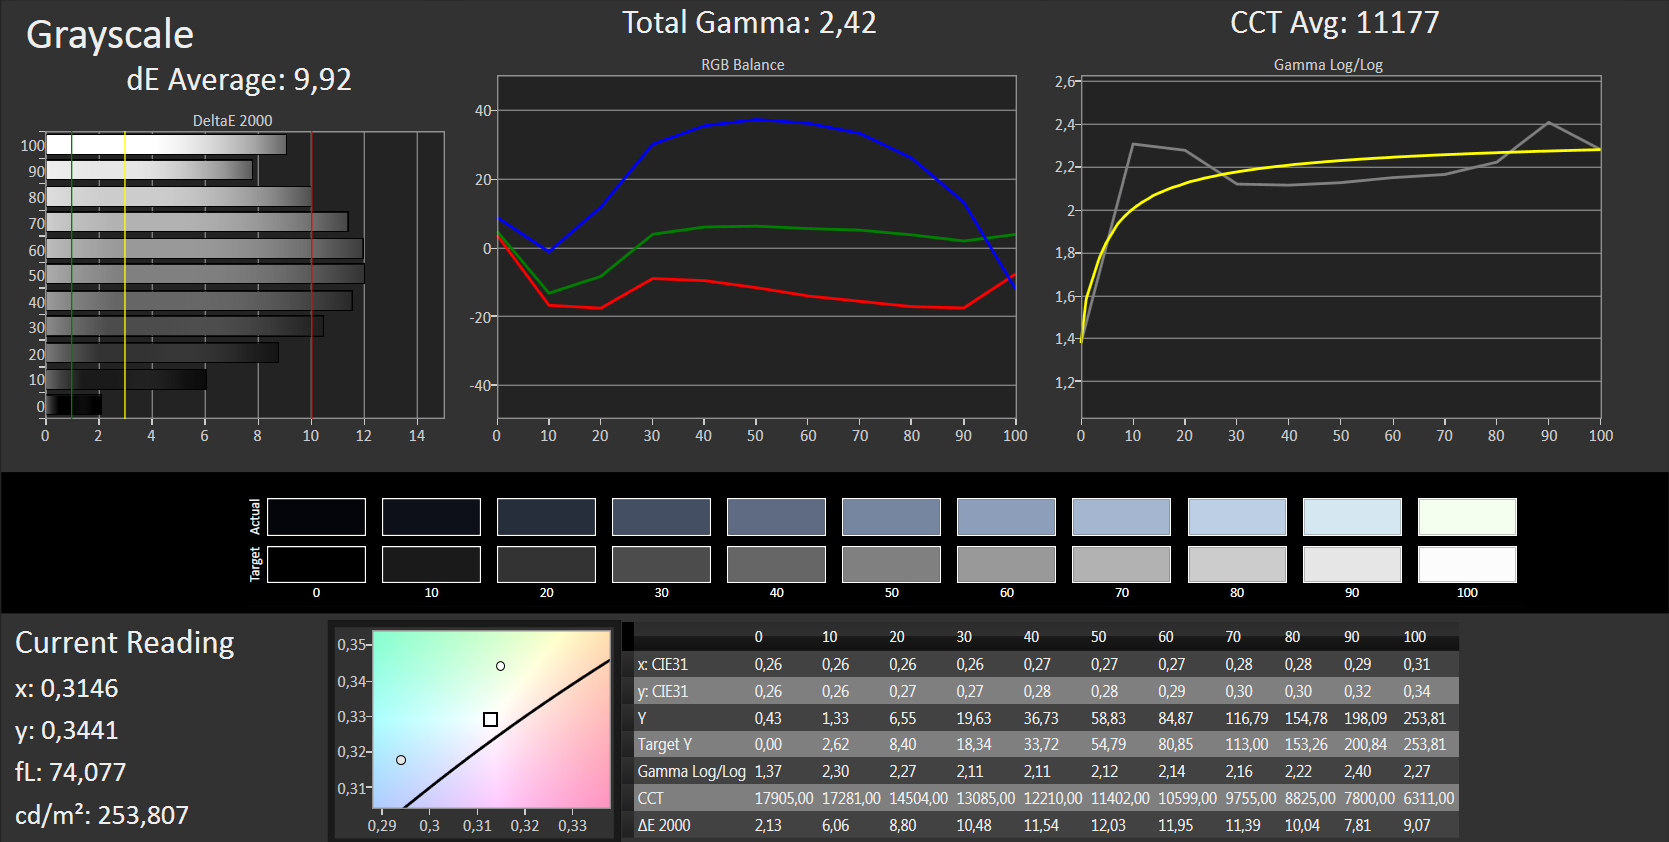
Brightness Distribution: 87 %
Center on Battery: 257 cd/m²
Contrast: 607:1 (Black: 0.41 cd/m²)
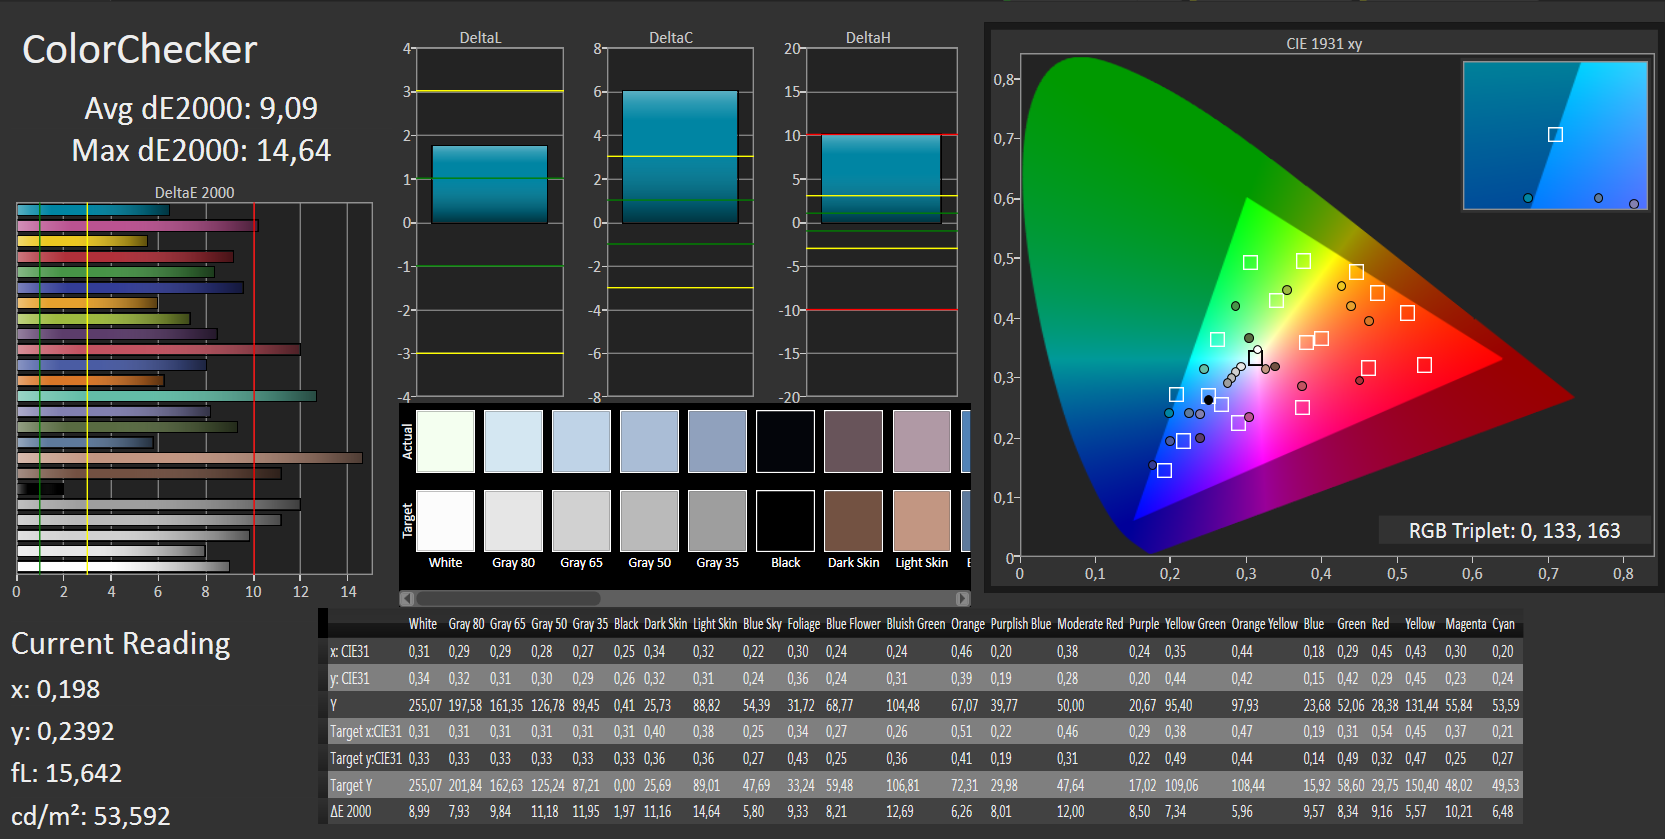
ΔE ColorChecker Calman: 9.09 | ∀{0.5-29.43 Ø4.71}
ΔE Greyscale Calman: 9.92 | ∀{0.09-98 Ø4.96}
56.7% sRGB (Argyll 1.6.3 3D)
36.5% AdobeRGB 1998 (Argyll 1.6.3 3D)
39.48% AdobeRGB 1998 (Argyll 3D)
56.7% sRGB (Argyll 3D)
38.15% Display P3 (Argyll 3D)
Gamma: 2.42
CCT: 11177 K
| Acer TravelMate P249-M-5452 TN LED, 1920x1080, 14" | HP ProBook 440 G3 TN, 1920x1080, 14" | Lenovo ThinkPad E460-20EUS00000 IPS-Panel, 1920x1080, 14" | Dell Latitude 14 3470 TN LED, 1366x768, 14" | Acer TravelMate X3 X349-M-7261 IPS, 1920x1080, 14" | |
|---|---|---|---|---|---|
| Display | 4% | 3% | 6% | -3% | |
| Display P3 Coverage (%) | 38.15 | 39.6 4% | 39.1 2% | 40.21 5% | 36.97 -3% |
| sRGB Coverage (%) | 56.7 | 59.1 4% | 58.8 4% | 60.5 7% | 55.6 -2% |
| AdobeRGB 1998 Coverage (%) | 39.48 | 40.94 4% | 40.41 2% | 41.55 5% | 38.2 -3% |
| Response Times | -39% | -18% | -35% | -35% | |
| Response Time Grey 50% / Grey 80% * (ms) | 44 ? | 46 ? -5% | 40 ? 9% | 47 ? -7% | 42 ? 5% |
| Response Time Black / White * (ms) | 16 ? | 27.6 ? -73% | 23.2 ? -45% | 26 ? -63% | 28 ? -75% |
| PWM Frequency (Hz) | 50 ? | ||||
| Screen | -4% | 18% | -14% | 26% | |
| Brightness middle (cd/m²) | 249 | 246 -1% | 233 -6% | 206 -17% | 230 -8% |
| Brightness (cd/m²) | 238 | 215 -10% | 221 -7% | 193 -19% | 226 -5% |
| Brightness Distribution (%) | 87 | 84 -3% | 88 1% | 87 0% | 86 -1% |
| Black Level * (cd/m²) | 0.41 | 0.5 -22% | 0.3 27% | 0.48 -17% | 0.2 51% |
| Contrast (:1) | 607 | 492 -19% | 777 28% | 429 -29% | 1150 89% |
| Colorchecker dE 2000 * | 9.09 | 8.6 5% | 4.43 51% | 11 -21% | 5.07 44% |
| Colorchecker dE 2000 max. * | 14.64 | 19.57 -34% | 10.07 31% | ||
| Greyscale dE 2000 * | 9.92 | 9.36 6% | 3.78 62% | 11.51 -16% | 3.64 63% |
| Gamma | 2.42 91% | 2.39 92% | 2.31 95% | 2.23 99% | 2.46 89% |
| CCT | 11177 58% | 11226 58% | 7171 91% | 13671 48% | 6521 100% |
| Color Space (Percent of AdobeRGB 1998) (%) | 36.5 | 37.8 4% | 37.3 2% | 38.46 5% | 35 -4% |
| Color Space (Percent of sRGB) (%) | 56.7 | 59.1 4% | 58.7 4% | 60.61 7% | 55 -3% |
| Total Average (Program / Settings) | -13% /
-7% | 1% /
10% | -14% /
-13% | -4% /
12% |
* ... smaller is better
Screen Flickering / PWM (Pulse-Width Modulation)
| Screen flickering / PWM detected | 50 Hz | ≤ 10 % brightness setting | 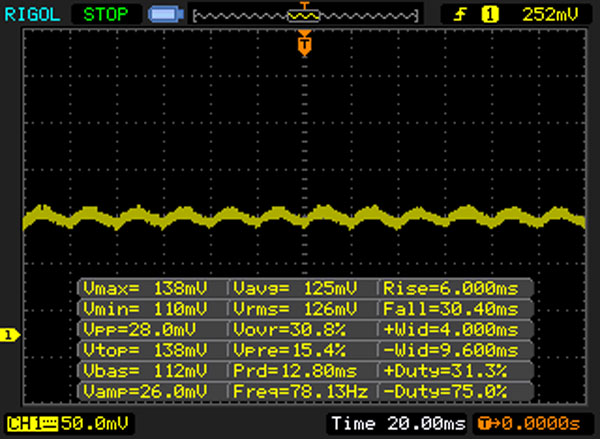 |
The display backlight flickers at 50 Hz (worst case, e.g., utilizing PWM) Flickering detected at a brightness setting of 10 % and below. There should be no flickering or PWM above this brightness setting. The frequency of 50 Hz is very low, so the flickering may cause eyestrain and headaches after extended use. In comparison: 52 % of all tested devices do not use PWM to dim the display. If PWM was detected, an average of 7757 (minimum: 5 - maximum: 343500) Hz was measured. | |||
Display Response Times
| ↔ Response Time Black to White | ||
|---|---|---|
| 16 ms ... rise ↗ and fall ↘ combined | ↗ 10 ms rise | 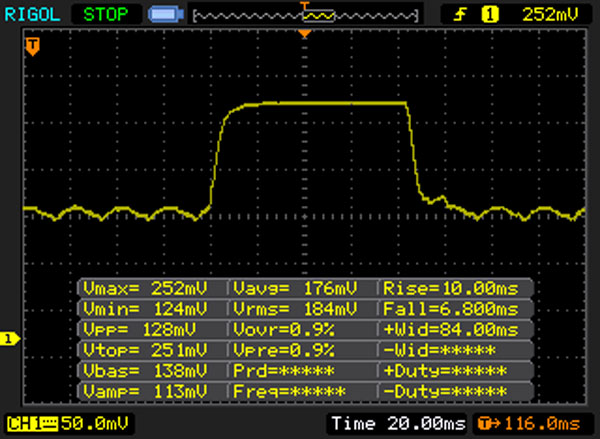 |
| ↘ 6 ms fall | ||
| The screen shows good response rates in our tests, but may be too slow for competitive gamers. In comparison, all tested devices range from 0.1 (minimum) to 240 (maximum) ms. » 37 % of all devices are better. This means that the measured response time is better than the average of all tested devices (19.8 ms). | ||
| ↔ Response Time 50% Grey to 80% Grey | ||
| 44 ms ... rise ↗ and fall ↘ combined | ↗ 23 ms rise | 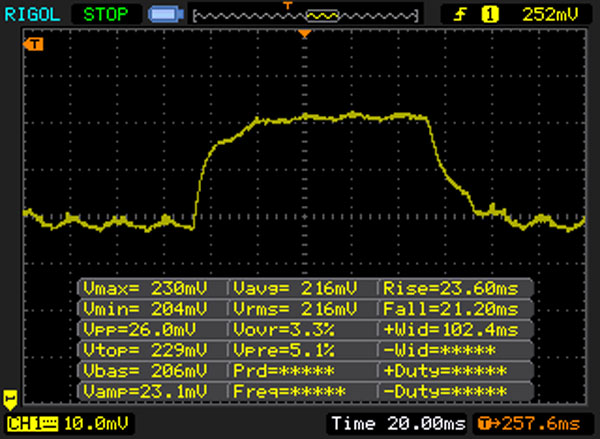 |
| ↘ 21 ms fall | ||
| The screen shows slow response rates in our tests and will be unsatisfactory for gamers. In comparison, all tested devices range from 0.165 (minimum) to 636 (maximum) ms. » 73 % of all devices are better. This means that the measured response time is worse than the average of all tested devices (31 ms). | ||

| Cinebench R15 | |
| CPU Single 64Bit | |
| Acer TravelMate X3 X349-M-7261 | |
| Acer Aspire E5-575G-549D | |
| Dell Vostro 5468 | |
| Acer TravelMate P249-M-5452 | |
| Lenovo ThinkPad E460-20EUS00000 | |
| HP ProBook 440 G3 | |
| Dell Latitude 14 3470 | |
| CPU Multi 64Bit | |
| Acer Aspire E5-575G-549D | |
| Dell Vostro 5468 | |
| Acer TravelMate X3 X349-M-7261 | |
| HP ProBook 440 G3 | |
| Acer TravelMate P249-M-5452 | |
| Lenovo ThinkPad E460-20EUS00000 | |
| Dell Latitude 14 3470 | |
| Cinebench R10 | |
| Rendering Multiple CPUs 32Bit | |
| Acer Aspire E5-575G-549D | |
| Acer TravelMate X3 X349-M-7261 | |
| HP ProBook 440 G3 | |
| Acer TravelMate P249-M-5452 | |
| Lenovo ThinkPad E460-20EUS00000 | |
| Rendering Single 32Bit | |
| Acer Aspire E5-575G-549D | |
| Acer TravelMate X3 X349-M-7261 | |
| HP ProBook 440 G3 | |
| Lenovo ThinkPad E460-20EUS00000 | |
| Acer TravelMate P249-M-5452 | |
| Geekbench 3 | |
| 32 Bit Single-Core Score | |
| Acer TravelMate X3 X349-M-7261 | |
| Acer TravelMate P249-M-5452 | |
| Acer Aspire E5-575G-549D | |
| Lenovo ThinkPad E460-20EUS00000 | |
| 32 Bit Multi-Core Score | |
| Acer TravelMate X3 X349-M-7261 | |
| Acer Aspire E5-575G-549D | |
| Acer TravelMate P249-M-5452 | |
| Lenovo ThinkPad E460-20EUS00000 | |
| Geekbench 4.0 | |
| 64 Bit Single-Core Score | |
| Acer TravelMate X3 X349-M-7261 | |
| Acer Aspire E5-575G-549D | |
| Acer TravelMate P249-M-5452 | |
| 64 Bit Multi-Core Score | |
| Acer TravelMate X3 X349-M-7261 | |
| Acer TravelMate P249-M-5452 | |
| Acer Aspire E5-575G-549D | |
| JetStream 1.1 - 1.1 Total | |
| Acer Aspire E5-575G-549D | |
| Acer TravelMate X3 X349-M-7261 | |
| Acer TravelMate P249-M-5452 | |
| Acer TravelMate P249-M-5452 | |
| HP ProBook 440 G3 | |
| Lenovo ThinkPad E460-20EUS00000 | |
| PCMark 7 Score | 4603 points | |
| PCMark 8 Home Score Accelerated v2 | 3472 points | |
| PCMark 8 Creative Score Accelerated v2 | 3760 points | |
| PCMark 8 Work Score Accelerated v2 | 4463 points | |
Help | ||

| Acer TravelMate P249-M-5452 SK Hynix HFS256G39TND-N210A | HP ProBook 440 G3 Hitachi Travelstar Z7K500 HTS725050A7E630 | Lenovo ThinkPad E460-20EUS00000 Samsung CM871 MZ7LF192HCGS | Dell Latitude 14 3470 Toshiba MQ01ACF050 | Acer TravelMate X3 X349-M-7261 Liteonit CV3-8D512 | |
|---|---|---|---|---|---|
| CrystalDiskMark 3.0 | -87% | -44% | -90% | 10% | |
| Read Seq (MB/s) | 510 | 124.8 -76% | 497.6 -2% | 108.9 -79% | 484.1 -5% |
| Write Seq (MB/s) | 267.2 | 123.6 -54% | 180 -33% | 103.2 -61% | 449.8 68% |
| Read 512 (MB/s) | 347.6 | 42.34 -88% | 297.1 -15% | 399.1 15% | |
| Write 512 (MB/s) | 267.5 | 61.9 -77% | 169.1 -37% | 355.1 33% | |
| Read 4k (MB/s) | 33.12 | 0.559 -98% | 18.91 -43% | 0.362 -99% | 33.44 1% |
| Write 4k (MB/s) | 95.9 | 1.277 -99% | 37.13 -61% | 0.946 -99% | 67.5 -30% |
| Read 4k QD32 (MB/s) | 392.8 | 1.179 -100% | 95.7 -76% | 0.721 -100% | 368.5 -6% |
| Write 4k QD32 (MB/s) | 266.4 | 1.304 -100% | 37.26 -86% | 0.901 -100% | 280.6 5% |
| 3DMark 06 Standard Score | 9061 points | |
| 3DMark 11 Performance | 1503 points | |
| 3DMark Ice Storm Standard Score | 53902 points | |
| 3DMark Cloud Gate Standard Score | 5329 points | |
| 3DMark Fire Strike Score | 736 points | |
Help | ||
| 3DMark 11 - 1280x720 Performance GPU | |
| Lenovo ThinkPad E460-20EUS00000 | |
| Acer TravelMate X3 X349-M-7261 | |
| Acer TravelMate P249-M-5452 | |
| HP ProBook 440 G3 | |
| Dell Latitude 14 3470 | |
| 3DMark | |
| 1280x720 Cloud Gate Standard Graphics | |
| Acer TravelMate X3 X349-M-7261 | |
| Acer TravelMate P249-M-5452 | |
| HP ProBook 440 G3 | |
| Lenovo ThinkPad E460-20EUS00000 | |
| Dell Latitude 14 3470 | |
| 1920x1080 Fire Strike Graphics | |
| Lenovo ThinkPad E460-20EUS00000 | |
| Acer TravelMate X3 X349-M-7261 | |
| Acer TravelMate P249-M-5452 | |
| HP ProBook 440 G3 | |
| Dell Latitude 14 3470 | |
| low | med. | high | ultra | |
|---|---|---|---|---|
| Tomb Raider (2013) | 76.4 | 38.4 | 23.8 | 11.1 |
| BioShock Infinite (2013) | 50.9 | 26.8 | 22.2 | 6.6 |
| Battlefield 4 (2013) | 31.2 | 23.3 | 10.6 | 4.2 |
| Battlefield 1 (2016) | 30.1 | 15.7 | 7.3 | 6.5 |
| Farming Simulator 17 (2016) | 82.1 | 52.2 | 20.6 | 12 |
| Titanfall 2 (2016) | 33.1 | 23.9 | 8.5 |
Noise level
| Idle |
| 31.8 / 31.8 / 31.8 dB(A) |
| DVD |
| 35.9 / dB(A) |
| Load |
| 35.7 / 36 dB(A) |
 | ||
30 dB silent 40 dB(A) audible 50 dB(A) loud |
||
min: | ||
| Acer TravelMate P249-M-5452 6200U, HD Graphics 520 | HP ProBook 440 G3 6200U, HD Graphics 520 | Lenovo ThinkPad E460-20EUS00000 6200U, Radeon R7 M360 | Dell Latitude 14 3470 6100U, HD Graphics 520 | Acer TravelMate X3 X349-M-7261 6500U, HD Graphics 520 | |
|---|---|---|---|---|---|
| Noise | 6% | 7% | 3% | 4% | |
| off / environment * (dB) | 31.8 | 29.2 8% | 31.15 2% | ||
| Idle Minimum * (dB) | 31.8 | 29.7 7% | 29 9% | 32.3 -2% | 31.5 1% |
| Idle Average * (dB) | 31.8 | 29.7 7% | 29 9% | 32.3 -2% | 31.5 1% |
| Idle Maximum * (dB) | 31.8 | 29.7 7% | 29 9% | 32.3 -2% | 31.5 1% |
| Load Average * (dB) | 35.7 | 32.7 8% | 33.1 7% | 33.3 7% | 31.7 11% |
| Load Maximum * (dB) | 36 | 35.1 2% | 35.6 1% | 33.4 7% | 34.1 5% |
* ... smaller is better
(+) The maximum temperature on the upper side is 34.8 °C / 95 F, compared to the average of 34.3 °C / 94 F, ranging from 21.2 to 62.5 °C for the class Office.
(±) The bottom heats up to a maximum of 42.8 °C / 109 F, compared to the average of 36.8 °C / 98 F
(+) In idle usage, the average temperature for the upper side is 22.9 °C / 73 F, compared to the device average of 29.5 °C / 85 F.
(+) The palmrests and touchpad are cooler than skin temperature with a maximum of 31.6 °C / 88.9 F and are therefore cool to the touch.
(-) The average temperature of the palmrest area of similar devices was 27.5 °C / 81.5 F (-4.1 °C / -7.4 F).
| Acer TravelMate P249-M-5452 6200U, HD Graphics 520 | HP ProBook 440 G3 6200U, HD Graphics 520 | Lenovo ThinkPad E460-20EUS00000 6200U, Radeon R7 M360 | Dell Latitude 14 3470 6100U, HD Graphics 520 | Acer TravelMate X3 X349-M-7261 6500U, HD Graphics 520 | |
|---|---|---|---|---|---|
| Heat | -24% | -19% | -18% | 1% | |
| Maximum Upper Side * (°C) | 34.8 | 41.4 -19% | 47.8 -37% | 38.9 -12% | 38.6 -11% |
| Maximum Bottom * (°C) | 42.8 | 50.2 -17% | 48.3 -13% | 37.7 12% | 39.5 8% |
| Idle Upper Side * (°C) | 24.6 | 34 -38% | 28.6 -16% | 35.1 -43% | 24.8 -1% |
| Idle Bottom * (°C) | 27.8 | 33.3 -20% | 30.6 -10% | 35.5 -28% | 25.4 9% |
* ... smaller is better
Acer TravelMate P249-M-5452 audio analysis
(±) | speaker loudness is average but good (72 dB)
Bass 100 - 315 Hz
(-) | nearly no bass - on average 15.9% lower than median
(+) | bass is linear (6.1% delta to prev. frequency)
Mids 400 - 2000 Hz
(+) | balanced mids - only 2.5% away from median
(+) | mids are linear (6.9% delta to prev. frequency)
Highs 2 - 16 kHz
(±) | higher highs - on average 7.2% higher than median
(±) | linearity of highs is average (7.3% delta to prev. frequency)
Overall 100 - 16.000 Hz
(±) | linearity of overall sound is average (19.3% difference to median)
Compared to same class
» 39% of all tested devices in this class were better, 7% similar, 54% worse
» The best had a delta of 7%, average was 21%, worst was 53%
Compared to all devices tested
» 47% of all tested devices were better, 8% similar, 46% worse
» The best had a delta of 4%, average was 23%, worst was 134%
Apple MacBook 12 (Early 2016) 1.1 GHz audio analysis
(+) | speakers can play relatively loud (83.6 dB)
Bass 100 - 315 Hz
(±) | reduced bass - on average 11.3% lower than median
(±) | linearity of bass is average (14.2% delta to prev. frequency)
Mids 400 - 2000 Hz
(+) | balanced mids - only 2.4% away from median
(+) | mids are linear (5.5% delta to prev. frequency)
Highs 2 - 16 kHz
(+) | balanced highs - only 2% away from median
(+) | highs are linear (4.5% delta to prev. frequency)
Overall 100 - 16.000 Hz
(+) | overall sound is linear (10.2% difference to median)
Compared to same class
» 7% of all tested devices in this class were better, 2% similar, 90% worse
» The best had a delta of 5%, average was 18%, worst was 53%
Compared to all devices tested
» 5% of all tested devices were better, 1% similar, 94% worse
» The best had a delta of 4%, average was 23%, worst was 134%
| Off / Standby | |
| Idle | |
| Load |
|
Key:
min: | |
| Acer TravelMate P249-M-5452 6200U, HD Graphics 520 | HP ProBook 440 G3 6200U, HD Graphics 520 | Lenovo ThinkPad E460-20EUS00000 6200U, Radeon R7 M360 | Dell Latitude 14 3470 6100U, HD Graphics 520 | Acer TravelMate X3 X349-M-7261 6500U, HD Graphics 520 | |
|---|---|---|---|---|---|
| Power Consumption | -11% | -23% | -3% | -8% | |
| Idle Minimum * (Watt) | 3.8 | 5.2 -37% | 4.1 -8% | 5 -32% | 4.9 -29% |
| Idle Average * (Watt) | 7.6 | 8.2 -8% | 8 -5% | 6.8 11% | 7.3 4% |
| Idle Maximum * (Watt) | 8 | 9 -13% | 8.9 -11% | 8.9 -11% | 9.4 -18% |
| Load Average * (Watt) | 30.5 | 28.8 6% | 39.3 -29% | 26.2 14% | 26 15% |
| Load Maximum * (Watt) | 32.5 | 34 -5% | 52.2 -61% | 31.8 2% | 36 -11% |
* ... smaller is better
| Acer TravelMate P249-M-5452 6200U, HD Graphics 520, 41 Wh | HP ProBook 440 G3 6200U, HD Graphics 520, 44 Wh | Lenovo ThinkPad E460-20EUS00000 6200U, Radeon R7 M360, 47 Wh | Dell Latitude 14 3470 6100U, HD Graphics 520, 41 Wh | Acer TravelMate X3 X349-M-7261 6500U, HD Graphics 520, 48.9 Wh | |
|---|---|---|---|---|---|
| Battery runtime | -14% | 3% | 2% | 4% | |
| Reader / Idle (h) | 13.2 | 9 -32% | 12.3 -7% | 11.1 -16% | 11.3 -14% |
| H.264 (h) | 6 | 5.4 -10% | 7.1 18% | 6.7 12% | |
| WiFi v1.3 (h) | 6.7 | 4.9 -27% | 4.9 -27% | 4.6 -31% | 6.5 -3% |
| Load (h) | 1.5 | 1.7 13% | 1.9 27% | 2.3 53% | 1.8 20% |
Pros
Cons
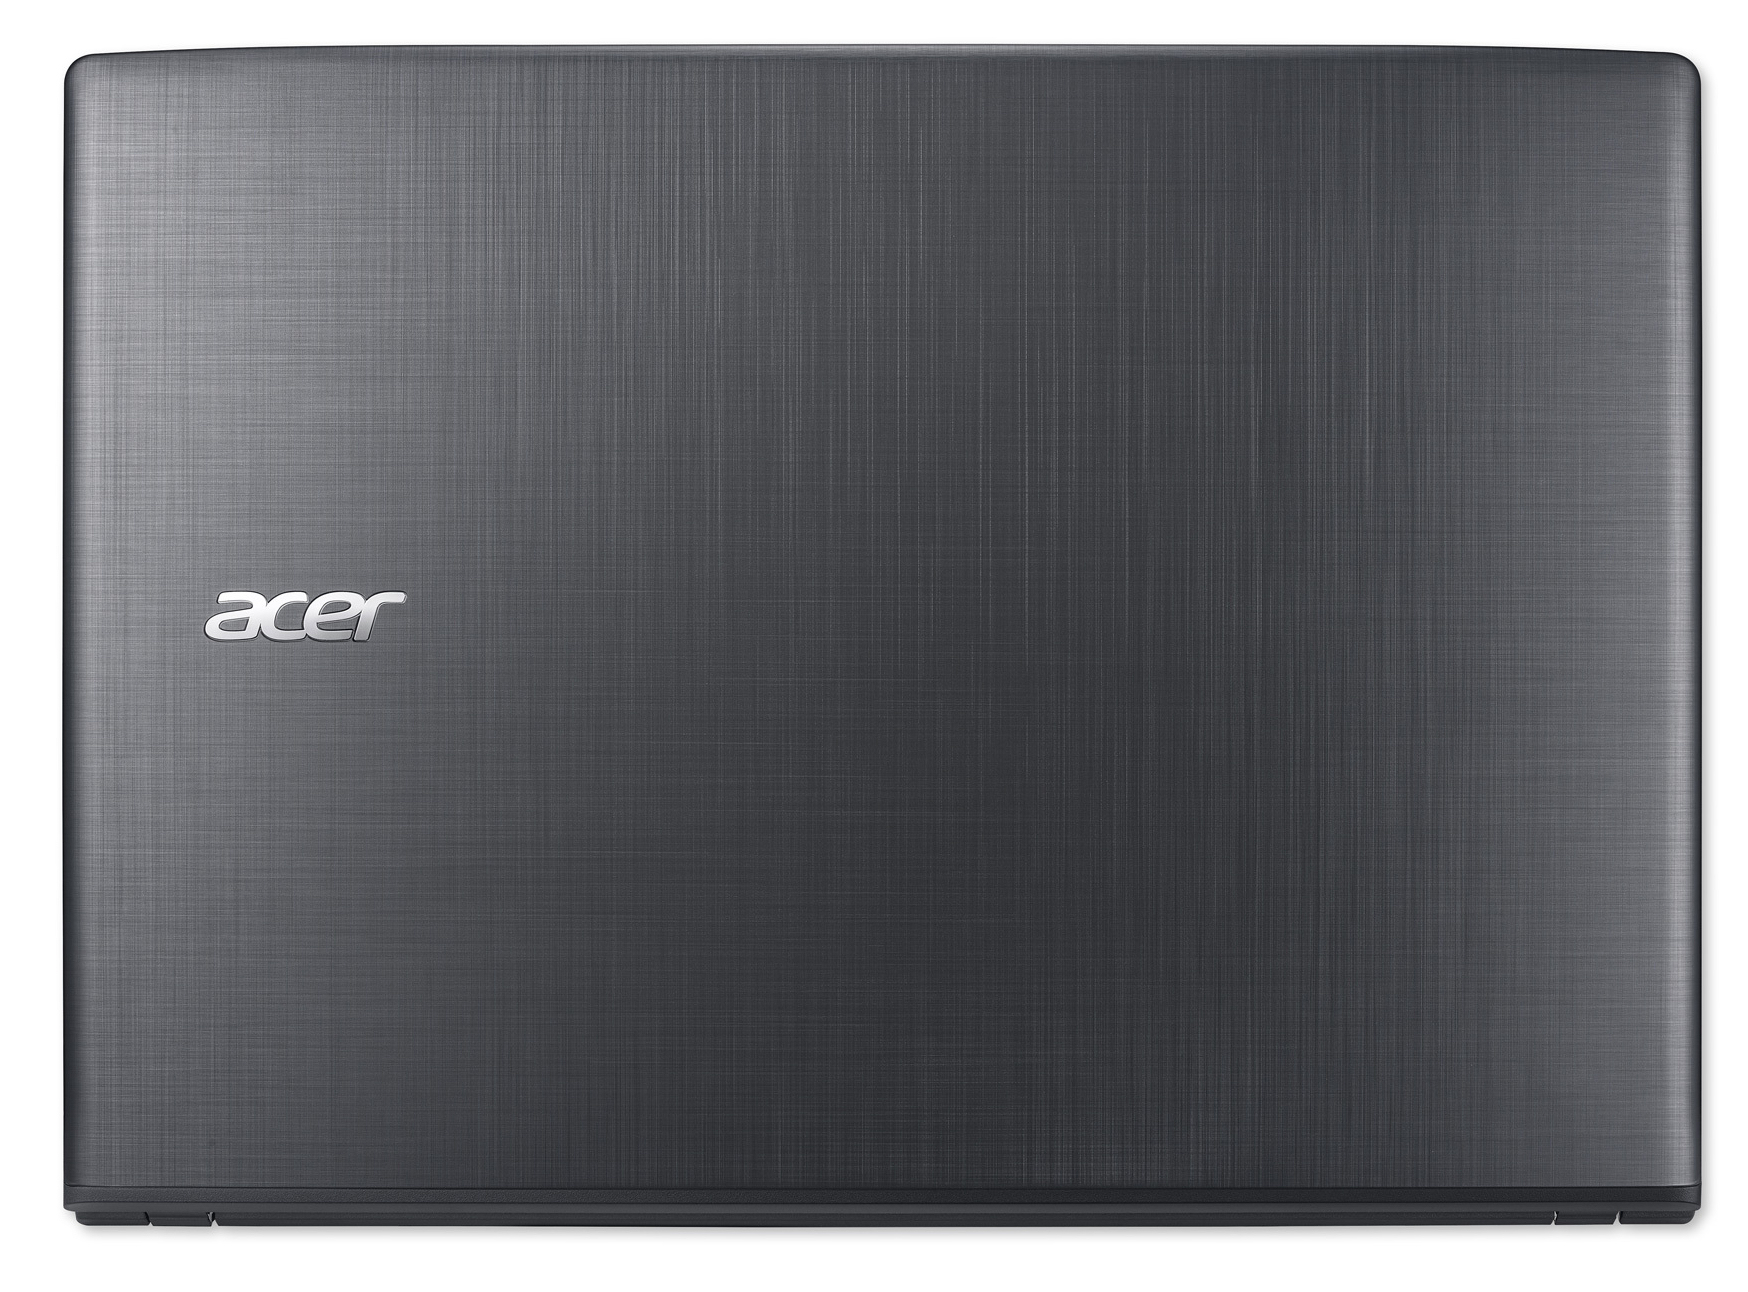
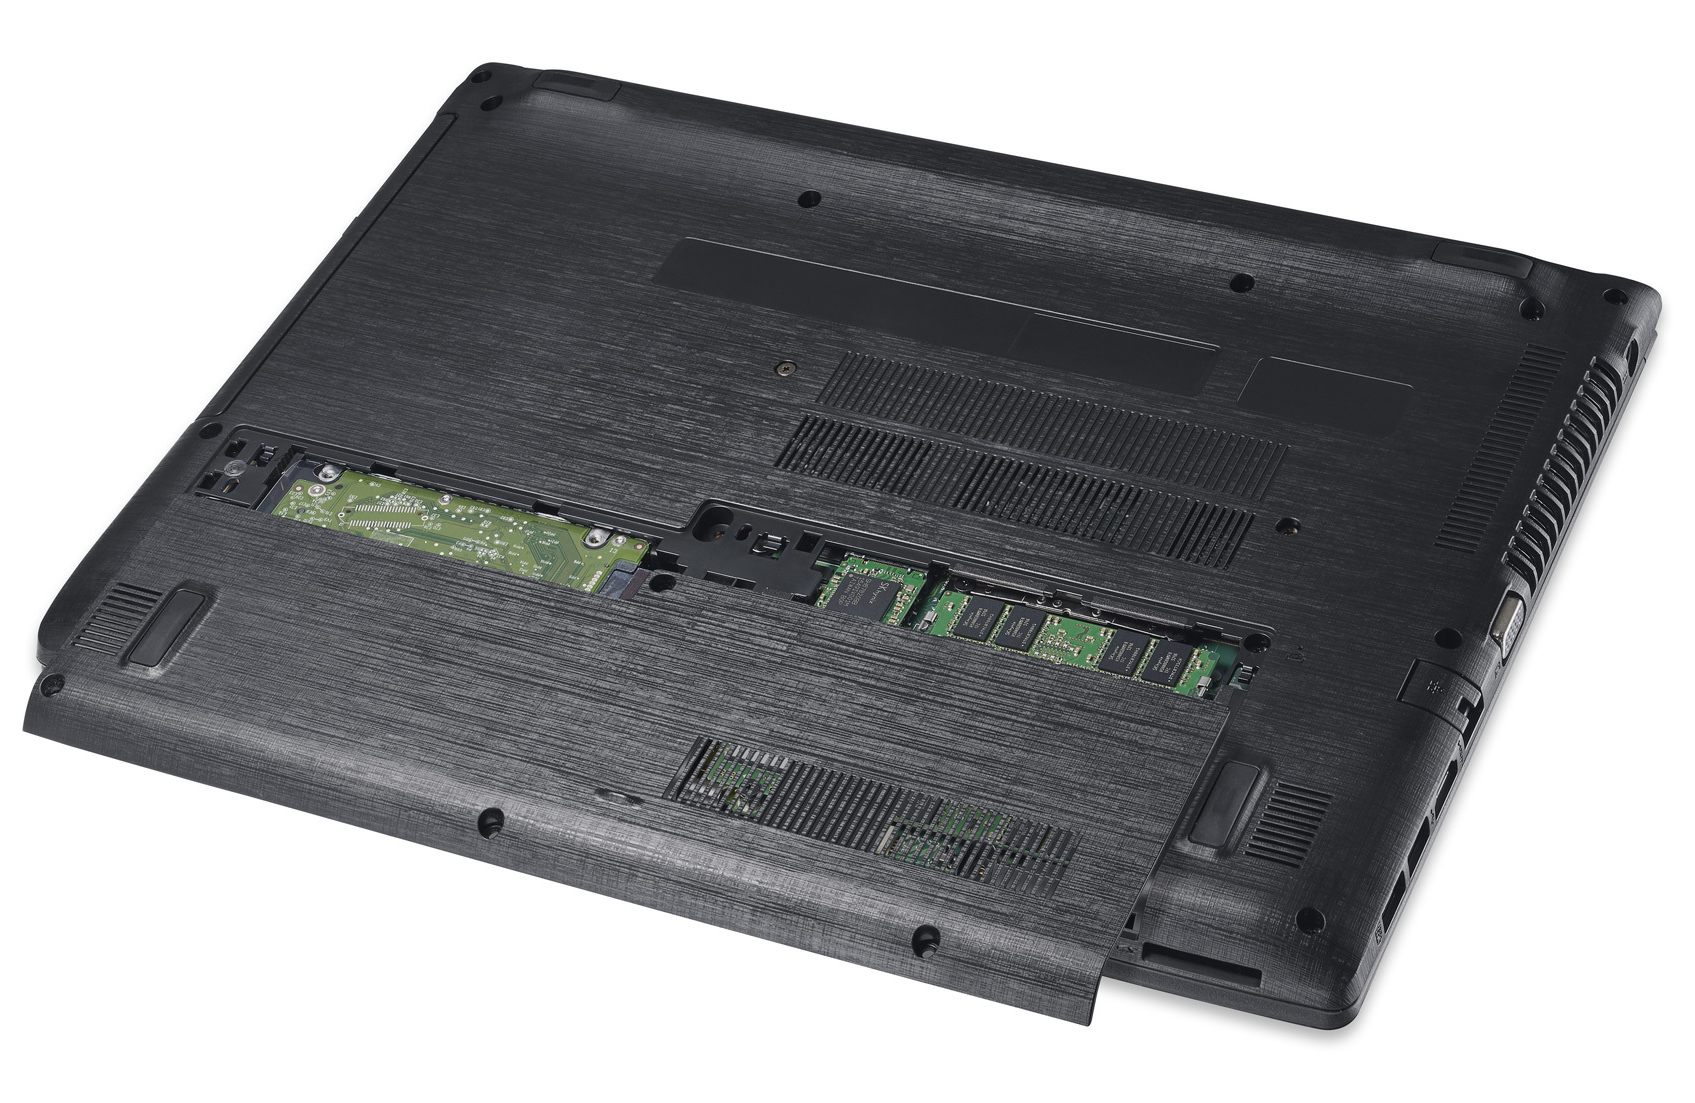
宏碁为入门上午用户带来了TravelMate P249-M。它的定位侧重企业、自由职业者和学生用户,但没有提供如指纹感应器、拓展坞和LTE模组等常见的商务功能。它的处理器具备足够日常使用的性能,笔记本电脑在运行中十分安静,几乎不会变烫。一块高速固态硬盘保证了系统的迅捷响应,而用户也可以通过维护底盖方便地升级更换固态硬盘。他的电池续航和输入设备也都十分优秀。生产商更是为它提供了三年的质保。它最明显的缺点在于宏碁选择的TN屏幕面板,它的对比度还不错,但是亮度和可视角度范围都十分有限。
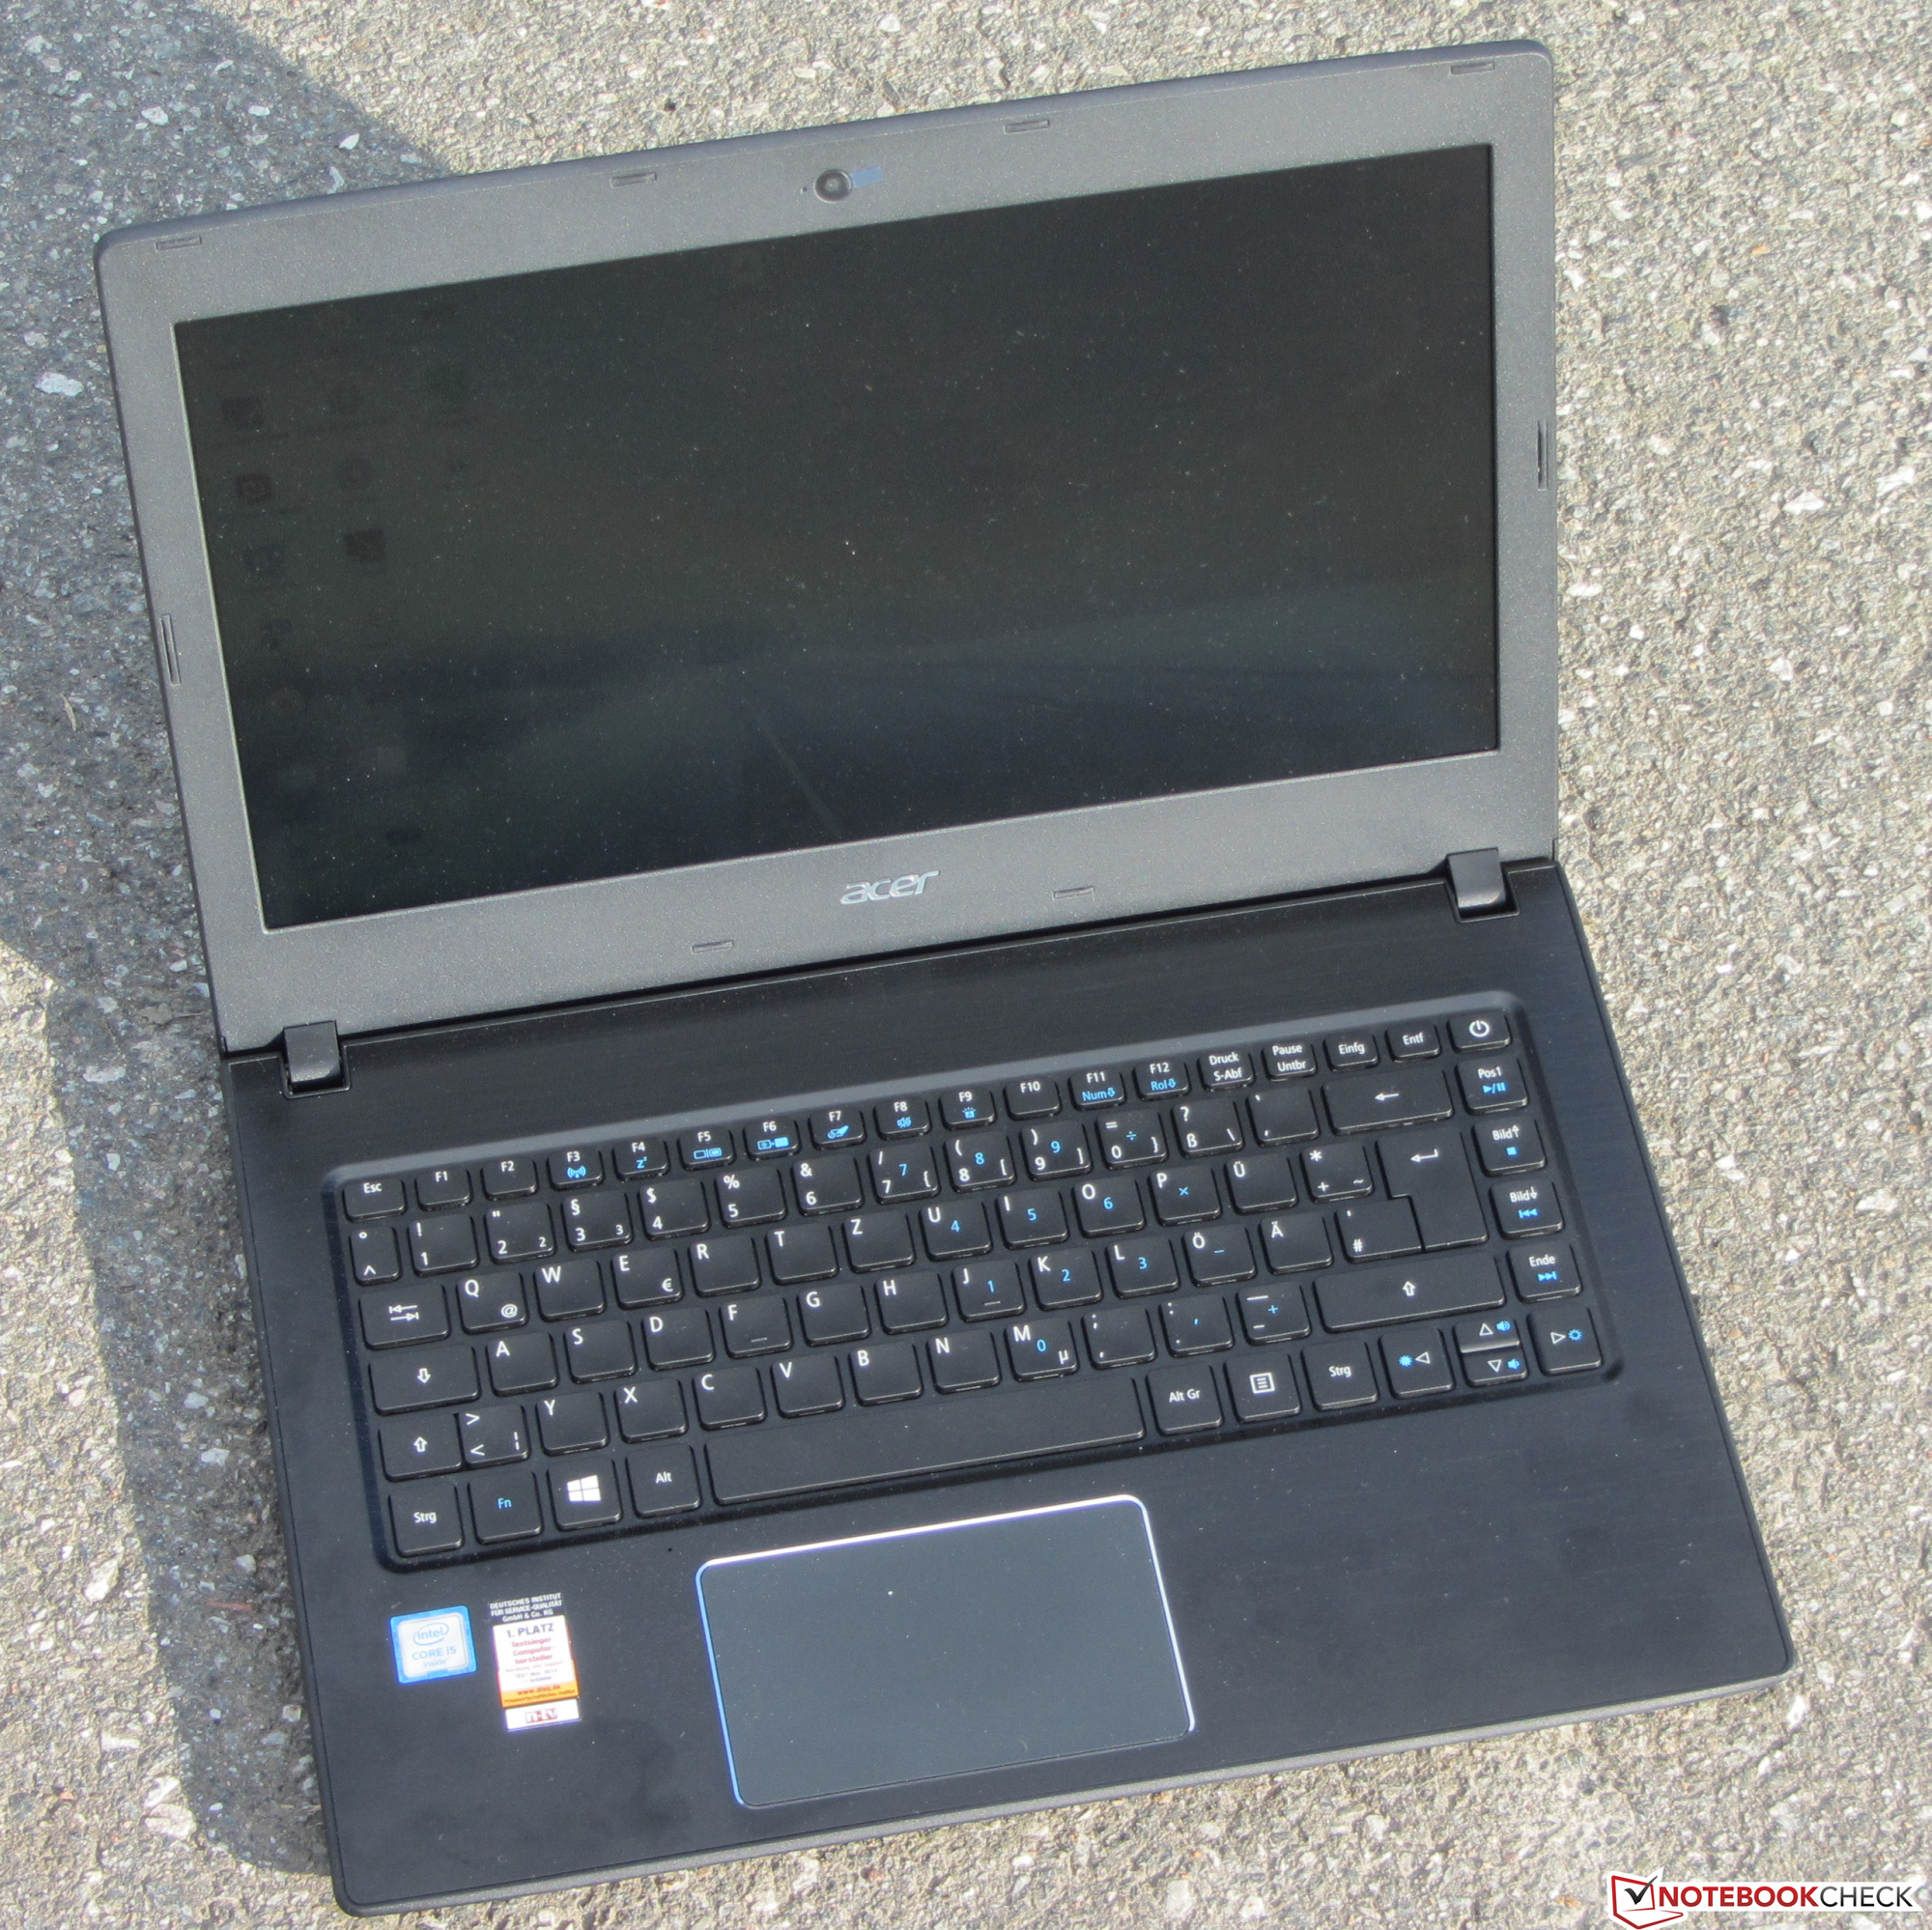
宏碁TravelMate P249-M是一台可靠的办公设备,不过它需要一块更好的屏幕。
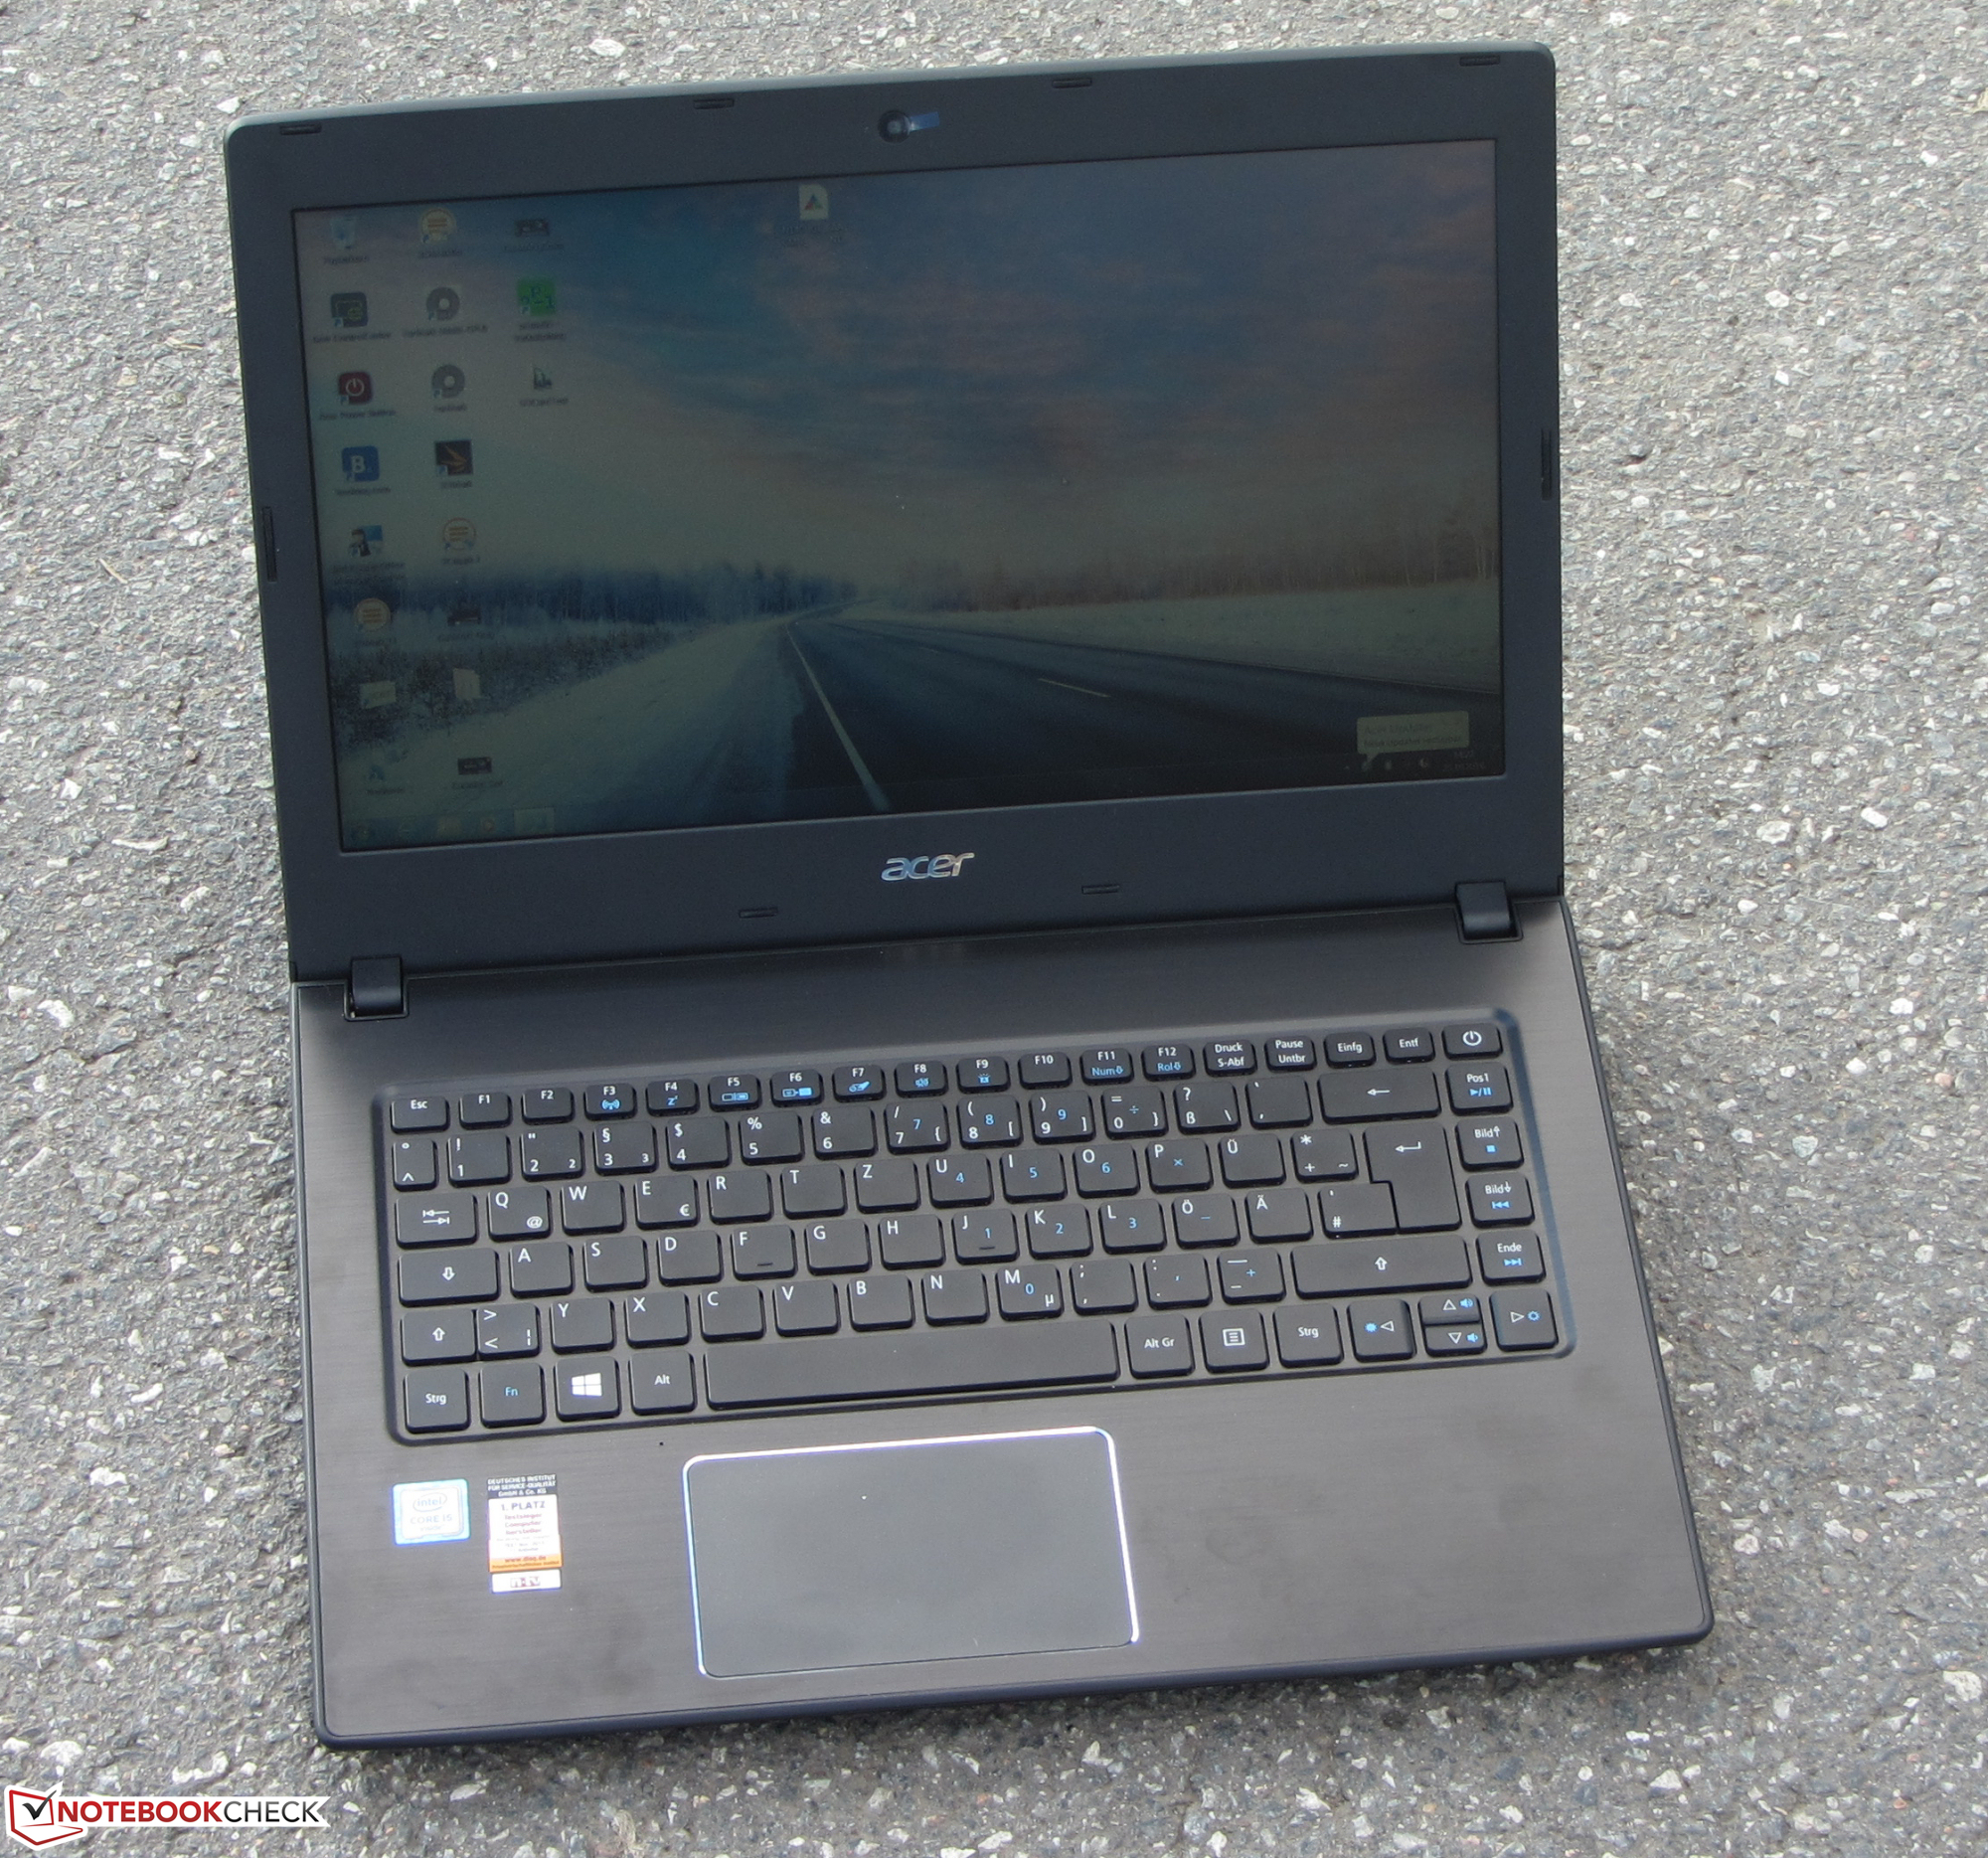
我们测试的是这个系列产品中的高配机型,它搭配了全高清屏幕,酷睿i5处理器和固态硬盘。如果你希望考虑更低价位的机型,可以考虑它的入门级型号(P249-M-3895),这款设备价位约560-580欧元(约4140-4287人民币)。我们将会在不久之后发布对它的评测。
如果你不喜欢P249-M的外观,我们建议你考虑宏碁TravelMate X349-M,它采用了更时尚的设计。X349-M采用了更薄的铝合金机身,IPS屏幕,指纹感应器和USB-C型接口。而P249-M则提供了更好的键盘和升级空间。
注:本文是基于完整评测的缩减版本,阅读完整的英文评测,请点击这里。
Acer TravelMate P249-M-5452
- 11/01/2016 v5.1 (old)
Sascha Mölck