惠普 Pavilion 17-x110ng 笔记本电脑简短评测
| SD Card Reader | |
| average JPG Copy Test (av. of 3 runs) | |
| Lenovo ThinkPad E470-20H2S00400 | |
| Lenovo IdeaPad 510-15IKB 80SV0087GE | |
| Acer Aspire F15 F5-573G-53V1 | |
| HP Pavilion 15-aw004ng W8Y60EA | |
| Acer Aspire E5-575G-549D | |
| HP Pavilion 17-x110ng | |
| maximum AS SSD Seq Read Test (1GB) | |
| HP Pavilion 15-aw004ng W8Y60EA | |
| Lenovo ThinkPad E470-20H2S00400 | |
| Acer Aspire E5-575G-549D | |
| Lenovo IdeaPad 510-15IKB 80SV0087GE | |
| HP Pavilion 17-x110ng | |
| Networking | |
| iperf3 transmit AX12 | |
| Lenovo ThinkPad E470-20H2S00400 | |
| HP Pavilion 17-x110ng | |
| iperf3 receive AX12 | |
| Lenovo ThinkPad E470-20H2S00400 | |
| HP Pavilion 17-x110ng | |
| |||||||||||||||||||||||||
Brightness Distribution: 88 %
Center on Battery: 288 cd/m²
Contrast: 472:1 (Black: 0.61 cd/m²)
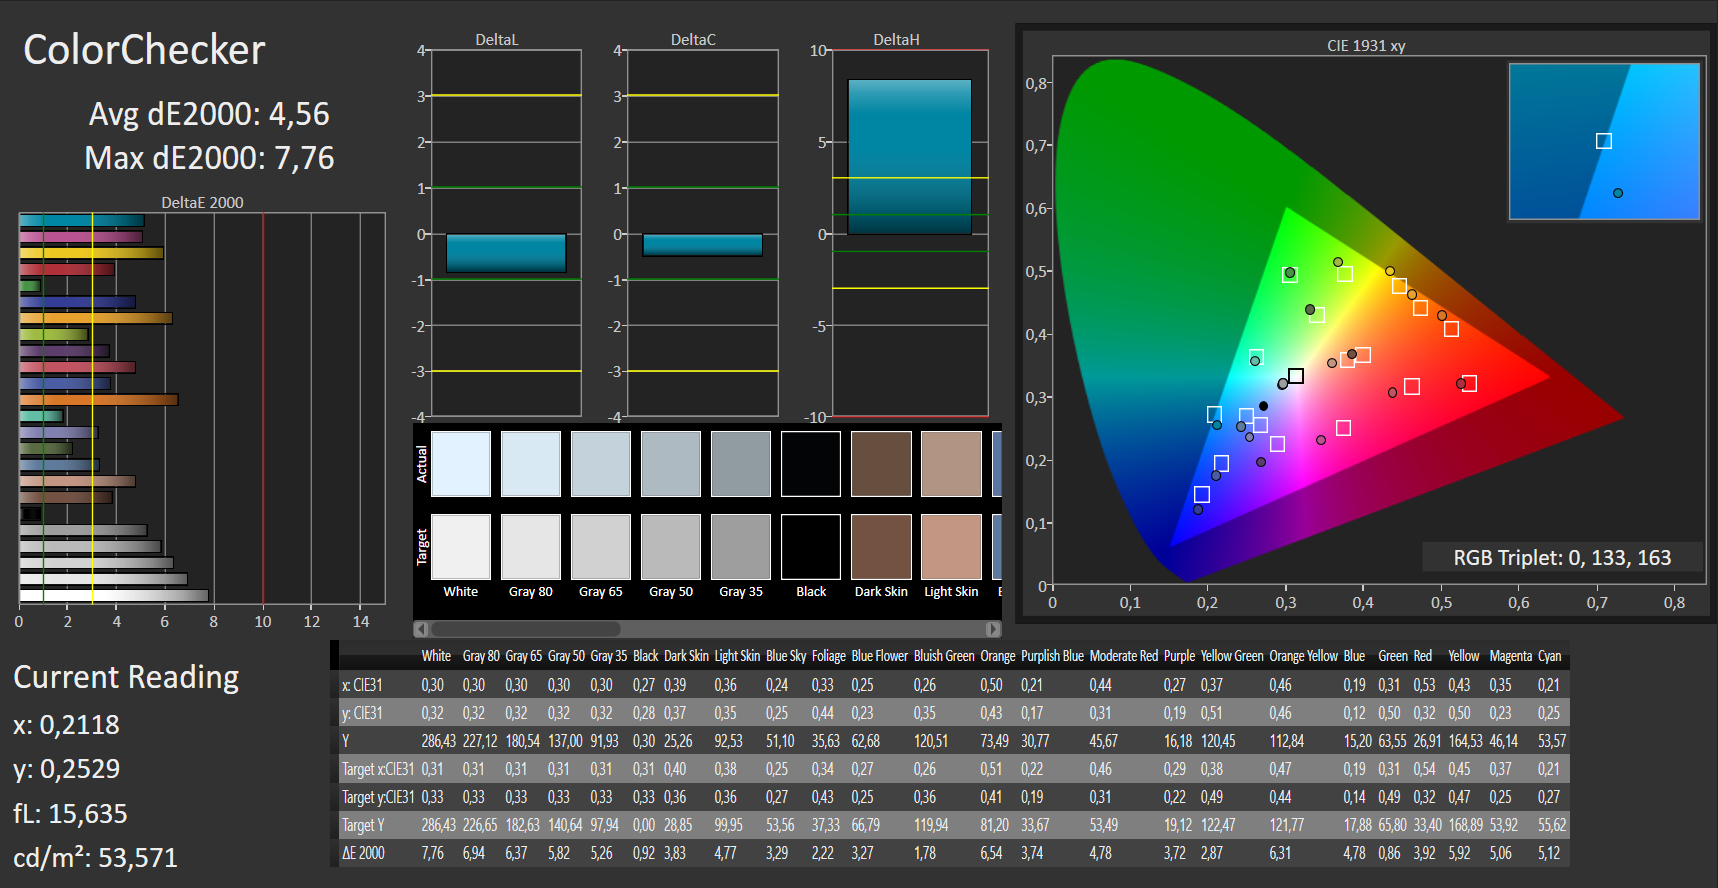
ΔE ColorChecker Calman: 4.56 | ∀{0.5-29.43 Ø4.72}
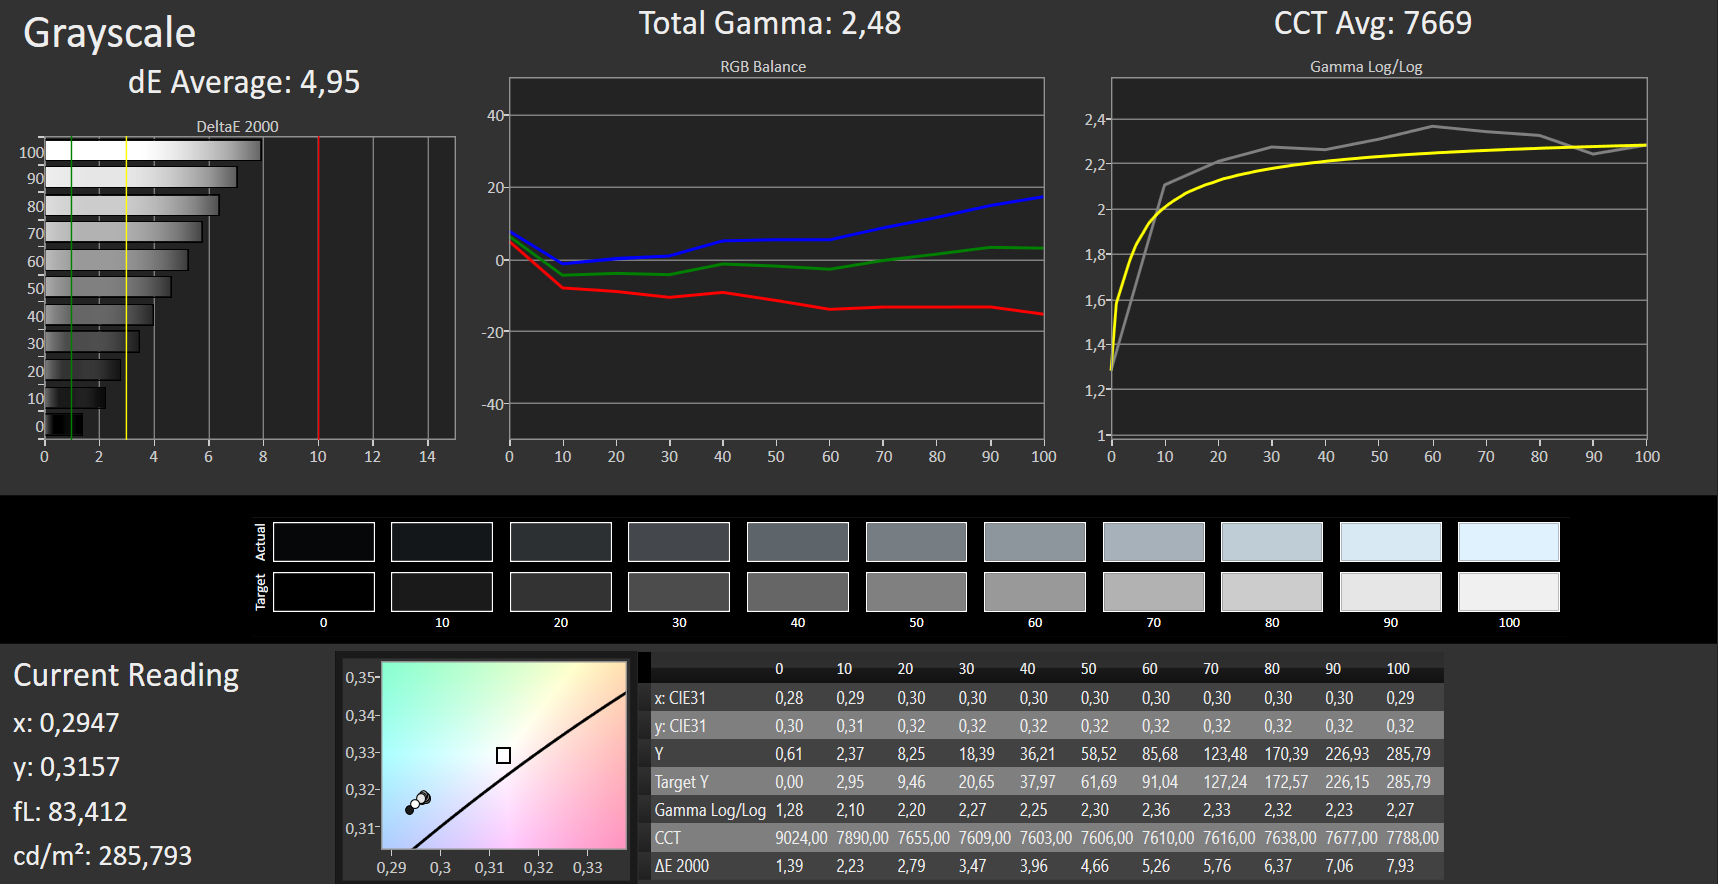
ΔE Greyscale Calman: 4.95 | ∀{0.09-98 Ø4.97}
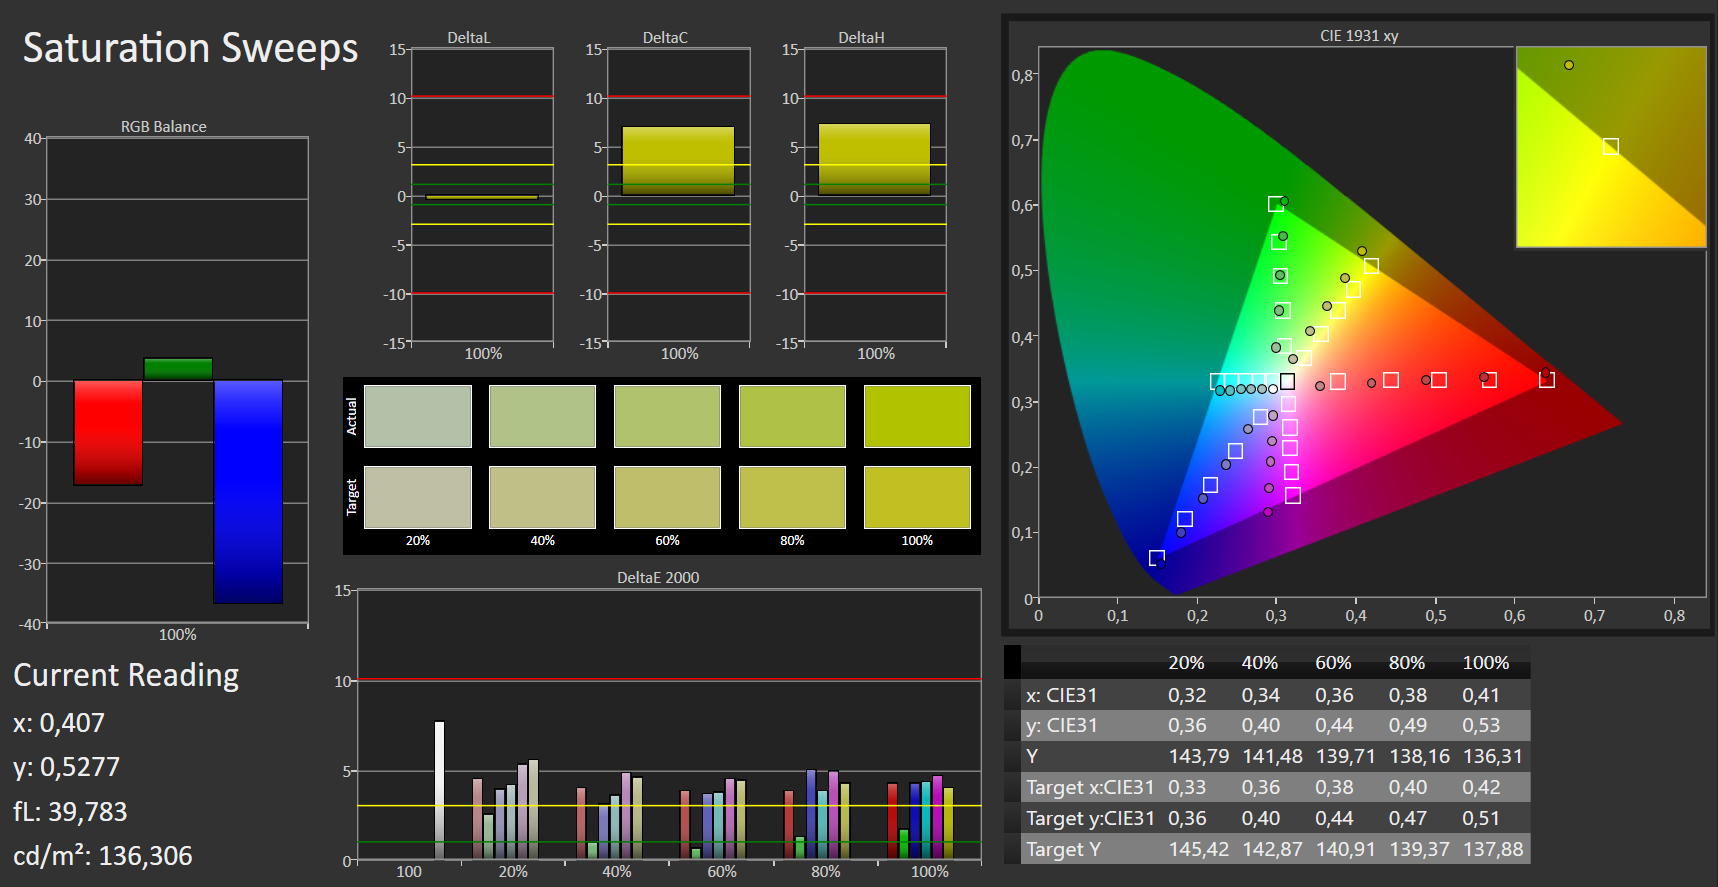
93% sRGB (Argyll 1.6.3 3D)
63.3% AdobeRGB 1998 (Argyll 3D)
86.5% sRGB (Argyll 3D)
63.6% Display P3 (Argyll 3D)
Gamma: 2.48
CCT: 7669 K
| HP Pavilion 17-x110ng Chi Mei CMN1738, , 1920x1080, 17.3" | Acer Aspire E5-575G-549D Chi Mei CMN15C4, , 1920x1080, 15.6" | Lenovo IdeaPad 510-15IKB 80SV0087GE BOE HF NV156FHM-N42, , 1920x1080, 15.6" | Acer Aspire F15 F5-573G-53V1 Innolux N156HGE-EAL, , 1920x1080, 15.6" | Lenovo ThinkPad E470-20H2S00400 N140HCA-EAB, , 1920x1080, 14" | HP Pavilion 15-aw004ng W8Y60EA Chi Mei, , 1920x1080, 15.6" | |
|---|---|---|---|---|---|---|
| Display | -37% | -30% | 26% | -32% | -34% | |
| Display P3 Coverage (%) | 63.6 | 38.57 -39% | 42.66 -33% | 84.2 32% | 41.23 -35% | 40.35 -37% |
| sRGB Coverage (%) | 86.5 | 57.4 -34% | 64.1 -26% | 99.7 15% | 61.4 -29% | 60.3 -30% |
| AdobeRGB 1998 Coverage (%) | 63.3 | 39.89 -37% | 44.08 -30% | 82.7 31% | 42.67 -33% | 41.71 -34% |
| Response Times | 13% | -26% | 8% | -1% | 12% | |
| Response Time Grey 50% / Grey 80% * (ms) | 41 ? | 39 ? 5% | 51 ? -24% | 44 ? -7% | 40.8 ? -0% | 41 ? -0% |
| Response Time Black / White * (ms) | 30 ? | 24 ? 20% | 38 ? -27% | 23 ? 23% | 30.4 ? -1% | 23 ? 23% |
| PWM Frequency (Hz) | 200 ? | 50 ? | 1000 ? | |||
| Screen | -41% | 21% | -57% | -14% | -50% | |
| Brightness middle (cd/m²) | 288 | 176 -39% | 291 1% | 234 -19% | 244 -15% | 240 -17% |
| Brightness (cd/m²) | 285 | 169 -41% | 265 -7% | 219 -23% | 231 -19% | 228 -20% |
| Brightness Distribution (%) | 88 | 91 3% | 86 -2% | 80 -9% | 89 1% | 89 1% |
| Black Level * (cd/m²) | 0.61 | 0.47 23% | 0.23 62% | 0.48 21% | 0.37 39% | 0.49 20% |
| Contrast (:1) | 472 | 374 -21% | 1265 168% | 488 3% | 659 40% | 490 4% |
| Colorchecker dE 2000 * | 4.56 | 8.83 -94% | 4.78 -5% | 11.8 -159% | 6.41 -41% | 10.96 -140% |
| Colorchecker dE 2000 max. * | 7.76 | 14.01 -81% | 9.51 -23% | 20.69 -167% | 13.4 -73% | 18.36 -137% |
| Greyscale dE 2000 * | 4.95 | 8.97 -81% | 3.49 29% | 13.3 -169% | 5.94 -20% | 11.34 -129% |
| Gamma | 2.48 89% | 2.43 91% | 2.58 85% | 2.47 89% | 2.28 96% | 2.27 97% |
| CCT | 7669 85% | 10234 64% | 6013 108% | 17098 38% | 6101 107% | 12292 53% |
| Color Space (Percent of sRGB) (%) | 93 | 57.3 -38% | 64 -31% | 100 8% | 61.1 -34% | 60 -35% |
| Color Space (Percent of AdobeRGB 1998) (%) | 36.8 | 40 | 74 | 39.3 | 39 | |
| Total Average (Program / Settings) | -22% /
-32% | -12% /
4% | -8% /
-30% | -16% /
-16% | -24% /
-38% |
* ... smaller is better
Display Response Times
| ↔ Response Time Black to White | ||
|---|---|---|
| 30 ms ... rise ↗ and fall ↘ combined | ↗ 8 ms rise | 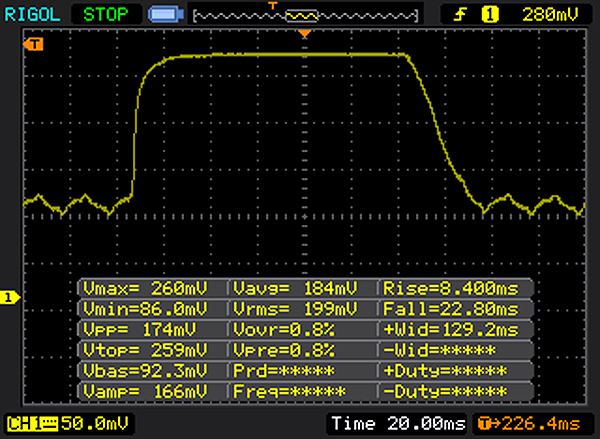 |
| ↘ 22 ms fall | ||
| The screen shows slow response rates in our tests and will be unsatisfactory for gamers. In comparison, all tested devices range from 0.1 (minimum) to 240 (maximum) ms. » 80 % of all devices are better. This means that the measured response time is worse than the average of all tested devices (19.8 ms). | ||
| ↔ Response Time 50% Grey to 80% Grey | ||
| 41 ms ... rise ↗ and fall ↘ combined | ↗ 16 ms rise | 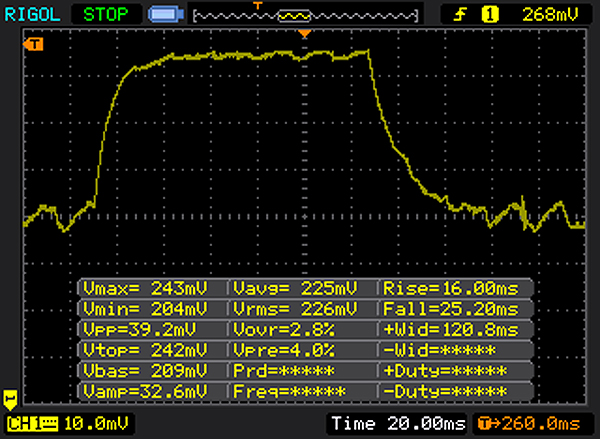 |
| ↘ 25 ms fall | ||
| The screen shows slow response rates in our tests and will be unsatisfactory for gamers. In comparison, all tested devices range from 0.165 (minimum) to 636 (maximum) ms. » 65 % of all devices are better. This means that the measured response time is worse than the average of all tested devices (31 ms). | ||
Screen Flickering / PWM (Pulse-Width Modulation)
| Screen flickering / PWM detected | 200 Hz | ≤ 90 % brightness setting | 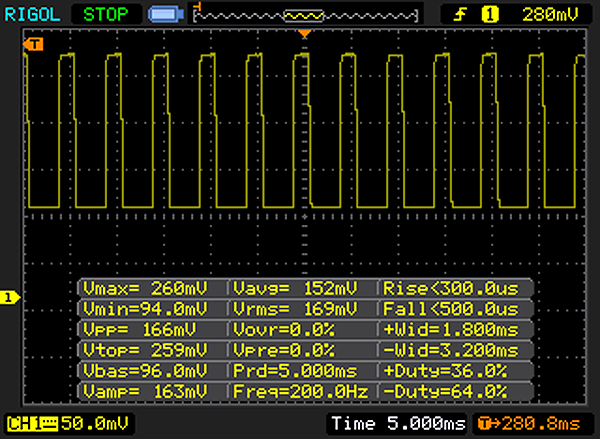 |
The display backlight flickers at 200 Hz (worst case, e.g., utilizing PWM) Flickering detected at a brightness setting of 90 % and below. There should be no flickering or PWM above this brightness setting. The frequency of 200 Hz is relatively low, so sensitive users will likely notice flickering and experience eyestrain at the stated brightness setting and below. In comparison: 52 % of all tested devices do not use PWM to dim the display. If PWM was detected, an average of 7781 (minimum: 5 - maximum: 343500) Hz was measured. | |||
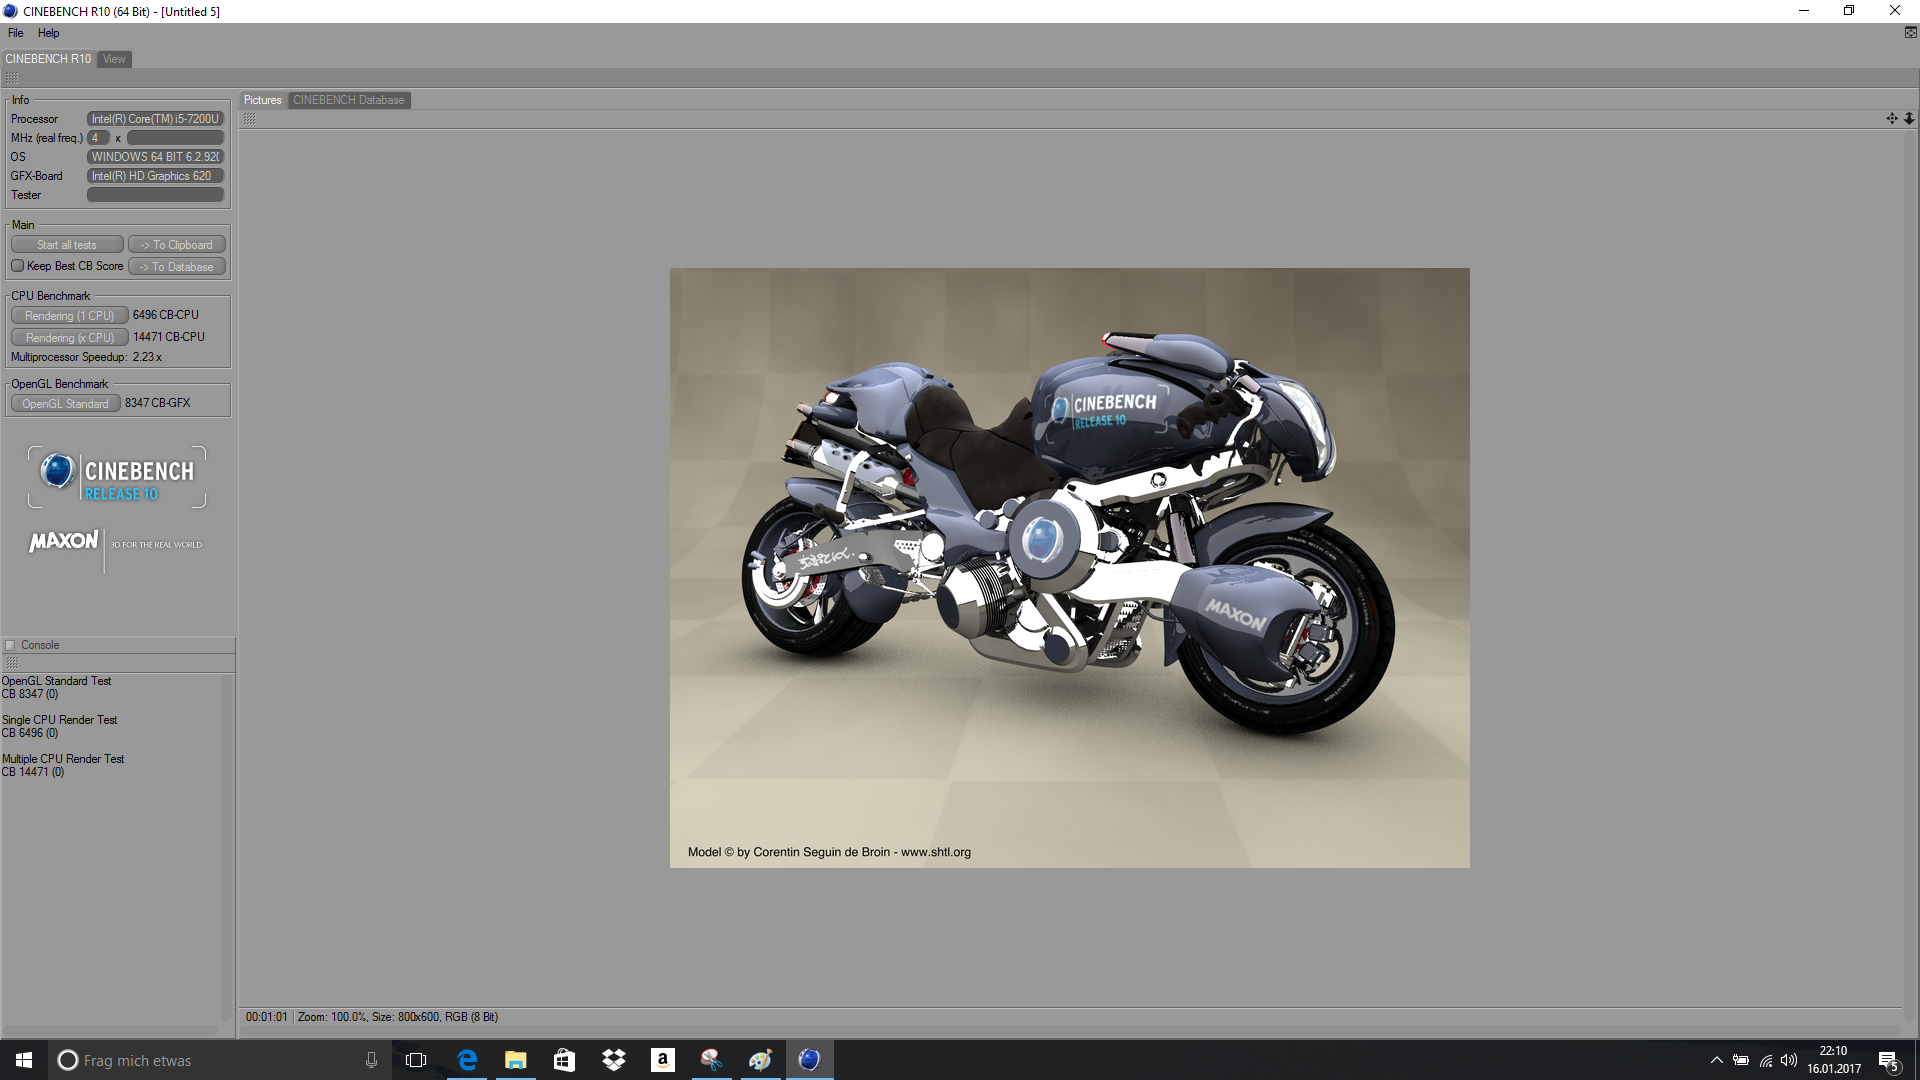
| Cinebench R10 | |
| Rendering Single CPUs 64Bit | |
| HP Pavilion 17-x110ng | |
| Acer Aspire F15 F5-573G-53V1 | |
| Rendering Multiple CPUs 64Bit | |
| HP Pavilion 17-x110ng | |
| Acer Aspire F15 F5-573G-53V1 | |
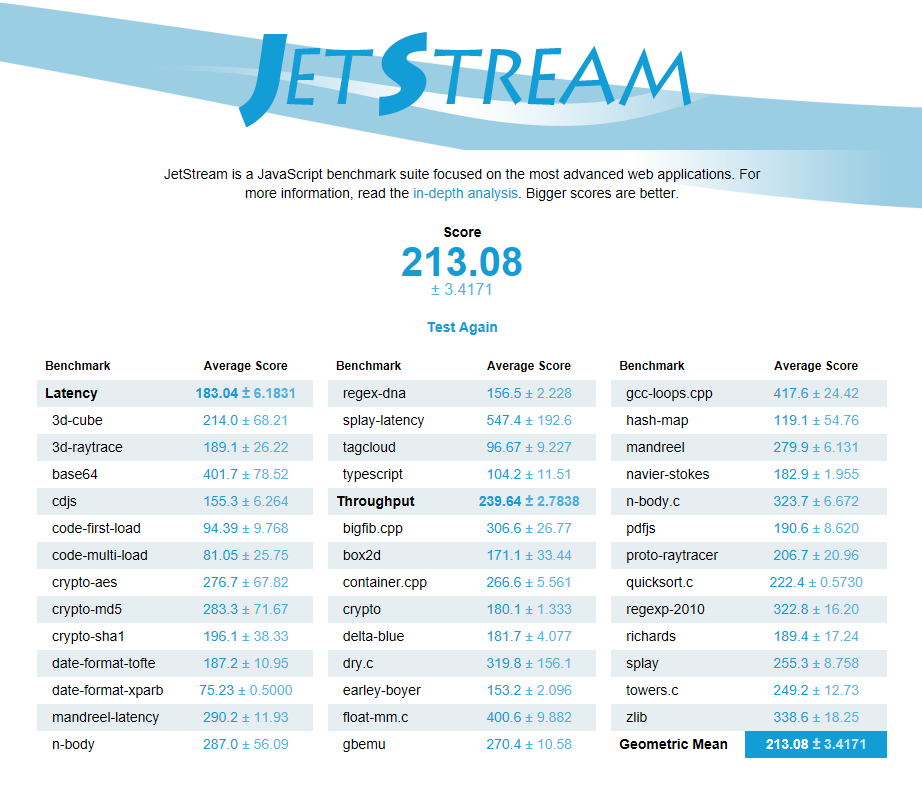
| JetStream 1.1 - 1.1 Total | |
| Lenovo IdeaPad 510-15IKB 80SV0087GE | |
| Acer Aspire E5-575G-549D | |
| HP Pavilion 17-x110ng | |
| Lenovo ThinkPad E470-20H2S00400 | |
| Acer Aspire F15 F5-573G-53V1 | |
| HP Pavilion 15-aw004ng W8Y60EA | |
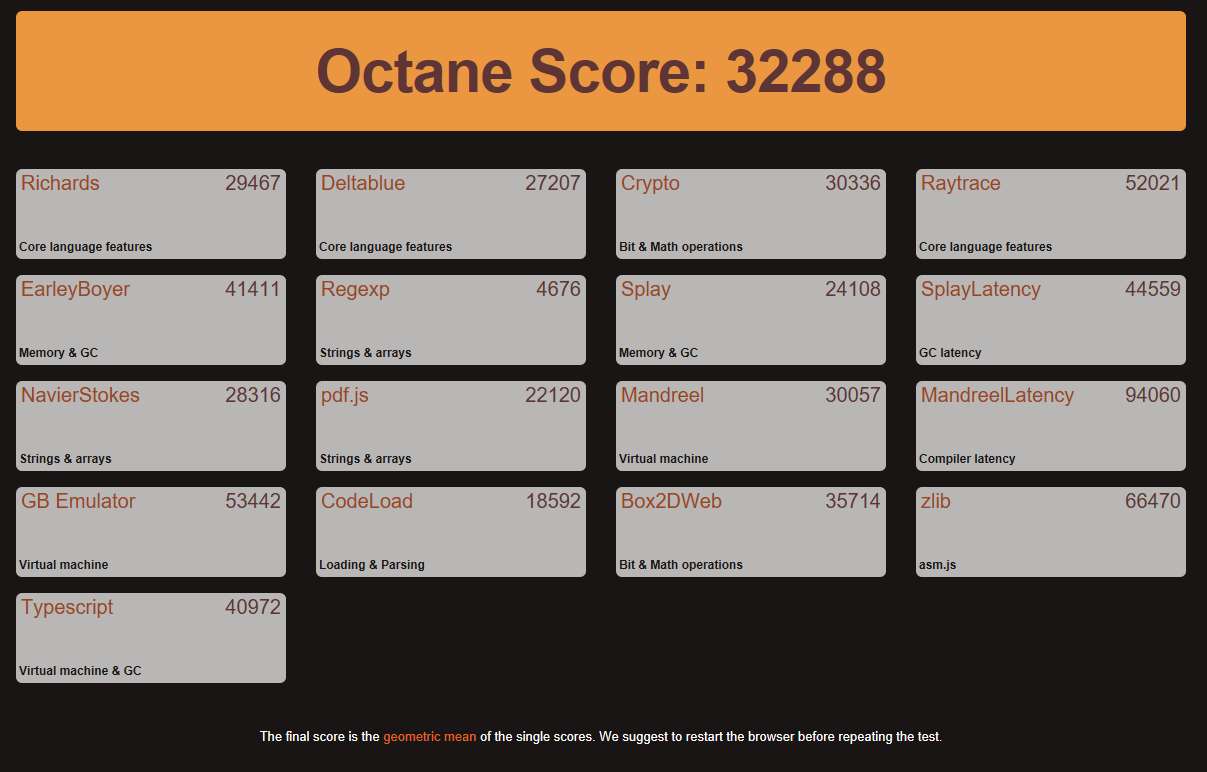
| Octane V2 - Total Score | |
| Lenovo ThinkPad E470-20H2S00400 | |
| HP Pavilion 17-x110ng | |
| Acer Aspire E5-575G-549D | |
| Acer Aspire F15 F5-573G-53V1 | |
| HP Pavilion 15-aw004ng W8Y60EA | |
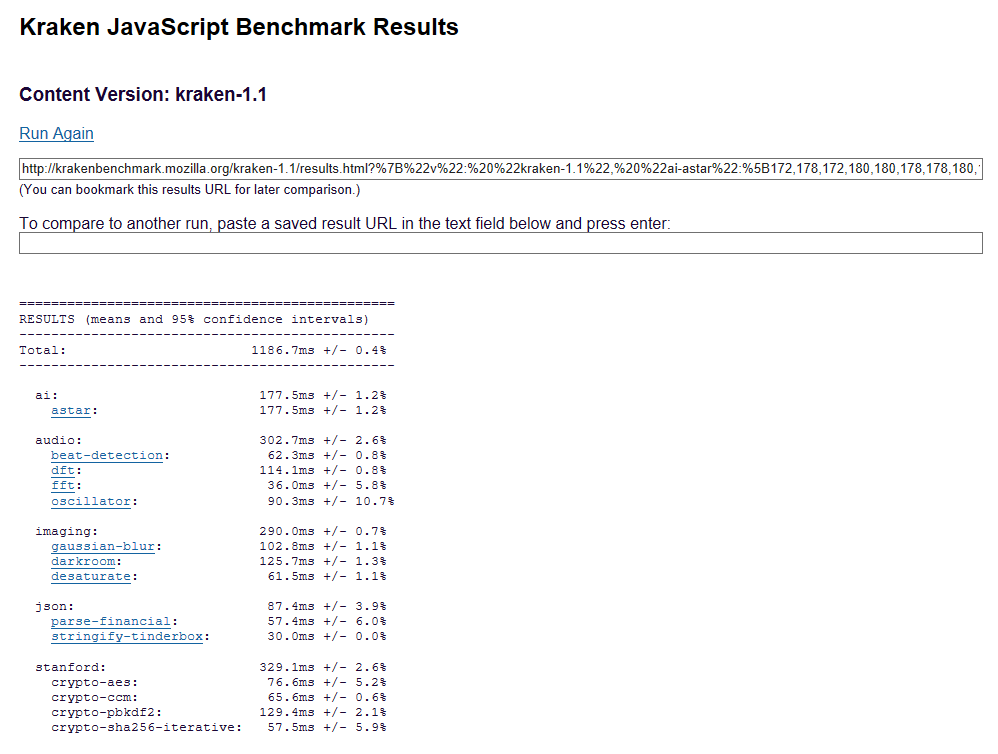
| Mozilla Kraken 1.1 - Total | |
| HP Pavilion 15-aw004ng W8Y60EA | |
| Acer Aspire F15 F5-573G-53V1 | |
| HP Pavilion 17-x110ng | |
| Lenovo ThinkPad E470-20H2S00400 | |
| Acer Aspire E5-575G-549D | |
* ... smaller is better
| PCMark 7 | |
| Productivity | |
| HP Pavilion 17-x110ng | |
| HP Pavilion 15-aw004ng W8Y60EA | |
| Acer Aspire F15 F5-573G-53V1 | |
| Score | |
| HP Pavilion 17-x110ng | |
| HP Pavilion 15-aw004ng W8Y60EA | |
| Acer Aspire F15 F5-573G-53V1 | |
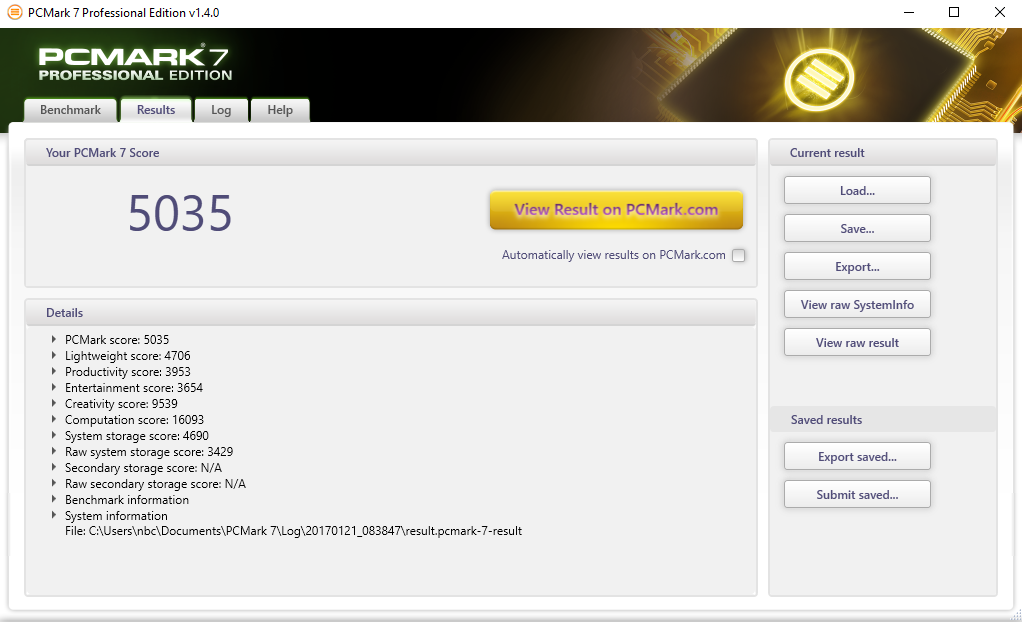
| PCMark 7 Score | 5035 points | |
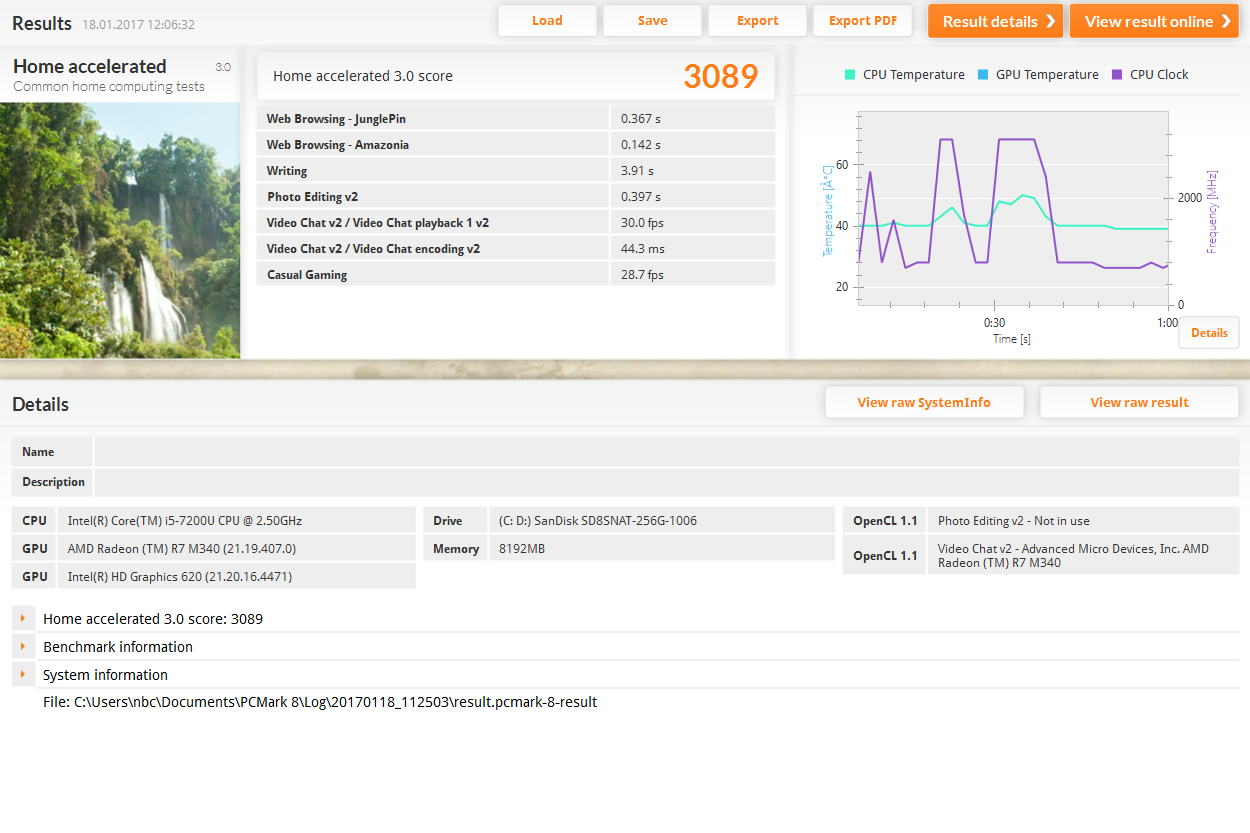
| PCMark 8 Home Score Accelerated v2 | 3102 points | |
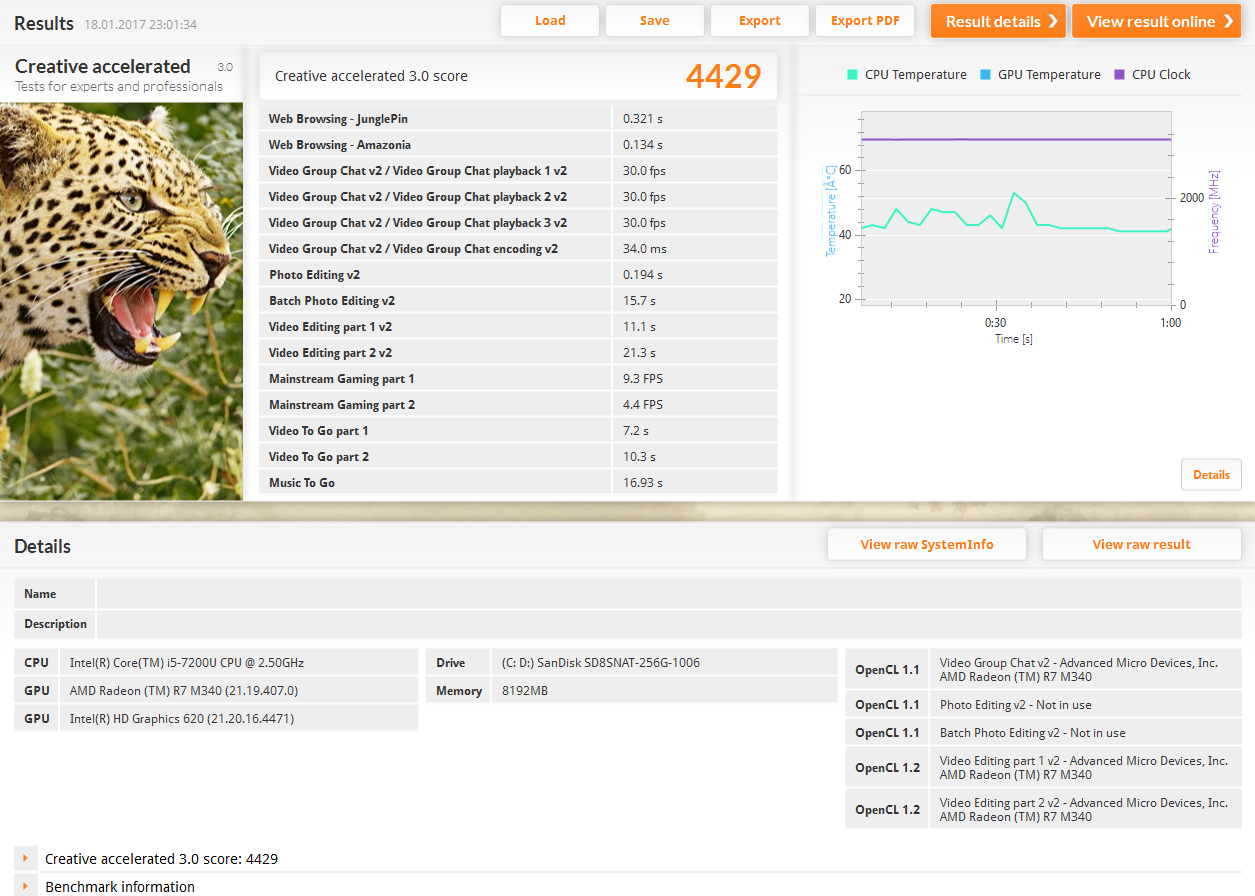
| PCMark 8 Creative Score Accelerated v2 | 4429 points | |
Help | ||
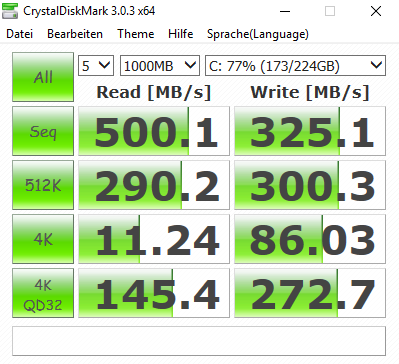
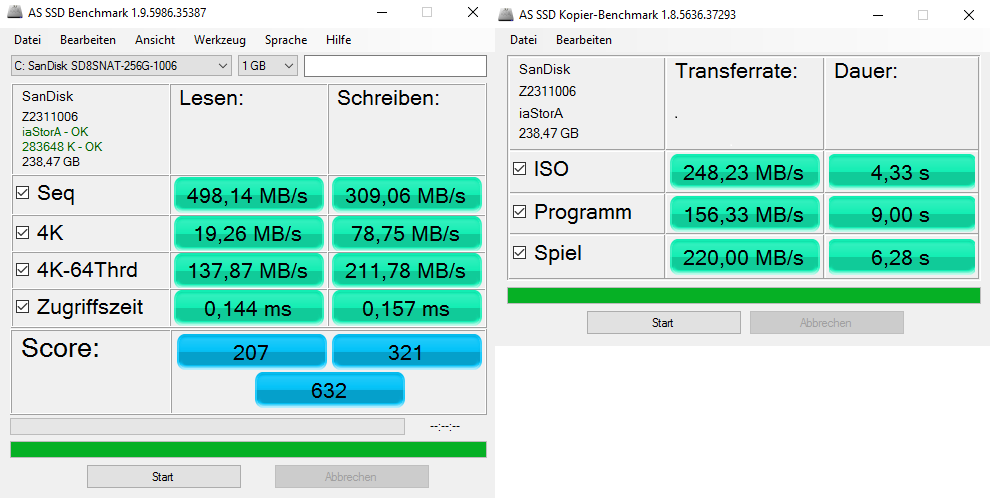
| HP Pavilion 17-x110ng SanDisk Z400s SD8SNAT-256G | Acer Aspire E5-575G-549D Toshiba MQ01ABD100 | Lenovo IdeaPad 510-15IKB 80SV0087GE Liteonit CV3-DE256 | Acer Aspire F15 F5-573G-53V1 WDC Scorpio Blue WD10JPVX-22JC3T0 | Lenovo ThinkPad E470-20H2S00400 SanDisk X400 SED 256GB, SATA (SD8TB8U-256G) | HP Pavilion 15-aw004ng W8Y60EA | |
|---|---|---|---|---|---|---|
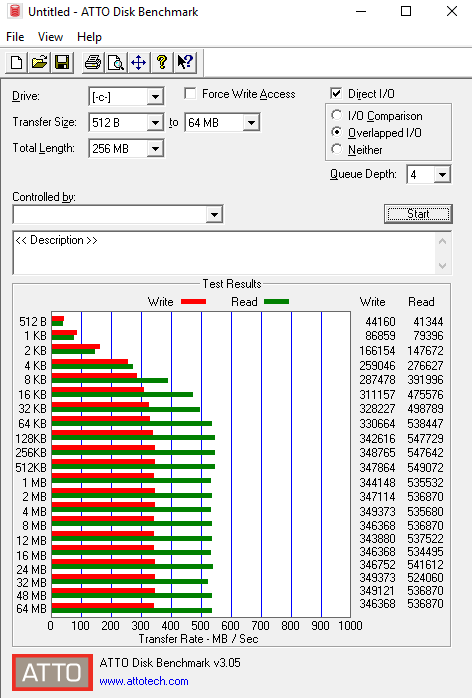
| CrystalDiskMark 3.0 | -92% | 40% | -89% | 39% | -10% | |
| Read Seq (MB/s) | 500 | 95.3 -81% | 469.2 -6% | 108.1 -78% | 476.5 -5% | 503 1% |
| Write Seq (MB/s) | 325.1 | 85.6 -74% | 431.5 33% | 105.6 -68% | 458.7 41% | 316.6 -3% |
| Read 512 (MB/s) | 290.2 | 29.32 -90% | 338.3 17% | 35.32 -88% | 346.4 19% | 261.9 -10% |
| Write 512 (MB/s) | 300.3 | 25.93 -91% | 297.9 -1% | 46.13 -85% | 291.1 -3% | 281.2 -6% |
| Read 4k (MB/s) | 11.24 | 0.366 -97% | 28.68 155% | 0.413 -96% | 35.15 213% | 17.04 52% |
| Write 4k (MB/s) | 86 | 0.726 -99% | 66.8 -22% | 0.9 -99% | 78.8 -8% | 46.55 -46% |
| Read 4k QD32 (MB/s) | 145.4 | 0.647 -100% | 364.7 151% | 0.895 -99% | 276 90% | 125 -14% |
| Write 4k QD32 (MB/s) | 272.7 | 0.722 -100% | 245.9 -10% | 0.884 -100% | 178.3 -35% | 131.4 -52% |

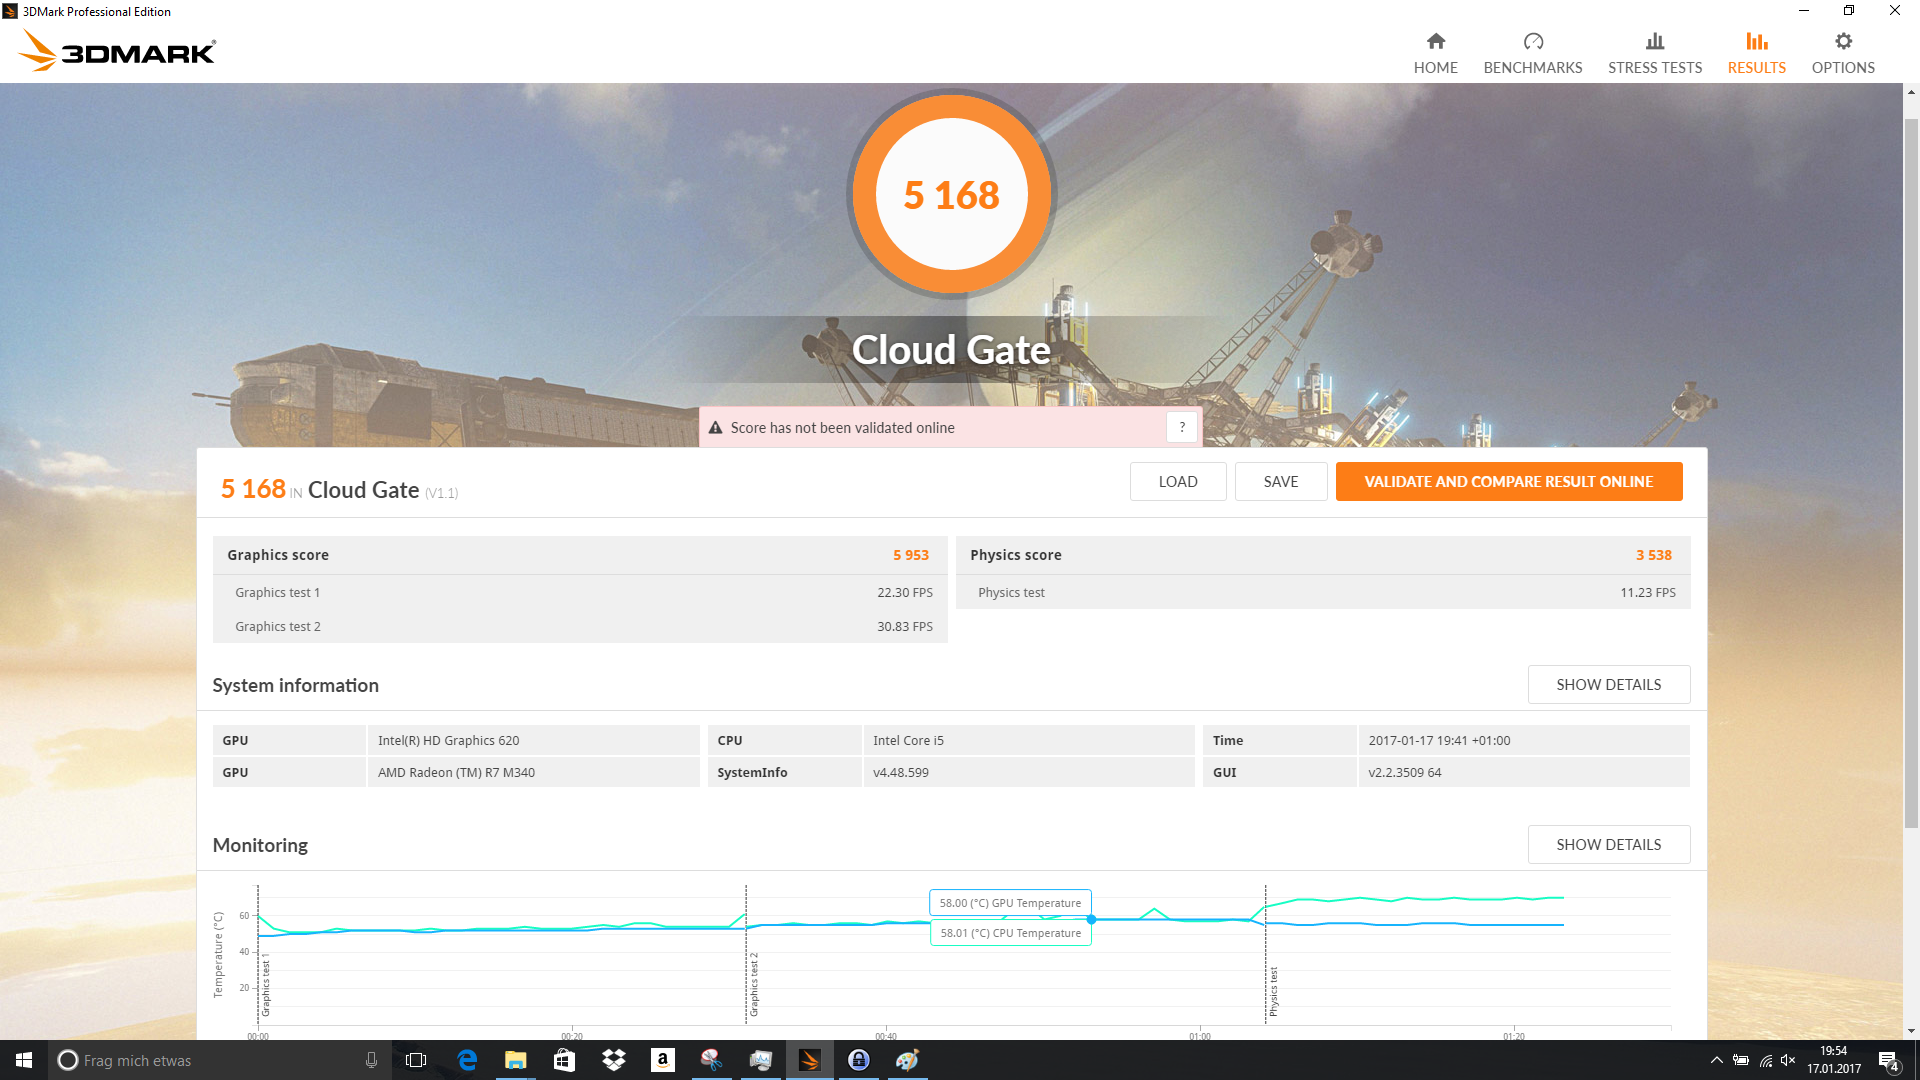
| 3DMark | |
| 1280x720 Cloud Gate Standard Graphics | |
| Acer Aspire E5-575G-549D | |
| Acer Aspire F15 F5-573G-53V1 | |
| HP Pavilion 15-aw004ng W8Y60EA | |
| Lenovo ThinkPad E470-20H2S00400 | |
| HP Pavilion 17-x110ng | |
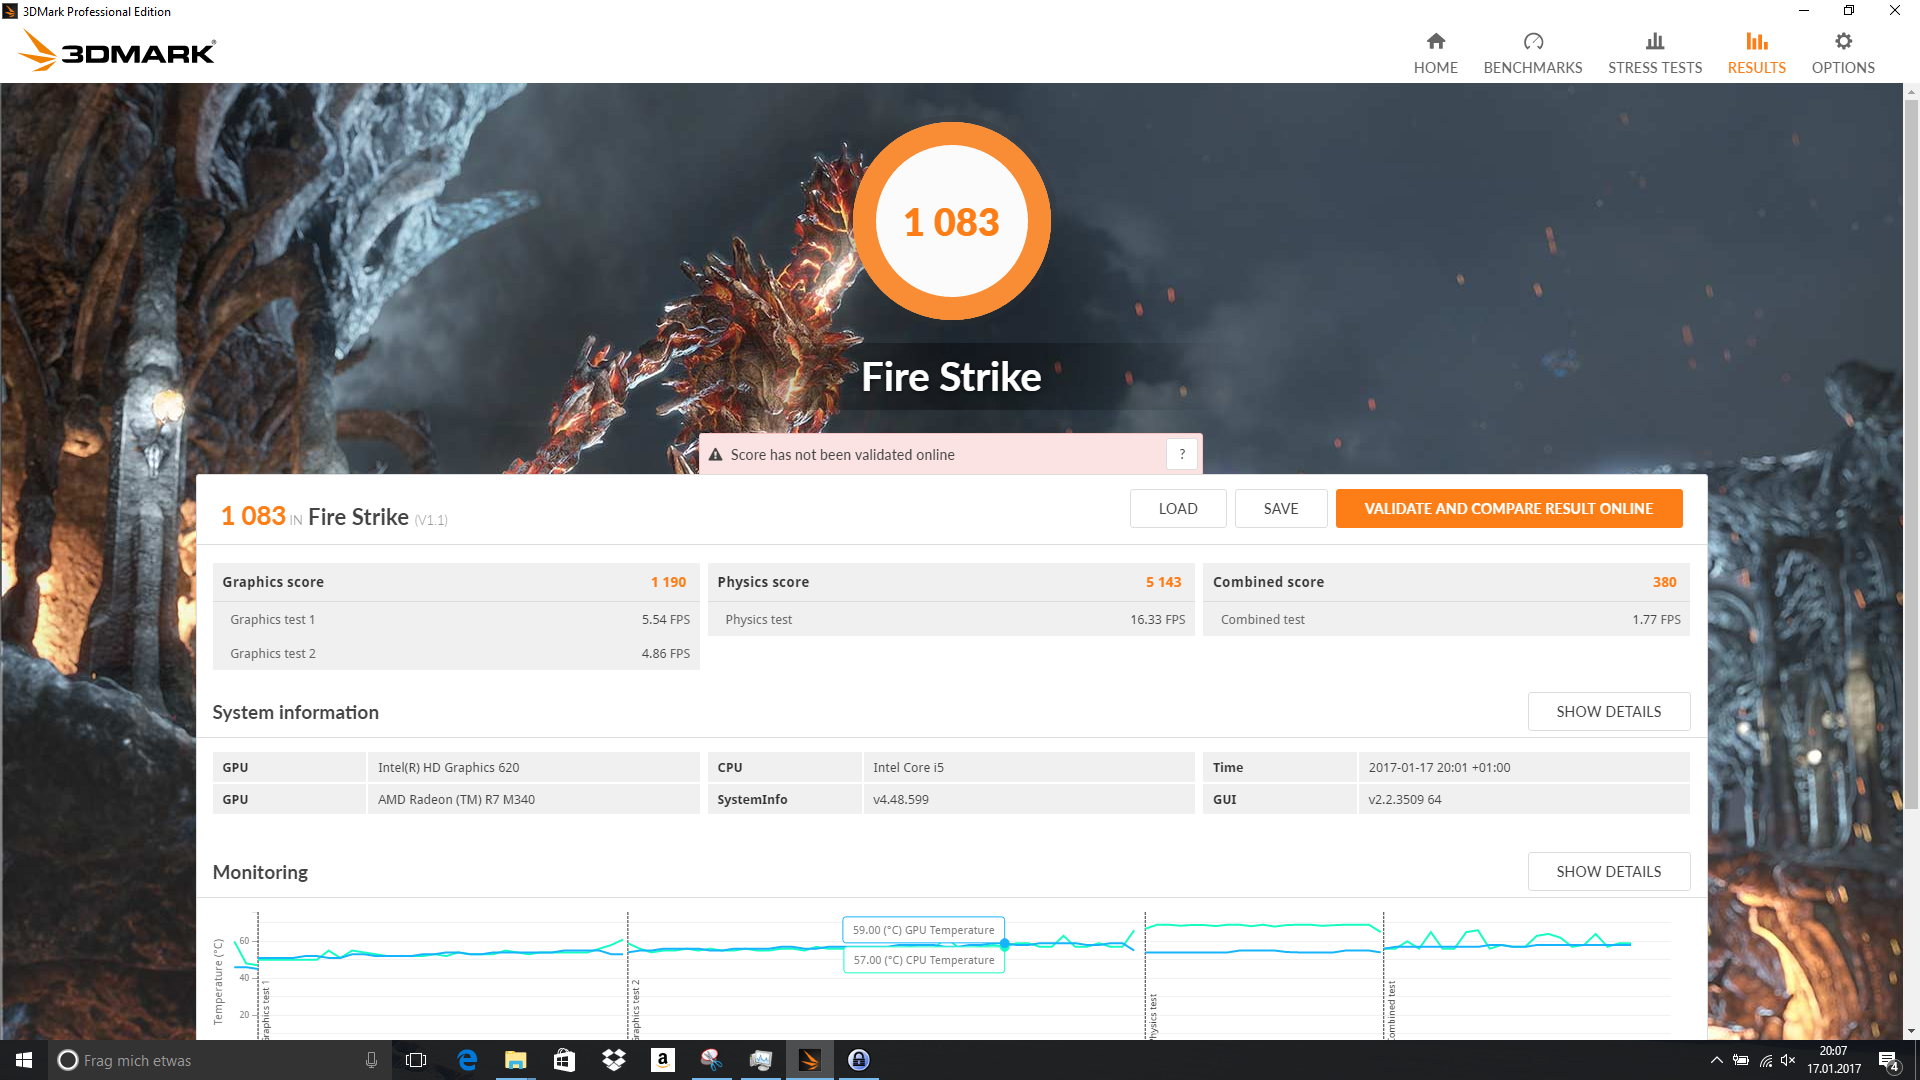
| 1920x1080 Fire Strike Graphics | |
| Acer Aspire E5-575G-549D | |
| Acer Aspire F15 F5-573G-53V1 | |
| HP Pavilion 15-aw004ng W8Y60EA | |
| Lenovo ThinkPad E470-20H2S00400 | |
| HP Pavilion 17-x110ng | |
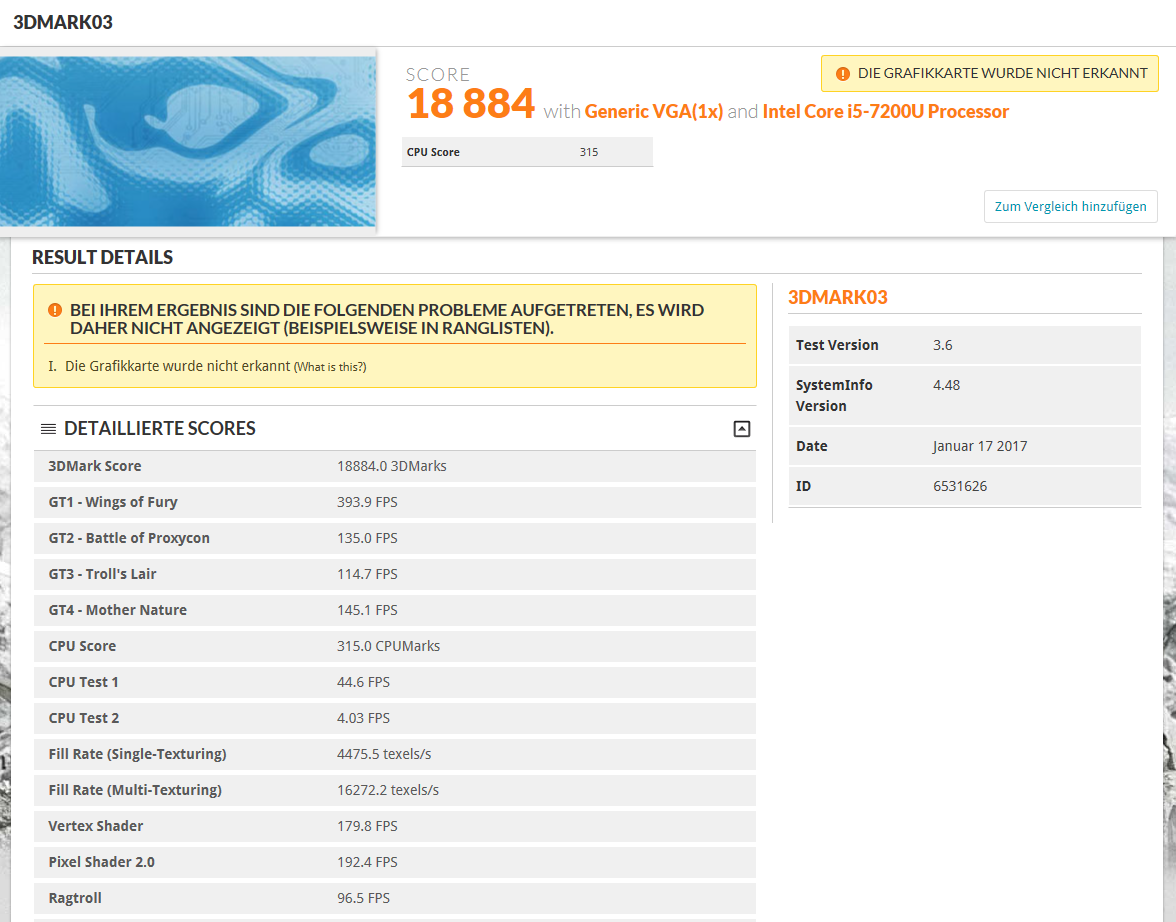
| 3DMark 03 Standard | 18884 points | |
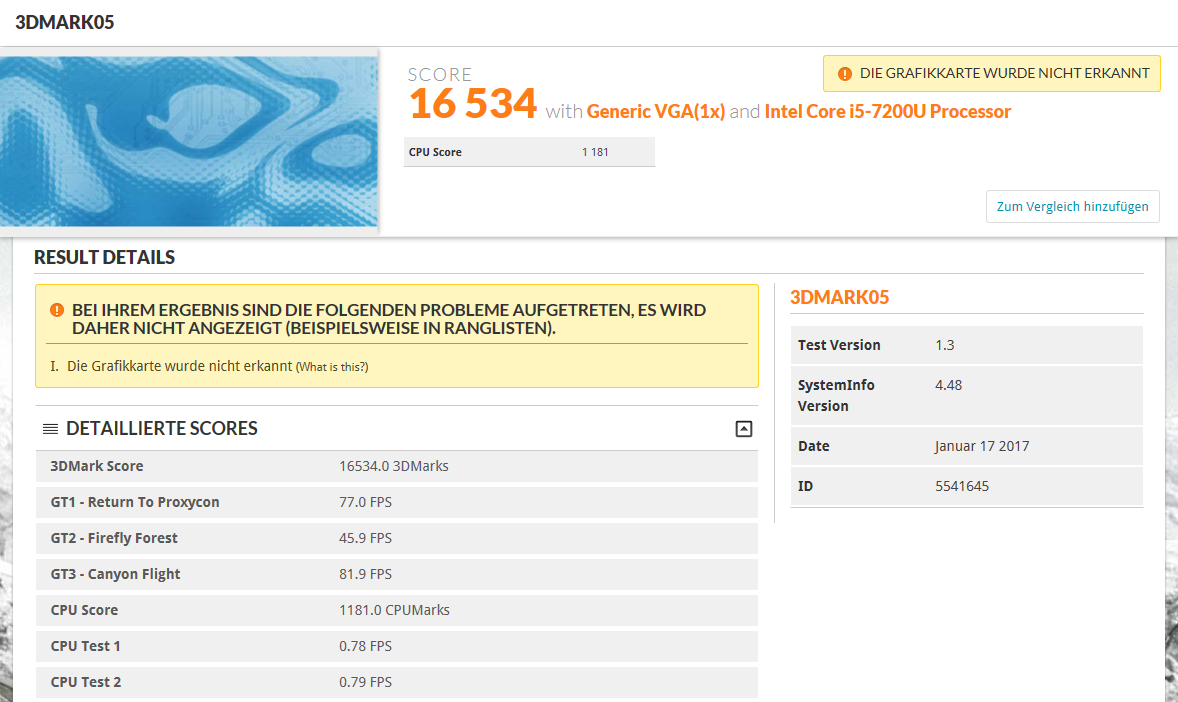
| 3DMark 05 Standard | 16534 points | |
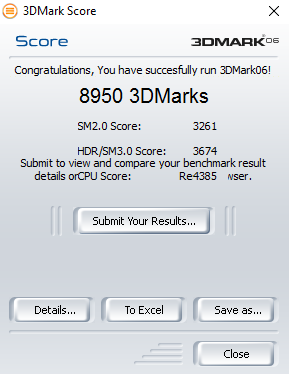
| 3DMark 06 Standard Score | 8950 points | |
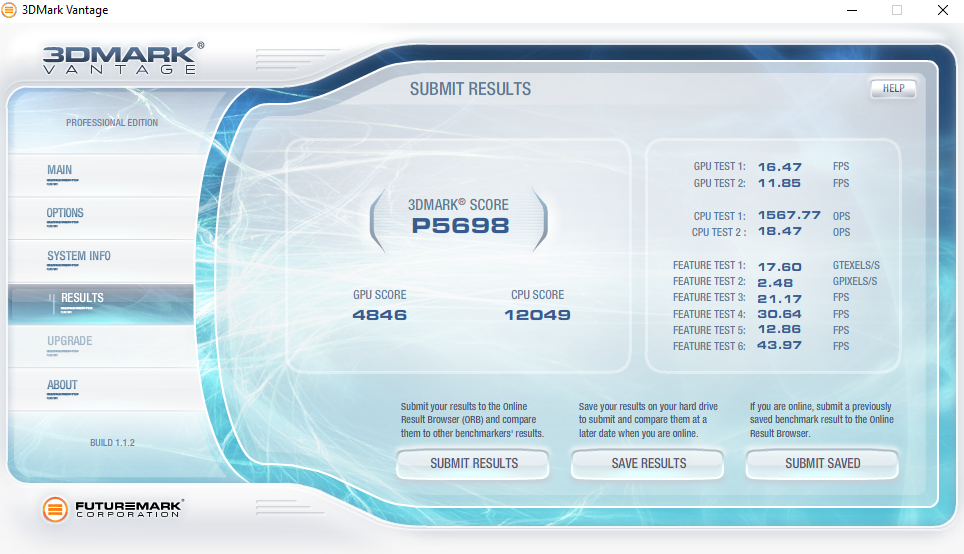
| 3DMark Vantage P Result | 5698 points | |
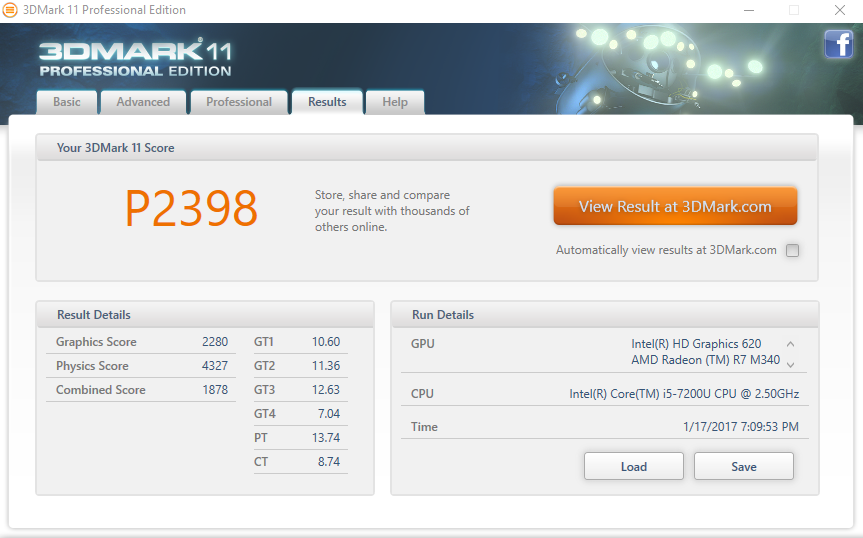
| 3DMark 11 Performance | 2398 points | |
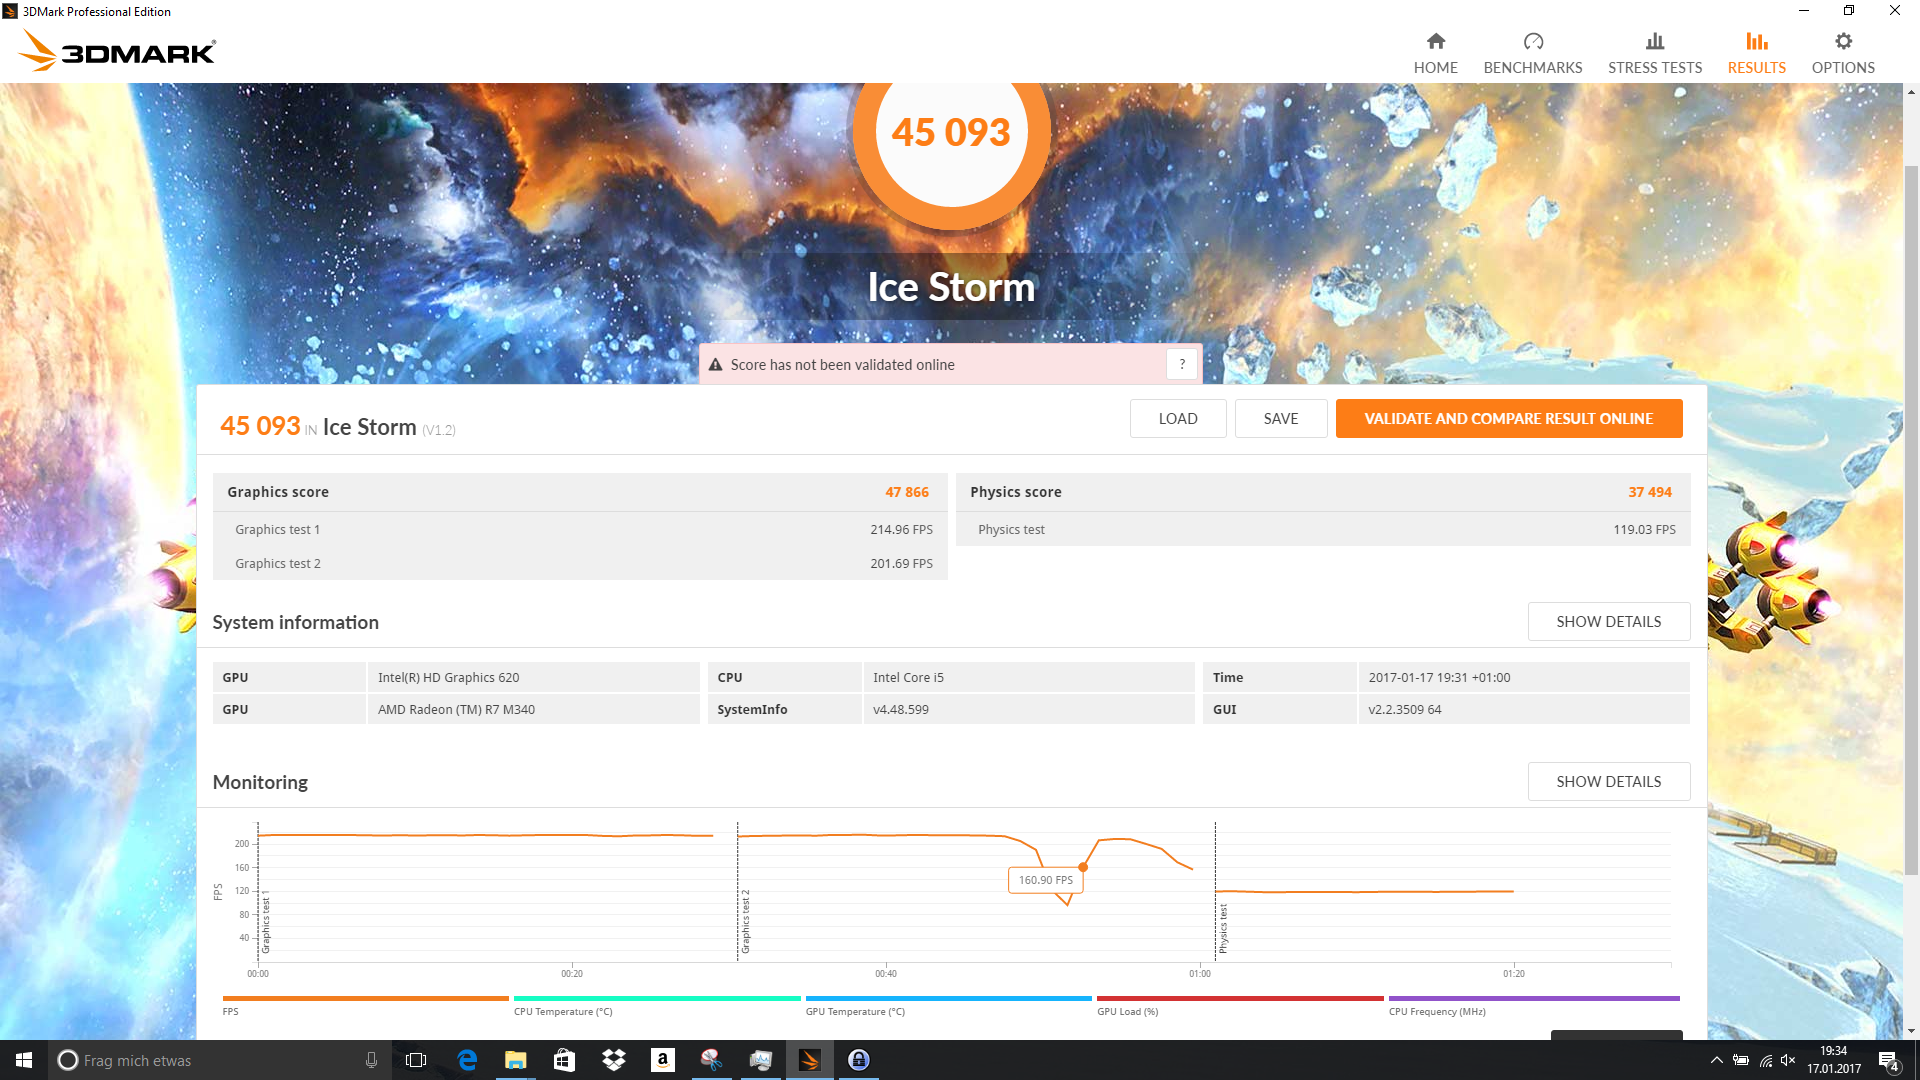
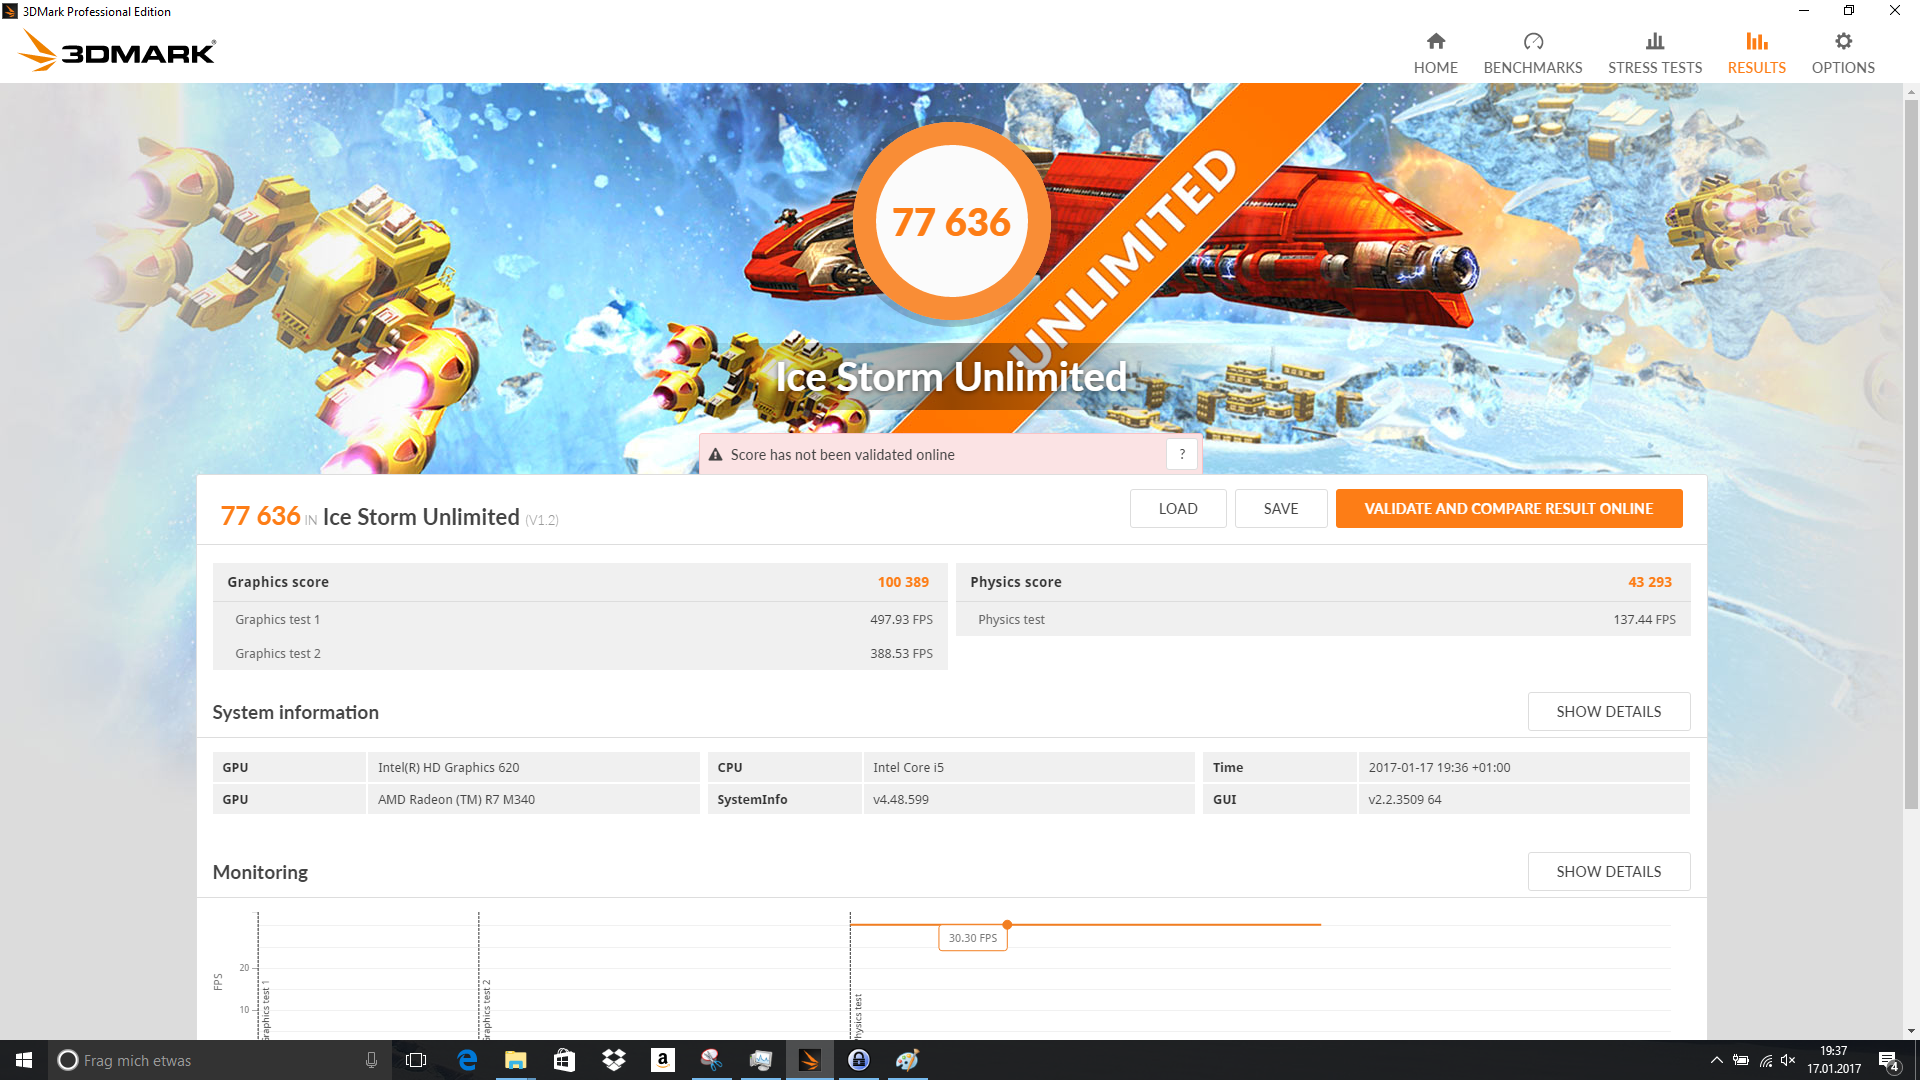
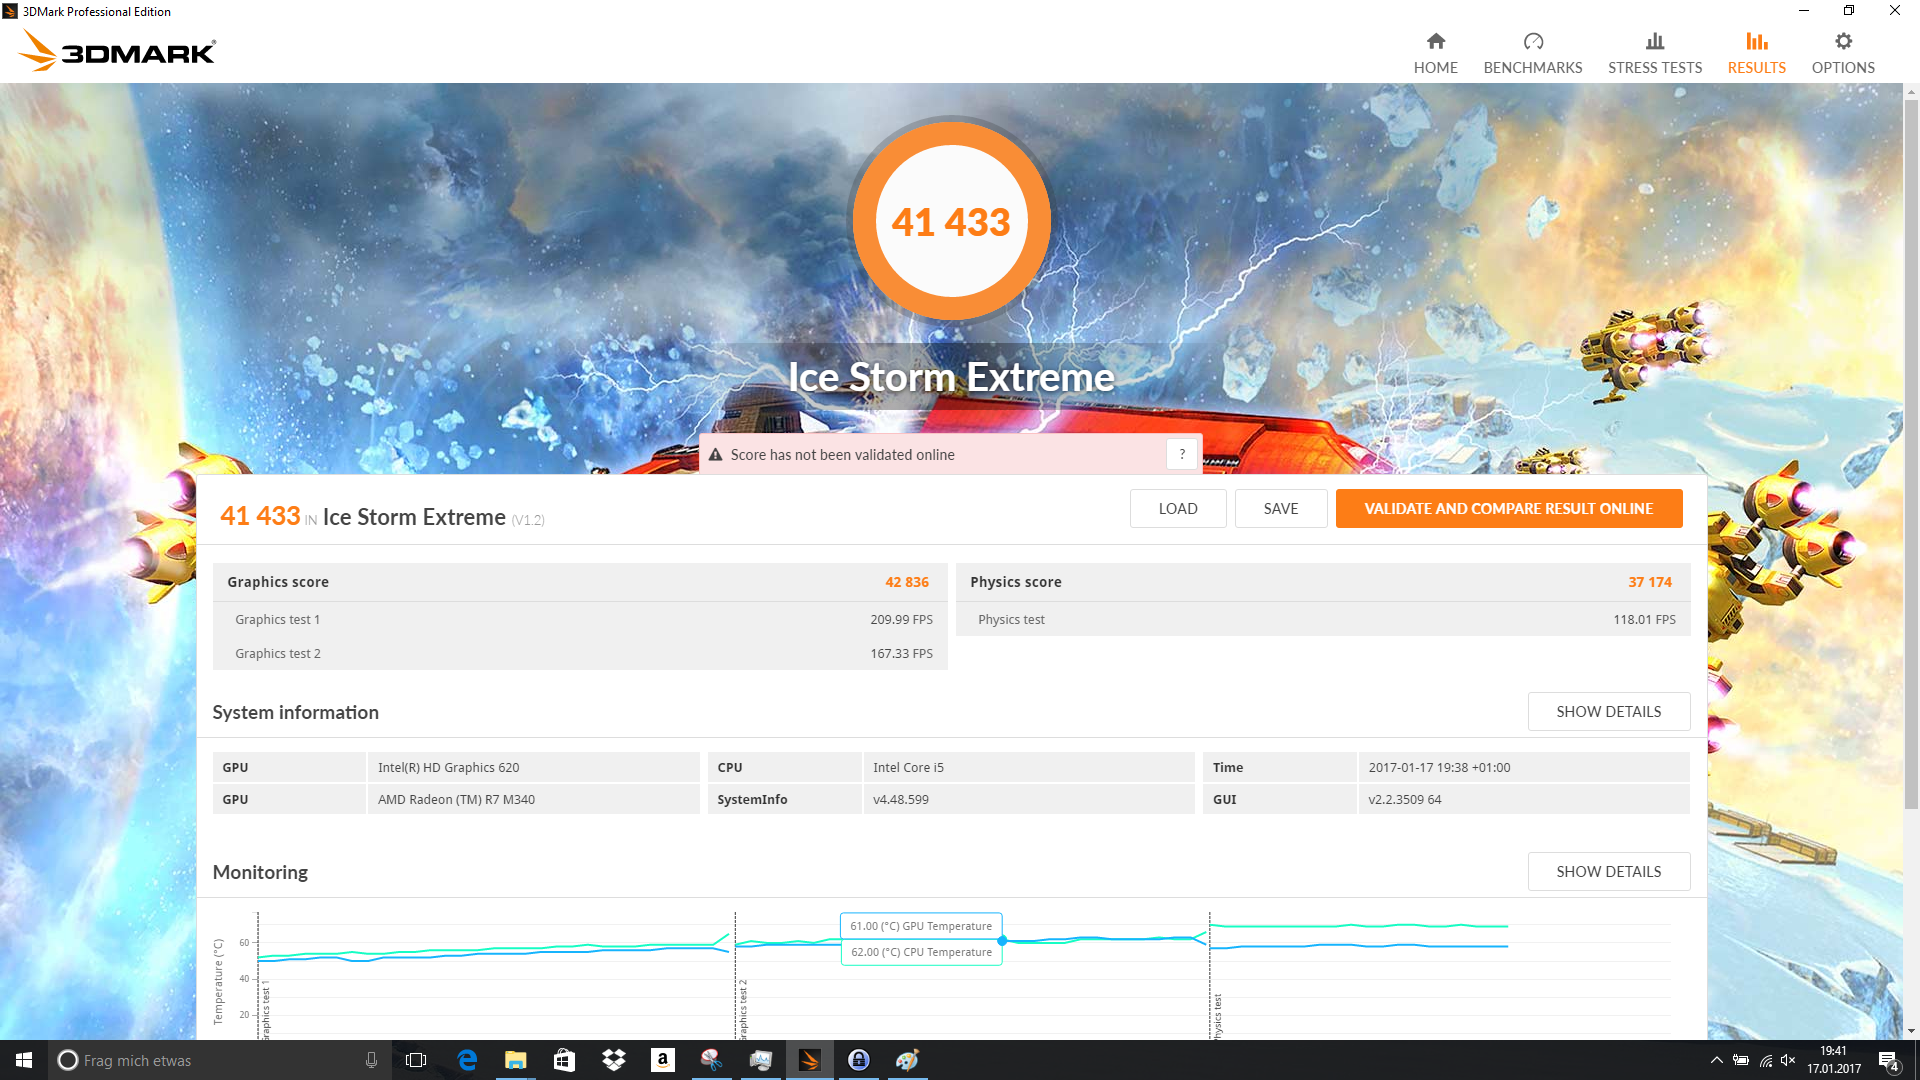
| 3DMark Ice Storm Standard Score | 45093 points | |
| 3DMark Cloud Gate Standard Score | 5168 points | |
| 3DMark Fire Strike Score | 1083 points | |
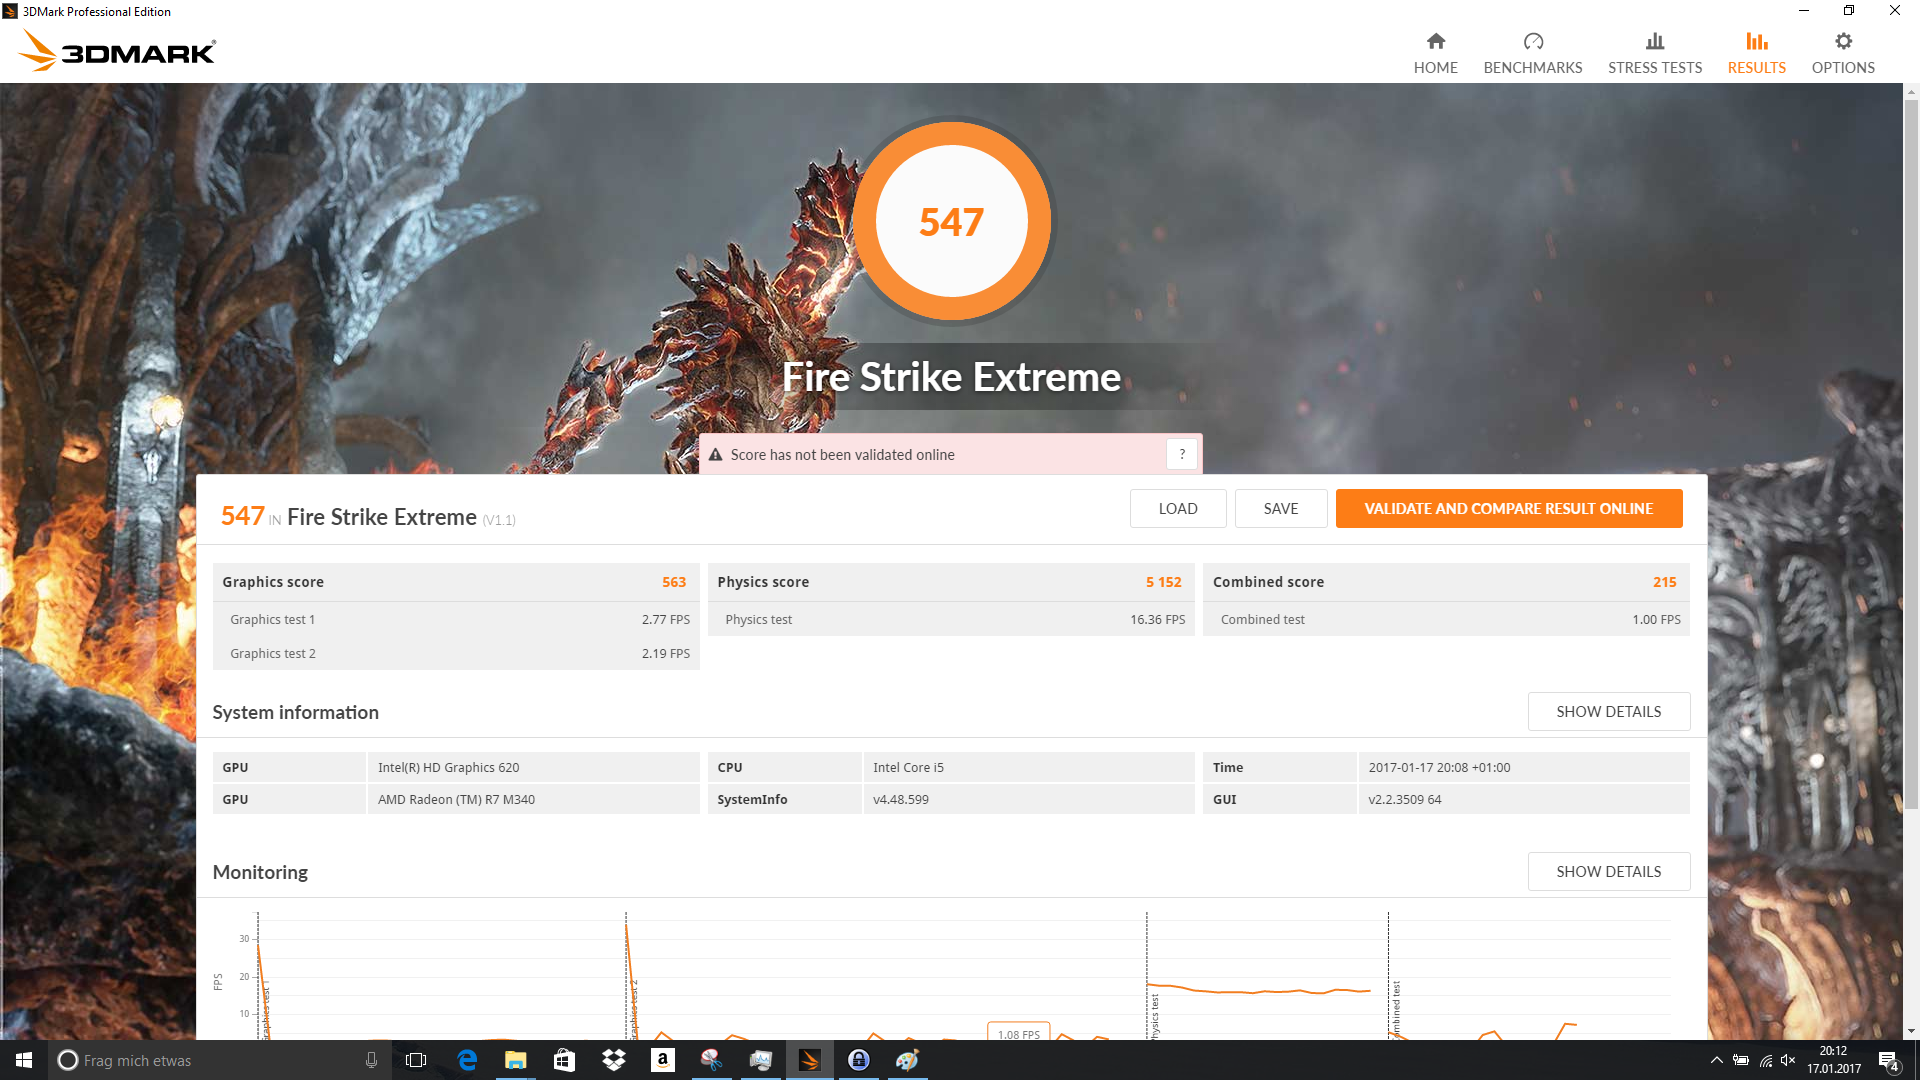
| 3DMark Fire Strike Extreme Score | 547 points | |
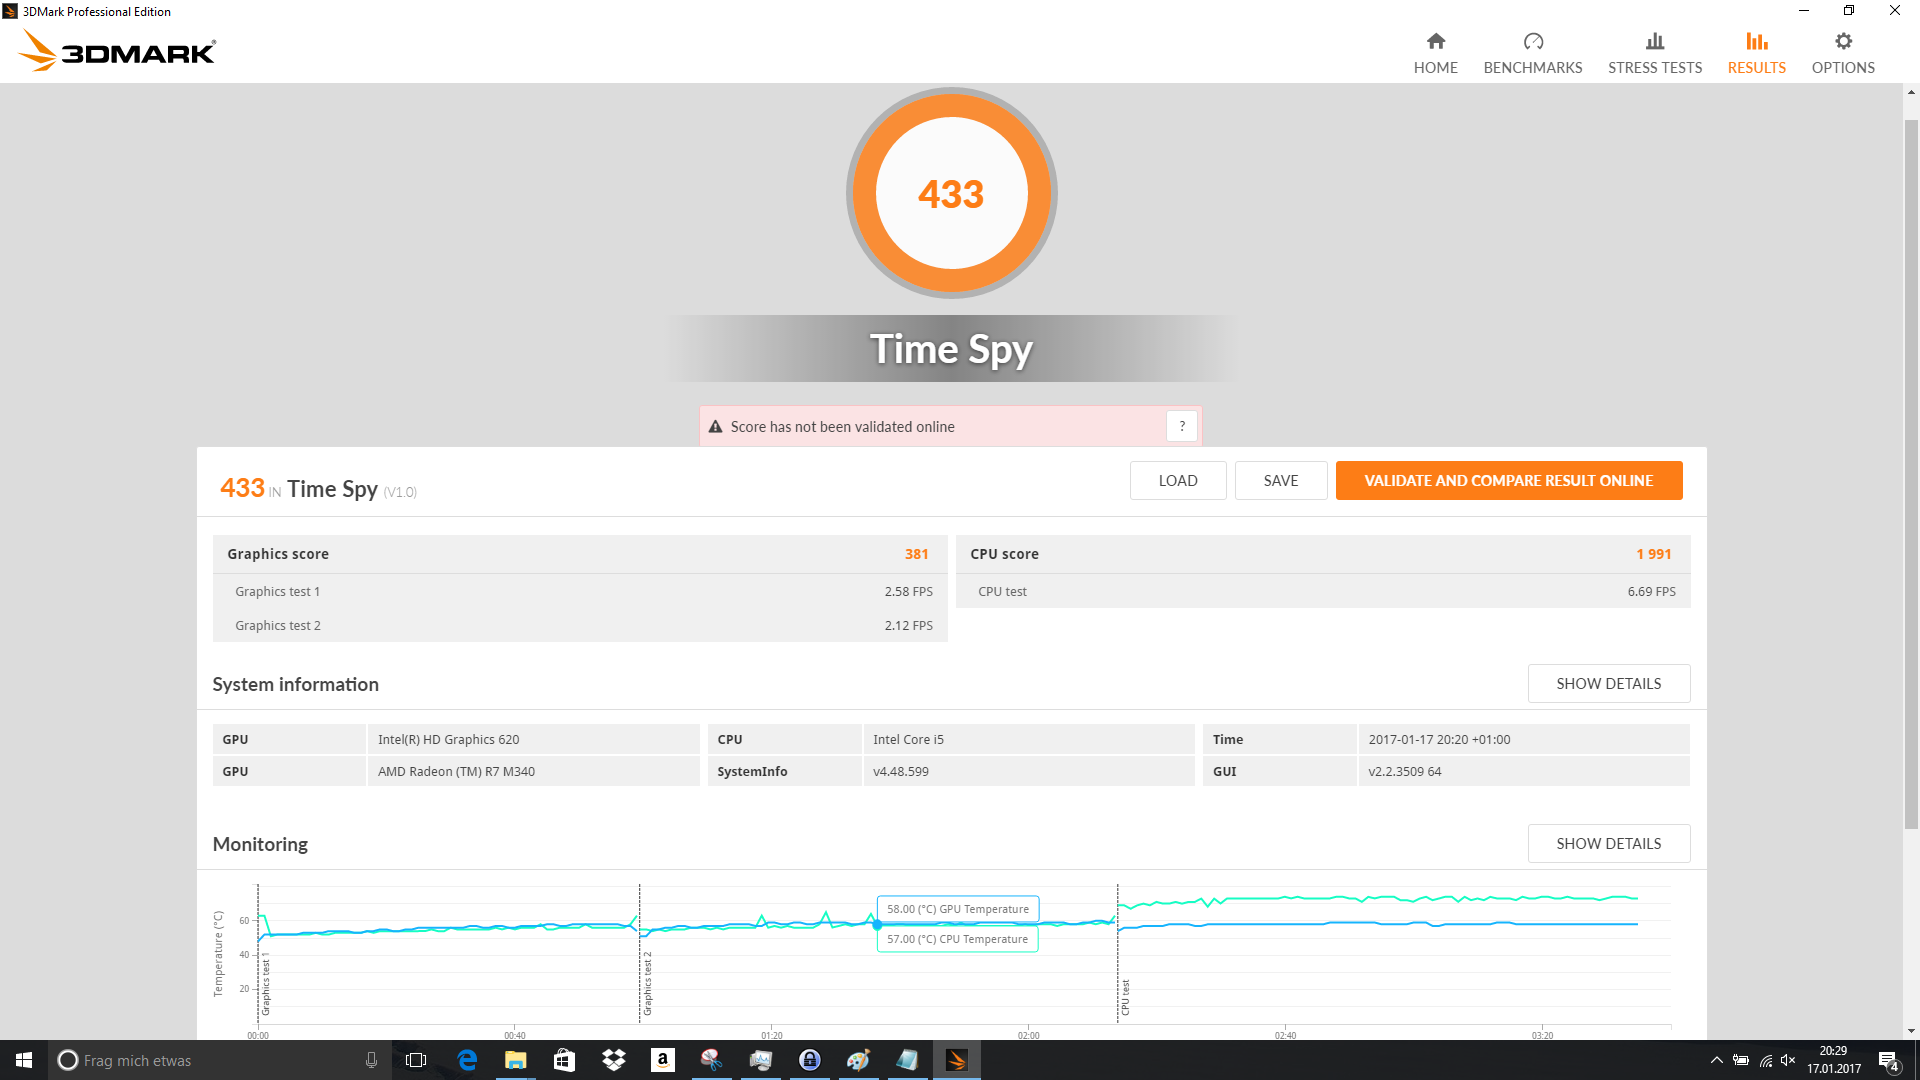
| 3DMark Time Spy Score | 433 points | |
Help | ||
| BioShock Infinite - 1366x768 Medium Preset | |
| Acer Aspire E5-575G-549D | |
| Acer Aspire F15 F5-573G-53V1 | |
| Lenovo ThinkPad E470-20H2S00400 | |
| Lenovo IdeaPad 510-15IKB 80SV0087GE | |
| HP Pavilion 15-aw004ng W8Y60EA | |
| HP Pavilion 17-x110ng | |
| Rise of the Tomb Raider - 1366x768 Medium Preset AF:2x | |
| Acer Aspire F15 F5-573G-53V1 | |
| Acer Aspire E5-575G-549D | |
| HP Pavilion 15-aw004ng W8Y60EA | |
| HP Pavilion 17-x110ng | |
| Battlefield 4 - 1366x768 Medium Preset | |
| Acer Aspire F15 F5-573G-53V1 | |
| Acer Aspire E5-575G-549D | |
| Lenovo ThinkPad E470-20H2S00400 | |
| HP Pavilion 15-aw004ng W8Y60EA | |
| HP Pavilion 17-x110ng | |
| low | med. | high | ultra | |
|---|---|---|---|---|
| BioShock Infinite (2013) | 73.6 | 42 | 32.6 | 9.6 |
| Battlefield 4 (2013) | 51.2 | 36.9 | 23.3 | 7.6 |
| GTA V (2015) | 50.7 | 43.7 | 12.2 | |
| The Witcher 3 (2015) | 21.1 | 13.4 | 6.9 | |
| Anno 2205 (2015) | 35.3 | 17.1 | 7 | |
| Rainbow Six Siege (2015) | 54 | 42.9 | 26.9 | 20.3 |
| Rise of the Tomb Raider (2016) | 22 | 11.9 | 6 | 3.5 |
| XCOM 2 (2016) | 22.8 | 7.9 | 5.2 | 4.9 |
| Far Cry Primal (2016) | 20.6 | 9.9 | 8.9 | |
| The Division (2016) | 23.1 | 15.6 | 6.2 | |
| Doom (2016) | 22 | 13 | 8.1 | |
| Overwatch (2016) | 60.5 | 42.6 | 22.3 | 12.4 |
| Deus Ex Mankind Divided (2016) | 13.9 | 10.1 | 5.2 | |
| FIFA 17 (2016) | 61.8 | 59.7 | 34.6 | 29.7 |
| Mafia 3 (2016) | 14 | 8.9 | ||
| Battlefield 1 (2016) | 31.8 | 22.7 | 9.6 | 9.6 |
| Civilization 6 (2016) | 36.4 | 26.1 | 9.5 | |
| Farming Simulator 17 (2016) | 69.7 | 59.3 | 21.1 | |
| Titanfall 2 (2016) | 41.1 | 29.8 | 11.2 | |
| Call of Duty Infinite Warfare (2016) | 26.4 | 22.6 | 12.1 | |
| Dishonored 2 (2016) | 10.9 | 9.2 | ||
| Watch Dogs 2 (2016) | 18.7 | 13.6 | ||
| Resident Evil 7 (2017) | 40.5 | 15.9 |
Noise level
| Idle |
| 31 / 31 / 31 dB(A) |
| DVD |
| 35.8 / dB(A) |
| Load |
| 33.8 / 44.8 dB(A) |
 | ||
30 dB silent 40 dB(A) audible 50 dB(A) loud |
||
min: | ||
| HP Pavilion 17-x110ng i5-7200U, Radeon R7 M440 | Acer Aspire E5-575G-549D i5-7200U, GeForce GTX 950M | Lenovo IdeaPad 510-15IKB 80SV0087GE i7-7500U, GeForce 940MX | Acer Aspire F15 F5-573G-53V1 6200U, GeForce GTX 950M | Lenovo ThinkPad E470-20H2S00400 i5-7200U, GeForce 940MX | HP Pavilion 15-aw004ng W8Y60EA A10-9600P, Radeon R8 M445DX | |
|---|---|---|---|---|---|---|
| Noise | 2% | -2% | -3% | 5% | -5% | |
| off / environment * (dB) | 29 | 28.9 -0% | 31.6 -9% | 31.2 -8% | 29 -0% | 31.2 -8% |
| Idle Minimum * (dB) | 31 | 30.8 1% | 32.6 -5% | 32.4 -5% | 29 6% | 31.7 -2% |
| Idle Average * (dB) | 31 | 30.8 1% | 32.6 -5% | 33.5 -8% | 29 6% | 31.9 -3% |
| Idle Maximum * (dB) | 31 | 30.8 1% | 32.6 -5% | 33.5 -8% | 29 6% | 31.9 -3% |
| Load Average * (dB) | 33.8 | 33.4 1% | 35.3 -4% | 35.2 -4% | 35.6 -5% | 41 -21% |
| Load Maximum * (dB) | 44.8 | 40.1 10% | 37.1 17% | 38.7 14% | 38.5 14% | 42.7 5% |
* ... smaller is better
(±) The maximum temperature on the upper side is 40.3 °C / 105 F, compared to the average of 36.8 °C / 98 F, ranging from 21 to 71 °C for the class Multimedia.
(-) The bottom heats up to a maximum of 46.1 °C / 115 F, compared to the average of 39.1 °C / 102 F
(+) In idle usage, the average temperature for the upper side is 23 °C / 73 F, compared to the device average of 31.3 °C / 88 F.
(+) The palmrests and touchpad are cooler than skin temperature with a maximum of 31.3 °C / 88.3 F and are therefore cool to the touch.
(-) The average temperature of the palmrest area of similar devices was 28.7 °C / 83.7 F (-2.6 °C / -4.6 F).
| HP Pavilion 17-x110ng i5-7200U, Radeon R7 M440 | Acer Aspire E5-575G-549D i5-7200U, GeForce GTX 950M | Lenovo IdeaPad 510-15IKB 80SV0087GE i7-7500U, GeForce 940MX | Acer Aspire F15 F5-573G-53V1 6200U, GeForce GTX 950M | Lenovo ThinkPad E470-20H2S00400 i5-7200U, GeForce 940MX | HP Pavilion 15-aw004ng W8Y60EA A10-9600P, Radeon R8 M445DX | |
|---|---|---|---|---|---|---|
| Heat | -29% | 3% | -27% | -12% | 1% | |
| Maximum Upper Side * (°C) | 40.3 | 48.1 -19% | 38.3 5% | 46.6 -16% | 43.8 -9% | 33.4 17% |
| Maximum Bottom * (°C) | 46.1 | 60.8 -32% | 36 22% | 65.4 -42% | 53 -15% | 32.9 29% |
| Idle Upper Side * (°C) | 23.8 | 30.8 -29% | 24.9 -5% | 28.9 -21% | 25.9 -9% | 27.7 -16% |
| Idle Bottom * (°C) | 23.4 | 31.9 -36% | 25.6 -9% | 29.8 -27% | 27.1 -16% | 29.4 -26% |
* ... smaller is better
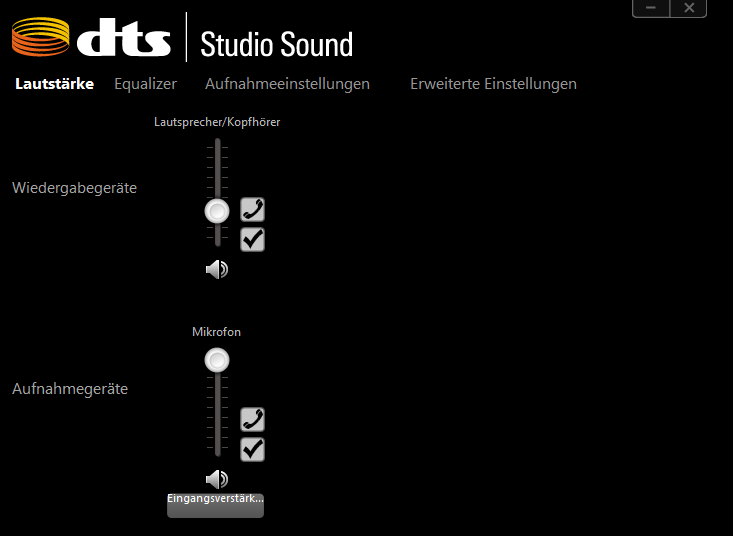
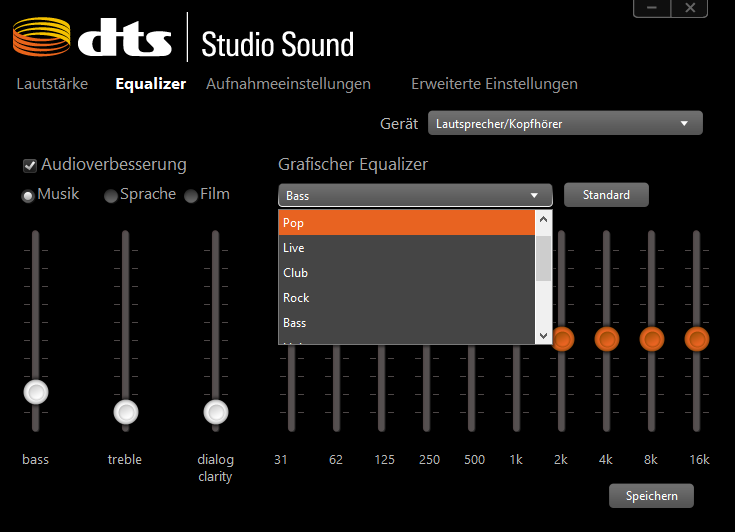
HP Pavilion 17-x110ng audio analysis
(-) | not very loud speakers (70 dB)
Bass 100 - 315 Hz
(±) | reduced bass - on average 13.2% lower than median
(+) | bass is linear (6.7% delta to prev. frequency)
Mids 400 - 2000 Hz
(+) | balanced mids - only 2.2% away from median
(+) | mids are linear (5.9% delta to prev. frequency)
Highs 2 - 16 kHz
(+) | balanced highs - only 4.5% away from median
(+) | highs are linear (6.6% delta to prev. frequency)
Overall 100 - 16.000 Hz
(±) | linearity of overall sound is average (16.5% difference to median)
Compared to same class
» 43% of all tested devices in this class were better, 7% similar, 50% worse
» The best had a delta of 5%, average was 17%, worst was 45%
Compared to all devices tested
» 28% of all tested devices were better, 6% similar, 66% worse
» The best had a delta of 4%, average was 24%, worst was 134%
Apple MacBook 12 (Early 2016) 1.1 GHz audio analysis
(+) | speakers can play relatively loud (83.6 dB)
Bass 100 - 315 Hz
(±) | reduced bass - on average 11.3% lower than median
(±) | linearity of bass is average (14.2% delta to prev. frequency)
Mids 400 - 2000 Hz
(+) | balanced mids - only 2.4% away from median
(+) | mids are linear (5.5% delta to prev. frequency)
Highs 2 - 16 kHz
(+) | balanced highs - only 2% away from median
(+) | highs are linear (4.5% delta to prev. frequency)
Overall 100 - 16.000 Hz
(+) | overall sound is linear (10.2% difference to median)
Compared to same class
» 7% of all tested devices in this class were better, 2% similar, 91% worse
» The best had a delta of 5%, average was 18%, worst was 53%
Compared to all devices tested
» 5% of all tested devices were better, 1% similar, 94% worse
» The best had a delta of 4%, average was 24%, worst was 134%
| Off / Standby | |
| Idle | |
| Load |
|
Key:
min: | |
| HP Pavilion 17-x110ng i5-7200U, Radeon R7 M440 | Acer Aspire E5-575G-549D i5-7200U, GeForce GTX 950M | Lenovo IdeaPad 510-15IKB 80SV0087GE i7-7500U, GeForce 940MX | Acer Aspire F15 F5-573G-53V1 6200U, GeForce GTX 950M | Lenovo ThinkPad E470-20H2S00400 i5-7200U, GeForce 940MX | HP Pavilion 15-aw004ng W8Y60EA A10-9600P, Radeon R8 M445DX | |
|---|---|---|---|---|---|---|
| Power Consumption | -2% | 24% | -19% | 26% | 13% | |
| Idle Minimum * (Watt) | 7.7 | 6 22% | 3.9 49% | 8.3 -8% | 2.7 65% | 5.5 29% |
| Idle Average * (Watt) | 14 | 8.1 42% | 7.4 47% | 12.1 14% | 5.5 61% | 8.2 41% |
| Idle Maximum * (Watt) | 15.1 | 9.8 35% | 9.5 37% | 15.4 -2% | 6.5 57% | 9.5 37% |
| Load Average * (Watt) | 33 | 52.5 -59% | 41 -24% | 56 -70% | 44.2 -34% | 44.5 -35% |
| Load Maximum * (Watt) | 54.6 | 81.6 -49% | 48 12% | 70 -28% | 65.2 -19% | 58 -6% |
* ... smaller is better
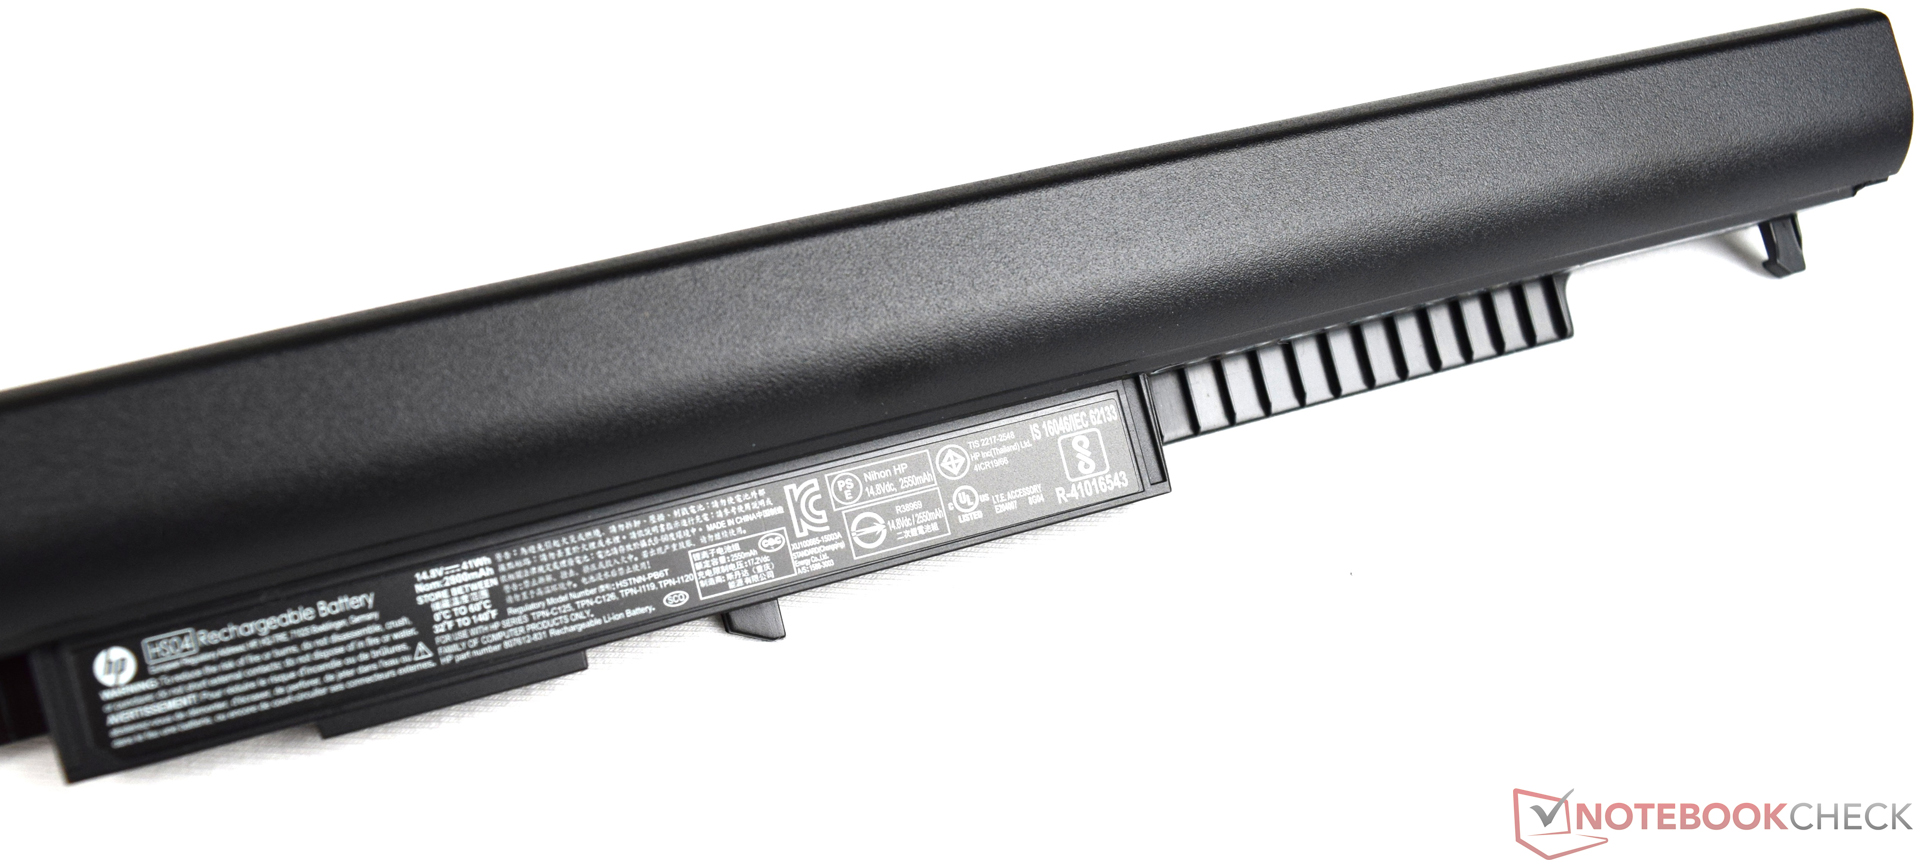
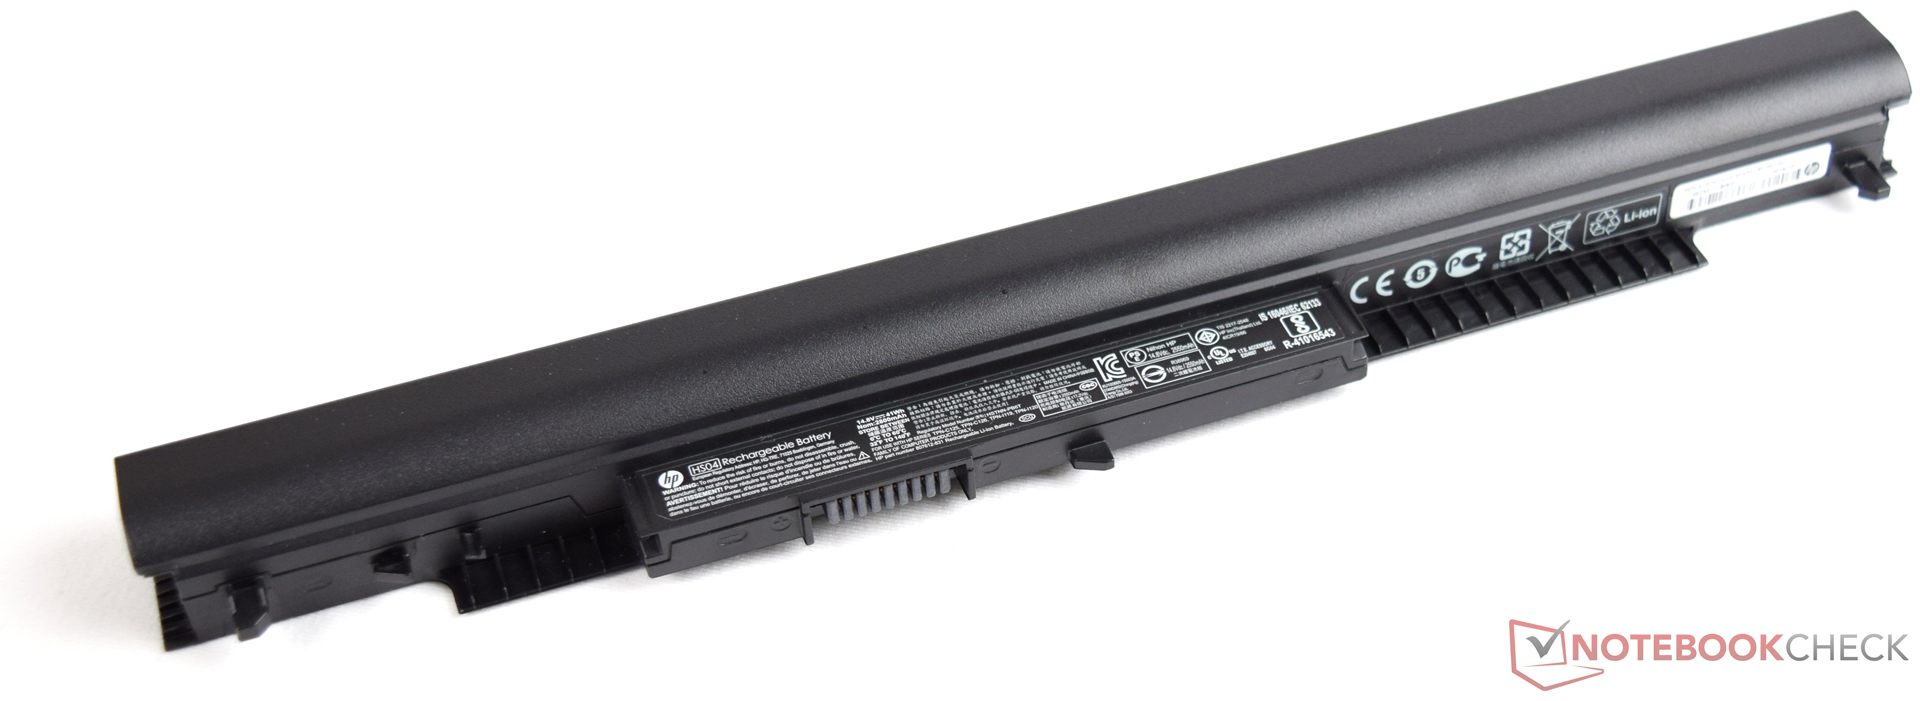


| HP Pavilion 17-x110ng 41 Wh | Acer Aspire E5-575G-549D 62 Wh | Lenovo IdeaPad 510-15IKB 80SV0087GE 30 Wh | Acer Aspire F15 F5-573G-53V1 62 Wh | Lenovo ThinkPad E470-20H2S00400 45 Wh | HP Pavilion 15-aw004ng W8Y60EA 41 Wh | |
|---|---|---|---|---|---|---|
| Battery runtime | 30% | -21% | 30% | 52% | -12% | |
| Reader / Idle (h) | 8.8 | 12.8 45% | 11.1 26% | 17.4 98% | 9.3 6% | |
| H.264 (h) | 4.8 | 7.7 60% | 5.6 17% | 8.4 75% | 3.2 -33% | |
| WiFi v1.3 (h) | 5.8 | 7.5 29% | 4.6 -21% | 6.4 10% | 5.4 -7% | 4.3 -26% |
| Load (h) | 1.5 | 1.3 -13% | 2.5 67% | 2.1 40% | 1.6 7% |
Pros
Cons

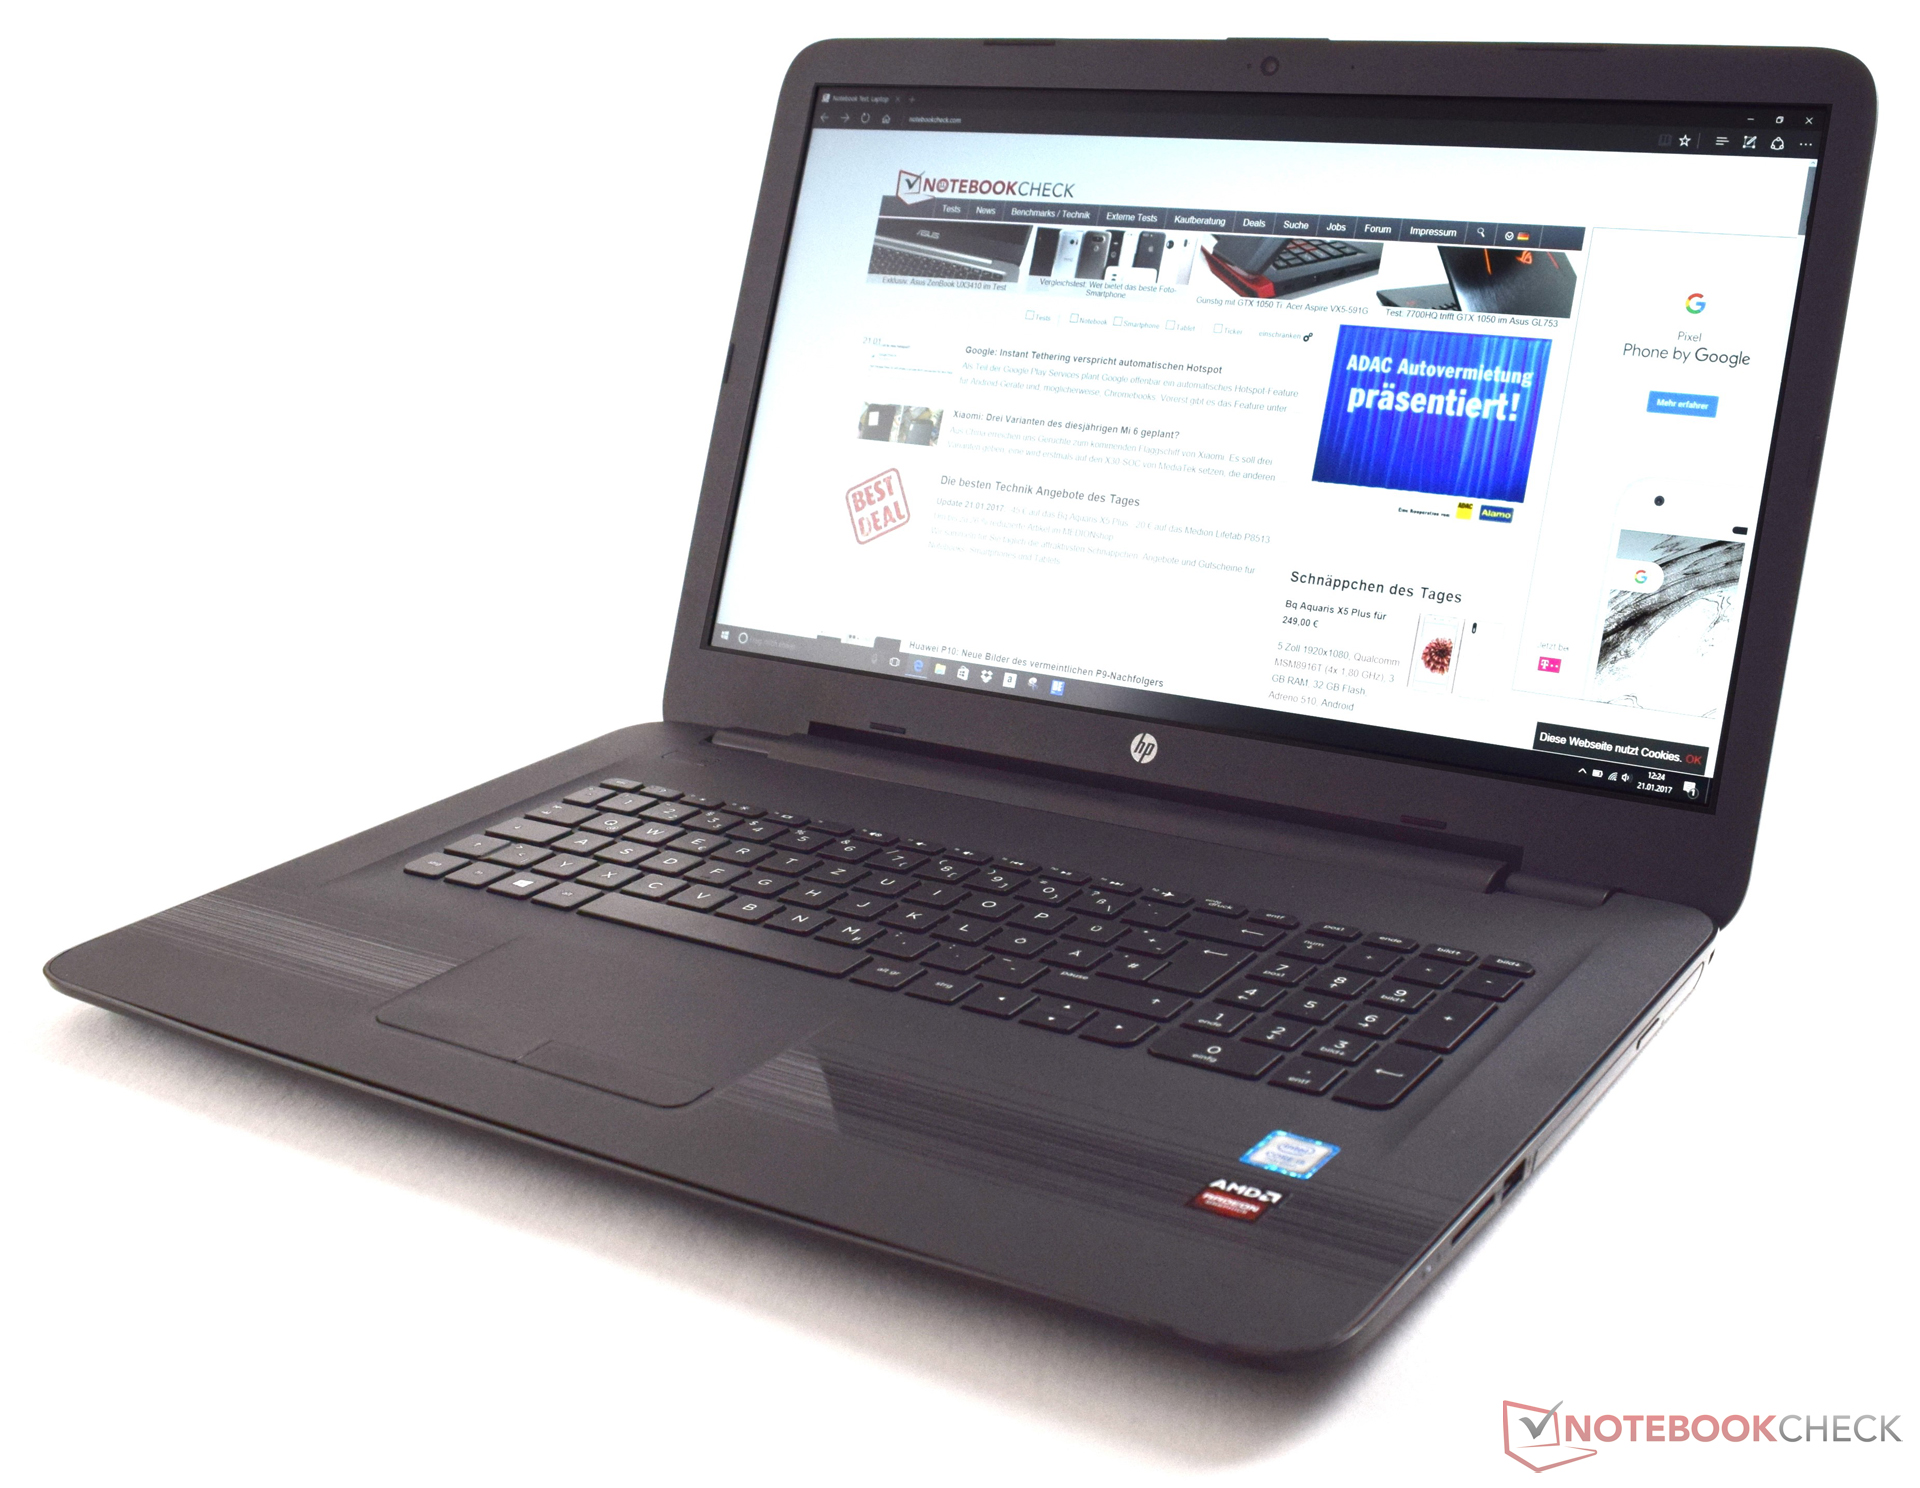
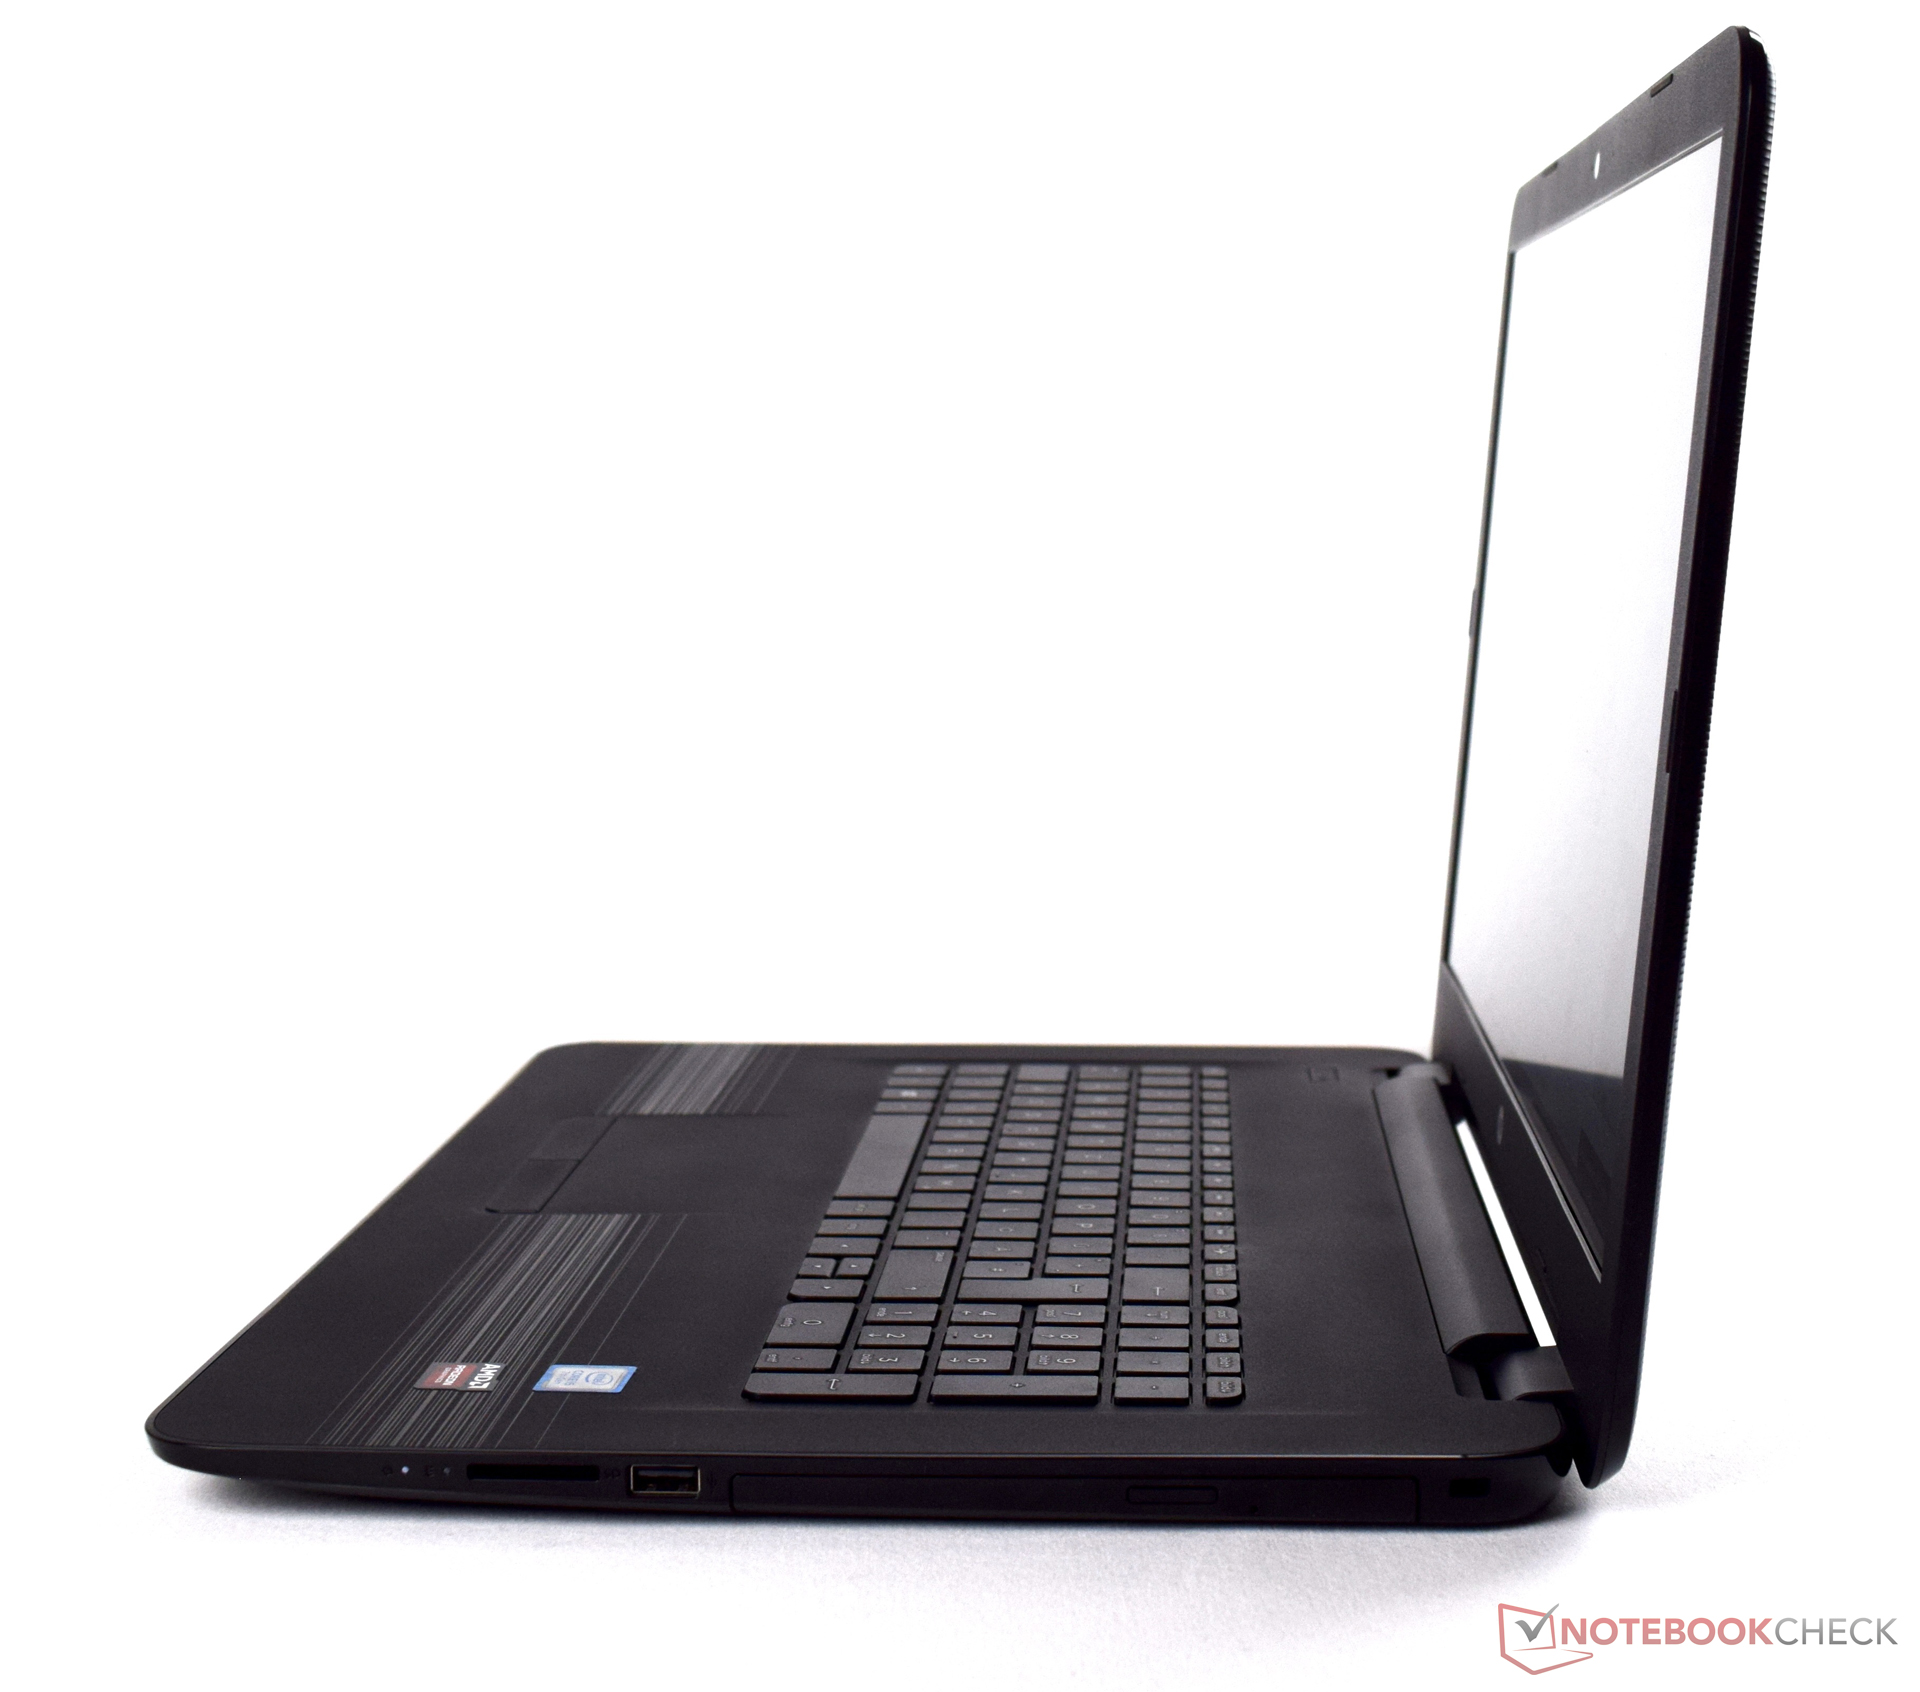
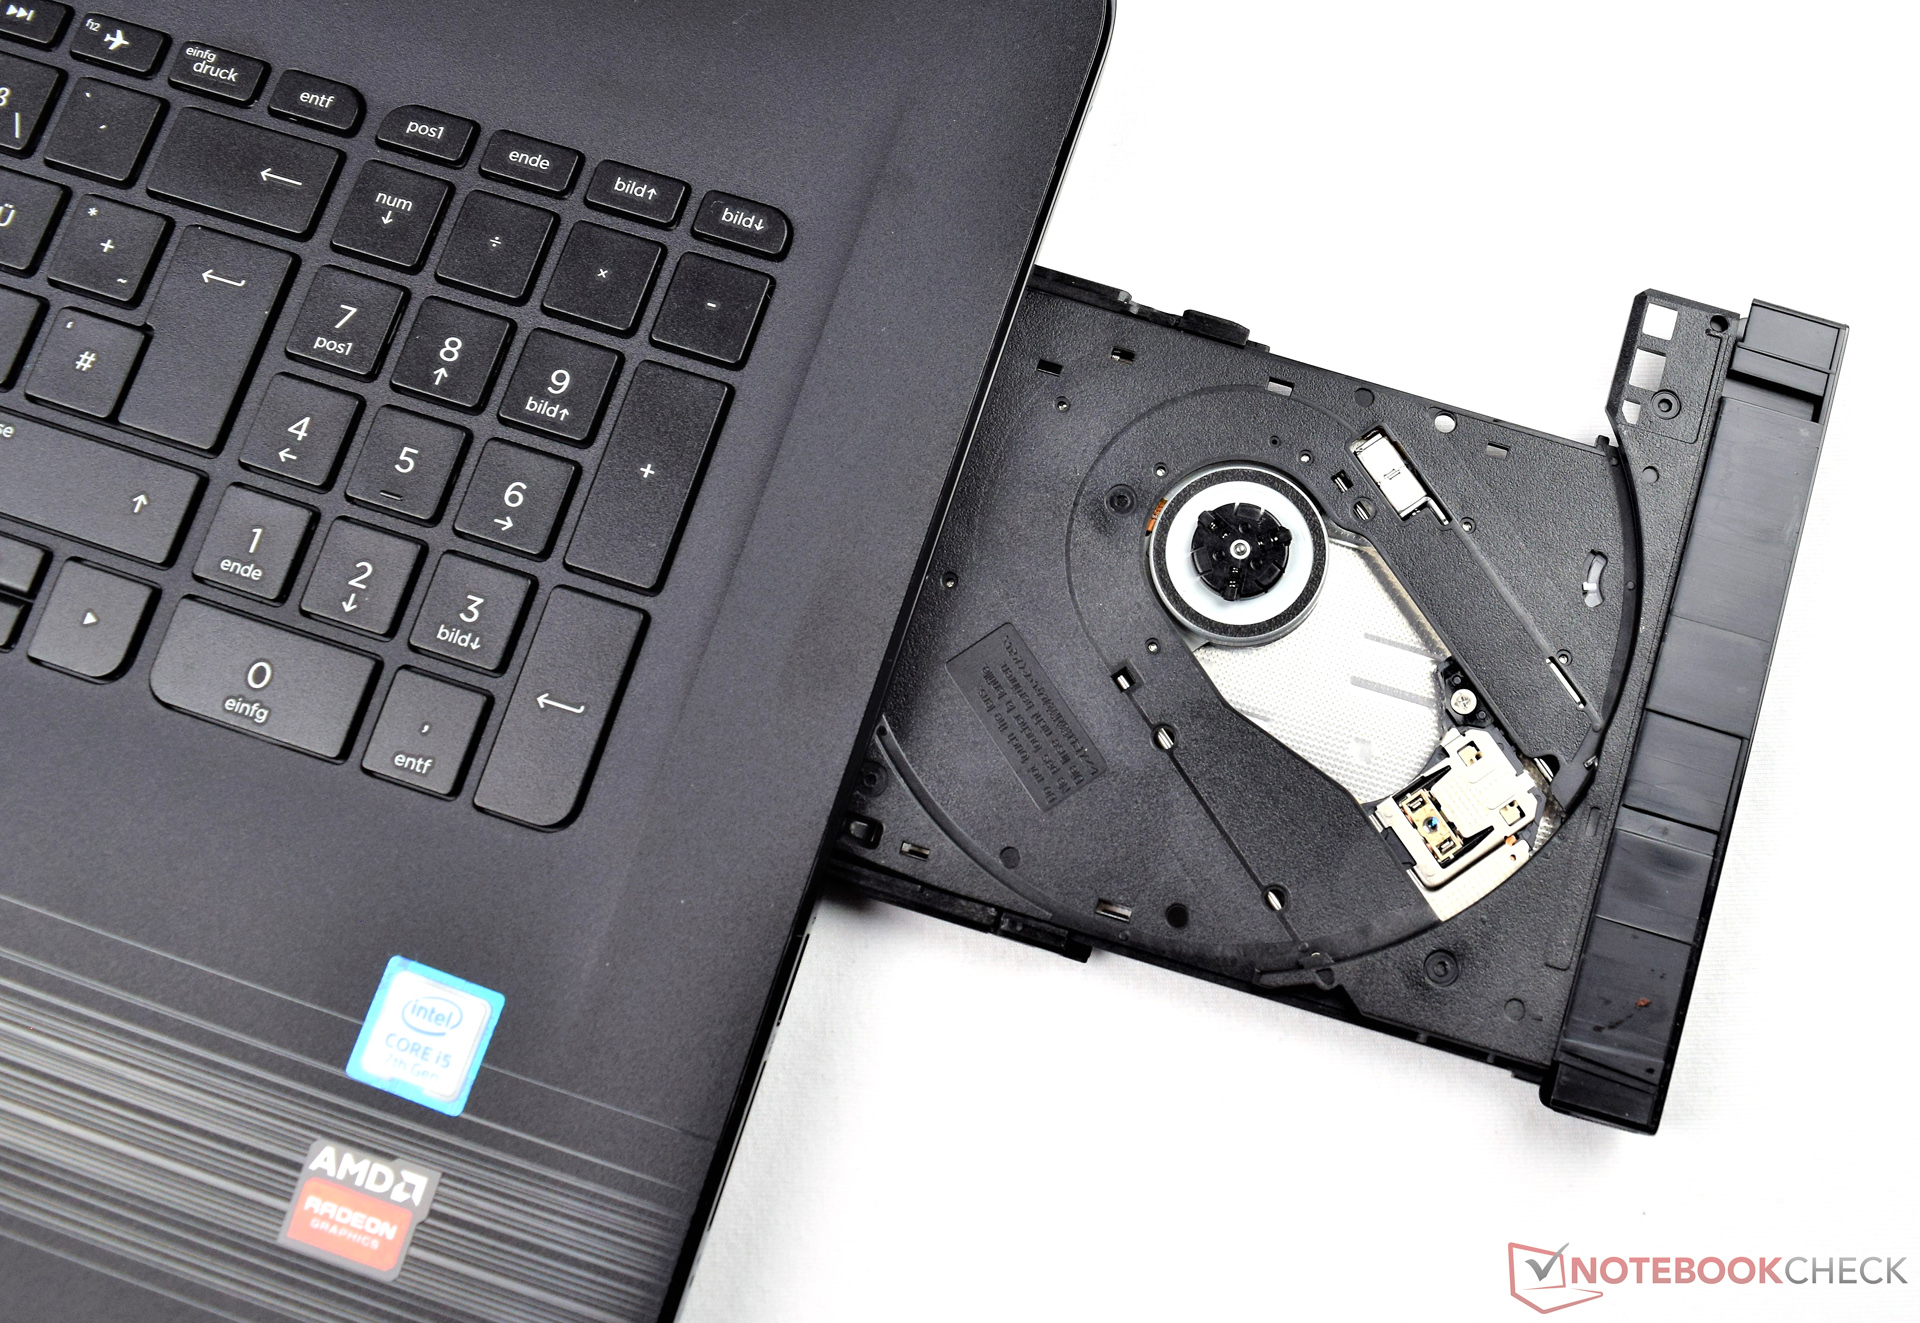
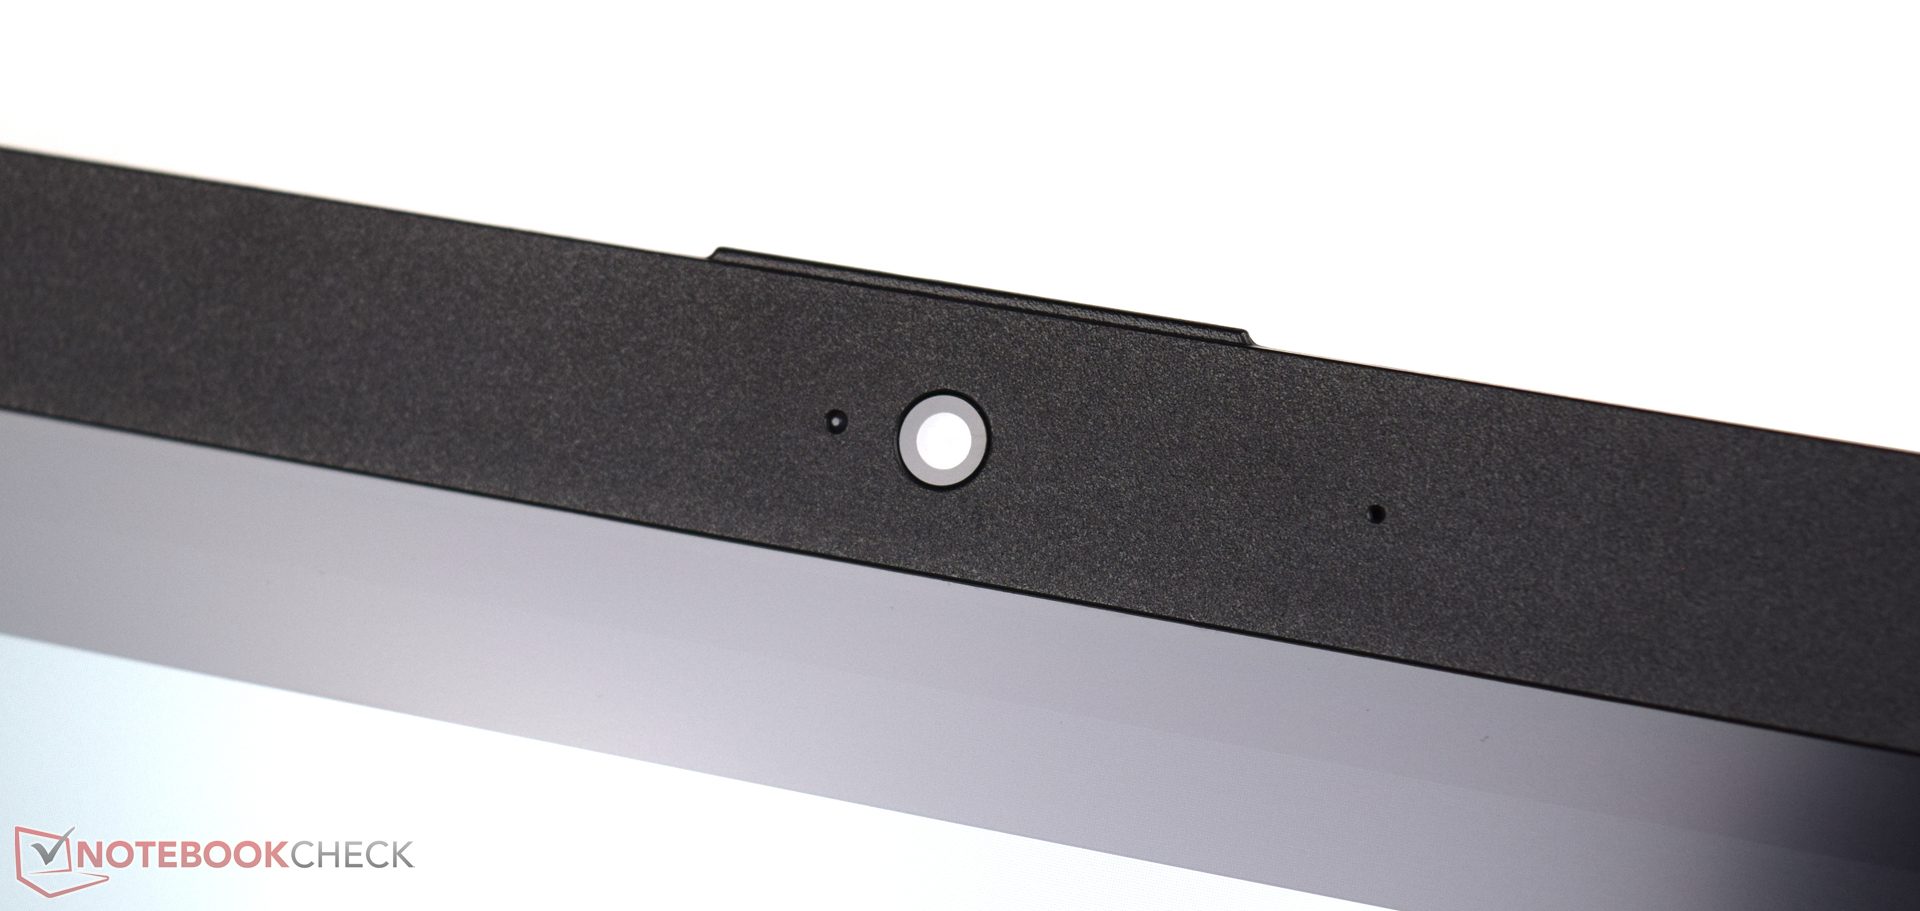
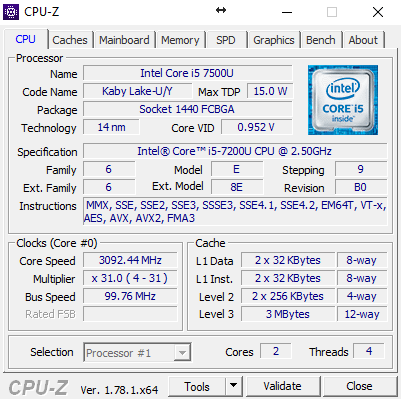
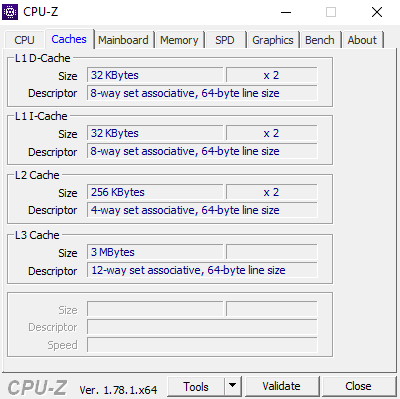
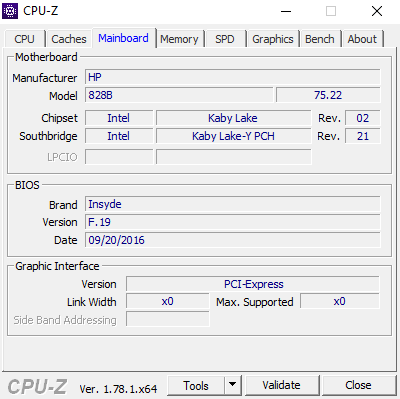
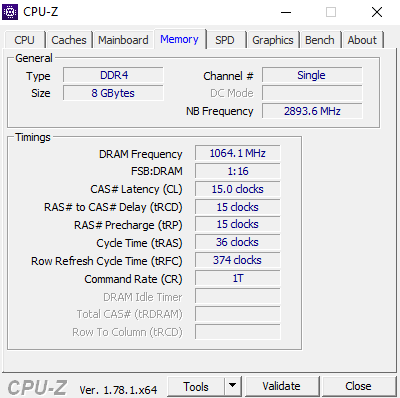
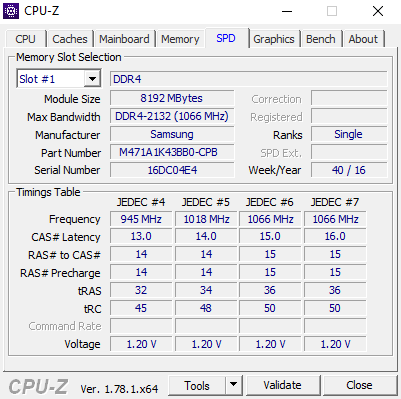
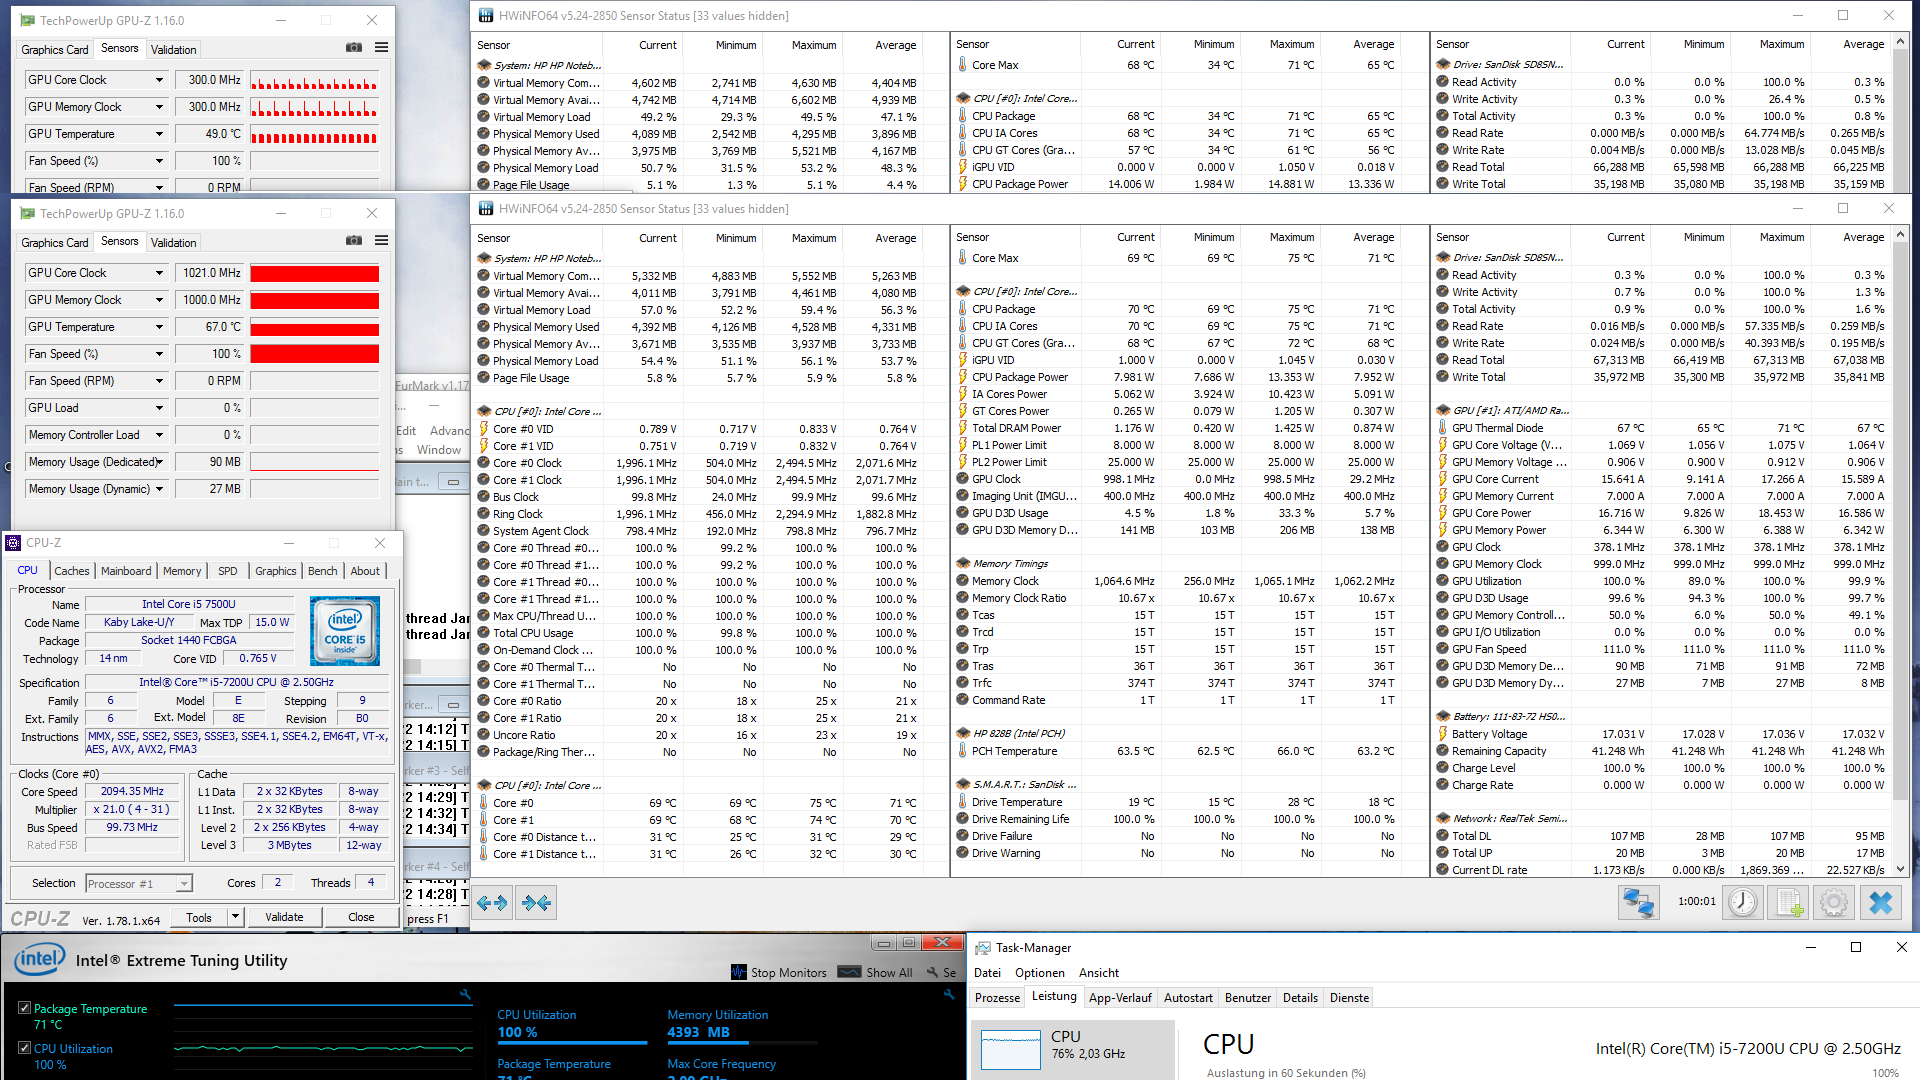
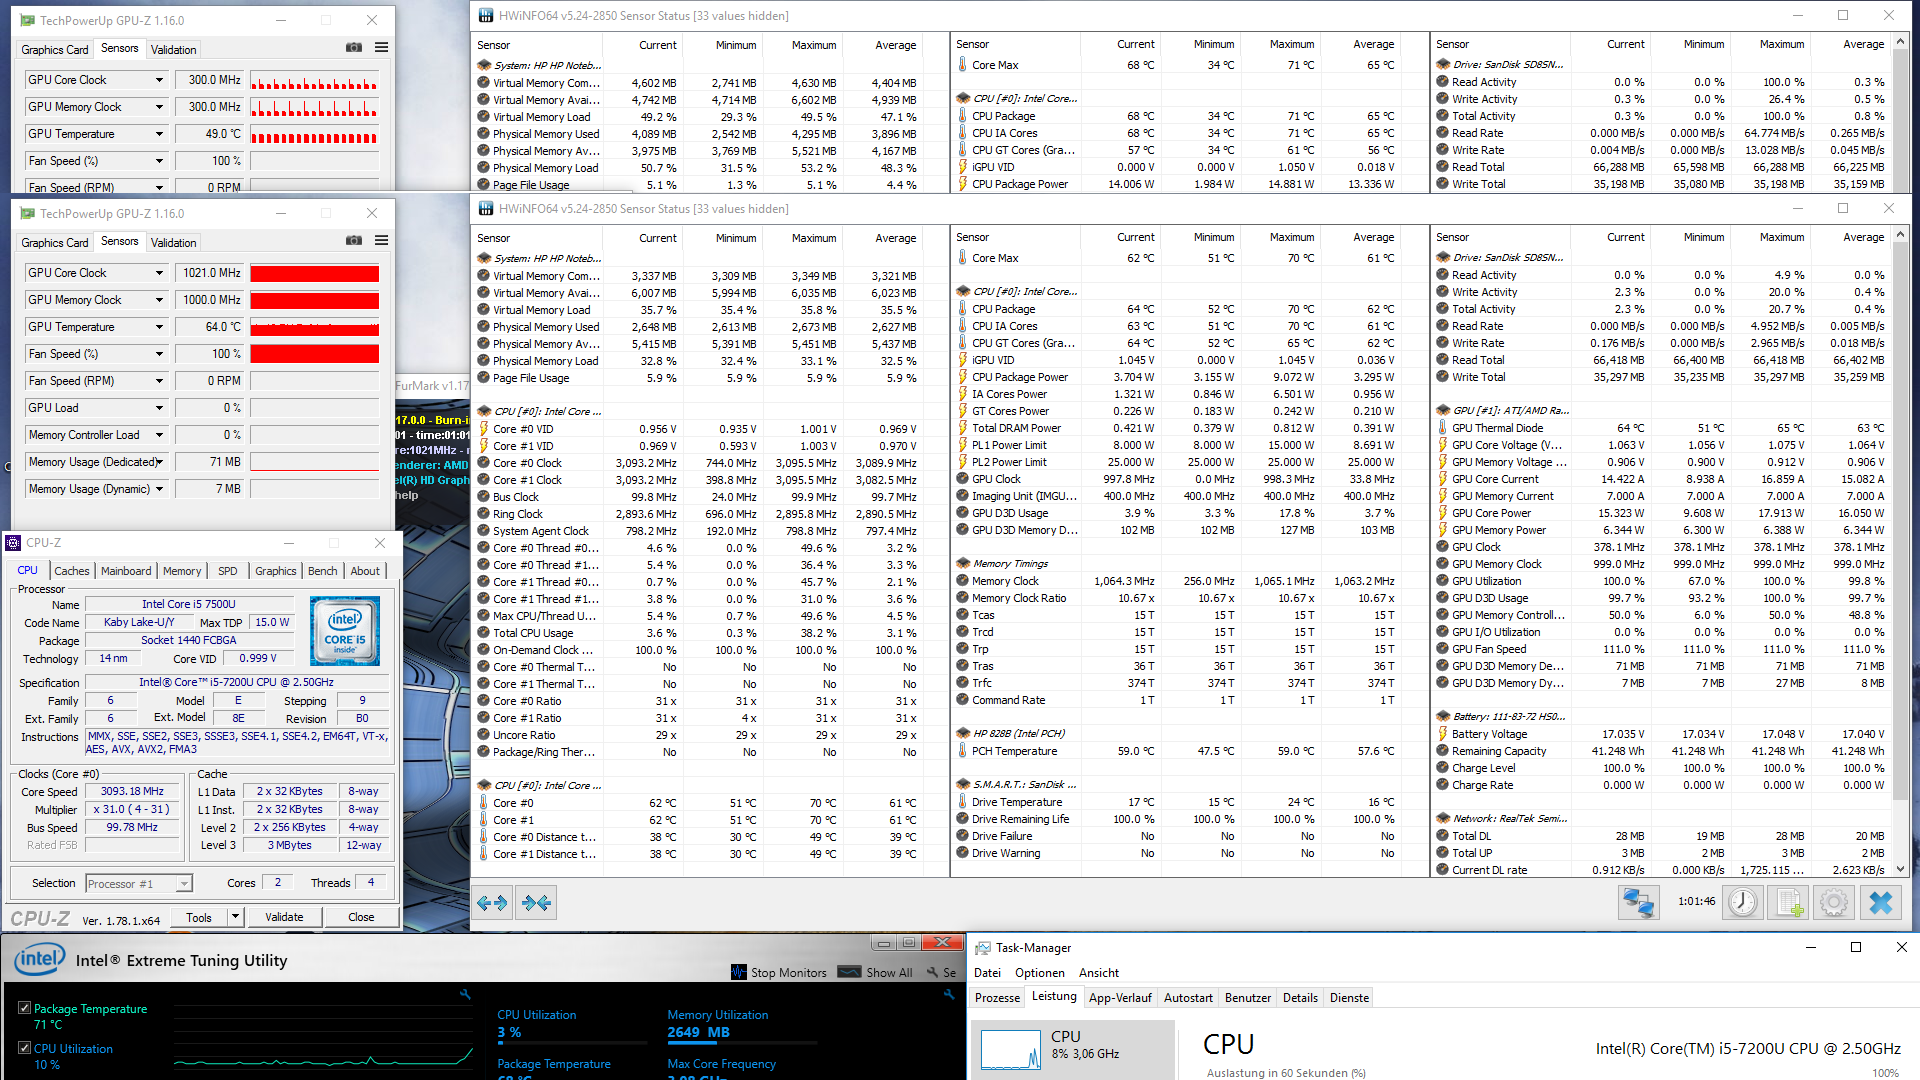
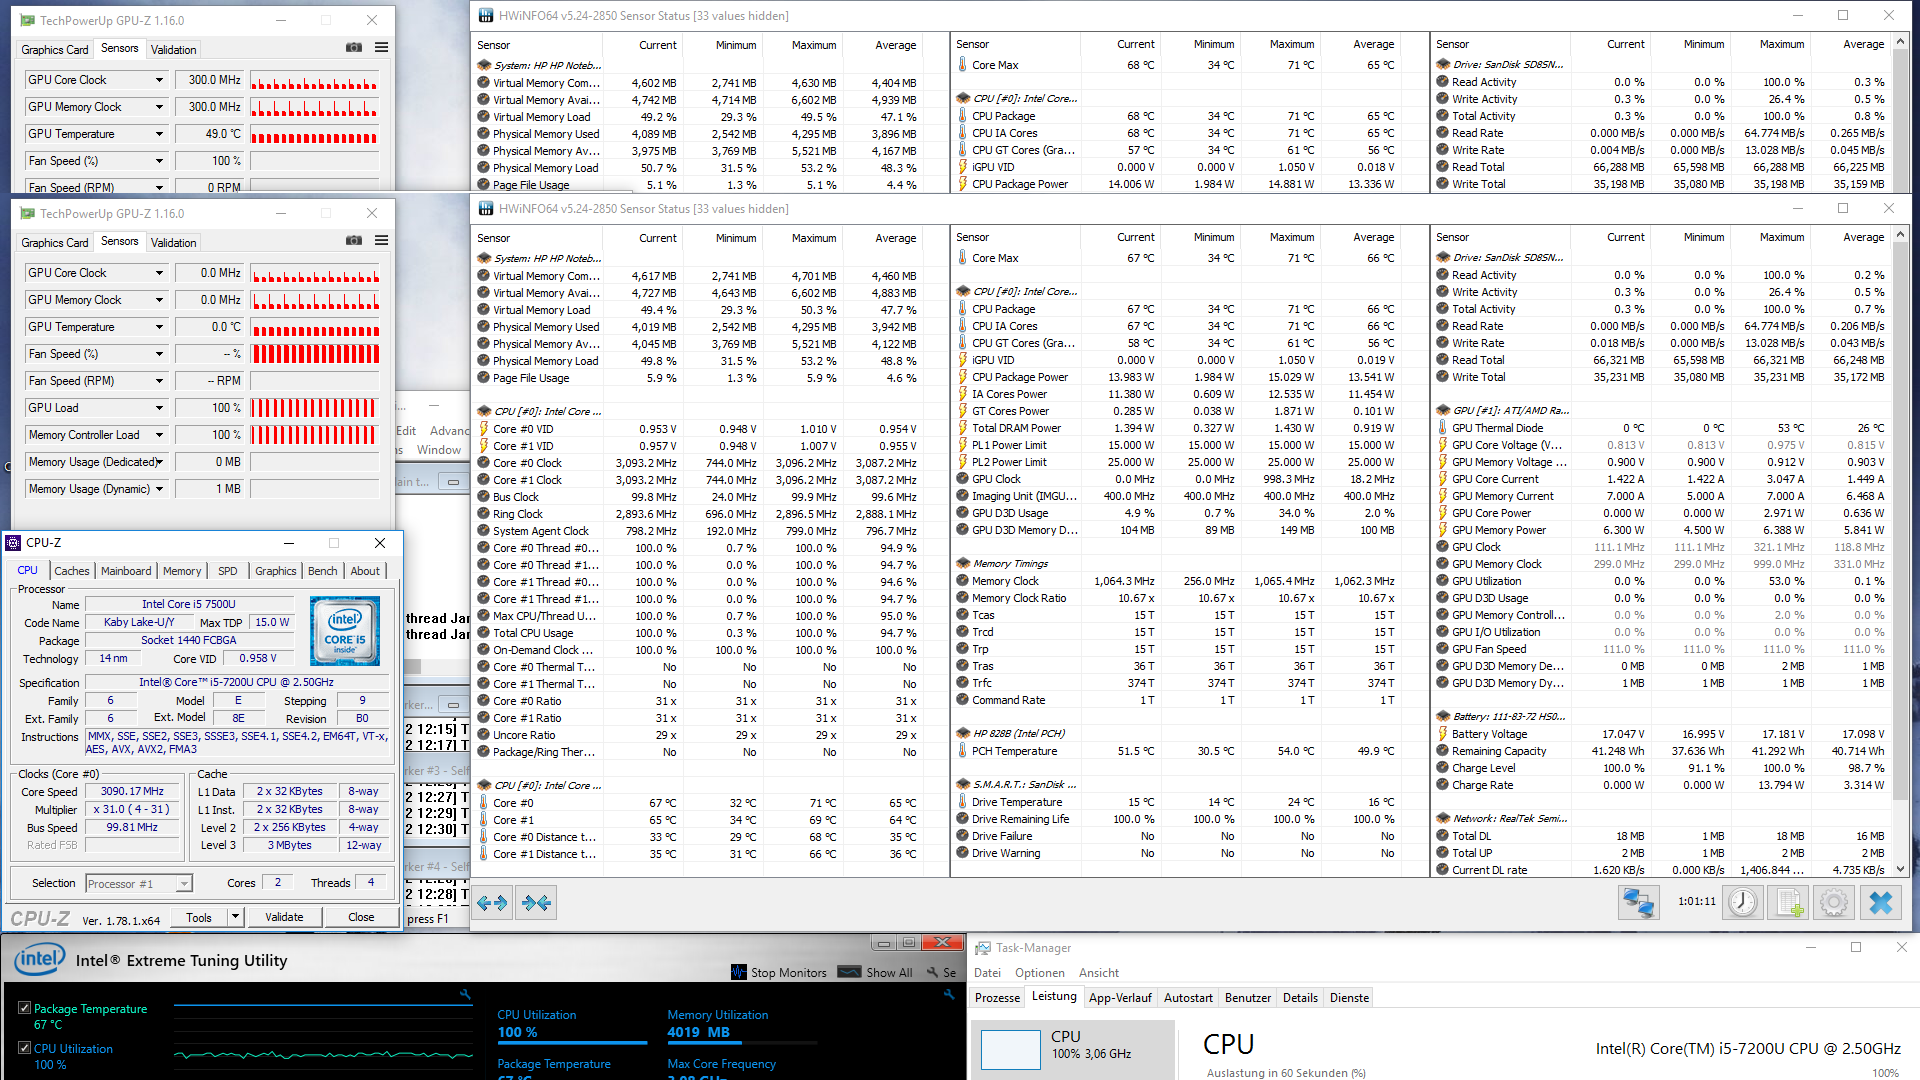
惠普17英寸多媒体笔记本Pavilion 17-x110ng目前零售价为699欧元(约合750美元)。它采用了英特尔处理器和AMD显卡的组合,配件置于并不起眼的黑色塑料机身内。英特尔酷睿i5-7200U是一款现代化的Kaby Lake芯片,高效的双核SoC为大多数多媒体应用程序提供了足够的性能。8 GB DDR4-RAM内存条也不错,即使面对苛刻的应用程序也不应该有任何问题。IPS显示屏幕提供宽广的视角,我们没有发现屏幕漏光现象。
惠普Pavilion 17-x110ng具有良好的系统性能,但由于显卡速度缓慢,游戏功能受到制约。
专用显卡是一个不错的补充,但你应该好好考虑你的使用场景。因为它的性能仅仅只能使得低分辨率下的游戏变的流畅。存储解决方案既好又坏。使用快速固态硬盘作为系统驱动器是有意义的,但是对于多媒体设备而言,256GB是不够的,毕竟其中大量数据是必要的。
注:本文是基于完整评测的缩减版本,阅读完整的英文评测,请点击这里。
HP Pavilion 17-x110ng
- 01/24/2017 v6 (old)
Sebastian Bade
Price comparison
