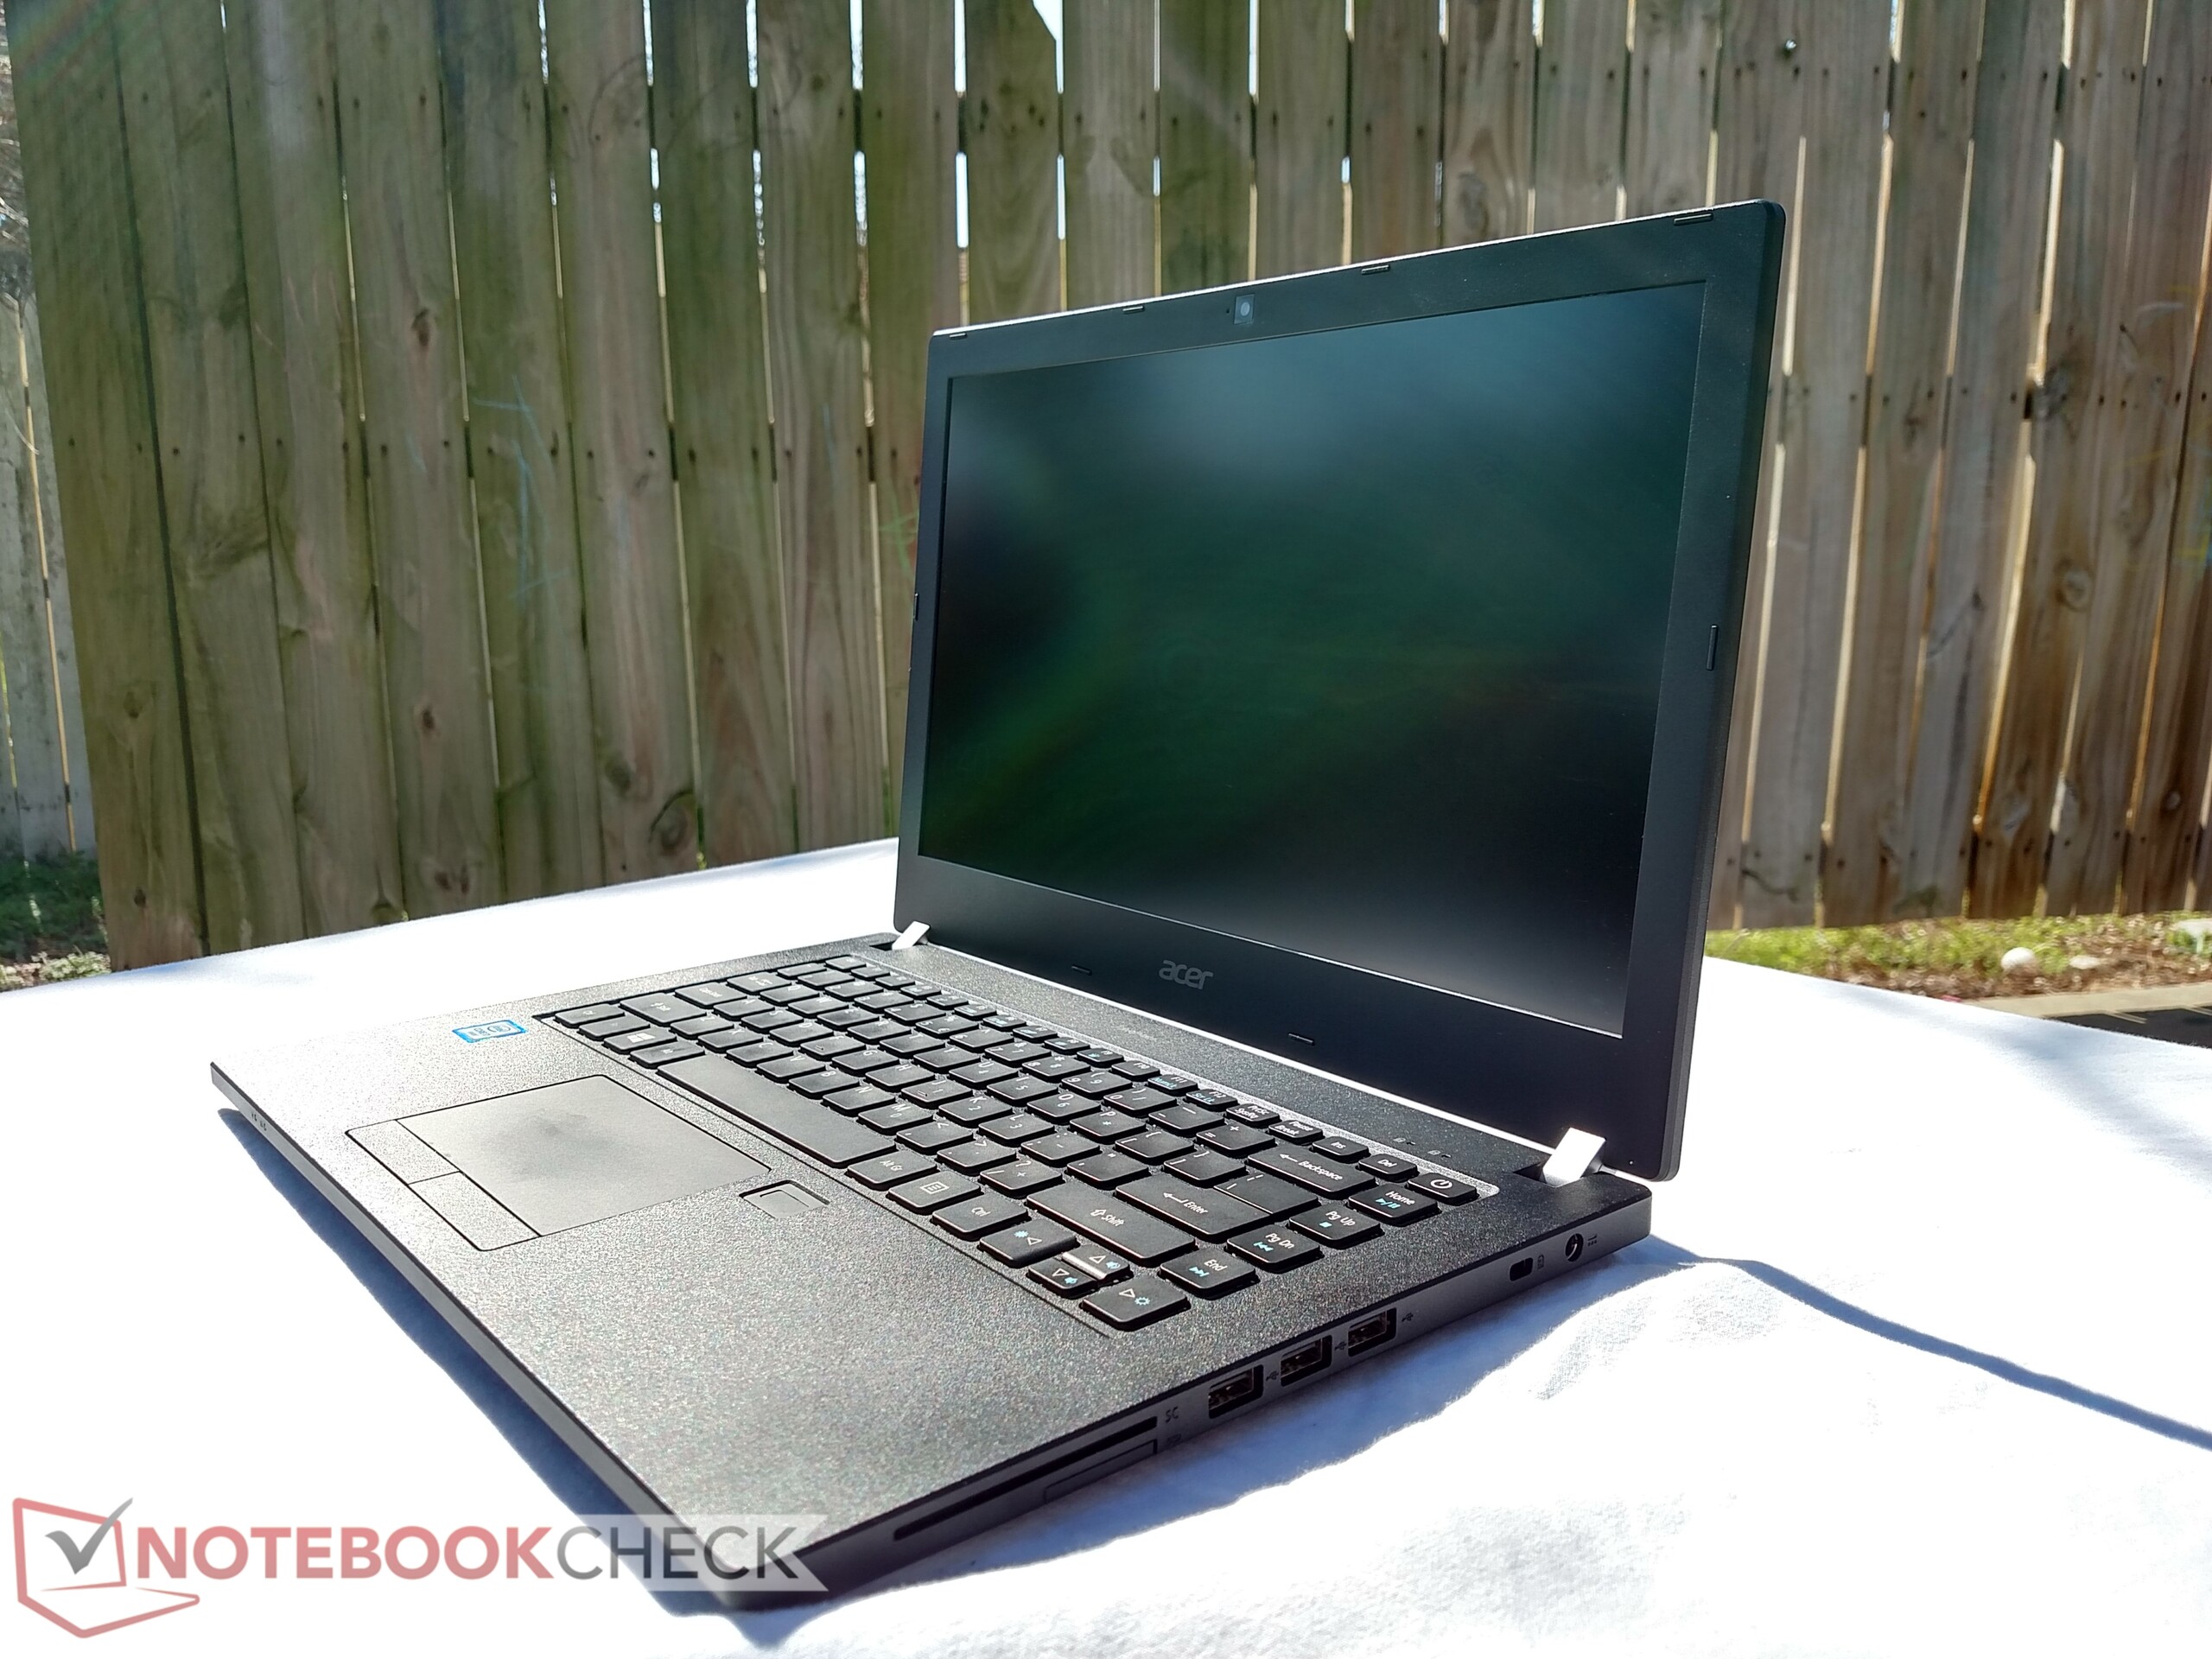
宏碁 TravelMate P449-M-7407 笔记本简短评测
| SD Card Reader | |
| average JPG Copy Test (av. of 3 runs) | |
| HP ProBook 450 G4 Y8B60EA | |
| Acer TravelMate P259-MG-71UU | |
| Lenovo ThinkPad E470-20H2S00400 | |
| Acer TravelMate P449-M-7407 | |
| maximum AS SSD Seq Read Test (1GB) | |
| HP ProBook 450 G4 Y8B60EA | |
| Lenovo ThinkPad E470-20H2S00400 | |
| Acer TravelMate P449-M-7407 | |
| Networking | |
| iperf3 transmit AX12 | |
| Acer TravelMate P259-MG-71UU | |
| Acer TravelMate P449-M-7407 | |
| Lenovo ThinkPad E470-20H2S00400 | |
| iperf3 receive AX12 | |
| Acer TravelMate P259-MG-71UU | |
| Lenovo ThinkPad E470-20H2S00400 | |
| Acer TravelMate P449-M-7407 | |
| |||||||||||||||||||||||||
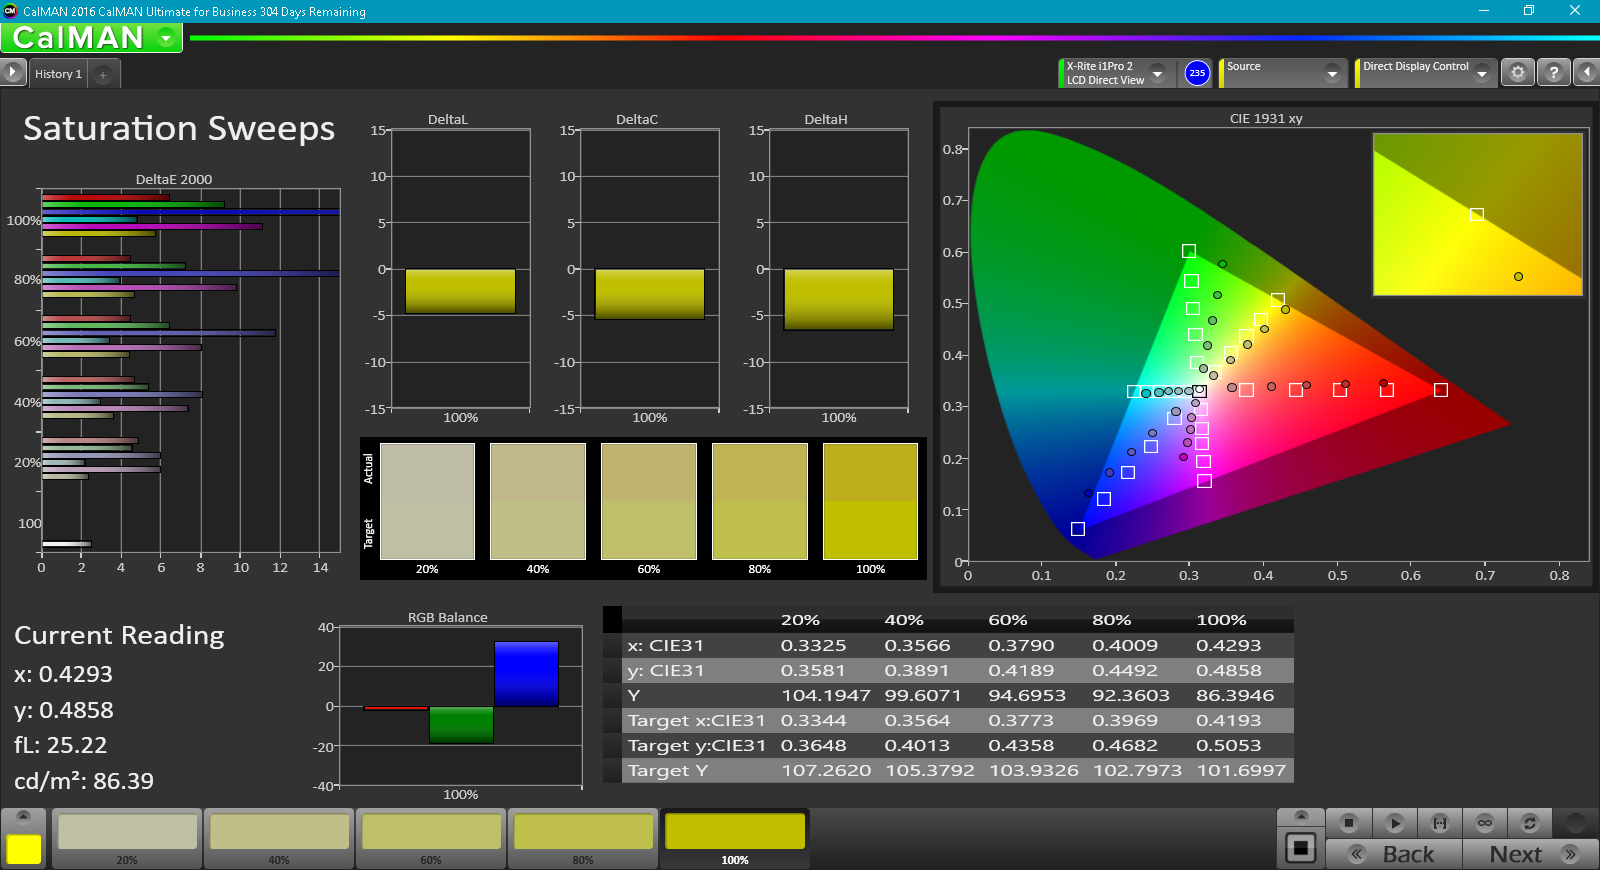
Brightness Distribution: 90 %
Center on Battery: 208.3 cd/m²
Contrast: 1096:1 (Black: 0.19 cd/m²)
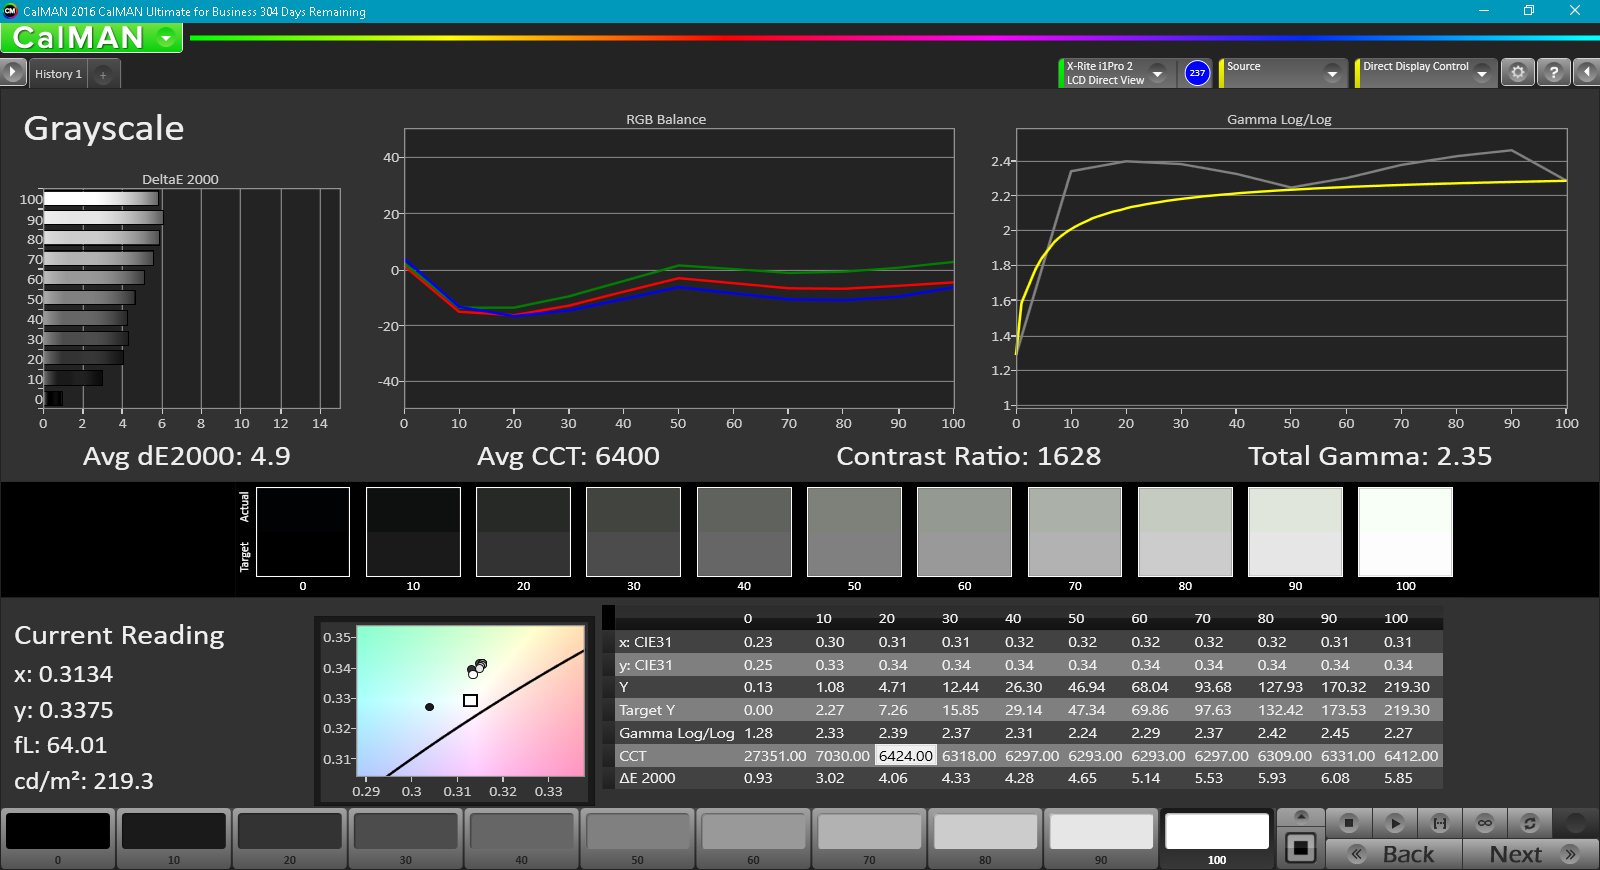
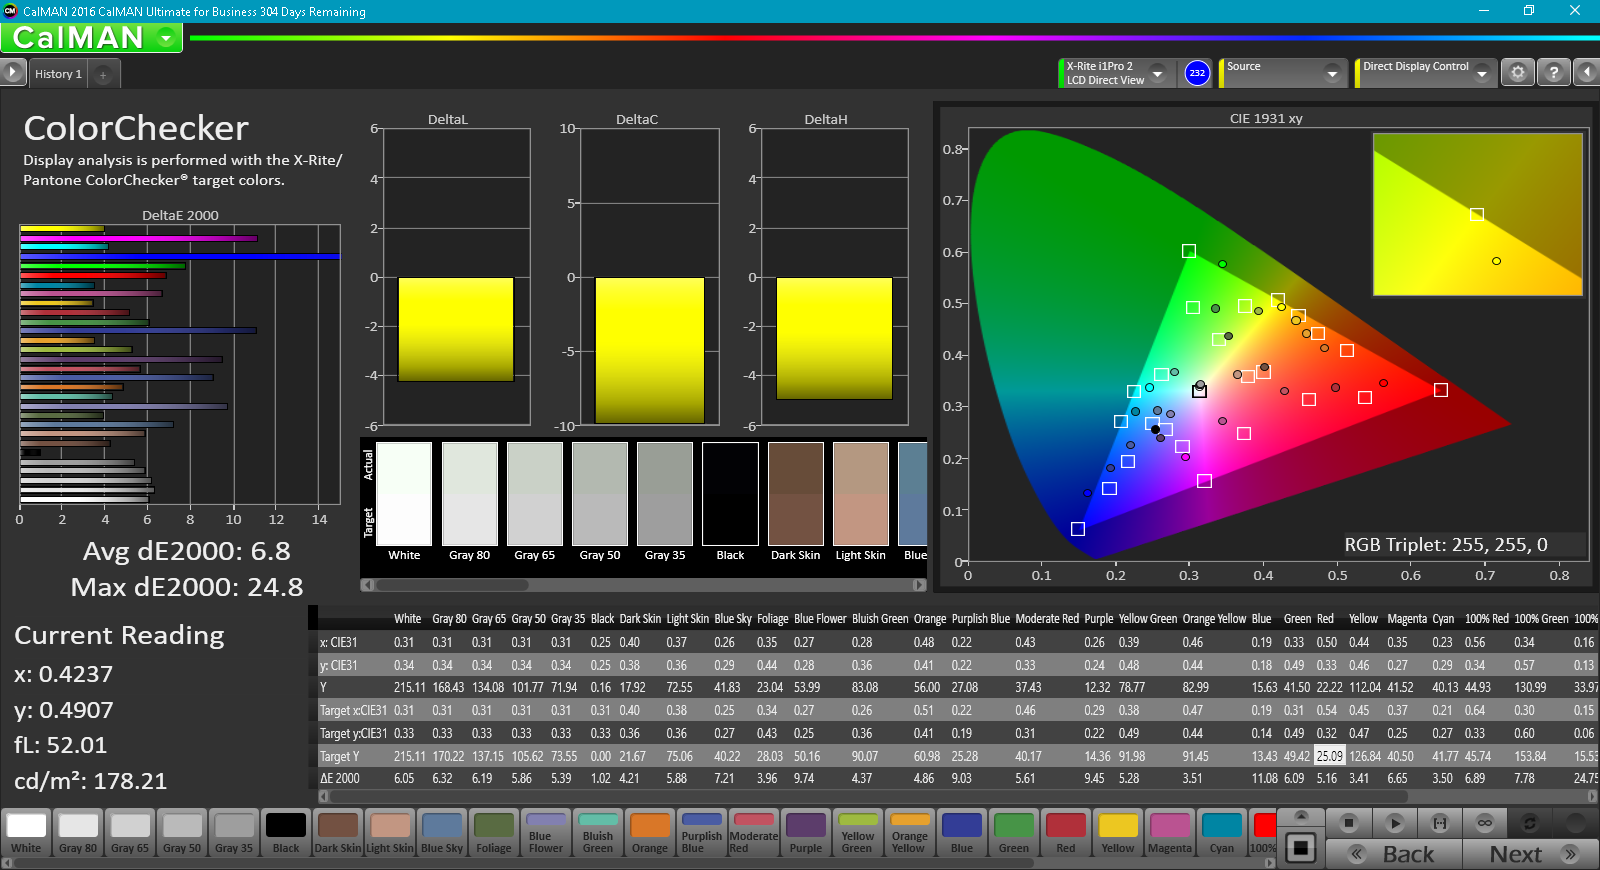
ΔE ColorChecker Calman: 6.8 | ∀{0.5-29.43 Ø4.72}
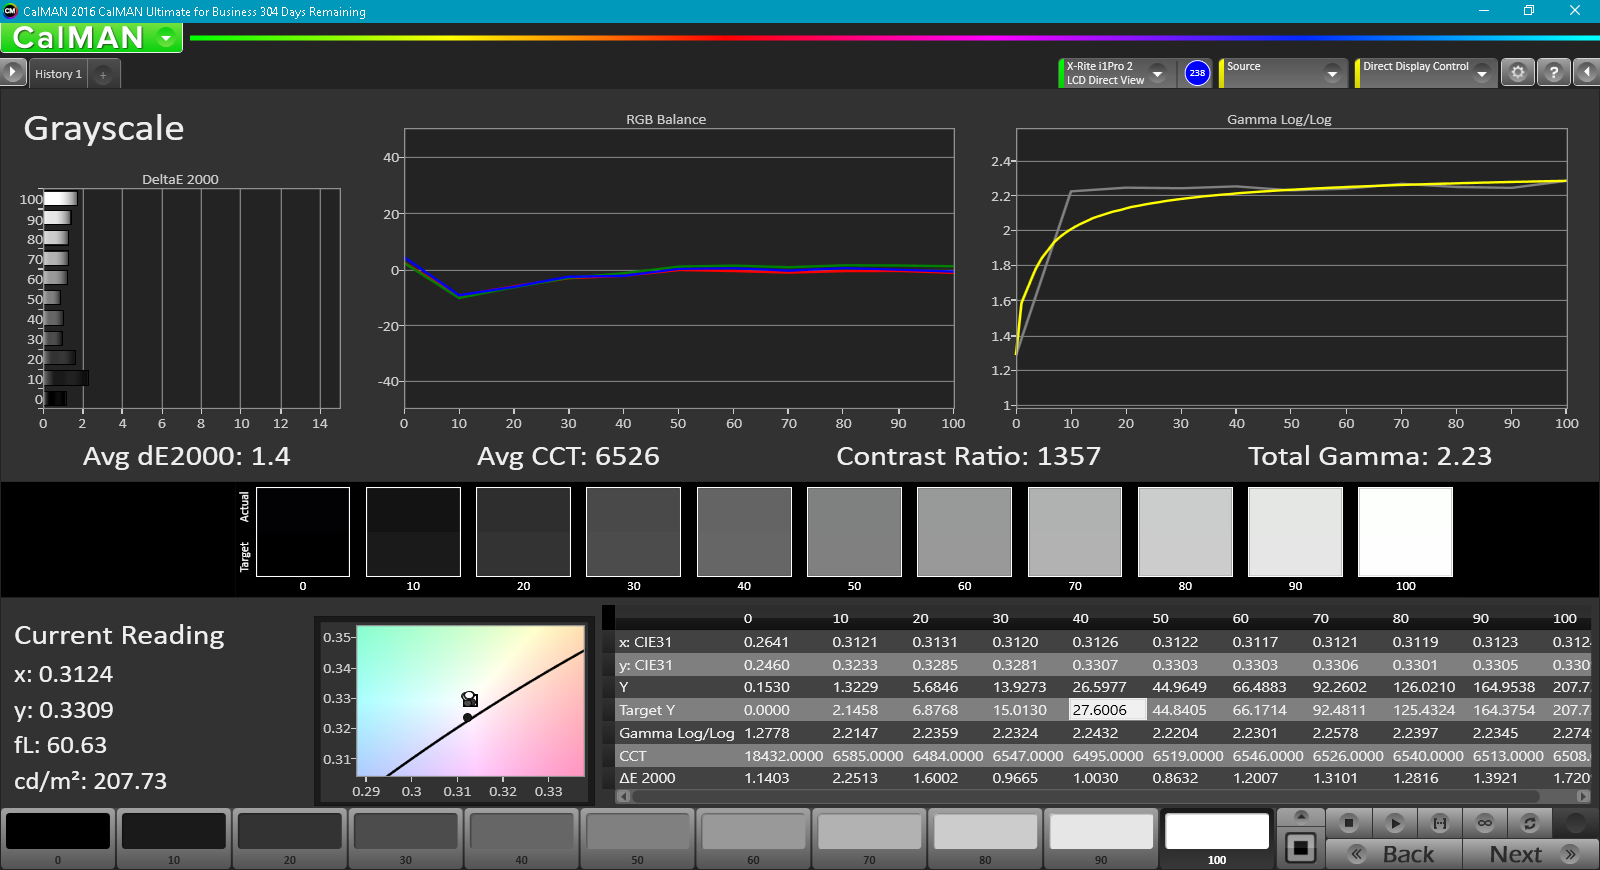
ΔE Greyscale Calman: 4.9 | ∀{0.09-98 Ø4.97}
54% sRGB (Argyll 1.6.3 3D)
34% AdobeRGB 1998 (Argyll 1.6.3 3D)
37.02% AdobeRGB 1998 (Argyll 3D)
53.9% sRGB (Argyll 3D)
35.83% Display P3 (Argyll 3D)
Gamma: 2.35
CCT: 6400 K
| Acer TravelMate P449-M-7407 AU Optronics AU0213D, IPS, 14", 1920x1080 | Acer TravelMate P259-MG-71UU BOE NT156FHM-N41, TN LED, 15.6", 1920x1080 | HP ProBook 450 G4 Y8B60EA Chi Mei CMN15C4, TN LED, 15.6", 1920x1080 | Lenovo ThinkPad E470-20H2S00400 N140HCA-EAB, IPS, 14", 1920x1080 | |
|---|---|---|---|---|
| Display | 8% | 11% | 15% | |
| Display P3 Coverage (%) | 35.83 | 38.58 8% | 39.89 11% | 41.23 15% |
| sRGB Coverage (%) | 53.9 | 58 8% | 59.5 10% | 61.4 14% |
| AdobeRGB 1998 Coverage (%) | 37.02 | 39.85 8% | 41.24 11% | 42.67 15% |
| Response Times | 21% | -1% | 9% | |
| Response Time Grey 50% / Grey 80% * (ms) | 50.8 ? | 43 ? 15% | 51 ? -0% | 40.8 ? 20% |
| Response Time Black / White * (ms) | 29.6 ? | 22 ? 26% | 30 ? -1% | 30.4 ? -3% |
| PWM Frequency (Hz) | 50 ? | |||
| Screen | -36% | -33% | -5% | |
| Brightness middle (cd/m²) | 208.3 | 180 -14% | 214 3% | 244 17% |
| Brightness (cd/m²) | 203 | 178 -12% | 201 -1% | 231 14% |
| Brightness Distribution (%) | 90 | 93 3% | 77 -14% | 89 -1% |
| Black Level * (cd/m²) | 0.19 | 0.45 -137% | 0.43 -126% | 0.37 -95% |
| Contrast (:1) | 1096 | 400 -64% | 498 -55% | 659 -40% |
| Colorchecker dE 2000 * | 6.8 | 9.91 -46% | 10.68 -57% | 6.41 6% |
| Colorchecker dE 2000 max. * | 24.8 | 18.19 27% | 18.07 27% | 13.4 46% |
| Greyscale dE 2000 * | 4.9 | 11.25 -130% | 11.32 -131% | 5.94 -21% |
| Gamma | 2.35 94% | 2.35 94% | 2.26 97% | 2.28 96% |
| CCT | 6400 102% | 12115 54% | 12204 53% | 6101 107% |
| Color Space (Percent of AdobeRGB 1998) (%) | 34 | 37 9% | 38 12% | 39.3 16% |
| Color Space (Percent of sRGB) (%) | 54 | 58 7% | 59 9% | 61.1 13% |
| Total Average (Program / Settings) | -2% /
-19% | -8% /
-20% | 6% /
1% |
* ... smaller is better
Display Response Times
| ↔ Response Time Black to White | ||
|---|---|---|
| 29.6 ms ... rise ↗ and fall ↘ combined | ↗ 6.8 ms rise | 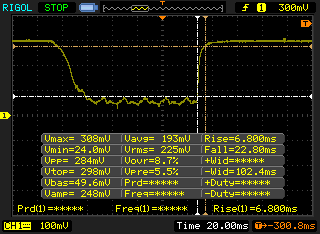 |
| ↘ 22.8 ms fall | ||
| The screen shows relatively slow response rates in our tests and may be too slow for gamers. In comparison, all tested devices range from 0.1 (minimum) to 240 (maximum) ms. » 79 % of all devices are better. This means that the measured response time is worse than the average of all tested devices (19.8 ms). | ||
| ↔ Response Time 50% Grey to 80% Grey | ||
| 50.8 ms ... rise ↗ and fall ↘ combined | ↗ 18.8 ms rise | 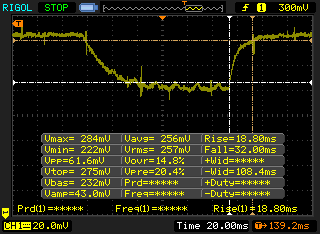 |
| ↘ 32 ms fall | ||
| The screen shows slow response rates in our tests and will be unsatisfactory for gamers. In comparison, all tested devices range from 0.165 (minimum) to 636 (maximum) ms. » 87 % of all devices are better. This means that the measured response time is worse than the average of all tested devices (31 ms). | ||
Screen Flickering / PWM (Pulse-Width Modulation)
| Screen flickering / PWM not detected | ||
In comparison: 52 % of all tested devices do not use PWM to dim the display. If PWM was detected, an average of 7772 (minimum: 5 - maximum: 343500) Hz was measured. | ||
| Cinebench R15 | |
| CPU Single 64Bit | |
| HP Pavilion 17t-ab200 | |
| HP ProBook 450 G4 Y8B60EA | |
| Asus UX310UQ-FC396T | |
| Acer TravelMate P259-MG-71UU | |
| Lenovo ThinkPad E470-20H2S00400 | |
| Acer TravelMate P449-M-7407 | |
| Acer Spin 5 SP513-51 | |
| HP ProBook 440 G4 Z2Y47ES | |
| CPU Multi 64Bit | |
| HP Pavilion 17t-ab200 | |
| HP ProBook 450 G4 Y8B60EA | |
| Asus UX310UQ-FC396T | |
| Lenovo ThinkPad E470-20H2S00400 | |
| Acer TravelMate P259-MG-71UU | |
| Acer TravelMate P449-M-7407 | |
| HP ProBook 440 G4 Z2Y47ES | |
| Acer Spin 5 SP513-51 | |
| Cinebench R10 | |
| Rendering Multiple CPUs 32Bit | |
| Asus UX310UQ-FC396T | |
| Acer TravelMate P259-MG-71UU | |
| Acer TravelMate P449-M-7407 | |
| Rendering Single 32Bit | |
| Asus UX310UQ-FC396T | |
| Acer TravelMate P259-MG-71UU | |
| Acer TravelMate P449-M-7407 | |
| wPrime 2.10 - 1024m | |
| HP ProBook 440 G4 Z2Y47ES | |
| Acer TravelMate P449-M-7407 | |
| HP Pavilion 17t-ab200 | |
* ... smaller is better
| PCMark 8 | |
| Home Score Accelerated v2 | |
| Acer TravelMate P259-MG-71UU | |
| Acer TravelMate P449-M-7407 | |
| Lenovo ThinkPad E470-20H2S00400 | |
| HP ProBook 450 G4 Y8B60EA | |
| Work Score Accelerated v2 | |
| HP ProBook 450 G4 Y8B60EA | |
| Acer TravelMate P259-MG-71UU | |
| Lenovo ThinkPad E470-20H2S00400 | |
| Acer TravelMate P449-M-7407 | |
| Creative Score Accelerated v2 | |
| Lenovo ThinkPad E470-20H2S00400 | |
| Acer TravelMate P449-M-7407 | |
| Acer TravelMate P259-MG-71UU | |
| PCMark 7 Score | 5504 points | |
| PCMark 8 Home Score Accelerated v2 | 3648 points | |
| PCMark 8 Creative Score Accelerated v2 | 4350 points | |
| PCMark 8 Work Score Accelerated v2 | 4511 points | |
Help | ||
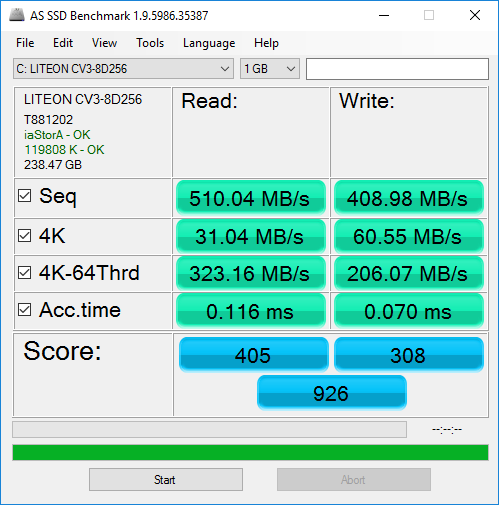
| Acer TravelMate P449-M-7407 Liteonit CV3-8D256 | Acer TravelMate P259-MG-71UU Liteonit CV3-8D256 | Lenovo ThinkPad E470-20H2S00400 SanDisk X400 SED 256GB, SATA (SD8TB8U-256G) | Asus Zenbook UX310UA-FC347T iGP Micron SSD 1100 (MTFDDAV256TBN) | HP Spectre x360 15-bl002xx Toshiba XG4 NVMe (THNSN5512GPUK) | |
|---|---|---|---|---|---|
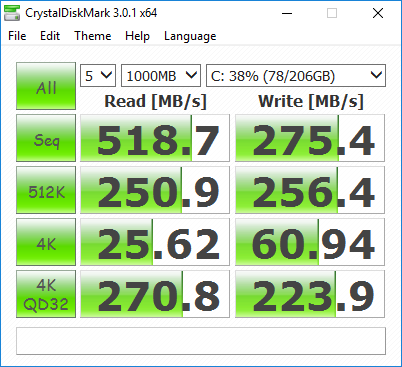
| CrystalDiskMark 3.0 | 8% | 20% | 25% | 146% | |
| Read Seq (MB/s) | 519 | 478.5 -8% | 476.5 -8% | 489.4 -6% | 1266 144% |
| Write Seq (MB/s) | 275.4 | 258.2 -6% | 458.7 67% | 431.6 57% | 982 257% |
| Read 512 (MB/s) | 250.9 | 254.3 1% | 346.4 38% | 356.7 42% | 834 232% |
| Write 512 (MB/s) | 256.4 | 264.8 3% | 291.1 14% | 389.1 52% | 714 178% |
| Read 4k (MB/s) | 25.6 | 28.32 11% | 35.15 37% | 26.68 4% | 40.72 59% |
| Write 4k (MB/s) | 60.9 | 76.3 25% | 78.8 29% | 88.7 46% | 139.4 129% |
| Read 4k QD32 (MB/s) | 270.8 | 346.2 28% | 276 2% | 246.3 -9% | 527 95% |
| Write 4k QD32 (MB/s) | 223.9 | 240.2 7% | 178.3 -20% | 251.5 12% | 395.2 77% |

| 3DMark 11 Performance | 1578 points | |
| 3DMark Ice Storm Standard Score | 55532 points | |
| 3DMark Cloud Gate Standard Score | 5590 points | |
| 3DMark Fire Strike Score | 722 points | |
Help | ||
Noise level
| Idle |
| 29.2 / 29.2 / 31.2 dB(A) |
| Load |
| 35.6 / 40.8 dB(A) |
 | ||
30 dB silent 40 dB(A) audible 50 dB(A) loud |
||
min: | ||
| Acer TravelMate P449-M-7407 HD Graphics 520, 6500U, Liteonit CV3-8D256 | Acer TravelMate P259-MG-71UU GeForce 940MX, 6500U, Liteonit CV3-8D256 | HP ProBook 450 G4 Y8B60EA GeForce 930MX, i7-7500U, SanDisk SD8SNAT256G1002 | Lenovo ThinkPad E470-20H2S00400 GeForce 940MX, i5-7200U, SanDisk X400 SED 256GB, SATA (SD8TB8U-256G) | Asus Zenbook UX310UQ-GL011T GeForce 940MX, 6500U, SanDisk SD8SNAT256G1002 | |
|---|---|---|---|---|---|
| Noise | -3% | -7% | 3% | -2% | |
| off / environment * (dB) | 29.2 | 30.5 -4% | 31.6 -8% | 29 1% | 30.5 -4% |
| Idle Minimum * (dB) | 29.2 | 31.6 -8% | 32.6 -12% | 29 1% | 30.5 -4% |
| Idle Average * (dB) | 29.2 | 31.6 -8% | 32.6 -12% | 29 1% | 30.5 -4% |
| Idle Maximum * (dB) | 31.2 | 32 -3% | 33 -6% | 29 7% | 31.5 -1% |
| Load Average * (dB) | 35.6 | 35.5 -0% | 38.9 -9% | 35.6 -0% | 36.2 -2% |
| Load Maximum * (dB) | 40.8 | 38.3 6% | 38.9 5% | 38.5 6% | 40 2% |
* ... smaller is better
(+) The maximum temperature on the upper side is 35.2 °C / 95 F, compared to the average of 34.3 °C / 94 F, ranging from 21.2 to 62.5 °C for the class Office.
(+) The bottom heats up to a maximum of 37 °C / 99 F, compared to the average of 36.8 °C / 98 F
(+) In idle usage, the average temperature for the upper side is 22.6 °C / 73 F, compared to the device average of 29.5 °C / 85 F.
(+) The palmrests and touchpad are cooler than skin temperature with a maximum of 21.8 °C / 71.2 F and are therefore cool to the touch.
(+) The average temperature of the palmrest area of similar devices was 27.5 °C / 81.5 F (+5.7 °C / 10.3 F).
Acer TravelMate P449-M-7407 audio analysis
(±) | speaker loudness is average but good (78.9 dB)
Bass 100 - 315 Hz
(-) | nearly no bass - on average 18.2% lower than median
(±) | linearity of bass is average (14% delta to prev. frequency)
Mids 400 - 2000 Hz
(+) | balanced mids - only 4.1% away from median
(±) | linearity of mids is average (10.1% delta to prev. frequency)
Highs 2 - 16 kHz
(±) | higher highs - on average 5.6% higher than median
(±) | linearity of highs is average (10.5% delta to prev. frequency)
Overall 100 - 16.000 Hz
(±) | linearity of overall sound is average (23.8% difference to median)
Compared to same class
» 68% of all tested devices in this class were better, 8% similar, 24% worse
» The best had a delta of 7%, average was 21%, worst was 53%
Compared to all devices tested
» 71% of all tested devices were better, 6% similar, 22% worse
» The best had a delta of 4%, average was 24%, worst was 134%
Lenovo ThinkPad E470-20H2S00400 audio analysis
(+) | speakers can play relatively loud (84.8 dB)
Bass 100 - 315 Hz
(-) | nearly no bass - on average 15.7% lower than median
(±) | linearity of bass is average (11.2% delta to prev. frequency)
Mids 400 - 2000 Hz
(±) | higher mids - on average 9% higher than median
(±) | linearity of mids is average (11.1% delta to prev. frequency)
Highs 2 - 16 kHz
(±) | higher highs - on average 5.1% higher than median
(±) | linearity of highs is average (10.5% delta to prev. frequency)
Overall 100 - 16.000 Hz
(±) | linearity of overall sound is average (23.8% difference to median)
Compared to same class
» 68% of all tested devices in this class were better, 8% similar, 24% worse
» The best had a delta of 7%, average was 21%, worst was 53%
Compared to all devices tested
» 71% of all tested devices were better, 6% similar, 22% worse
» The best had a delta of 4%, average was 24%, worst was 134%
| Off / Standby | |
| Idle | |
| Load |
|
Key:
min: | |
| Acer TravelMate P449-M-7407 6500U, HD Graphics 520, Liteonit CV3-8D256, IPS, 1920x1080, 14" | Acer TravelMate P259-MG-71UU 6500U, GeForce 940MX, Liteonit CV3-8D256, TN LED, 1920x1080, 15.6" | HP ProBook 450 G4 Y8B60EA i7-7500U, GeForce 930MX, SanDisk SD8SNAT256G1002, TN LED, 1920x1080, 15.6" | Lenovo ThinkPad E470-20H2S00400 i5-7200U, GeForce 940MX, SanDisk X400 SED 256GB, SATA (SD8TB8U-256G), IPS, 1920x1080, 14" | Asus Zenbook UX310UQ-GL011T 6500U, GeForce 940MX, SanDisk SD8SNAT256G1002, TN LED, 1920x1080, 13.3" | |
|---|---|---|---|---|---|
| Power Consumption | -62% | -34% | -27% | -32% | |
| Idle Minimum * (Watt) | 3.4 | 7 -106% | 3.8 -12% | 2.7 21% | 3 12% |
| Idle Average * (Watt) | 5.2 | 8 -54% | 6.6 -27% | 5.5 -6% | 5.6 -8% |
| Idle Maximum * (Watt) | 7.2 | 10.6 -47% | 11.3 -57% | 6.5 10% | 6.8 6% |
| Load Average * (Watt) | 28.2 | 39.7 -41% | 38 -35% | 44.2 -57% | 48.7 -73% |
| Load Maximum * (Watt) | 32 | 51.9 -62% | 45 -41% | 65.2 -104% | 63 -97% |
* ... smaller is better
| Acer TravelMate P449-M-7407 6500U, HD Graphics 520, 48.3 Wh | Acer TravelMate P259-MG-71UU 6500U, GeForce 940MX, 41 Wh | HP ProBook 450 G4 Y8B60EA i7-7500U, GeForce 930MX, 45 Wh | Lenovo ThinkPad E470-20H2S00400 i5-7200U, GeForce 940MX, 45 Wh | Asus Zenbook UX310UQ-GL011T 6500U, GeForce 940MX, 48 Wh | |
|---|---|---|---|---|---|
| Battery runtime | -26% | 21% | 27% | 19% | |
| Reader / Idle (h) | 9.4 | 10.3 10% | 12.4 32% | 17.4 85% | 14.6 55% |
| WiFi v1.3 (h) | 8.5 | 4.7 -45% | 8.6 1% | 5.4 -36% | 8.1 -5% |
| Load (h) | 1.6 | 0.9 -44% | 2.1 31% | 2.1 31% | 1.7 6% |
Pros
Cons
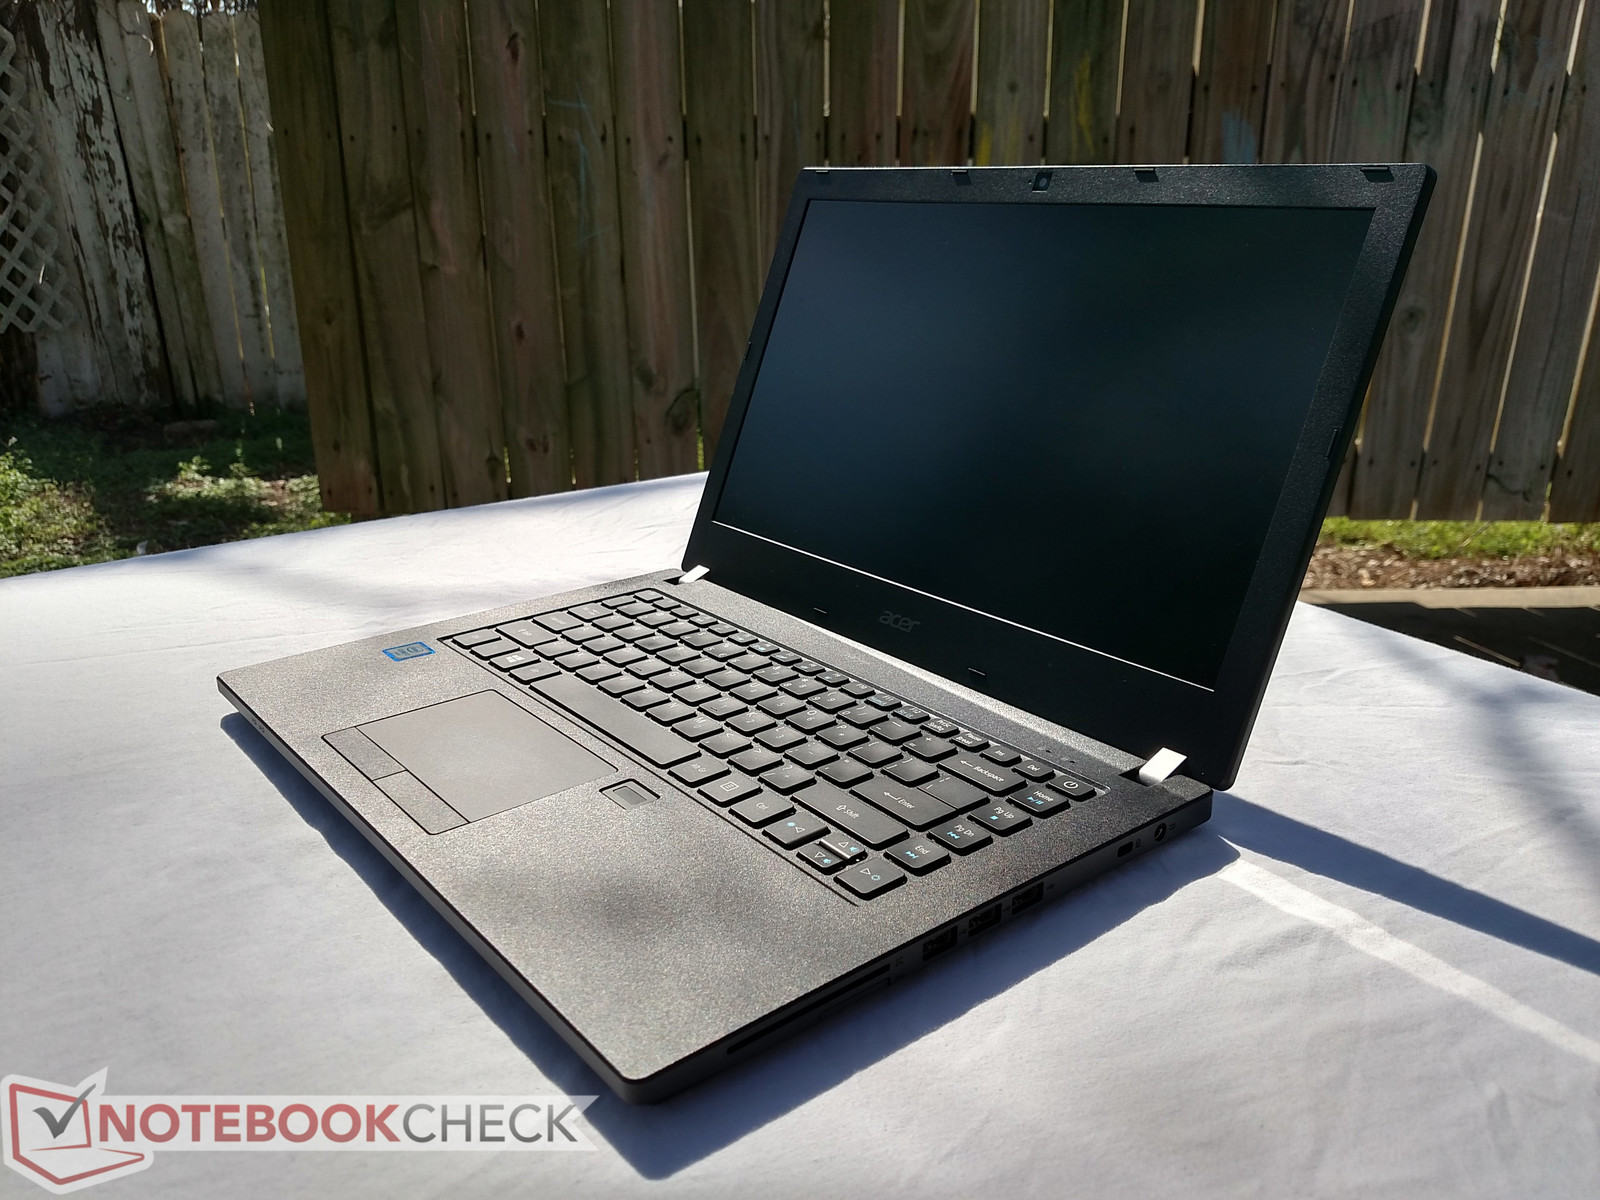
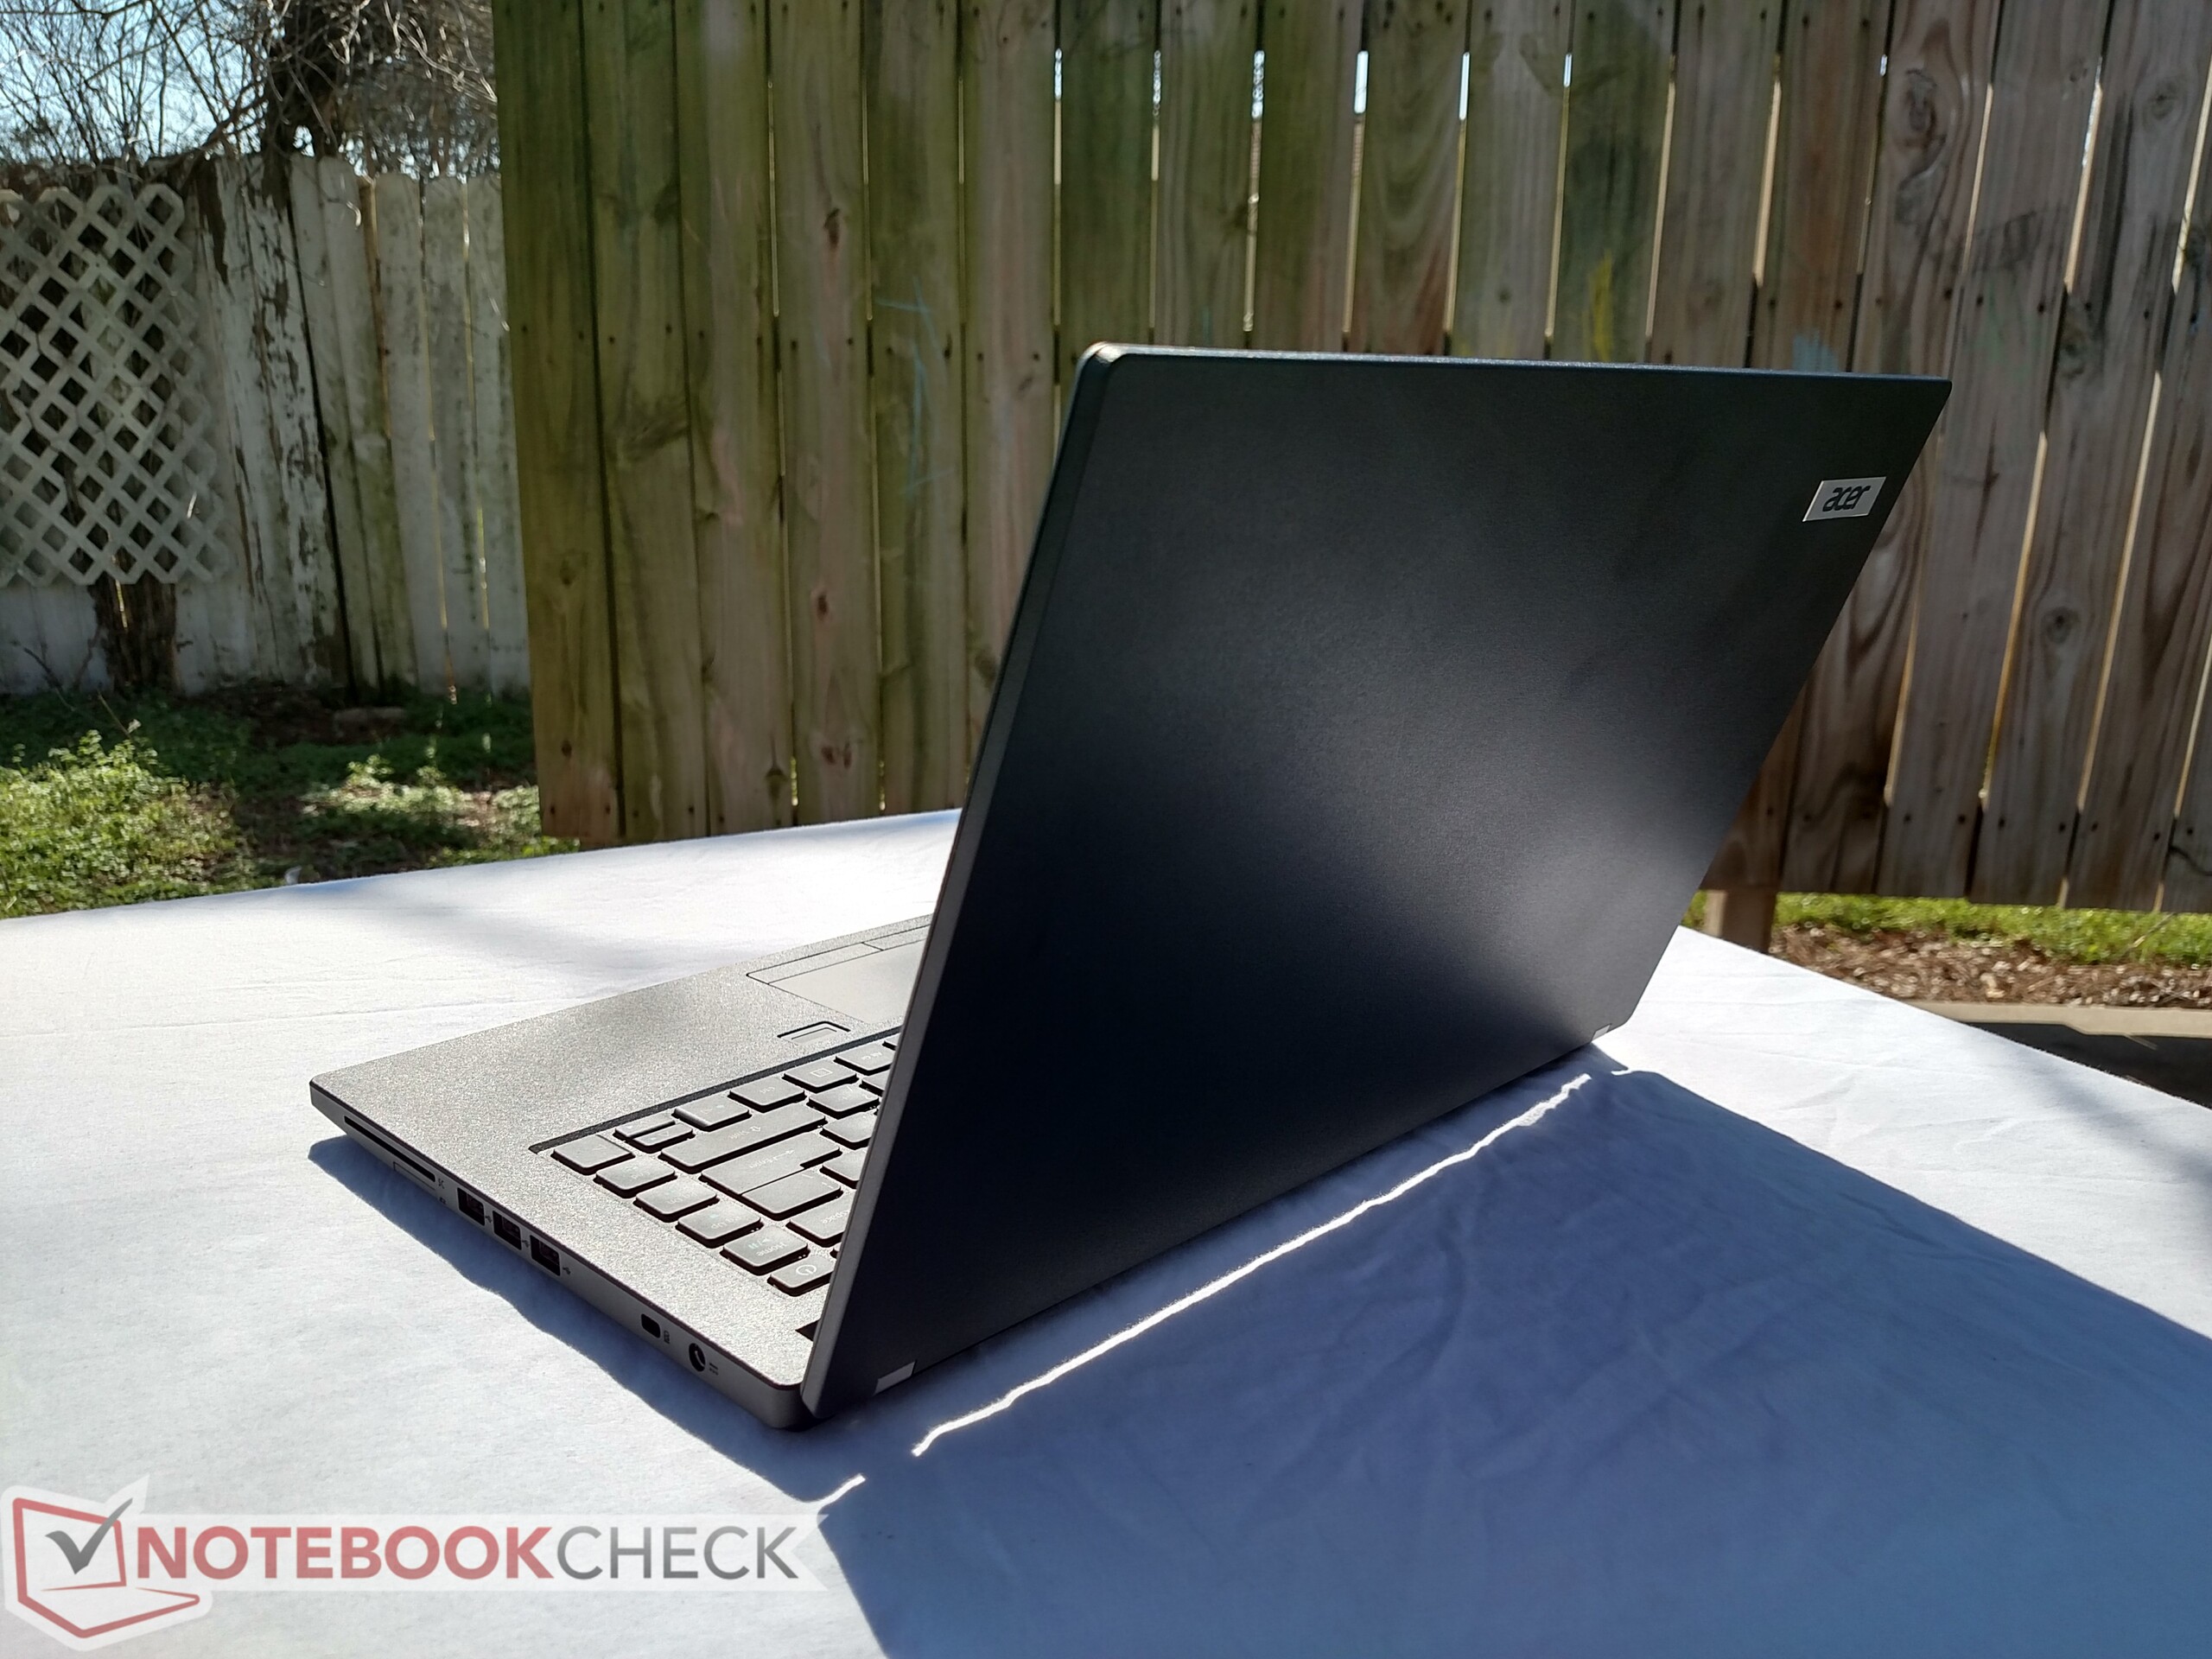
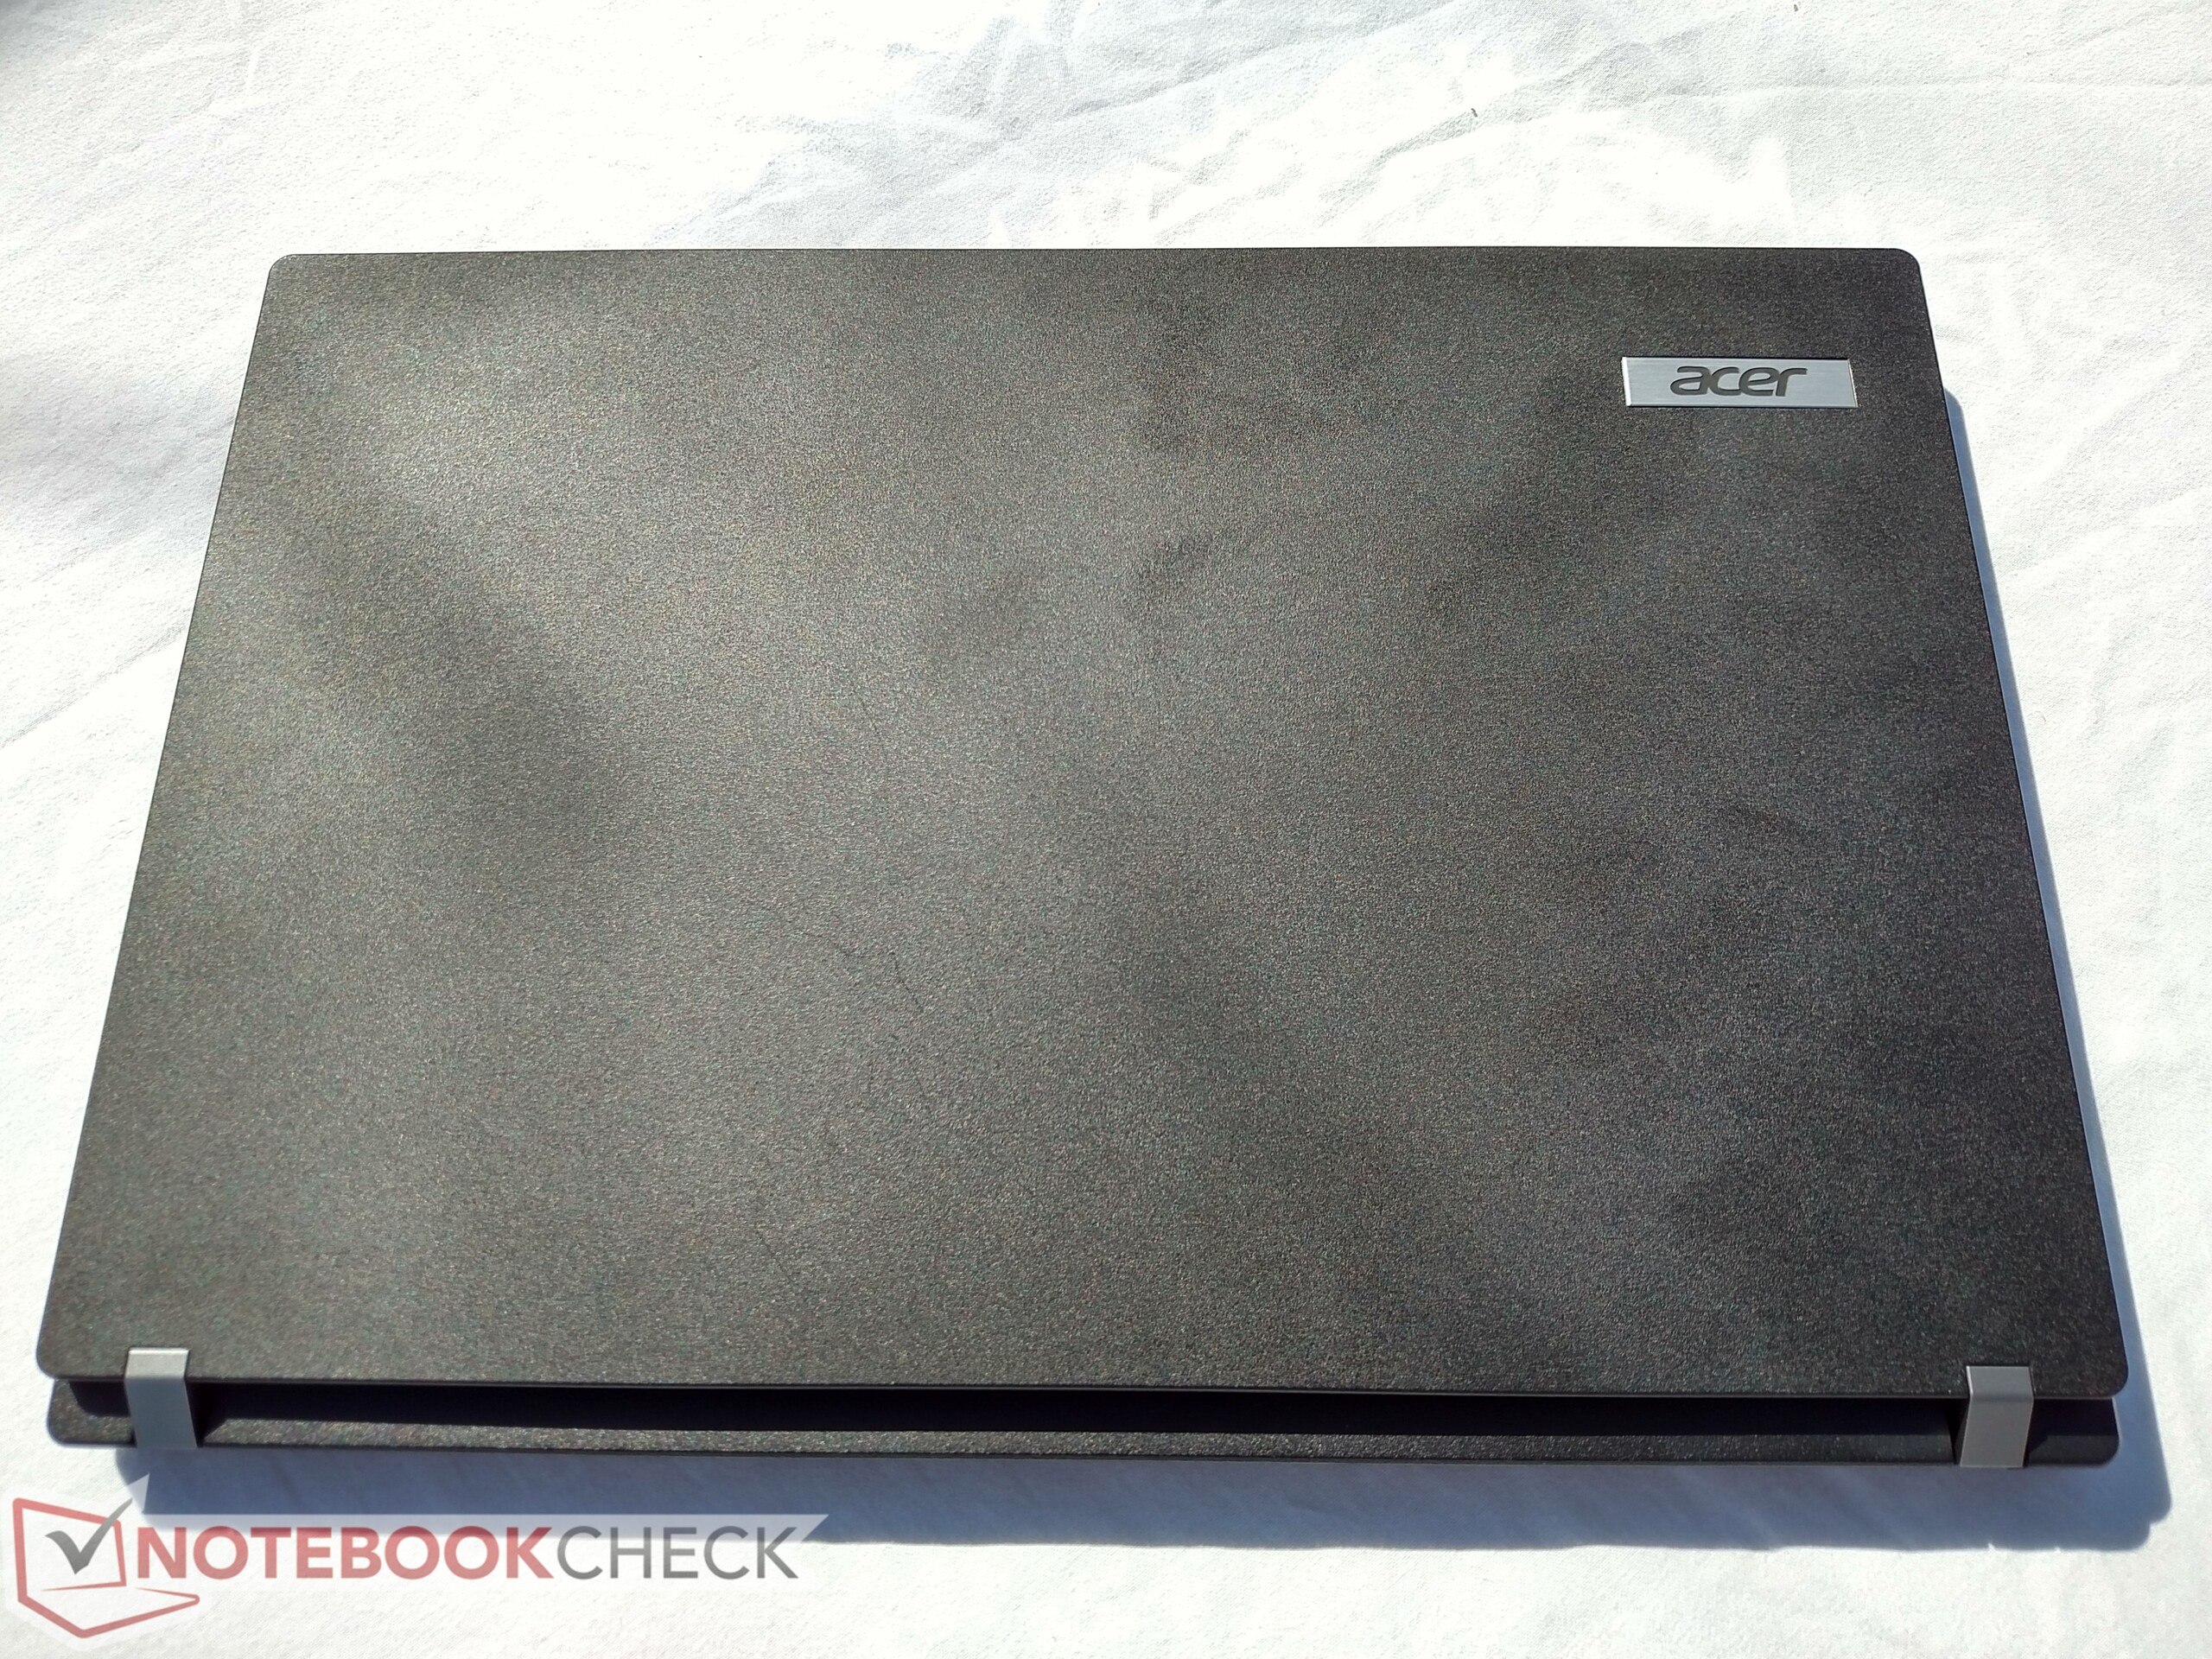
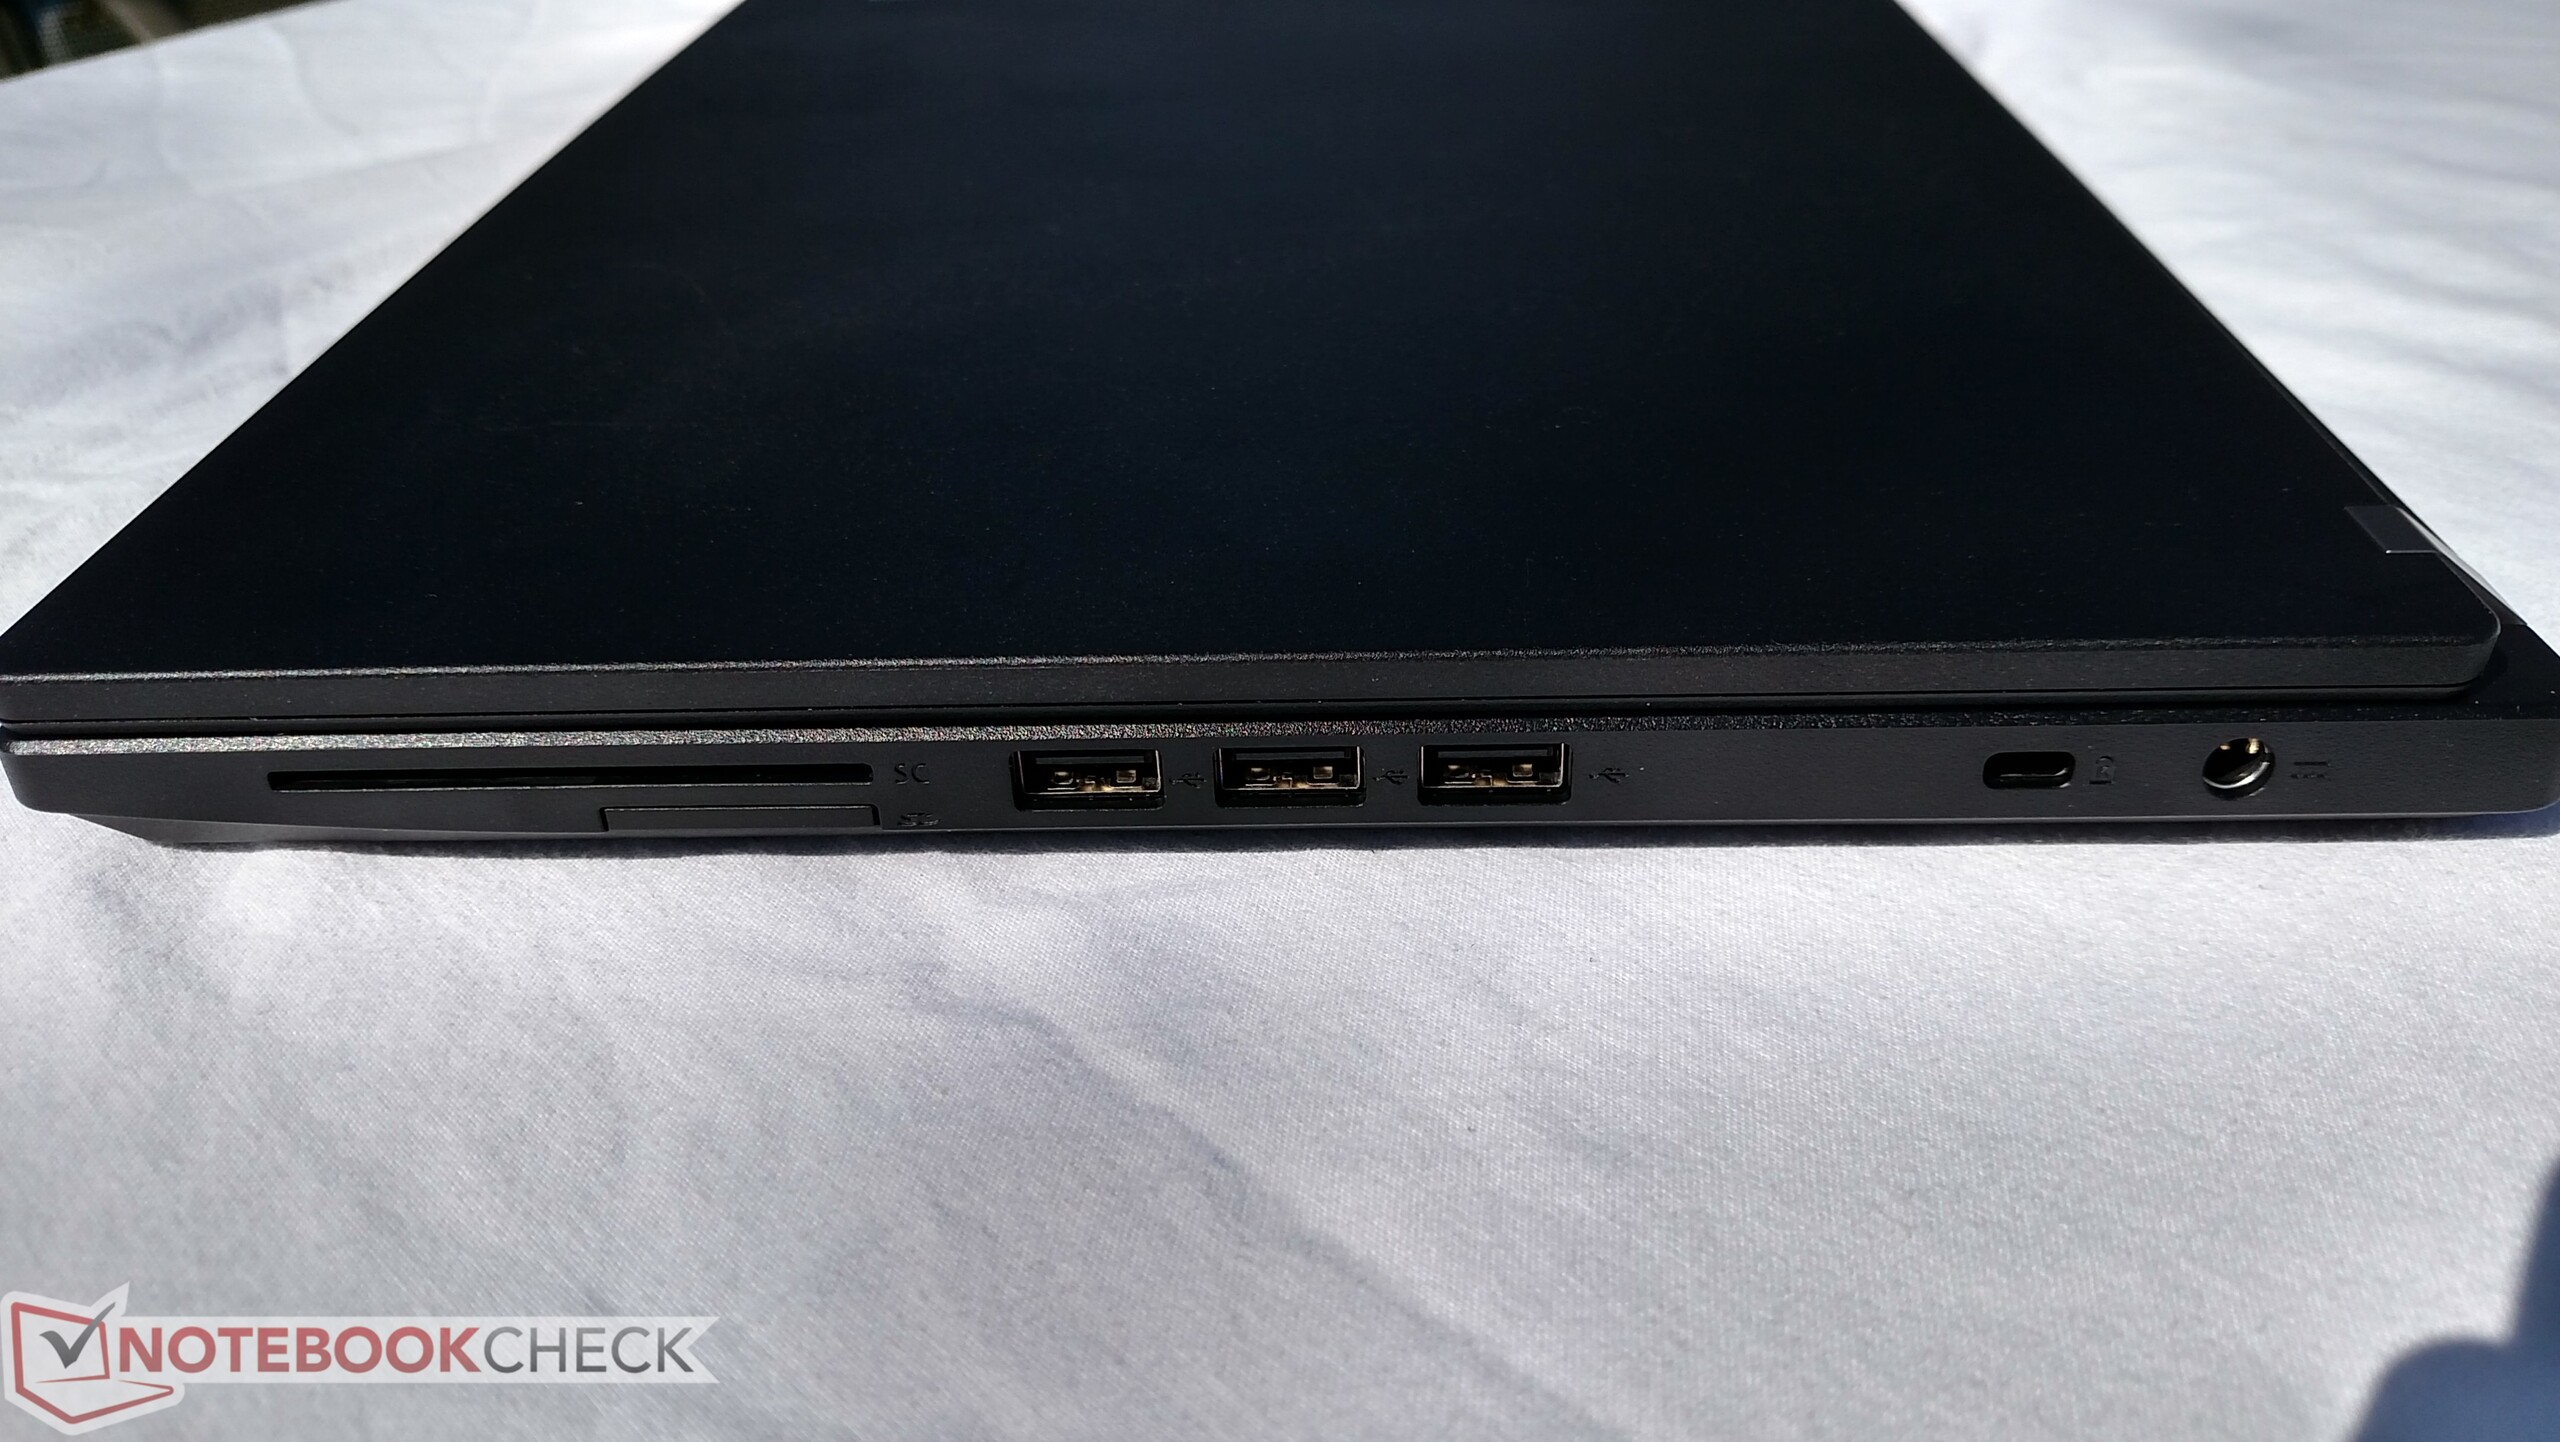
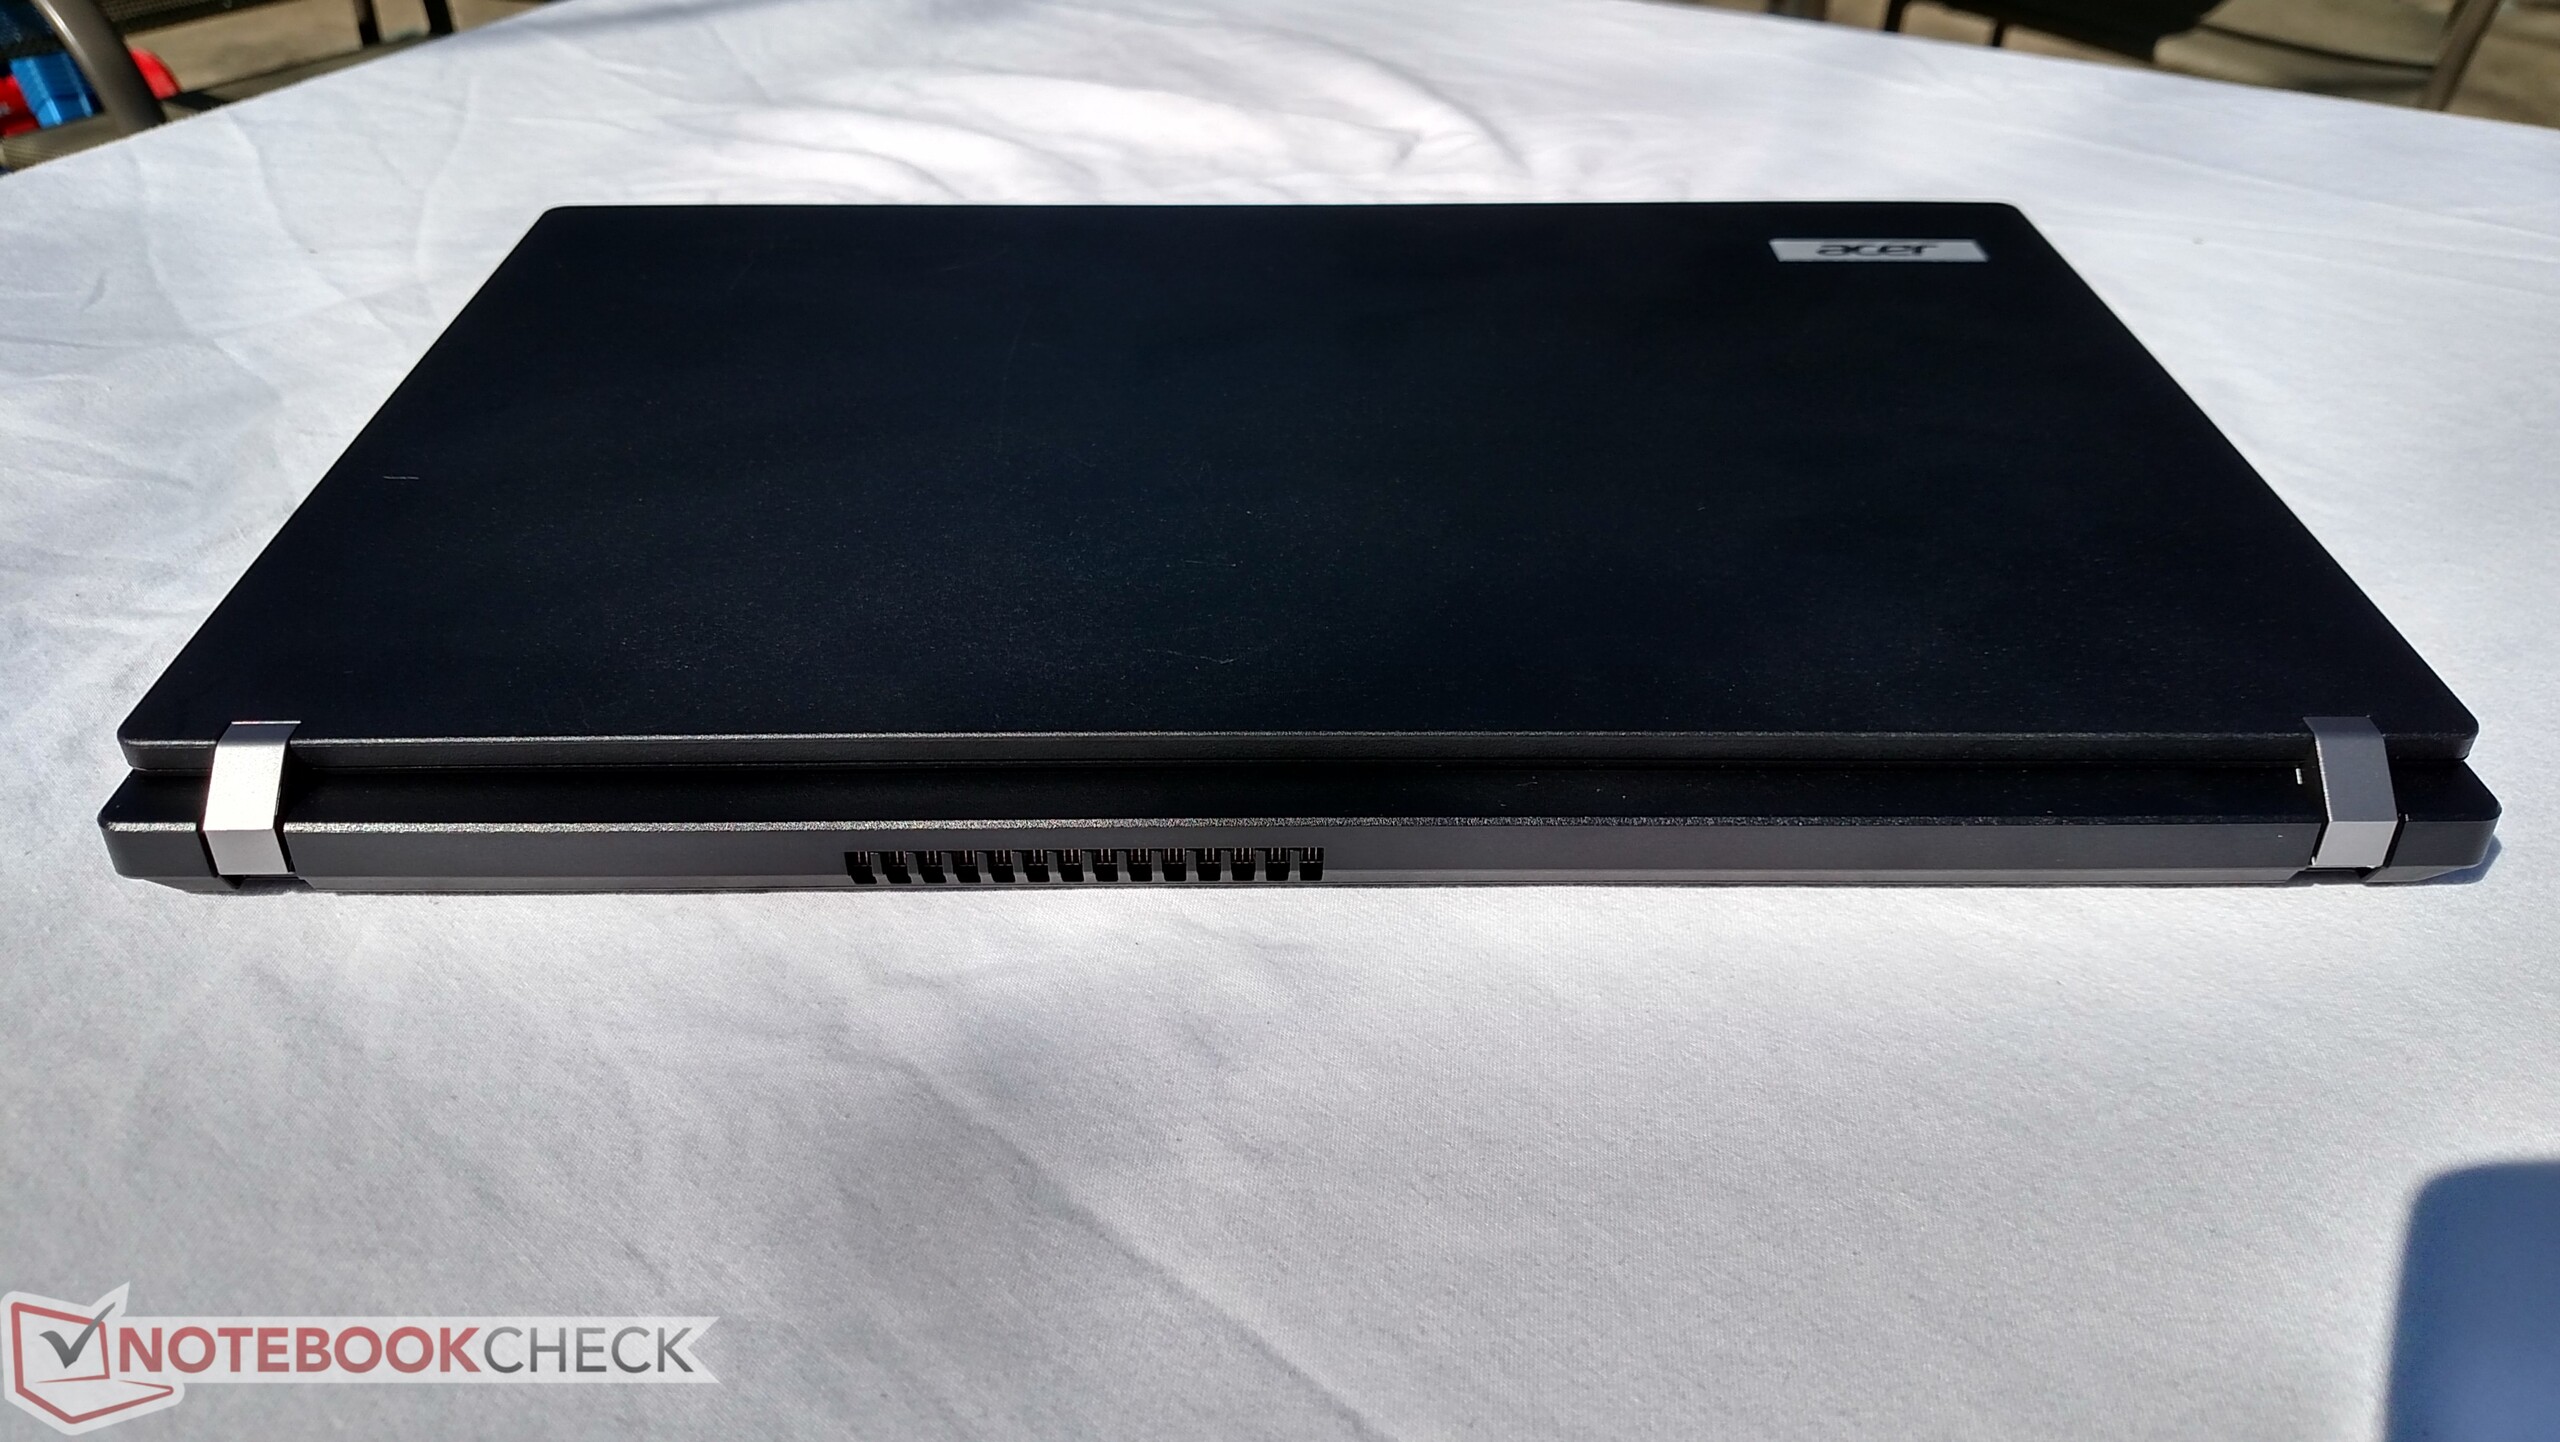
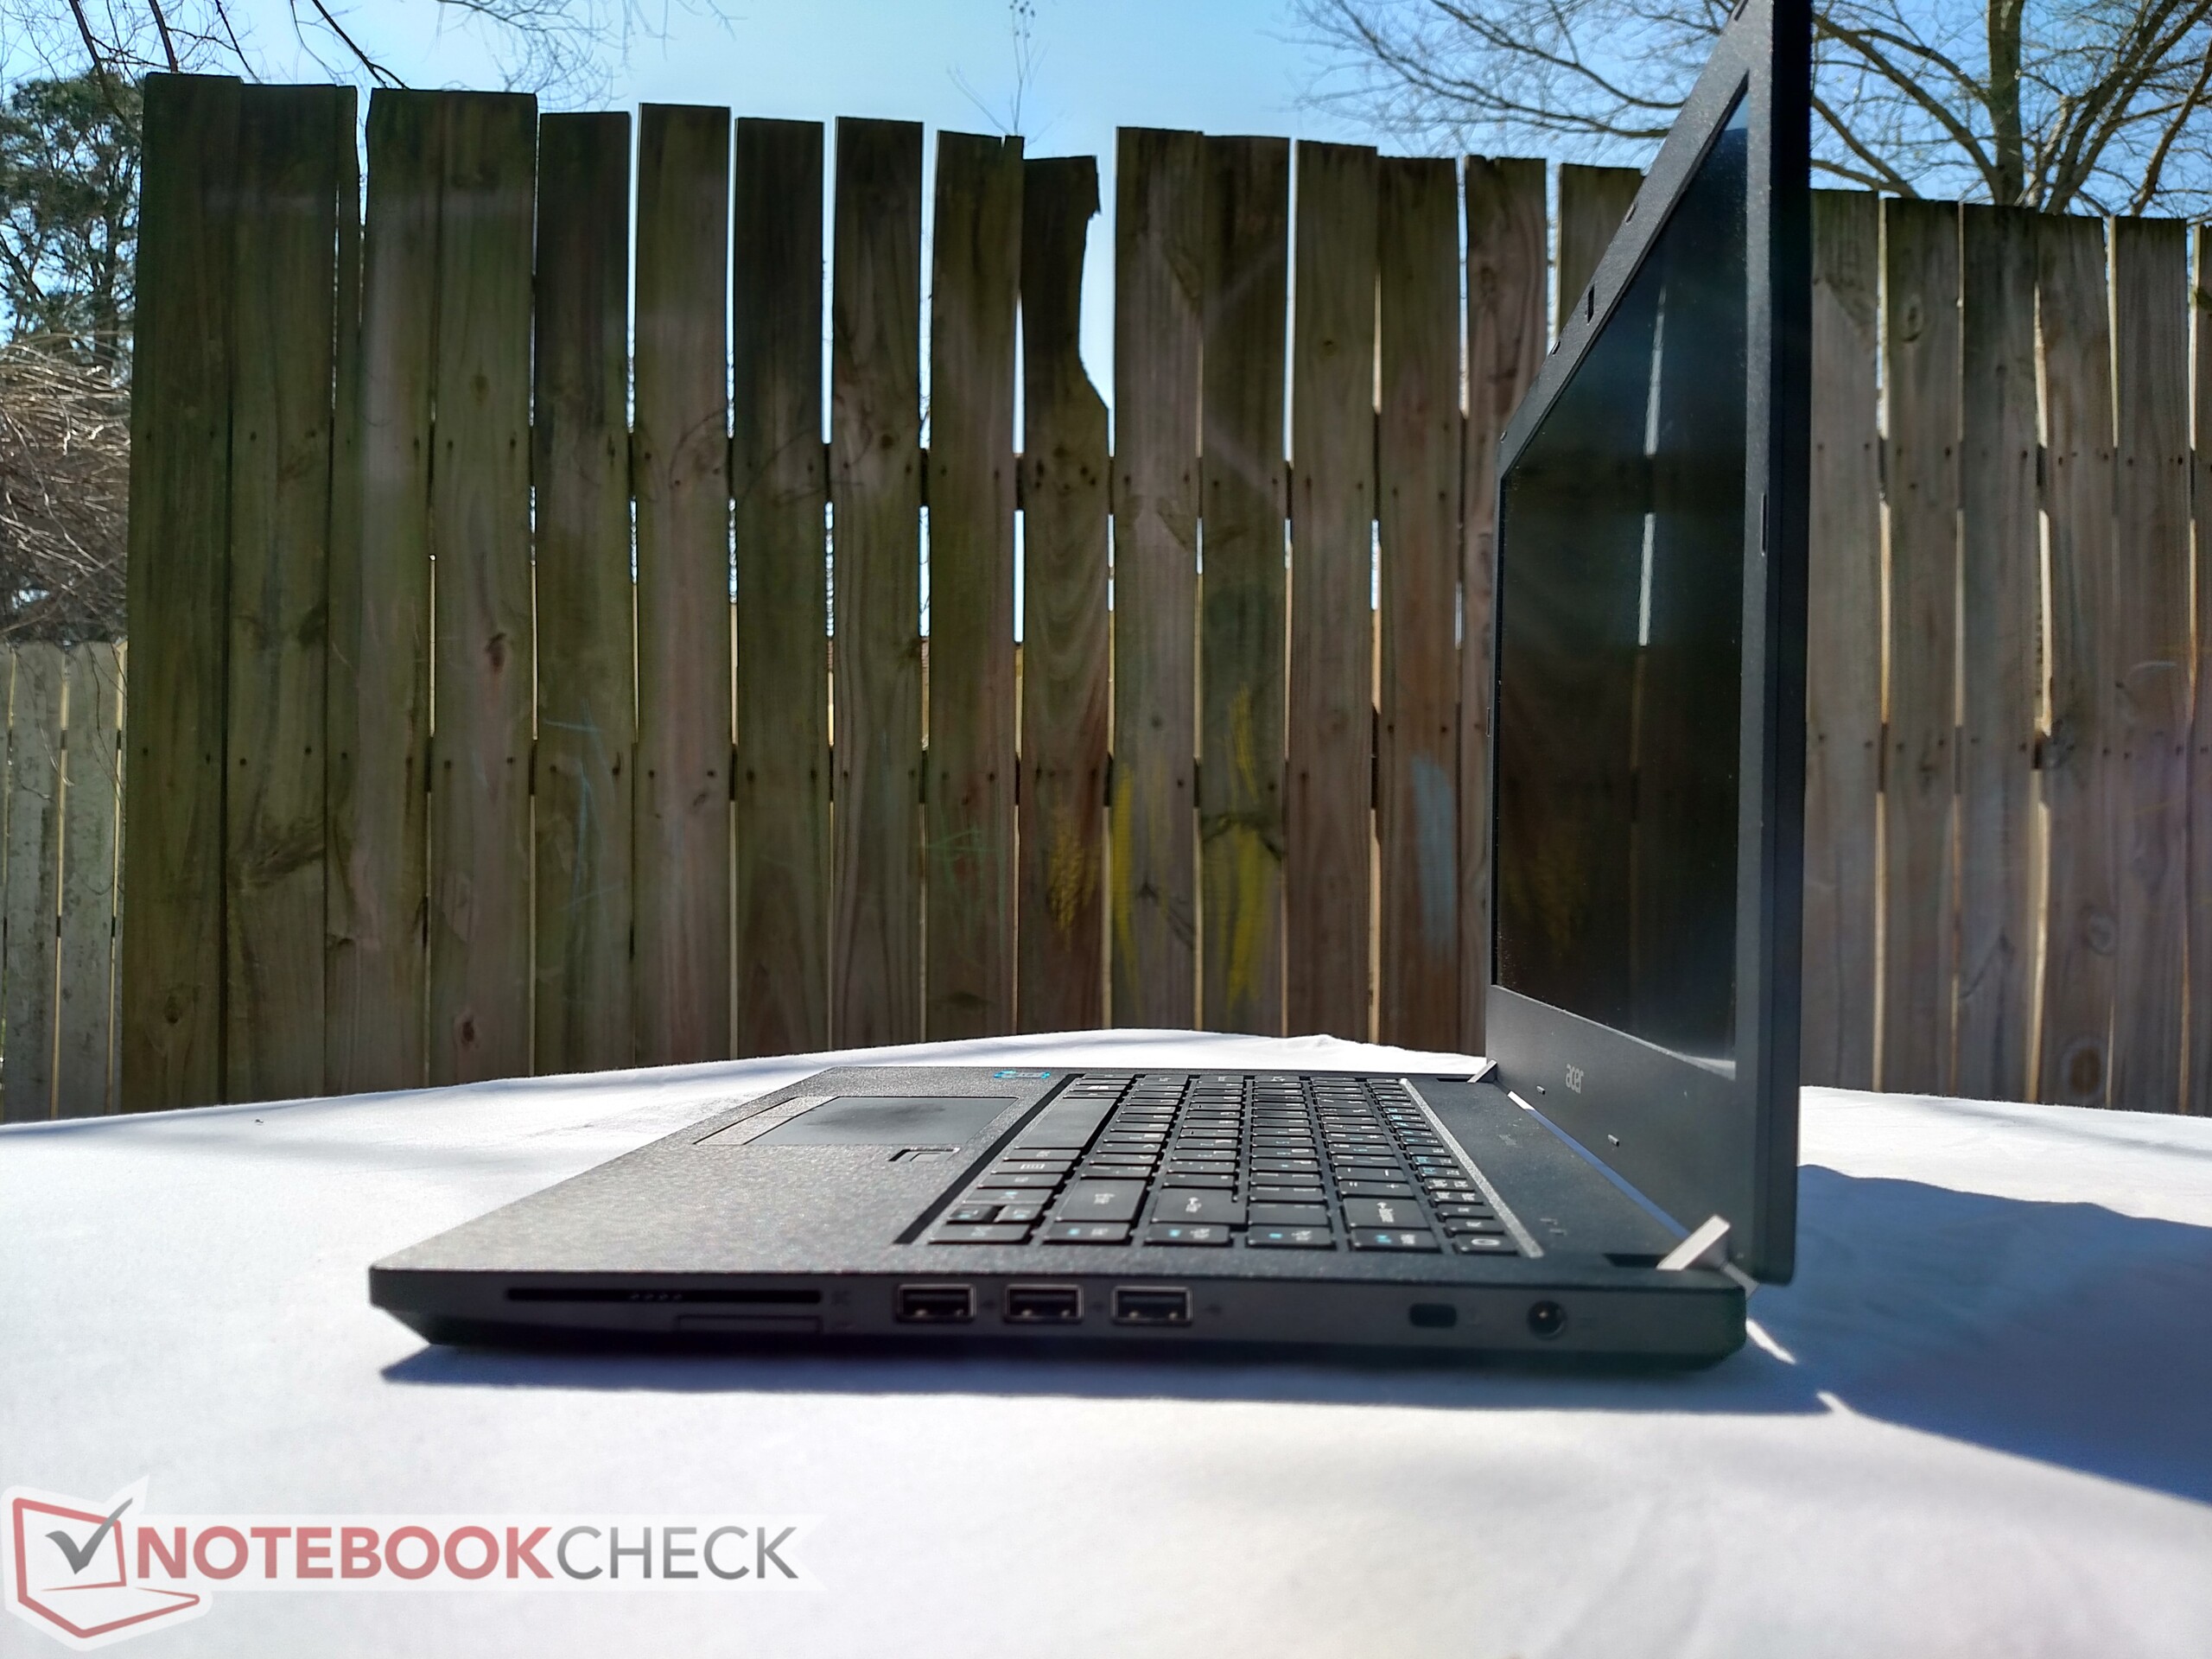
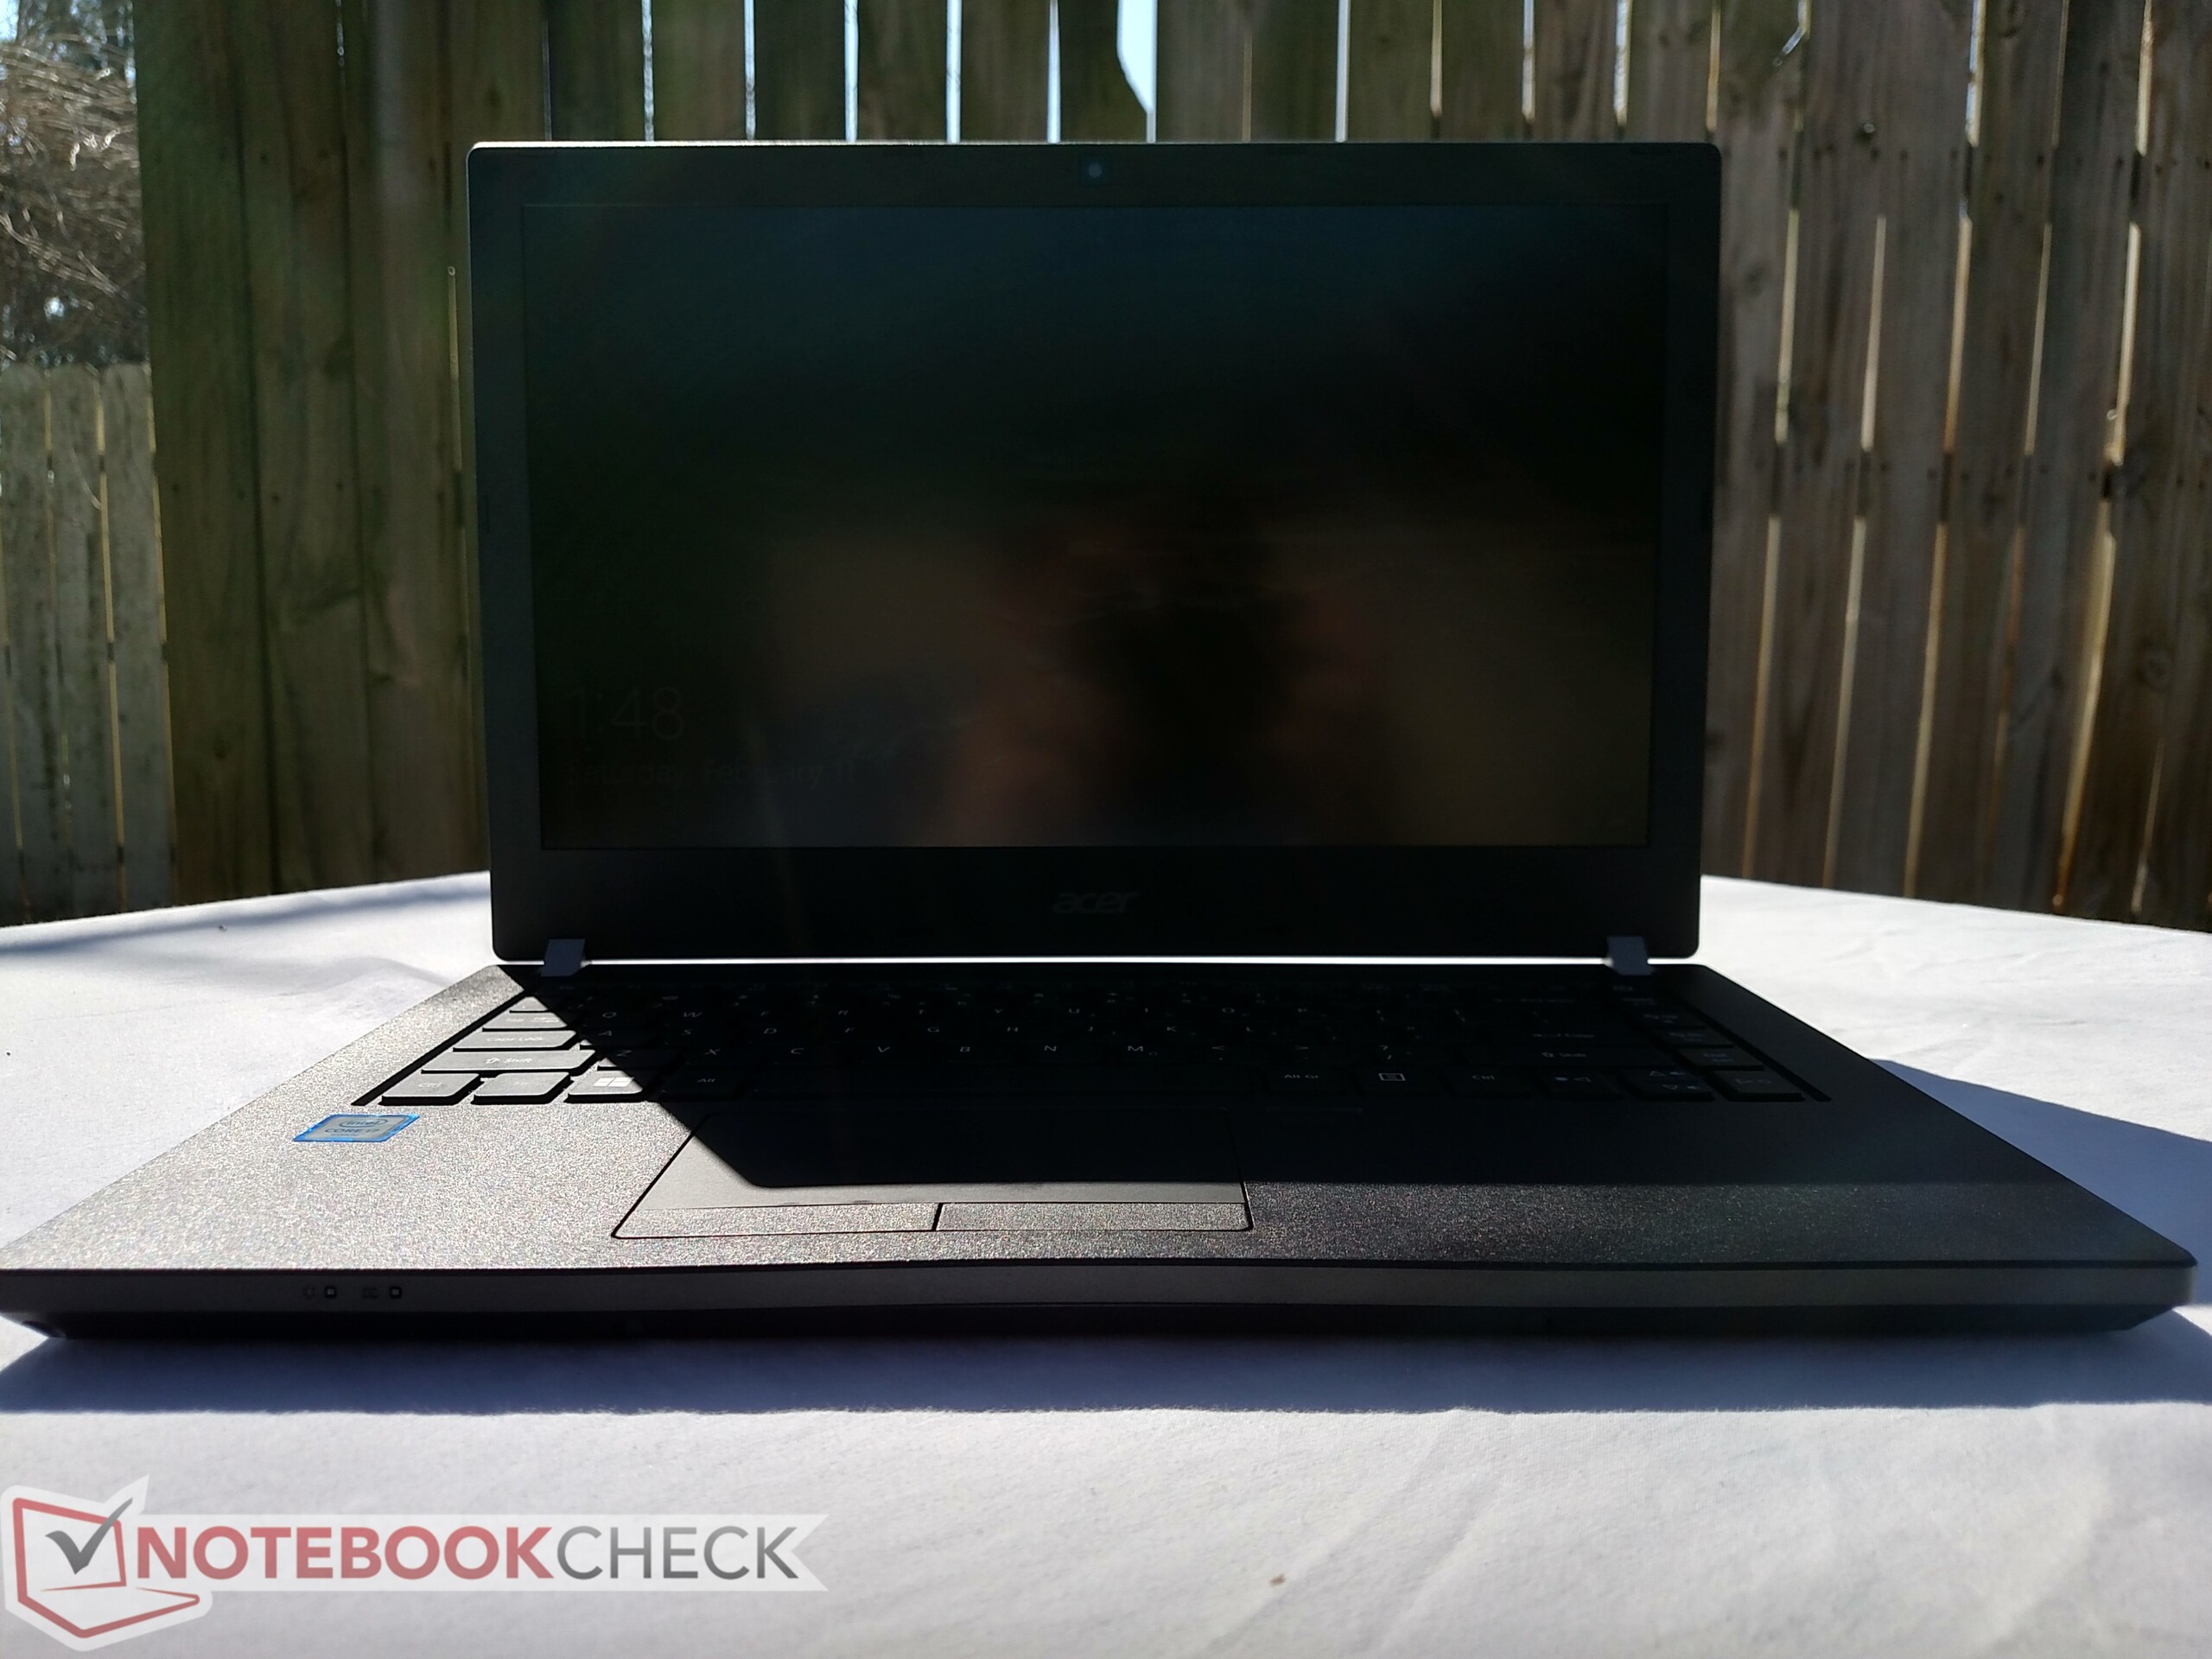
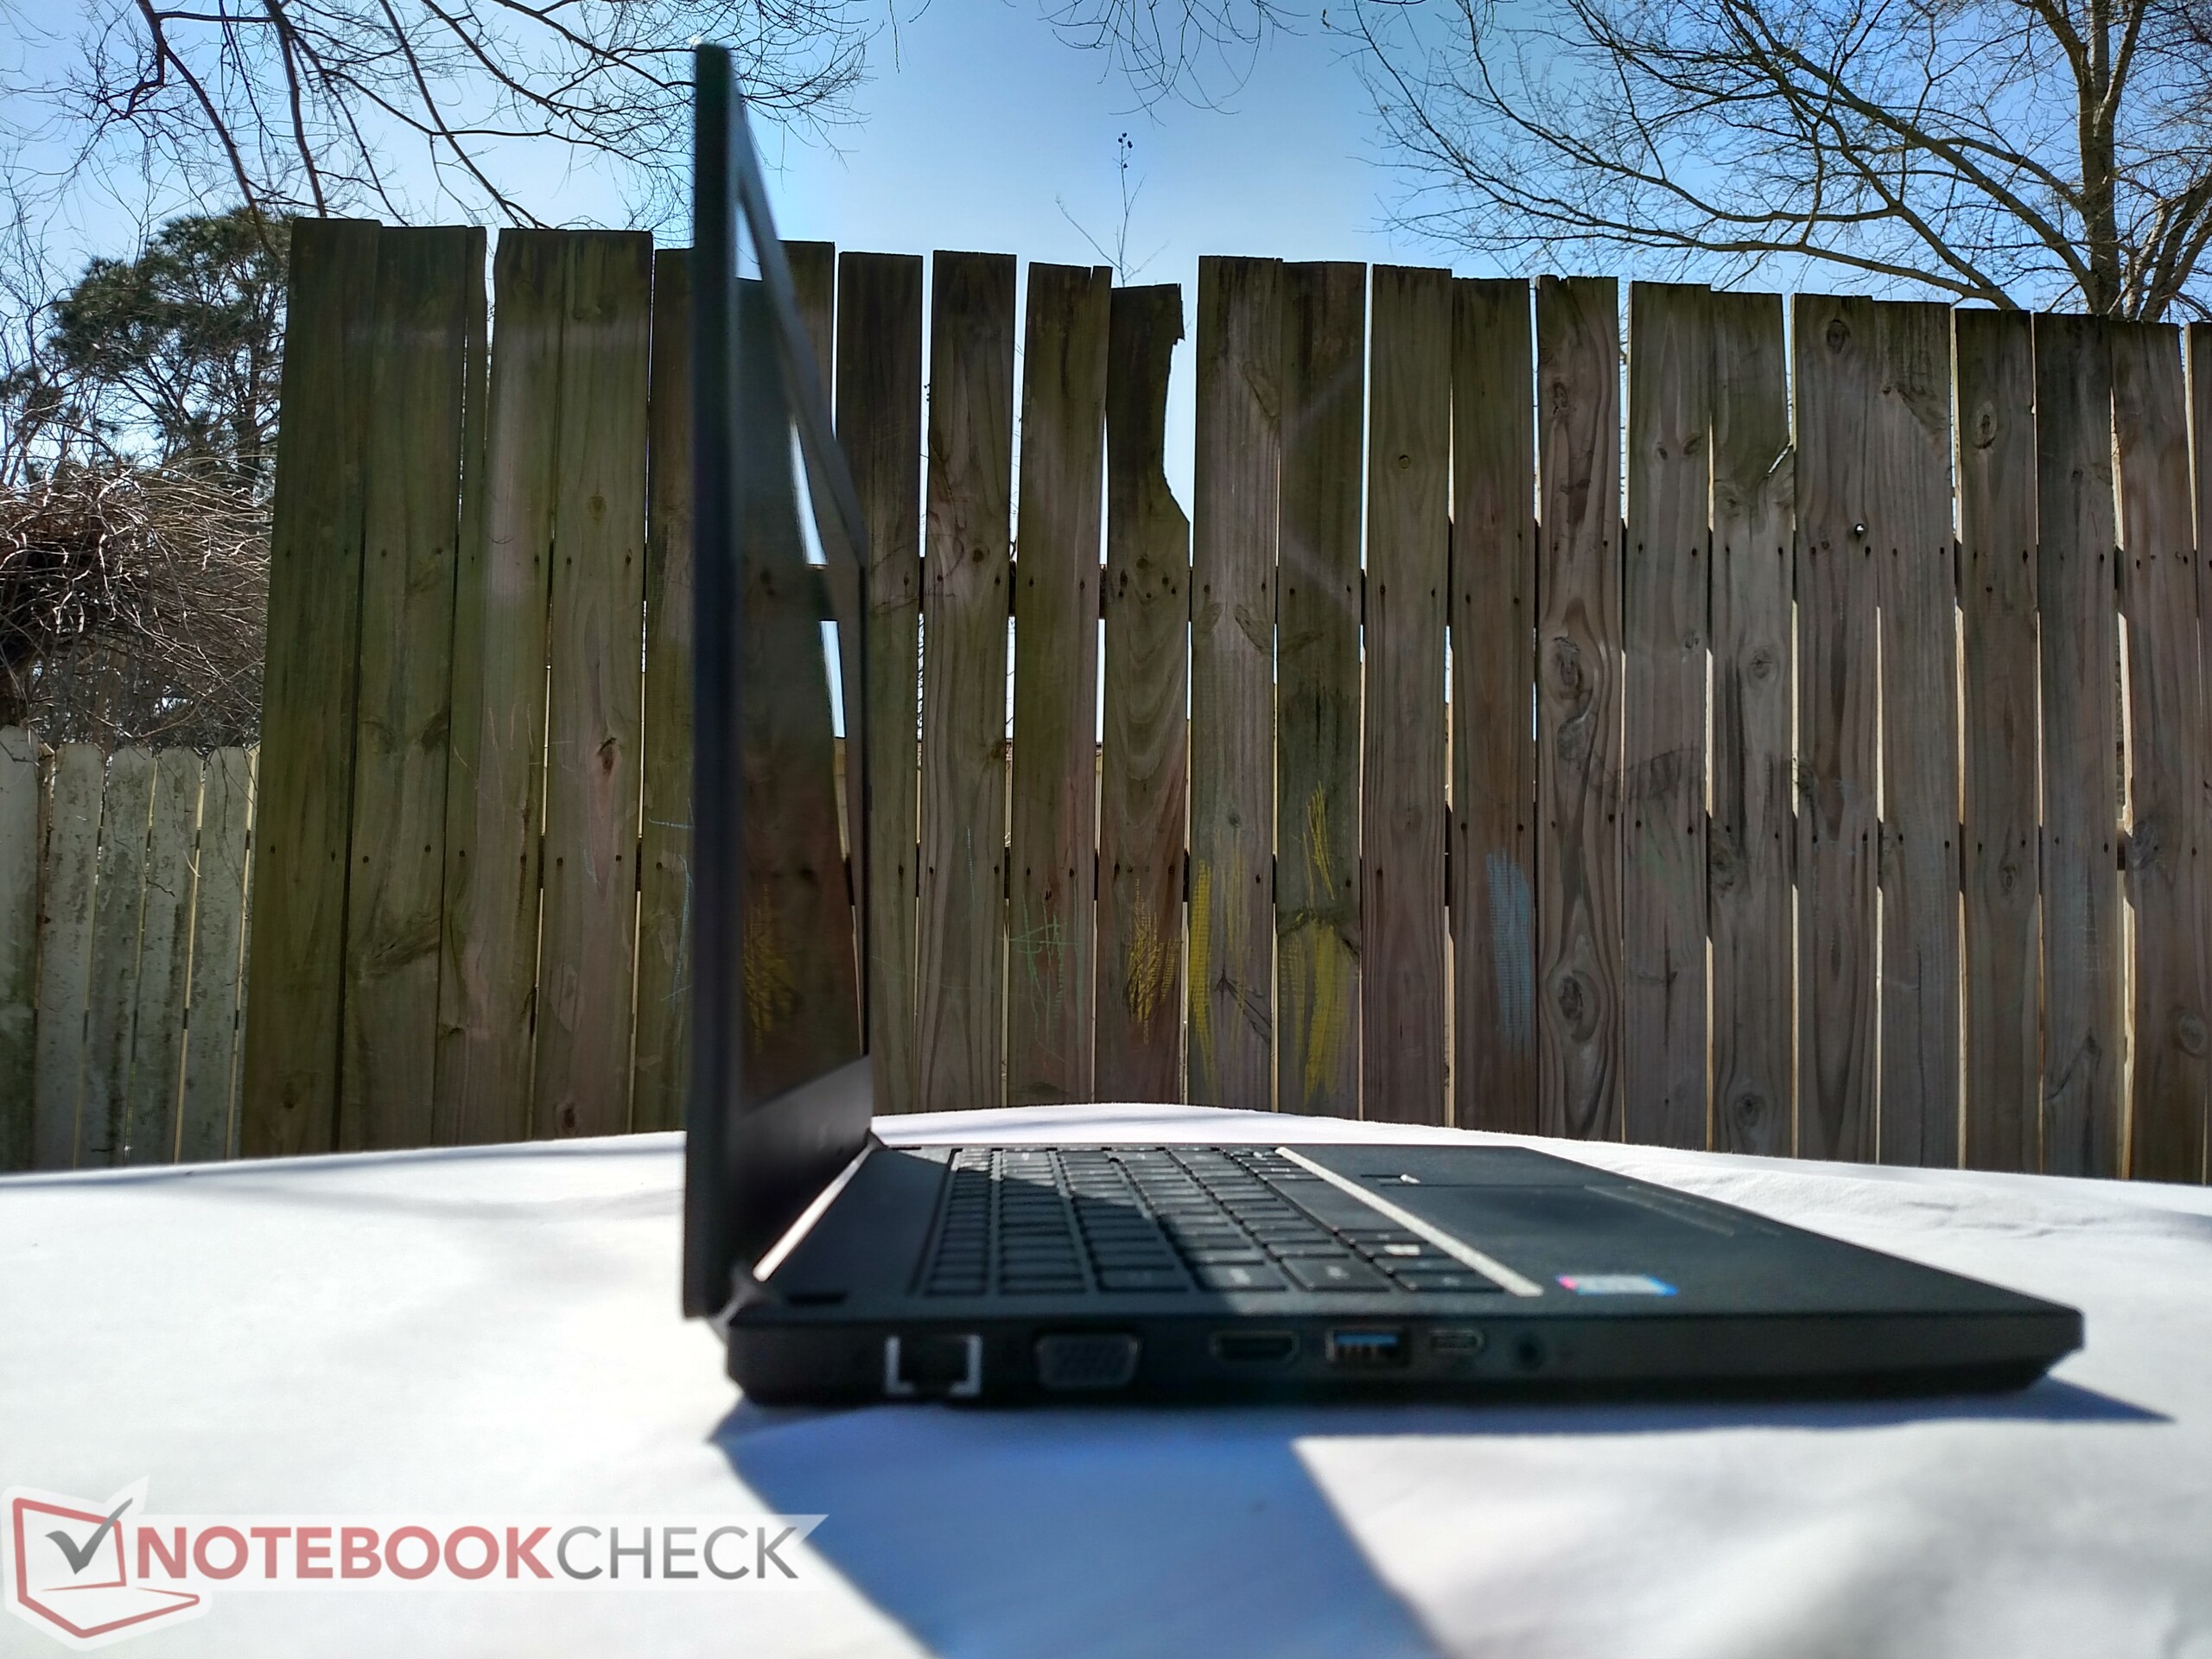
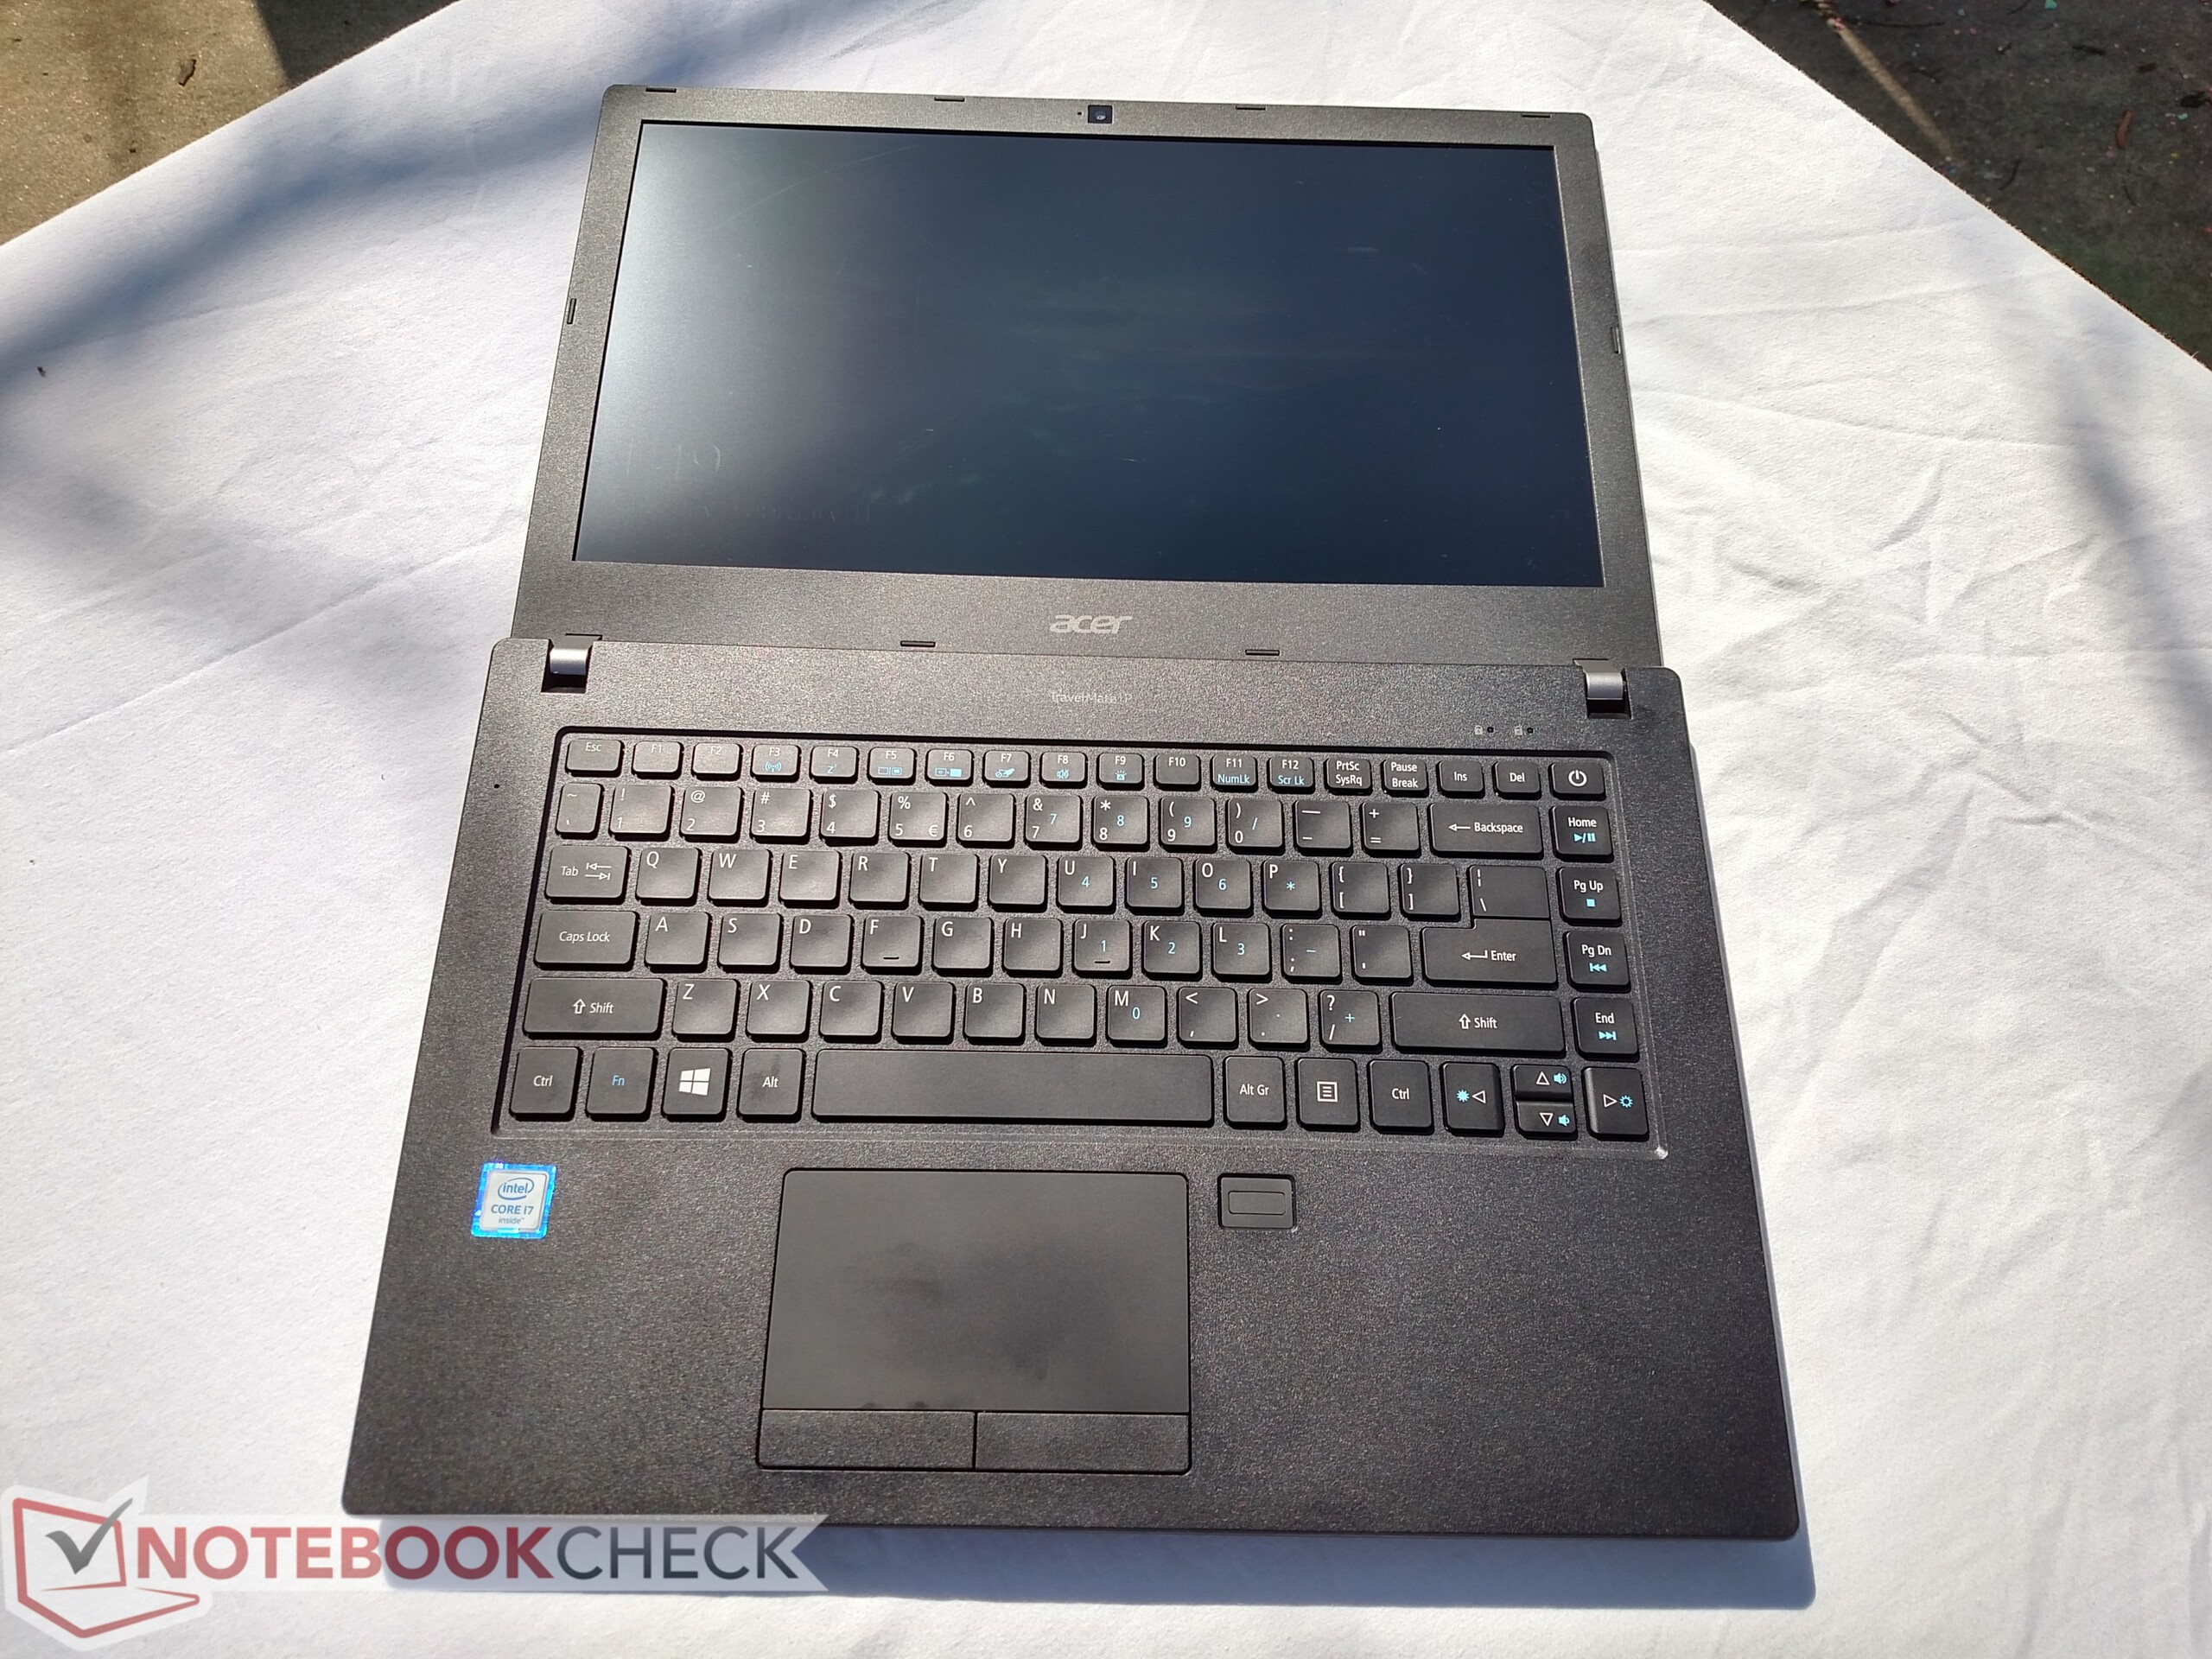
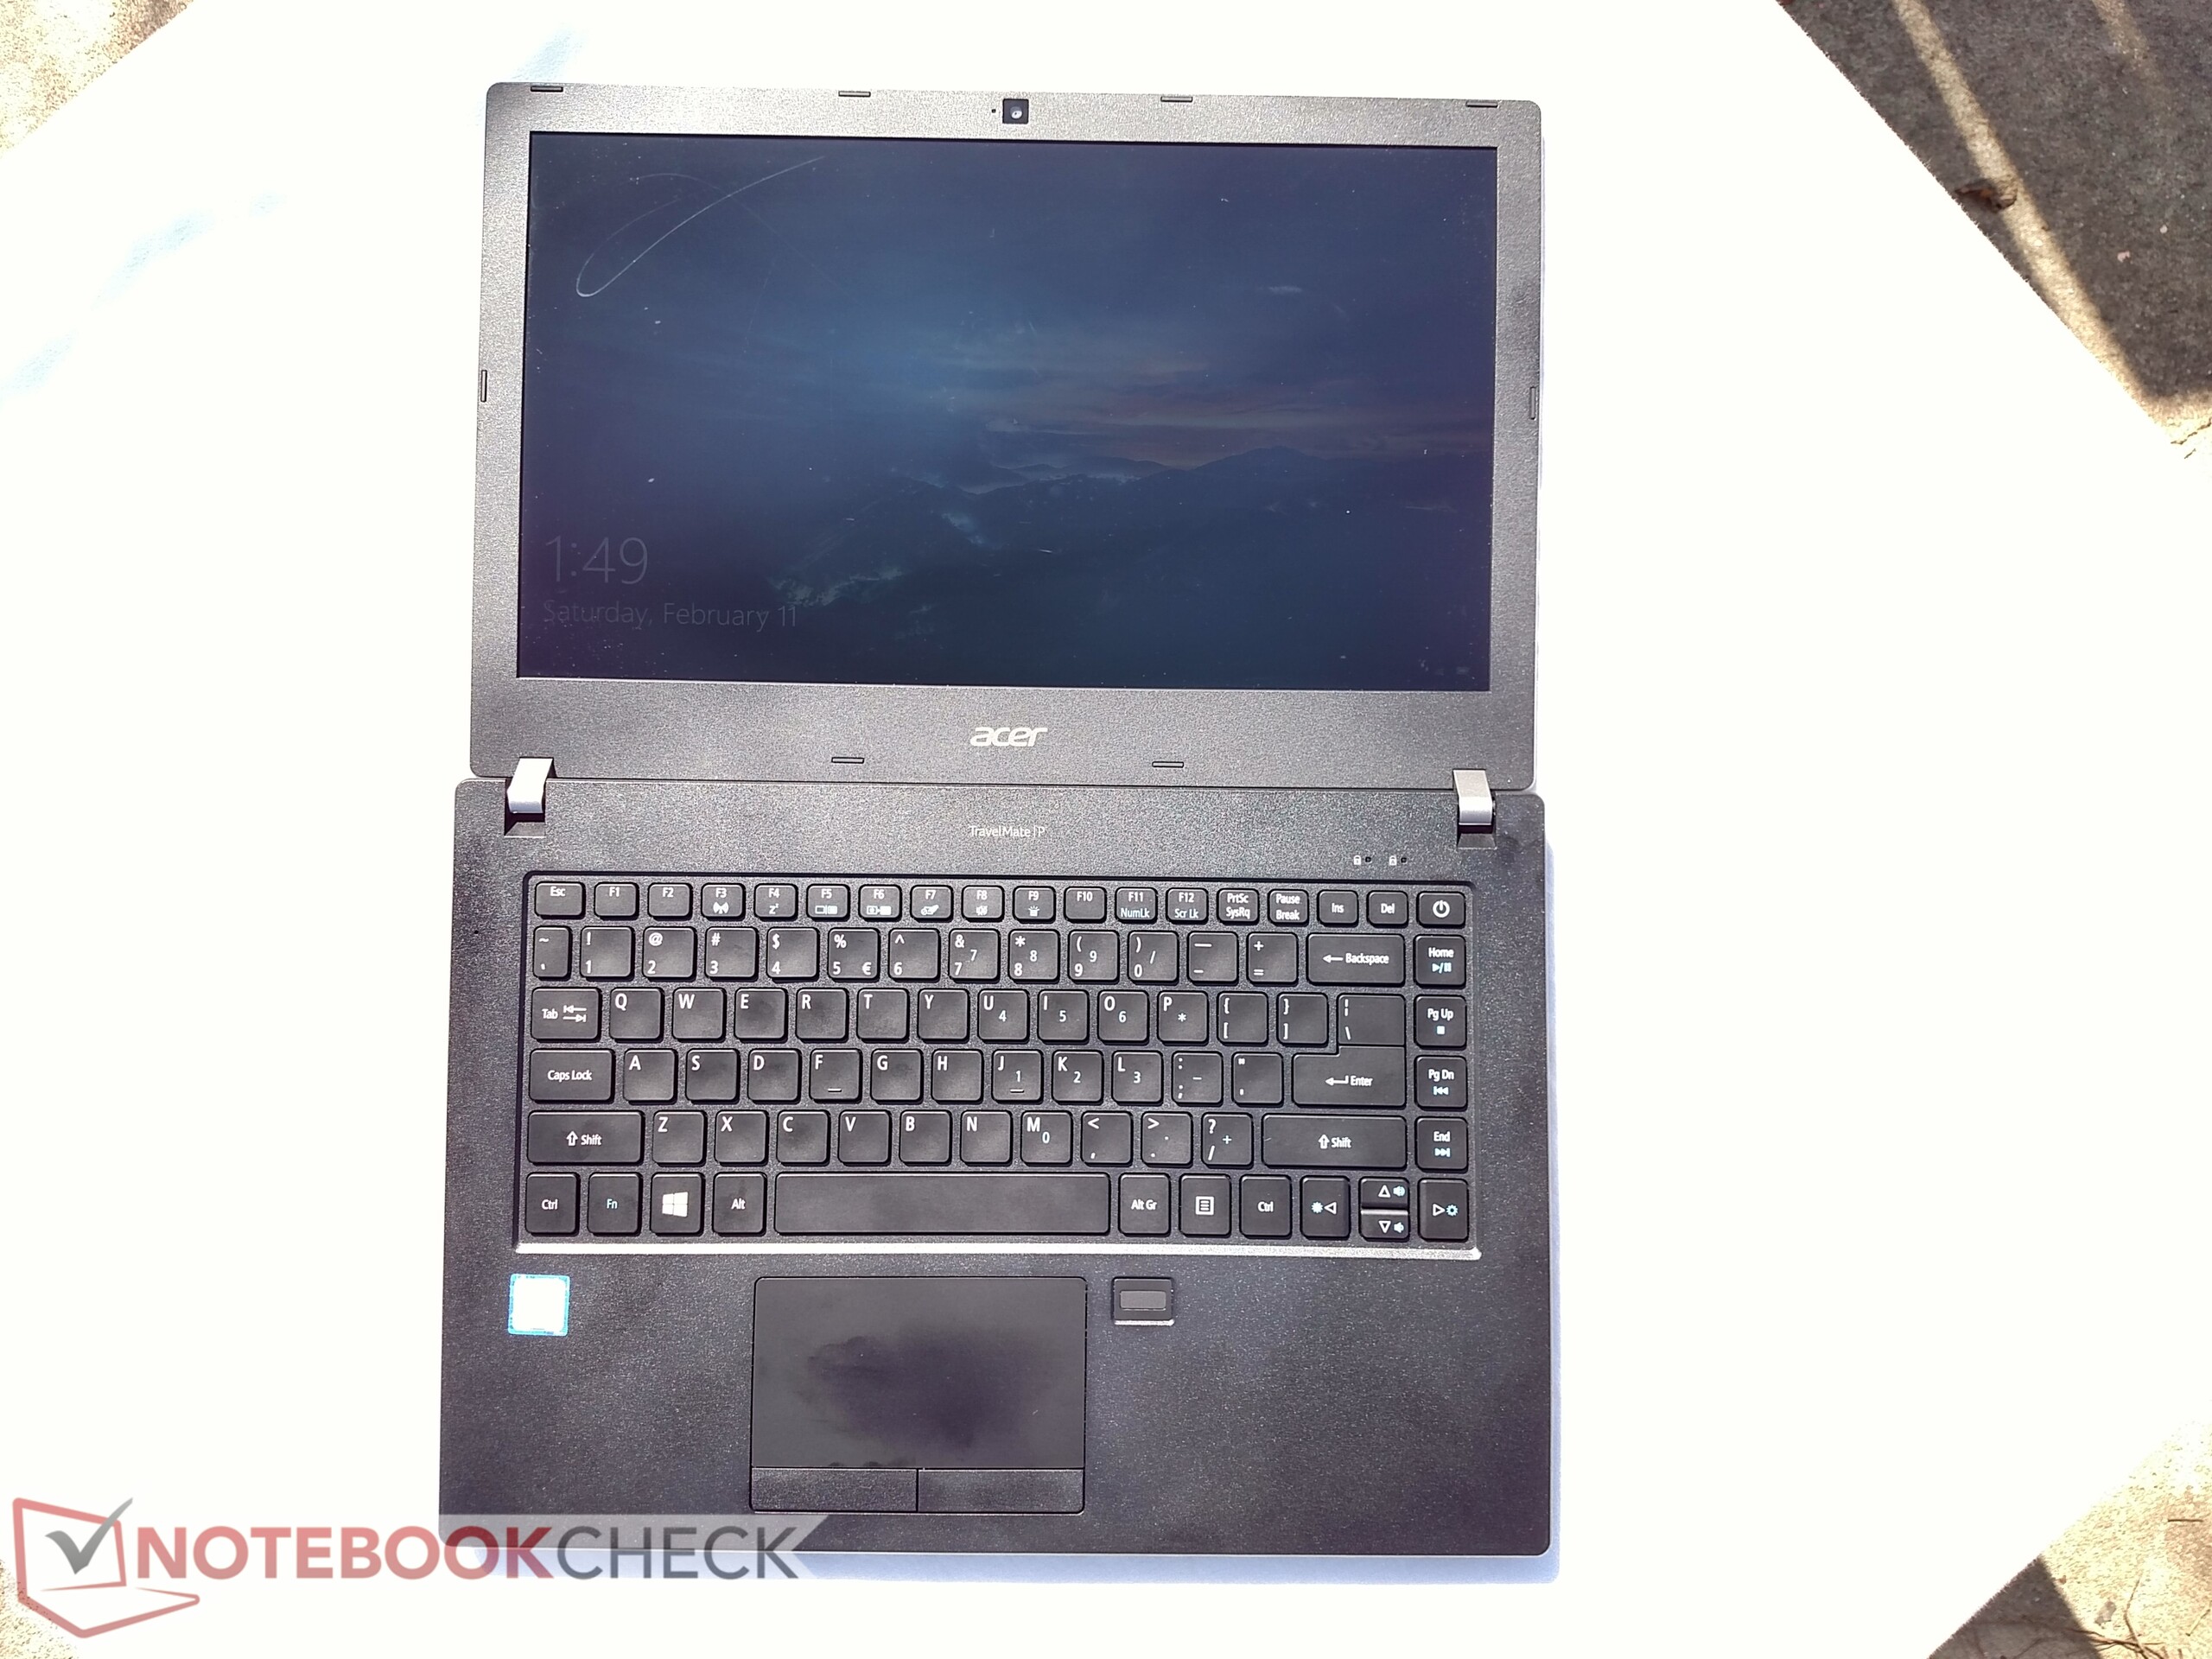
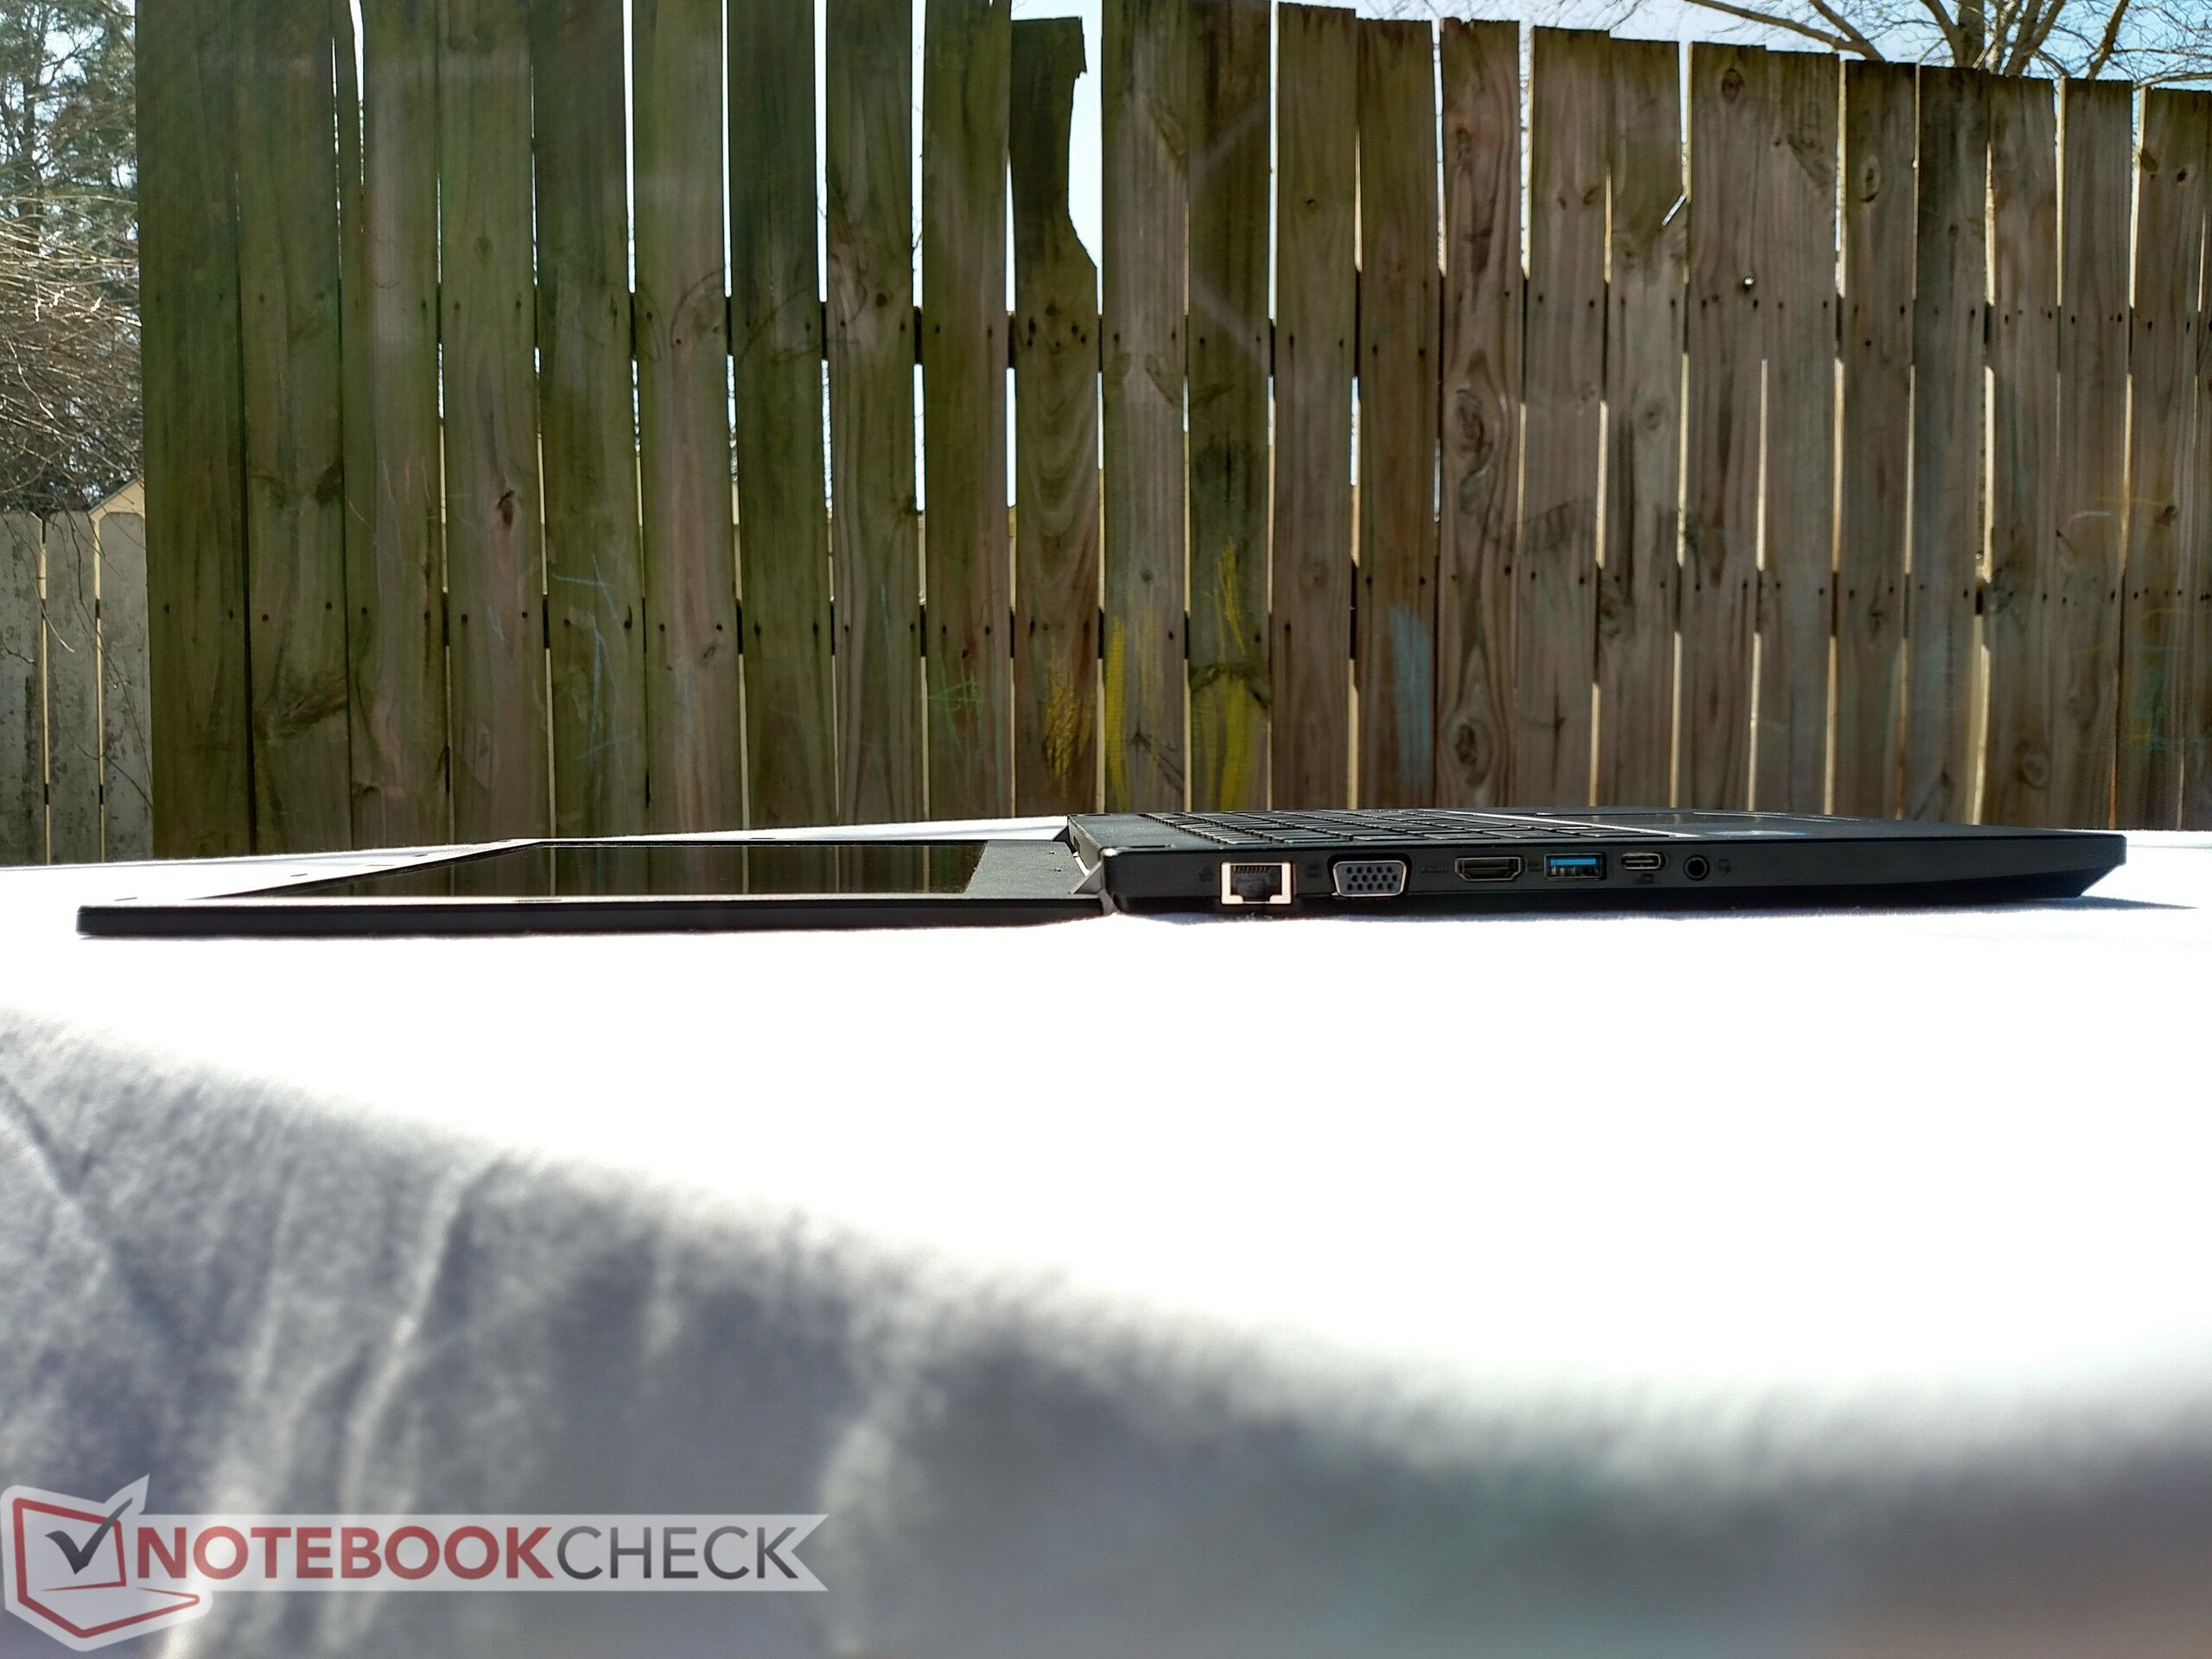
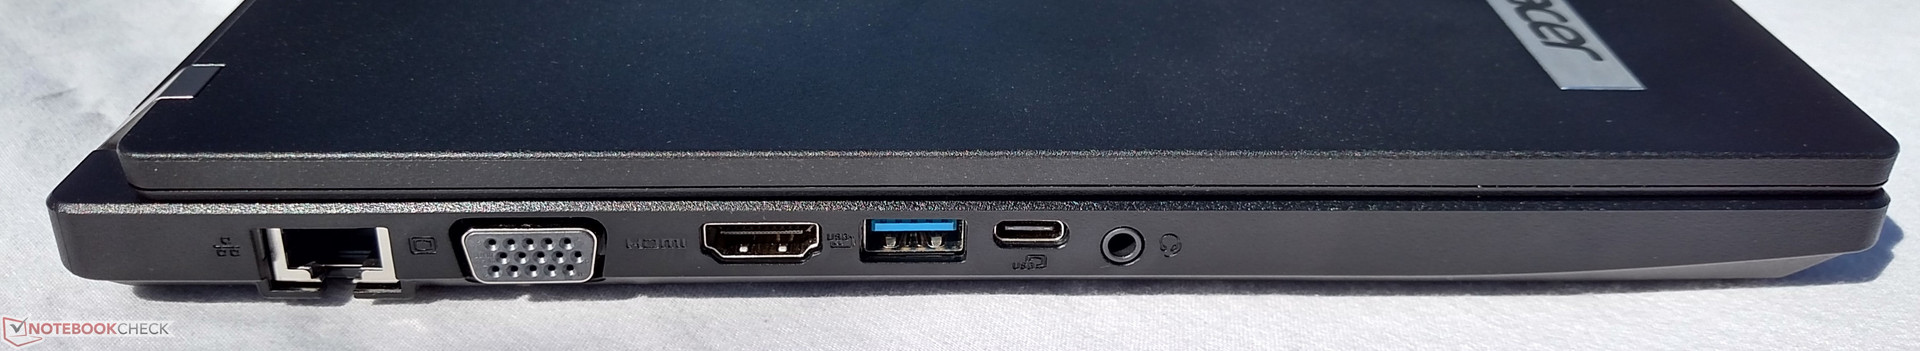
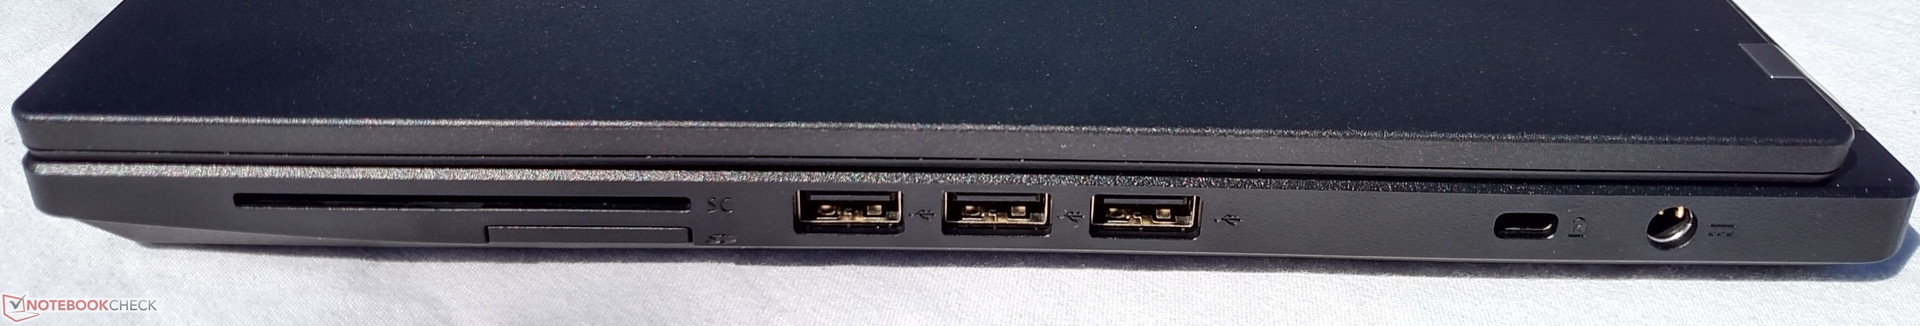
宏碁TravelMate P449是“无所不能,便一无所精”的。它是一个全面的设备,涉猎甚广。它大小适合,机身体积小,重量轻,便于携带,但是屏幕仍然足够大,可用于多任务办公。机身看起来有专业而有吸引力。键盘看起来很不错,和性能足够用。显示屏提供高对比度和艳丽色彩。风扇仅在极端负载下才会发出噪声。温度管理良好,即使在满负荷条件下,设备仍保持低温。端口众多,有5个USB端口,2个显示器选项端口和一个以太网端口,电池足以支撑一整天的工作。
对于那些需要便携且续航持久的机器的用户来说,宏碁TravelMate P449是一个很好的选择。尽管它有一些缺点,如果预算有限,这将是一个不错的选择。
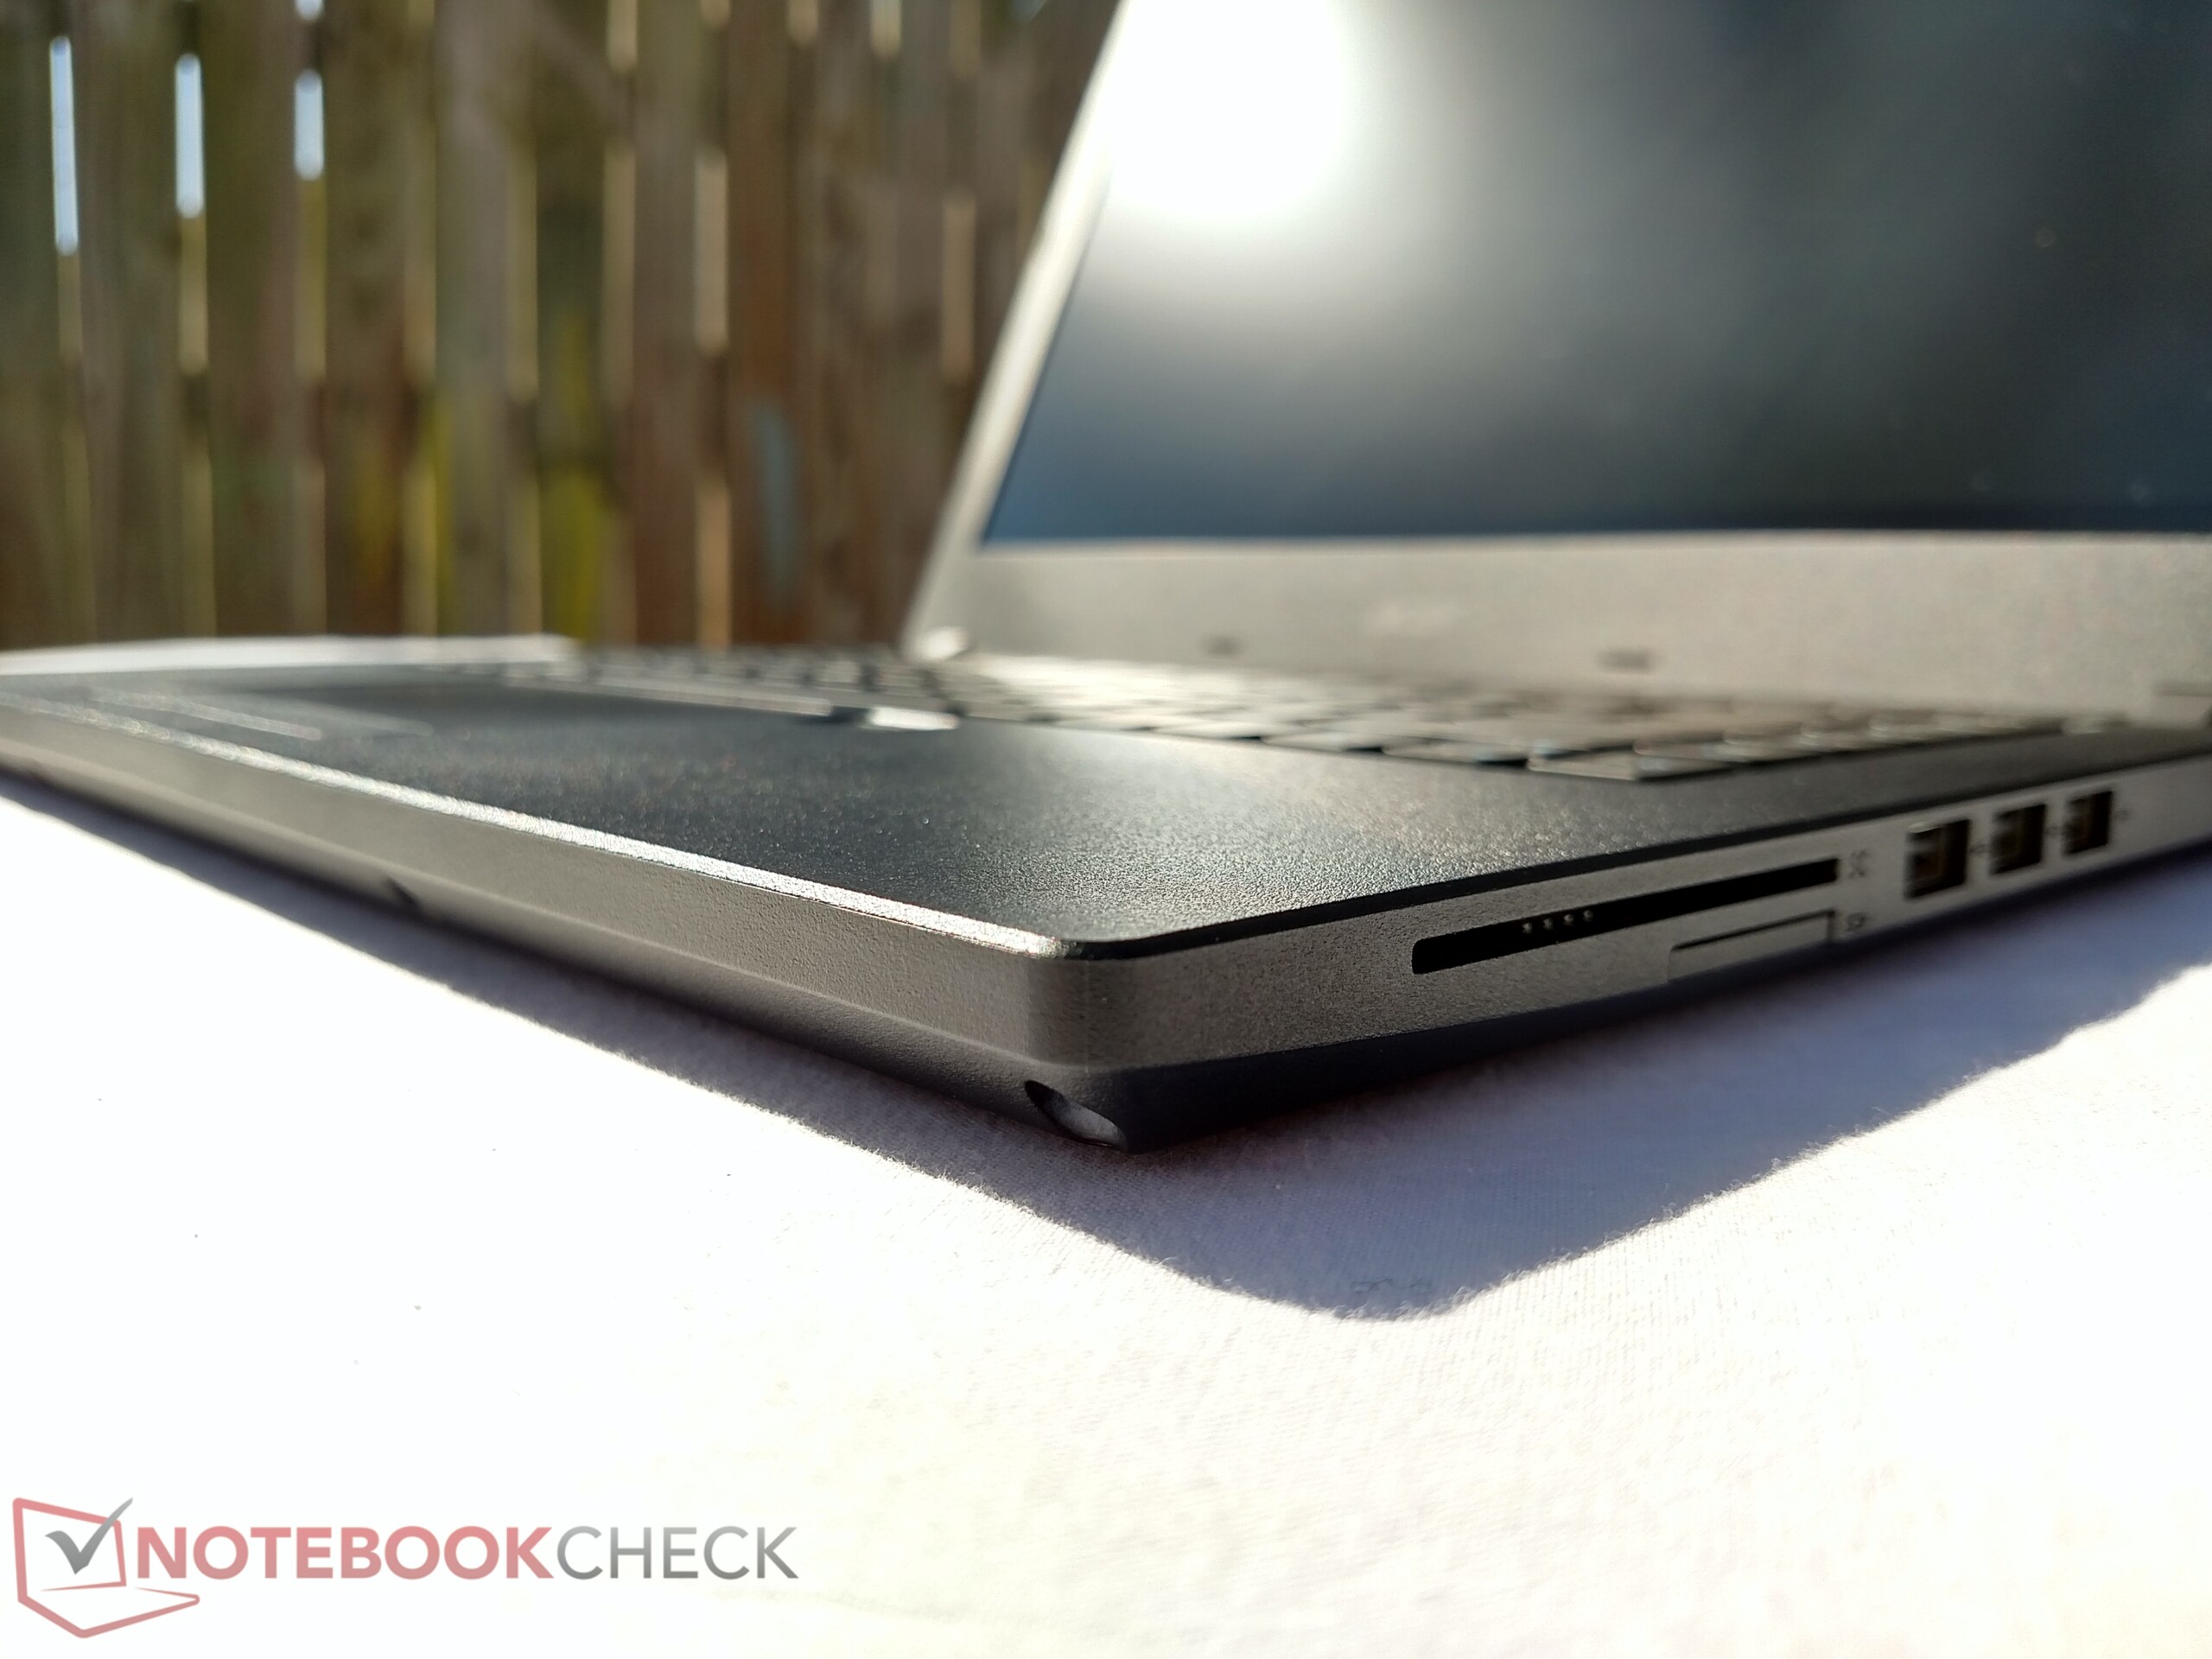
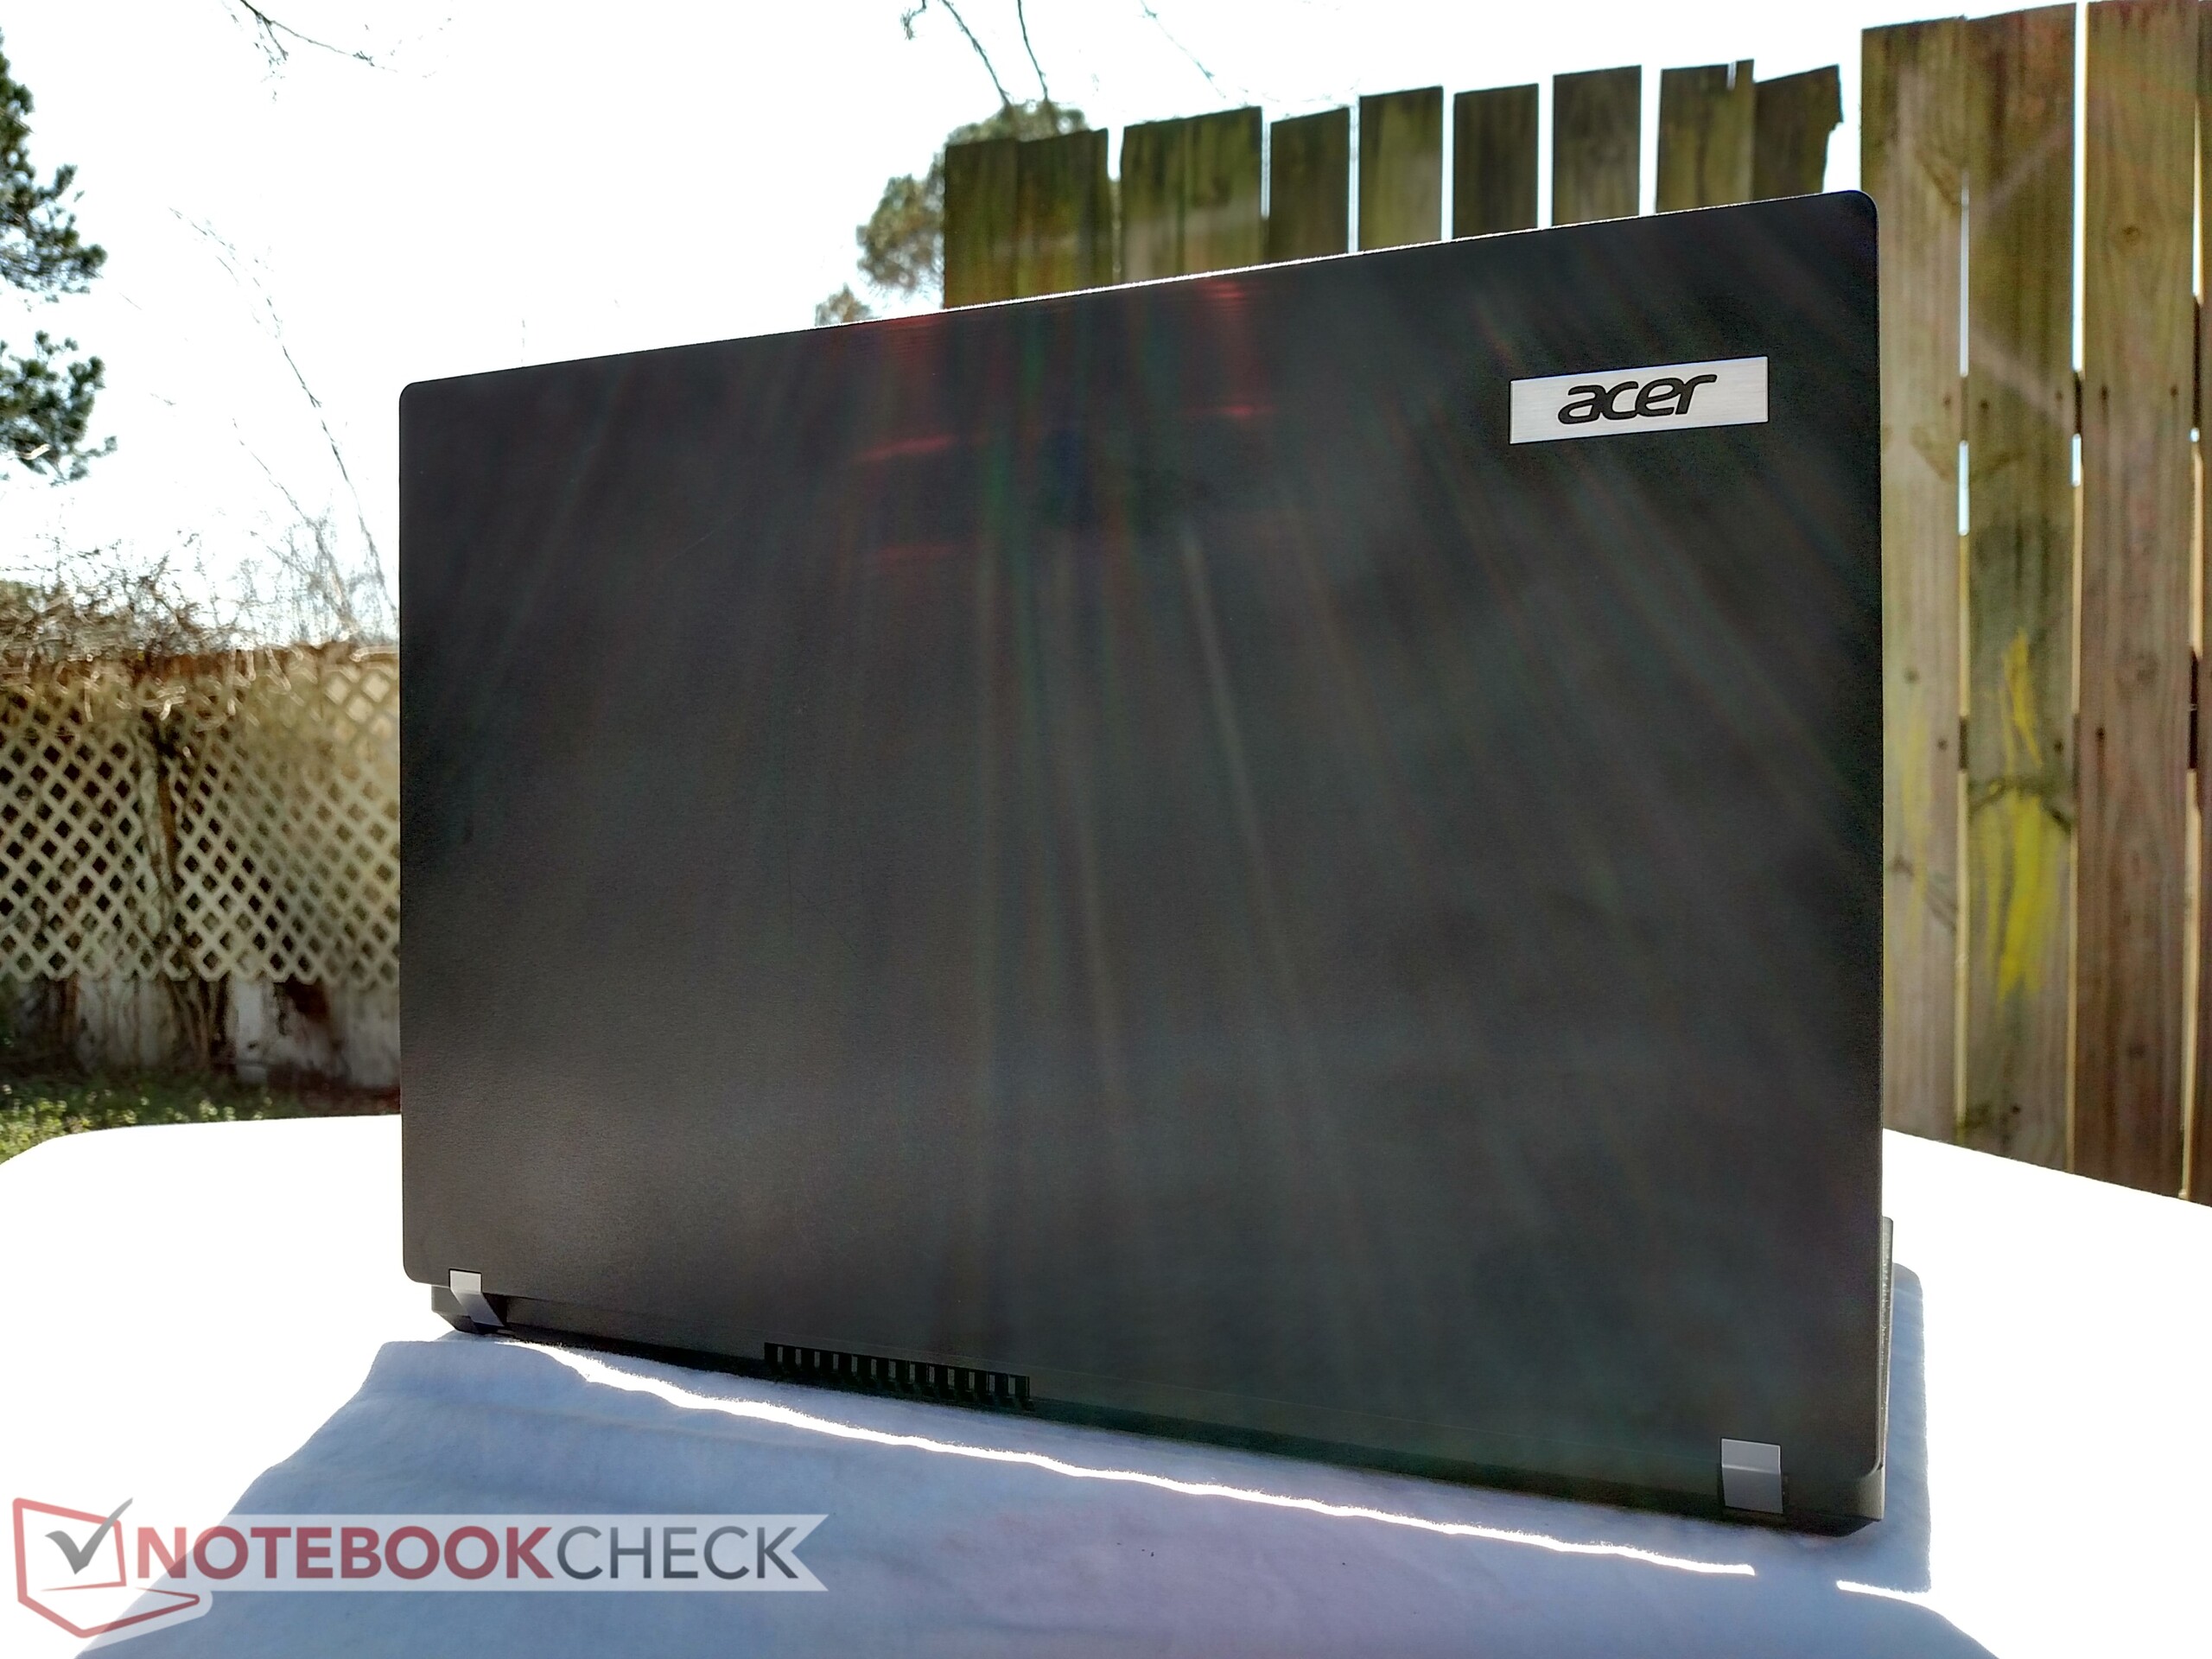
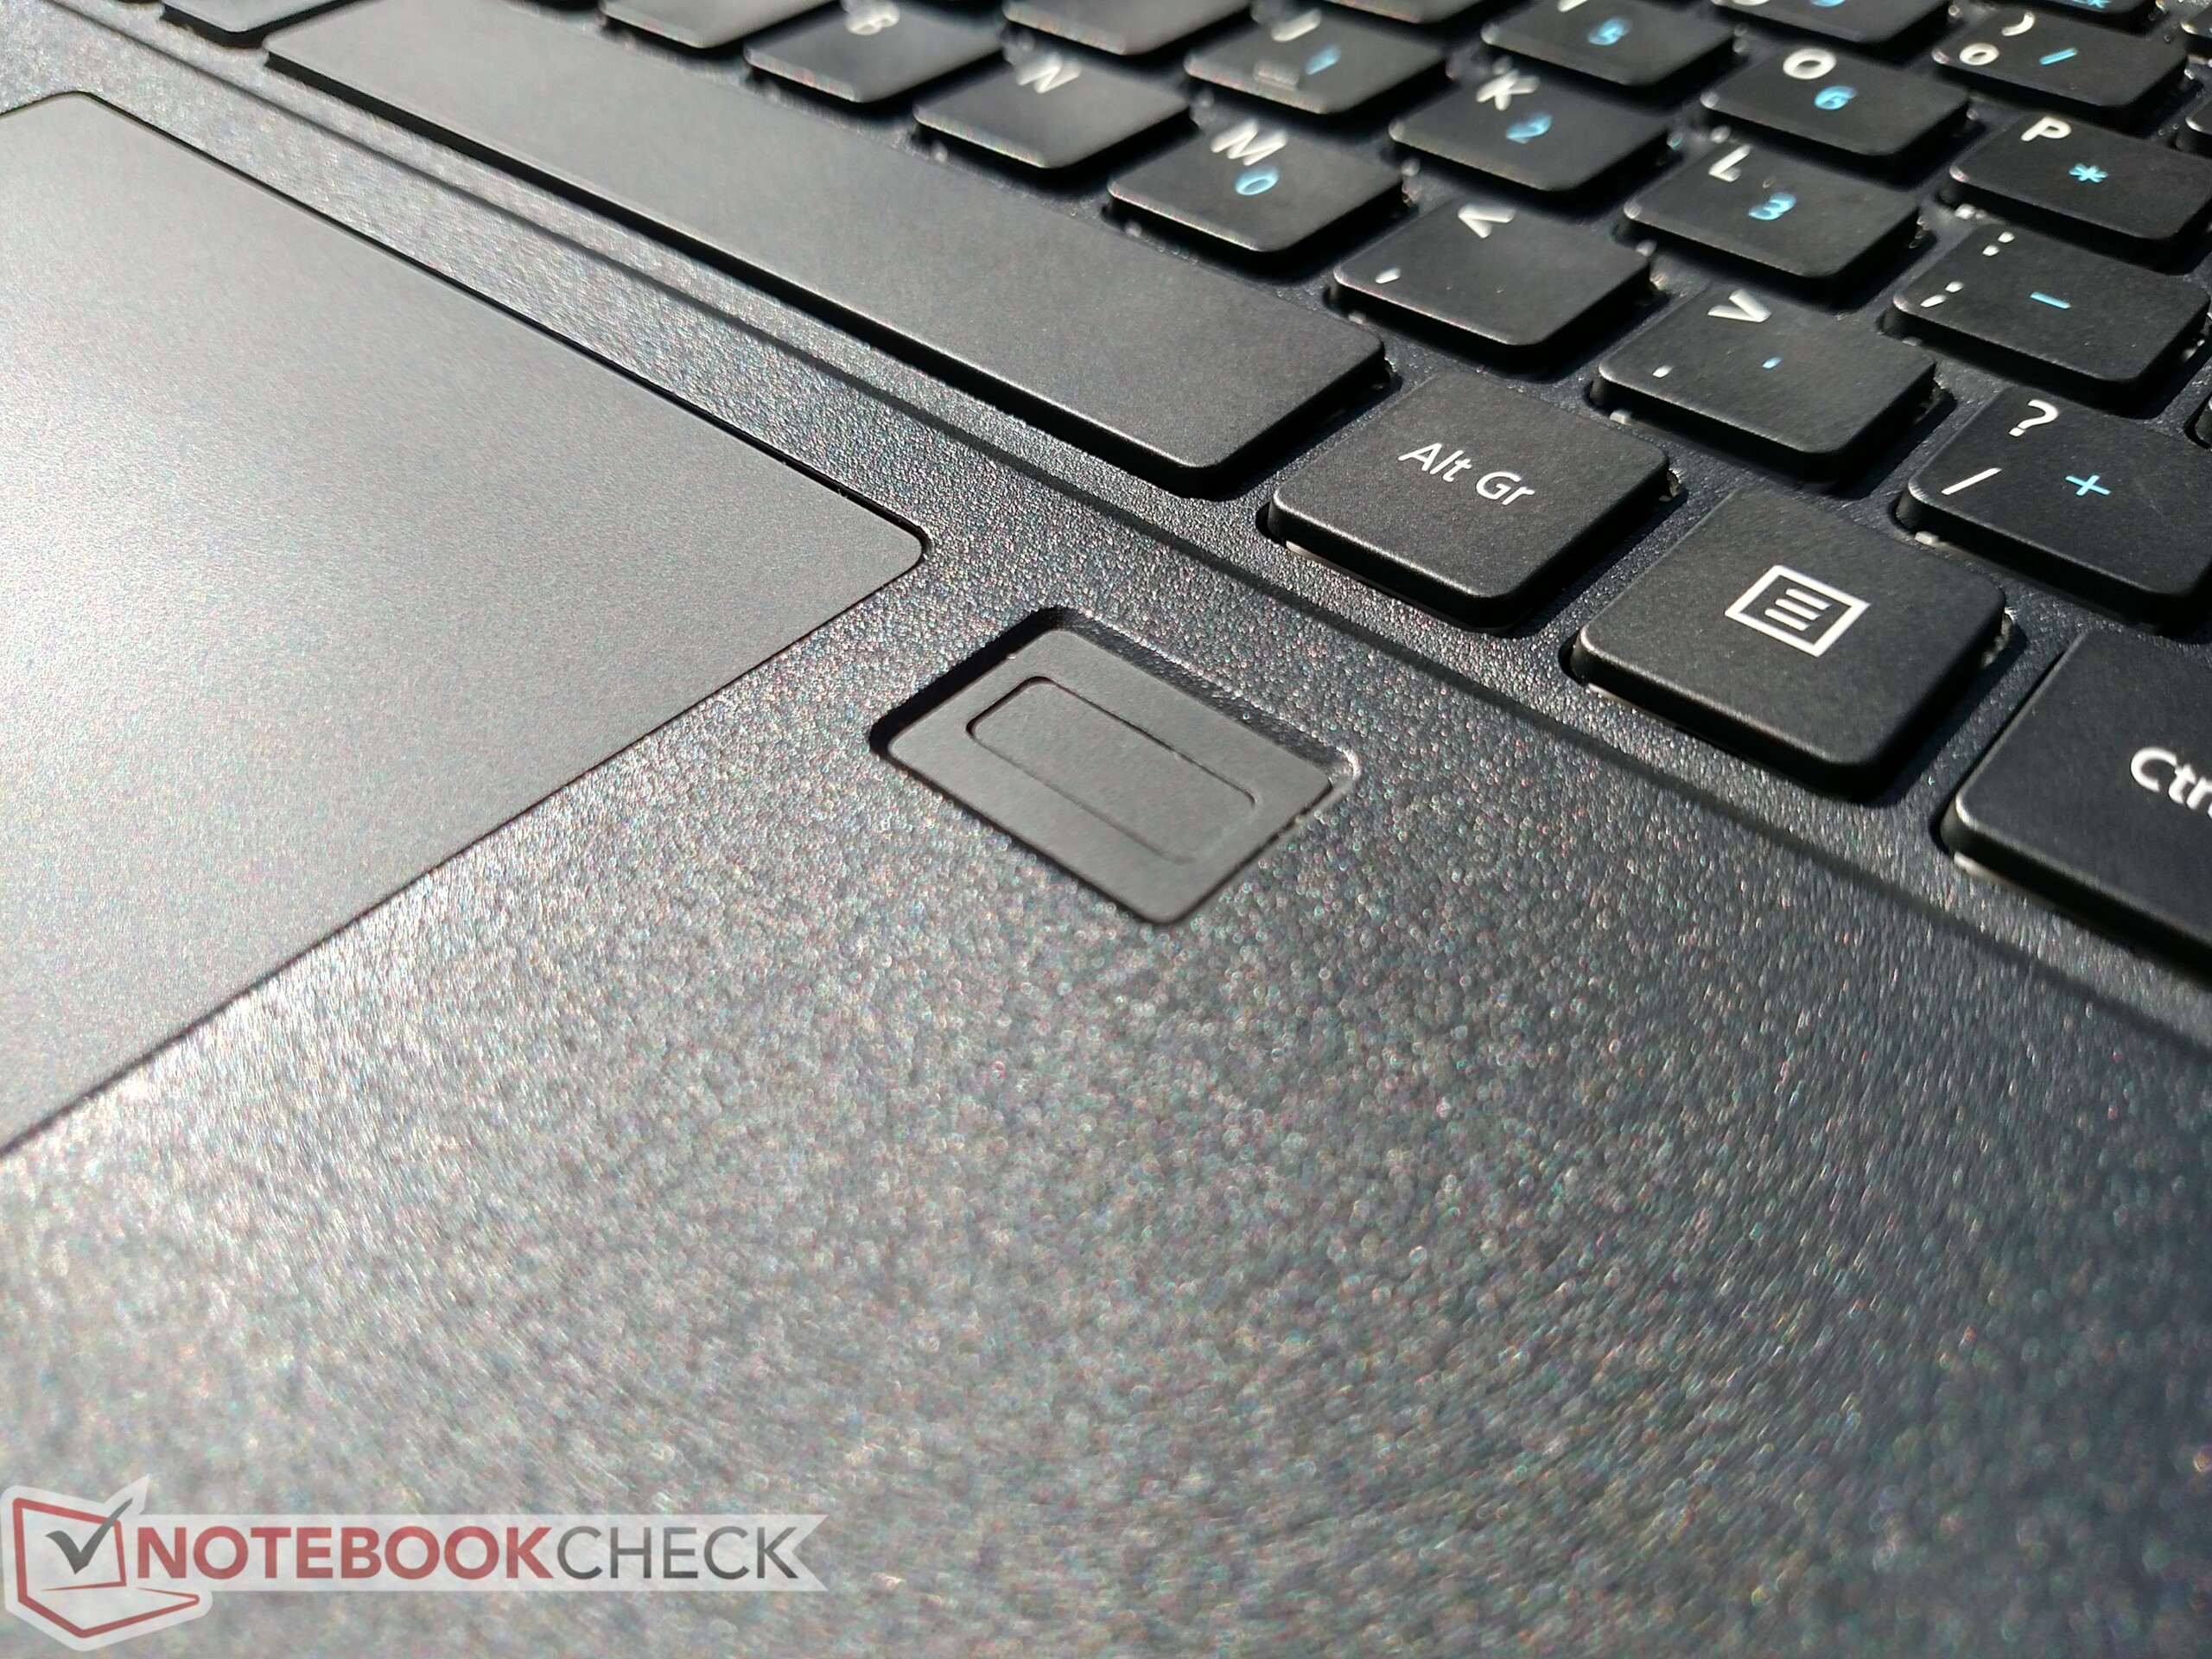
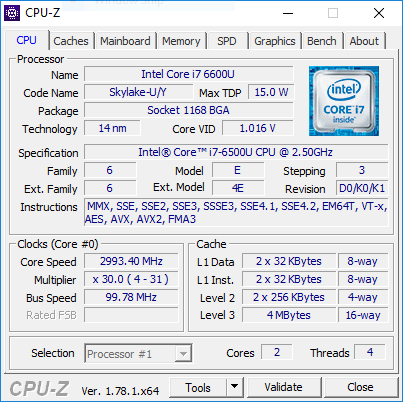
TravelMate做出了一些牺牲,以获得有竞争力的价格点。俊朗的外壳很薄,感觉很廉价,因此长期耐用性将是一个问题。触摸板不同步,而指纹读取器几乎没有用。屏幕昏暗,几乎不能在明亮的光线下使用。大多数连接端口都很慢或已经过时,而Skylake 处理器已过时,并且严重节流。
即便如此,宏碁TravelMate P449-M-7407仍然是1000美元以下商务本市场上的一个引人注目的选择。然而,联想 ThinkPad E470 的价格难以忽视。约720美元,E470提供更好的性能和质量,类似的续航时间,一个良好的IPS屏幕和一个独立显卡。对于130美元以上的价位,ThinkPad可以配备Kaby Lake 酷睿i7-7500U的处理器和16 GB的内存。请记住,这些机型不附带操作系统,只能在教育市场上获取。对比TravelMate,ThinkPad E470更值得推荐。但是,如果E470无法获取,P449是一个不错的备选方案。
注:本文是基于完整评测的缩减版本,阅读完整的英文评测,请点击这里。
Acer TravelMate P449-M-7407
- 01/16/2024 v7 (old)
Sam Medley
Price comparison
