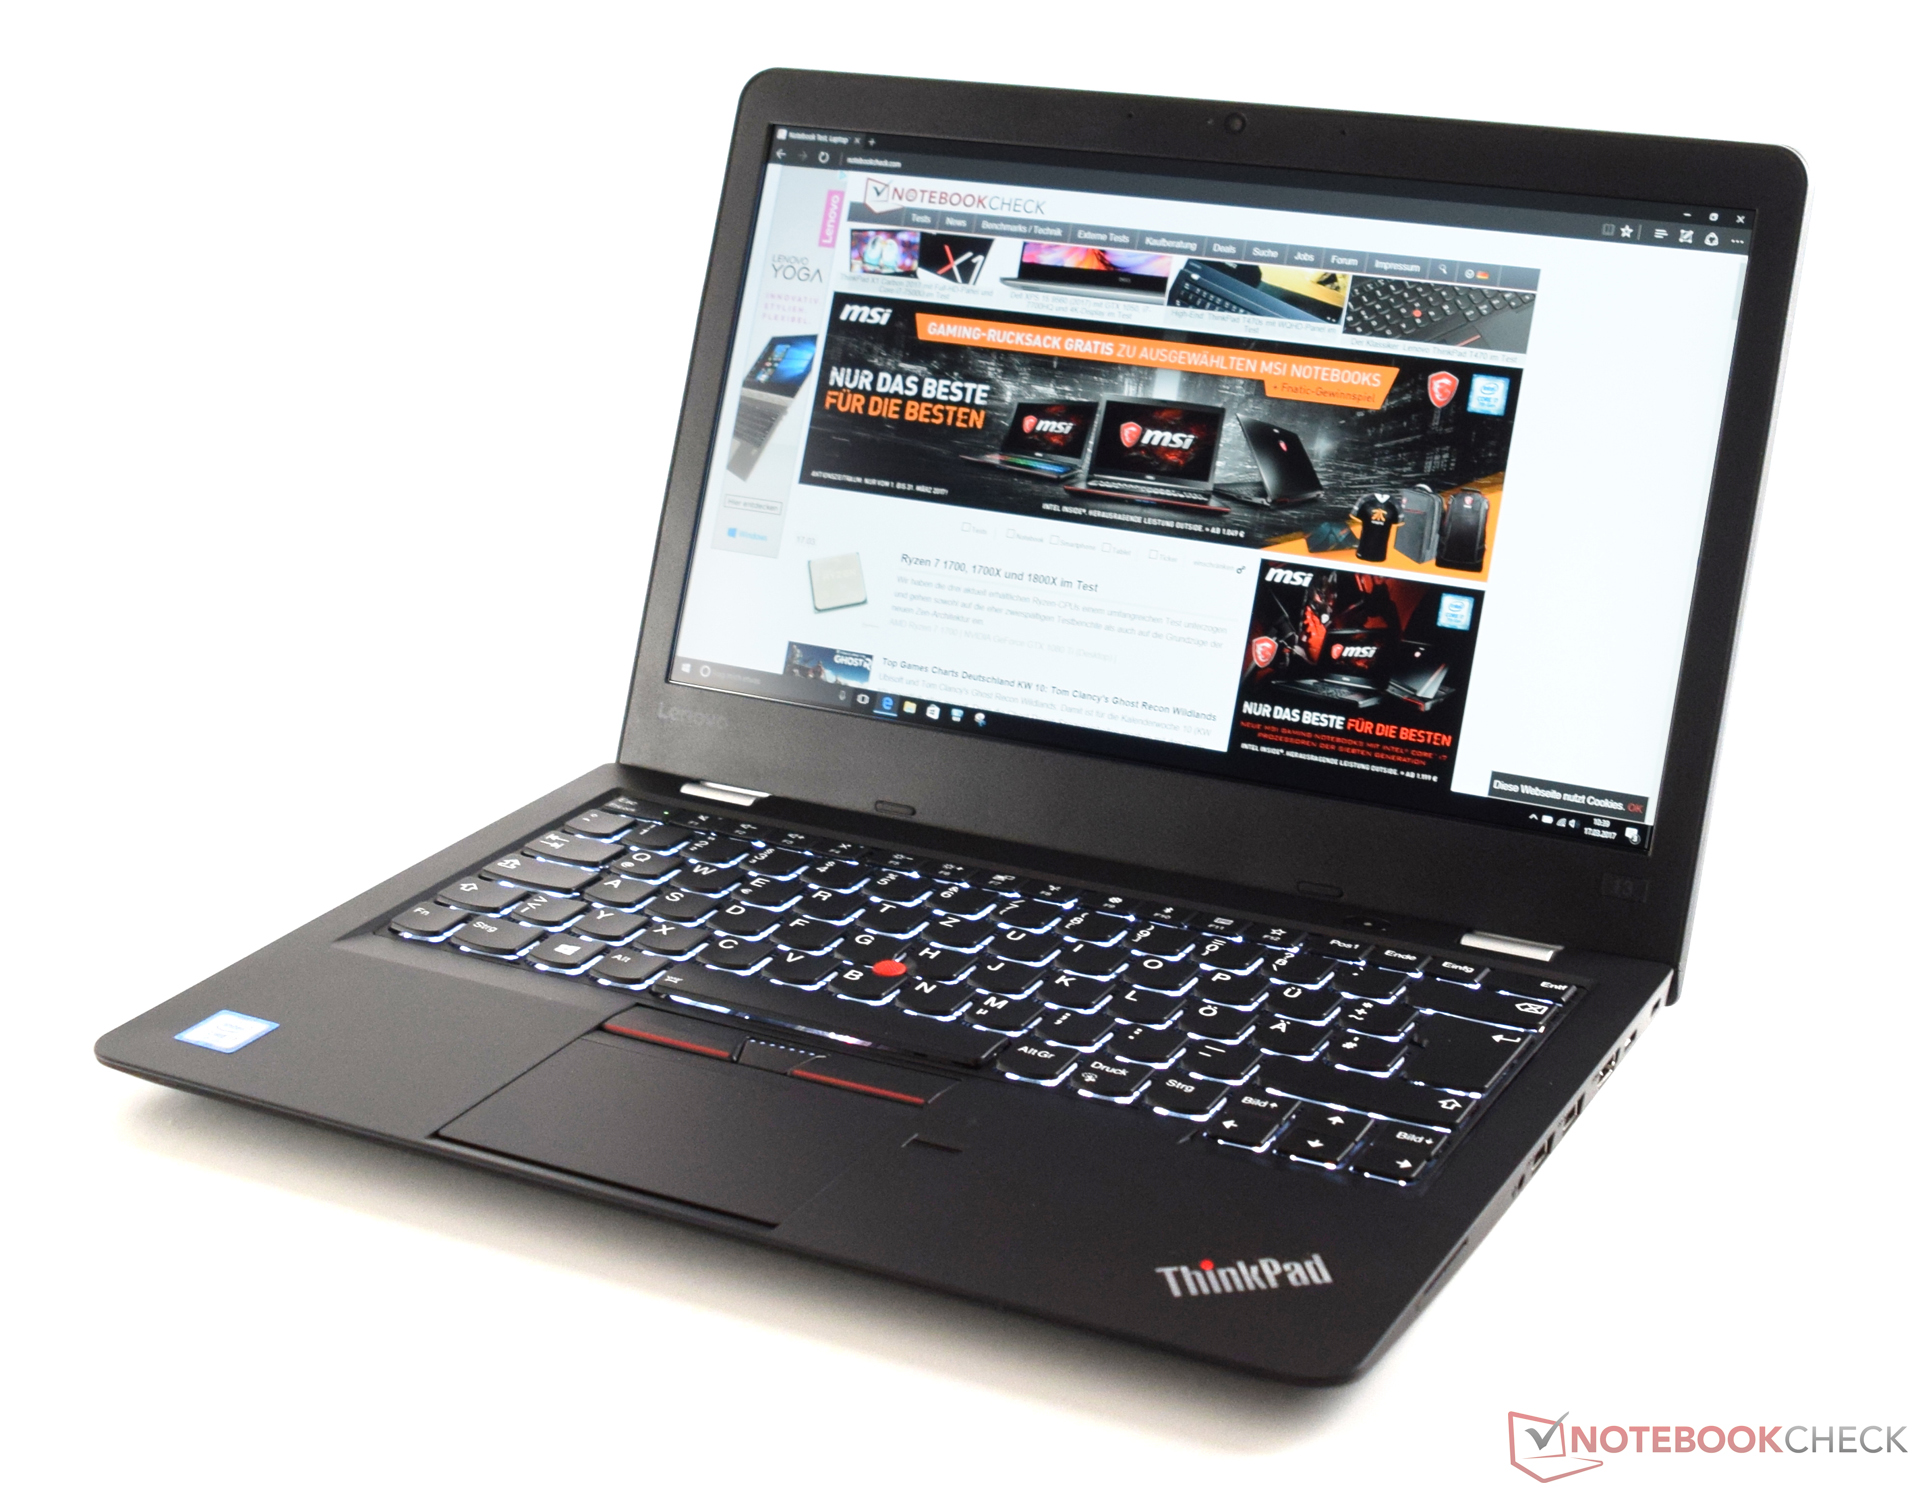
联想 ThinkPad 13 2017 (酷睿 i7, 全高清) 笔记本电脑简短评测
| SD Card Reader | |
| average JPG Copy Test (av. of 3 runs) | |
| Dell XPS 13 9360 FHD i5 | |
| HP ProBook 430 G4-Y8B47EA | |
| Asus Zenbook UX310UA-FC347T iGP | |
| Lenovo ThinkPad 13-20GKS01100 | |
| Lenovo ThinkPad 13-20J2S00G00 | |
| maximum AS SSD Seq Read Test (1GB) | |
| Dell XPS 13 9360 FHD i5 | |
| HP ProBook 430 G4-Y8B47EA | |
| Asus Zenbook UX310UA-FC347T iGP | |
| Lenovo ThinkPad 13-20GKS01100 | |
| Lenovo ThinkPad 13-20J2S00G00 | |
| Networking | |
| iperf3 transmit AX12 | |
| Asus Zenbook UX310UA-FC347T iGP (jseb) | |
| Dell XPS 13 9360 FHD i5 | |
| Lenovo ThinkPad 13-20J2S00G00 | |
| iperf3 receive AX12 | |
| Lenovo ThinkPad 13-20J2S00G00 | |
| Dell XPS 13 9360 FHD i5 | |
| Asus Zenbook UX310UA-FC347T iGP (jseb) | |
| |||||||||||||||||||||||||
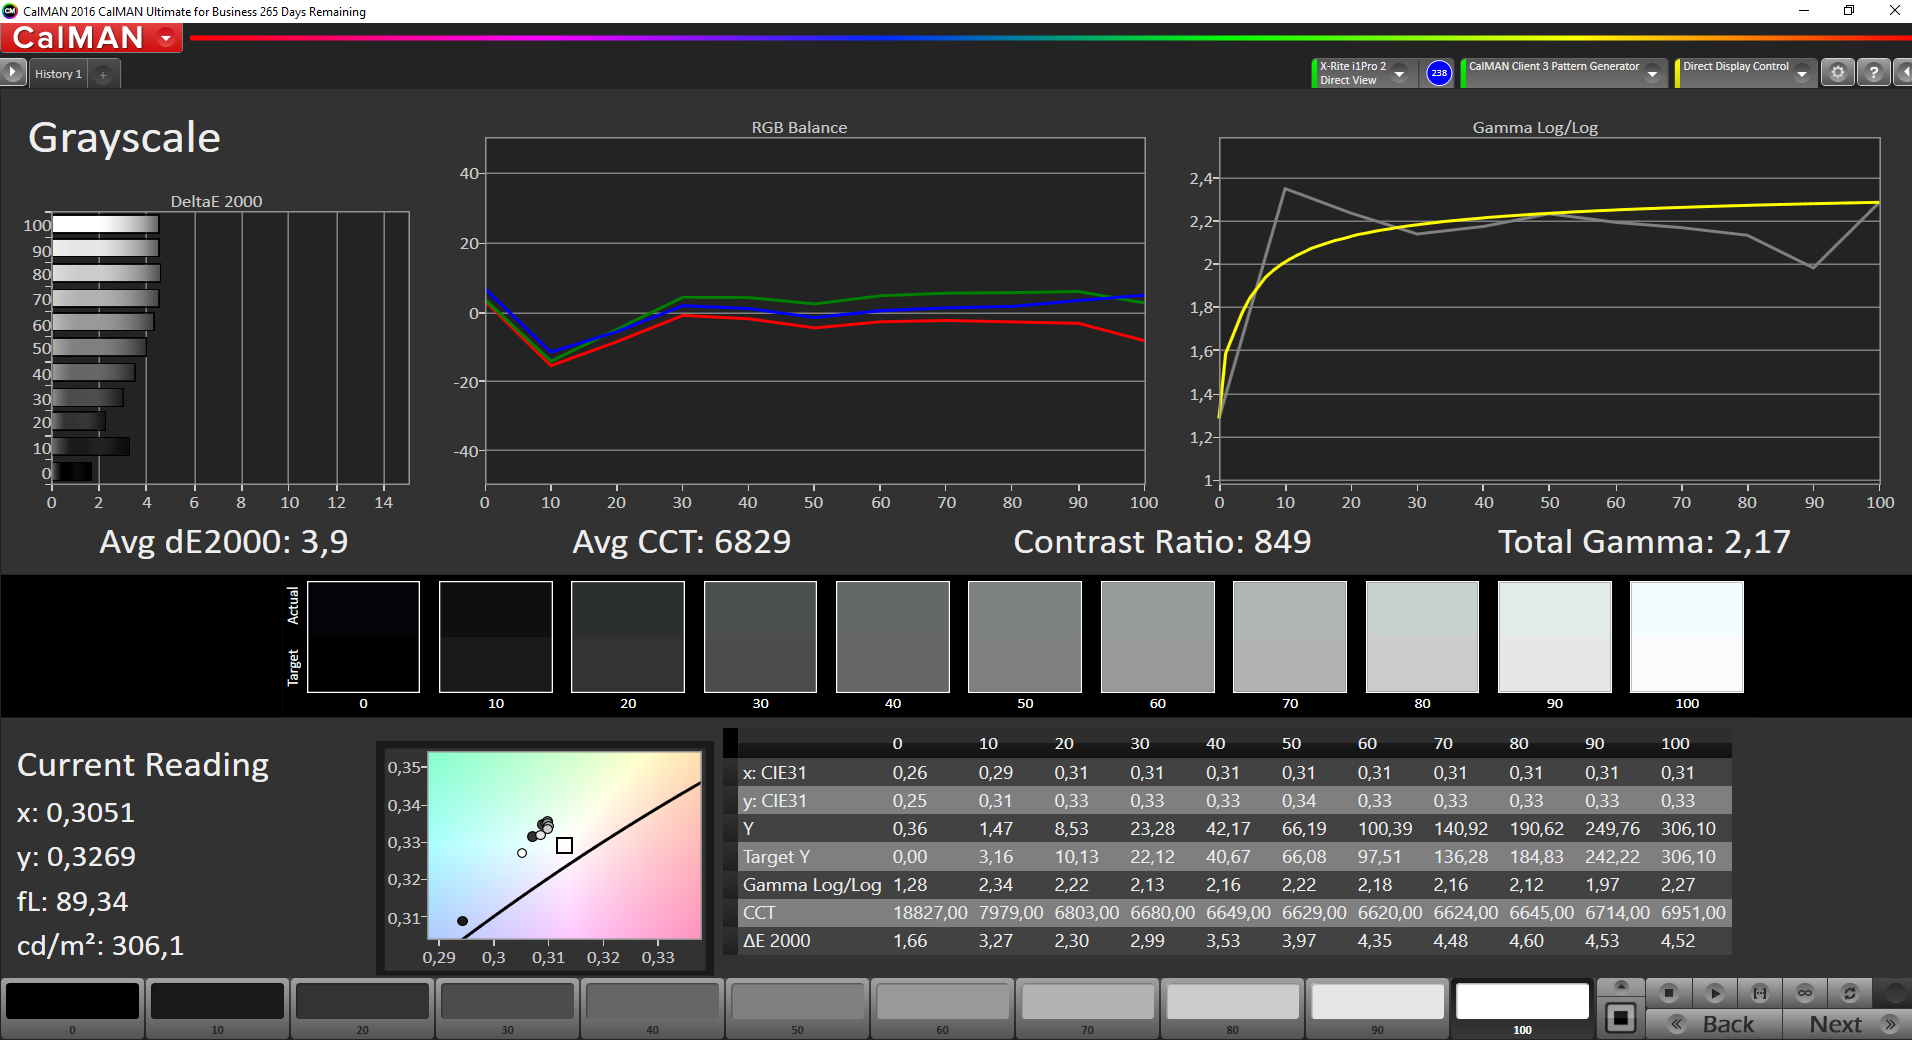
Brightness Distribution: 89 %
Center on Battery: 306 cd/m²
Contrast: 850:1 (Black: 0.36 cd/m²)
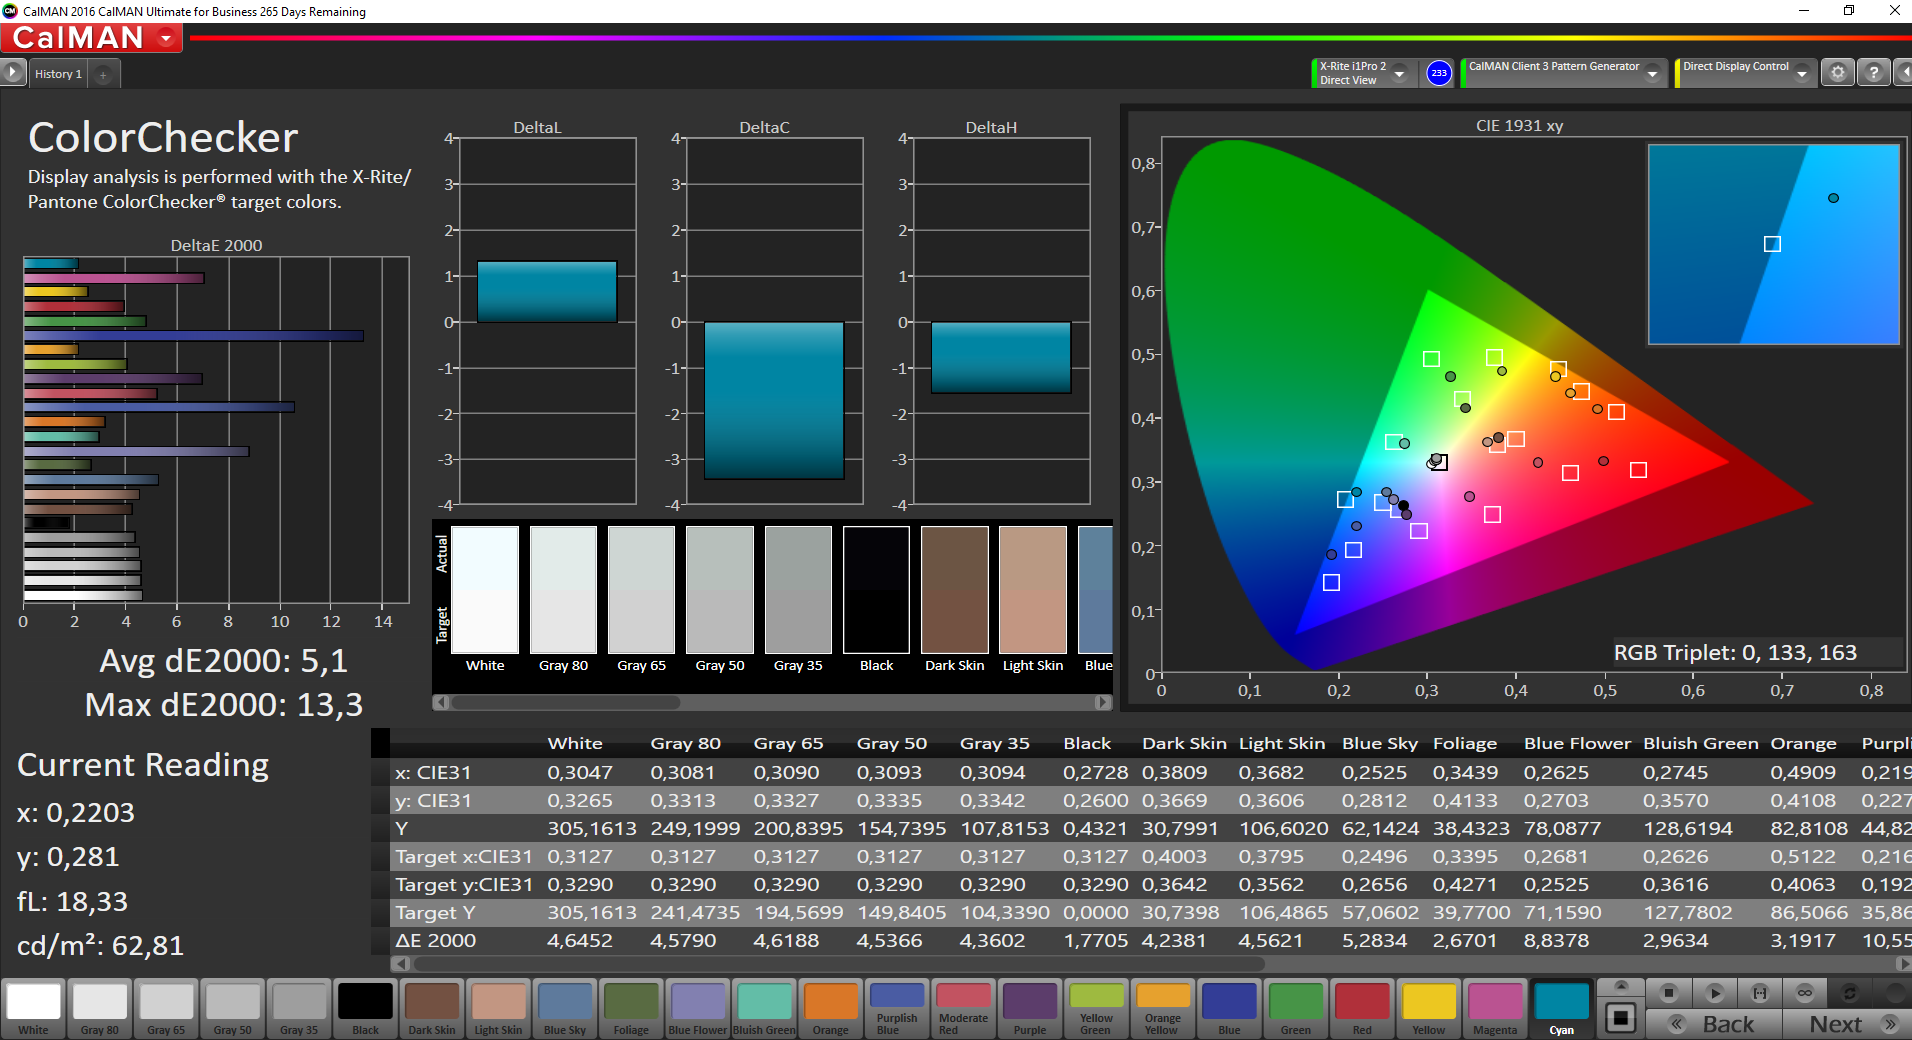
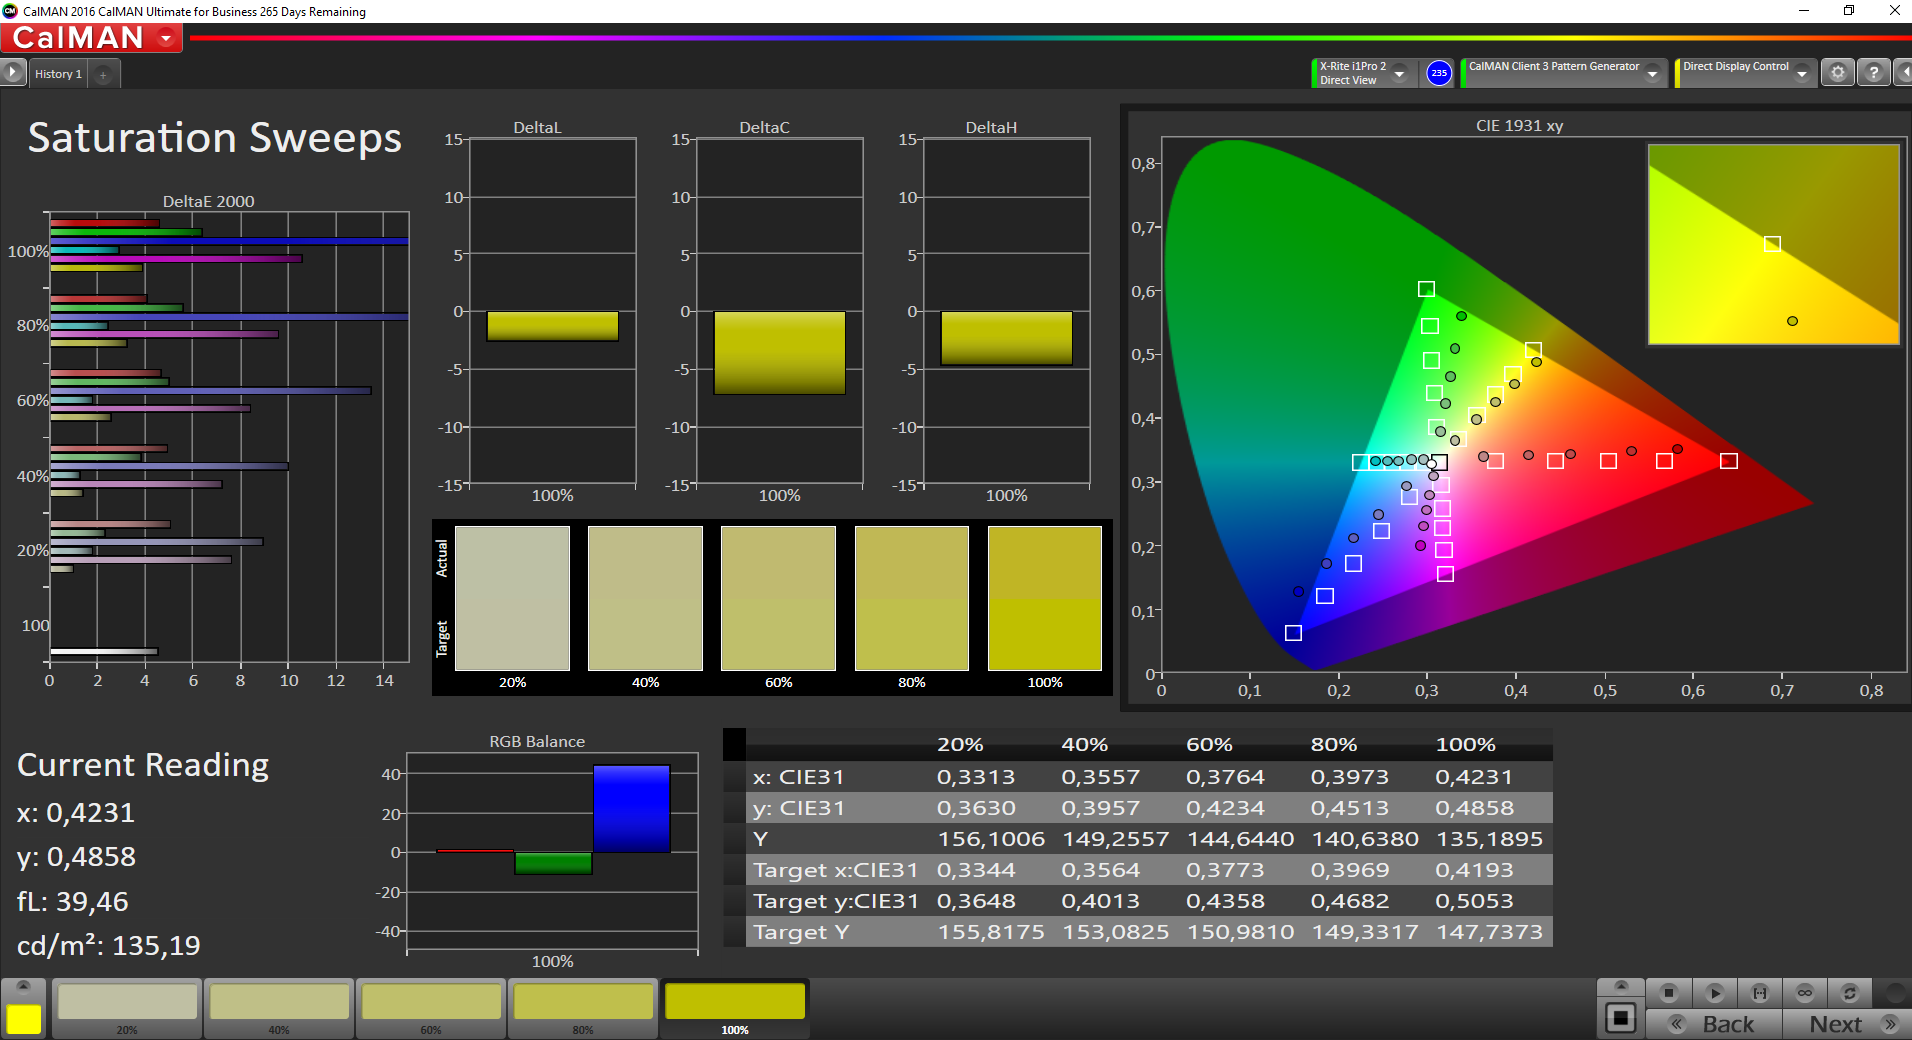
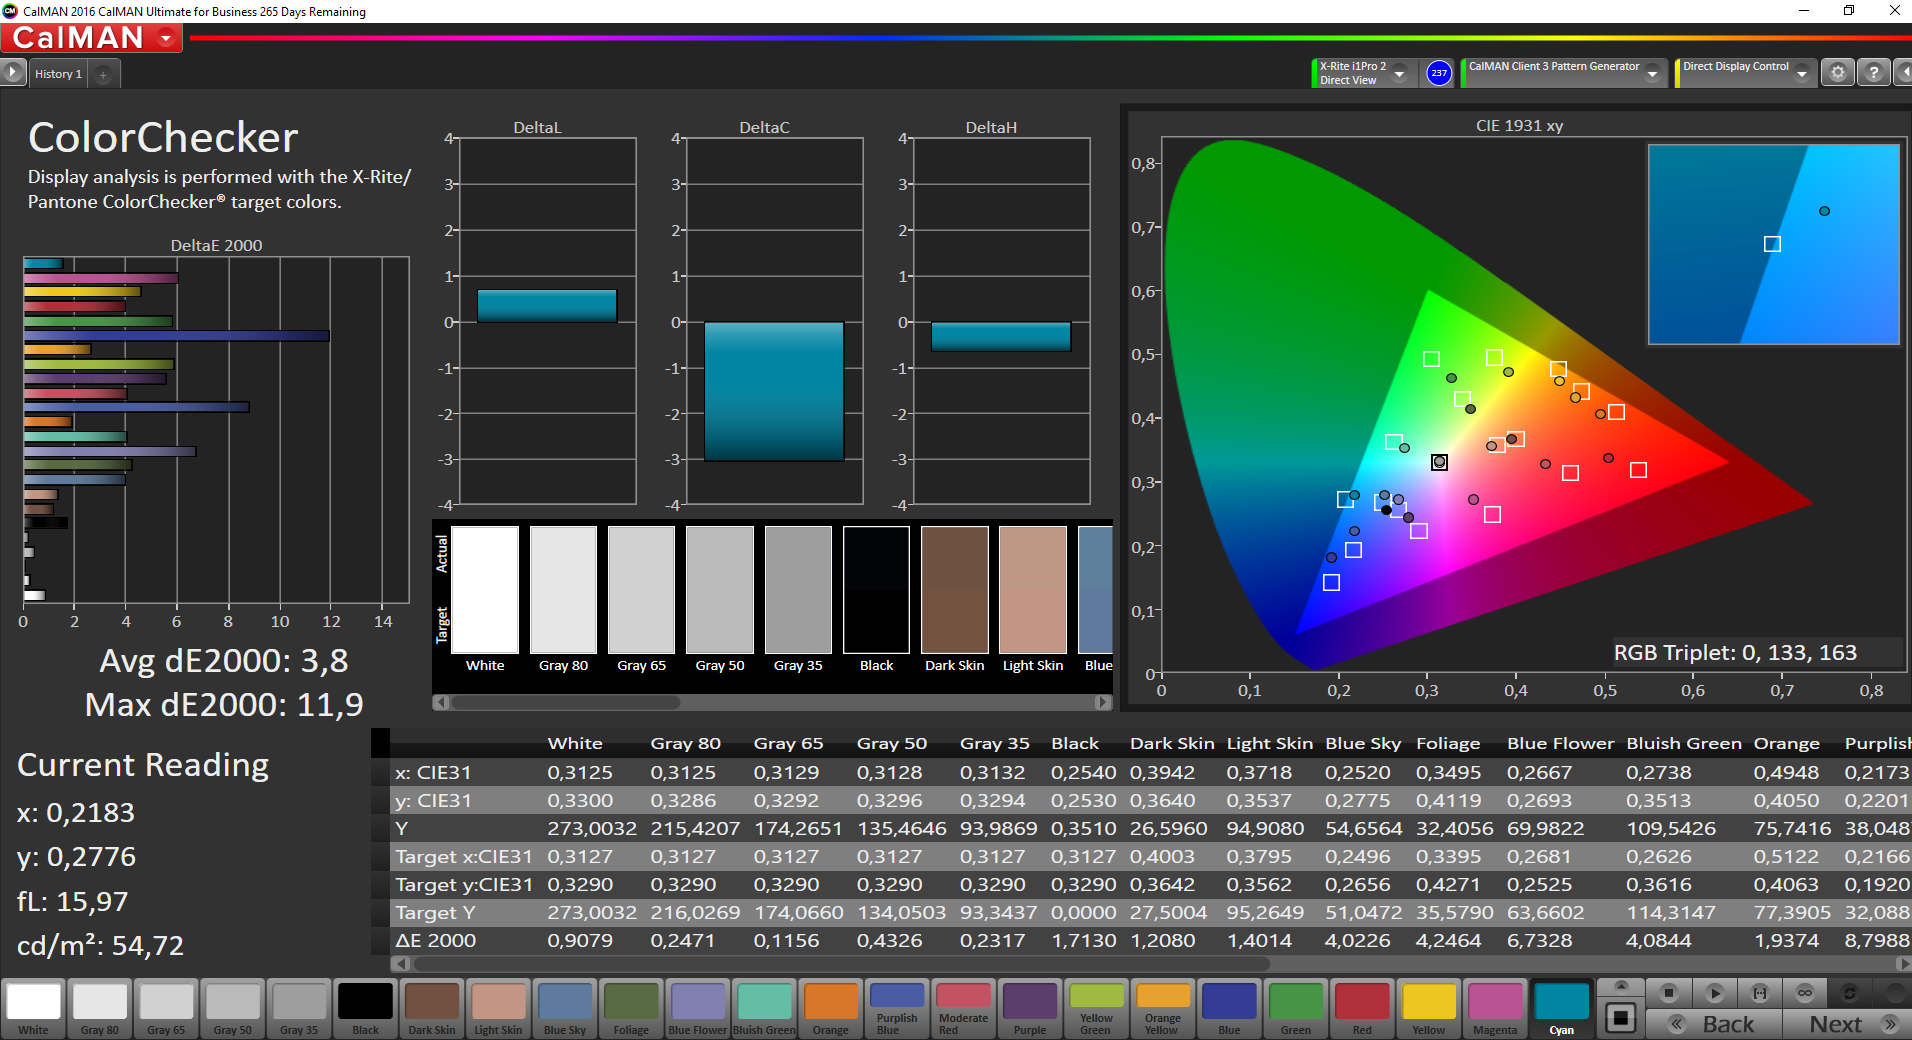
ΔE ColorChecker Calman: 5.1 | ∀{0.5-29.43 Ø4.72}
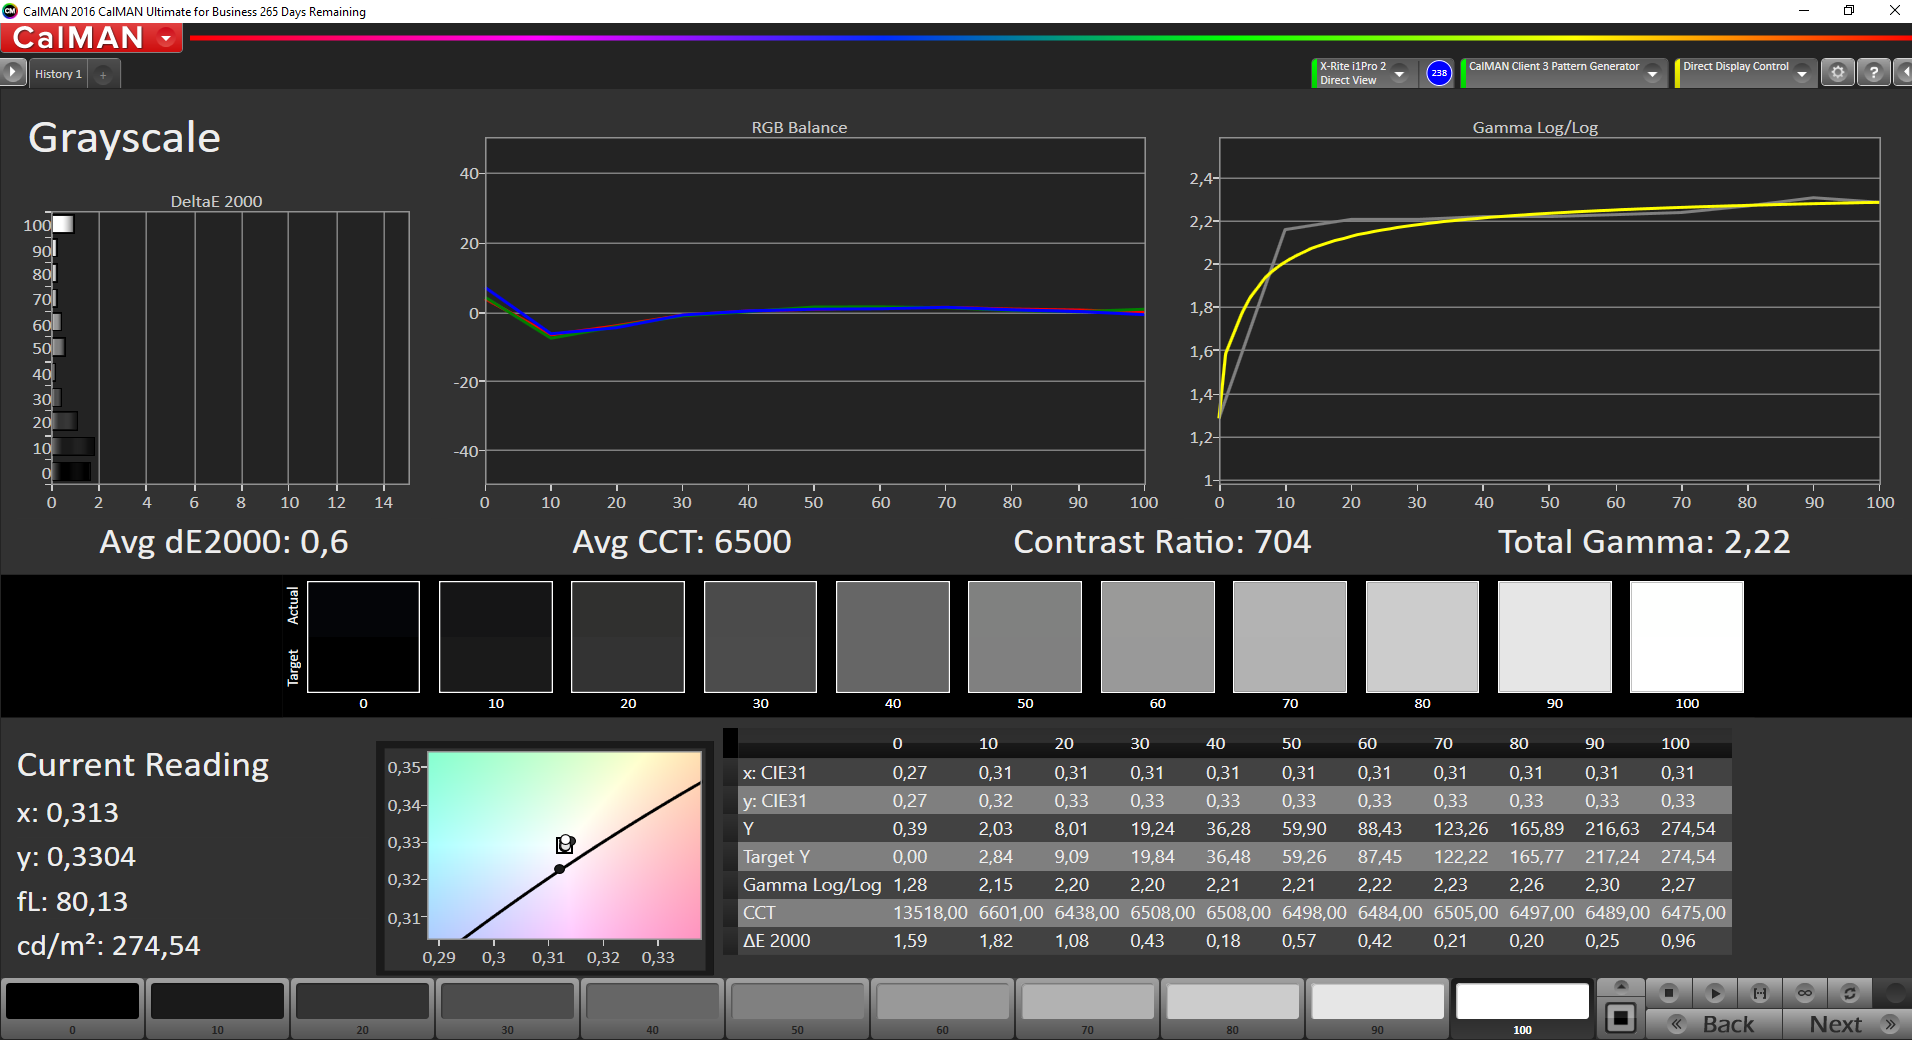
ΔE Greyscale Calman: 3.9 | ∀{0.09-98 Ø4.97}
59.75% sRGB (Argyll 1.6.3 3D)
38.24% AdobeRGB 1998 (Argyll 1.6.3 3D)
41.54% AdobeRGB 1998 (Argyll 3D)
60% sRGB (Argyll 3D)
40.16% Display P3 (Argyll 3D)
Gamma: 2.17
CCT: 6829 K
| Lenovo ThinkPad 13-20J2S00G00 LP133WF2-SPL78, , 1920x1080, 13.3" | Lenovo ThinkPad 13-20GKS01100 LP133WF2-SPL1, , 1920x1080, 13.3" | HP ProBook 430 G4-Y8B47EA LGD052D, , 1920x1080, 13.3" | Asus Zenbook UX310UA-FC347T iGP AU Optronics AUO272D, , 1920x1080, 13.3" | Dell XPS 13 9360 FHD i5 Sharp SHP1449 LQ133M1, , 1920x1080, 13.3" | |
|---|---|---|---|---|---|
| Display | -5% | -4% | 42% | 22% | |
| Display P3 Coverage (%) | 40.16 | 38.35 -5% | 38.55 -4% | 64.2 60% | 48.94 22% |
| sRGB Coverage (%) | 60 | 57.4 -4% | 57.8 -4% | 65.3 9% | 73.3 22% |
| AdobeRGB 1998 Coverage (%) | 41.54 | 39.66 -5% | 39.85 -4% | 65.3 57% | 50.5 22% |
| Response Times | -3% | -1% | 11% | -4% | |
| Response Time Grey 50% / Grey 80% * (ms) | 43.6 ? | 43.2 ? 1% | 42.4 ? 3% | 40 ? 8% | 32.8 ? 25% |
| Response Time Black / White * (ms) | 25.2 ? | 26.8 ? -6% | 26.4 ? -5% | 22 ? 13% | 33.2 ? -32% |
| PWM Frequency (Hz) | 30860 ? | 200 ? | |||
| Screen | -1% | -4% | 18% | 15% | |
| Brightness middle (cd/m²) | 306 | 233 -24% | 253 -17% | 358 17% | 351.2 15% |
| Brightness (cd/m²) | 307 | 227 -26% | 249 -19% | 347 13% | 325 6% |
| Brightness Distribution (%) | 89 | 86 -3% | 92 3% | 87 -2% | 89 0% |
| Black Level * (cd/m²) | 0.36 | 0.22 39% | 0.32 11% | 0.26 28% | 0.195 46% |
| Contrast (:1) | 850 | 1059 25% | 791 -7% | 1377 62% | 1801 112% |
| Colorchecker dE 2000 * | 5.1 | 5.41 -6% | 5.28 -4% | 5.22 -2% | 7.4 -45% |
| Colorchecker dE 2000 max. * | 13.3 | 13.61 -2% | 13.66 -3% | 9.19 31% | 9.08 32% |
| Greyscale dE 2000 * | 3.9 | 4.15 -6% | 3.8 3% | 6.69 -72% | 6.71 -72% |
| Gamma | 2.17 101% | 2.45 90% | 2.3 96% | 2.35 94% | 2.74 80% |
| CCT | 6829 95% | 6773 96% | 6646 98% | 6745 96% | 7222 90% |
| Color Space (Percent of AdobeRGB 1998) (%) | 38.24 | 36.52 -4% | 36.7 -4% | 59 54% | 50.48 32% |
| Color Space (Percent of sRGB) (%) | 59.75 | 57.16 -4% | 57.6 -4% | 91 52% | 73.31 23% |
| Total Average (Program / Settings) | -3% /
-2% | -3% /
-4% | 24% /
22% | 11% /
14% |
* ... smaller is better

Display Response Times
| ↔ Response Time Black to White | ||
|---|---|---|
| 25.2 ms ... rise ↗ and fall ↘ combined | ↗ 12.8 ms rise | 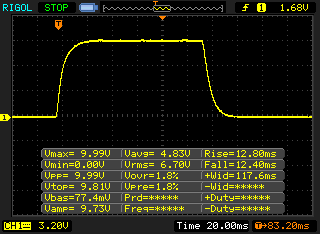 |
| ↘ 12.4 ms fall | ||
| The screen shows relatively slow response rates in our tests and may be too slow for gamers. In comparison, all tested devices range from 0.1 (minimum) to 240 (maximum) ms. » 61 % of all devices are better. This means that the measured response time is worse than the average of all tested devices (19.8 ms). | ||
| ↔ Response Time 50% Grey to 80% Grey | ||
| 43.6 ms ... rise ↗ and fall ↘ combined | ↗ 20.8 ms rise | 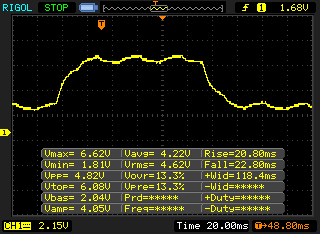 |
| ↘ 22.8 ms fall | ||
| The screen shows slow response rates in our tests and will be unsatisfactory for gamers. In comparison, all tested devices range from 0.165 (minimum) to 636 (maximum) ms. » 73 % of all devices are better. This means that the measured response time is worse than the average of all tested devices (31 ms). | ||
Screen Flickering / PWM (Pulse-Width Modulation)
| Screen flickering / PWM detected | 30860 Hz | ≤ 90 % brightness setting | 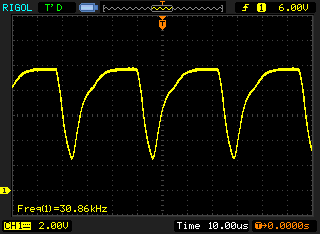 |
The display backlight flickers at 30860 Hz (worst case, e.g., utilizing PWM) Flickering detected at a brightness setting of 90 % and below. There should be no flickering or PWM above this brightness setting. The frequency of 30860 Hz is quite high, so most users sensitive to PWM should not notice any flickering. In comparison: 52 % of all tested devices do not use PWM to dim the display. If PWM was detected, an average of 7753 (minimum: 5 - maximum: 343500) Hz was measured. | |||
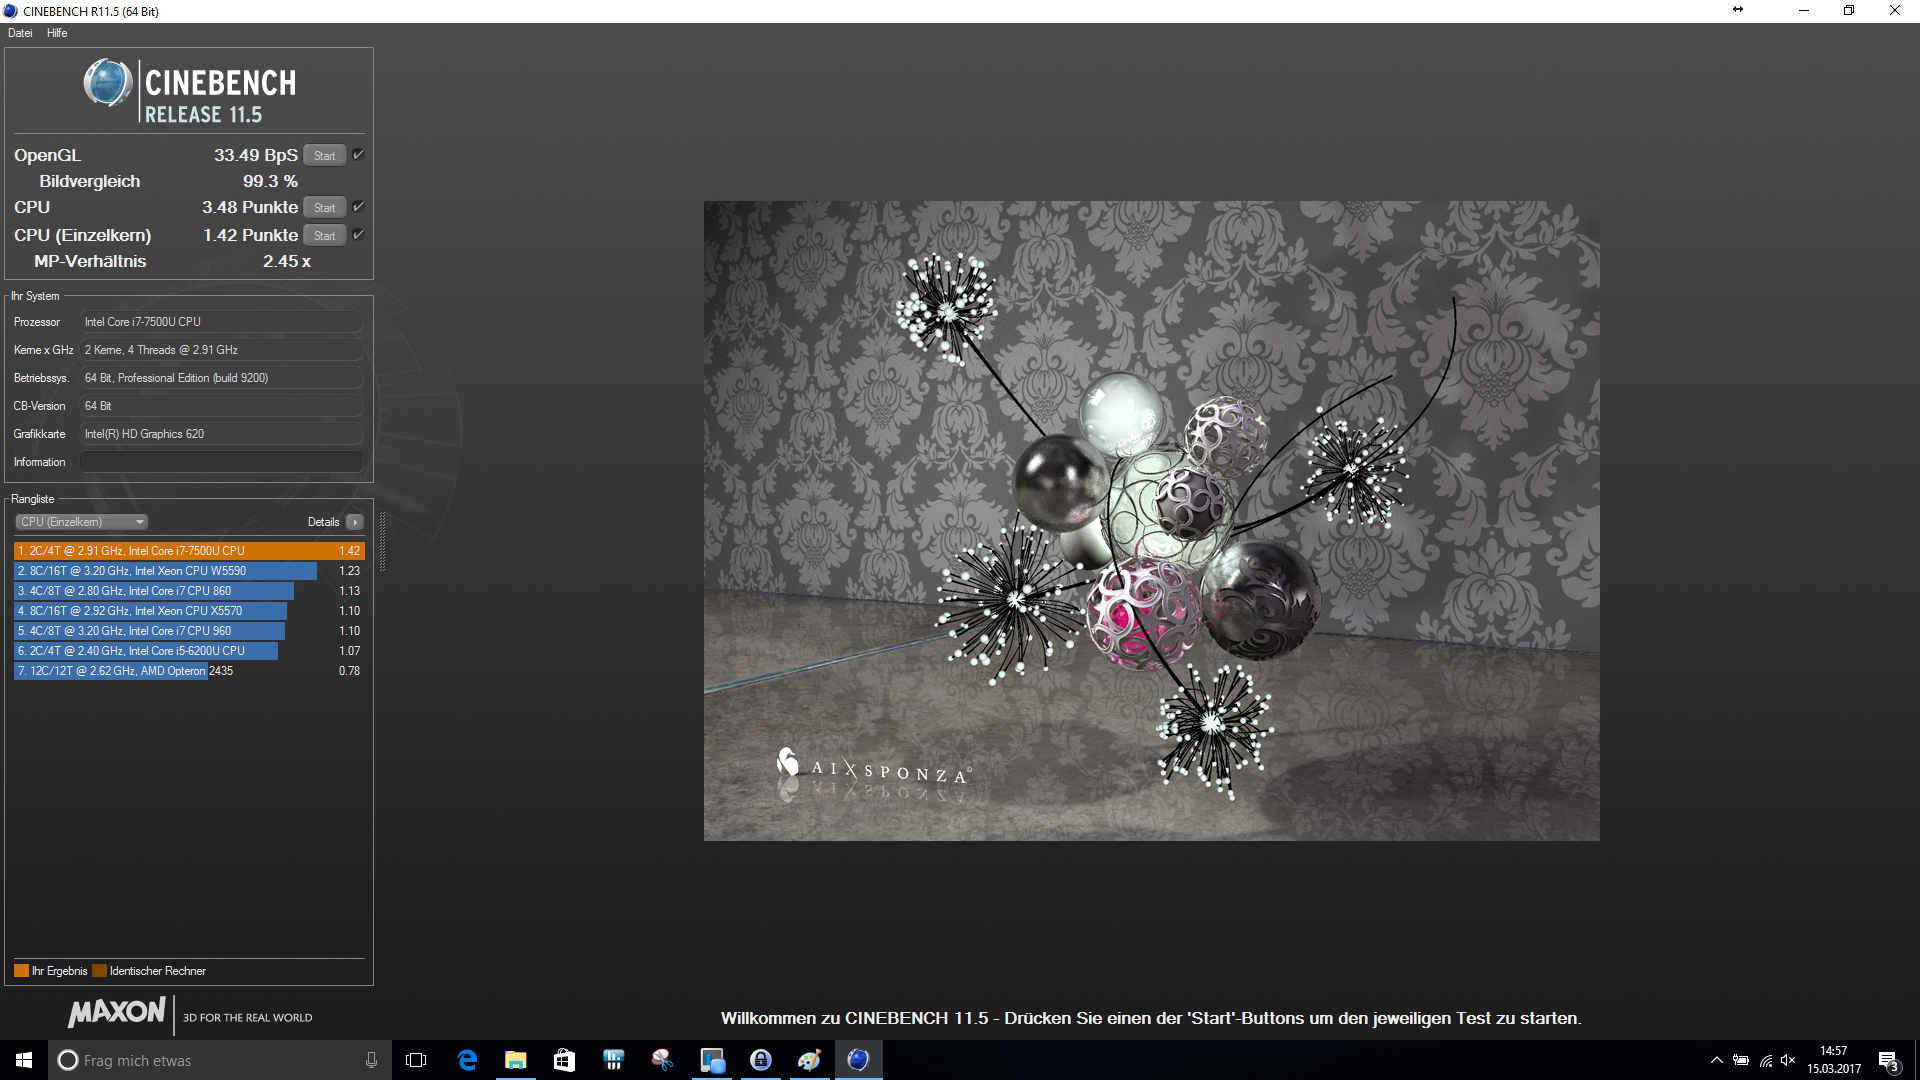
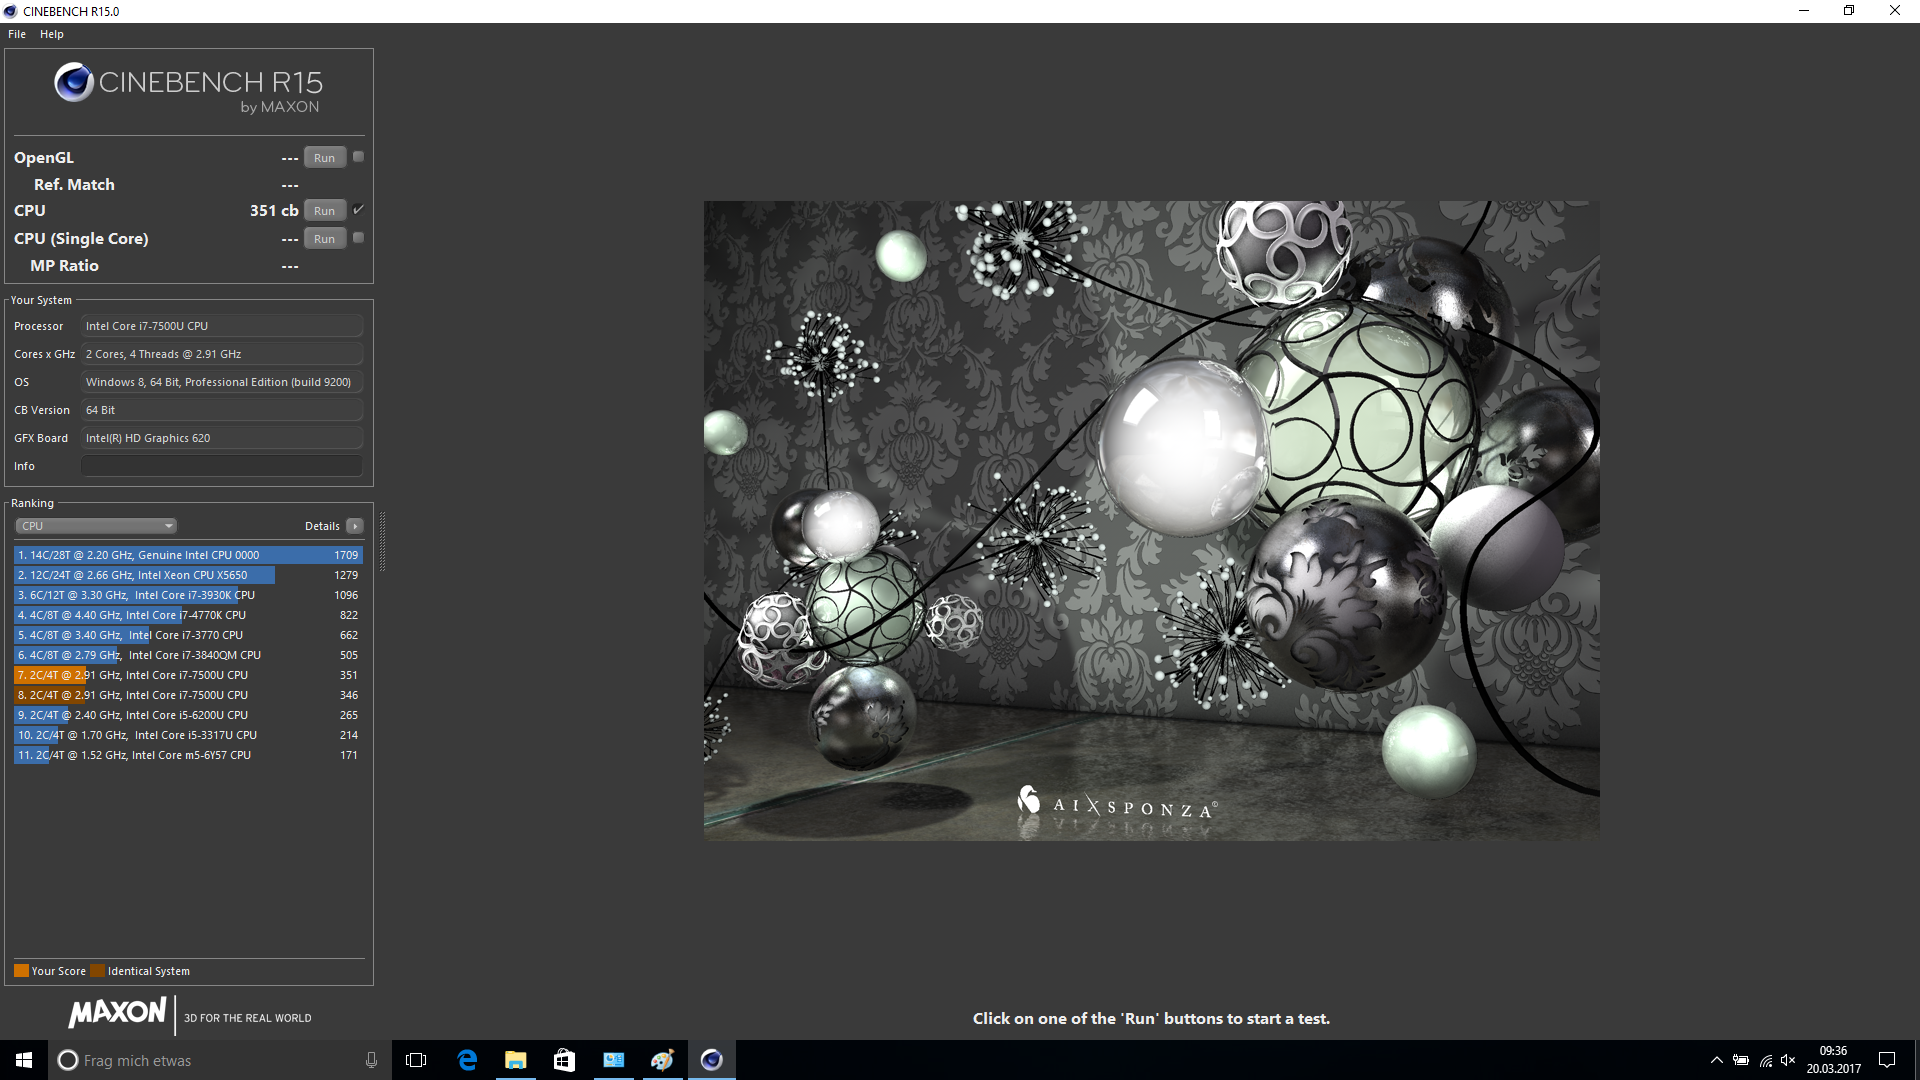
| Cinebench R11.5 | |
| CPU Single 64Bit | |
| Lenovo ThinkPad 13-20J2S00G00 | |
| Asus Zenbook UX310UA-FC347T iGP | |
| Dell XPS 13 9360 FHD i5 | |
| CPU Multi 64Bit | |
| Lenovo ThinkPad 13-20J2S00G00 | |
| Asus Zenbook UX310UA-FC347T iGP | |
| Dell XPS 13 9360 FHD i5 | |
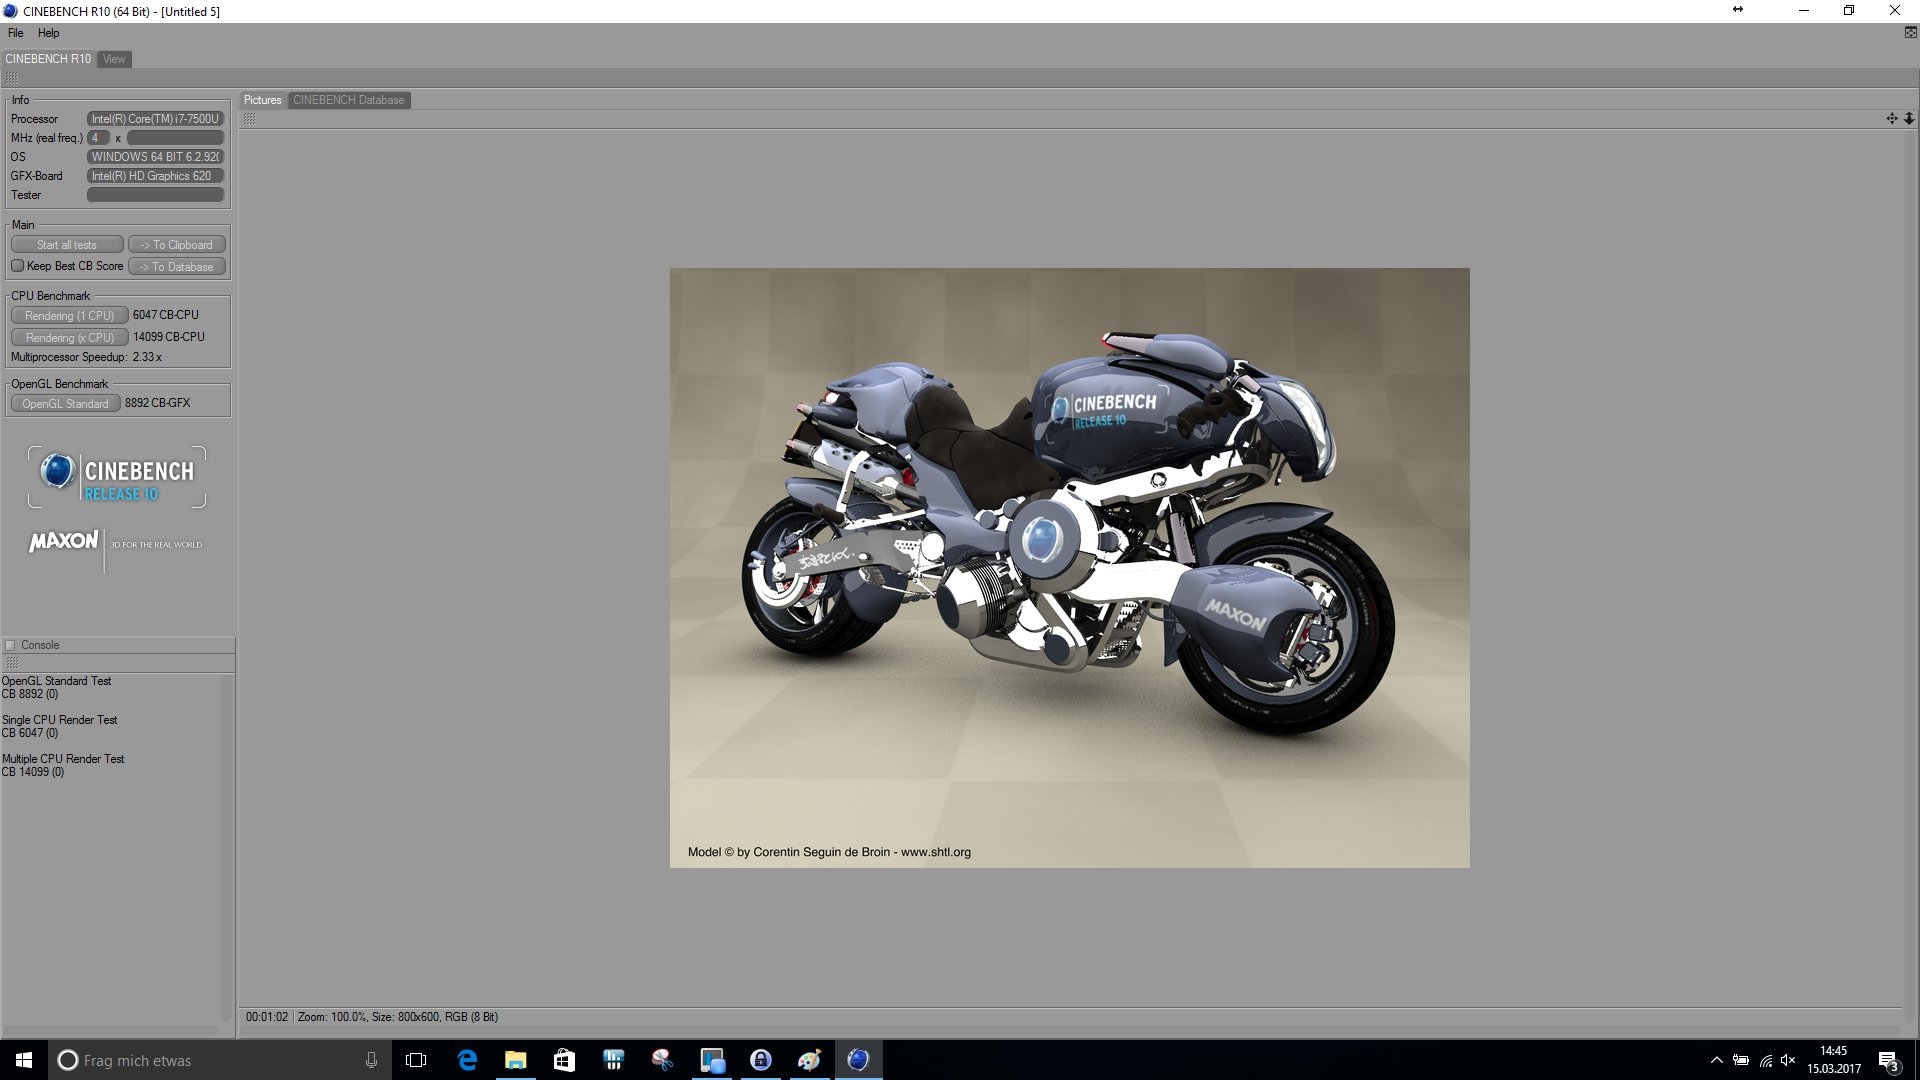
| Cinebench R10 | |
| Rendering Single CPUs 64Bit | |
| Asus Zenbook UX310UA-FC347T iGP | |
| Lenovo ThinkPad 13-20J2S00G00 | |
| Rendering Multiple CPUs 64Bit | |
| Asus Zenbook UX310UA-FC347T iGP | |
| Lenovo ThinkPad 13-20J2S00G00 | |
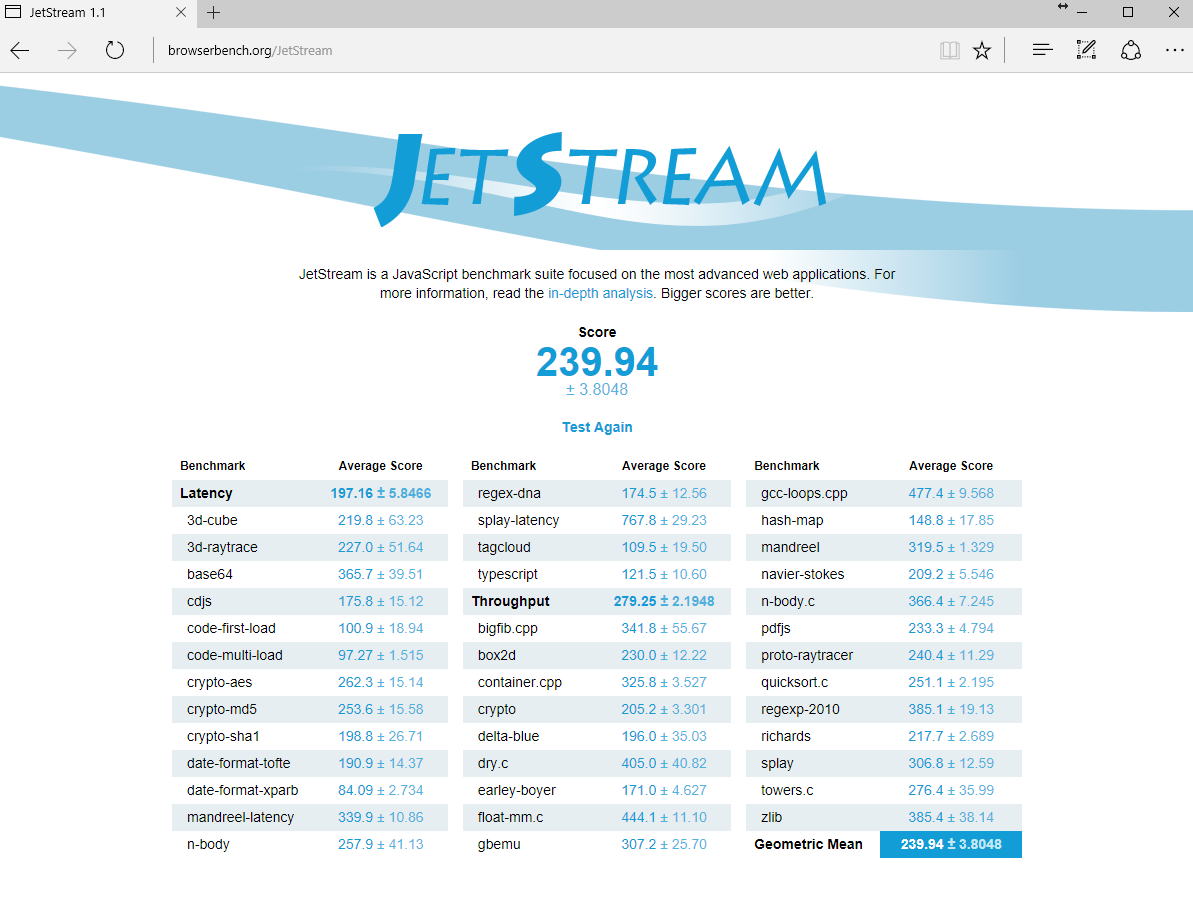
| JetStream 1.1 - 1.1 Total | |
| Lenovo ThinkPad 13-20J2S00G00 | |
| Asus Zenbook UX310UA-FC347T iGP | |
| HP ProBook 430 G4-Y8B47EA | |
| Lenovo ThinkPad 13-20GKS01100 | |
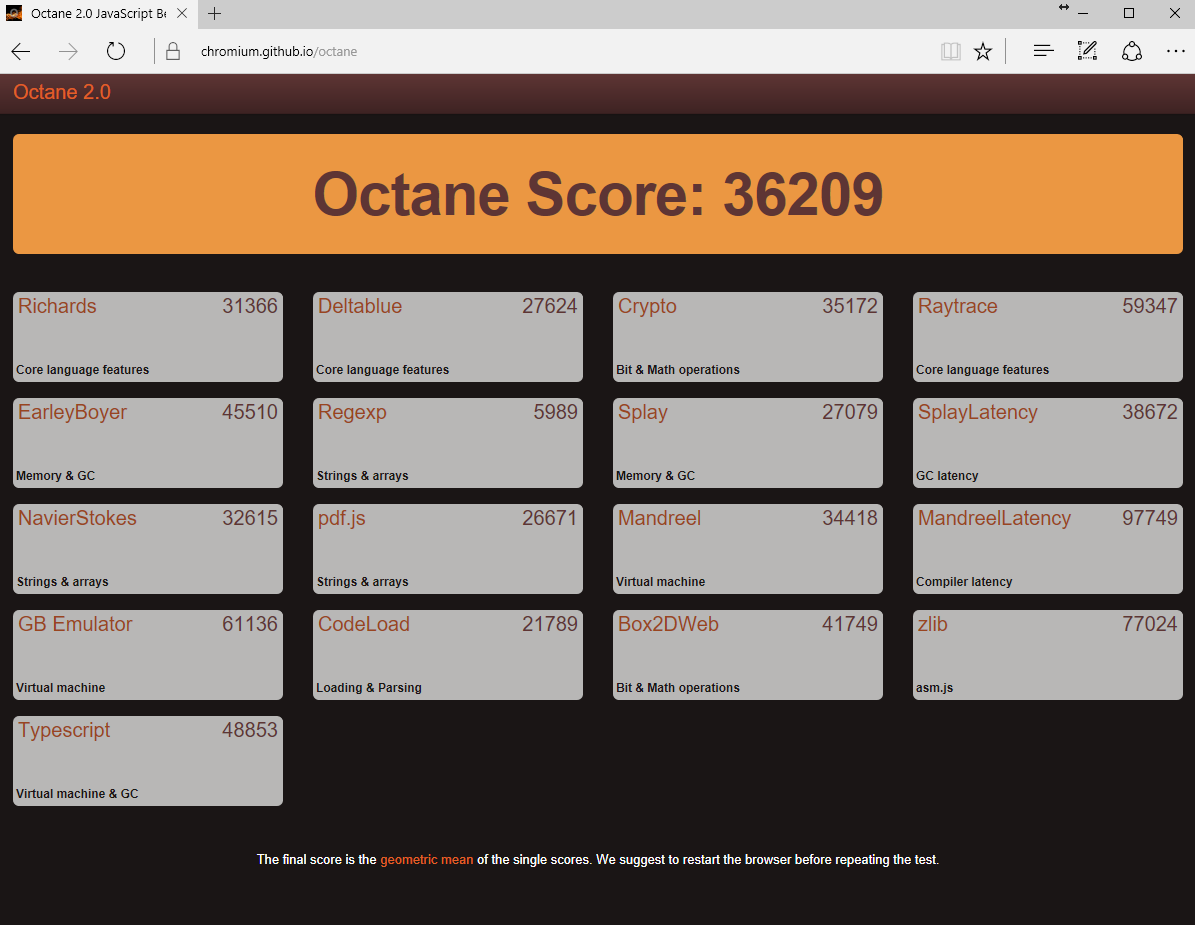
| Octane V2 - Total Score | |
| Lenovo ThinkPad 13-20J2S00G00 | |
| HP ProBook 430 G4-Y8B47EA | |
| Asus Zenbook UX310UA-FC347T iGP | |
| Dell XPS 13 9360 FHD i5 | |
| Lenovo ThinkPad 13-20GKS01100 | |
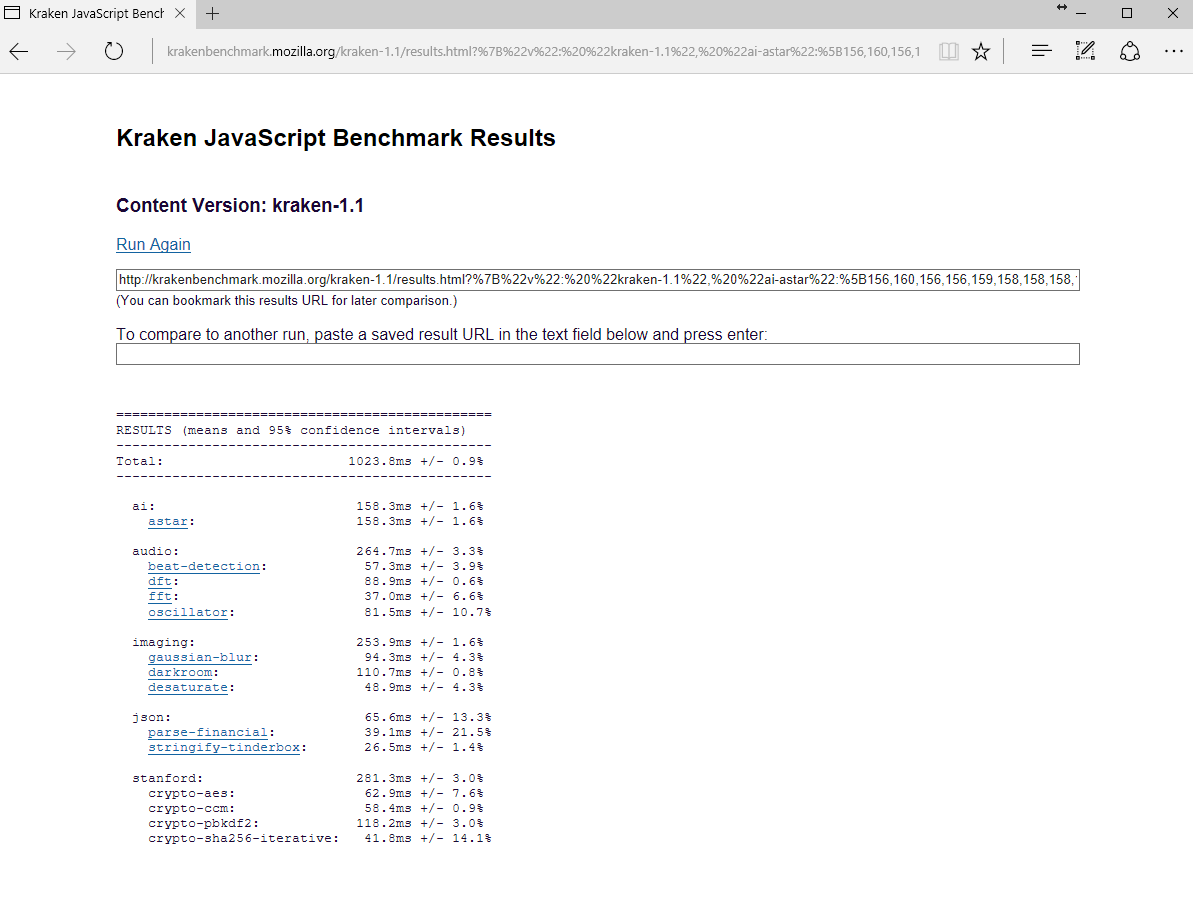
| Mozilla Kraken 1.1 - Total | |
| Lenovo ThinkPad 13-20GKS01100 | |
| Asus Zenbook UX310UA-FC347T iGP | |
| Lenovo ThinkPad 13-20J2S00G00 | |
| HP ProBook 430 G4-Y8B47EA | |
* ... smaller is better
| PCMark 7 - Score | |
| Asus Zenbook UX310UA-FC347T iGP | |
| HP ProBook 430 G4-Y8B47EA | |
| Lenovo ThinkPad 13-20J2S00G00 | |
| PCMark Vantage Result | 16210 points | |
| PCMark 7 Score | 5189 points | |
| PCMark 8 Home Score Accelerated v2 | 3705 points | |
| PCMark 8 Creative Score Accelerated v2 | 4583 points | |
| PCMark 8 Work Score Accelerated v2 | 4838 points | |
Help | ||
| Lenovo ThinkPad 13-20J2S00G00 Toshiba NVMe THNSF5512GPUK | Lenovo ThinkPad 13-20GKS01100 Samsung SSD PM871 MZNLN256HCHP | HP ProBook 430 G4-Y8B47EA SanDisk SD8SNAT256G1002 | Asus Zenbook UX310UA-FC347T iGP Micron SSD 1100 (MTFDDAV256TBN) | Dell XPS 13 9360 FHD i5 Toshiba NVMe THNSN5256GPUK | |
|---|---|---|---|---|---|
| CrystalDiskMark 3.0 | -41% | -49% | -39% | -3% | |
| Read Seq (MB/s) | 1143 | 461.7 -60% | 505 -56% | 489.4 -57% | 1233 8% |
| Write Seq (MB/s) | 653 | 297.8 -54% | 328.9 -50% | 431.6 -34% | 733 12% |
| Read 512 (MB/s) | 629 | 351.6 -44% | 313.6 -50% | 356.7 -43% | 1036 65% |
| Write 512 (MB/s) | 518 | 298.4 -42% | 301 -42% | 389.1 -25% | 439.9 -15% |
| Read 4k (MB/s) | 31.96 | 31.85 0% | 21.69 -32% | 26.68 -17% | 29.31 -8% |
| Write 4k (MB/s) | 138.5 | 68.5 -51% | 80.4 -42% | 88.7 -36% | 116.9 -16% |
| Read 4k QD32 (MB/s) | 578 | 360.9 -38% | 132.2 -77% | 246.3 -57% | 479.2 -17% |
| Write 4k QD32 (MB/s) | 443.1 | 276.2 -38% | 258.8 -42% | 251.5 -43% | 218.3 -51% |

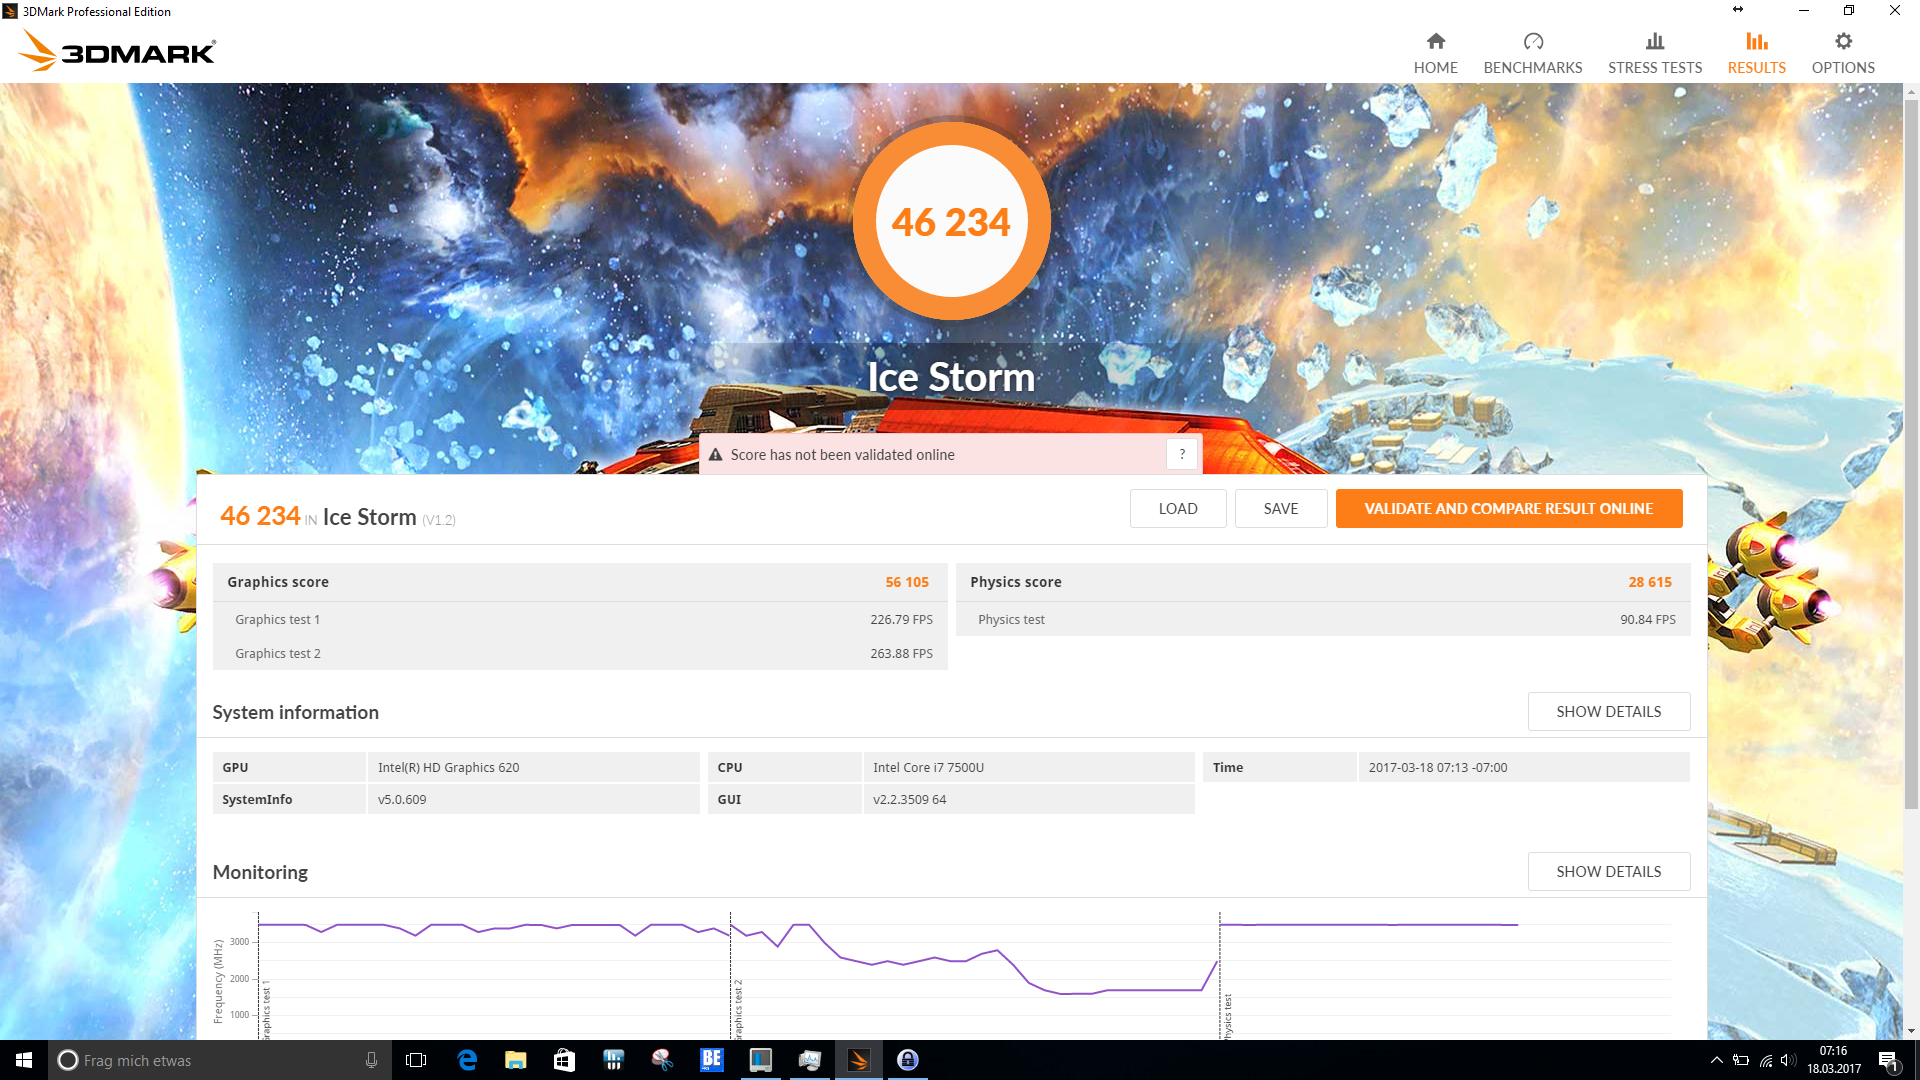
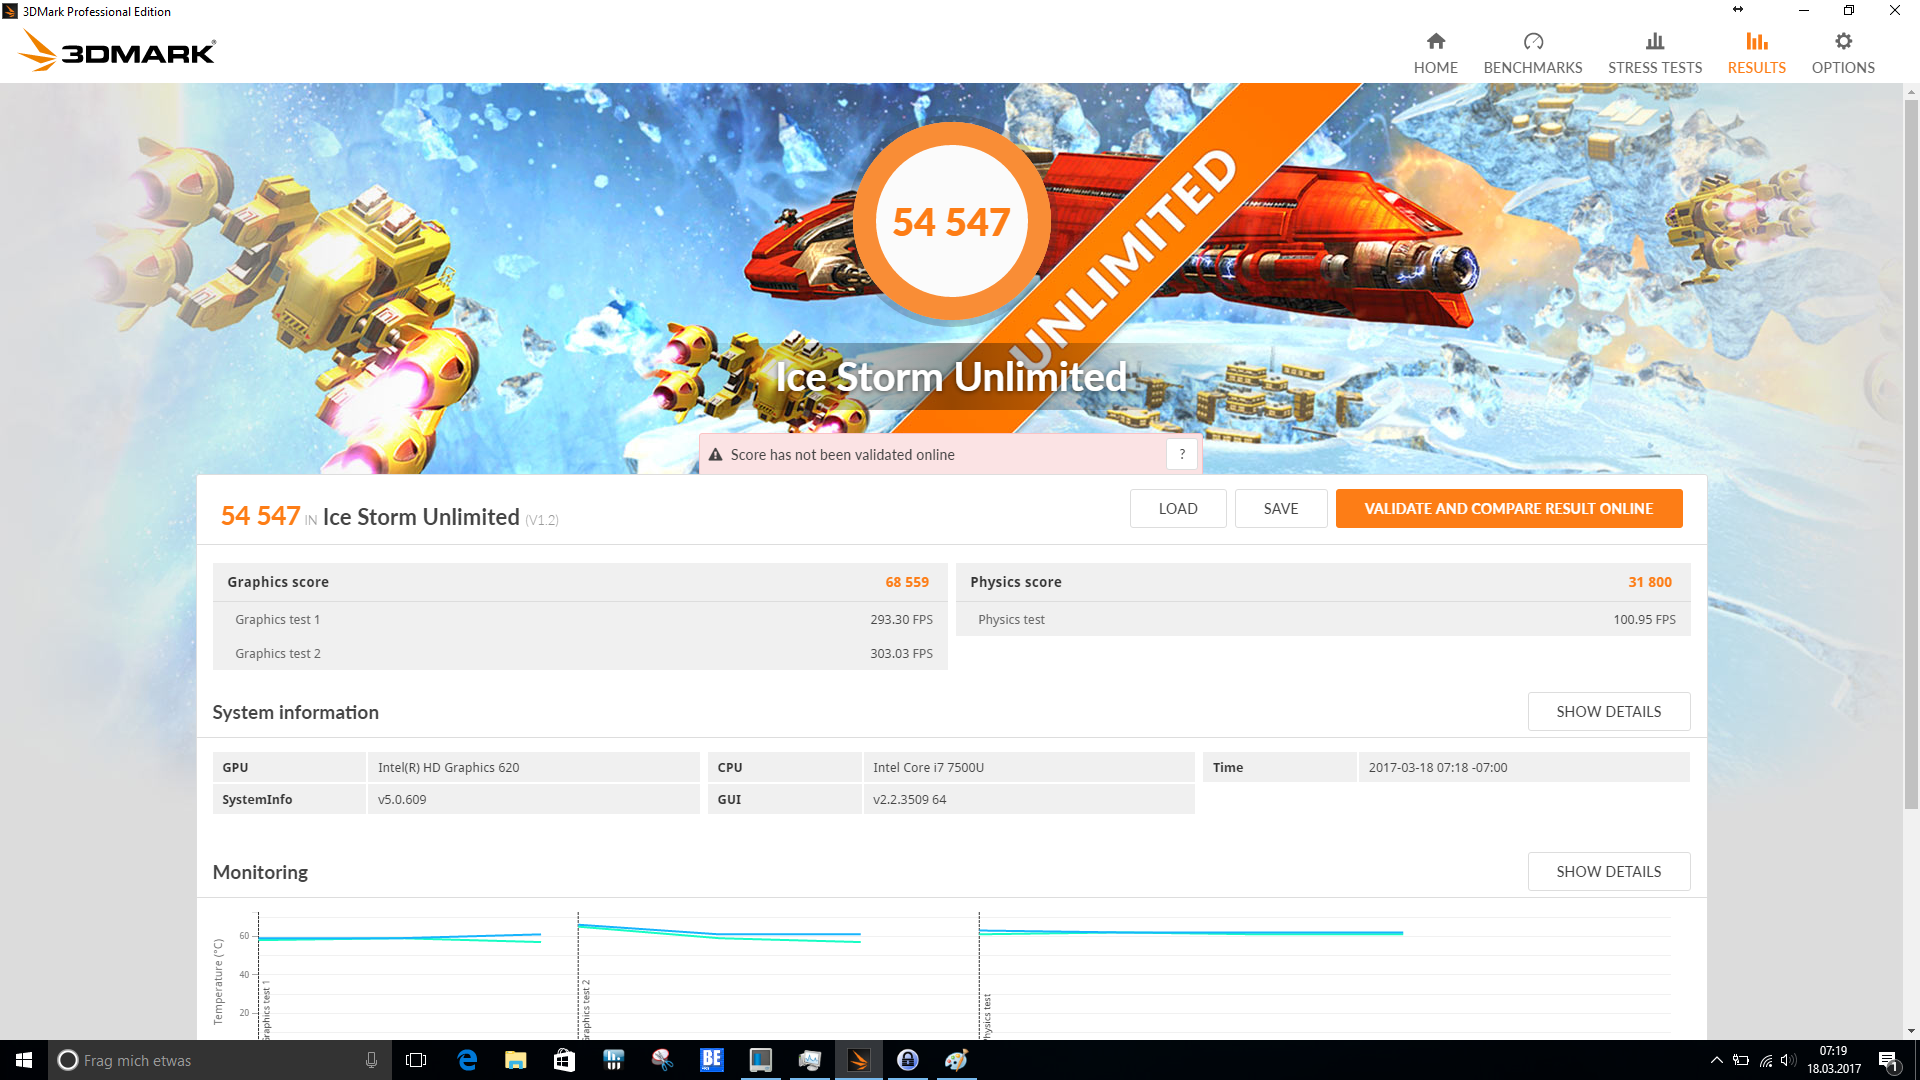
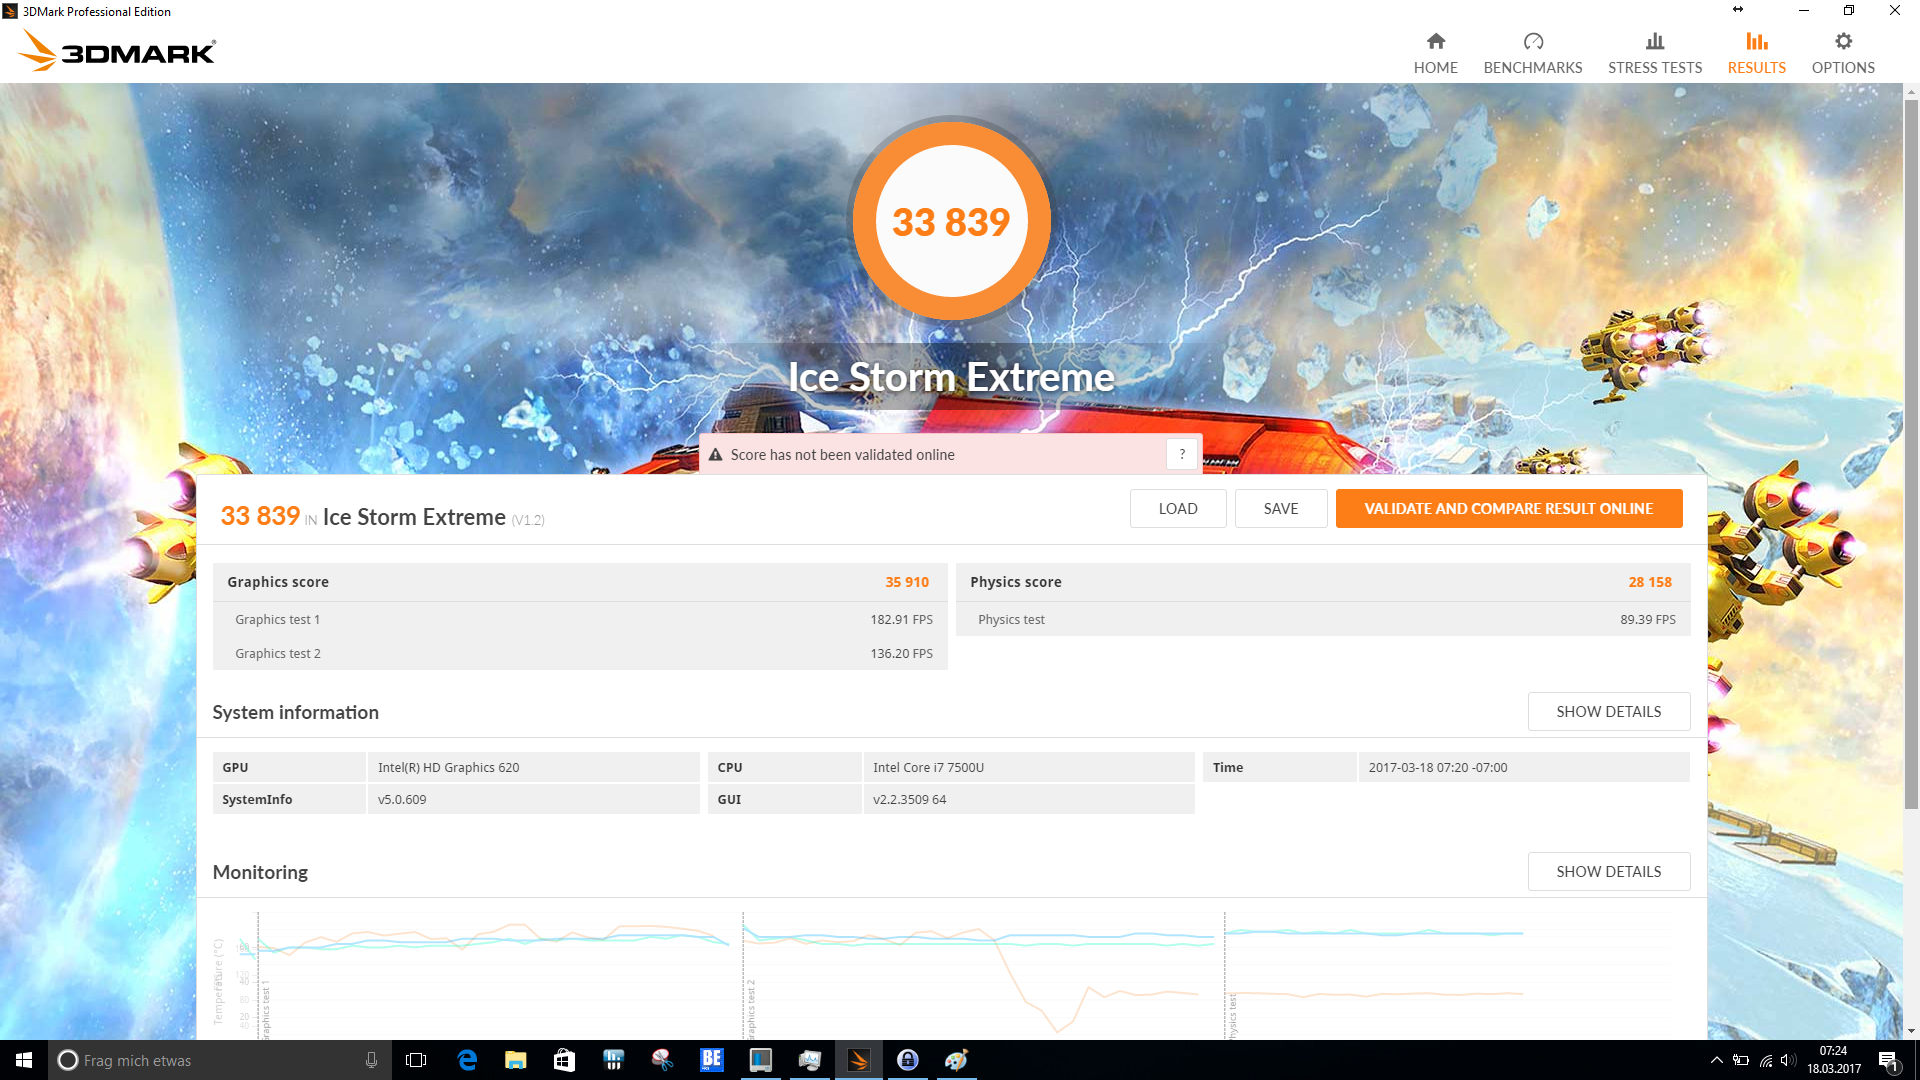
| 3DMark 11 - 1280x720 Performance GPU | |
| Asus Zenbook UX310UA-FC347T iGP | |
| Dell XPS 13 9360 FHD i5 | |
| Lenovo ThinkPad 13-20J2S00G00 | |
| HP ProBook 430 G4-Y8B47EA | |
| Lenovo ThinkPad 13-20GKS01100 | |
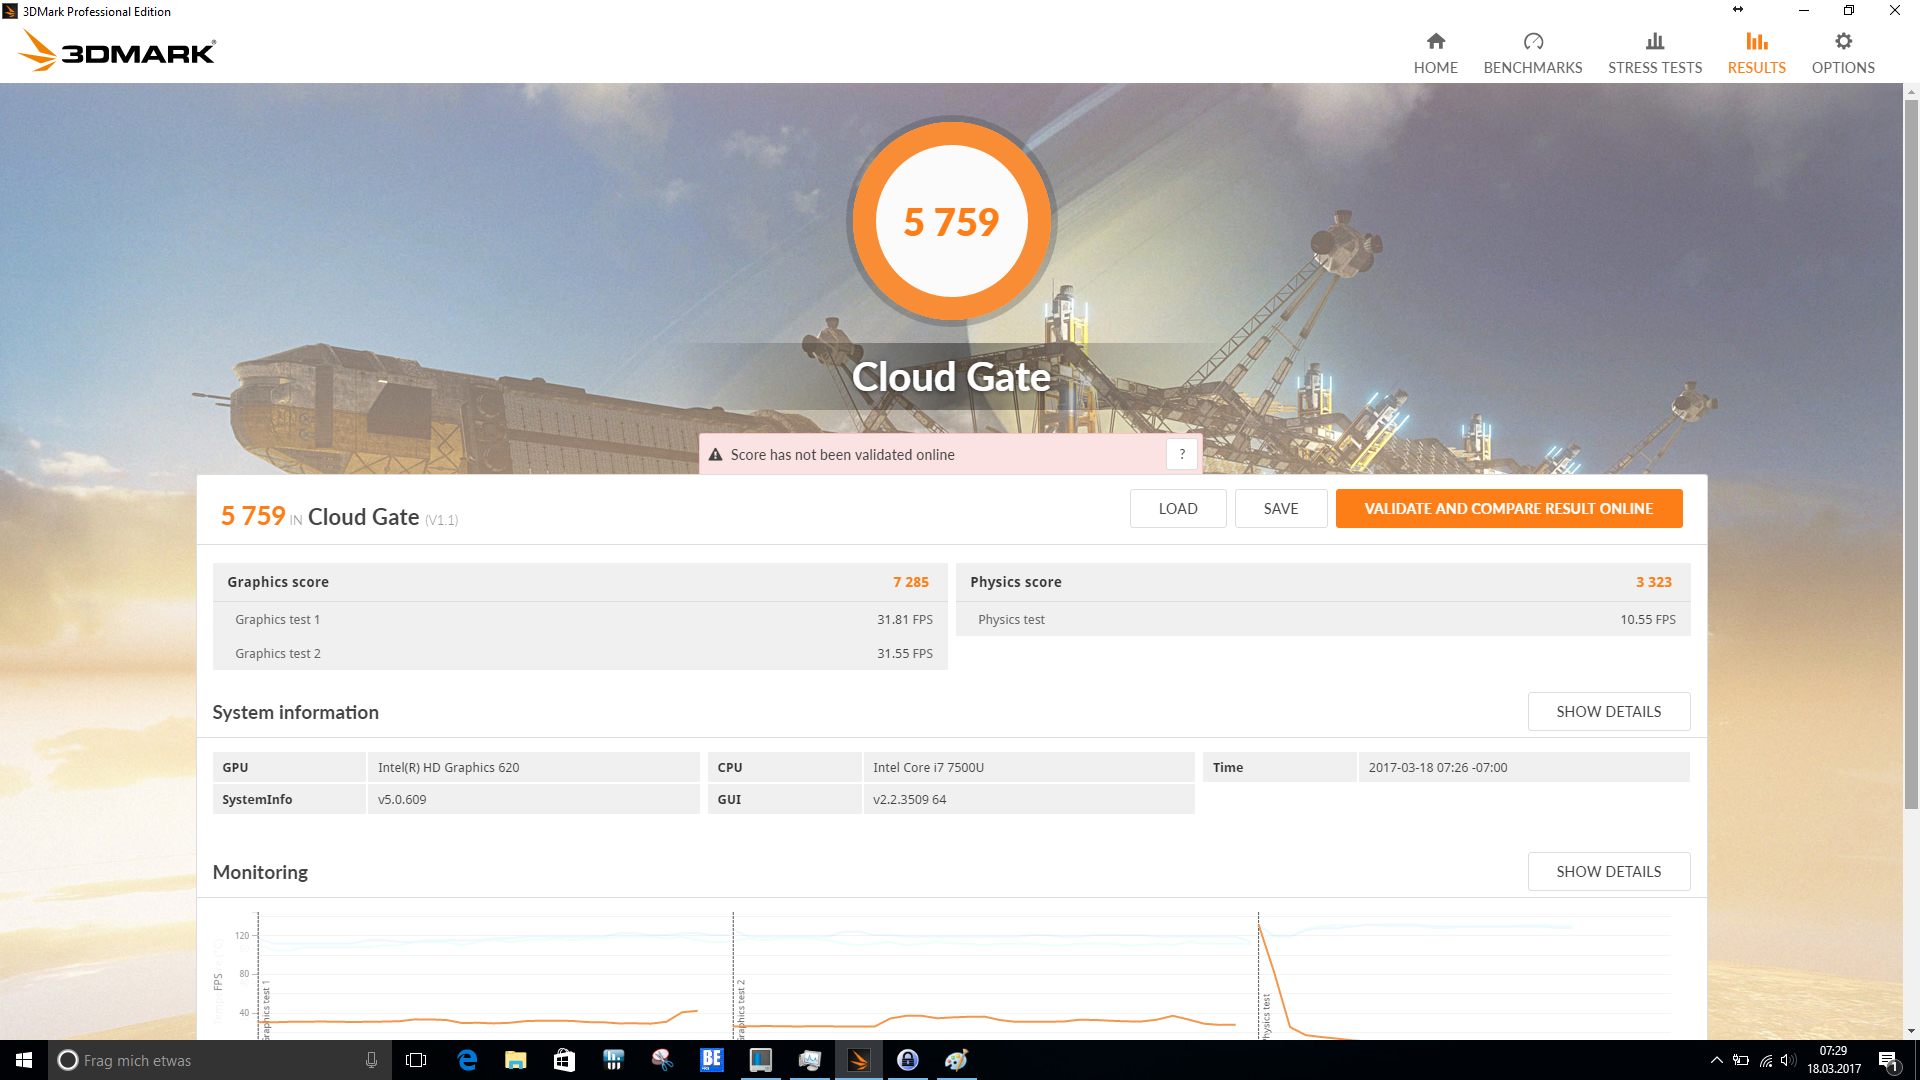
| 3DMark | |
| 1280x720 Cloud Gate Standard Graphics | |
| Asus Zenbook UX310UA-FC347T iGP | |
| Dell XPS 13 9360 FHD i5 | |
| HP ProBook 430 G4-Y8B47EA | |
| Lenovo ThinkPad 13-20GKS01100 | |
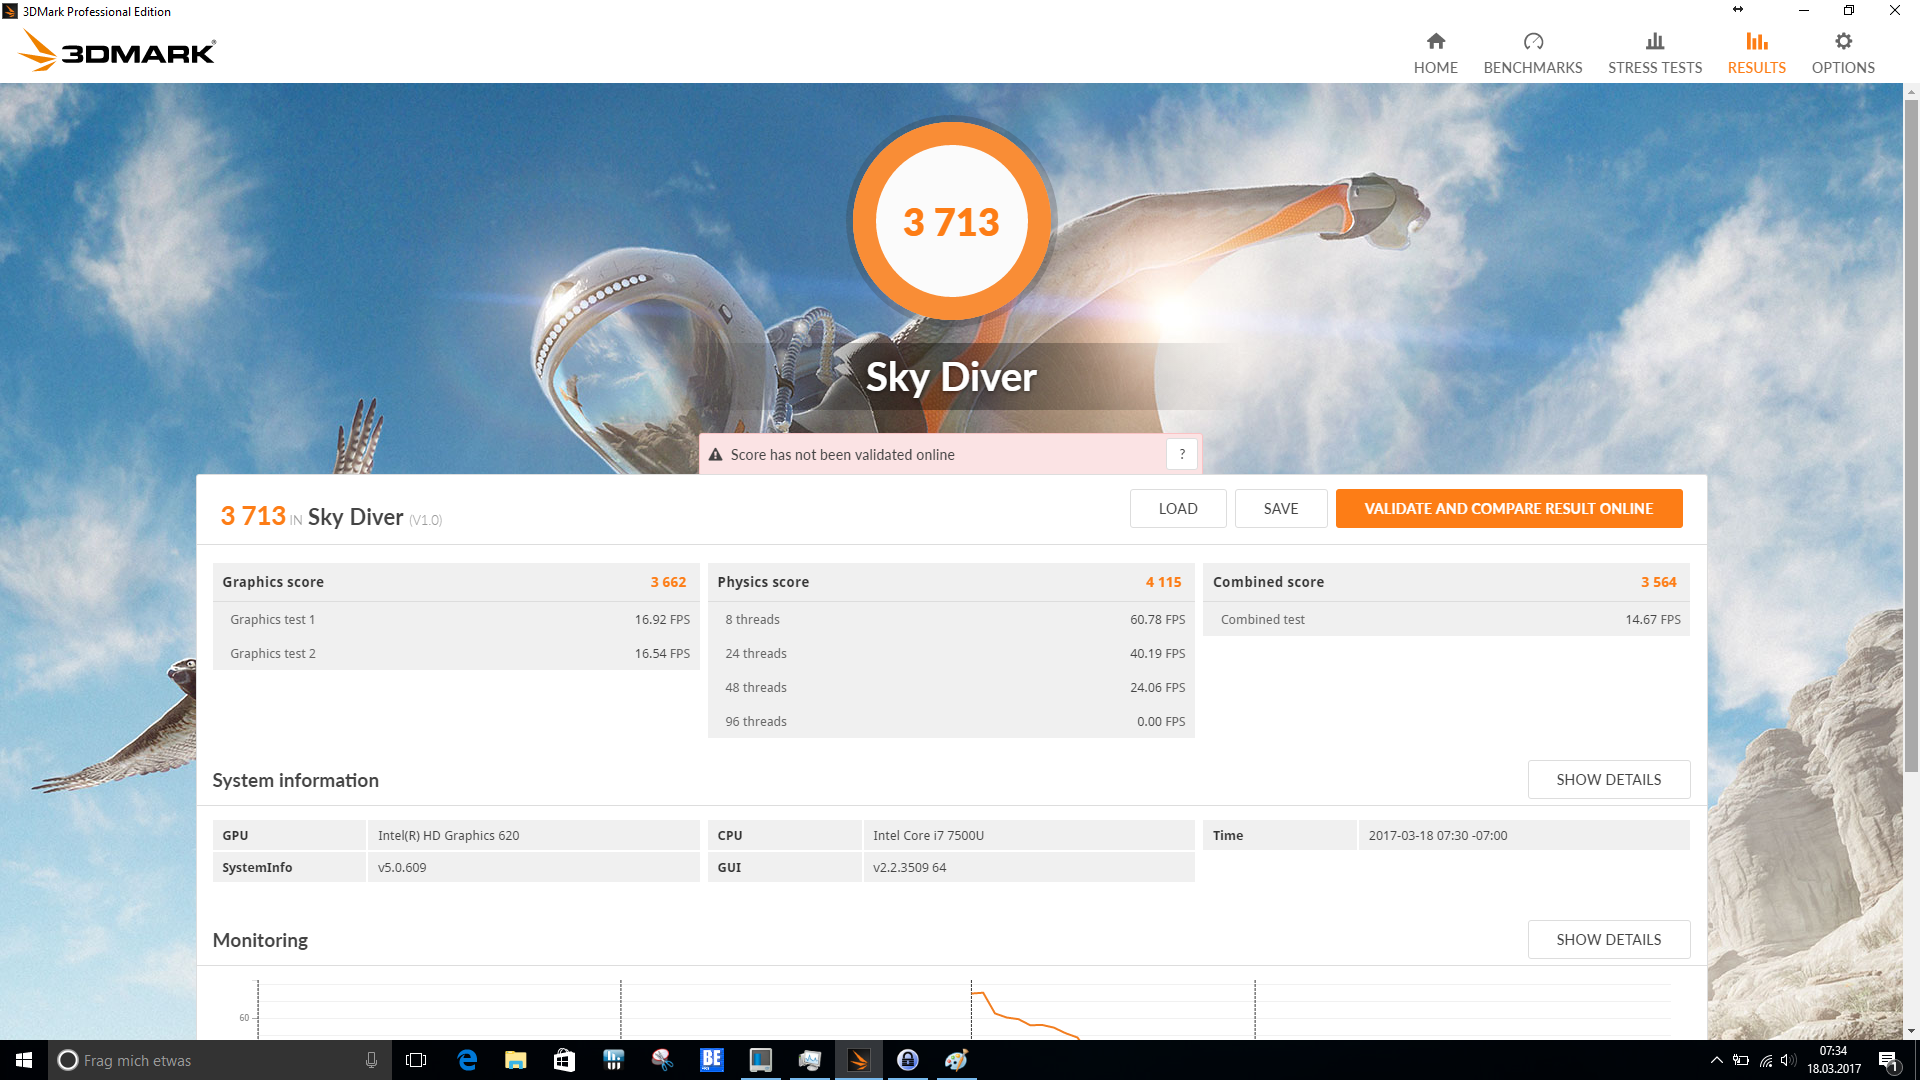
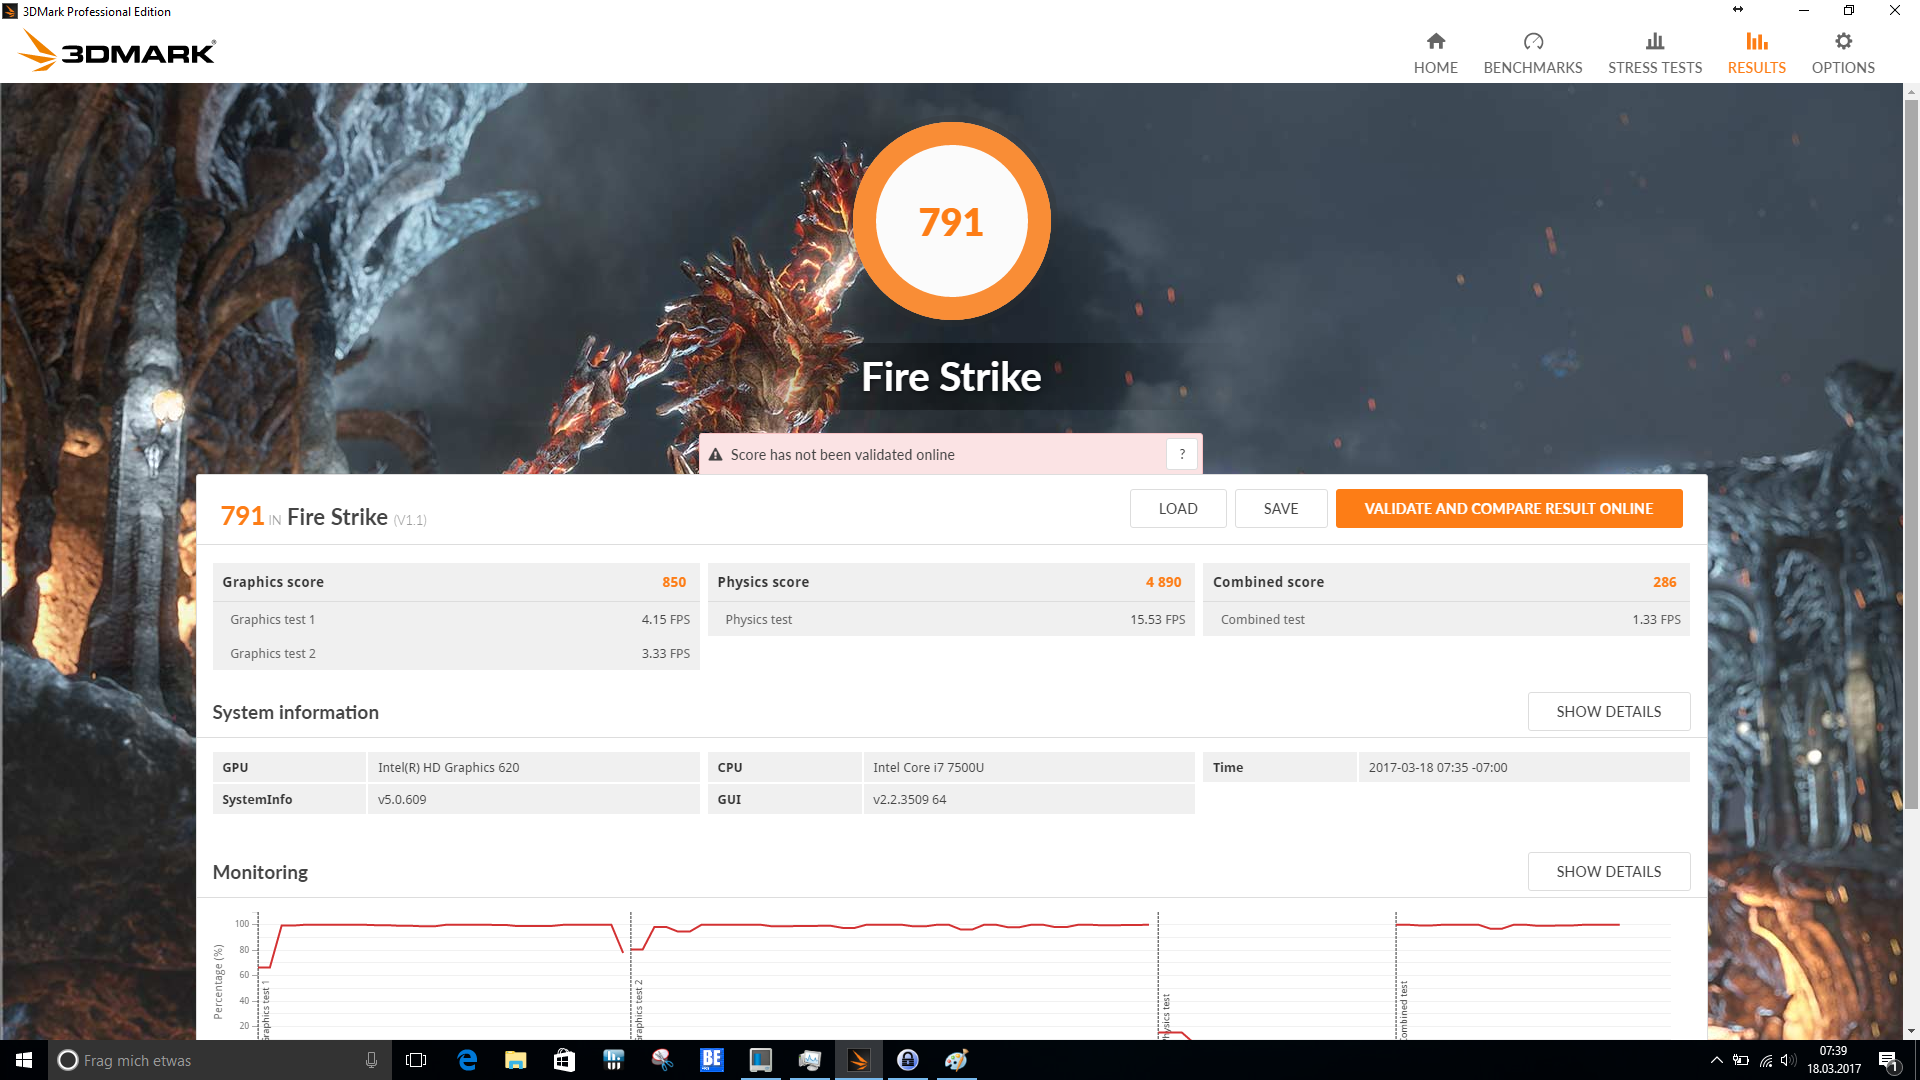
| 1920x1080 Fire Strike Graphics | |
| Asus Zenbook UX310UA-FC347T iGP | |
| Dell XPS 13 9360 FHD i5 | |
| HP ProBook 430 G4-Y8B47EA | |
| Lenovo ThinkPad 13-20GKS01100 | |
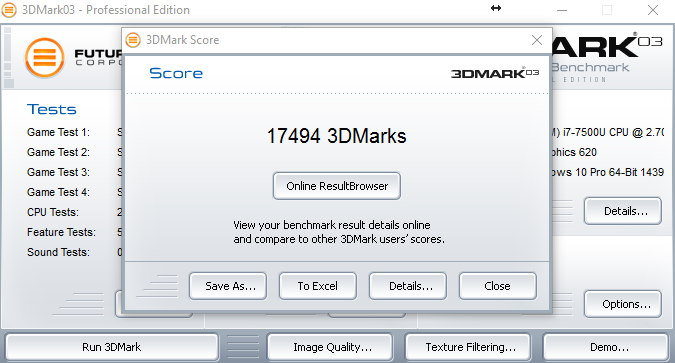
| 3DMark 03 Standard | 17494 points | |
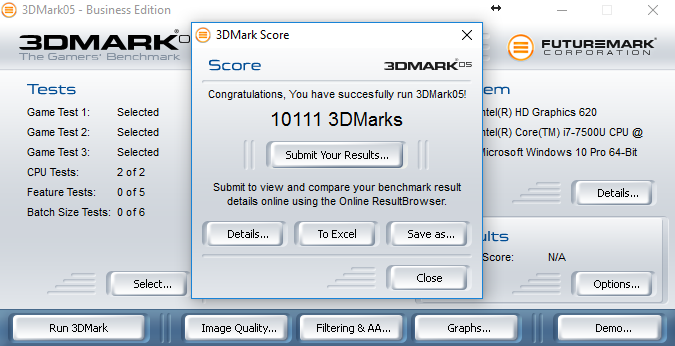
| 3DMark 05 Standard | 10111 points | |
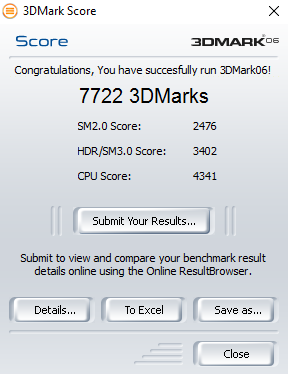
| 3DMark 06 Standard Score | 7722 points | |
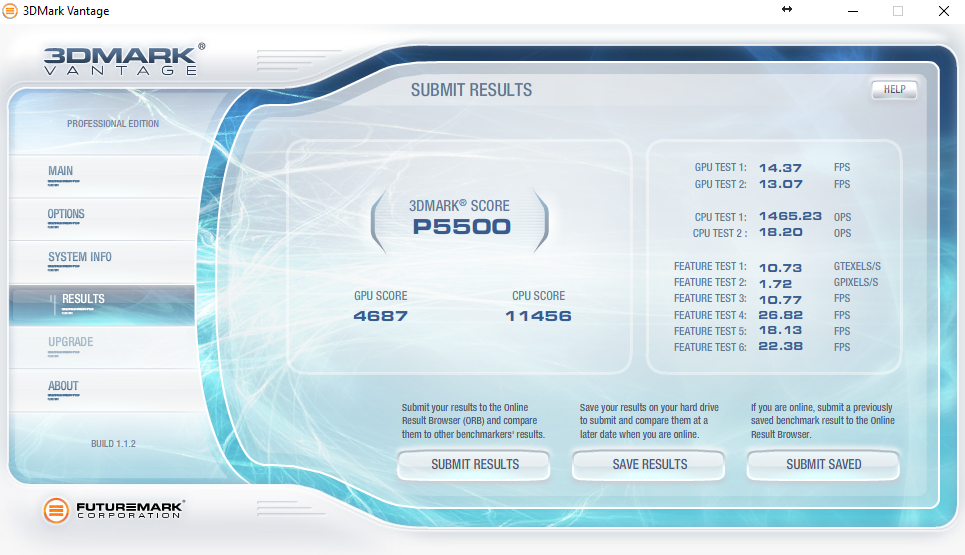
| 3DMark Vantage P Result | 5500 points | |
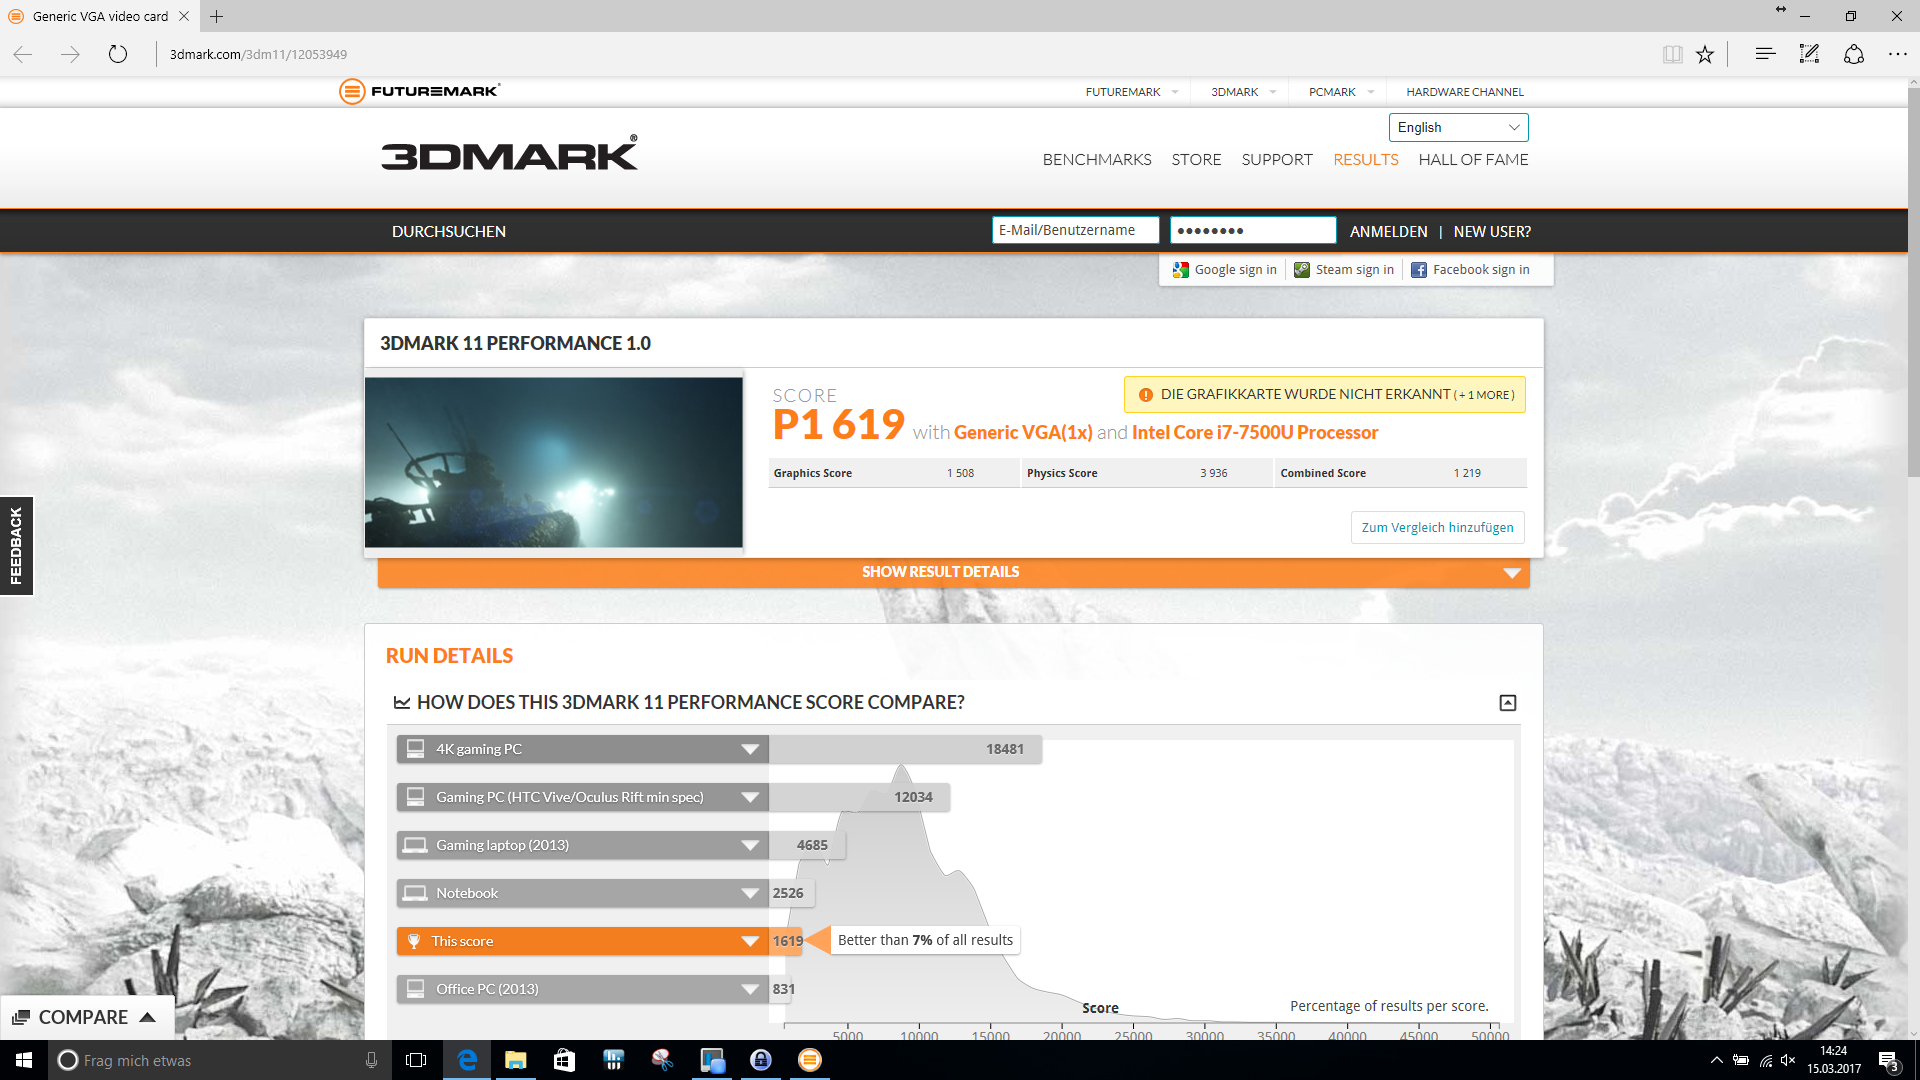
| 3DMark 11 Performance | 1619 points | |
Help | ||
| low | med. | high | ultra | |
|---|---|---|---|---|
| BioShock Infinite (2013) | 44 | 25 | 21 | 6 |
| Battlefield 4 (2013) | 33 | 26 | 17 | 6 |
| The Witcher 3 (2015) | 13 | 10 | 5 | |
| Rise of the Tomb Raider (2016) | 15 | 9 | 6 |
Noise level
| Idle |
| 29.1 / 29.1 / 29.1 dB(A) |
| Load |
| 31.9 / 31.9 dB(A) |
 | ||
30 dB silent 40 dB(A) audible 50 dB(A) loud |
||
min: | ||
| Lenovo ThinkPad 13-20J2S00G00 i7-7500U, HD Graphics 620 | Lenovo ThinkPad 13-20GKS01100 6200U, HD Graphics 520 | HP ProBook 430 G4-Y8B47EA i7-7500U, HD Graphics 620 | Asus Zenbook UX310UA-FC347T iGP i7-7500U, HD Graphics 620 | Dell XPS 13 9360 FHD i5 i5-7200U, HD Graphics 620 | |
|---|---|---|---|---|---|
| Noise | -1% | -3% | -7% | 0% | |
| off / environment * (dB) | 29.1 | 29.1 -0% | 29.1 -0% | 30.7 -5% | |
| Idle Minimum * (dB) | 29.1 | 29.1 -0% | 29.1 -0% | 30.9 -6% | 28.9 1% |
| Idle Average * (dB) | 29.1 | 29.1 -0% | 29.1 -0% | 30.9 -6% | 28.9 1% |
| Idle Maximum * (dB) | 29.1 | 29.1 -0% | 29.1 -0% | 30.9 -6% | 28.9 1% |
| Load Average * (dB) | 31.9 | 31.5 1% | 33.4 -5% | 35.6 -12% | 30.9 3% |
| Load Maximum * (dB) | 31.9 | 33.5 -5% | 36 -13% | 34.1 -7% | 33.5 -5% |
* ... smaller is better
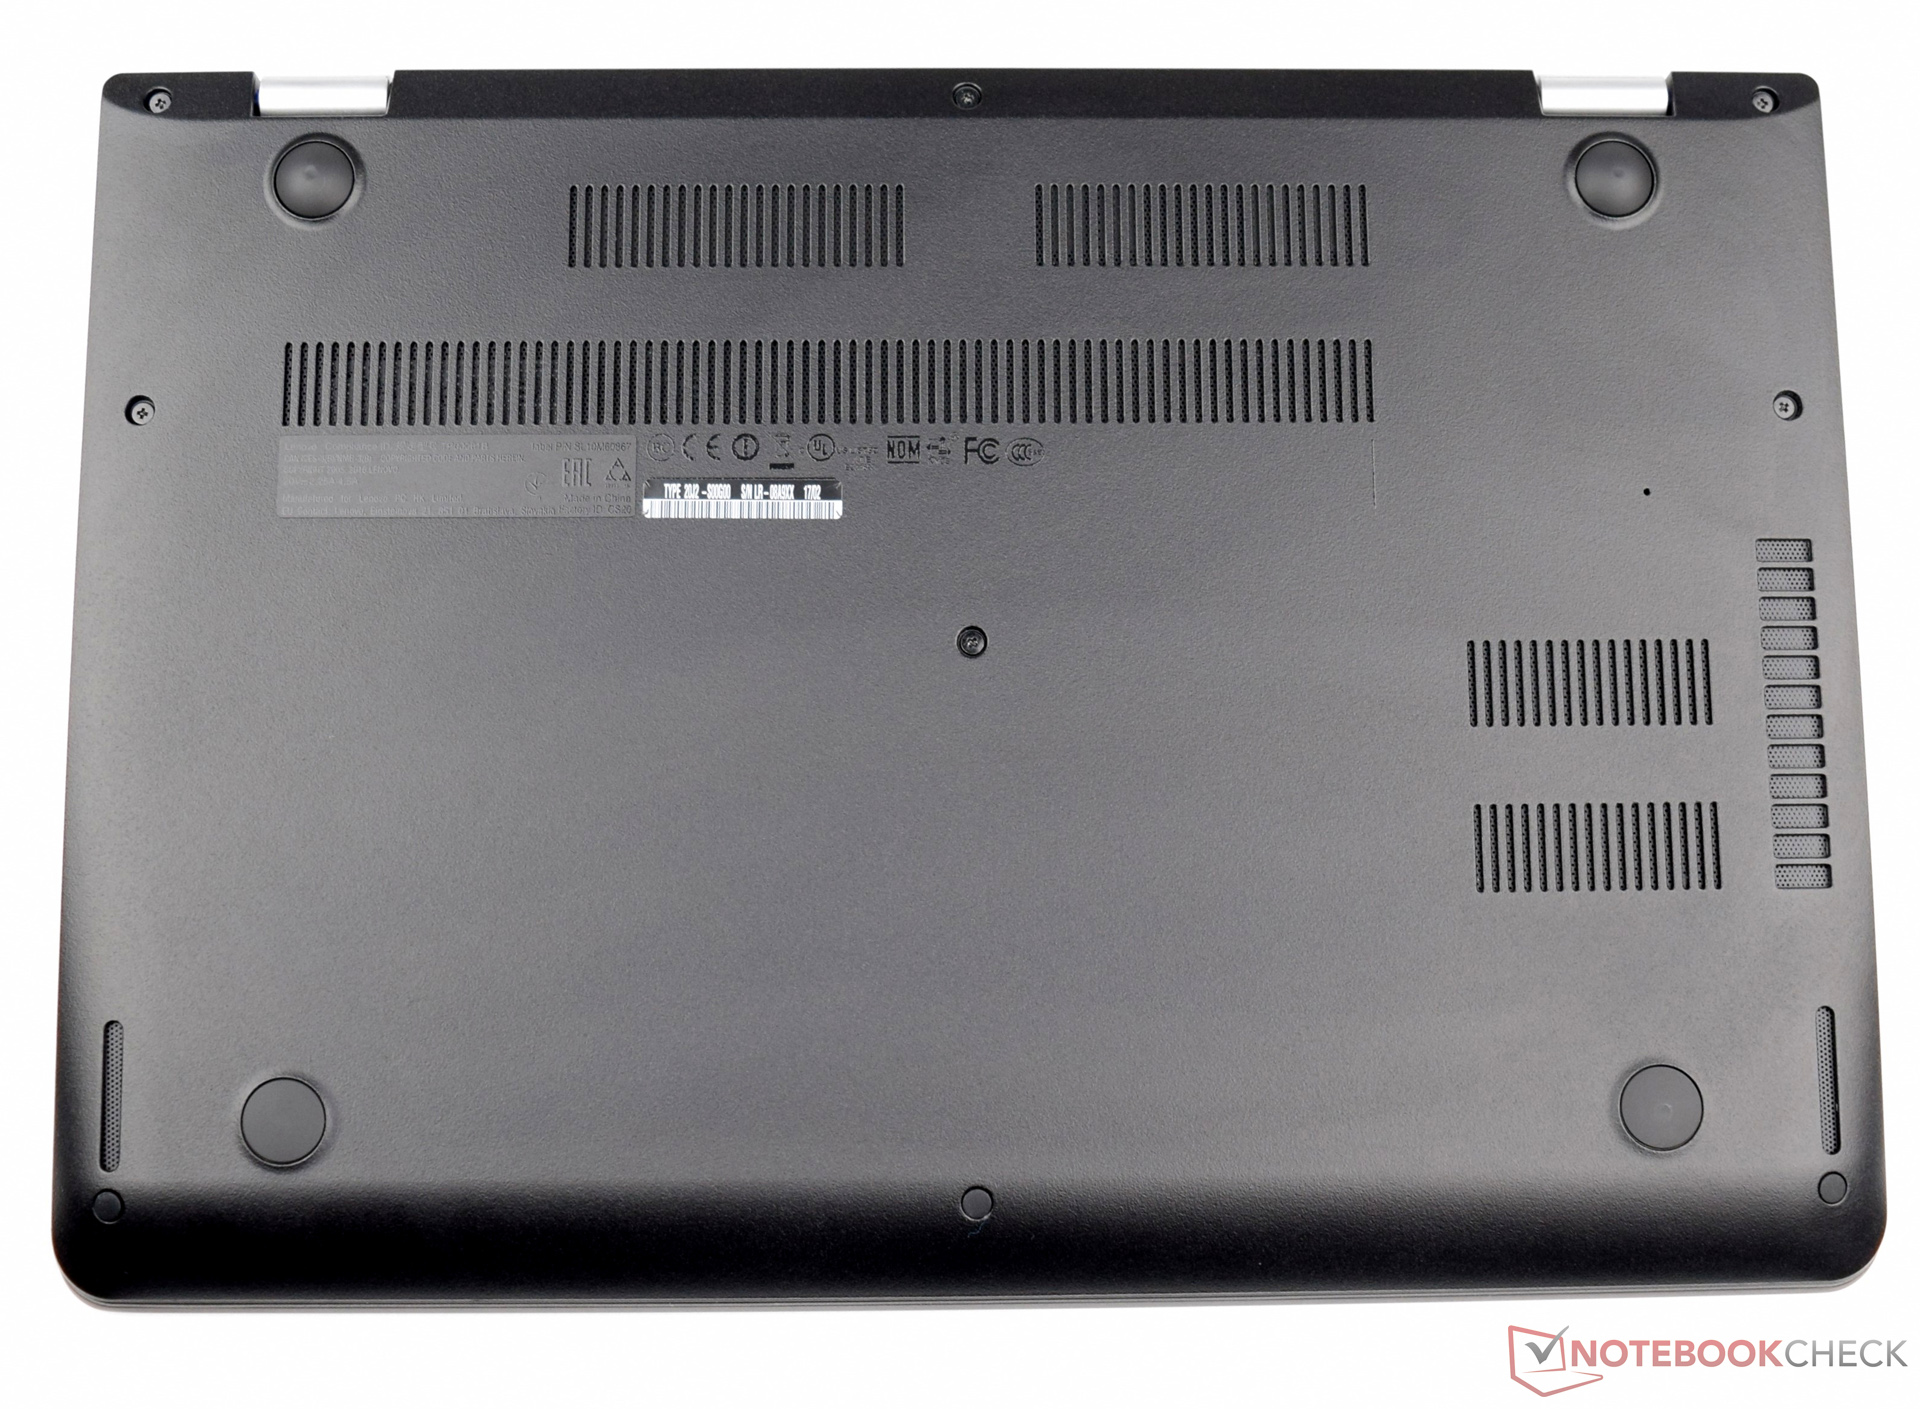
(±) The maximum temperature on the upper side is 44.7 °C / 112 F, compared to the average of 34.3 °C / 94 F, ranging from 21.2 to 62.5 °C for the class Office.
(-) The bottom heats up to a maximum of 54.7 °C / 130 F, compared to the average of 36.8 °C / 98 F
(+) In idle usage, the average temperature for the upper side is 23.5 °C / 74 F, compared to the device average of 29.5 °C / 85 F.
(±) The palmrests and touchpad can get very hot to the touch with a maximum of 39.8 °C / 103.6 F.
(-) The average temperature of the palmrest area of similar devices was 27.5 °C / 81.5 F (-12.3 °C / -22.1 F).
| Lenovo ThinkPad 13-20J2S00G00 i7-7500U, HD Graphics 620 | Lenovo ThinkPad 13-20GKS01100 6200U, HD Graphics 520 | HP ProBook 430 G4-Y8B47EA i7-7500U, HD Graphics 620 | Asus Zenbook UX310UA-FC347T iGP i7-7500U, HD Graphics 620 | Dell XPS 13 9360 FHD i5 i5-7200U, HD Graphics 620 | |
|---|---|---|---|---|---|
| Heat | -9% | -0% | 16% | 0% | |
| Maximum Upper Side * (°C) | 44.7 | 43.7 2% | 38.7 13% | 33.7 25% | 43.4 3% |
| Maximum Bottom * (°C) | 54.7 | 44.2 19% | 39.4 28% | 34.1 38% | 49.2 10% |
| Idle Upper Side * (°C) | 24.2 | 31.4 -30% | 29.5 -22% | 25.2 -4% | 26.4 -9% |
| Idle Bottom * (°C) | 25.6 | 32.1 -25% | 30.6 -20% | 24.1 6% | 26.4 -3% |
* ... smaller is better
Lenovo ThinkPad 13-20J2S00G00 audio analysis
(±) | speaker loudness is average but good (74.1 dB)
Bass 100 - 315 Hz
(-) | nearly no bass - on average 16.3% lower than median
(±) | linearity of bass is average (11.1% delta to prev. frequency)
Mids 400 - 2000 Hz
(±) | higher mids - on average 6.2% higher than median
(±) | linearity of mids is average (8.8% delta to prev. frequency)
Highs 2 - 16 kHz
(+) | balanced highs - only 2% away from median
(+) | highs are linear (6.9% delta to prev. frequency)
Overall 100 - 16.000 Hz
(±) | linearity of overall sound is average (21.3% difference to median)
Compared to same class
» 52% of all tested devices in this class were better, 9% similar, 39% worse
» The best had a delta of 7%, average was 21%, worst was 53%
Compared to all devices tested
» 59% of all tested devices were better, 7% similar, 33% worse
» The best had a delta of 4%, average was 23%, worst was 134%
HP ProBook 430 G4-Y8B47EA audio analysis
(+) | speakers can play relatively loud (84.6 dB)
Bass 100 - 315 Hz
(-) | nearly no bass - on average 19.7% lower than median
(±) | linearity of bass is average (13.1% delta to prev. frequency)
Mids 400 - 2000 Hz
(+) | balanced mids - only 3.8% away from median
(+) | mids are linear (6.8% delta to prev. frequency)
Highs 2 - 16 kHz
(±) | higher highs - on average 5.7% higher than median
(+) | highs are linear (5.4% delta to prev. frequency)
Overall 100 - 16.000 Hz
(±) | linearity of overall sound is average (18.9% difference to median)
Compared to same class
» 35% of all tested devices in this class were better, 7% similar, 57% worse
» The best had a delta of 7%, average was 21%, worst was 53%
Compared to all devices tested
» 44% of all tested devices were better, 8% similar, 48% worse
» The best had a delta of 4%, average was 23%, worst was 134%
| Off / Standby | |
| Idle | |
| Load |
|
Key:
min: | |
| Lenovo ThinkPad 13-20J2S00G00 i7-7500U, HD Graphics 620 | Lenovo ThinkPad 13-20GKS01100 6200U, HD Graphics 520 | HP ProBook 430 G4-Y8B47EA i7-7500U, HD Graphics 620 | Asus Zenbook UX310UA-FC347T iGP i7-7500U, HD Graphics 620 | Dell XPS 13 9360 FHD i5 i5-7200U, HD Graphics 620 | |
|---|---|---|---|---|---|
| Power Consumption | 8% | -14% | -12% | 13% | |
| Idle Minimum * (Watt) | 3.16 | 3.1 2% | 4.2 -33% | 3.5 -11% | 4.1 -30% |
| Idle Average * (Watt) | 5.9 | 5.5 7% | 6.5 -10% | 6.6 -12% | 4.2 29% |
| Idle Maximum * (Watt) | 6.5 | 6 8% | 7.2 -11% | 7.5 -15% | 5.1 22% |
| Load Average * (Watt) | 30.6 | 25.8 16% | 28.7 6% | 34.7 -13% | 22.1 28% |
| Load Maximum * (Watt) | 35.8 | 33.6 6% | 43.5 -22% | 39.6 -11% | 29.4 18% |
* ... smaller is better
| Lenovo ThinkPad 13-20J2S00G00 i7-7500U, HD Graphics 620, 42 Wh | Lenovo ThinkPad 13-20GKS01100 6200U, HD Graphics 520, 42 Wh | HP ProBook 430 G4-Y8B47EA i7-7500U, HD Graphics 620, 48 Wh | Asus Zenbook UX310UA-FC347T iGP i7-7500U, HD Graphics 620, 48 Wh | Dell XPS 13 9360 FHD i5 i5-7200U, HD Graphics 620, 60 Wh | |
|---|---|---|---|---|---|
| Battery runtime | 22% | 41% | 25% | 57% | |
| Reader / Idle (h) | 15.1 | 15.7 4% | 15.9 5% | 16.1 7% | 21.6 43% |
| H.264 (h) | 5.2 | 7.8 50% | 8.7 67% | 6.9 33% | |
| WiFi v1.3 (h) | 7.9 | 6.2 -22% | 7.2 -9% | 9.6 22% | 11.3 43% |
| Load (h) | 1.4 | 2.2 57% | 2.8 100% | 1.9 36% | 2.6 86% |
Pros
Cons

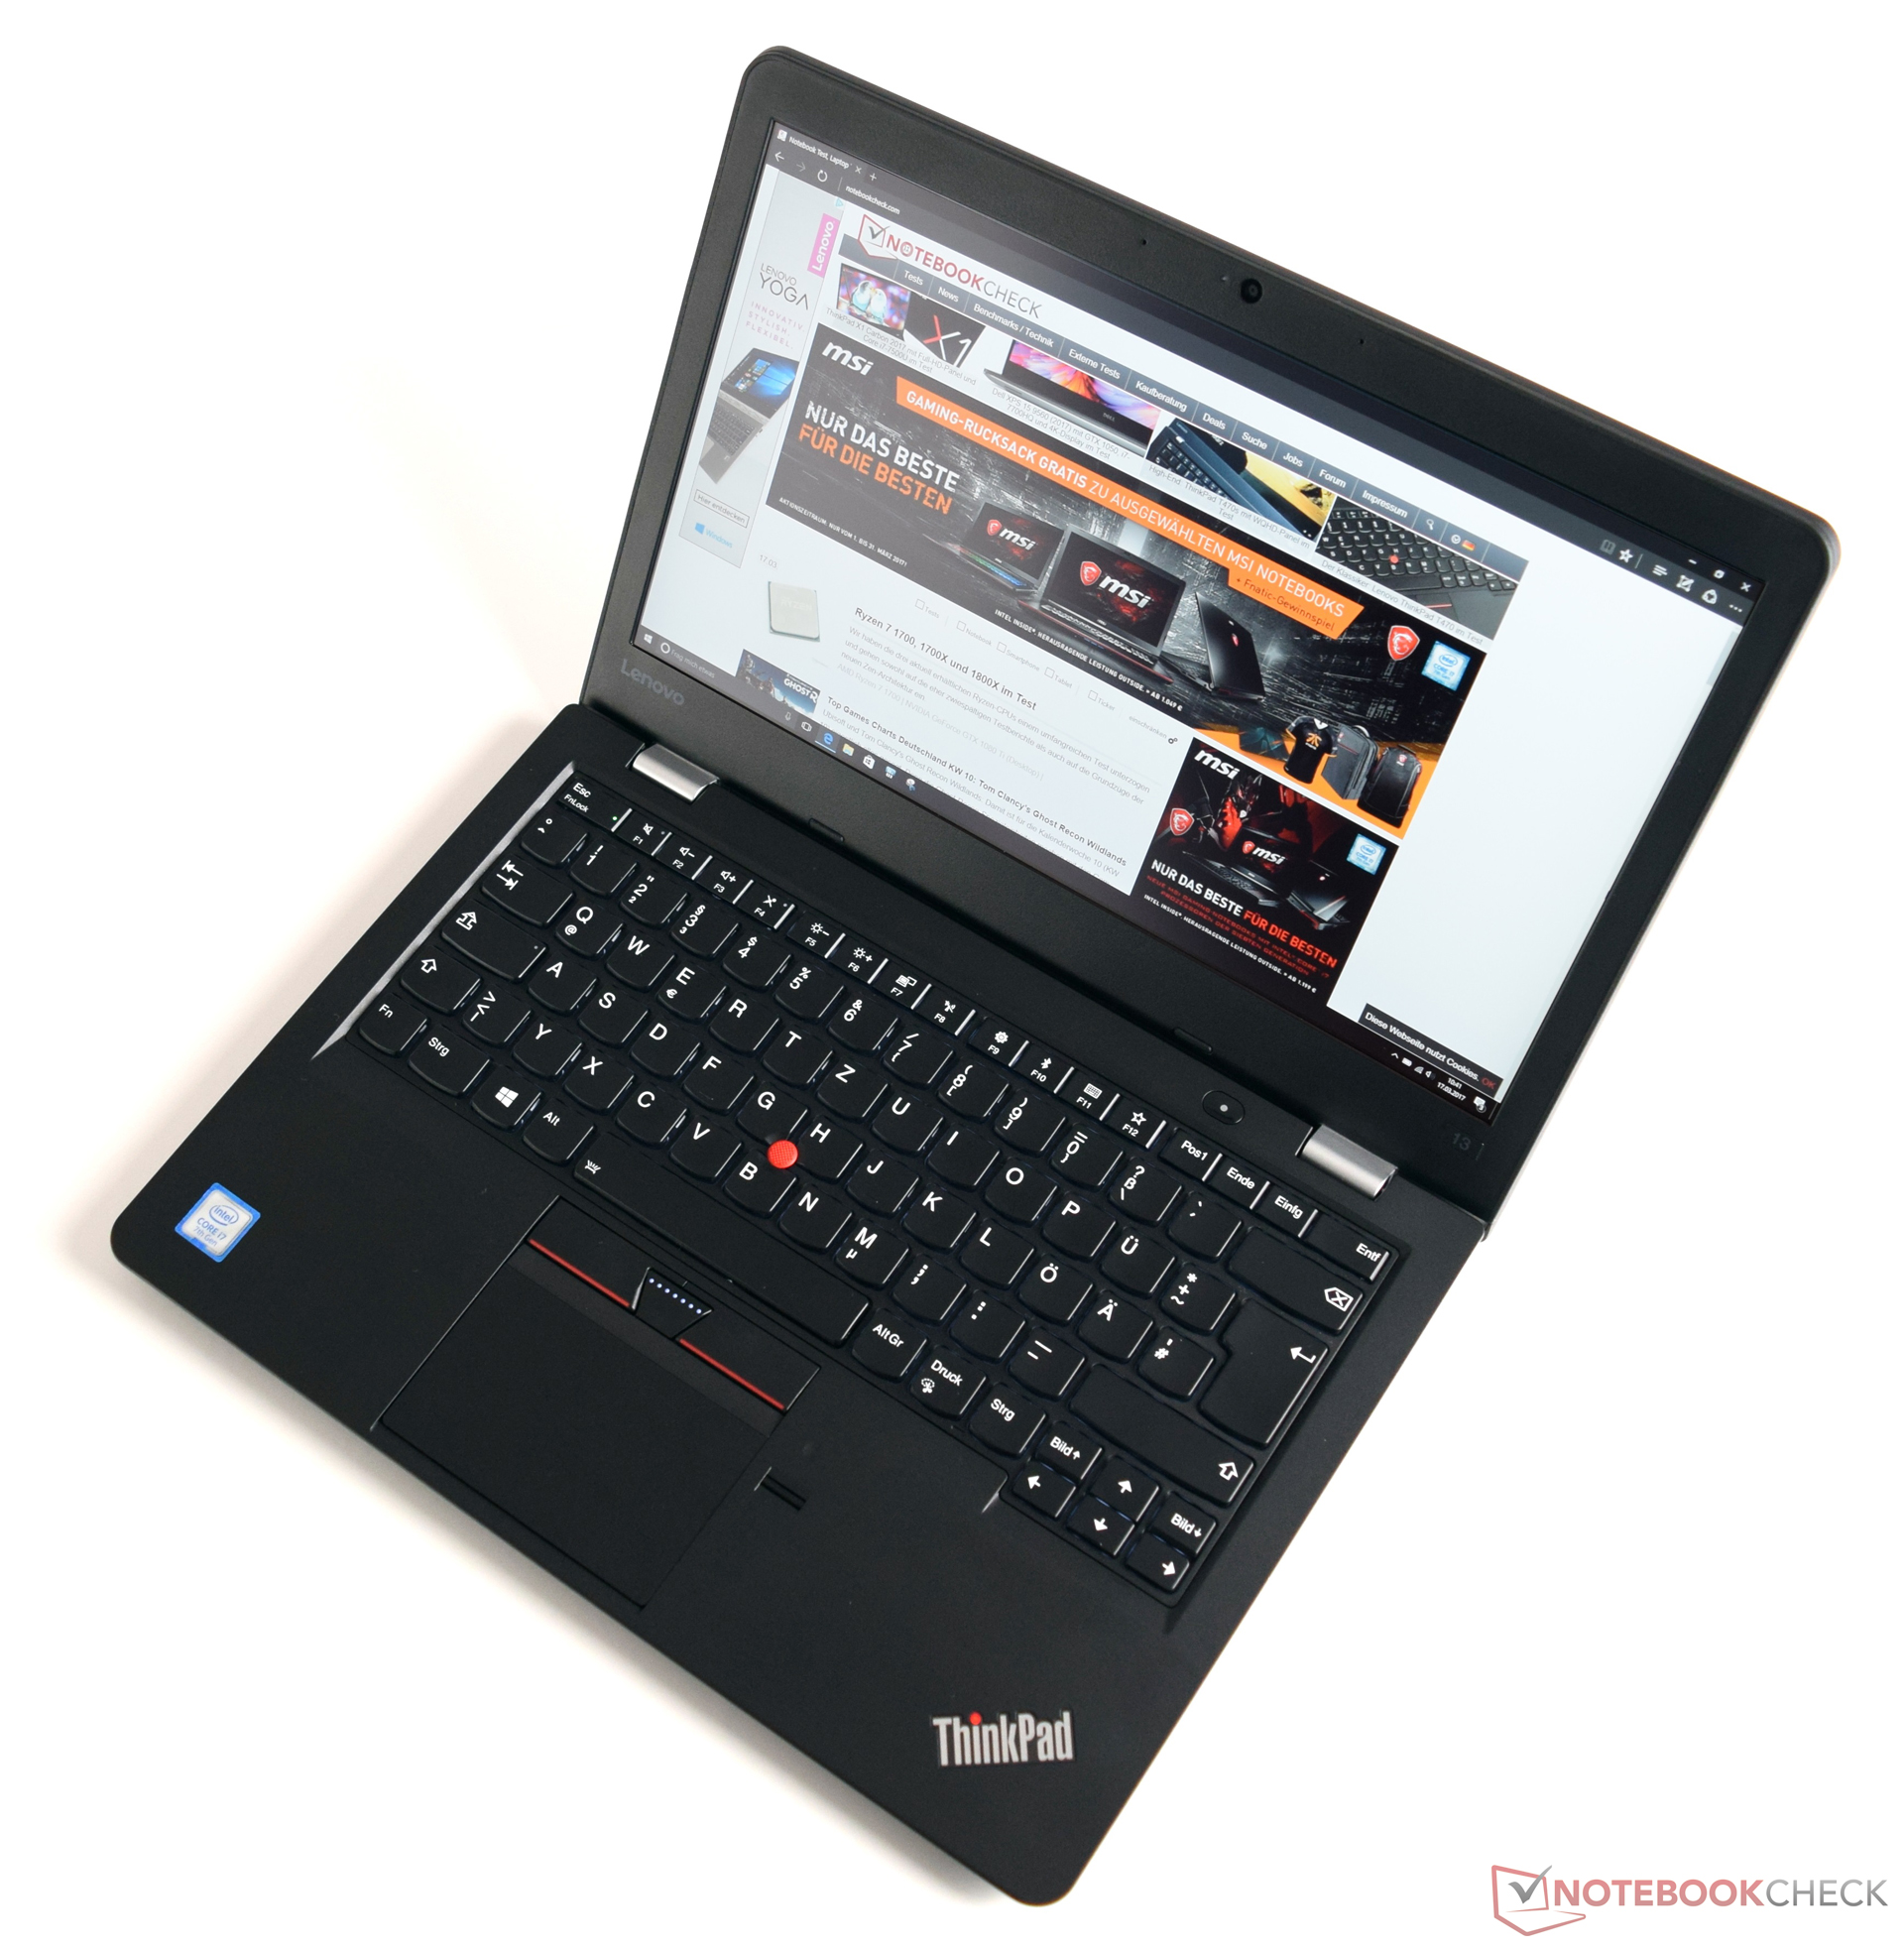
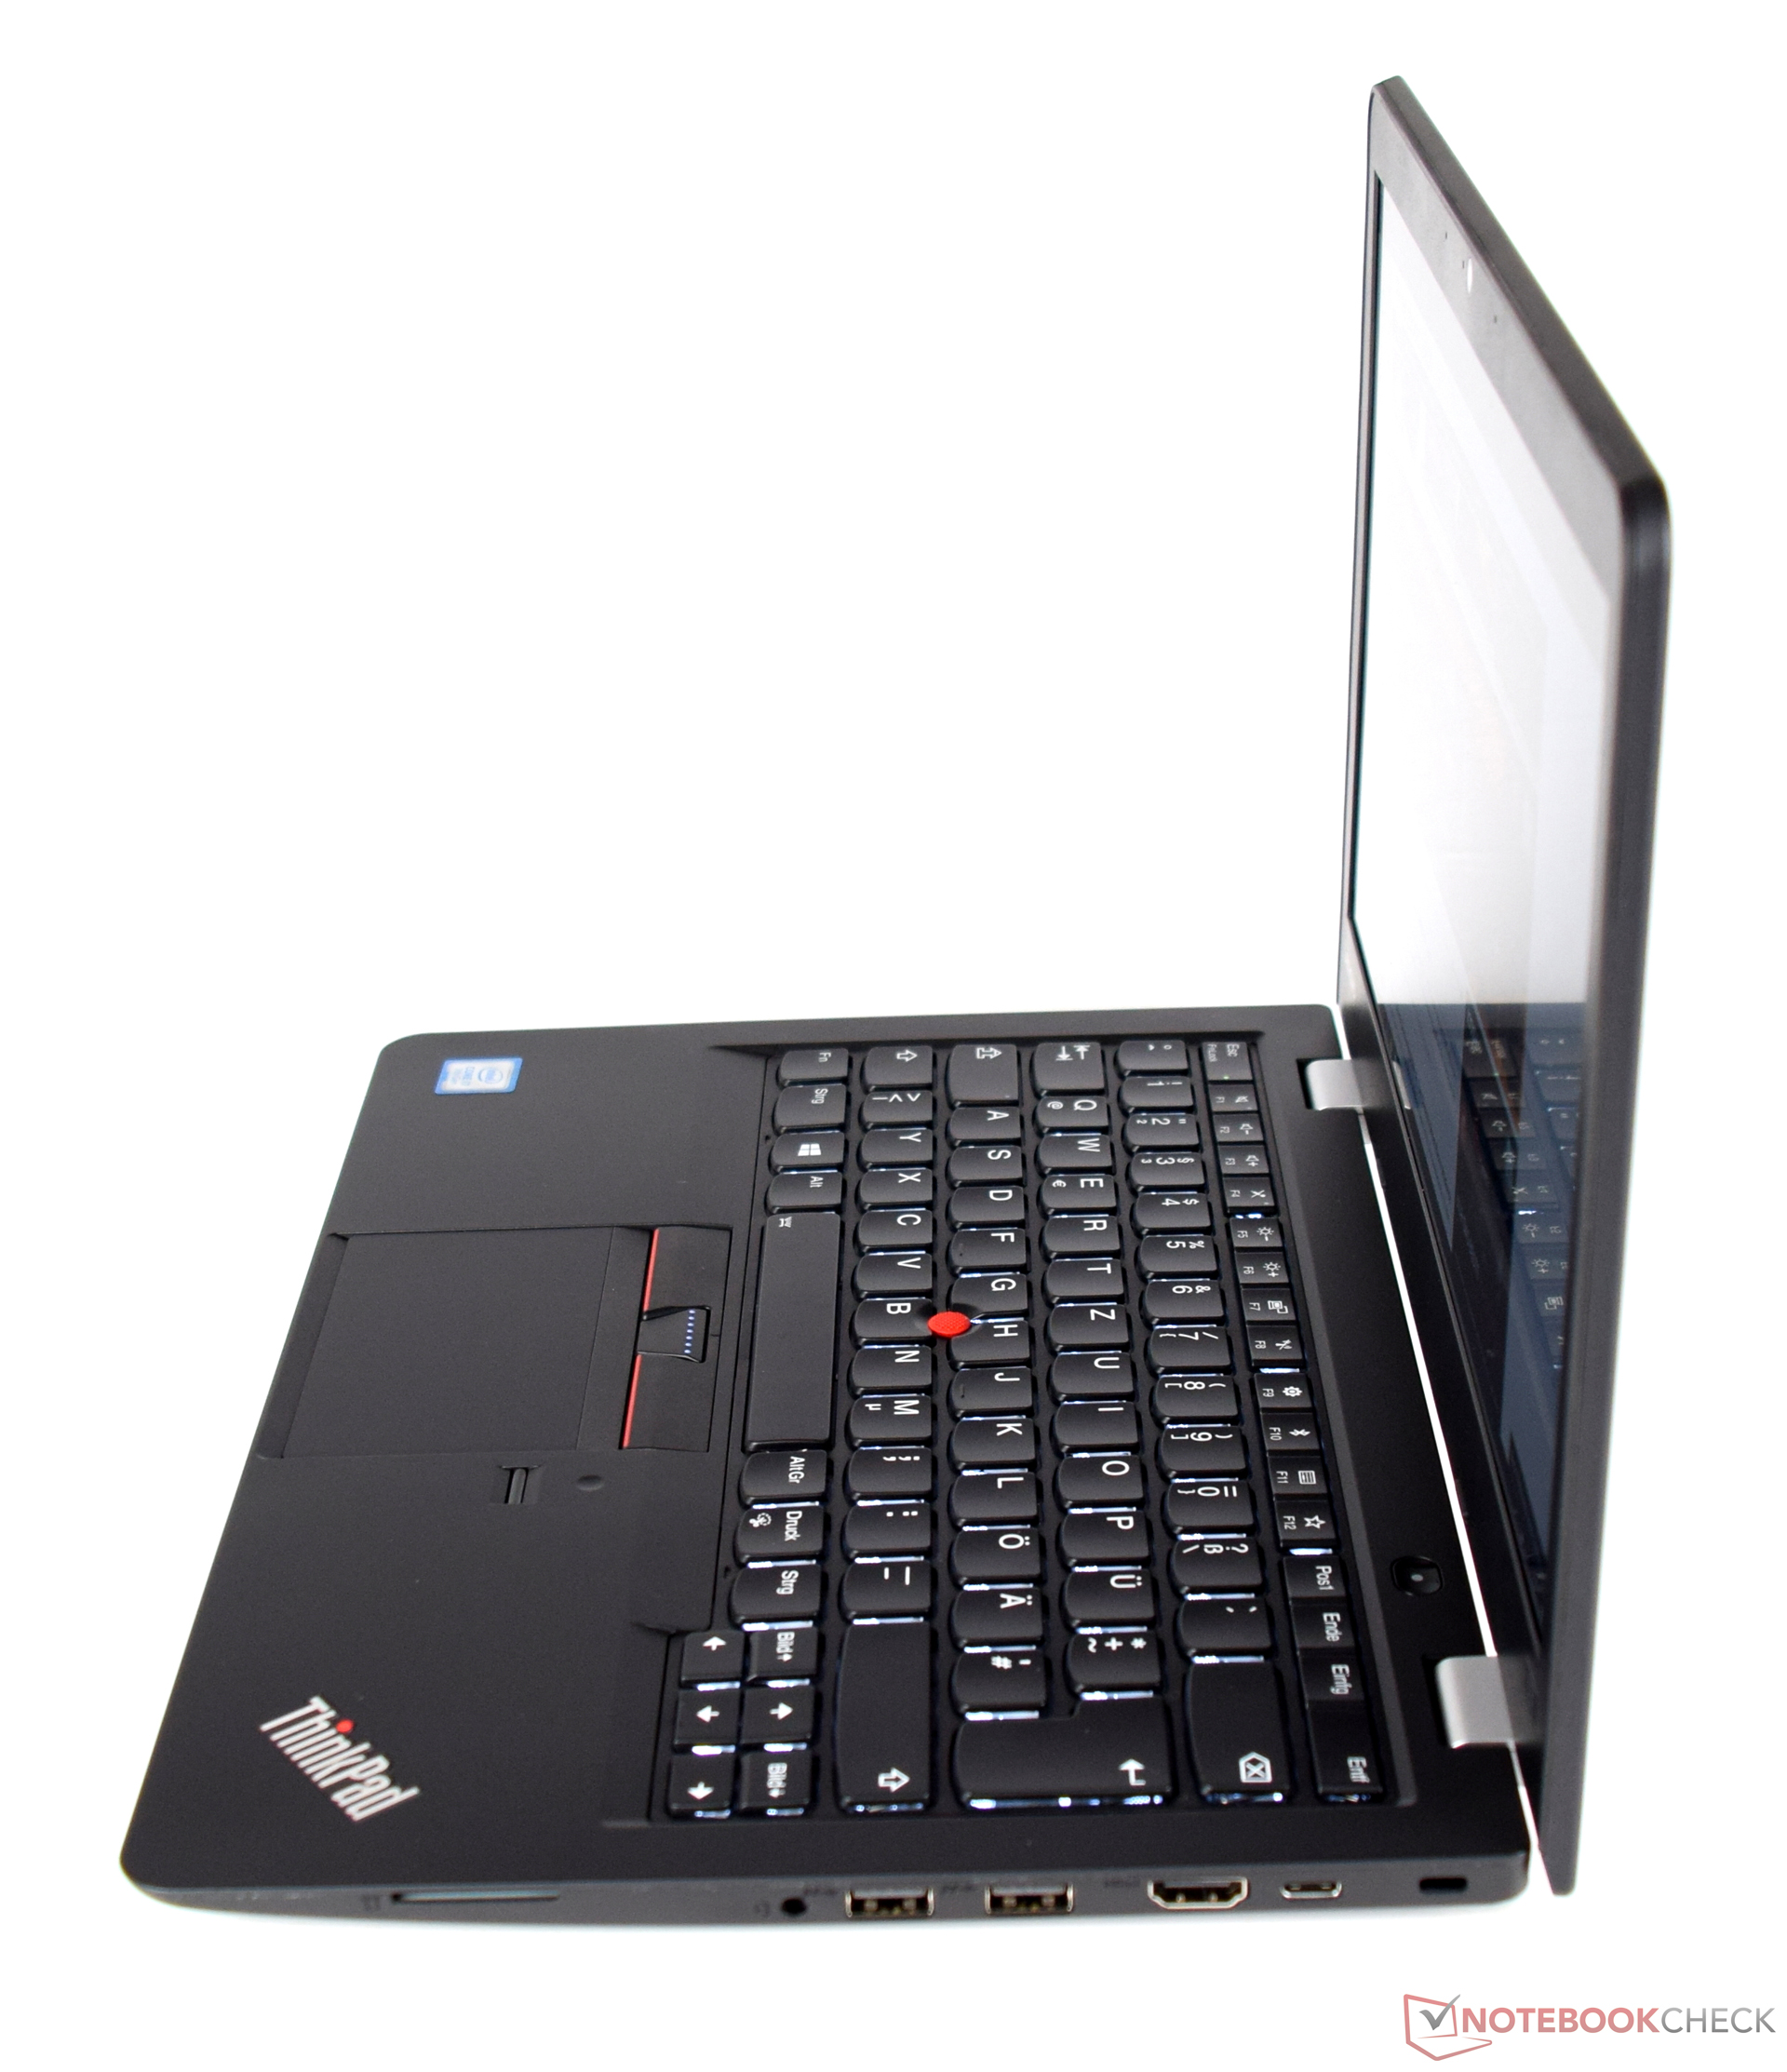
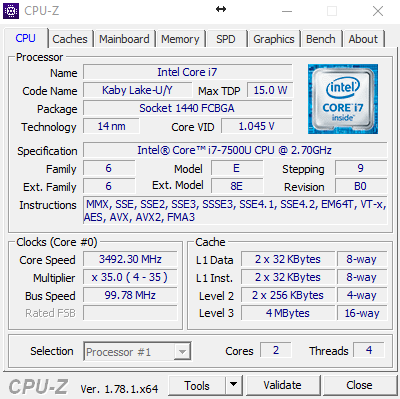
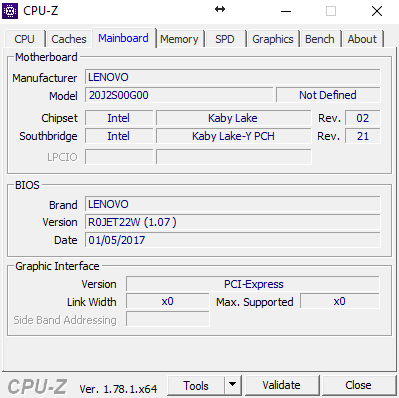
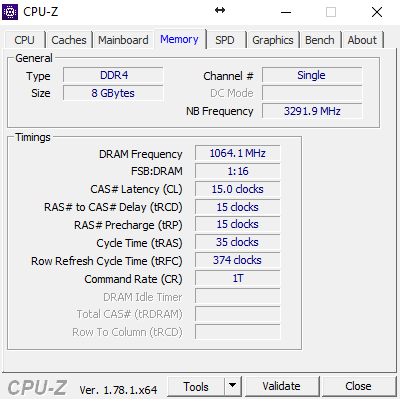
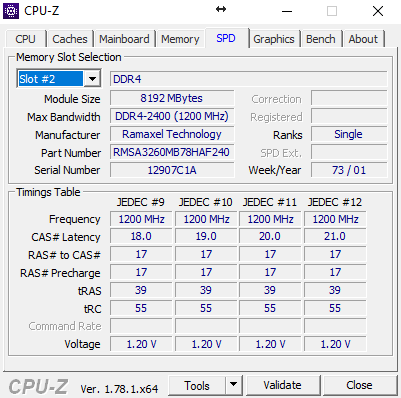
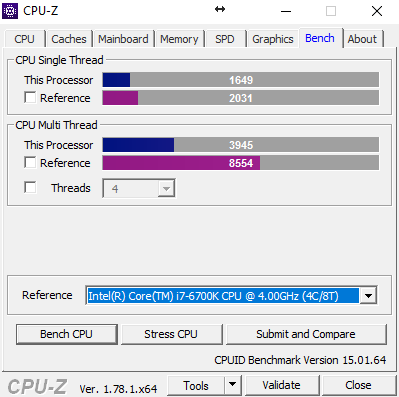
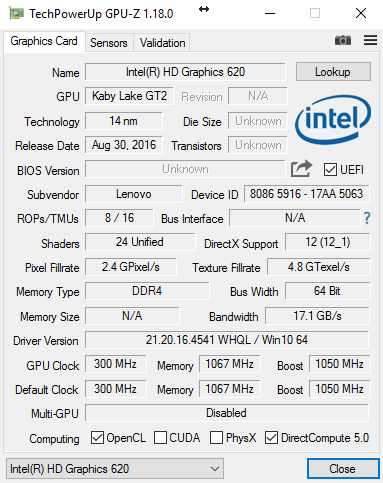
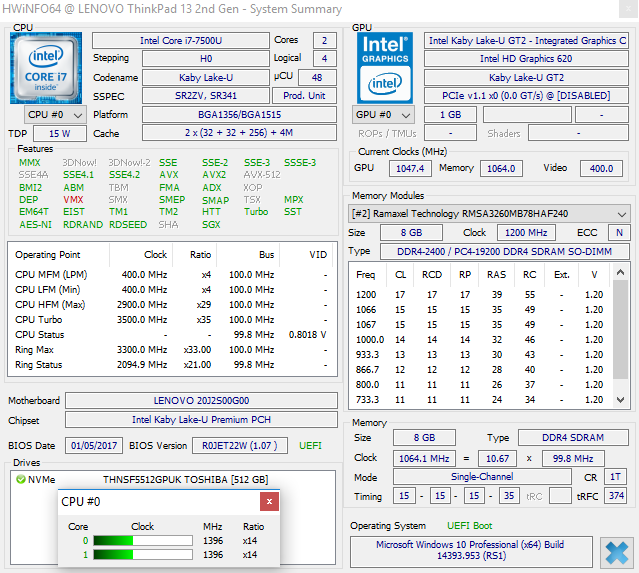
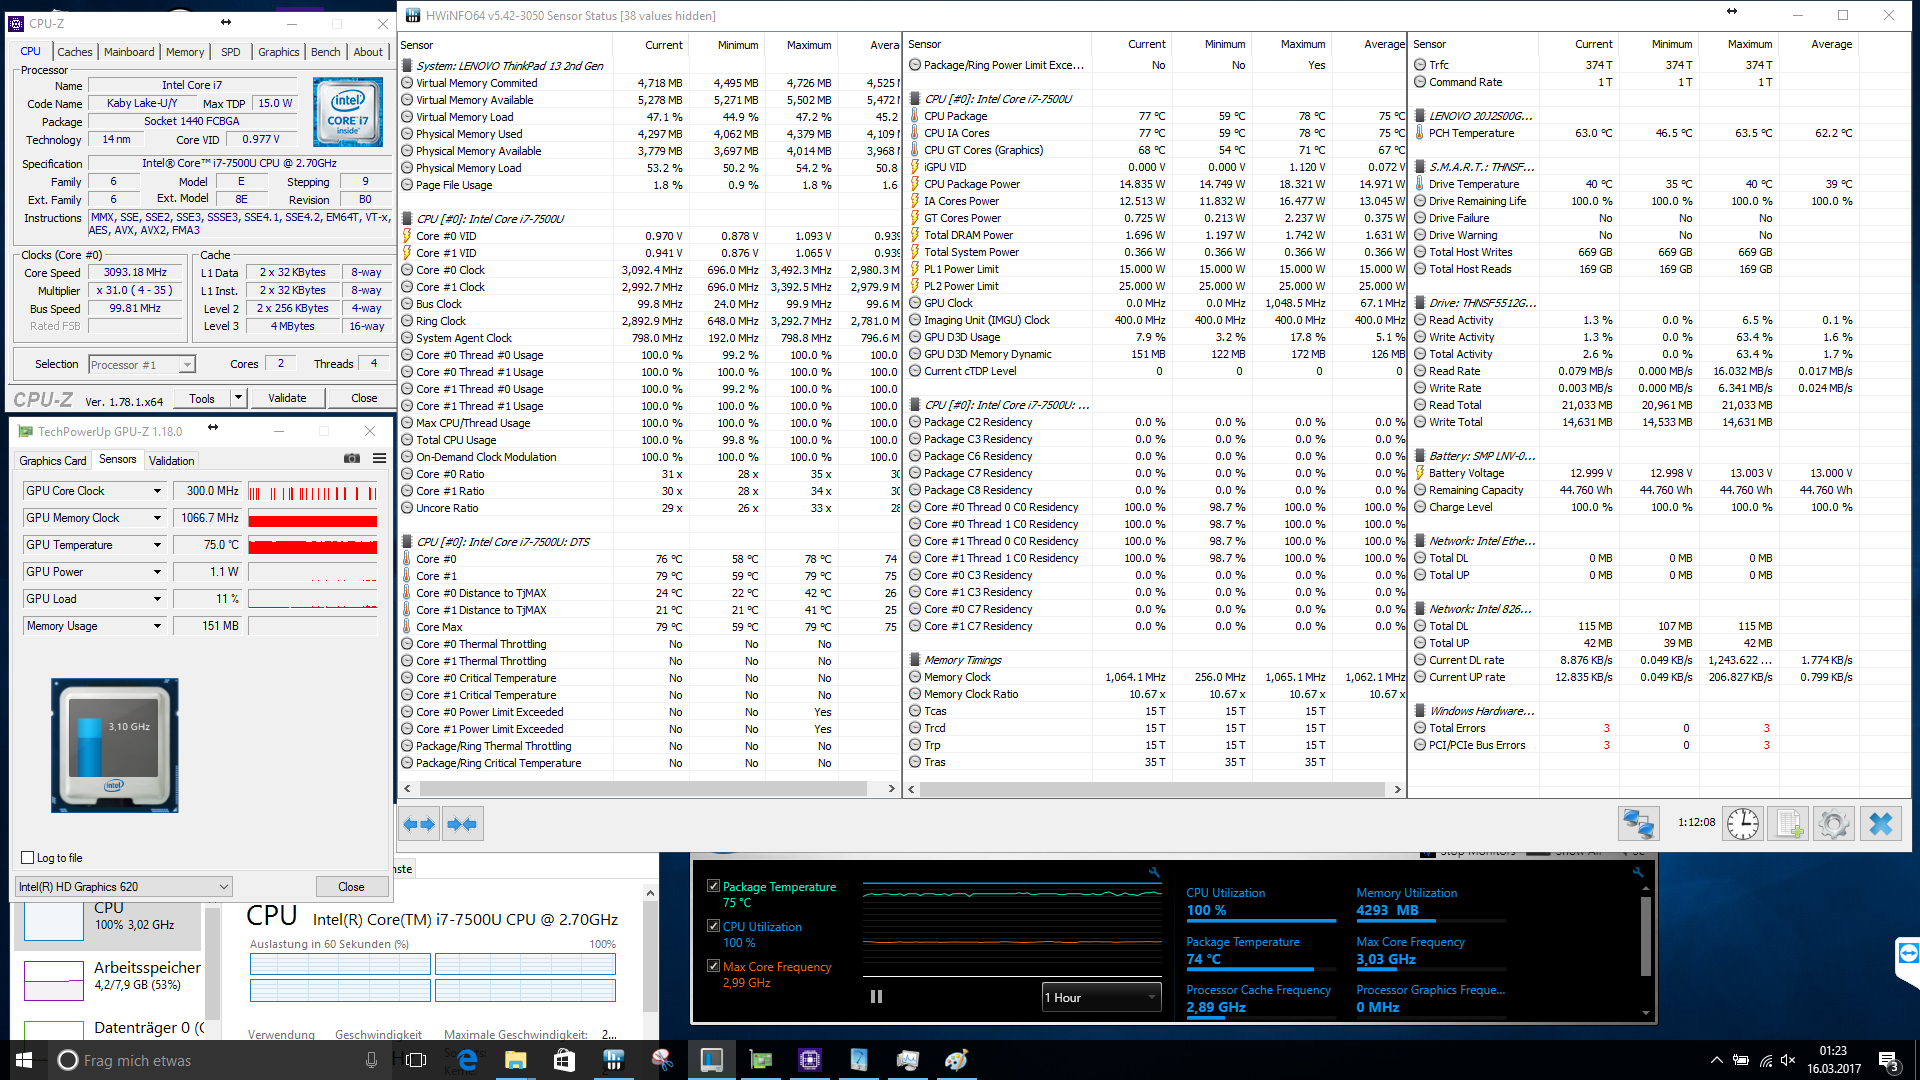
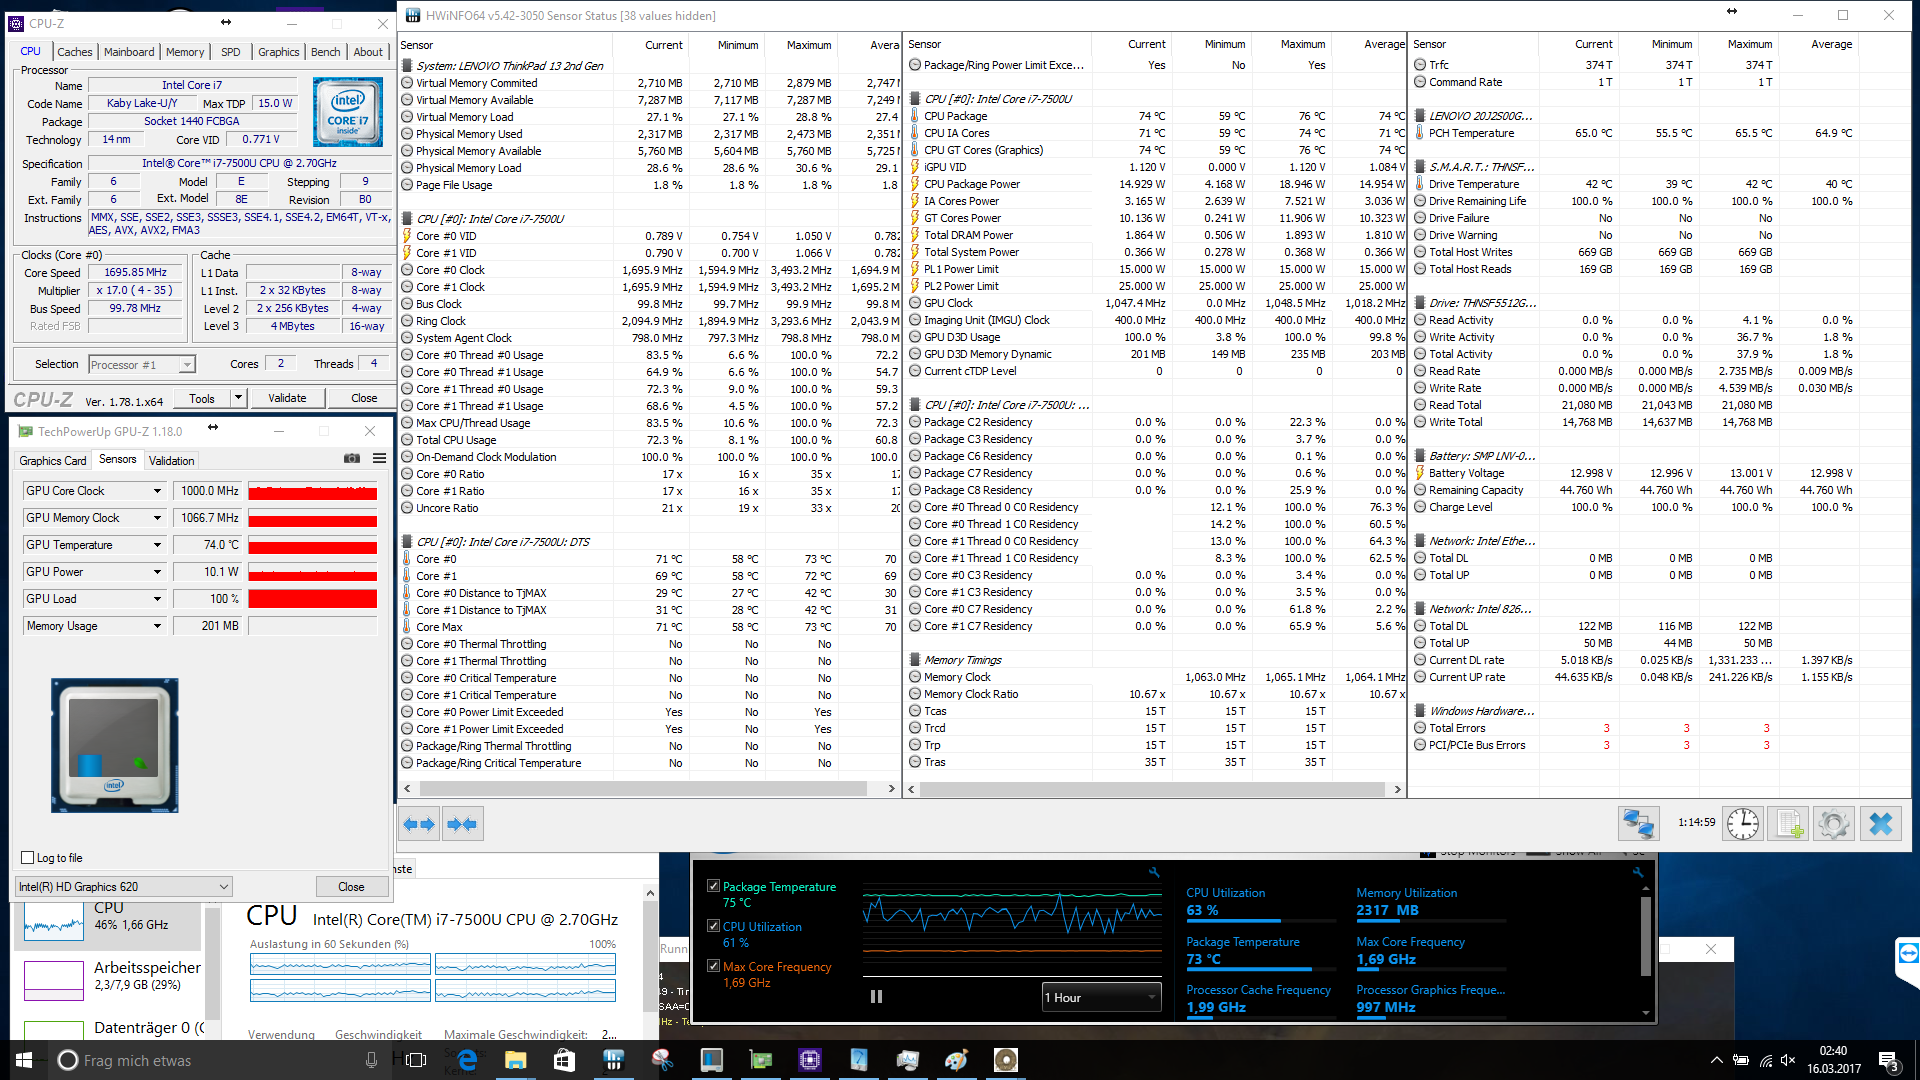
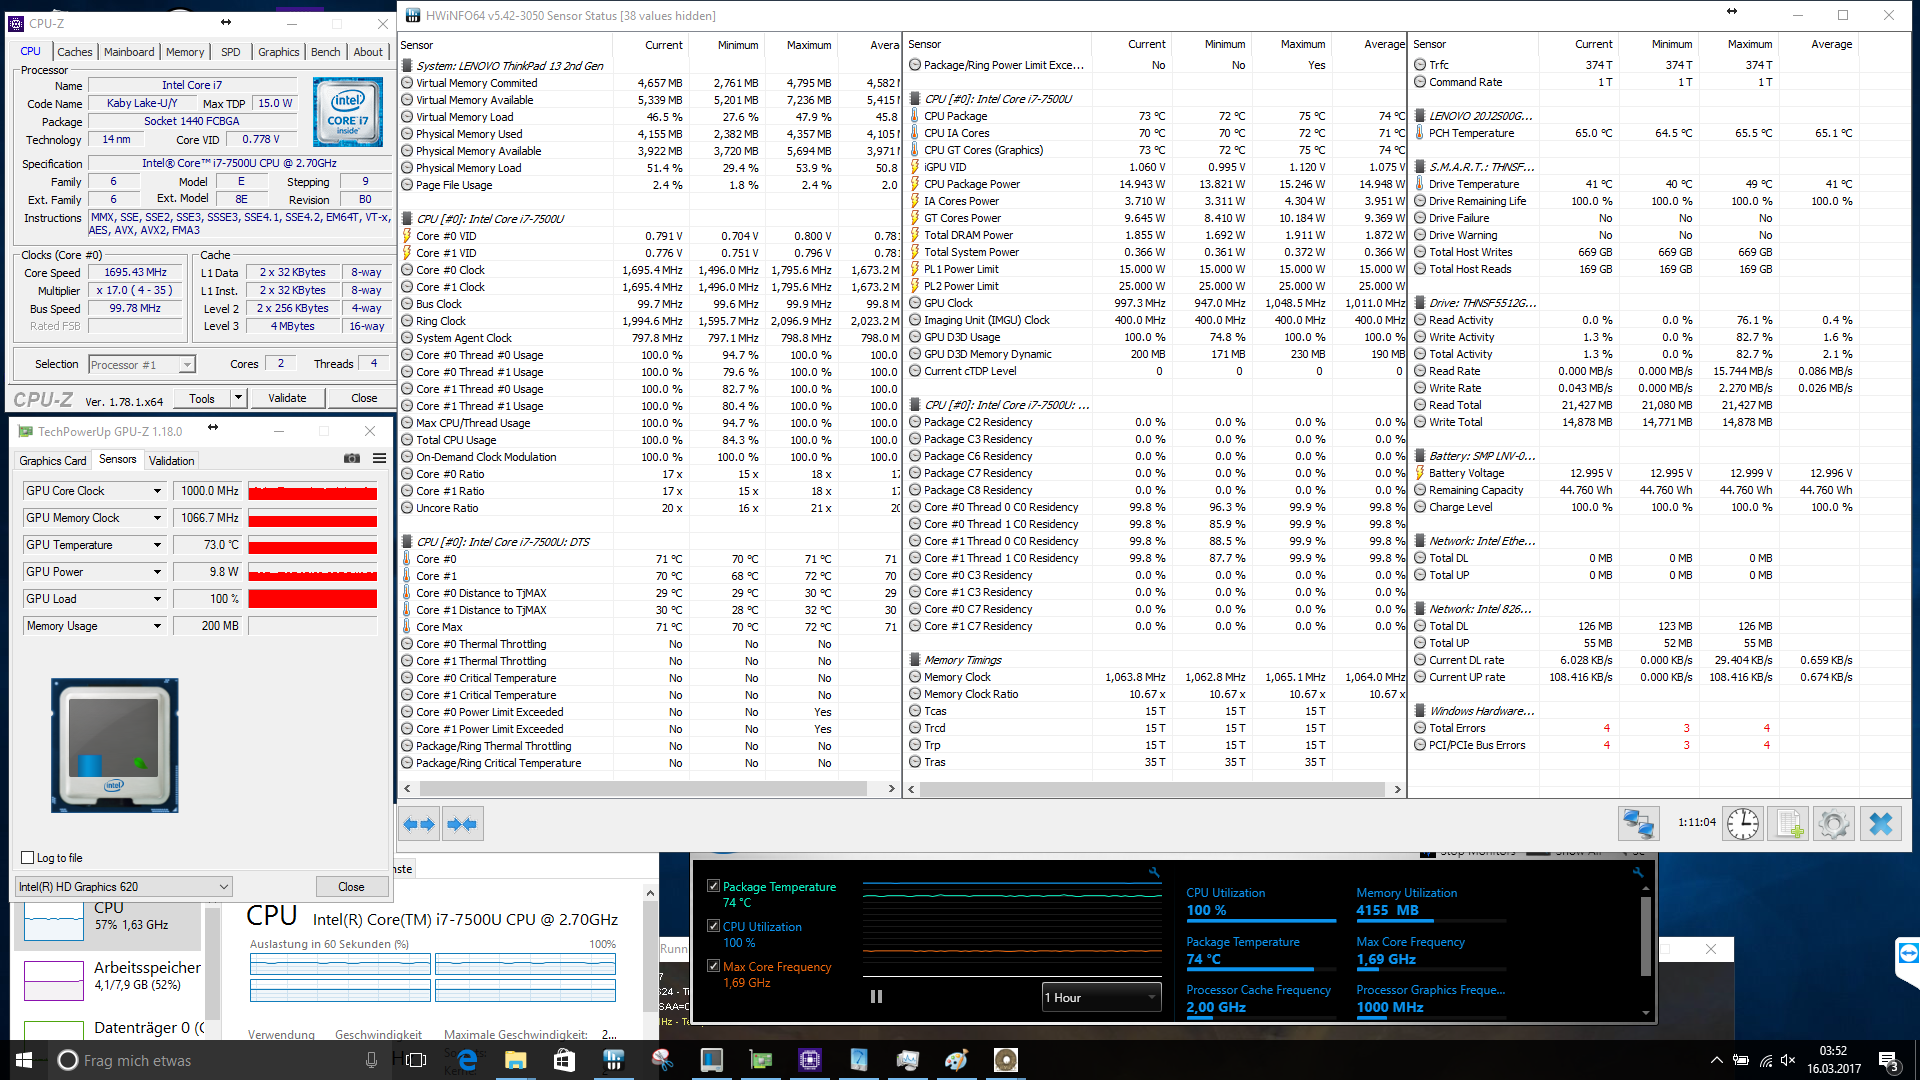
联想ThinkPad 13(2017)是一款的坚实的入门级商务笔记本电脑。该笔电的性能与其1230欧元(约合1329美元)的价格相匹配。买家将获得运行快速的英特尔酷睿 i7-7500U ,即使在高负载(无热节流)下也可以发挥出很大一部分潜力。由于PCIe接口的存在,最新512 GB的固态硬盘可以快速运行。 8 GB的DDR4运行内存足以满足大多数办公程序所需,并且可以在需要时通过第二个模块进行扩展。
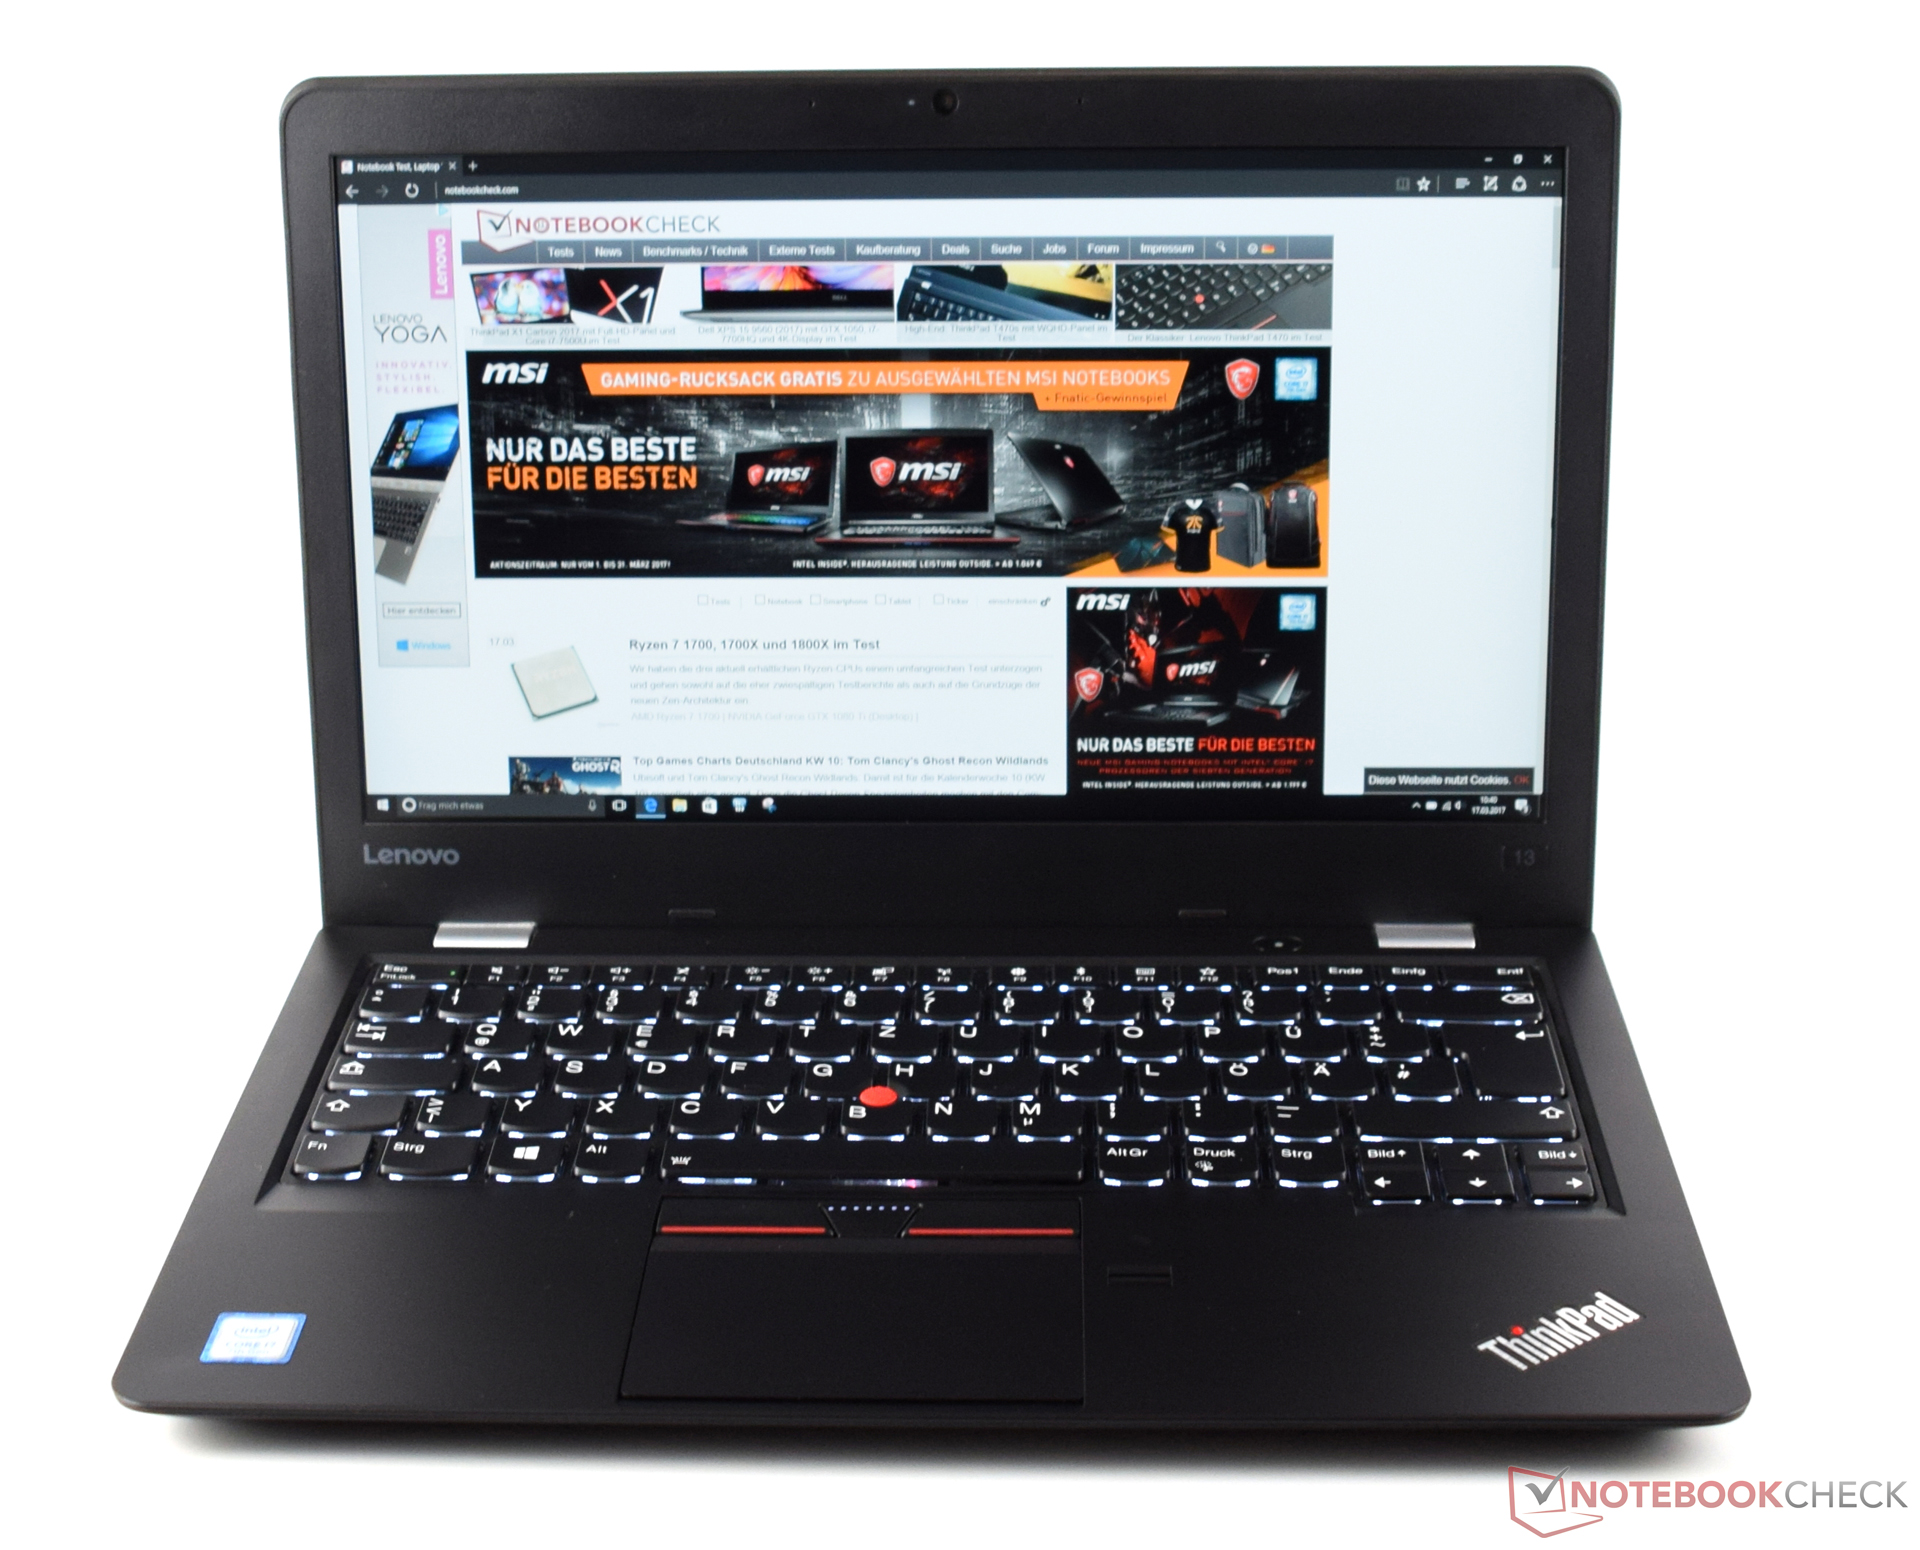
联想ThinkPad 13(2017)主要以其良好的性价比吸引了业界的关注。那些不需要SmartCard读卡器并可以接受12个月保修时间的用户可以留意一下ThinkPad 13的产品线。
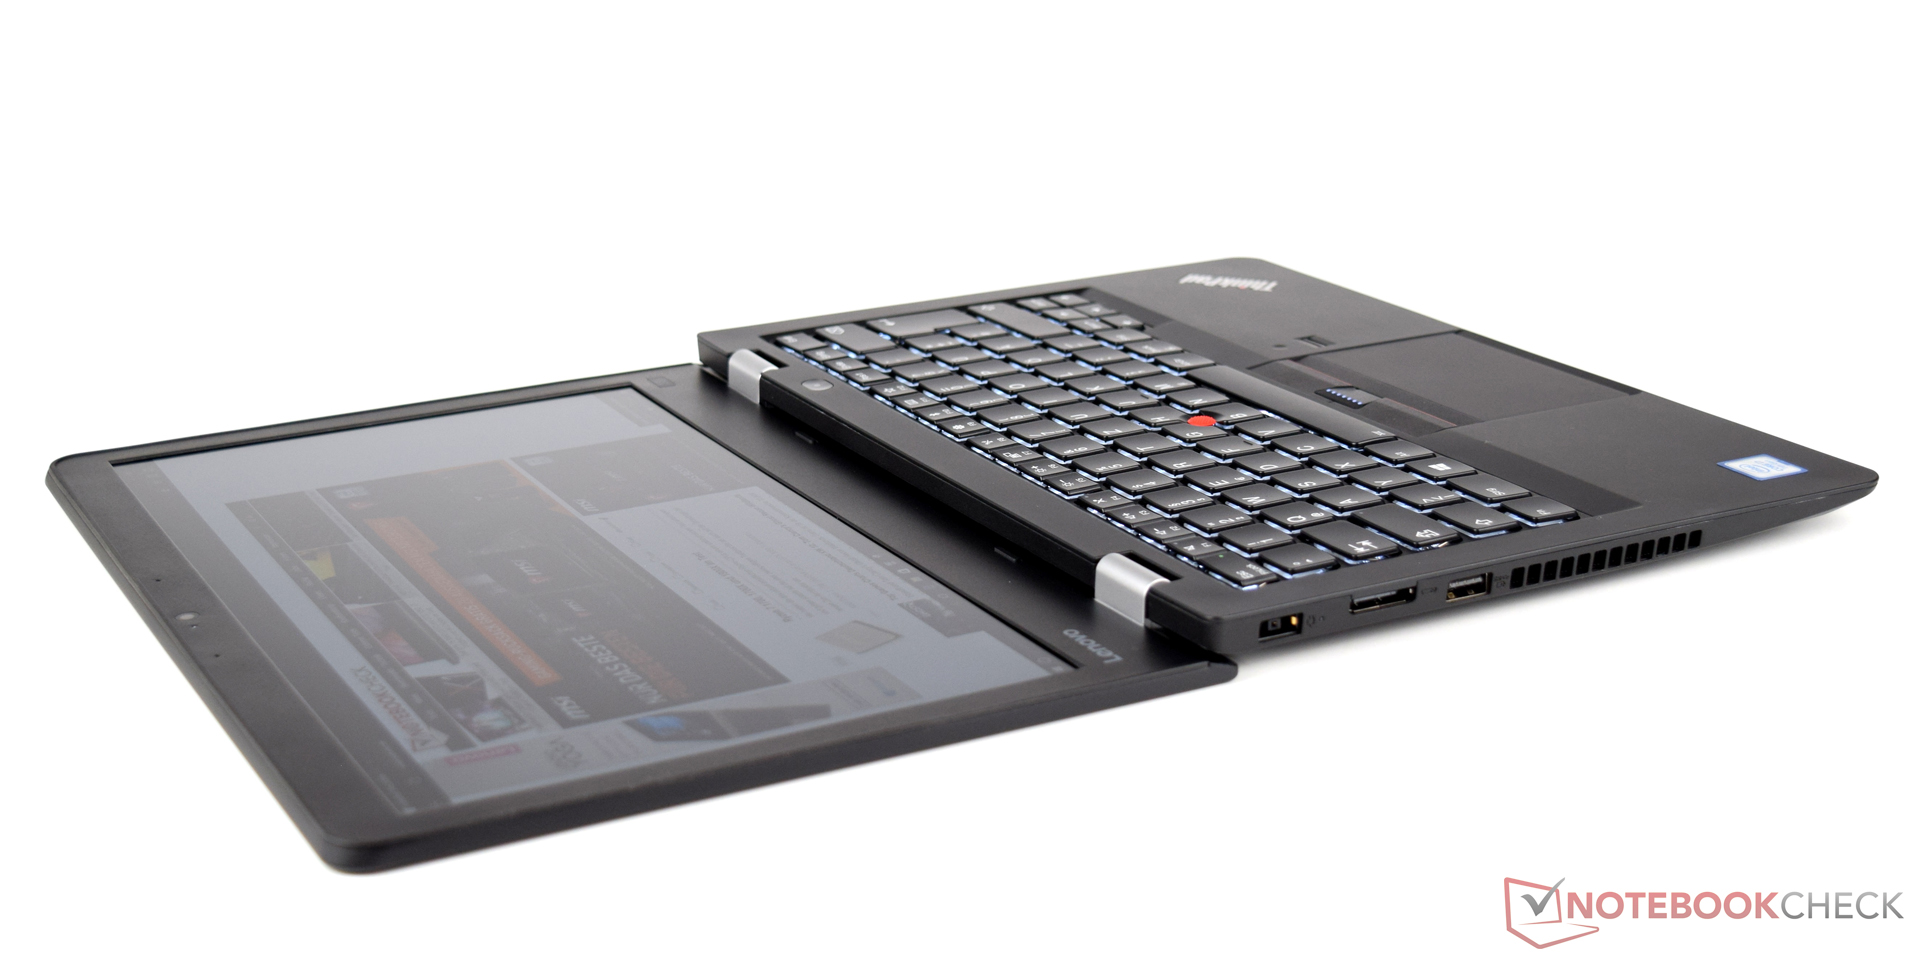
如上所述,SmartCard读卡器选择的缺失可能会导致一些买家放弃该设备。总的来说,我们真的很喜欢联想ThinkPad 13(2017)。笔记本电脑主要靠其优秀的输入设备和良好的整体性能得分。屏幕情况有点复杂,一方面它提供了良好的亮度,另一方面却具有较低的色域。但是,如果将该设备用作为一个可以增加拓展坞的台式机替代品,则这些批评意见不会在购买决定上起作用。
注:本文是基于完整评测的缩减版本,阅读完整的英文评测,请点击这里。
Lenovo ThinkPad 13-20J2S00G00
- 03/20/2017 v6 (old)
Sebastian Bade