Asus VivoBook S15 S510UA (i5-7200U, FHD) Laptop Review
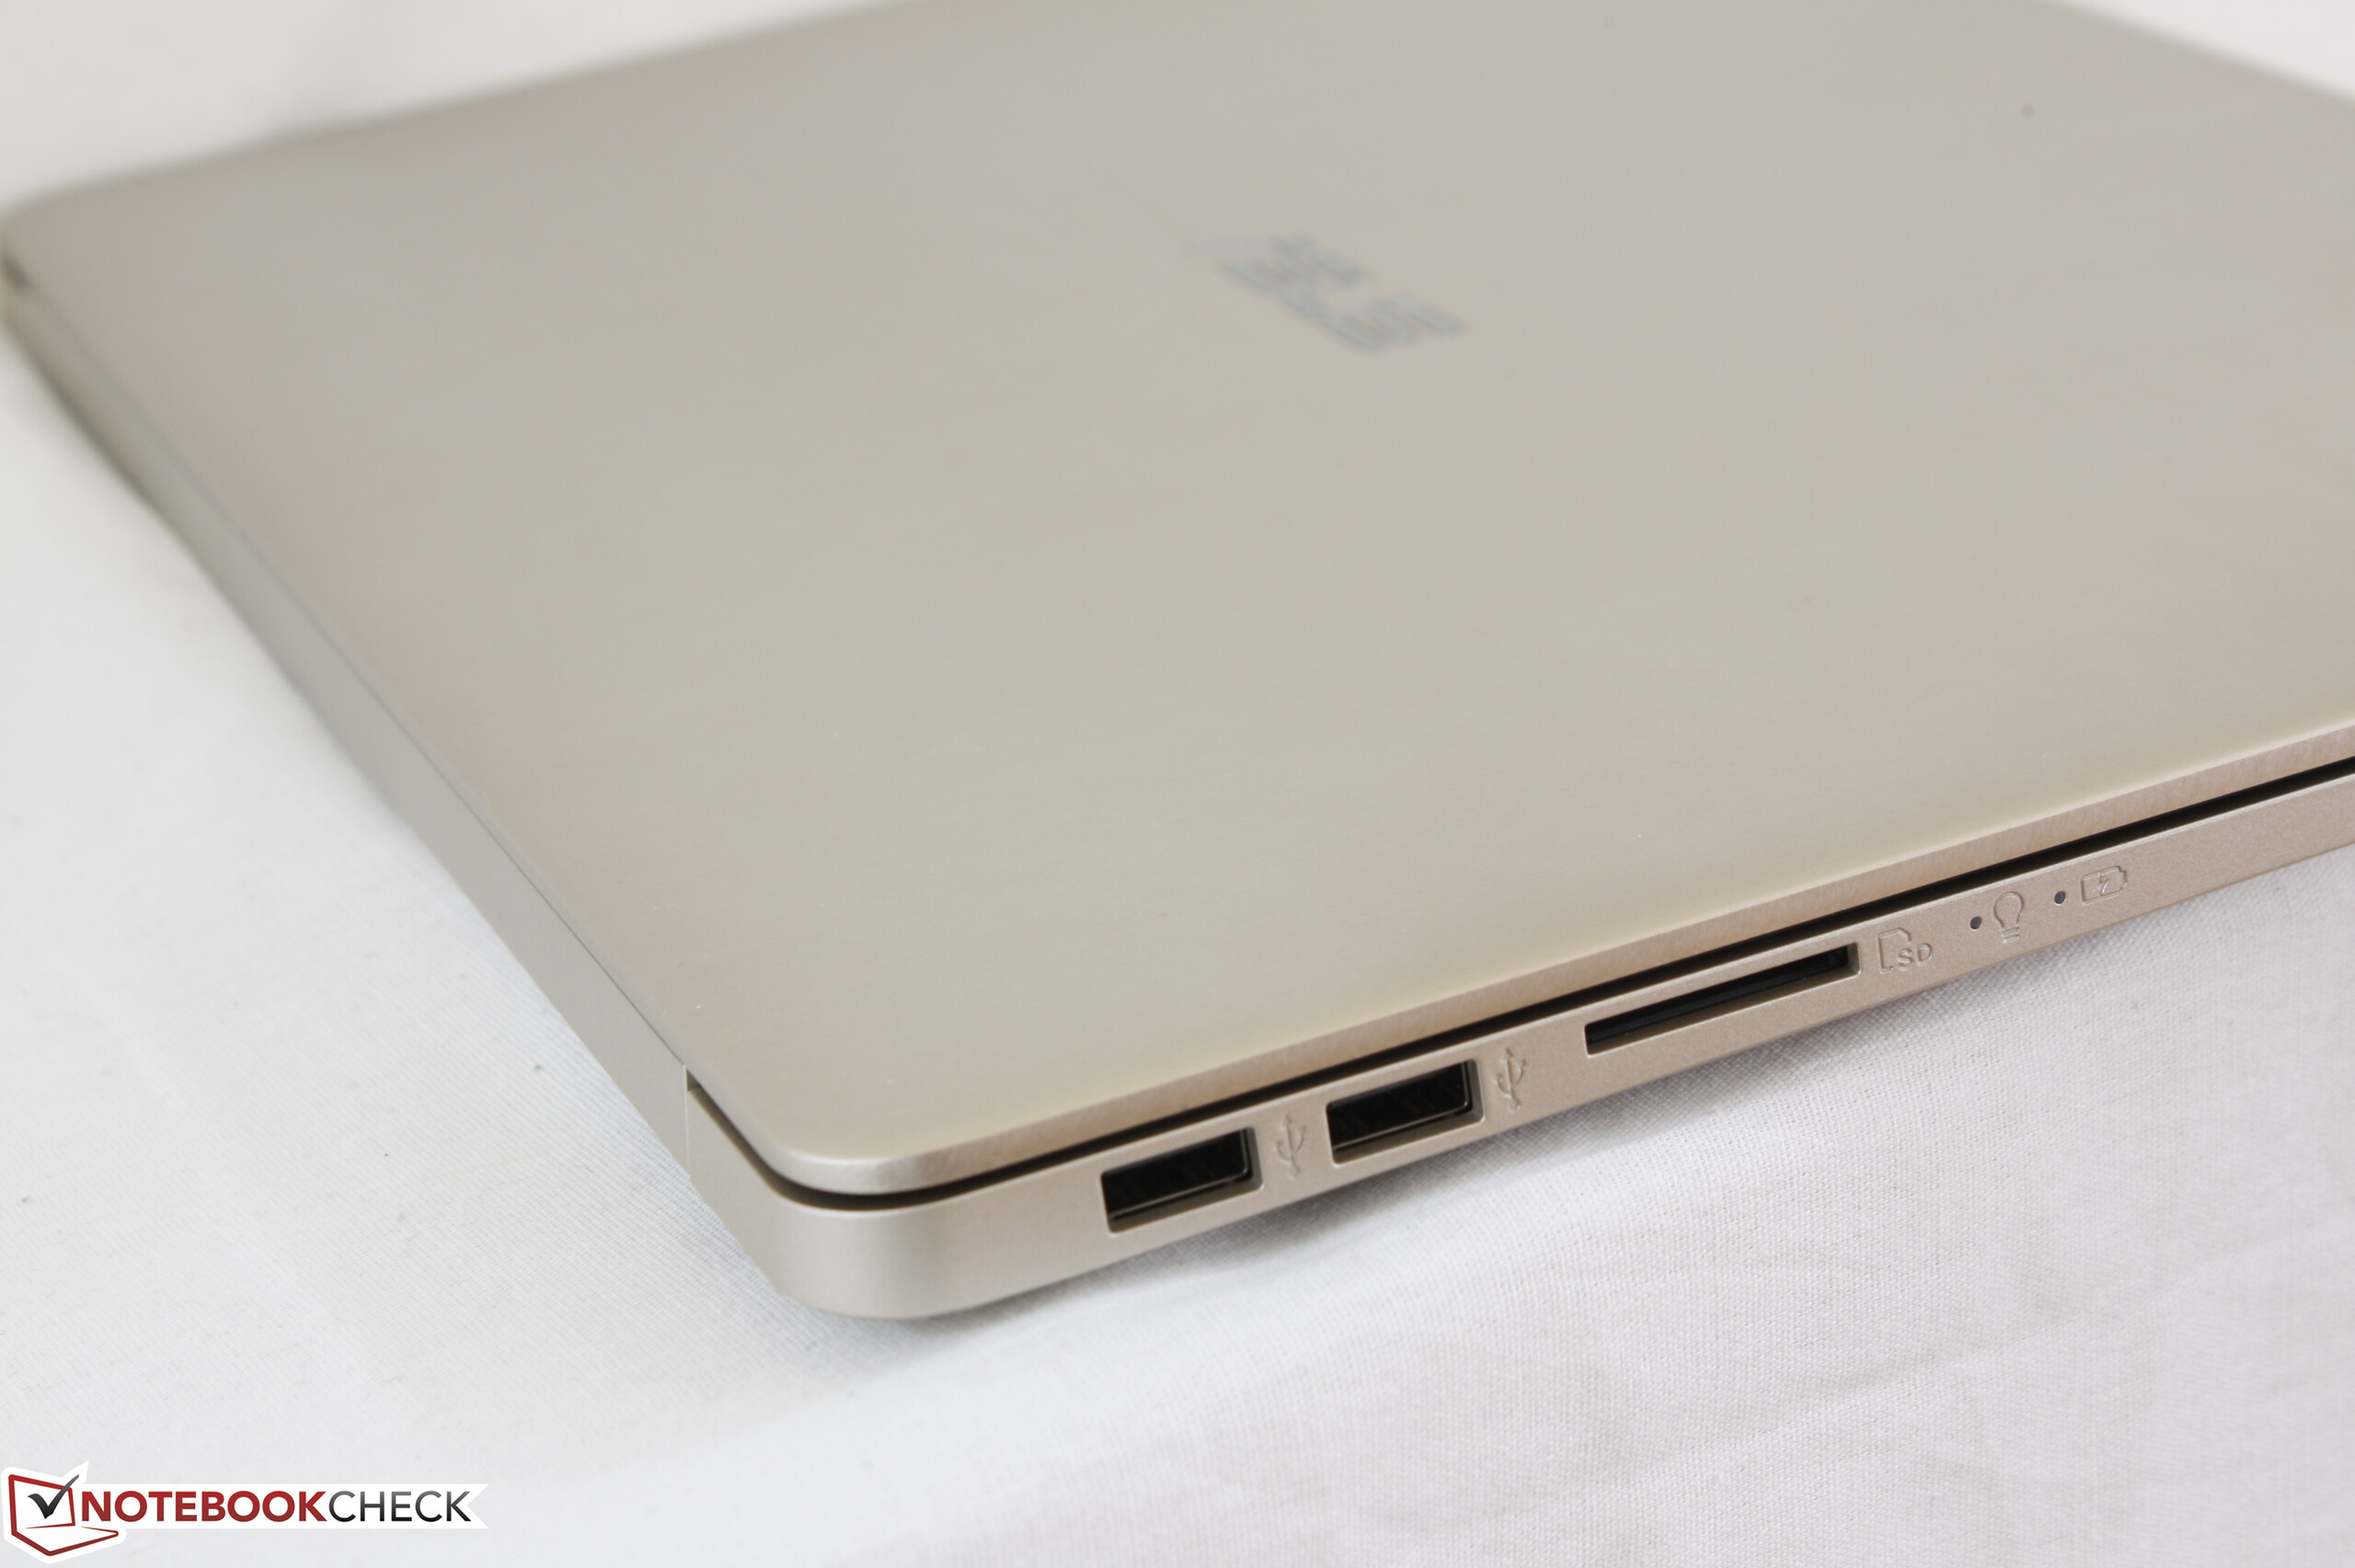


| SD Card Reader | |
| average JPG Copy Test (av. of 3 runs) | |
| HP Pavilion 15t-au100 CTO (W0P31AV) | |
| Asus VivoBook S15 S510UA | |
| Dell Inspiron 15 7000 7567 | |
| maximum AS SSD Seq Read Test (1GB) | |
| HP Pavilion 15t-au100 CTO (W0P31AV) | |
| Asus VivoBook S15 S510UA | |
| Dell Inspiron 15 7000 7567 | |
| Networking | |
| iperf3 transmit AX12 | |
| Asus VivoBook S15 S510UA | |
| Lenovo V510-15IKB 80WQ0002GE | |
| Dell Inspiron 15 7000 7567 (jseb) | |
| iperf3 receive AX12 | |
| Asus VivoBook S15 S510UA | |
| Lenovo V510-15IKB 80WQ0002GE | |
| Dell Inspiron 15 7000 7567 (jseb) | |
| |||||||||||||||||||||||||
Brightness Distribution: 89 %
Center on Battery: 277.5 cd/m²
Contrast: 793:1 (Black: 0.35 cd/m²)
ΔE ColorChecker Calman: 4.8 | ∀{0.5-29.43 Ø4.73}
ΔE Greyscale Calman: 3 | ∀{0.09-98 Ø4.97}
69.3% sRGB (Argyll 1.6.3 3D)
37.7% AdobeRGB 1998 (Argyll 1.6.3 3D)
41.11% AdobeRGB 1998 (Argyll 3D)
59.5% sRGB (Argyll 3D)
39.9% Display P3 (Argyll 3D)
Gamma: 2.39
CCT: 6854 K
| Asus VivoBook S15 S510UA ID: LGD0573, Name: LG Display LP156WF9-SPK2, IPS, 15.6", 1920x1080 | Lenovo V510-15IKB 80WQ0002GE LG Philips LP156WF6-SPK3, IPS, 15.6", 1920x1080 | HP Pavilion 15t-au100 CTO (W0P31AV) BOE0693, IPS, 15.6", 1920x1080 | Apple MacBook Pro 15 2016 (2.9 GHz, 460) Apple APPA030, IPS, 15.4", 2880x1800 | HP Envy 15-as133cl Chi Mei CMN15D8, IPS, 15.6", 1920x1080 | Dell Inspiron 15 7000 7567 AU Optronics AUO38ED B156HTN 28H80, TN, 15.6", 1920x1080 | |
|---|---|---|---|---|---|---|
| Display | -2% | 9% | 109% | 8% | -8% | |
| Display P3 Coverage (%) | 39.9 | 38.8 -3% | 43.27 8% | 99 148% | 42.95 8% | 36.42 -9% |
| sRGB Coverage (%) | 59.5 | 58.1 -2% | 64.9 9% | 100 68% | 64.3 8% | 54.9 -8% |
| AdobeRGB 1998 Coverage (%) | 41.11 | 40.12 -2% | 44.71 9% | 87.3 112% | 44.41 8% | 37.62 -8% |
| Response Times | -8% | -18% | -66% | -15% | -15% | |
| Response Time Grey 50% / Grey 80% * (ms) | 38.4 ? | 39 ? -2% | 42 ? -9% | 46 ? -20% | 44.4 ? -16% | 36 ? 6% |
| Response Time Black / White * (ms) | 26.4 ? | 30 ? -14% | 33.6 ? -27% | 56 ? -112% | 30 ? -14% | 36 ? -36% |
| PWM Frequency (Hz) | 20000 ? | 198.4 | 119000 ? | 1000 ? | ||
| Screen | -6% | -9% | 46% | 2% | -75% | |
| Brightness middle (cd/m²) | 277.5 | 256 -8% | 186.5 -33% | 420 51% | 262.3 -5% | 246 -11% |
| Brightness (cd/m²) | 265 | 252 -5% | 174 -34% | 401 51% | 240 -9% | 235 -11% |
| Brightness Distribution (%) | 89 | 87 -2% | 69 -22% | 90 1% | 83 -7% | 75 -16% |
| Black Level * (cd/m²) | 0.35 | 0.3 14% | 0.18 49% | 0.3 14% | 0.24 31% | 0.55 -57% |
| Contrast (:1) | 793 | 853 8% | 1036 31% | 1400 77% | 1093 38% | 447 -44% |
| Colorchecker dE 2000 * | 4.8 | 5.4 -13% | 5.7 -19% | 3.33 31% | 5 -4% | 10.97 -129% |
| Colorchecker dE 2000 max. * | 17.8 | 9.36 47% | 22.5 -26% | 5.11 71% | 20.6 -16% | |
| Greyscale dE 2000 * | 3 | 5.37 -79% | 4.4 -47% | 2.73 9% | 3.2 -7% | 14.25 -375% |
| Gamma | 2.39 92% | 2.58 85% | 2.35 94% | 2.48 89% | 2.45 90% | 1.83 120% |
| CCT | 6854 95% | 6795 96% | 6963 93% | 6457 101% | 6817 95% | 11200 58% |
| Color Space (Percent of AdobeRGB 1998) (%) | 37.7 | 37 -2% | 44.71 19% | 78.09 107% | 40.5 7% | 35 -7% |
| Color Space (Percent of sRGB) (%) | 69.3 | 58 -16% | 64.95 -6% | 99.97 44% | 63.5 -8% | 55 -21% |
| Total Average (Program / Settings) | -5% /
-5% | -6% /
-7% | 30% /
43% | -2% /
1% | -33% /
-52% |
* ... smaller is better
Display Response Times
| ↔ Response Time Black to White | ||
|---|---|---|
| 26.4 ms ... rise ↗ and fall ↘ combined | ↗ 15.6 ms rise | 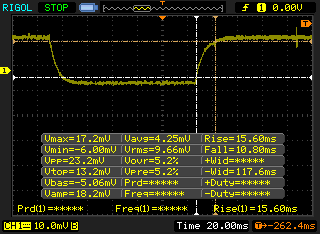 |
| ↘ 10.8 ms fall | ||
| The screen shows relatively slow response rates in our tests and may be too slow for gamers. In comparison, all tested devices range from 0.1 (minimum) to 240 (maximum) ms. » 66 % of all devices are better. This means that the measured response time is worse than the average of all tested devices (19.9 ms). | ||
| ↔ Response Time 50% Grey to 80% Grey | ||
| 38.4 ms ... rise ↗ and fall ↘ combined | ↗ 19.2 ms rise | 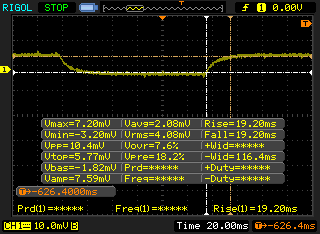 |
| ↘ 19.2 ms fall | ||
| The screen shows slow response rates in our tests and will be unsatisfactory for gamers. In comparison, all tested devices range from 0.165 (minimum) to 636 (maximum) ms. » 57 % of all devices are better. This means that the measured response time is worse than the average of all tested devices (31.1 ms). | ||
Screen Flickering / PWM (Pulse-Width Modulation)
| Screen flickering / PWM not detected | 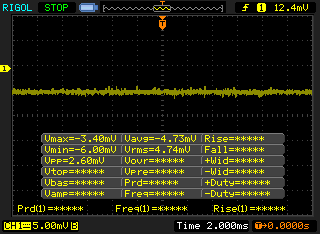 | ||
In comparison: 52 % of all tested devices do not use PWM to dim the display. If PWM was detected, an average of 7801 (minimum: 5 - maximum: 343500) Hz was measured. | |||
| Cinebench R10 | |
| Rendering Multiple CPUs 32Bit | |
| Asus VivoBook S15 S510UA | |
| Dell Latitude 5280 | |
| Lenovo ThinkPad 13-20J2S00G00 | |
| HP ProBook 640 G2-T9X60ET | |
| Lenovo Thinkpad 13-20J1001BUS | |
| HP 250 G4 T6P08ES | |
| Lenovo IdeaPad Z40-59422614 | |
| HP EliteBook 725 G4 | |
| Rendering Single 32Bit | |
| Asus VivoBook S15 S510UA | |
| Dell Latitude 5280 | |
| Lenovo ThinkPad 13-20J2S00G00 | |
| HP ProBook 640 G2-T9X60ET | |
| HP 250 G4 T6P08ES | |
| Lenovo Thinkpad 13-20J1001BUS | |
| Lenovo IdeaPad Z40-59422614 | |
| HP EliteBook 725 G4 | |
| wPrime 2.10 - 1024m | |
| Lenovo IdeaPad Z40-59422614 | |
| Lenovo Thinkpad 13-20J1001BUS | |
| HP EliteBook 725 G4 | |
| Dell Latitude 5280 | |
| Asus VivoBook S15 S510UA | |
| Lenovo ThinkPad T470s-20HF0012US | |
* ... smaller is better
| PCMark 8 | |
| Home Score Accelerated v2 | |
| Apple MacBook Pro 15 2016 (2.9 GHz, 460) | |
| Asus VivoBook S15 S510UA | |
| HP Pavilion 15t-au100 CTO (W0P31AV) | |
| Work Score Accelerated v2 | |
| Apple MacBook Pro 15 2016 (2.9 GHz, 460) | |
| Asus VivoBook S15 S510UA | |
| HP Pavilion 15t-au100 CTO (W0P31AV) | |
| Creative Score Accelerated v2 | |
| Apple MacBook Pro 15 2016 (2.9 GHz, 460) | |
| Asus VivoBook S15 S510UA | |
| HP Pavilion 15t-au100 CTO (W0P31AV) | |
| PCMark 8 Home Score Accelerated v2 | 3831 points | |
| PCMark 8 Creative Score Accelerated v2 | 4627 points | |
| PCMark 8 Work Score Accelerated v2 | 4746 points | |
Help | ||
| Asus VivoBook S15 S510UA Toshiba HG6 THNSNJ128G8NY | Lenovo V510-15IKB 80WQ0002GE Samsung CM871a MZNTY256HDHP | HP Pavilion 15t-au100 CTO (W0P31AV) Toshiba MQ01ABD100 | Apple MacBook Pro 15 2016 (2.9 GHz, 460) Apple SSD SM1024L | Dell Inspiron 15 7000 7567 Intel SSDSCKKF256H6 | |
|---|---|---|---|---|---|
| CrystalDiskMark 3.0 | 51% | -91% | 165% | 29% | |
| Read Seq (MB/s) | 503 | 532 6% | 109.5 -78% | 1458 190% | 485.8 -3% |
| Write Seq (MB/s) | 396 | 511 29% | 105.2 -73% | 1440 264% | 422.8 7% |
| Read 512 (MB/s) | 417.7 | 414.8 -1% | 34.08 -92% | 914 119% | 338.9 -19% |
| Write 512 (MB/s) | 342 | 307.7 -10% | 40.02 -88% | 1058 209% | 304 -11% |
| Read 4k (MB/s) | 19.48 | 39.51 103% | 0.429 -98% | 9.786 -50% | 27.11 39% |
| Write 4k (MB/s) | 64.6 | 108.1 67% | 1.008 -98% | 10.9 -83% | 85.4 32% |
| Read 4k QD32 (MB/s) | 250.3 | 361.6 44% | 0.81 -100% | 679 171% | 279.6 12% |
| Write 4k QD32 (MB/s) | 94.3 | 253 168% | 0.893 -99% | 562 496% | 255.1 171% |

| 3DMark | |
| 1280x720 Cloud Gate Standard Graphics | |
| Apple MacBook Pro 13 2016 (2.9 GHz) | |
| HP Spectre x360 15-bl002xx | |
| Asus VivoBook S15 S510UA | |
| Acer TravelMate P249-M-5452 | |
| Dell Latitude 5280 | |
| HP 250 G4 T6P08ES | |
| HP EliteBook 725 G4 | |
| 1920x1080 Fire Strike Graphics | |
| HP Spectre x360 15-bl002xx | |
| Apple MacBook Pro 13 2016 (2.9 GHz) | |
| HP EliteBook 725 G4 | |
| HP EliteBook 725 G4 | |
| Asus VivoBook S15 S510UA | |
| HP 250 G4 T6P08ES | |
| Acer TravelMate P249-M-5452 | |
| Dell Latitude 5280 | |
| 1920x1080 Ice Storm Extreme Graphics | |
| Asus VivoBook S15 S510UA | |
| Acer TravelMate P249-M-5452 | |
| Dell Latitude 5280 | |
| HP Spectre x360 15-bl002xx | |
| HP EliteBook 725 G4 | |
| 3DMark 11 Performance | 1768 points | |
| 3DMark Ice Storm Standard Score | 69286 points | |
| 3DMark Cloud Gate Standard Score | 6704 points | |
| 3DMark Fire Strike Score | 965 points | |
| 3DMark Fire Strike Extreme Score | 449 points | |
Help | ||
| low | med. | high | ultra | |
|---|---|---|---|---|
| BioShock Infinite (2013) | 62.7 | 33.9 | 28.6 | 8.8 |
| Dota 2 Reborn (2015) | 82 | 56 | 20 |
Noise level
| Idle |
| 30.2 / 30.2 / 30.2 dB(A) |
| HDD |
| 30.2 dB(A) |
| Load |
| 36.9 / 37 dB(A) |
 | ||
30 dB silent 40 dB(A) audible 50 dB(A) loud |
||
min: | ||
| Asus VivoBook S15 S510UA HD Graphics 620, i5-7200U, Toshiba HG6 THNSNJ128G8NY | Lenovo V510-15IKB 80WQ0002GE HD Graphics 620, i5-7200U, Samsung CM871a MZNTY256HDHP | HP Pavilion 15t-au100 CTO (W0P31AV) GeForce 940MX, i7-7500U, Toshiba MQ01ABD100 | Apple MacBook Pro 15 2016 (2.9 GHz, 460) Radeon Pro 460, 6920HQ, Apple SSD SM1024L | Dell Inspiron 15 7000 7567 GeForce GTX 1050 Ti Mobile, i7-7700HQ, Intel SSDSCKKF256H6 | |
|---|---|---|---|---|---|
| Noise | 0% | -9% | -4% | -11% | |
| off / environment * (dB) | 28.2 | 30.2 -7% | 29 -3% | 30.3 -7% | |
| Idle Minimum * (dB) | 30.2 | 30.2 -0% | 32.2 -7% | 30.3 -0% | 30.9 -2% |
| Idle Average * (dB) | 30.2 | 30.2 -0% | 32.2 -7% | 30.3 -0% | 30.9 -2% |
| Idle Maximum * (dB) | 30.2 | 32 -6% | 33.7 -12% | 30.3 -0% | 31 -3% |
| Load Average * (dB) | 36.9 | 34.7 6% | 39.4 -7% | 35.1 5% | 46.5 -26% |
| Load Maximum * (dB) | 37 | 33.9 8% | 42.2 -14% | 46 -24% | 46.8 -26% |
* ... smaller is better
(-) The maximum temperature on the upper side is 46 °C / 115 F, compared to the average of 36.8 °C / 98 F, ranging from 21 to 71 °C for the class Multimedia.
(±) The bottom heats up to a maximum of 45 °C / 113 F, compared to the average of 39.1 °C / 102 F
(+) In idle usage, the average temperature for the upper side is 23.5 °C / 74 F, compared to the device average of 31.3 °C / 88 F.
(+) The palmrests and touchpad are reaching skin temperature as a maximum (32.4 °C / 90.3 F) and are therefore not hot.
(-) The average temperature of the palmrest area of similar devices was 28.7 °C / 83.7 F (-3.7 °C / -6.6 F).
Asus VivoBook S15 S510UA audio analysis
(-) | not very loud speakers (66.4 dB)
Bass 100 - 315 Hz
(-) | nearly no bass - on average 15.3% lower than median
(±) | linearity of bass is average (12.2% delta to prev. frequency)
Mids 400 - 2000 Hz
(+) | balanced mids - only 1.6% away from median
(+) | mids are linear (6.8% delta to prev. frequency)
Highs 2 - 16 kHz
(+) | balanced highs - only 3.8% away from median
(±) | linearity of highs is average (10.6% delta to prev. frequency)
Overall 100 - 16.000 Hz
(±) | linearity of overall sound is average (19.8% difference to median)
Compared to same class
» 65% of all tested devices in this class were better, 6% similar, 28% worse
» The best had a delta of 5%, average was 17%, worst was 45%
Compared to all devices tested
» 50% of all tested devices were better, 7% similar, 43% worse
» The best had a delta of 4%, average was 24%, worst was 134%
Apple MacBook 12 (Early 2016) 1.1 GHz audio analysis
(+) | speakers can play relatively loud (83.6 dB)
Bass 100 - 315 Hz
(±) | reduced bass - on average 11.3% lower than median
(±) | linearity of bass is average (14.2% delta to prev. frequency)
Mids 400 - 2000 Hz
(+) | balanced mids - only 2.4% away from median
(+) | mids are linear (5.5% delta to prev. frequency)
Highs 2 - 16 kHz
(+) | balanced highs - only 2% away from median
(+) | highs are linear (4.5% delta to prev. frequency)
Overall 100 - 16.000 Hz
(+) | overall sound is linear (10.2% difference to median)
Compared to same class
» 7% of all tested devices in this class were better, 2% similar, 91% worse
» The best had a delta of 5%, average was 18%, worst was 53%
Compared to all devices tested
» 5% of all tested devices were better, 1% similar, 94% worse
» The best had a delta of 4%, average was 24%, worst was 134%
| Off / Standby | |
| Idle | |
| Load |
|
Key:
min: | |
| Asus VivoBook S15 S510UA i5-7200U, HD Graphics 620, Toshiba HG6 THNSNJ128G8NY, IPS, 1920x1080, 15.6" | Lenovo V510-15IKB 80WQ0002GE i5-7200U, HD Graphics 620, Samsung CM871a MZNTY256HDHP, IPS, 1920x1080, 15.6" | HP Pavilion 15t-au100 CTO (W0P31AV) i7-7500U, GeForce 940MX, Toshiba MQ01ABD100, IPS, 1920x1080, 15.6" | Apple MacBook Pro 15 2016 (2.9 GHz, 460) 6920HQ, Radeon Pro 460, Apple SSD SM1024L, IPS, 2880x1800, 15.4" | HP Envy 15-as133cl i7-7500U, HD Graphics 620, HGST Travelstar 5K1000 HTS541010A7E630, IPS, 1920x1080, 15.6" | |
|---|---|---|---|---|---|
| Power Consumption | -5% | -33% | -62% | 10% | |
| Idle Minimum * (Watt) | 4.6 | 4 13% | 6.16 -34% | 3 35% | 4.6 -0% |
| Idle Average * (Watt) | 7.6 | 9.6 -26% | 8.48 -12% | 9.9 -30% | 7.7 -1% |
| Idle Maximum * (Watt) | 7.7 | 9.7 -26% | 9.62 -25% | 12.5 -62% | 7.8 -1% |
| Load Average * (Watt) | 35.1 | 27.7 21% | 41.63 -19% | 70.6 -101% | 30.5 13% |
| Load Maximum * (Watt) | 36.2 | 38.4 -6% | 63.22 -75% | 90.8 -151% | 22.7 37% |
* ... smaller is better
| Asus VivoBook S15 S510UA i5-7200U, HD Graphics 620, 42 Wh | Lenovo V510-15IKB 80WQ0002GE i5-7200U, HD Graphics 620, 32 Wh | HP Pavilion 15t-au100 CTO (W0P31AV) i7-7500U, GeForce 940MX, 41 Wh | Apple MacBook Pro 15 2016 (2.9 GHz, 460) 6920HQ, Radeon Pro 460, 76 Wh | HP Envy 15-as133cl i7-7500U, HD Graphics 620, 52 Wh | |
|---|---|---|---|---|---|
| Battery runtime | -12% | 3% | 58% | 17% | |
| Reader / Idle (h) | 10.2 | 7.3 -28% | 9.6 -6% | ||
| WiFi v1.3 (h) | 4.3 | 3.8 -12% | 3.7 -14% | 10.3 140% | 6.8 58% |
| Load (h) | 1.2 | 1.8 50% | 0.9 -25% | 1.2 0% |
Pros
Cons
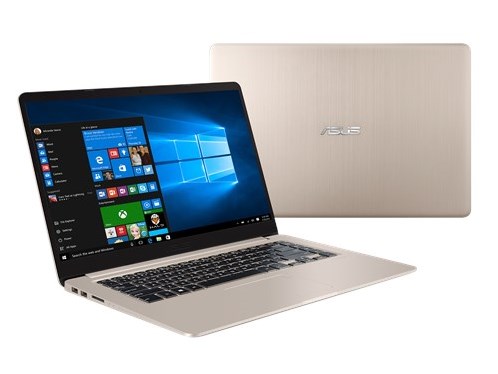

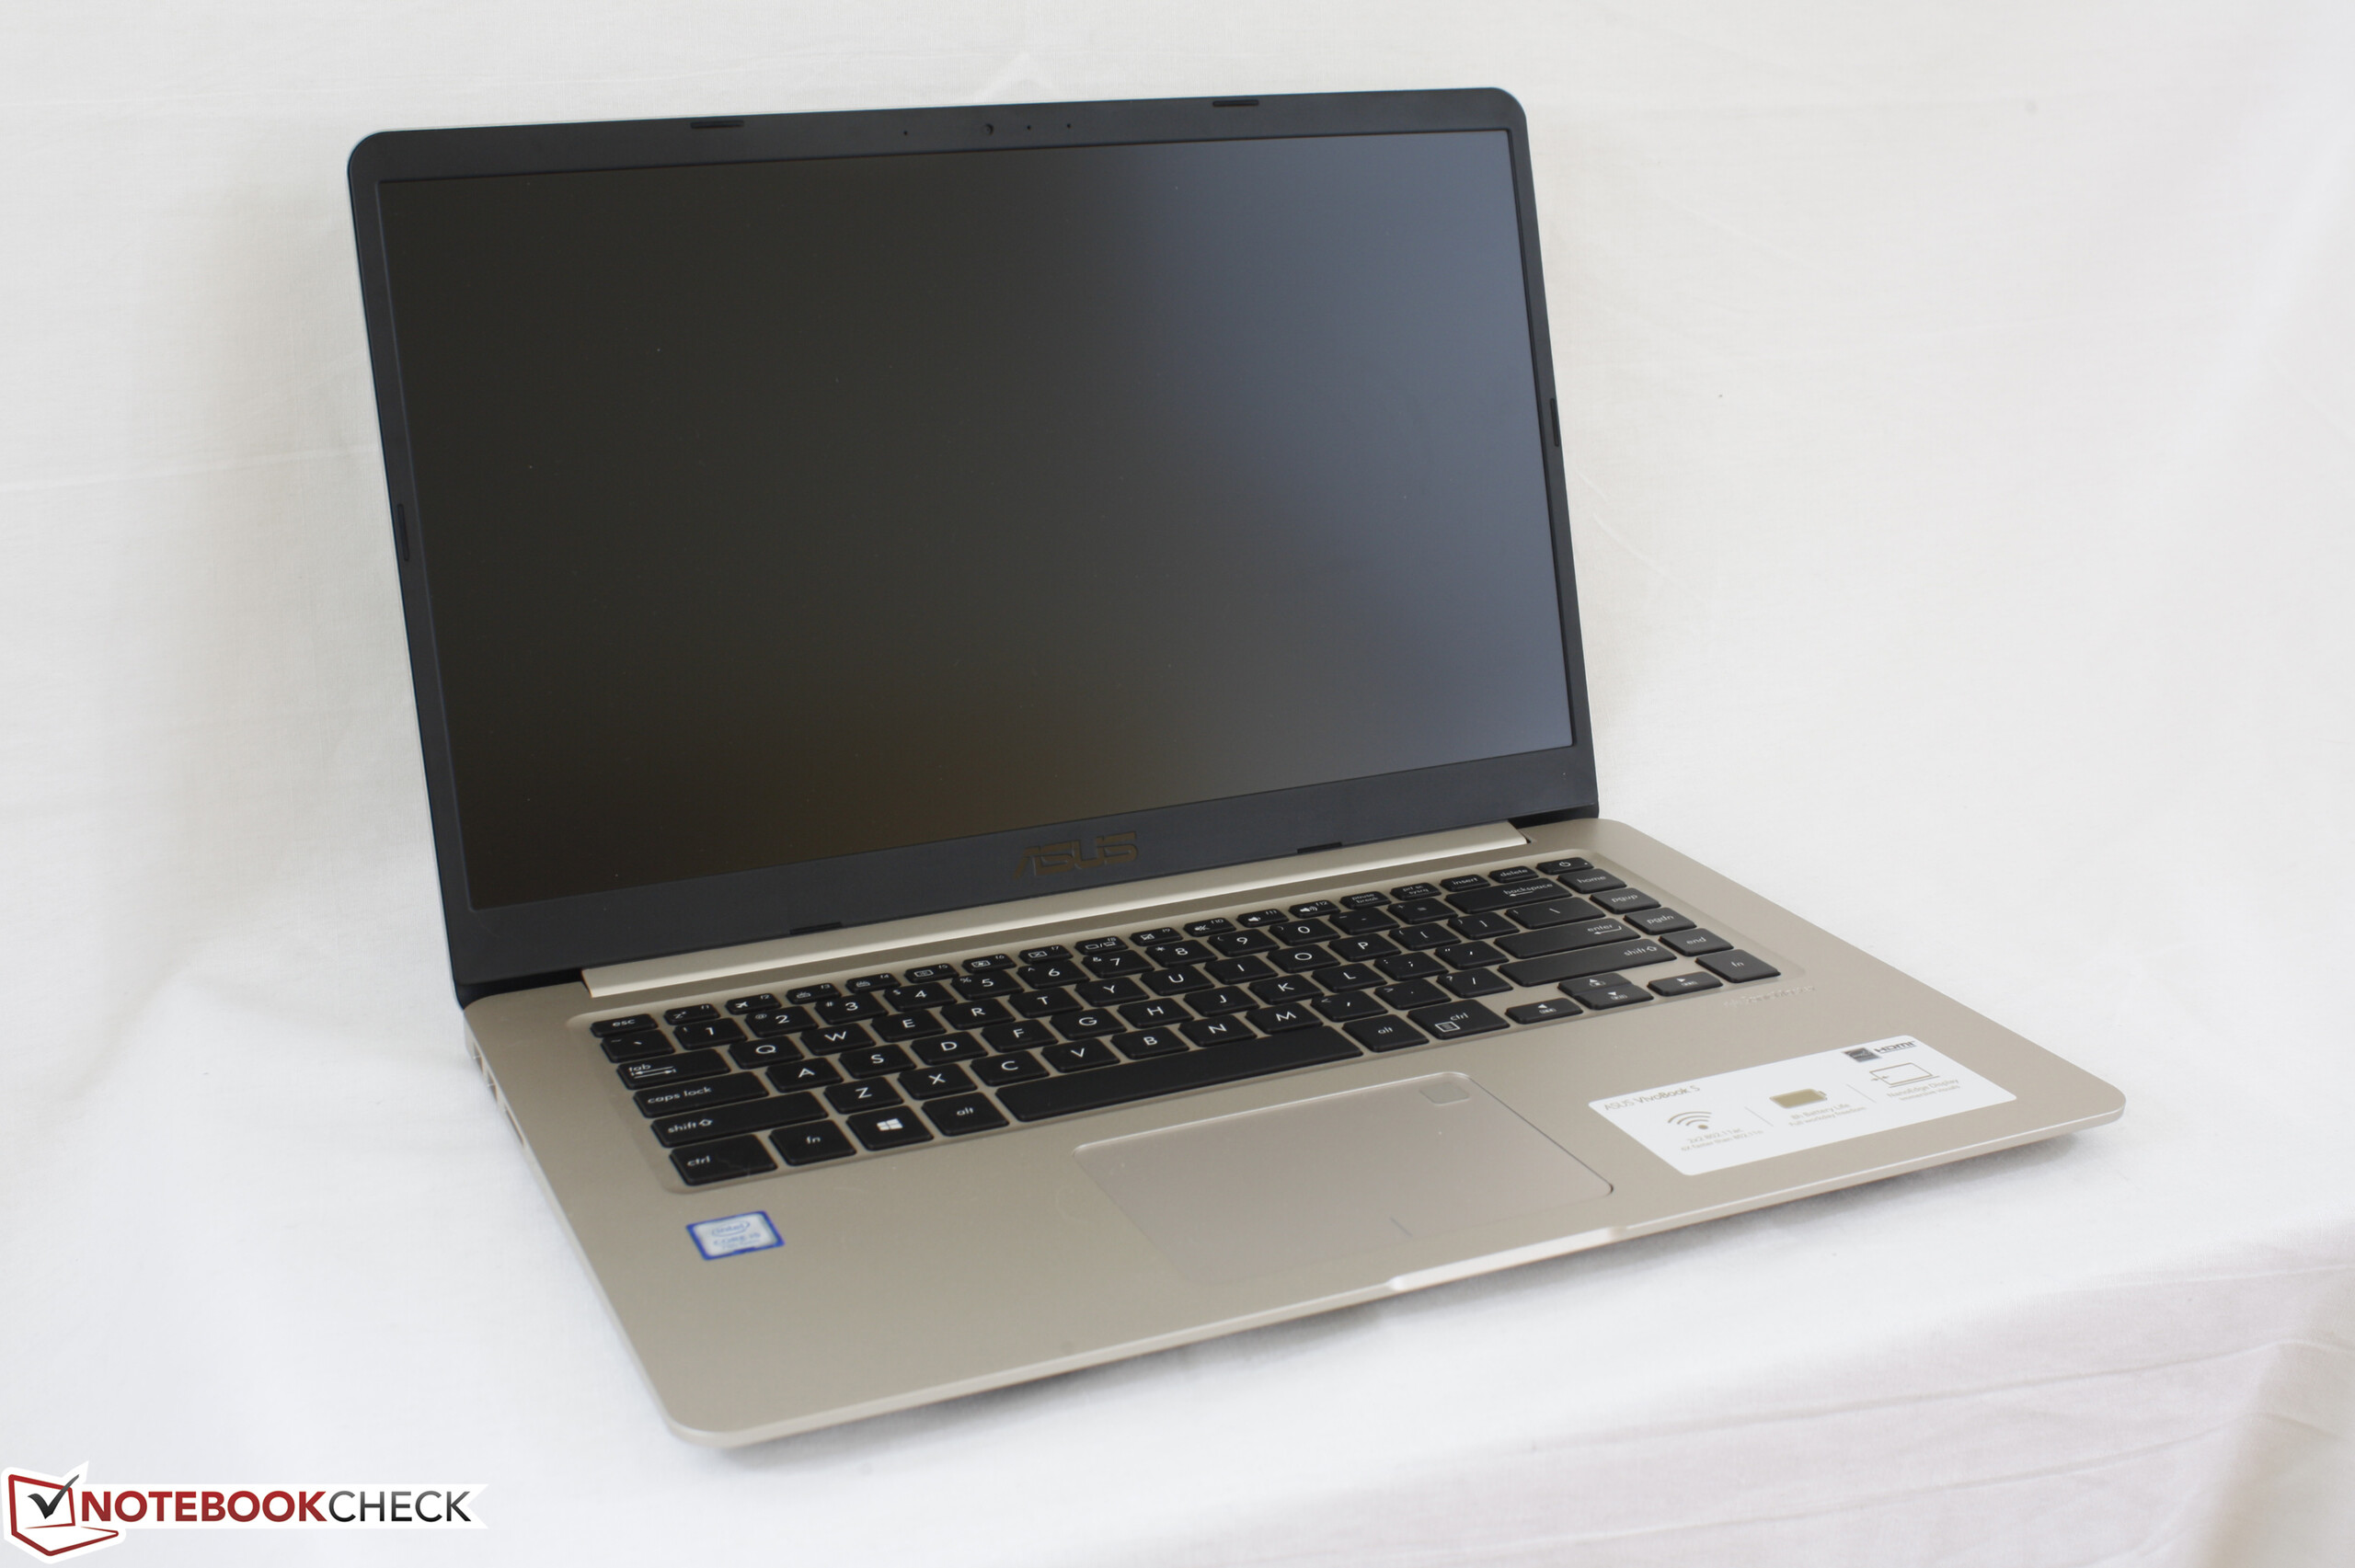
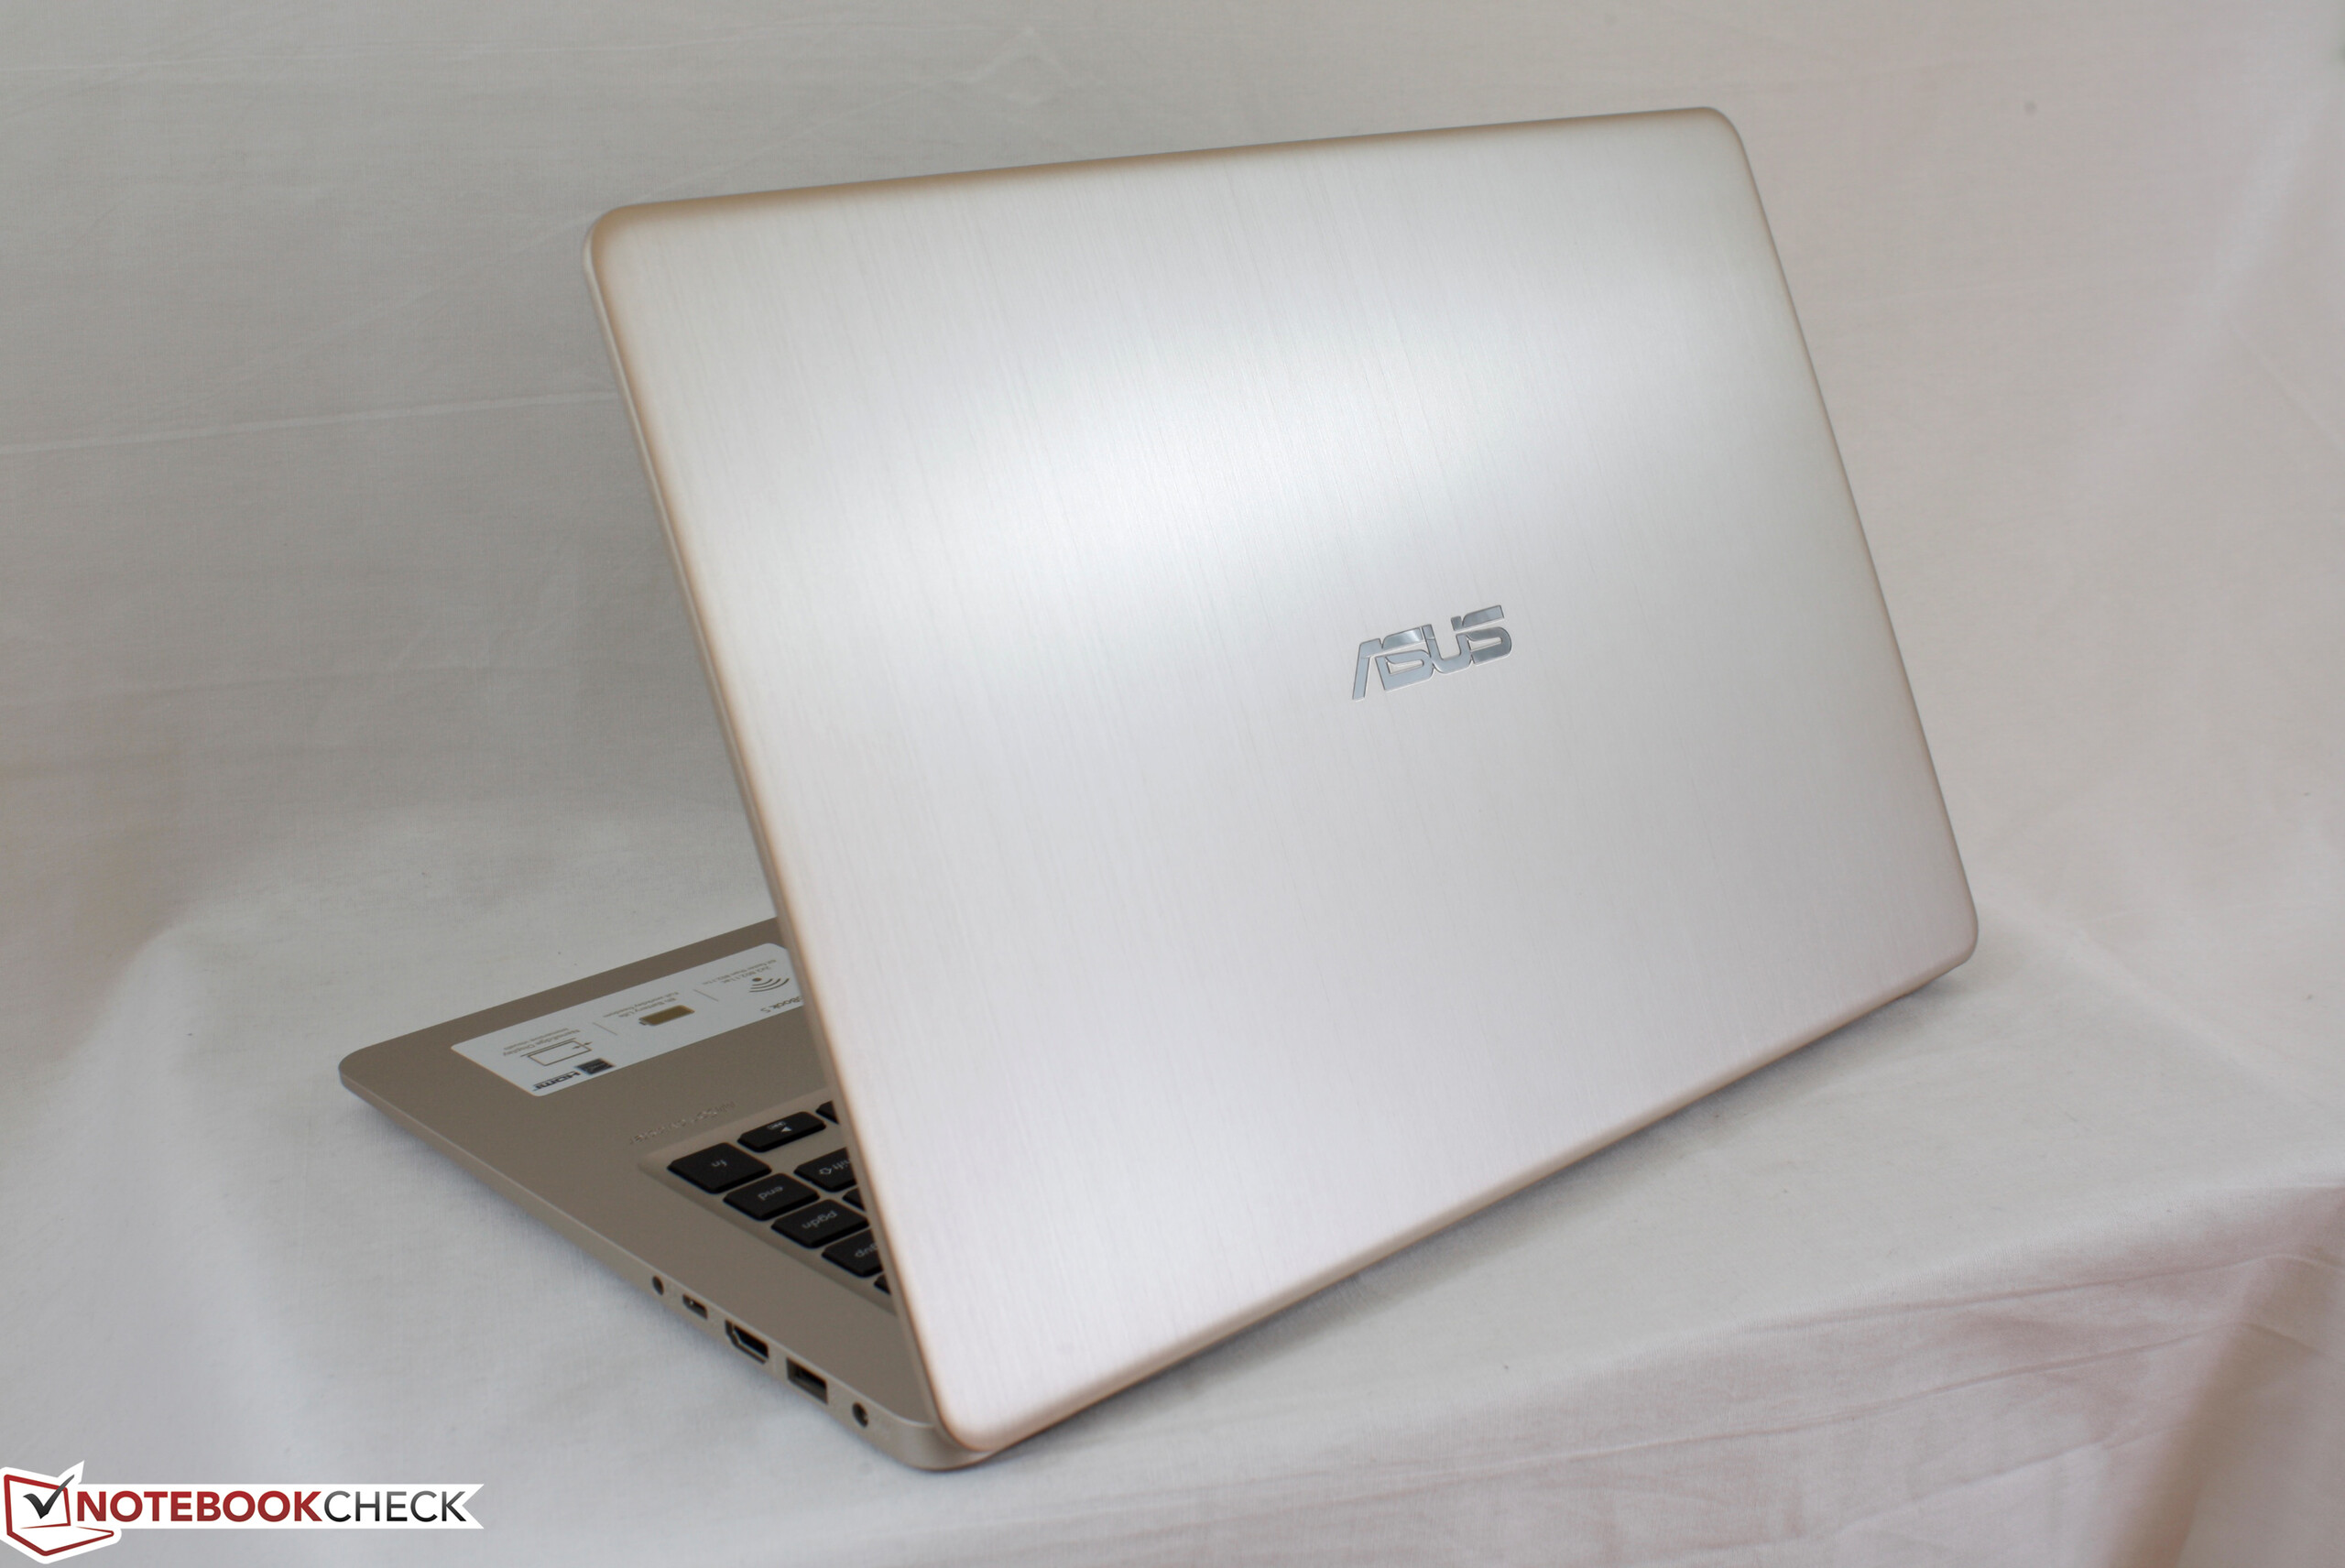
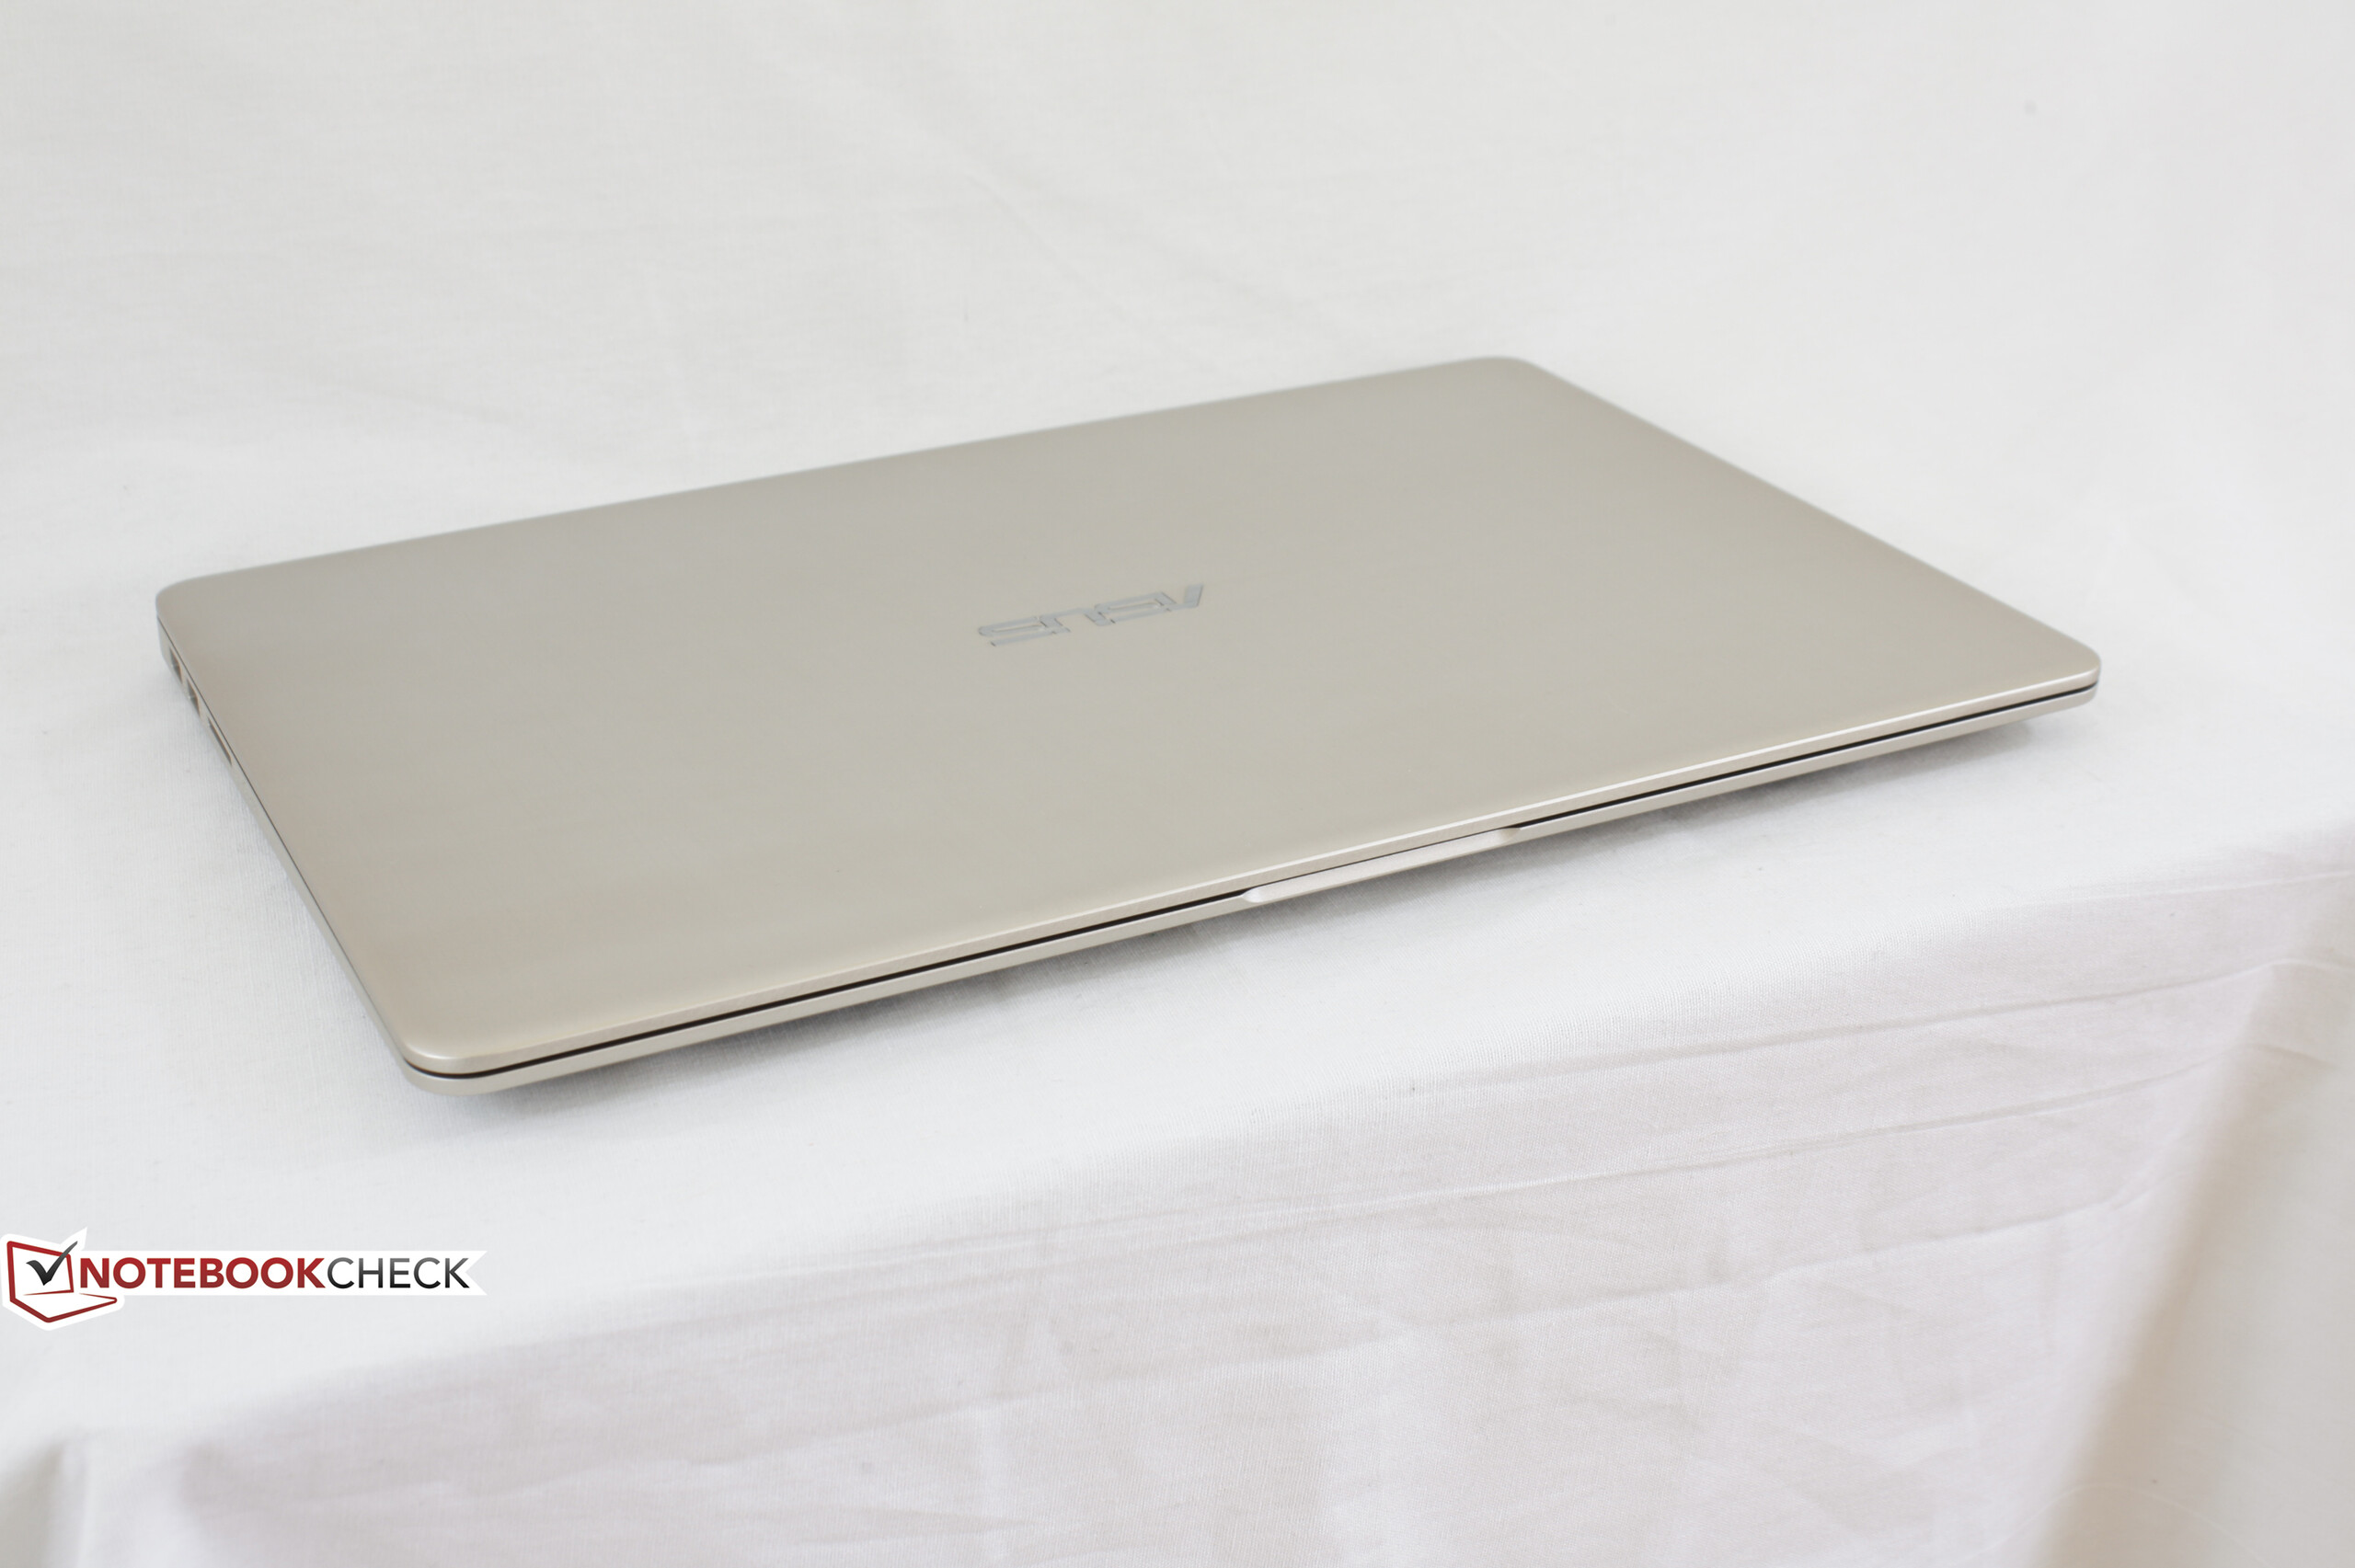
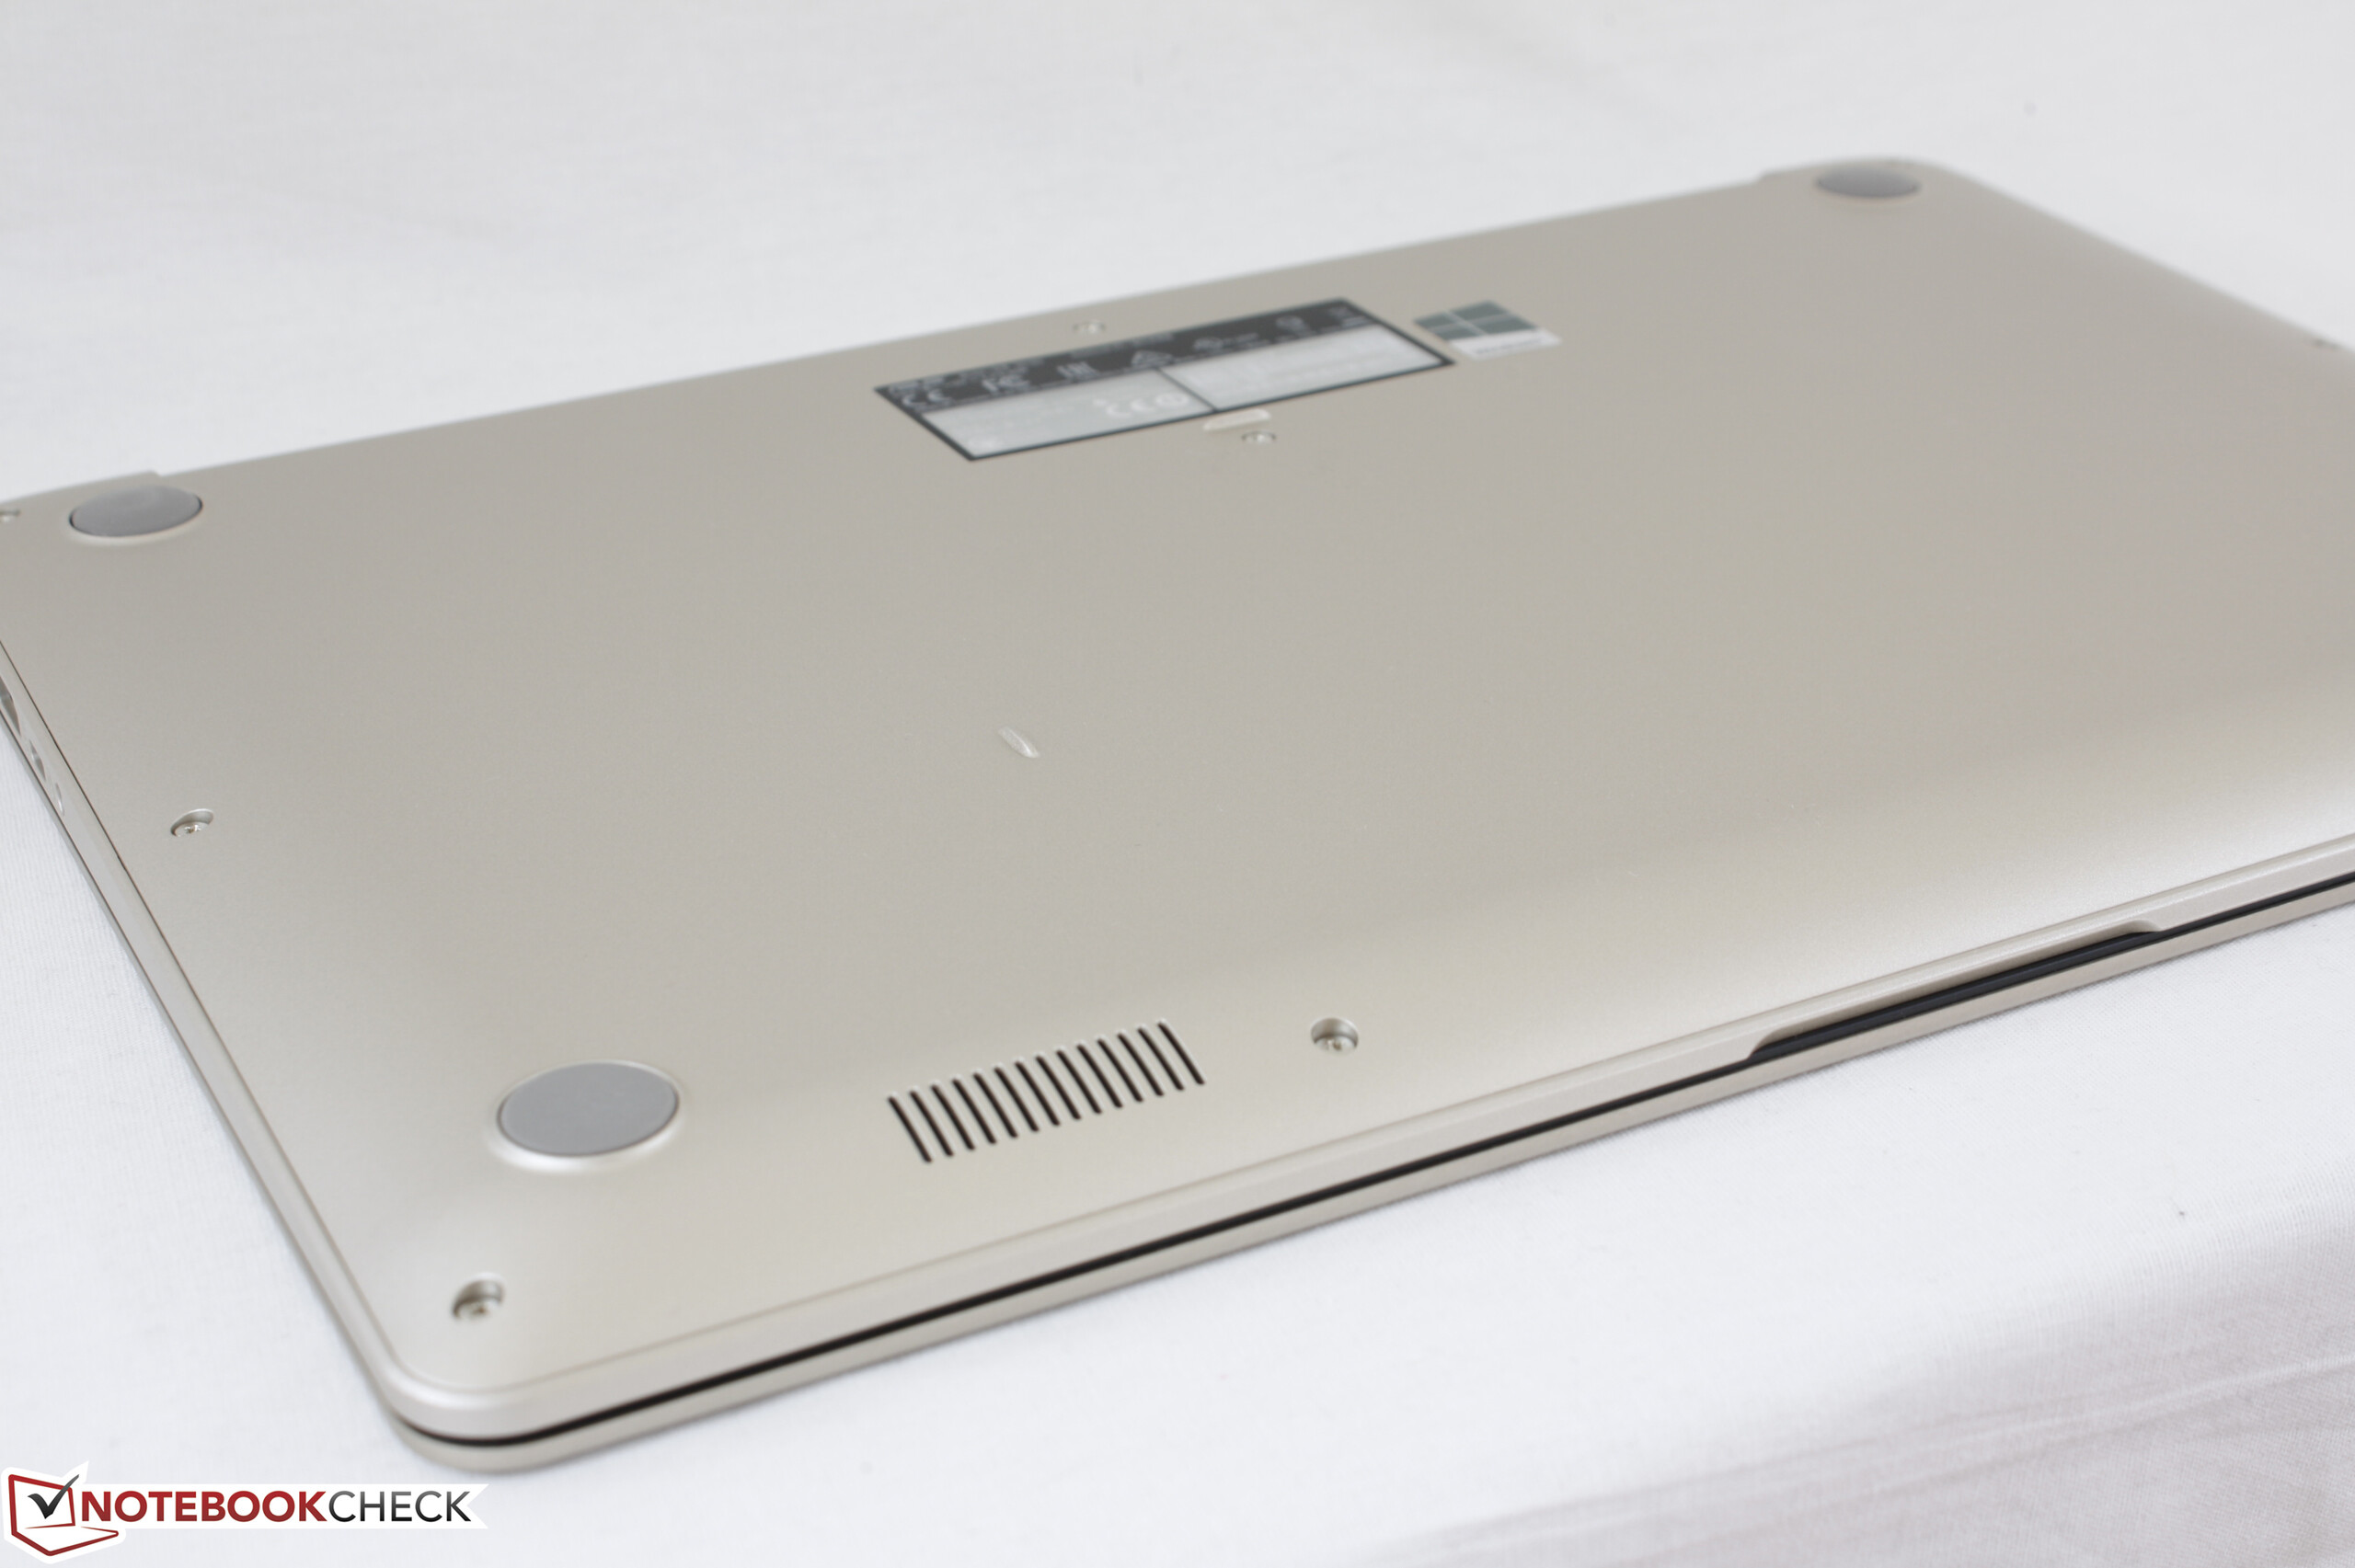
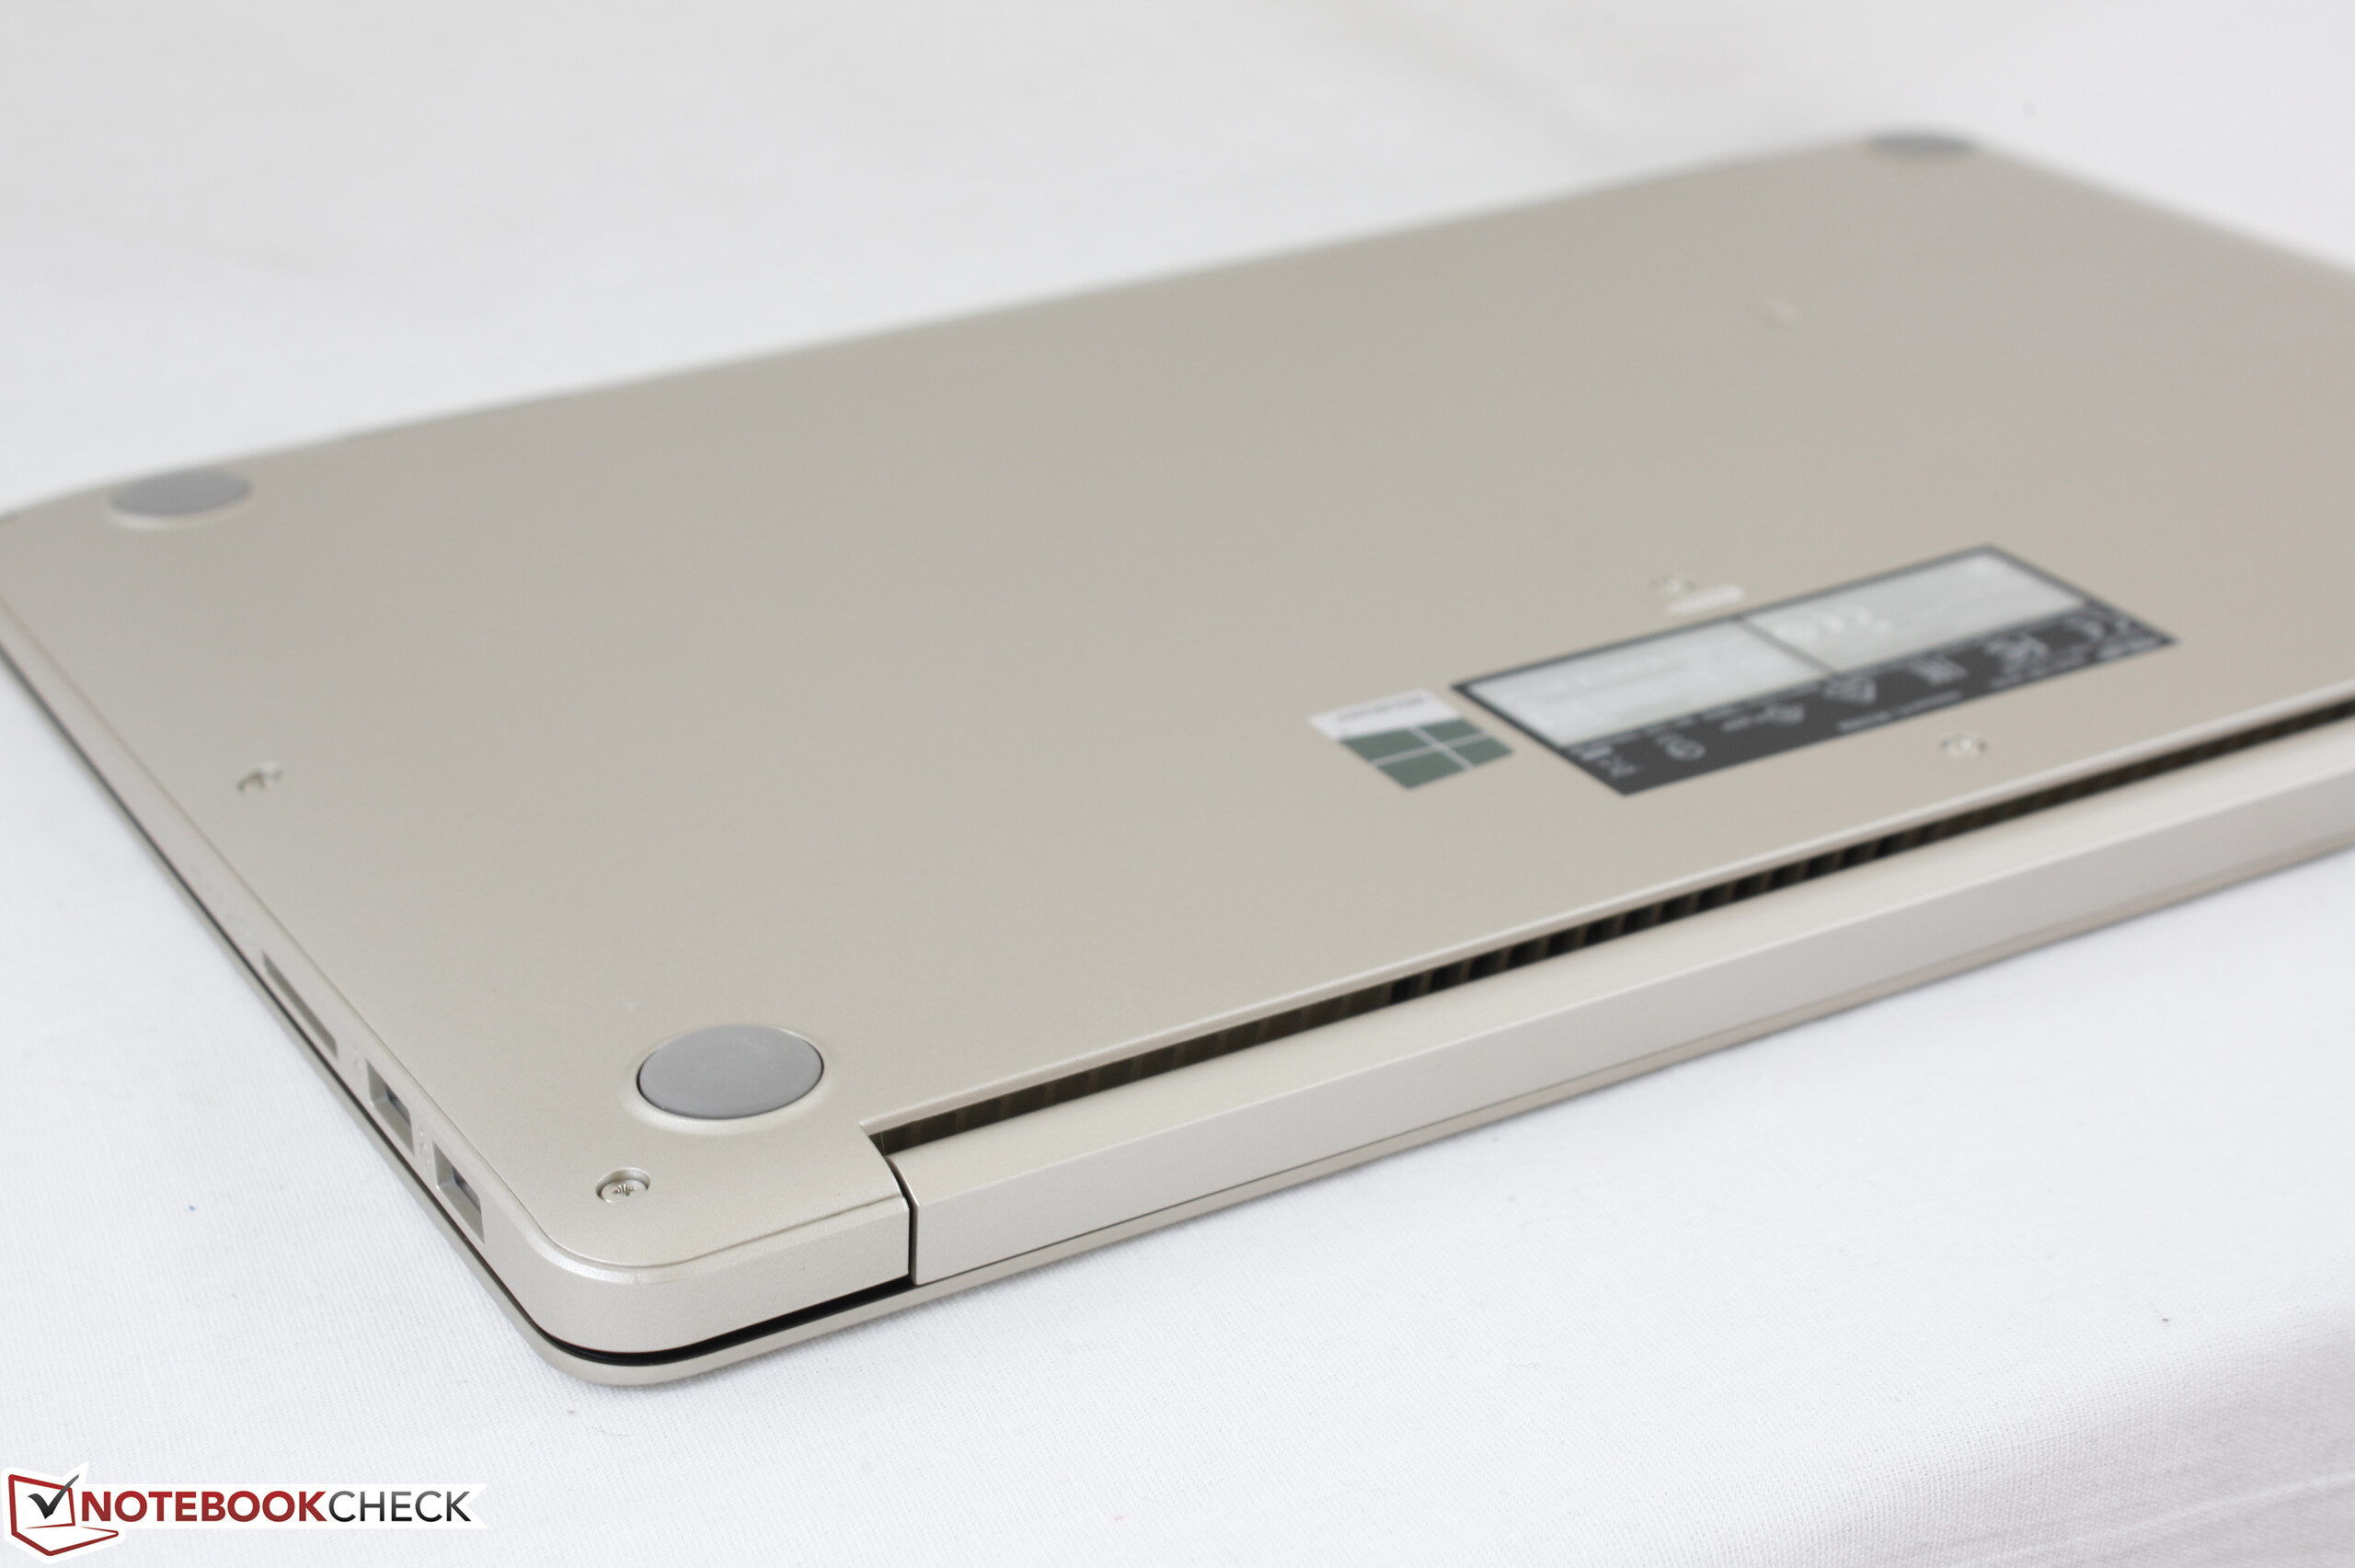
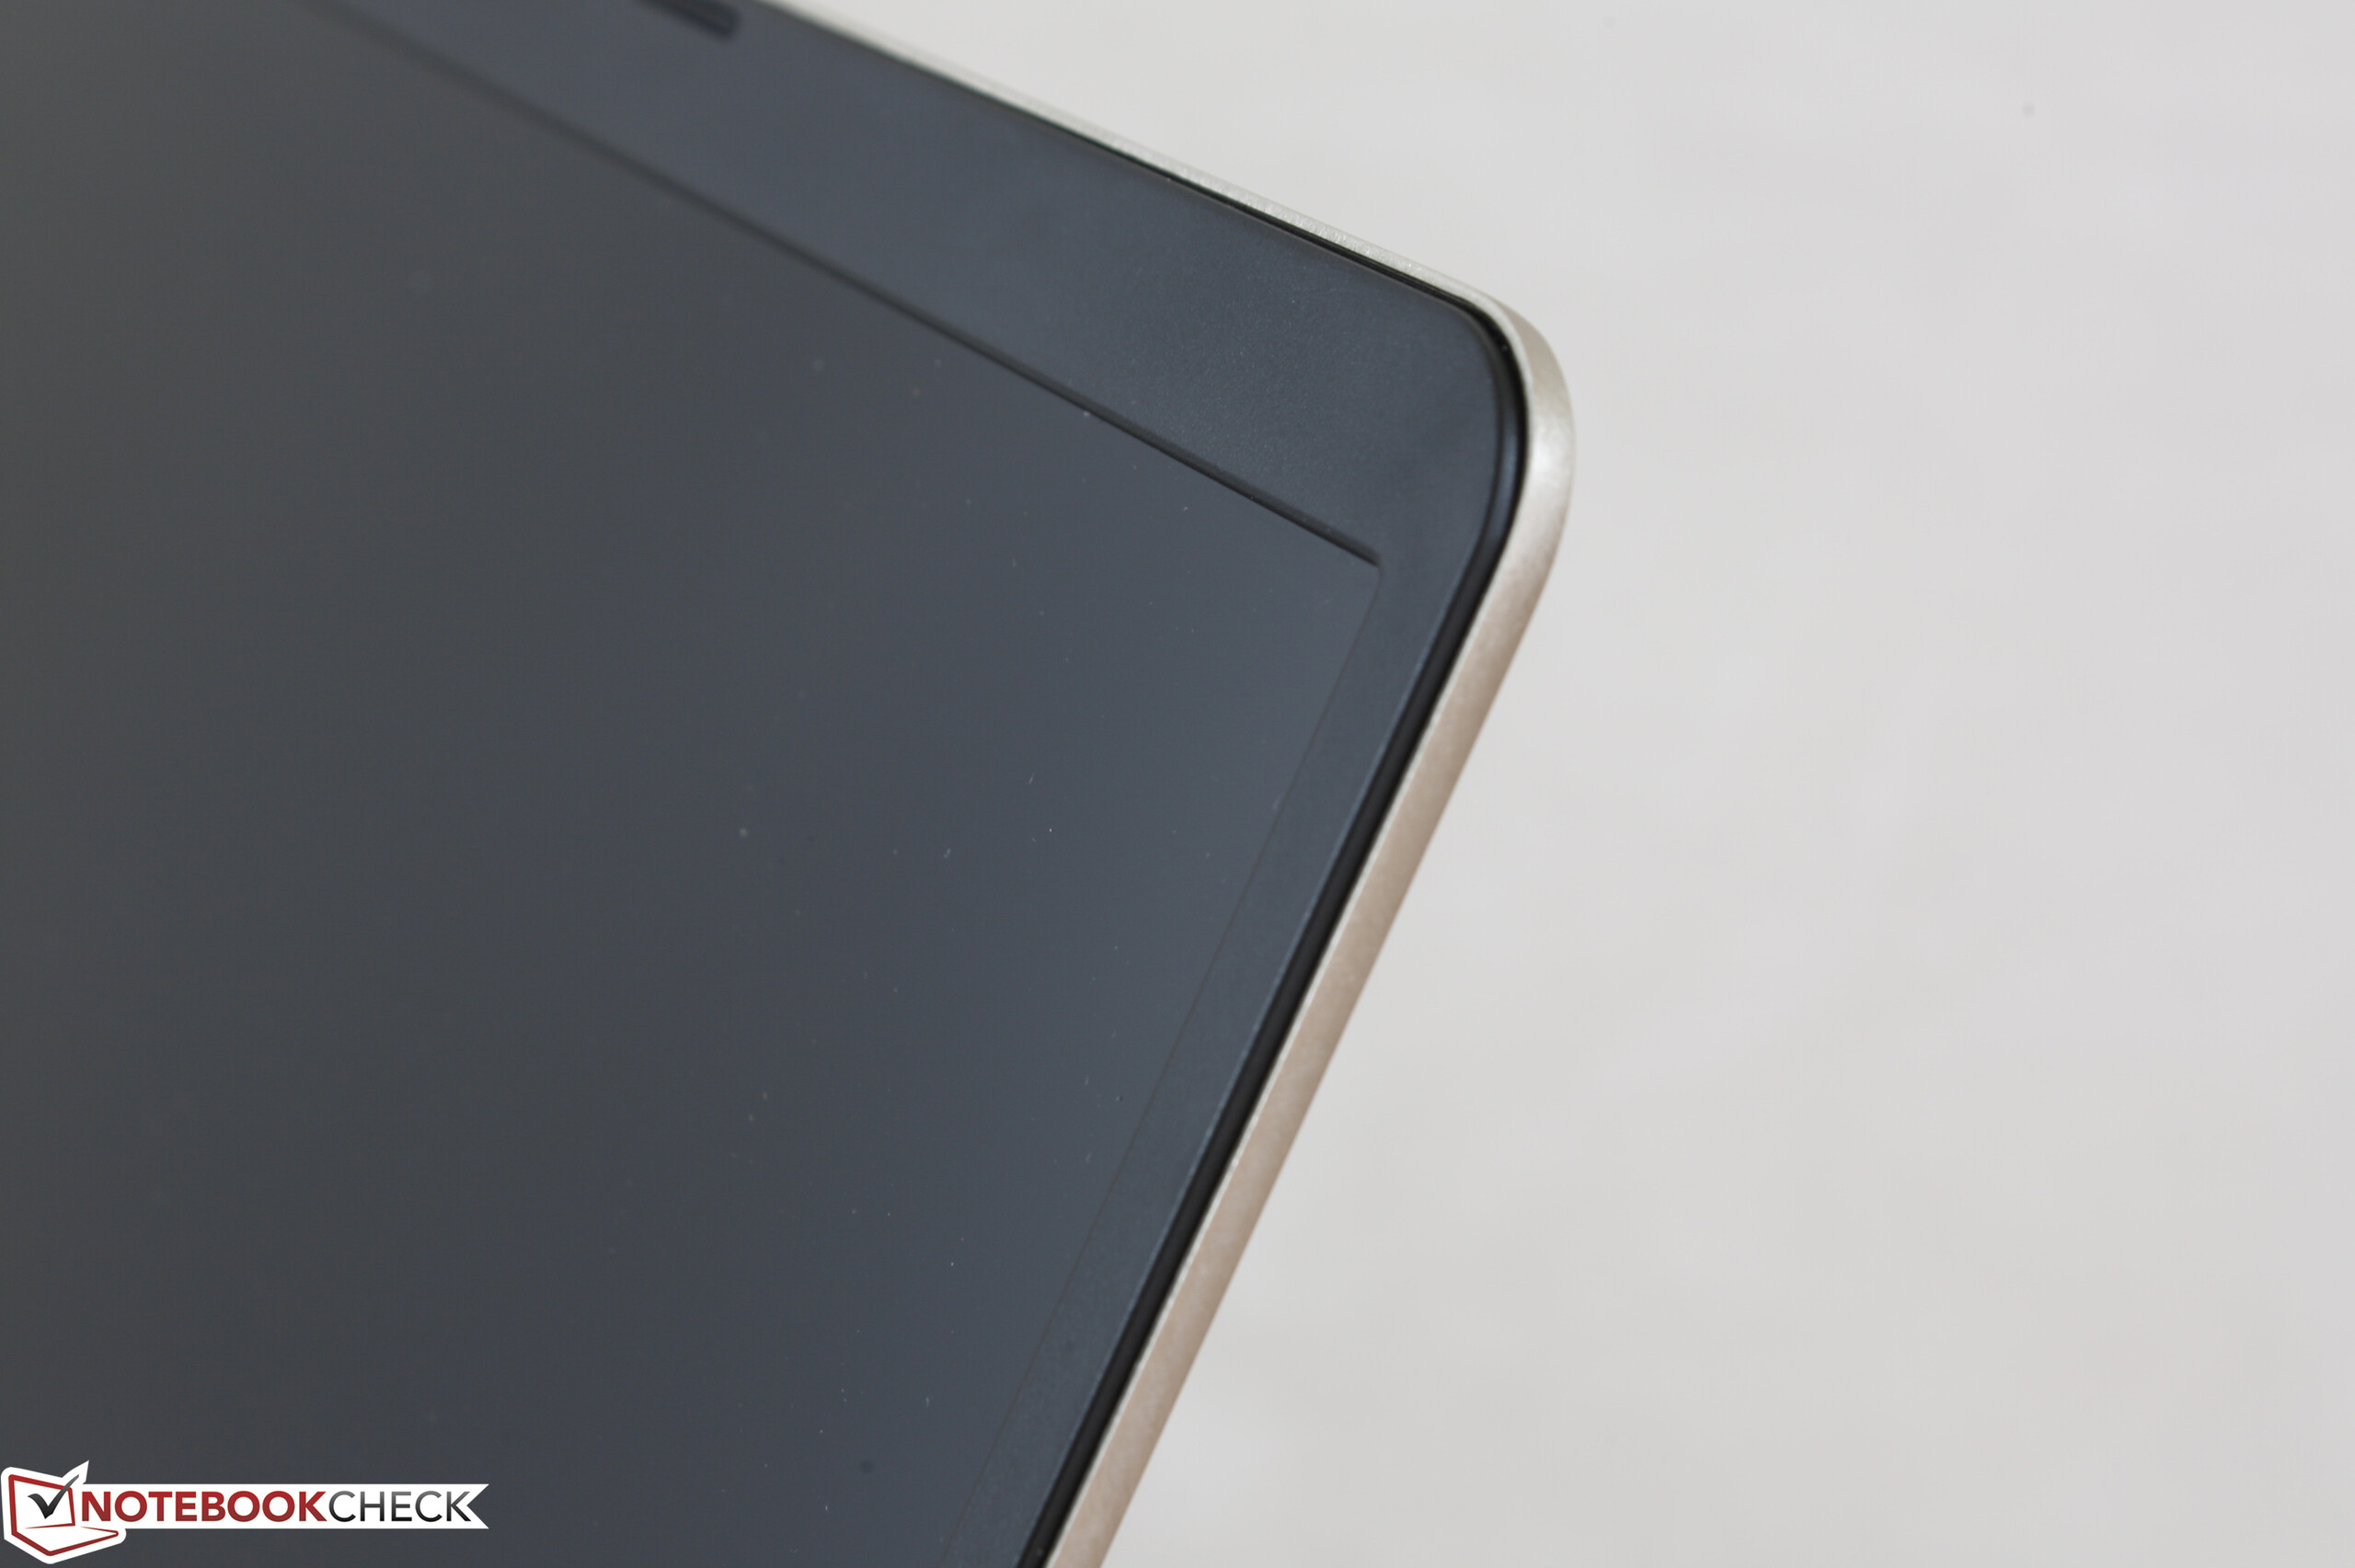
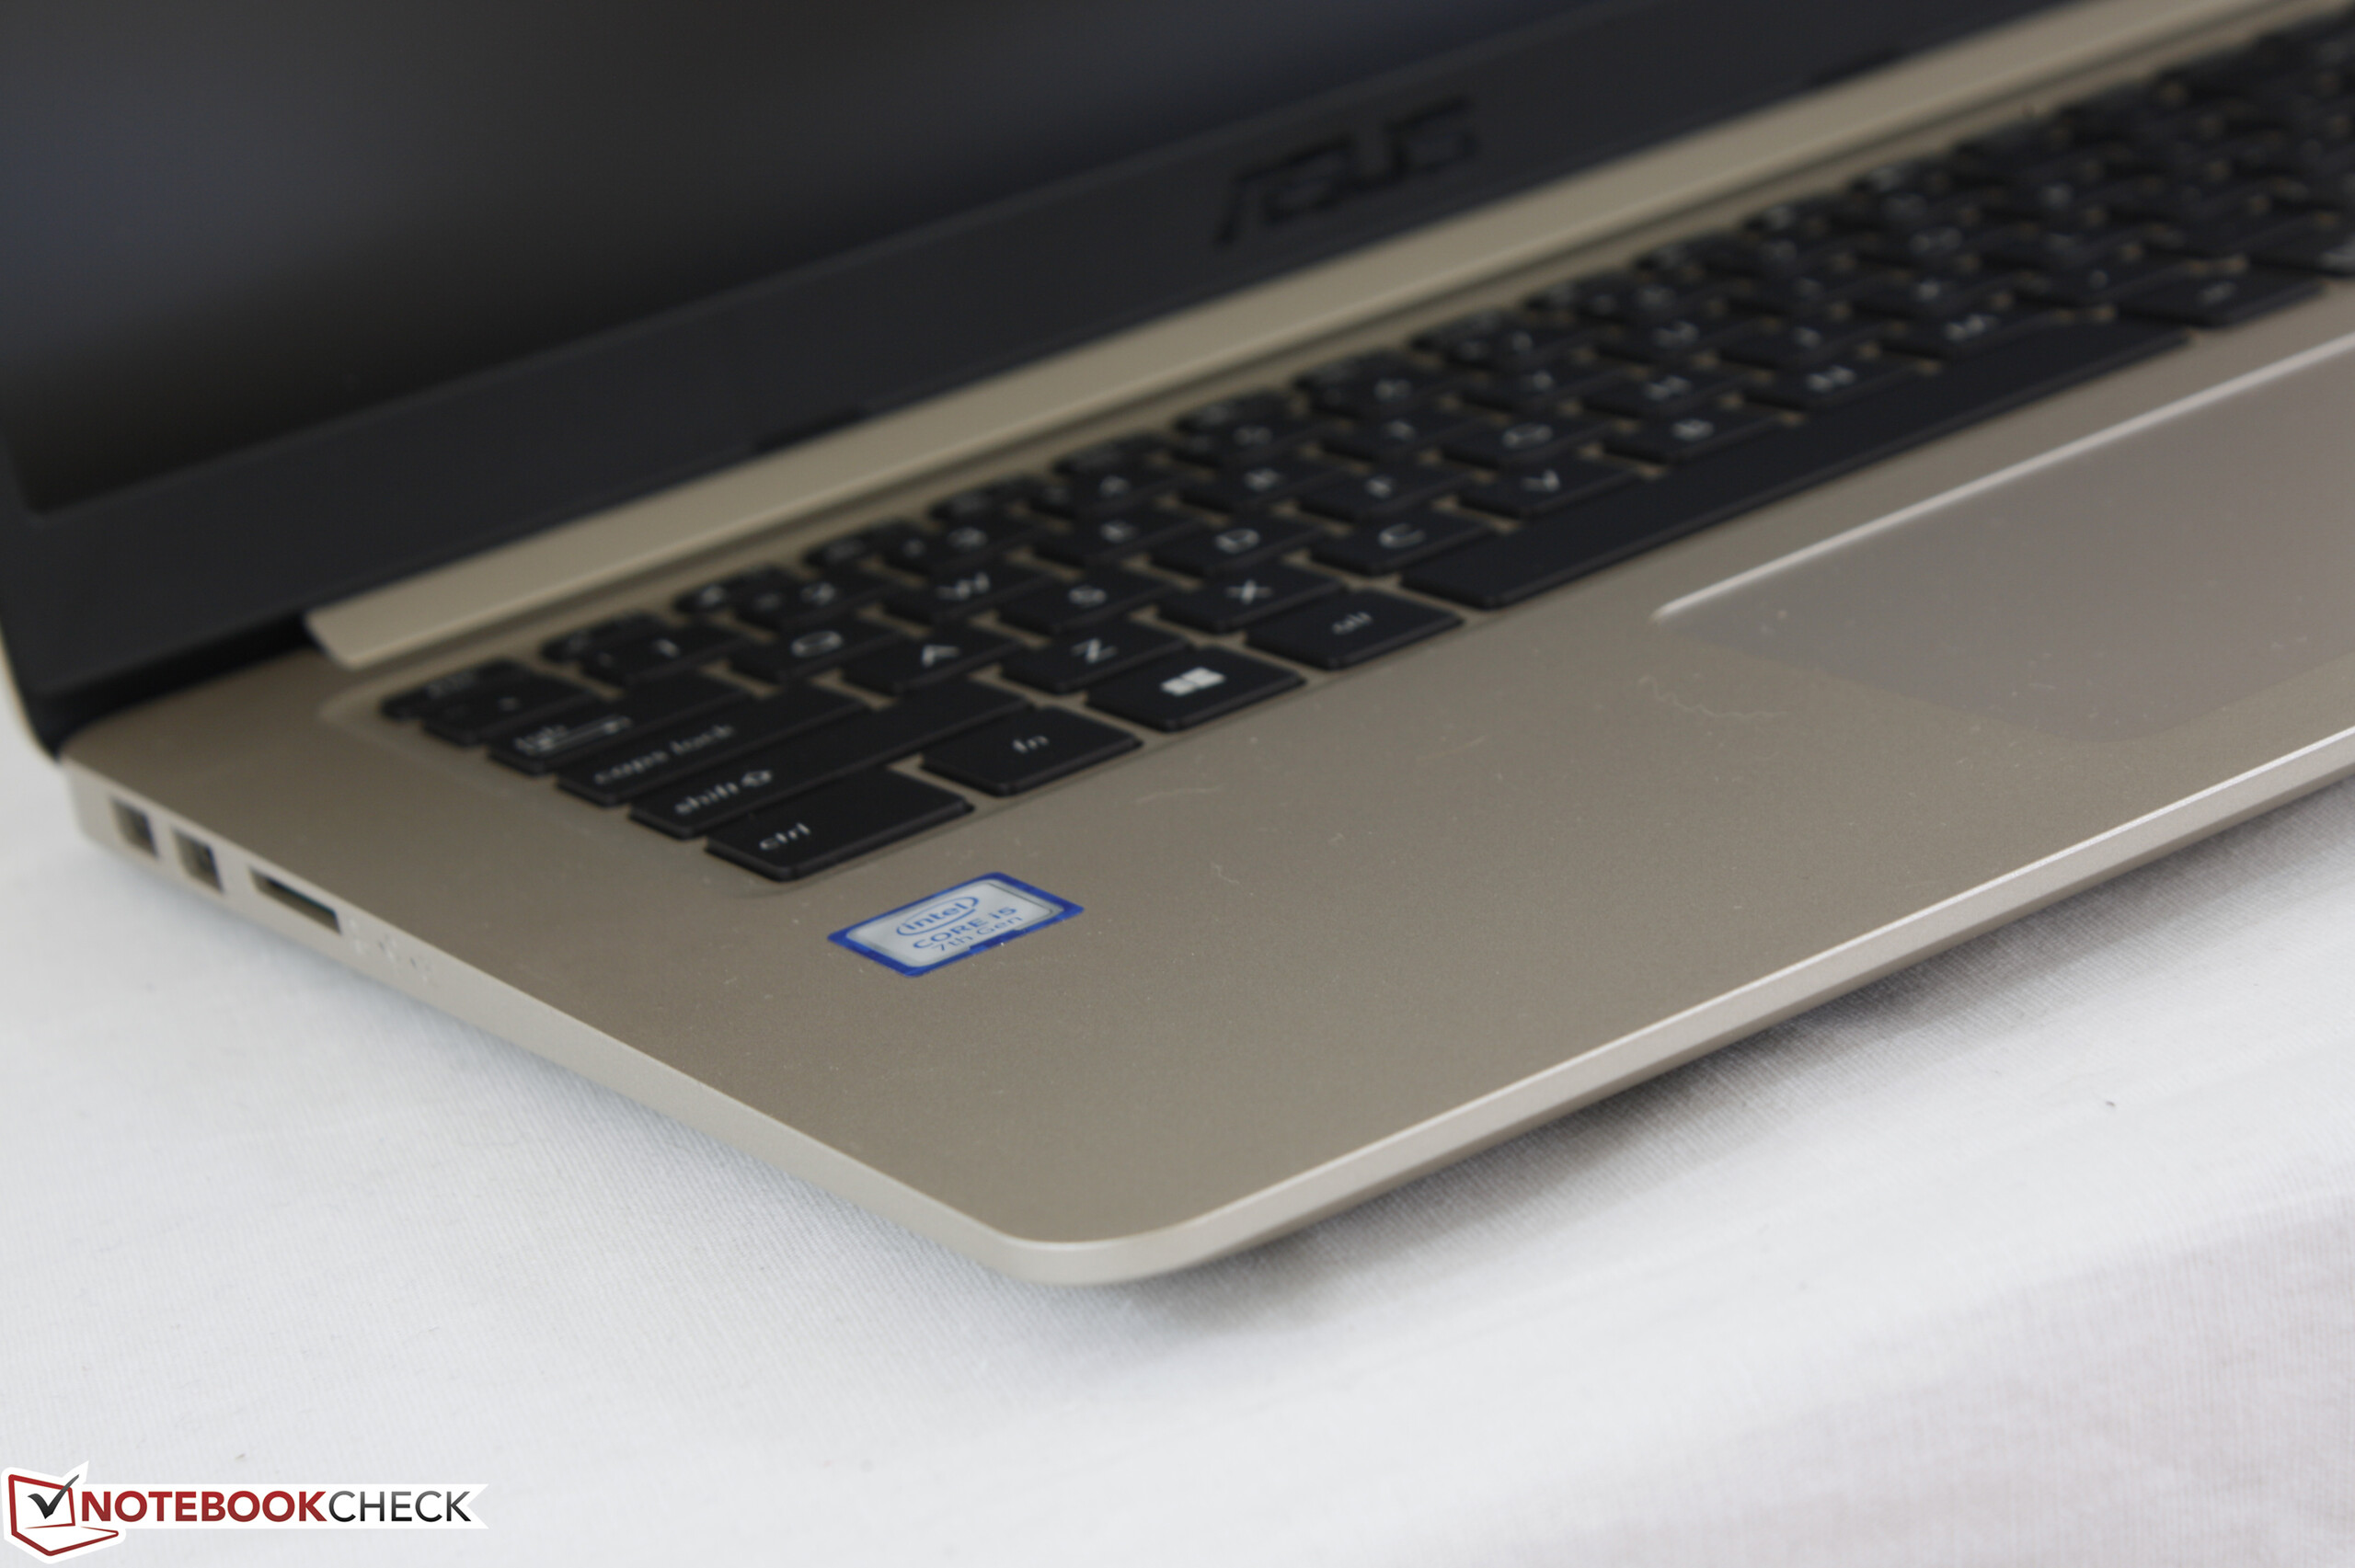
The VivoBook S510 series was designed to be more affordable than the ZenBook, XPS, or Spectre series without being any heavier or less attractive. It is, an essence, a budget-mainstream notebook wrapped in a super-thin flagship design. Asus has succeeded in this regard as the S510UA starts for far less than $1000 USD and its narrow bezels naturally lead to a smaller footprint when compared to more typical budget-mainstream notebooks in the Pavilion, Inspiron, or IdeaPad families. We're especially relieved to see no cut corners on display quality or core performance as the processor can sustain Turbo Boost speeds without much of an issue. The relatively low fan noise is another high note especially when compared to the more energetic fans of the XPS 15.
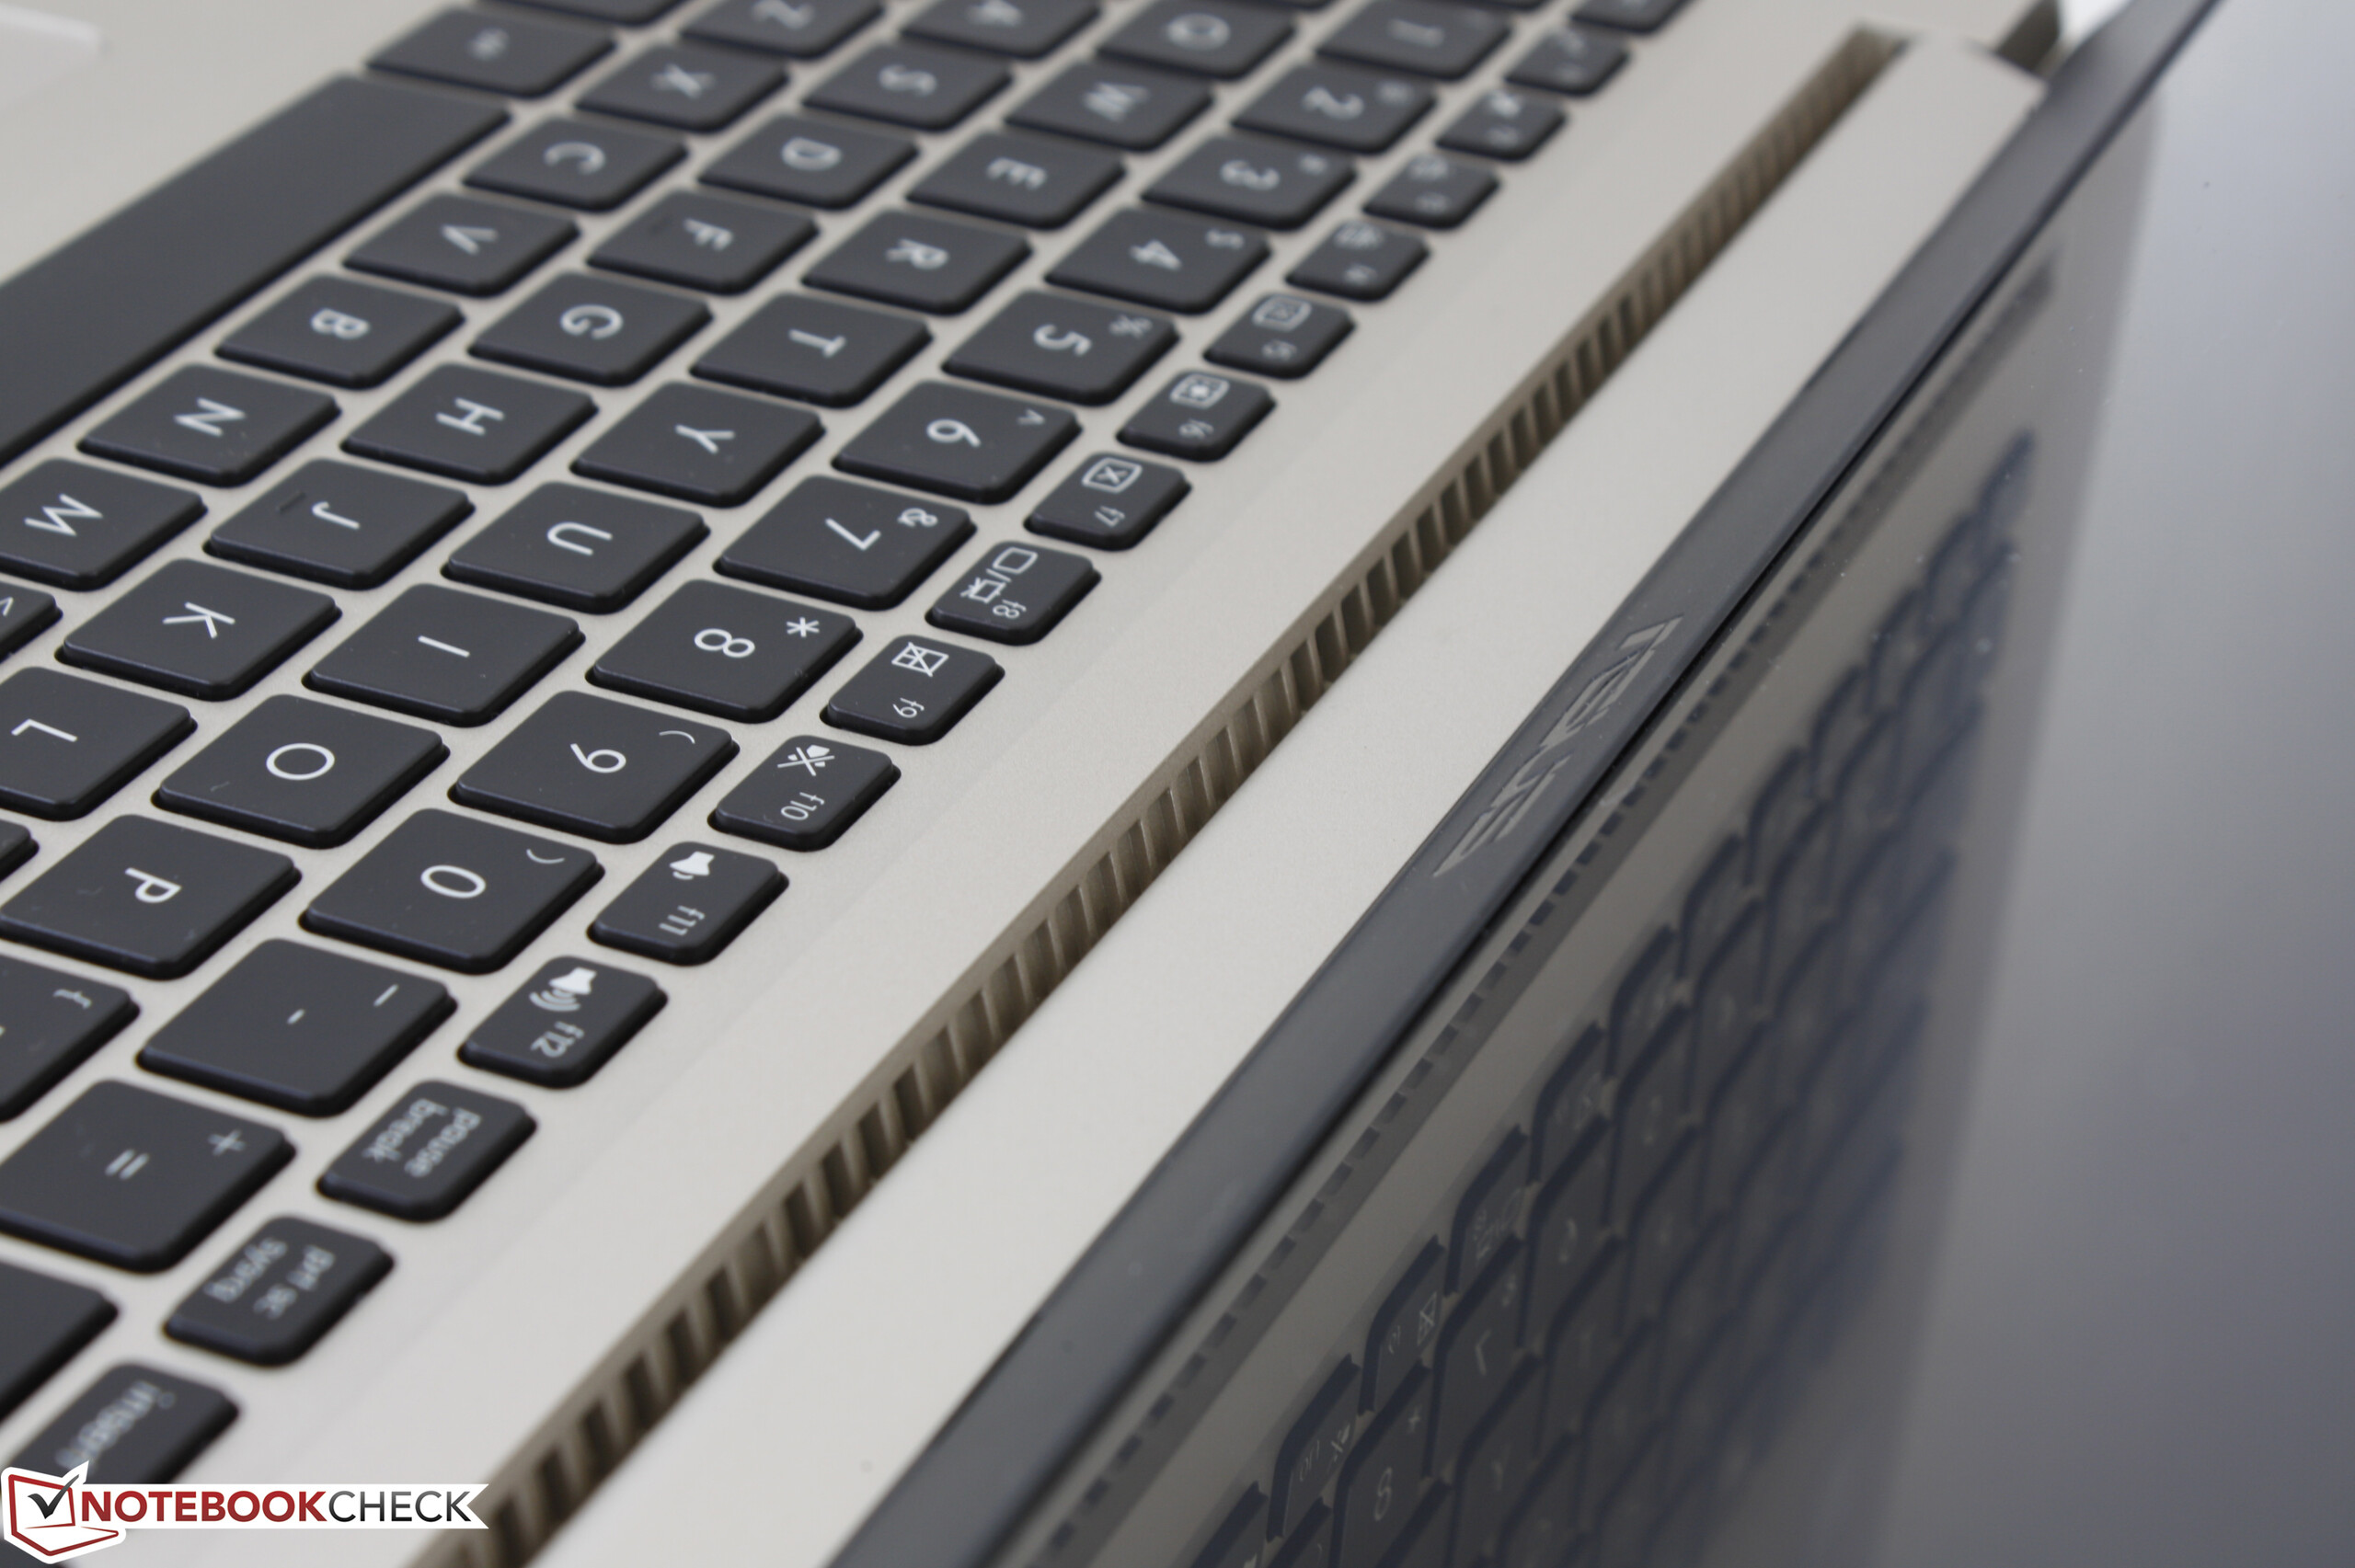
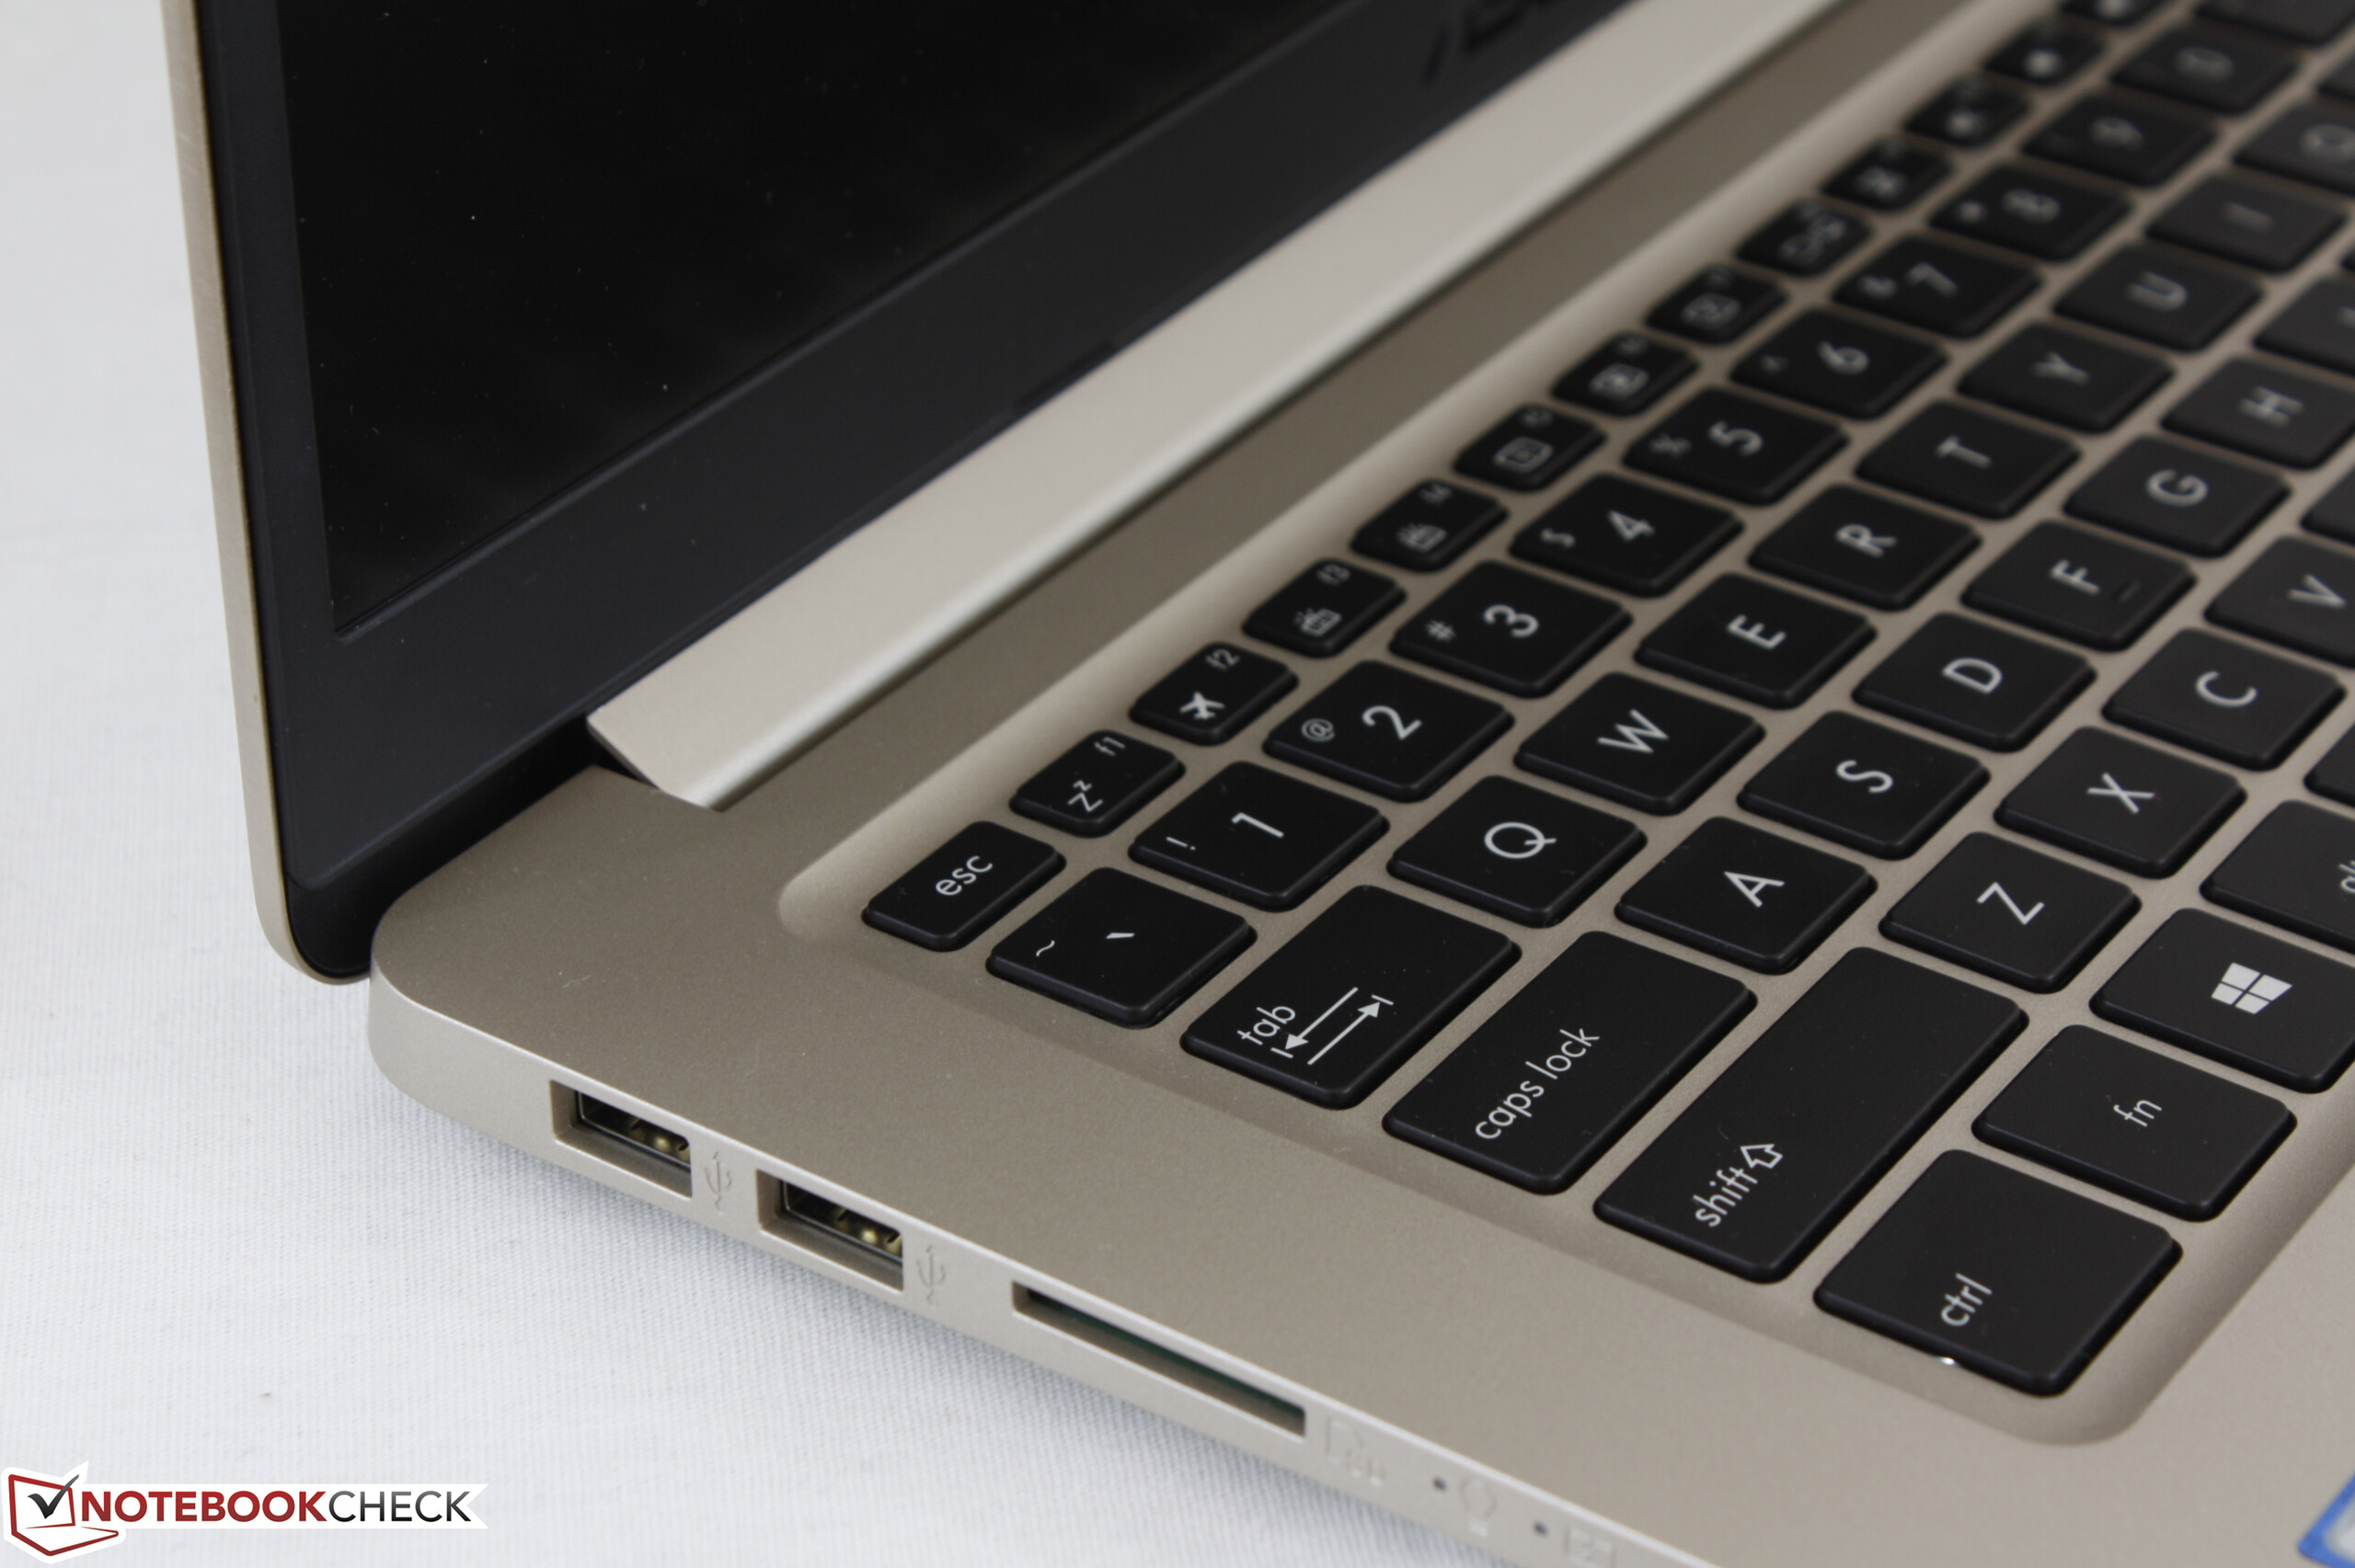
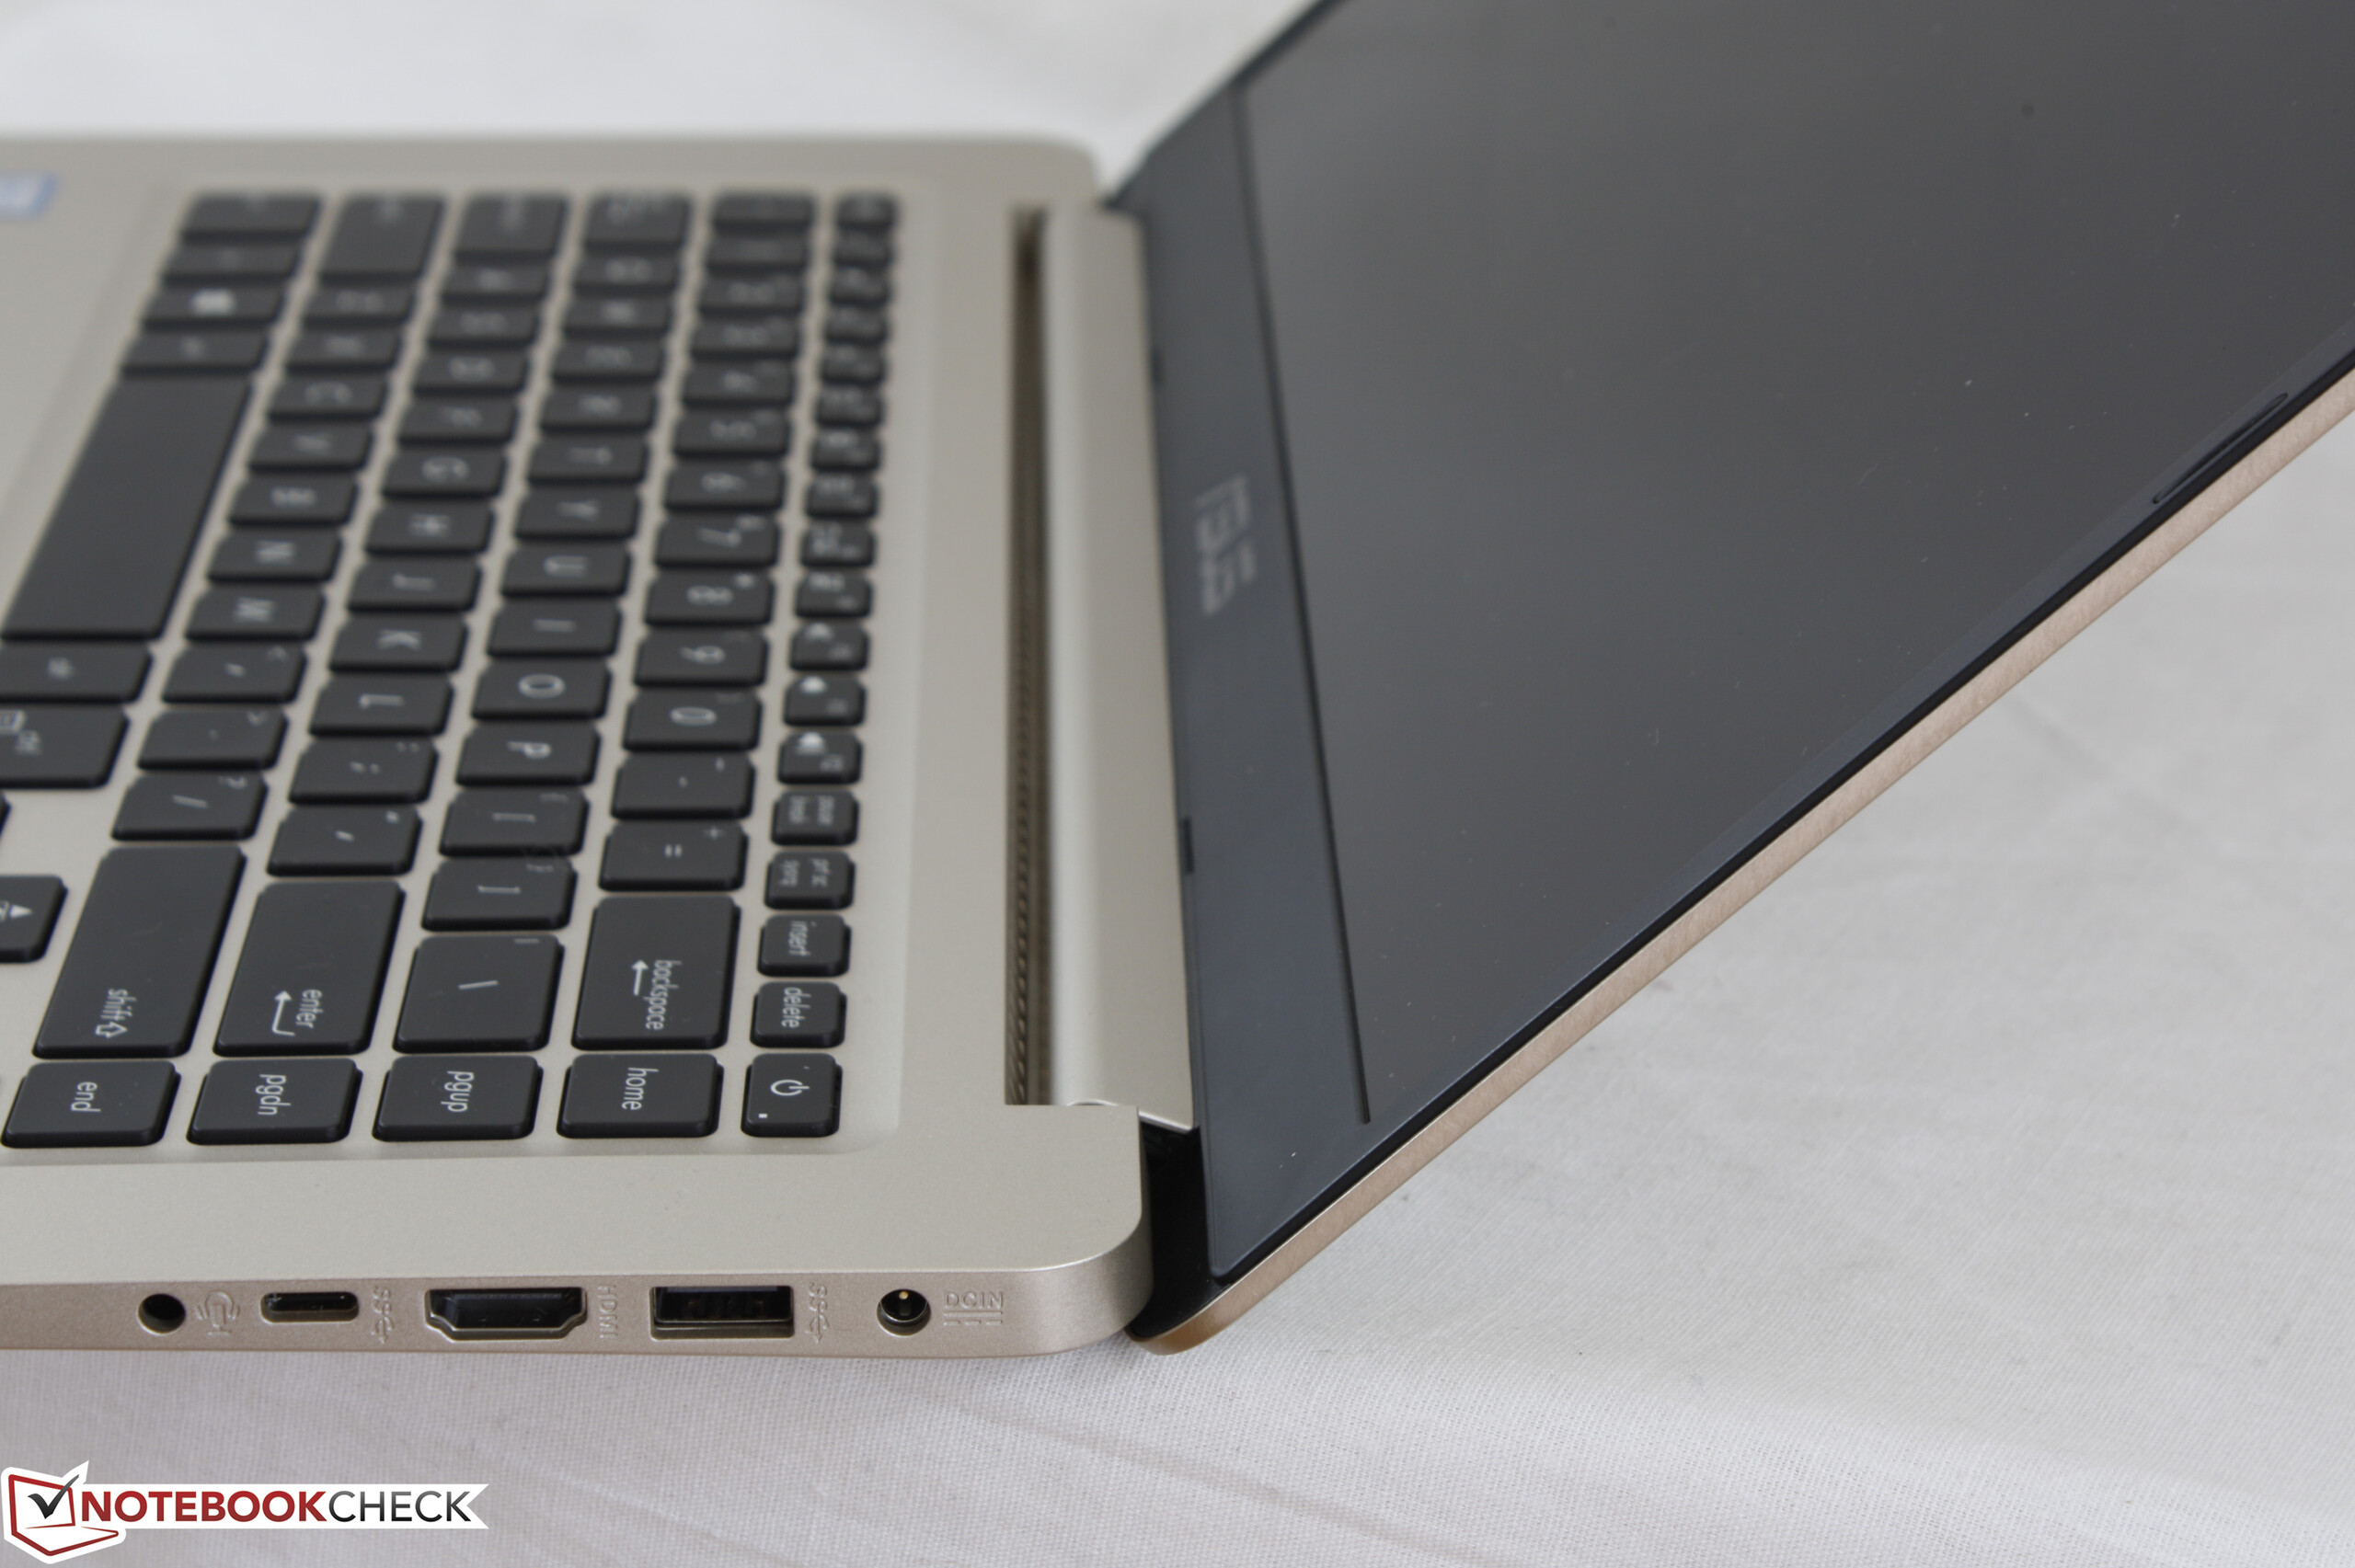
Where the S510UA falters, however, is hard to ignore. The case is not very rigid and both the keyboard and trackpad do not feel as firm as they could have been. Its chassis may look like a flagship offering, but it doesn't feel anywhere near as solid as one. Battery life is short and the superficial dent on the bottom of the notebook around the processor is telling of a more budget or economical design. Hopefully these strange hardware flaws on our test unit are not indicative of a wider problem with the new VivoBook S15 series as a whole, so we'll likely check out more SKUs in the future for a better perspective.
We can absolutely recommend the VivoBook S15 S510 over an older HP Pavilion 15 or Asus F series if affordability and portability are of top concerns. Otherwise, users who want to invest about $200 or $300 USD more on an introductory ZenBook, XPS, or Spectre SKU will find a vastly superior experience.
The lightweight S510UA looks sleek, performs wonderfully, and carries a respectable 1080p IPS matte display. The spongy keyboard, below average battery life, and odd hardware hitches on our test unit suggest that buyers should tread carefully before investing in the new VivoBook S15 series.
Asus VivoBook S15 S510UA
- 06/11/2017 v6 (old)
Allen Ngo
Price comparison
