戴尔XPS 13 7390二合一笔记本电脑评测:强过以往任何XPS


| SD Card Reader | |
| average JPG Copy Test (av. of 3 runs) | |
| Dell XPS 13 9380 2019 (Toshiba Exceria Pro SDXC 64 GB UHS-II) | |
| Dell XPS 13 9370 FHD i5 (Toshiba Exceria Pro M501 64 GB UHS-II) | |
| Dell XPS 13 7390 2-in-1 Core i3 (Toshiba Exceria Pro M501 64 GB UHS-II) | |
| Dell XPS 13 7390 2-in-1 Core i7 (Toshiba Exceria Pro M501 64 GB UHS-II) | |
| Dell XPS 13-9365 2-in-1 (Toshiba THN-M401S0640E2) | |
| maximum AS SSD Seq Read Test (1GB) | |
| Dell XPS 13 9370 FHD i5 (Toshiba Exceria Pro M501 64 GB UHS-II) | |
| Dell XPS 13 7390 2-in-1 Core i3 (Toshiba Exceria Pro M501 64 GB UHS-II) | |
| Dell XPS 13 9380 2019 (Toshiba Exceria Pro SDXC 64 GB UHS-II) | |
| Dell XPS 13 7390 2-in-1 Core i7 (Toshiba Exceria Pro M501 64 GB UHS-II) | |
| Dell XPS 13-9365 2-in-1 (Toshiba THN-M401S0640E2) | |
| |||||||||||||||||||||||||
Brightness Distribution: 86 %
Center on Battery: 549.8 cd/m²
Contrast: 1410:1 (Black: 0.39 cd/m²)
ΔE ColorChecker Calman: 2.12 | ∀{0.5-29.43 Ø4.73}
calibrated: 1.37
ΔE Greyscale Calman: 2.6 | ∀{0.09-98 Ø4.97}
99.7% sRGB (Argyll 1.6.3 3D)
65.4% AdobeRGB 1998 (Argyll 1.6.3 3D)
71.5% AdobeRGB 1998 (Argyll 3D)
99.2% sRGB (Argyll 3D)
69.9% Display P3 (Argyll 3D)
Gamma: 2.3
CCT: 6884 K
| Dell XPS 13 7390 2-in-1 Core i7 Sharp LQ134N1, IPS, 13.4", 1920x1200 | Dell XPS 13 7390 2-in-1 Core i3 Sharp LQ134N1, IPS, 13.4", 1920x1200 | Dell XPS 13 9380 2019 ID: AUO 282B B133ZAN Dell: 90NTH, IPS, 13.3", 3840x2160 | Dell XPS 13 9370 FHD i5 SHP1484, IPS, 13.3", 1920x1080 | Dell XPS 13 9360 FHD i7 Iris SHP1449, IPS, 13.3", 1920x1080 | Dell XPS 13-9365 2-in-1 IPS, 13.3", 1920x1080 | |
|---|---|---|---|---|---|---|
| Display | -2% | -7% | -2% | -24% | -31% | |
| Display P3 Coverage (%) | 69.9 | 68.6 -2% | 64.7 -7% | 68.9 -1% | 51.6 -26% | 47.32 -32% |
| sRGB Coverage (%) | 99.2 | 98.2 -1% | 93.1 -6% | 96.6 -3% | 77.4 -22% | 71.1 -28% |
| AdobeRGB 1998 Coverage (%) | 71.5 | 70.4 -2% | 65.3 -9% | 69.6 -3% | 53.3 -25% | 48.83 -32% |
| Response Times | -6% | -23% | -44% | 5% | -7% | |
| Response Time Grey 50% / Grey 80% * (ms) | 47.6 ? | 46 ? 3% | 58 ? -22% | 62.4 ? -31% | 41.2 ? 13% | 48 ? -1% |
| Response Time Black / White * (ms) | 29.2 ? | 33.6 ? -15% | 36 ? -23% | 45.6 ? -56% | 30 ? -3% | 32.8 ? -12% |
| PWM Frequency (Hz) | 2500 ? | 2525 ? | 1008 ? | 19530 ? | 1042 ? | |
| Screen | 6% | -35% | -25% | -47% | -74% | |
| Brightness middle (cd/m²) | 549.8 | 576.3 5% | 404 -27% | 428 -22% | 461 -16% | 322.6 -41% |
| Brightness (cd/m²) | 520 | 555 7% | 389 -25% | 405 -22% | 418 -20% | 306 -41% |
| Brightness Distribution (%) | 86 | 88 2% | 85 -1% | 87 1% | 85 -1% | 91 6% |
| Black Level * (cd/m²) | 0.39 | 0.33 15% | 0.37 5% | 0.26 33% | 0.2 49% | 0.19 51% |
| Contrast (:1) | 1410 | 1746 24% | 1092 -23% | 1646 17% | 2305 63% | 1698 20% |
| Colorchecker dE 2000 * | 2.12 | 1.45 32% | 3.72 -75% | 3.8 -79% | 5.4 -155% | 7.7 -263% |
| Colorchecker dE 2000 max. * | 3.66 | 4.12 -13% | 7.38 -102% | 7.2 -97% | 12.2 -233% | 11.1 -203% |
| Colorchecker dE 2000 calibrated * | 1.37 | 1.19 13% | 2.06 -50% | |||
| Greyscale dE 2000 * | 2.6 | 3.1 -19% | 4.44 -71% | 4.4 -69% | 5.4 -108% | 7.9 -204% |
| Gamma | 2.3 96% | 2.27 97% | 2.34 94% | 2.21 100% | 2.15 102% | 2.88 76% |
| CCT | 6884 94% | 6931 94% | 7095 92% | 7067 92% | 7258 90% | 7044 92% |
| Color Space (Percent of AdobeRGB 1998) (%) | 65.4 | 64.2 -2% | 60 -8% | 62.8 -4% | 48.6 -26% | 44.1 -33% |
| Color Space (Percent of sRGB) (%) | 99.7 | 98.5 -1% | 93 -7% | 96.4 -3% | 76.9 -23% | 69.9 -30% |
| Total Average (Program / Settings) | -1% /
3% | -22% /
-28% | -24% /
-23% | -22% /
-36% | -37% /
-56% |
* ... smaller is better
Display Response Times
| ↔ Response Time Black to White | ||
|---|---|---|
| 29.2 ms ... rise ↗ and fall ↘ combined | ↗ 16 ms rise | 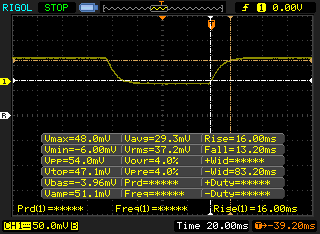 |
| ↘ 13.2 ms fall | ||
| The screen shows relatively slow response rates in our tests and may be too slow for gamers. In comparison, all tested devices range from 0.1 (minimum) to 240 (maximum) ms. » 78 % of all devices are better. This means that the measured response time is worse than the average of all tested devices (19.9 ms). | ||
| ↔ Response Time 50% Grey to 80% Grey | ||
| 47.6 ms ... rise ↗ and fall ↘ combined | ↗ 23.2 ms rise | 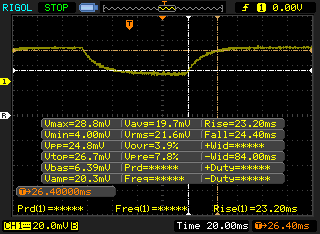 |
| ↘ 24.4 ms fall | ||
| The screen shows slow response rates in our tests and will be unsatisfactory for gamers. In comparison, all tested devices range from 0.165 (minimum) to 636 (maximum) ms. » 82 % of all devices are better. This means that the measured response time is worse than the average of all tested devices (31.1 ms). | ||
Screen Flickering / PWM (Pulse-Width Modulation)
| Screen flickering / PWM detected | 2500 Hz | ≤ 25 % brightness setting | 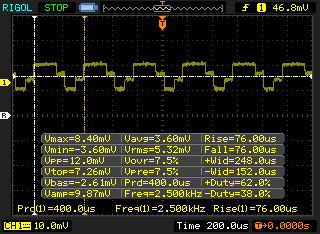 |
The display backlight flickers at 2500 Hz (worst case, e.g., utilizing PWM) Flickering detected at a brightness setting of 25 % and below. There should be no flickering or PWM above this brightness setting. The frequency of 2500 Hz is quite high, so most users sensitive to PWM should not notice any flickering. In comparison: 52 % of all tested devices do not use PWM to dim the display. If PWM was detected, an average of 7784 (minimum: 5 - maximum: 343500) Hz was measured. | |||
| Cinebench R20 | |
| CPU (Single Core) | |
| Dell XPS 13 7390 2-in-1 Core i7 | |
| Intel SDS Core i7-1065G7 Preliminary Sample 25 W | |
| Dell XPS 15 7590 9980HK GTX 1650 | |
| Intel SDS Core i7-1065G7 Preliminary Sample 15 W | |
| Average Intel Core i7-1065G7 (358 - 474, n=31) | |
| Dell G5 15 5590 | |
| Dell XPS 13 7390 2-in-1 Core i3 | |
| Dell Latitude 14 5495 | |
| Dell Inspiron 15 5000 5585 | |
| CPU (Multi Core) | |
| Dell XPS 15 7590 9980HK GTX 1650 | |
| Dell G5 15 5590 | |
| Dell XPS 13 7390 2-in-1 Core i7 | |
| Intel SDS Core i7-1065G7 Preliminary Sample 25 W | |
| Average Intel Core i7-1065G7 (1081 - 2024, n=31) | |
| Dell Inspiron 15 5000 5585 | |
| Dell Latitude 14 5495 | |
| Intel SDS Core i7-1065G7 Preliminary Sample 15 W | |
| Dell XPS 13 7390 2-in-1 Core i3 | |
| PCMark 8 Home Score Accelerated v2 | 3982 points | |
| PCMark 8 Work Score Accelerated v2 | 5086 points | |
| PCMark 10 Score | 4677 points | |
Help | ||
| Dell XPS 13 7390 2-in-1 Core i7 Toshiba BG4 KBG40ZPZ512G | Dell XPS 13 7390 2-in-1 Core i3 Toshiba BG4 KBG40ZPZ256G | Dell XPS 13 9380 2019 SK hynix PC401 HFS256GD9TNG | Dell XPS 13-9365 2-in-1 Toshiba NVMe THNSN5256GPUK | Dell Latitude 7200 WDC PC SN520 SDAPNUW-512G | Dell Latitude 13 5300 2-in-1 SK hynix PC401 HFS256GD9TNG | |
|---|---|---|---|---|---|---|
| AS SSD | -11% | -5% | -10% | 63% | -4% | |
| Seq Read (MB/s) | 1801 | 1558 -13% | 2035 13% | 1283 -29% | 1294 -28% | 1236 -31% |
| Seq Write (MB/s) | 1125 | 1103 -2% | 658 -42% | 735 -35% | 856 -24% | 500 -56% |
| 4K Read (MB/s) | 39.7 | 37.52 -5% | 39.74 0% | 37.69 -5% | 42.52 7% | 40.1 1% |
| 4K Write (MB/s) | 67 | 59 -12% | 105.7 58% | 96.9 45% | 141 110% | 115.7 73% |
| 4K-64 Read (MB/s) | 1253 | 1684 34% | 461 -63% | 586 -53% | 983 -22% | 474.1 -62% |
| 4K-64 Write (MB/s) | 209 | 198.9 -5% | 300.1 44% | 204.7 -2% | 1183 466% | 350.4 68% |
| Access Time Read * (ms) | 0.069 | 0.099 -43% | 0.061 12% | 0.045 35% | 0.057 17% | 0.04 42% |
| Access Time Write * (ms) | 0.625 | 0.722 -16% | 0.051 92% | 0.037 94% | 0.026 96% | 0.051 92% |
| Score Read (Points) | 1472 | 1877 28% | 704 -52% | 752 -49% | 1155 -22% | 638 -57% |
| Score Write (Points) | 388 | 368 -5% | 471 21% | 375 -3% | 1410 263% | 516 33% |
| Score Total (Points) | 2583 | 3180 23% | 1479 -43% | 1495 -42% | 3142 22% | 1456 -44% |
| Copy ISO MB/s (MB/s) | 1293 | 677 -48% | 893 -31% | 950 -27% | 1387 7% | 818 -37% |
| Copy Program MB/s (MB/s) | 560 | 298.4 -47% | 287.9 -49% | 263.8 -53% | 449.5 -20% | 395.5 -29% |
| Copy Game MB/s (MB/s) | 927 | 496.1 -46% | 618 -33% | 726 -22% | 1059 14% | 452.5 -51% |
* ... smaller is better

| 3DMark 11 | |
| 1280x720 Performance GPU | |
| Dell XPS 15 7590 9980HK GTX 1650 | |
| Dell Inspiron 15 7000 7577 | |
| Asus Zenbook UX510UW-CN044T | |
| Dell Inspiron 17-7786 | |
| Dell XPS 13 7390 2-in-1 Core i7 | |
| Huawei MateBook 14 KLV-W29 | |
| Dell Inspiron 15 5000 5585 | |
| Average Intel Iris Plus Graphics G7 (Ice Lake 64 EU) (2112 - 4630, n=28) | |
| Lenovo Ideapad C340-14API 81N6004UGE | |
| Dell XPS 13 7390 2-in-1 Core i3 | |
| Asus ZenBook 14 UX433FA | |
| Dell XPS 15 7590 i5 iGPU FHD | |
| Dell Latitude 3400 | |
| 1280x720 Performance Combined | |
| Dell XPS 15 7590 9980HK GTX 1650 | |
| Dell Inspiron 15 7000 7577 | |
| Huawei MateBook 14 KLV-W29 | |
| Asus Zenbook UX510UW-CN044T | |
| Dell Inspiron 17-7786 | |
| Dell XPS 13 7390 2-in-1 Core i7 | |
| Dell Inspiron 15 5000 5585 | |
| Average Intel Iris Plus Graphics G7 (Ice Lake 64 EU) (1319 - 4163, n=28) | |
| Lenovo Ideapad C340-14API 81N6004UGE | |
| Dell XPS 13 7390 2-in-1 Core i3 | |
| Asus ZenBook 14 UX433FA | |
| Dell XPS 15 7590 i5 iGPU FHD | |
| Dell Latitude 3400 | |
| 3DMark 06 Standard Score | 17752 points | |
| 3DMark 11 Performance | 4958 points | |
| 3DMark Ice Storm Standard Score | 77789 points | |
| 3DMark Cloud Gate Standard Score | 14796 points | |
| 3DMark Fire Strike Score | 2925 points | |
| 3DMark Time Spy Score | 948 points | |
Help | ||
| Rocket League | |
| 1920x1080 High Quality AA:High FX | |
| Dell XPS 15 7590 9980HK GTX 1650 | |
| Acer Aspire 5 A515-52G-723L | |
| Intel SDS Core i7-1065G7 Preliminary Sample 25 W | |
| Intel SDS Core i7-1065G7 Preliminary Sample 15 W | |
| Dell Inspiron 15 5000 5585 | |
| Dell XPS 13 7390 2-in-1 Core i7 | |
| Dell XPS 13 9360 FHD i7 Iris | |
| Dell XPS 13 7390 2-in-1 Core i3 | |
| Dell XPS 13 9370 FHD i5 | |
| Asus ZenBook 14 UX433FA | |
| 1920x1080 Performance | |
| Dell XPS 15 7590 9980HK GTX 1650 | |
| Dell Inspiron 15 5000 5585 | |
| Intel SDS Core i7-1065G7 Preliminary Sample 25 W | |
| Intel SDS Core i7-1065G7 Preliminary Sample 15 W | |
| Dell XPS 13 7390 2-in-1 Core i3 | |
| Dell XPS 13 7390 2-in-1 Core i7 | |
| Asus ZenBook 14 UX433FA | |
| The Witcher 3 - 1920x1080 High Graphics & Postprocessing (Nvidia HairWorks Off) | |
| Dell G5 15 5590 | |
| Dell XPS 15 7590 9980HK GTX 1650 | |
| Dell XPS 15 9575 i5-8305G | |
| Dell Inspiron 15 7000 7577 | |
| Dell XPS 15 2018 i5 FHD 97Wh | |
| Huawei MateBook 14 KLV-W29 | |
| Acer Aspire 5 A515-52G-723L | |
| Dell Inspiron 15 5000 5585 | |
| Intel SDS Core i7-1065G7 Preliminary Sample 15 W | |
| Huawei Matebook X Pro i5 | |
| Intel SDS Core i7-1065G7 Preliminary Sample 25 W | |
| Dell XPS 13 7390 2-in-1 Core i7 | |
| Dell Latitude 14 5495 | |
| Dell XPS 13 7390 2-in-1 Core i3 | |
| Shadow of the Tomb Raider - 1280x720 Lowest Preset | |
| Dell XPS 15 7590 9980HK GTX 1650 | |
| Acer Aspire 5 A515-52G-723L | |
| Dell Inspiron 15 5000 5585 | |
| Intel SDS Core i7-1065G7 Preliminary Sample 15 W | |
| Intel SDS Core i7-1065G7 Preliminary Sample 25 W | |
| Dell XPS 13 7390 2-in-1 Core i7 | |
| Dell XPS 13 9380 2019 | |
| low | med. | high | ultra | |
|---|---|---|---|---|
| Guild Wars 2 (2012) | 105 | 33.2 | 13.9 | |
| StarCraft II: Heart of the Swarm (2013) | 321.1 | 98.1 | 61.6 | 30.6 |
| BioShock Infinite (2013) | 112.6 | 68.6 | 58.1 | 21.3 |
| The Witcher 3 (2015) | 54.9 | 34.4 | 17 | 7.8 |
| Metal Gear Solid V (2015) | 60 | 60 | 31.1 | 18.1 |
| Rise of the Tomb Raider (2016) | 42.4 | 26.9 | 14.7 | 10.5 |
| Doom (2016) | 41.2 | 20.4 | ||
| Overwatch (2016) | 91.4 | 56 | 29.7 | |
| Rocket League (2017) | 114 | 62.6 | 33.8 | |
| Destiny 2 (2017) | 29.4 | 20.4 | ||
| Shadow of the Tomb Raider (2018) | 27 | |||
| F1 2019 (2019) | 35 | 22 | 20 | 13 |
| Borderlands 3 (2019) | 31.8 | 13.8 | 8.7 | 6.6 |
| Dell XPS 13 7390 2-in-1 Core i7 Iris Plus Graphics G7 (Ice Lake 64 EU), i7-1065G7, Toshiba BG4 KBG40ZPZ512G | Dell XPS 13 7390 2-in-1 Core i3 UHD Graphics G1 (Ice Lake 32 EU), i3-1005G1, Toshiba BG4 KBG40ZPZ256G | Dell XPS 13 9380 2019 UHD Graphics 620, i5-8265U, SK hynix PC401 HFS256GD9TNG | Dell XPS 13 9370 FHD i5 UHD Graphics 620, i5-8250U, Toshiba XG5 KXG50ZNV256G | Dell XPS 13 9360 FHD i7 Iris Iris Plus Graphics 640, i7-7560U, Toshiba XG4 NVMe (THNSN5512GPUK) | Dell XPS 13-9365 2-in-1 HD Graphics 615, i7-7Y75, Toshiba NVMe THNSN5256GPUK | |
|---|---|---|---|---|---|---|
| Noise | 0% | -3% | -1% | -2% | ||
| off / environment * (dB) | 28.1 | 28 -0% | 30.4 -8% | 29.1 -4% | 29.9 -6% | |
| Idle Minimum * (dB) | 28.1 | 28 -0% | 30.4 -8% | 29.1 -4% | 29.9 -6% | |
| Idle Average * (dB) | 28.1 | 28 -0% | 30.4 -8% | 29.1 -4% | 29.9 -6% | |
| Idle Maximum * (dB) | 28.1 | 28 -0% | 30.4 -8% | 29.1 -4% | 30.3 -8% | |
| Load Average * (dB) | 31.7 | 31.7 -0% | 31.7 -0% | 32.2 -2% | 33.9 -7% | |
| Witcher 3 ultra * (dB) | 43.4 | |||||
| Load Maximum * (dB) | 43.4 | 43.5 -0% | 38.1 12% | 37.3 14% | 34.9 20% |
* ... smaller is better
Noise level
| Idle |
| 28.1 / 28.1 / 28.1 dB(A) |
| Load |
| 31.7 / 43.4 dB(A) |
 | ||
30 dB silent 40 dB(A) audible 50 dB(A) loud |
||
min: | ||
(-) The maximum temperature on the upper side is 51.4 °C / 125 F, compared to the average of 35.4 °C / 96 F, ranging from 19.6 to 60 °C for the class Convertible.
(-) The bottom heats up to a maximum of 46.4 °C / 116 F, compared to the average of 36.9 °C / 98 F
(+) In idle usage, the average temperature for the upper side is 30.3 °C / 87 F, compared to the device average of 30.3 °C / 87 F.
(±) Playing The Witcher 3, the average temperature for the upper side is 37.7 °C / 100 F, compared to the device average of 30.3 °C / 87 F.
(+) The palmrests and touchpad are reaching skin temperature as a maximum (33.8 °C / 92.8 F) and are therefore not hot.
(-) The average temperature of the palmrest area of similar devices was 28 °C / 82.4 F (-5.8 °C / -10.4 F).
Dell XPS 13 7390 2-in-1 Core i7 audio analysis
(±) | speaker loudness is average but good (80.7 dB)
Bass 100 - 315 Hz
(±) | reduced bass - on average 7.8% lower than median
(±) | linearity of bass is average (12.5% delta to prev. frequency)
Mids 400 - 2000 Hz
(+) | balanced mids - only 4.5% away from median
(+) | mids are linear (6.2% delta to prev. frequency)
Highs 2 - 16 kHz
(+) | balanced highs - only 3.4% away from median
(±) | linearity of highs is average (10.5% delta to prev. frequency)
Overall 100 - 16.000 Hz
(+) | overall sound is linear (14.8% difference to median)
Compared to same class
» 23% of all tested devices in this class were better, 4% similar, 72% worse
» The best had a delta of 6%, average was 20%, worst was 57%
Compared to all devices tested
» 20% of all tested devices were better, 4% similar, 76% worse
» The best had a delta of 4%, average was 24%, worst was 134%
Apple MacBook 12 (Early 2016) 1.1 GHz audio analysis
(+) | speakers can play relatively loud (83.6 dB)
Bass 100 - 315 Hz
(±) | reduced bass - on average 11.3% lower than median
(±) | linearity of bass is average (14.2% delta to prev. frequency)
Mids 400 - 2000 Hz
(+) | balanced mids - only 2.4% away from median
(+) | mids are linear (5.5% delta to prev. frequency)
Highs 2 - 16 kHz
(+) | balanced highs - only 2% away from median
(+) | highs are linear (4.5% delta to prev. frequency)
Overall 100 - 16.000 Hz
(+) | overall sound is linear (10.2% difference to median)
Compared to same class
» 7% of all tested devices in this class were better, 2% similar, 91% worse
» The best had a delta of 5%, average was 18%, worst was 53%
Compared to all devices tested
» 5% of all tested devices were better, 1% similar, 94% worse
» The best had a delta of 4%, average was 24%, worst was 134%
| Off / Standby | |
| Idle | |
| Load |
|
Key:
min: | |
| Dell XPS 13 7390 2-in-1 Core i7 i7-1065G7, Iris Plus Graphics G7 (Ice Lake 64 EU), Toshiba BG4 KBG40ZPZ512G, IPS, 1920x1200, 13.4" | HP Envy x360 13-ar0601ng R7 3700U, Vega 10, SK Hynix BC501 HFM512GDJTNG, IPS, 120 Hz, 1920x1080, 13.3" | Dell XPS 13 7390 2-in-1 Core i3 i3-1005G1, UHD Graphics G1 (Ice Lake 32 EU), Toshiba BG4 KBG40ZPZ256G, IPS, 1920x1200, 13.4" | Dell XPS 13 9380 2019 i5-8265U, UHD Graphics 620, SK hynix PC401 HFS256GD9TNG, IPS, 3840x2160, 13.3" | Dell XPS 13 9370 FHD i5 i5-8250U, UHD Graphics 620, Toshiba XG5 KXG50ZNV256G, IPS, 1920x1080, 13.3" | Dell XPS 13-9365 2-in-1 i7-7Y75, HD Graphics 615, Toshiba NVMe THNSN5256GPUK, IPS, 1920x1080, 13.3" | |
|---|---|---|---|---|---|---|
| Power Consumption | -2% | 1% | -37% | 1% | 25% | |
| Idle Minimum * (Watt) | 2.6 | 3.2 -23% | 3 -15% | 4.8 -85% | 3.14 -21% | 3.1 -19% |
| Idle Average * (Watt) | 5.3 | 2.8 47% | 5.4 -2% | 8.6 -62% | 5.22 2% | 4.3 19% |
| Idle Maximum * (Watt) | 7 | 12.4 -77% | 7.3 -4% | 10.4 -49% | 6 14% | 4.9 30% |
| Load Average * (Watt) | 43.1 | 24.2 44% | 33.4 23% | 37.9 12% | 38.5 11% | 24.3 44% |
| Witcher 3 ultra * (Watt) | 43.1 | |||||
| Load Maximum * (Watt) | 49 | 50 -2% | 48.3 1% | 48.5 1% | 50.4 -3% | 22.8 53% |
* ... smaller is better
| Dell XPS 13 7390 2-in-1 Core i7 i7-1065G7, Iris Plus Graphics G7 (Ice Lake 64 EU), 51 Wh | Dell XPS 13 7390 2-in-1 Core i3 i3-1005G1, UHD Graphics G1 (Ice Lake 32 EU), 51 Wh | Dell XPS 13 9380 2019 i5-8265U, UHD Graphics 620, 52 Wh | Dell XPS 13 9370 FHD i5 i5-8250U, UHD Graphics 620, 52 Wh | Dell XPS 13 9360 FHD i7 Iris i7-7560U, Iris Plus Graphics 640, 60 Wh | Dell XPS 13-9365 2-in-1 i7-7Y75, HD Graphics 615, 46 Wh | |
|---|---|---|---|---|---|---|
| Battery runtime | -1% | -8% | 19% | 21% | 27% | |
| WiFi v1.3 (h) | 9 | 8.9 -1% | 8.3 -8% | 10.7 19% | 10.9 21% | 11.4 27% |
| Reader / Idle (h) | 35.7 | 17.2 | 23.6 | 25.4 | 16.2 | |
| Load (h) | 2.2 | 2.4 | 2 | 2.6 | 2.9 |
Pros
Cons
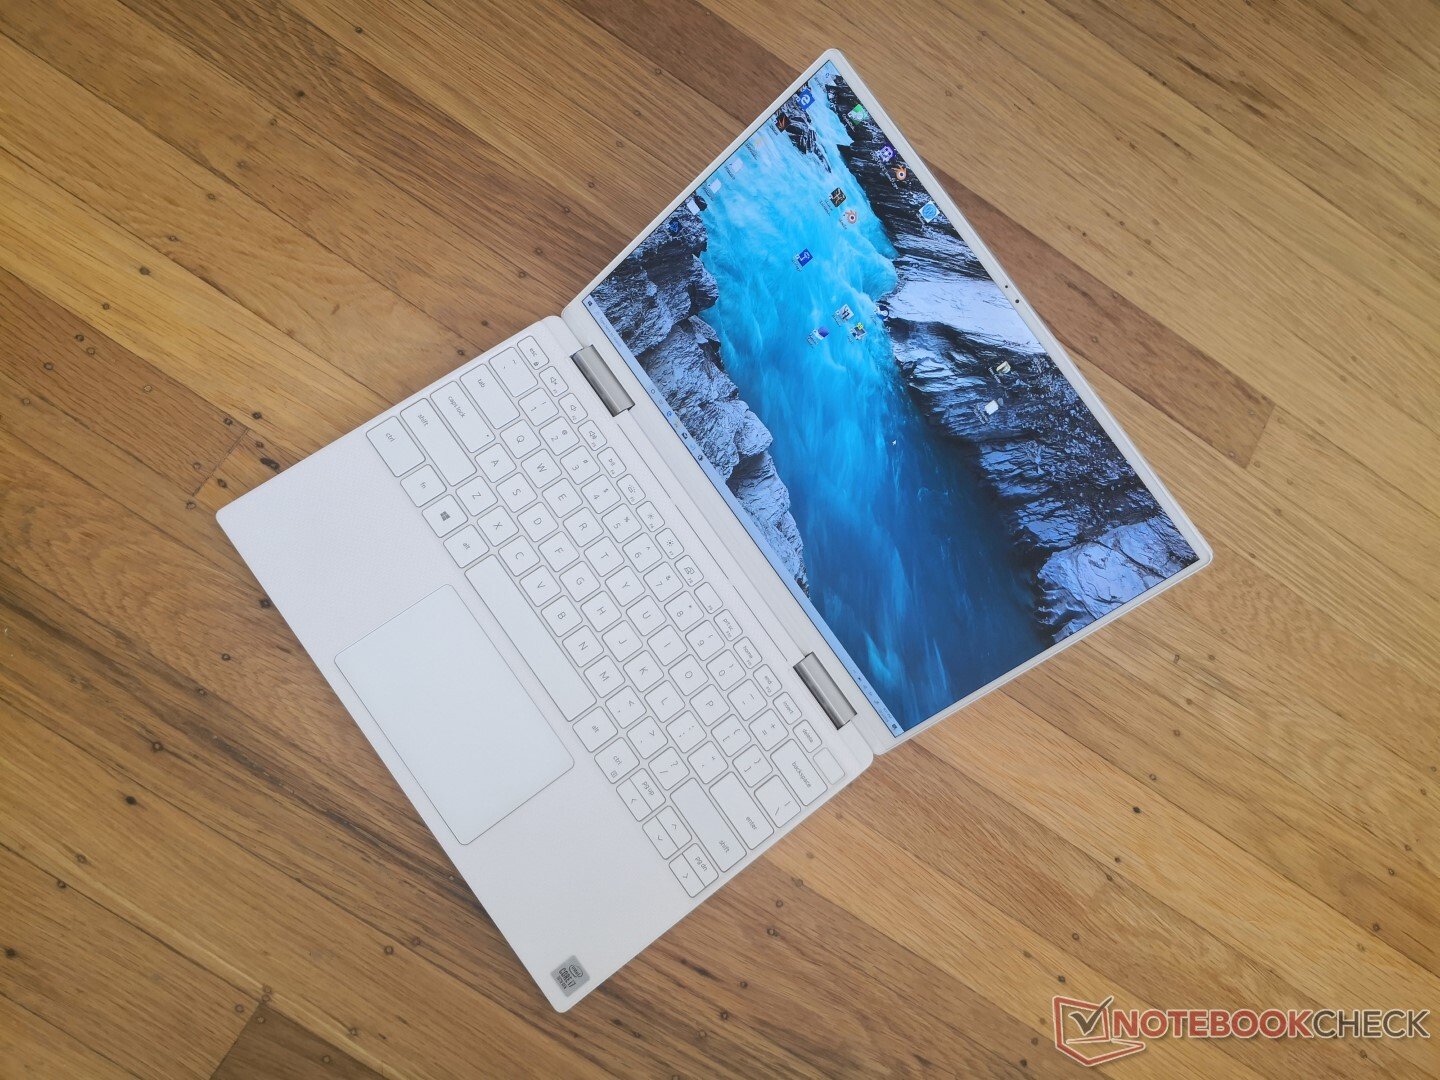
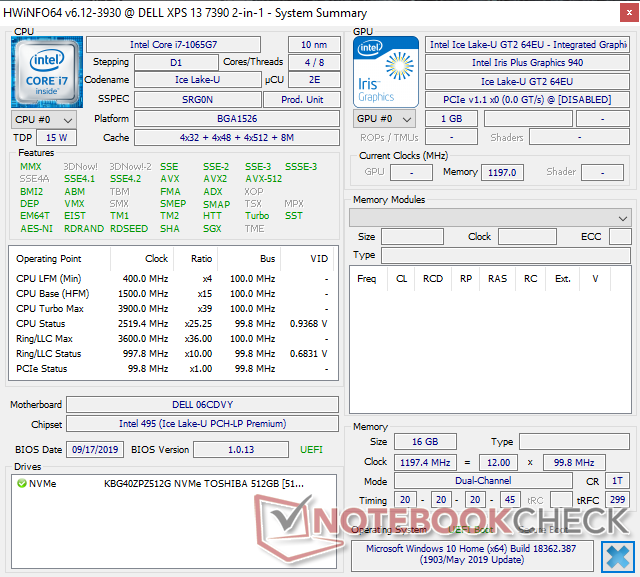
XPS 13 7390 2合1有两个值得关注的地方:全新处理器,然后是笔记本电脑本身。 25 W Ice Lake CPU是对上一代15 W Whiskey Lake-U系列CPU和GPU的升级。变化幅度足够大,因此该二合一笔记本实际上可以胜过之前的任何XPS 13。即使在CPU必须比平时温度更高的情况下运行,您仍可以在如此轻巧的笔记本上运行流行的多人游戏,这一事实已经是一个了不起的成就。在这种情况下,Ice Lake实现了英特尔想要做的事情:以更高的每瓦性能提供与35 W AMD Ryzen 7 3700U相当的原始性能,同时集成了AI加速功能以更好地适应未来发展。
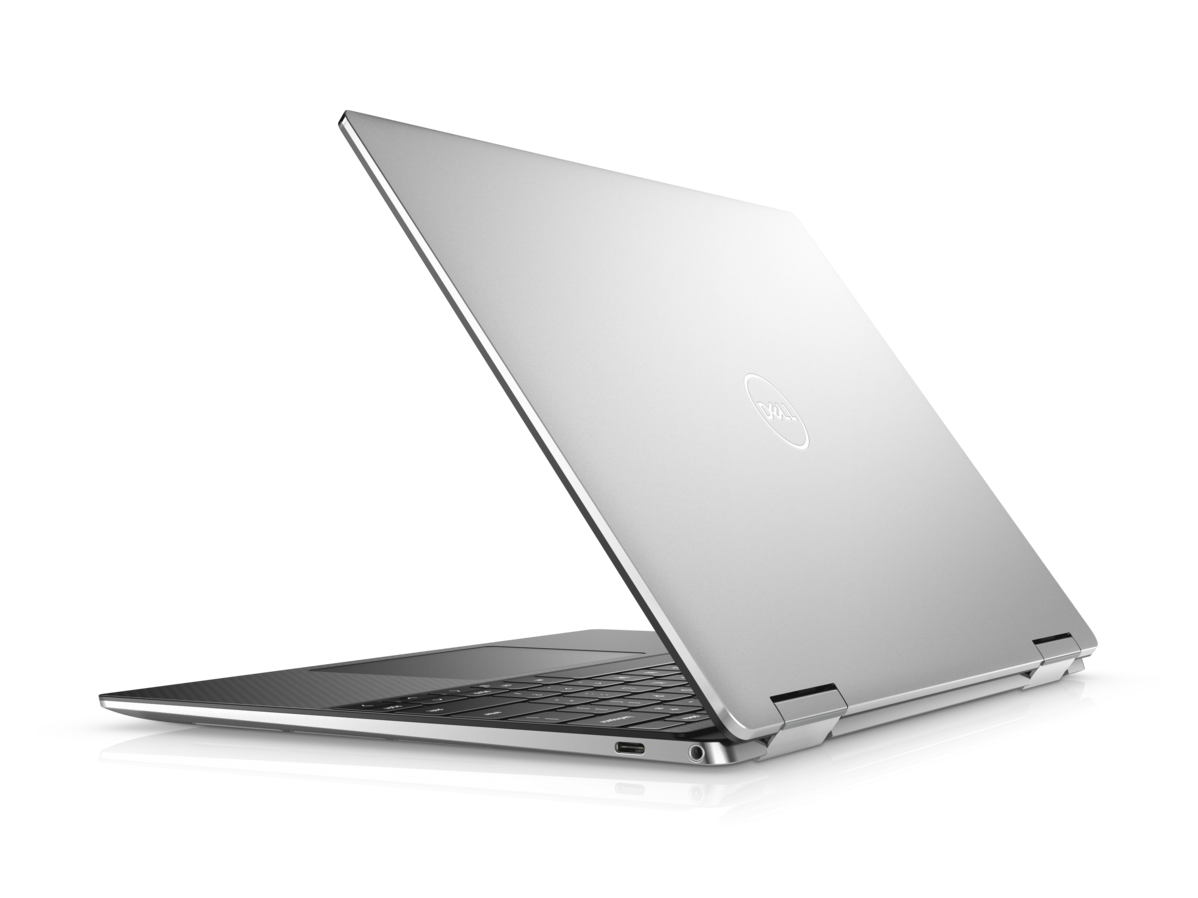
至于实际的XPS 13 7390 2合1笔记本电脑,我们认为风扇在高负载下音调过高,方向键太狭窄。否则,我们就不会有太多不喜欢它的地方,因为我们喜欢明亮的面板,宽广的色域,较长的续航时间以及非常小的外形尺寸。续航时间,风扇性能和温度与Core i3 SKU相似,尽管它们之间存在性能差异。相反,我们不喜欢的是这台XPS 13没有的东西。惠普即将推出自己的基于Ice Lake的Spectre x360 13,并更新了EliteBook,提供了戴尔未提供的一些功能,包括可升级的存储,4G LTE,eSIM,HDMI,USB Type-A和甚至更亮的1000-nit面板。仅仅为了最新的XPS 13 2合1的纤薄美学,您将放弃很多其他功能。
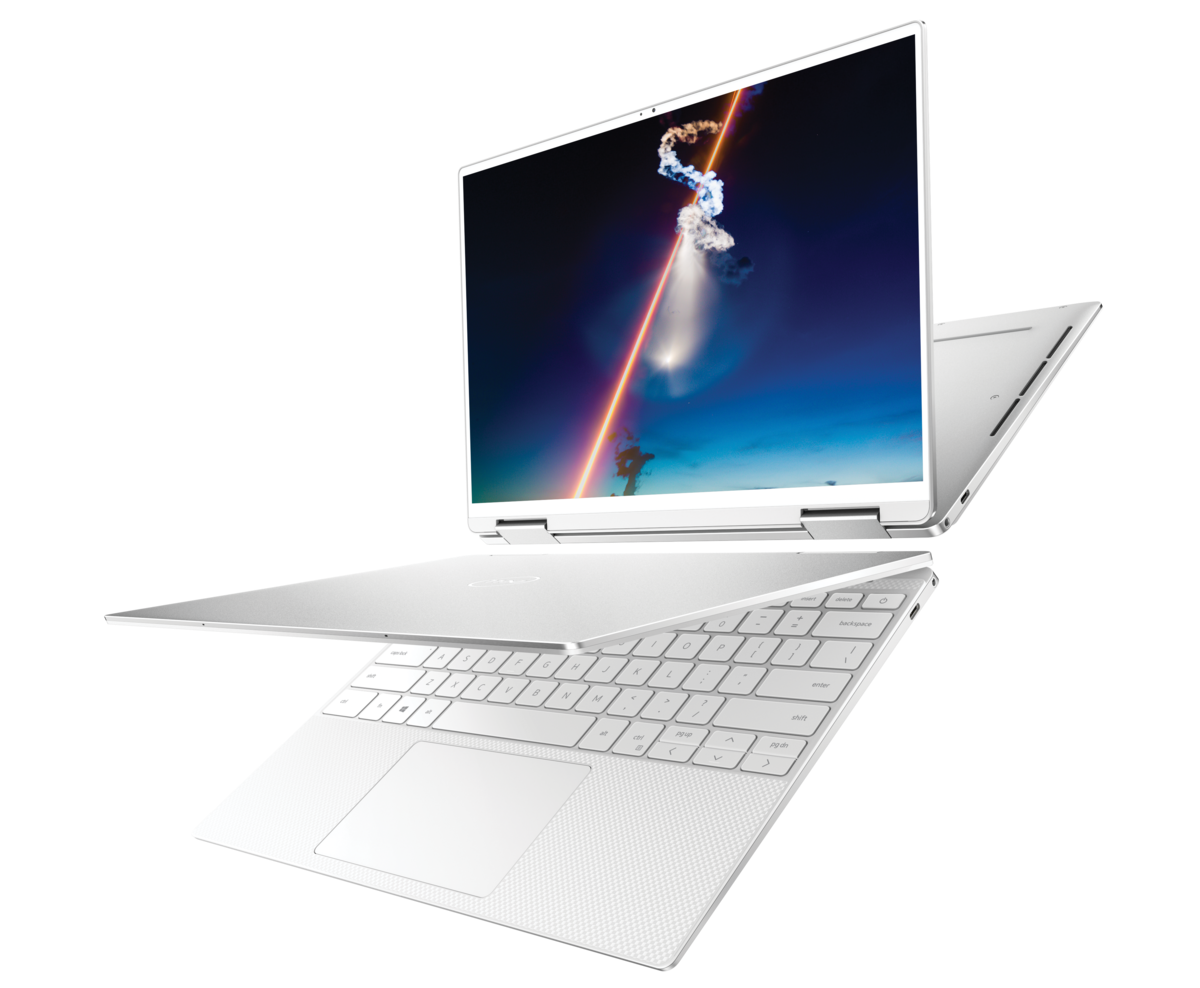
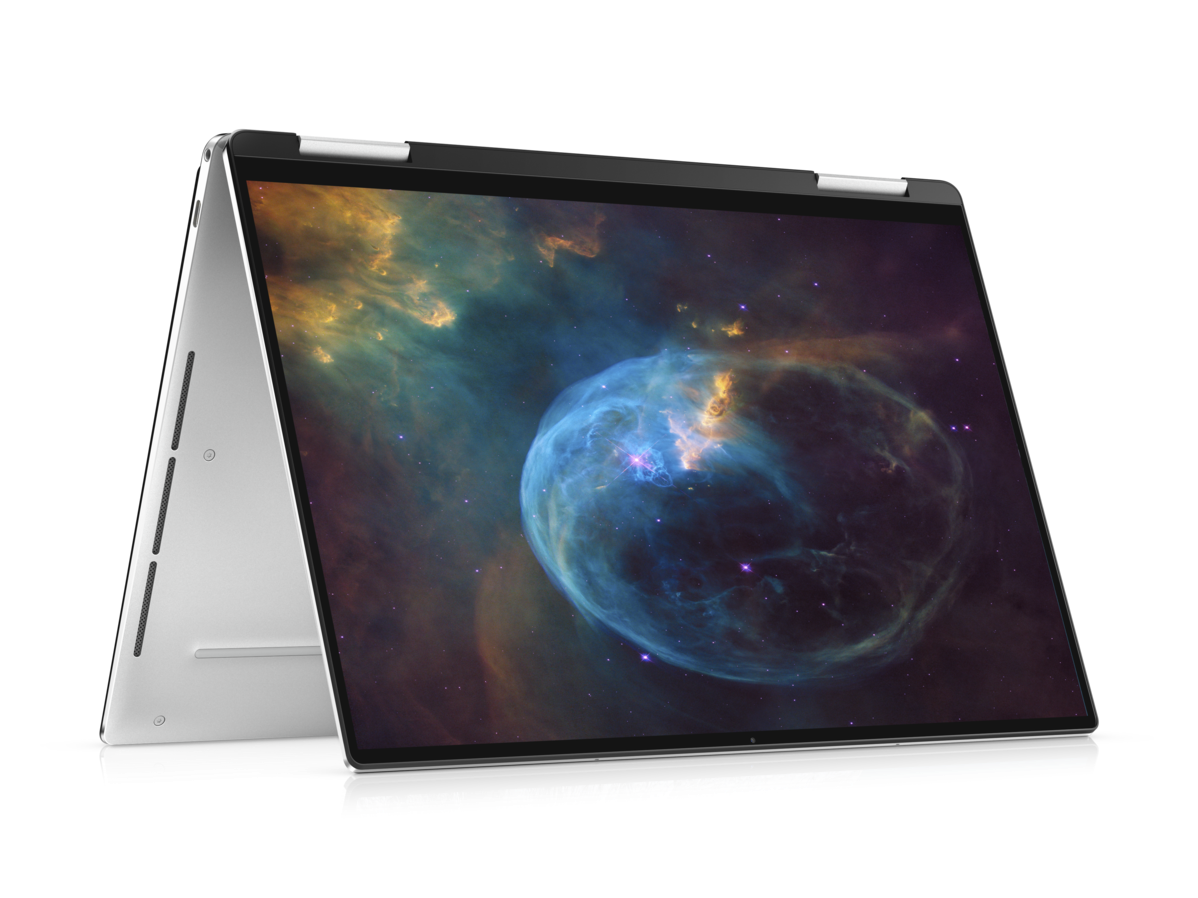
XPS 13 7390 二合一的性能比其不起眼的外观所显示的要强。另一方面,它的超薄设计减去了大多数超极本竞品倾向于提供的几种升级选项和连接功能。
Dell XPS 13 7390 2-in-1 Core i7
- 05/15/2020 v7 (old)
Allen Ngo
Price comparison

