联想拯救者Y730-15ICH(i5-8300H,GTX1050 Ti)笔记本电脑评测
| Networking | |
| iperf3 transmit AX12 | |
| Lenovo Legion Y730-15ICH i5-8300H | |
| Razer Blade 15 Base Model | |
| Dell G7 15-7588 | |
| Lenovo Legion Y530-15ICH | |
| iperf3 receive AX12 | |
| Razer Blade 15 Base Model | |
| Dell G7 15-7588 | |
| Lenovo Legion Y730-15ICH i5-8300H | |
| Lenovo Legion Y530-15ICH | |
| |||||||||||||||||||||||||
Brightness Distribution: 84 %
Center on Battery: 286.5 cd/m²
Contrast: 868:1 (Black: 0.33 cd/m²)
ΔE ColorChecker Calman: 6.3 | ∀{0.5-29.43 Ø4.72}
calibrated: 4.17
ΔE Greyscale Calman: 5.6 | ∀{0.09-98 Ø4.97}
85.1% sRGB (Argyll 1.6.3 3D)
55.7% AdobeRGB 1998 (Argyll 1.6.3 3D)
62.5% AdobeRGB 1998 (Argyll 3D)
85.5% sRGB (Argyll 3D)
65.9% Display P3 (Argyll 3D)
Gamma: 2.23
CCT: 6822 K
| Lenovo Legion Y730-15ICH i5-8300H BOE NV156FHM-N61, IPS, 15.6", 1920x1080 | Lenovo Legion Y530-15ICH LG Display LP156WFG-SPB2, IPS, 15.6", 1920x1080 | Dell G7 15-7588 LG Philips LGD053F, IPS, 15.6", 1920x1080 | Razer Blade 15 Base Model BOE NV156FHM-N61, IPS, 15.6", 1920x1080 | Asus FX504GD AU Optronics B156HTN03.8, TN LED, 15.6", 1920x1080 | MSI GF63 8RC AU Optronics B156HAN02.1, IPS, 15.6", 1920x1080 | |
|---|---|---|---|---|---|---|
| Display | 2% | -38% | 1% | -39% | -35% | |
| Display P3 Coverage (%) | 65.9 | 62.5 -5% | 37.82 -43% | 66.3 1% | 37.09 -44% | 39.43 -40% |
| sRGB Coverage (%) | 85.5 | 93 9% | 56.2 -34% | 86.6 1% | 55.8 -35% | 59.3 -31% |
| AdobeRGB 1998 Coverage (%) | 62.5 | 63.8 2% | 39.2 -37% | 63.3 1% | 38.34 -39% | 40.73 -35% |
| Response Times | 69% | 22% | 11% | 33% | 28% | |
| Response Time Grey 50% / Grey 80% * (ms) | 43.2 ? | 15 ? 65% | 38.8 ? 10% | 39.2 ? 9% | 41.6 ? 4% | 33.2 ? 23% |
| Response Time Black / White * (ms) | 40 ? | 11 ? 72% | 26.8 ? 33% | 35.2 ? 12% | 15.2 ? 62% | 27.2 ? 32% |
| PWM Frequency (Hz) | 21740 ? | 21190 ? | ||||
| Screen | 7% | -30% | 15% | -33% | -10% | |
| Brightness middle (cd/m²) | 286.5 | 305 6% | 250.9 -12% | 273.6 -5% | 260 -9% | 266.6 -7% |
| Brightness (cd/m²) | 269 | 284 6% | 246 -9% | 262 -3% | 241 -10% | 257 -4% |
| Brightness Distribution (%) | 84 | 83 -1% | 89 6% | 86 2% | 85 1% | 89 6% |
| Black Level * (cd/m²) | 0.33 | 0.52 -58% | 0.34 -3% | 0.3 9% | 0.55 -67% | 0.29 12% |
| Contrast (:1) | 868 | 587 -32% | 738 -15% | 912 5% | 473 -46% | 919 6% |
| Colorchecker dE 2000 * | 6.3 | 3.63 42% | 7.34 -17% | 3.22 49% | 7 -11% | 5.93 6% |
| Colorchecker dE 2000 max. * | 10.01 | 8.18 18% | 28.66 -186% | 7.61 24% | 22.52 -125% | 16.28 -63% |
| Colorchecker dE 2000 calibrated * | 4.17 | 1.31 69% | 4.42 -6% | 4.1 2% | 5.27 -26% | 3.6 14% |
| Greyscale dE 2000 * | 5.6 | 4.77 15% | 6.8 -21% | 1.4 75% | 6.1 -9% | 6.8 -21% |
| Gamma | 2.23 99% | 2.54 87% | 2.164 102% | 2.24 98% | 1.97 112% | 2.43 91% |
| CCT | 6822 95% | 7500 87% | 6780 96% | 6636 98% | 7894 82% | 7192 90% |
| Color Space (Percent of AdobeRGB 1998) (%) | 55.7 | 59 6% | 36 -35% | 56.4 1% | 35.5 -36% | 37.6 -32% |
| Color Space (Percent of sRGB) (%) | 85.1 | 93 9% | 56 -34% | 86.2 1% | 61 -28% | 59.3 -30% |
| Total Average (Program / Settings) | 26% /
14% | -15% /
-25% | 9% /
12% | -13% /
-26% | -6% /
-10% |
* ... smaller is better
Display Response Times
| ↔ Response Time Black to White | ||
|---|---|---|
| 40 ms ... rise ↗ and fall ↘ combined | ↗ 21.2 ms rise | 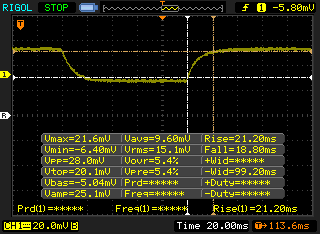 |
| ↘ 18.8 ms fall | ||
| The screen shows slow response rates in our tests and will be unsatisfactory for gamers. In comparison, all tested devices range from 0.1 (minimum) to 240 (maximum) ms. » 97 % of all devices are better. This means that the measured response time is worse than the average of all tested devices (19.8 ms). | ||
| ↔ Response Time 50% Grey to 80% Grey | ||
| 43.2 ms ... rise ↗ and fall ↘ combined | ↗ 25.2 ms rise | 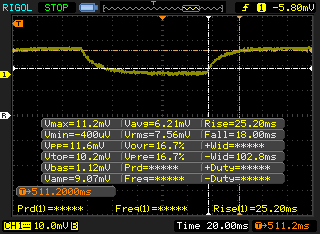 |
| ↘ 18 ms fall | ||
| The screen shows slow response rates in our tests and will be unsatisfactory for gamers. In comparison, all tested devices range from 0.165 (minimum) to 636 (maximum) ms. » 72 % of all devices are better. This means that the measured response time is worse than the average of all tested devices (31 ms). | ||
Screen Flickering / PWM (Pulse-Width Modulation)
| Screen flickering / PWM detected | 21740 Hz | ≤ 99 % brightness setting | 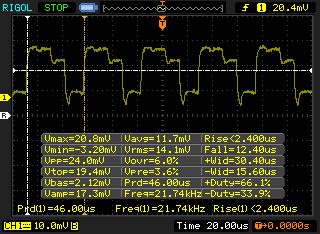 |
The display backlight flickers at 21740 Hz (worst case, e.g., utilizing PWM) Flickering detected at a brightness setting of 99 % and below. There should be no flickering or PWM above this brightness setting. The frequency of 21740 Hz is quite high, so most users sensitive to PWM should not notice any flickering. In comparison: 52 % of all tested devices do not use PWM to dim the display. If PWM was detected, an average of 7781 (minimum: 5 - maximum: 343500) Hz was measured. | |||
| Cinebench R11.5 | |
| CPU Single 64Bit | |
| Eurocom Sky X4C | |
| Lenovo Yoga 730-15IKB | |
| Average Intel Core i5-8300H (1.72 - 1.96, n=7) | |
| HP Omen X 17-ap0xx | |
| Lenovo Legion Y520-15IKBN-80WK001KUS | |
| Asus FX504GD | |
| Lenovo Legion Y520-15IKBN 80WK0042GE | |
| CPU Multi 64Bit | |
| Eurocom Sky X4C | |
| HP Omen X 17-ap0xx | |
| Lenovo Yoga 730-15IKB | |
| Average Intel Core i5-8300H (6.2 - 8.79, n=7) | |
| Lenovo Legion Y520-15IKBN-80WK001KUS | |
| Asus FX504GD | |
| Lenovo Legion Y520-15IKBN 80WK0042GE | |
| Cinebench R10 | |
| Rendering Multiple CPUs 32Bit | |
| Eurocom Sky X4C | |
| HP Omen X 17-ap0xx | |
| Lenovo Yoga 730-15IKB | |
| Average Intel Core i5-8300H (20061 - 24718, n=4) | |
| Asus FX504GD | |
| Lenovo Legion Y520-15IKBN 80WK0042GE | |
| Rendering Single 32Bit | |
| Eurocom Sky X4C | |
| Asus FX504GD | |
| Lenovo Yoga 730-15IKB | |
| Average Intel Core i5-8300H (6115 - 6524, n=4) | |
| HP Omen X 17-ap0xx | |
| Lenovo Legion Y520-15IKBN 80WK0042GE | |
| wPrime 2.10 - 1024m | |
| Average Intel Core i5-8300H (206 - 286, n=4) | |
| Asus FX504GD | |
| HP Omen X 17-ap0xx | |
| Eurocom Sky X4C | |
* ... smaller is better
| PCMark 8 Home Score Accelerated v2 | 3931 points | |
| PCMark 8 Work Score Accelerated v2 | 5208 points | |
| PCMark 10 Score | 4527 points | |
Help | ||
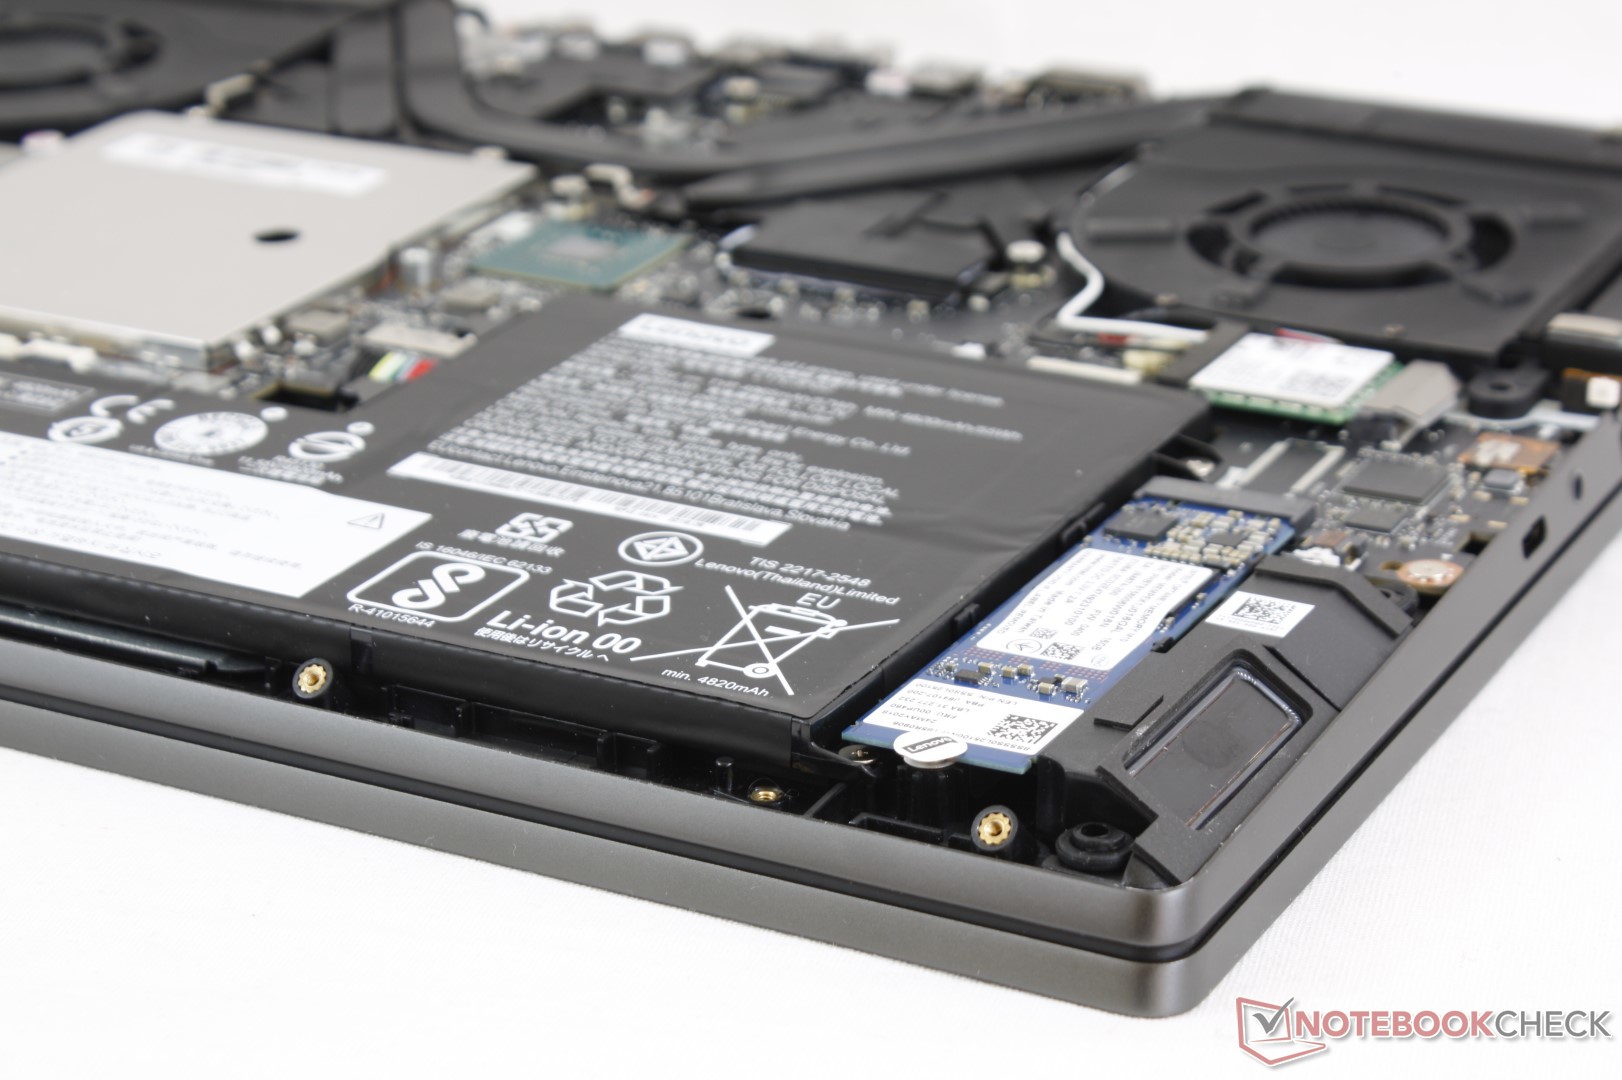
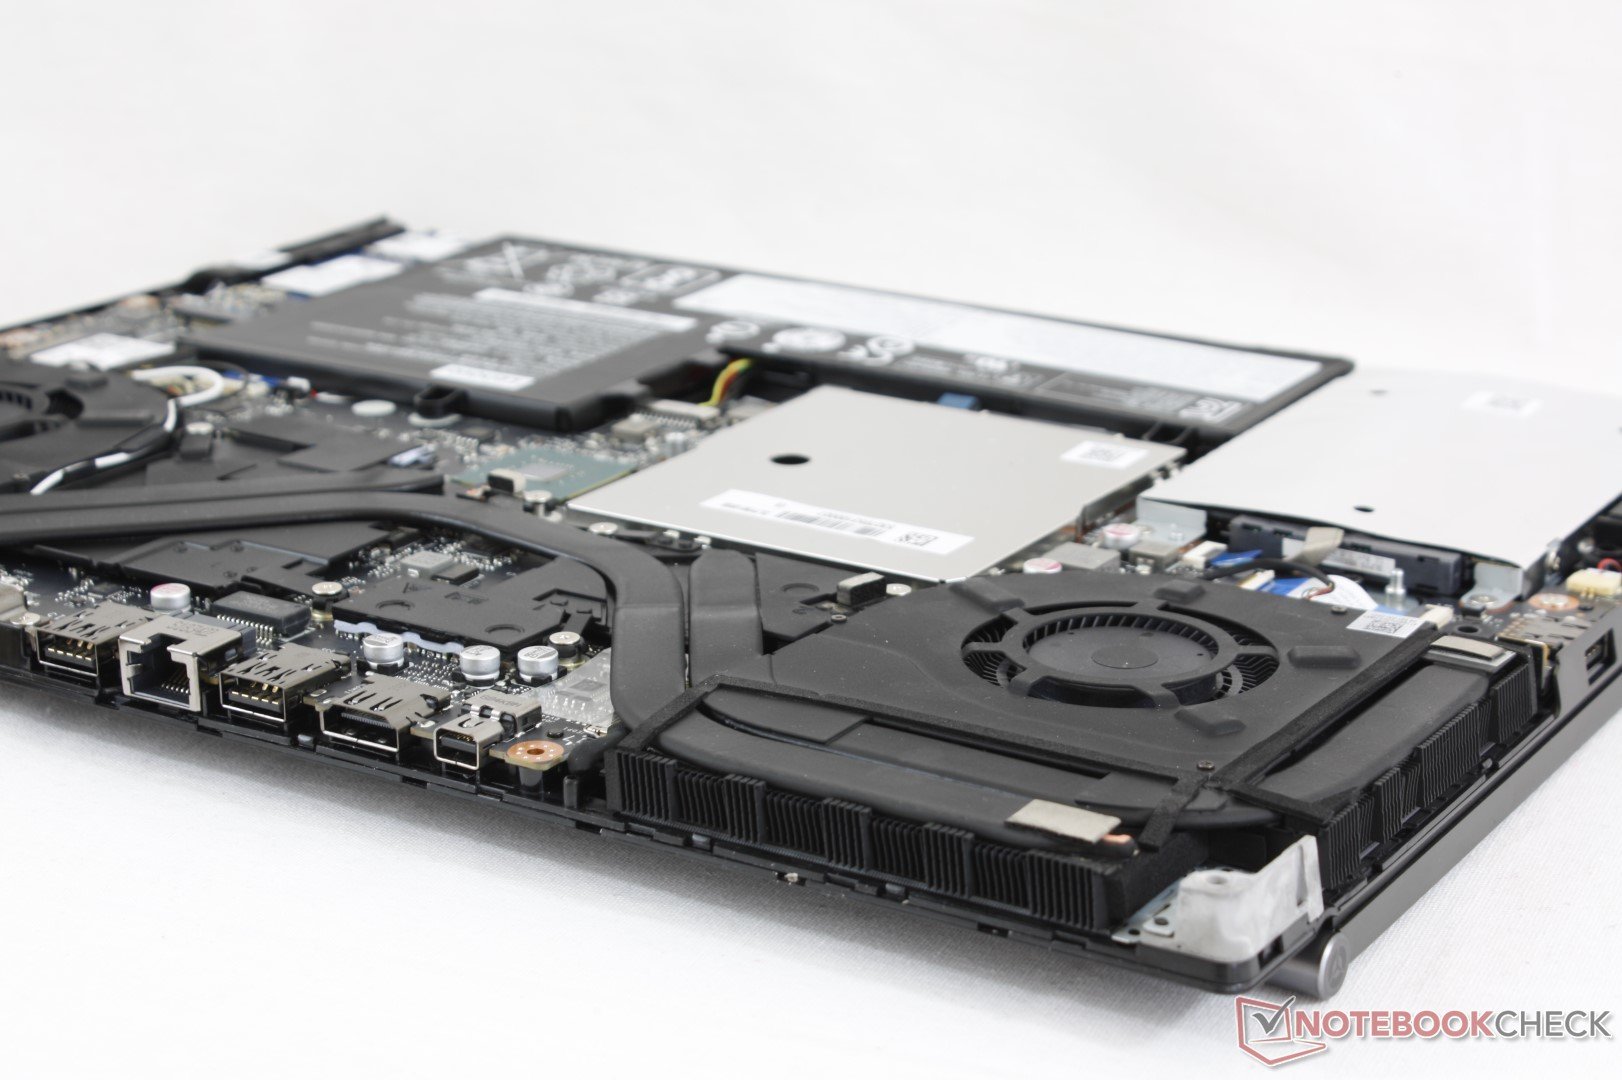
| Lenovo Legion Y730-15ICH i5-8300H Intel Optane 16 GB MEMPEK1J016GAL + HGST ST1000LM049 1 TB HDD | Lenovo Legion Y530-15ICH Samsung SSD PM981 MZVLB256HAHQ | Dell G7 15-7588 SK hynix SC311 SATA | Asus FX504GD Seagate Mobile HDD 1TB ST1000LX015-1U7172 | MSI GF63 8RC Seagate BarraCuda Pro Compute 1TB ST1000LM049 | Razer Blade 15 Base Model Samsung SSD PM981 MZVLB256HAHQ | |
|---|---|---|---|---|---|---|
| CrystalDiskMark 5.2 / 6 | 250% | -20% | -82% | -77% | 259% | |
| Write 4K (MB/s) | 66.9 | 108.9 63% | 61.3 -8% | 0.27 -100% | 1.244 -98% | 112.5 68% |
| Read 4K (MB/s) | 118.5 | 40.23 -66% | 22.45 -81% | 0.586 -100% | 0.544 -100% | 43.09 -64% |
| Write Seq (MB/s) | 157.7 | 1390 781% | 243.9 55% | 86.8 -45% | 97.1 -38% | 1450 819% |
| Read Seq (MB/s) | 886 | 964 9% | 506 -43% | 113.2 -87% | 162.1 -82% | 1392 57% |
| Write 4K Q32T1 (MB/s) | 162.4 | 314.2 93% | 145.1 -11% | 0.242 -100% | 1.674 -99% | 356.1 119% |
| Read 4K Q32T1 (MB/s) | 353 | 369.2 5% | 195.1 -45% | 0.963 -100% | 0.998 -100% | 406.9 15% |
| Write Seq Q32T1 (MB/s) | 159.8 | 1506 842% | 186 16% | 98.4 -38% | 134.8 -16% | 1451 808% |
| Read Seq Q32T1 (MB/s) | 926 | 3446 272% | 540 -42% | 110.2 -88% | 154.8 -83% | 3272 253% |

| 3DMark 11 Performance | 9335 points | |
| 3DMark Cloud Gate Standard Score | 23927 points | |
| 3DMark Fire Strike Score | 6989 points | |
Help | ||
| low | med. | high | ultra | |
|---|---|---|---|---|
| BioShock Infinite (2013) | 233.1 | 198.8 | 176.7 | 74.8 |
| The Witcher 3 (2015) | 142.2 | 91.5 | 51.9 | 27.9 |
| Rise of the Tomb Raider (2016) | 125.3 | 95 | 51.3 | 40 |
| Lenovo Legion Y730-15ICH i5-8300H GeForce GTX 1050 Ti Mobile, i5-8300H, Intel Optane 16 GB MEMPEK1J016GAL + HGST ST1000LM049 1 TB HDD | Lenovo Legion Y530-15ICH GeForce GTX 1060 Mobile, i7-8750H, Samsung SSD PM981 MZVLB256HAHQ | Dell G7 15-7588 GeForce GTX 1060 Max-Q, i7-8750H, SK hynix SC311 SATA | Asus FX504GD GeForce GTX 1050 Mobile, i5-8300H, Seagate Mobile HDD 1TB ST1000LX015-1U7172 | MSI GF63 8RC GeForce GTX 1050 Mobile, i5-8300H, Seagate BarraCuda Pro Compute 1TB ST1000LM049 | Razer Blade 15 Base Model GeForce GTX 1060 Max-Q, i7-8750H, Samsung SSD PM981 MZVLB256HAHQ | |
|---|---|---|---|---|---|---|
| Noise | -1% | -2% | -0% | -4% | -6% | |
| off / environment * (dB) | 28.9 | 30.2 -4% | 28.1 3% | 28.1 3% | 28 3% | 27.8 4% |
| Idle Minimum * (dB) | 32.2 | 30.9 4% | 29 10% | 29 10% | 33.8 -5% | 31 4% |
| Idle Average * (dB) | 32.5 | 30.9 5% | 29 11% | 29.2 10% | 34 -5% | 31.2 4% |
| Idle Maximum * (dB) | 32.7 | 31.6 3% | 29.2 11% | 29.7 9% | 34.2 -5% | 31.3 4% |
| Load Average * (dB) | 33.2 | 42.3 -27% | 40.6 -22% | 44.3 -33% | 37.3 -12% | 47.2 -42% |
| Witcher 3 ultra * (dB) | 43.1 | 49.8 -16% | 40.7 6% | 43.4 -1% | 51.3 -19% | |
| Load Maximum * (dB) | 45 | 40 11% | 49.8 -11% | 47.7 -6% | 46 -2% | 44.3 2% |
* ... smaller is better
Noise level
| Idle |
| 32.2 / 32.5 / 32.7 dB(A) |
| Load |
| 33.2 / 45 dB(A) |
 | ||
30 dB silent 40 dB(A) audible 50 dB(A) loud |
||
min: | ||
(+) The maximum temperature on the upper side is 30 °C / 86 F, compared to the average of 40.4 °C / 105 F, ranging from 21.2 to 68.8 °C for the class Gaming.
(±) The bottom heats up to a maximum of 40.8 °C / 105 F, compared to the average of 43.2 °C / 110 F
(+) In idle usage, the average temperature for the upper side is 21.7 °C / 71 F, compared to the device average of 33.9 °C / 93 F.
(+) Playing The Witcher 3, the average temperature for the upper side is 25.6 °C / 78 F, compared to the device average of 33.9 °C / 93 F.
(+) The palmrests and touchpad are cooler than skin temperature with a maximum of 23.4 °C / 74.1 F and are therefore cool to the touch.
(+) The average temperature of the palmrest area of similar devices was 28.8 °C / 83.8 F (+5.4 °C / 9.7 F).
Lenovo Legion Y730-15ICH i5-8300H audio analysis
(±) | speaker loudness is average but good (72.3 dB)
Bass 100 - 315 Hz
(±) | reduced bass - on average 11.3% lower than median
(±) | linearity of bass is average (14% delta to prev. frequency)
Mids 400 - 2000 Hz
(±) | higher mids - on average 7.1% higher than median
(+) | mids are linear (5.9% delta to prev. frequency)
Highs 2 - 16 kHz
(+) | balanced highs - only 1.7% away from median
(+) | highs are linear (4.8% delta to prev. frequency)
Overall 100 - 16.000 Hz
(±) | linearity of overall sound is average (19.3% difference to median)
Compared to same class
» 65% of all tested devices in this class were better, 8% similar, 27% worse
» The best had a delta of 6%, average was 18%, worst was 132%
Compared to all devices tested
» 47% of all tested devices were better, 8% similar, 46% worse
» The best had a delta of 4%, average was 24%, worst was 134%
Apple MacBook 12 (Early 2016) 1.1 GHz audio analysis
(+) | speakers can play relatively loud (83.6 dB)
Bass 100 - 315 Hz
(±) | reduced bass - on average 11.3% lower than median
(±) | linearity of bass is average (14.2% delta to prev. frequency)
Mids 400 - 2000 Hz
(+) | balanced mids - only 2.4% away from median
(+) | mids are linear (5.5% delta to prev. frequency)
Highs 2 - 16 kHz
(+) | balanced highs - only 2% away from median
(+) | highs are linear (4.5% delta to prev. frequency)
Overall 100 - 16.000 Hz
(+) | overall sound is linear (10.2% difference to median)
Compared to same class
» 7% of all tested devices in this class were better, 2% similar, 91% worse
» The best had a delta of 5%, average was 18%, worst was 53%
Compared to all devices tested
» 5% of all tested devices were better, 1% similar, 94% worse
» The best had a delta of 4%, average was 24%, worst was 134%
| Off / Standby | |
| Idle | |
| Load |
|
Key:
min: | |
| Lenovo Legion Y730-15ICH i5-8300H i5-8300H, GeForce GTX 1050 Ti Mobile, Intel Optane 16 GB MEMPEK1J016GAL + HGST ST1000LM049 1 TB HDD, IPS, 1920x1080, 15.6" | Lenovo Legion Y530-15ICH i7-8750H, GeForce GTX 1060 Mobile, Samsung SSD PM981 MZVLB256HAHQ, IPS, 1920x1080, 15.6" | Dell G7 15-7588 i7-8750H, GeForce GTX 1060 Max-Q, SK hynix SC311 SATA, IPS, 1920x1080, 15.6" | Asus FX504GD i5-8300H, GeForce GTX 1050 Mobile, Seagate Mobile HDD 1TB ST1000LX015-1U7172, TN LED, 1920x1080, 15.6" | MSI GF63 8RC i5-8300H, GeForce GTX 1050 Mobile, Seagate BarraCuda Pro Compute 1TB ST1000LM049, IPS, 1920x1080, 15.6" | Razer Blade 15 Base Model i7-8750H, GeForce GTX 1060 Max-Q, Samsung SSD PM981 MZVLB256HAHQ, IPS, 1920x1080, 15.6" | |
|---|---|---|---|---|---|---|
| Power Consumption | -5% | 12% | 12% | 16% | -14% | |
| Idle Minimum * (Watt) | 8 | 7.3 9% | 5.5 31% | 7.2 10% | 5.4 32% | 10.2 -27% |
| Idle Average * (Watt) | 11.8 | 11.1 6% | 7.6 36% | 10.2 14% | 10.4 12% | 13.2 -12% |
| Idle Maximum * (Watt) | 13.1 | 12.6 4% | 9 31% | 10.9 17% | 10.5 20% | 17.6 -34% |
| Load Average * (Watt) | 90.2 | 109 -21% | 94 -4% | 93.3 -3% | 84.7 6% | 99.5 -10% |
| Witcher 3 ultra * (Watt) | 107.8 | 116.3 -8% | 95.8 11% | 92.7 14% | 113.6 -5% | |
| Load Maximum * (Watt) | 136.2 | 168 -23% | 154.4 -13% | 102.5 25% | 119.9 12% | 133.3 2% |
* ... smaller is better
| Lenovo Legion Y730-15ICH i5-8300H i5-8300H, GeForce GTX 1050 Ti Mobile, 57 Wh | Lenovo Legion Y530-15ICH i7-8750H, GeForce GTX 1060 Mobile, 52 Wh | Dell G7 15-7588 i7-8750H, GeForce GTX 1060 Max-Q, 56 Wh | Asus FX504GD i5-8300H, GeForce GTX 1050 Mobile, 48 Wh | MSI GF63 8RC i5-8300H, GeForce GTX 1050 Mobile, 51 Wh | Razer Blade 15 Base Model i7-8750H, GeForce GTX 1060 Max-Q, 65 Wh | |
|---|---|---|---|---|---|---|
| Battery runtime | -34% | 59% | -21% | -2% | 25% | |
| Reader / Idle (h) | 9.6 | 8.3 -14% | 10.9 14% | 7.5 -22% | 9.5 -1% | 11.5 20% |
| WiFi v1.3 (h) | 5.3 | 3.8 -28% | 7.5 42% | 3.7 -30% | 5.5 4% | 5.5 4% |
| Load (h) | 1 | 0.4 -60% | 2.2 120% | 0.9 -10% | 0.9 -10% | 1.5 50% |
Pros
Cons
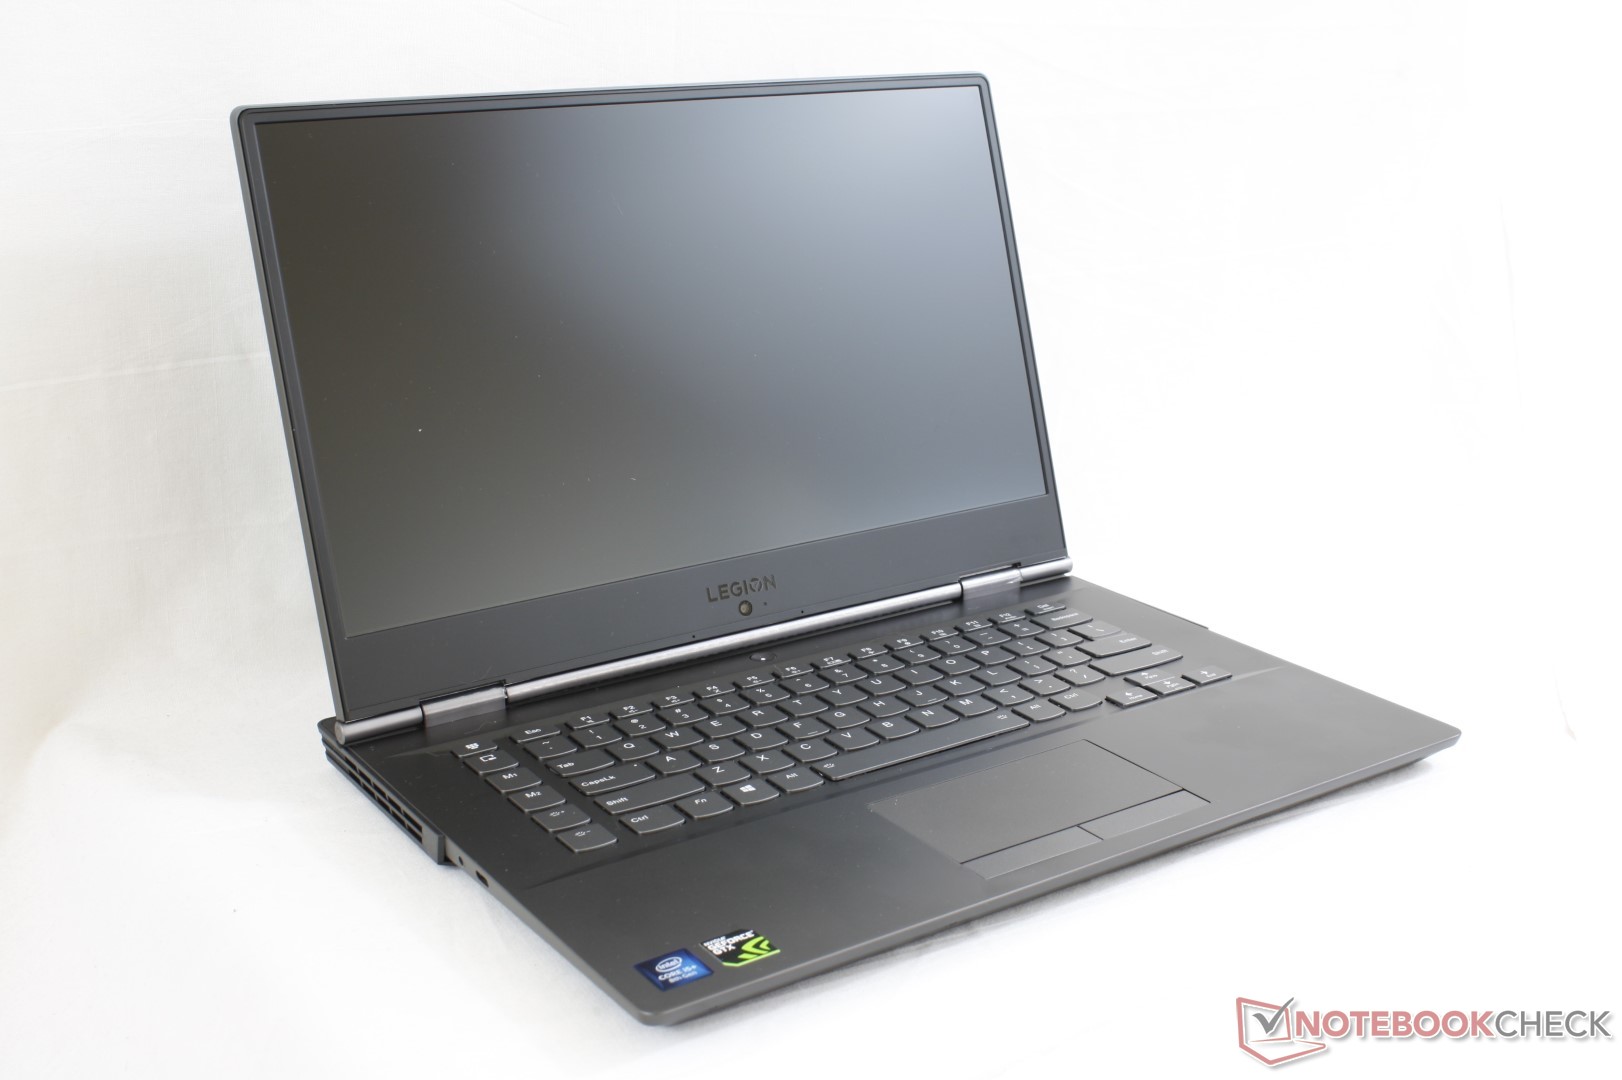
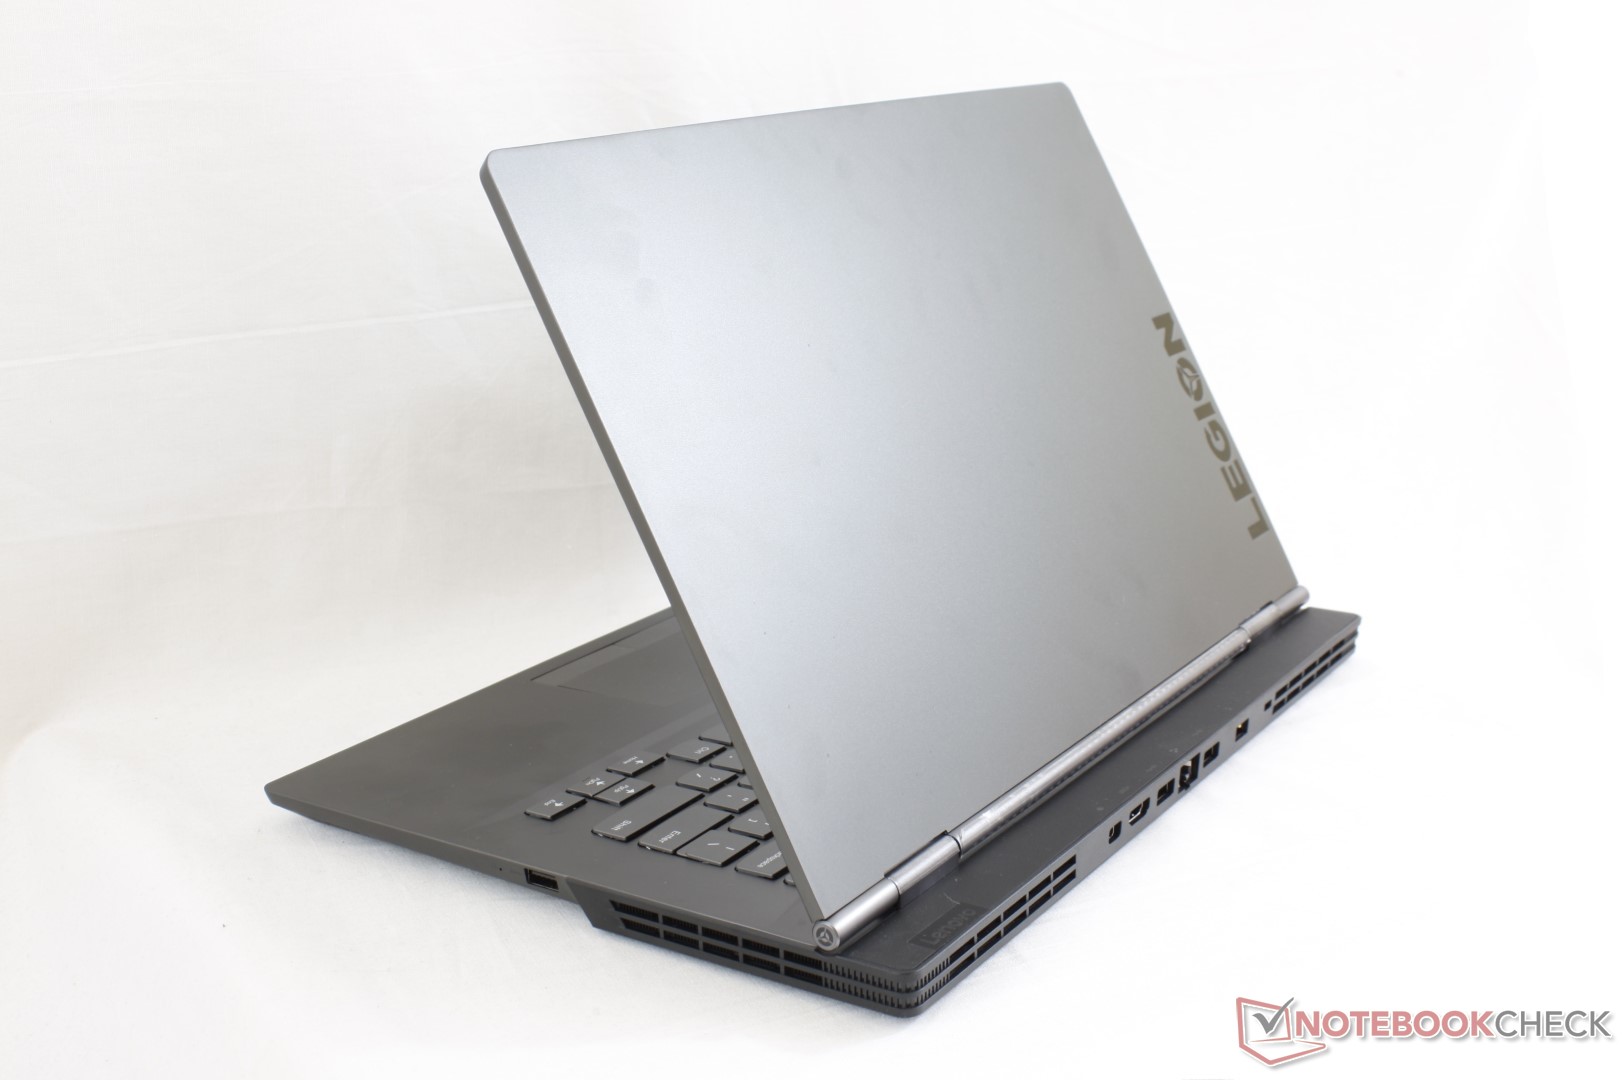
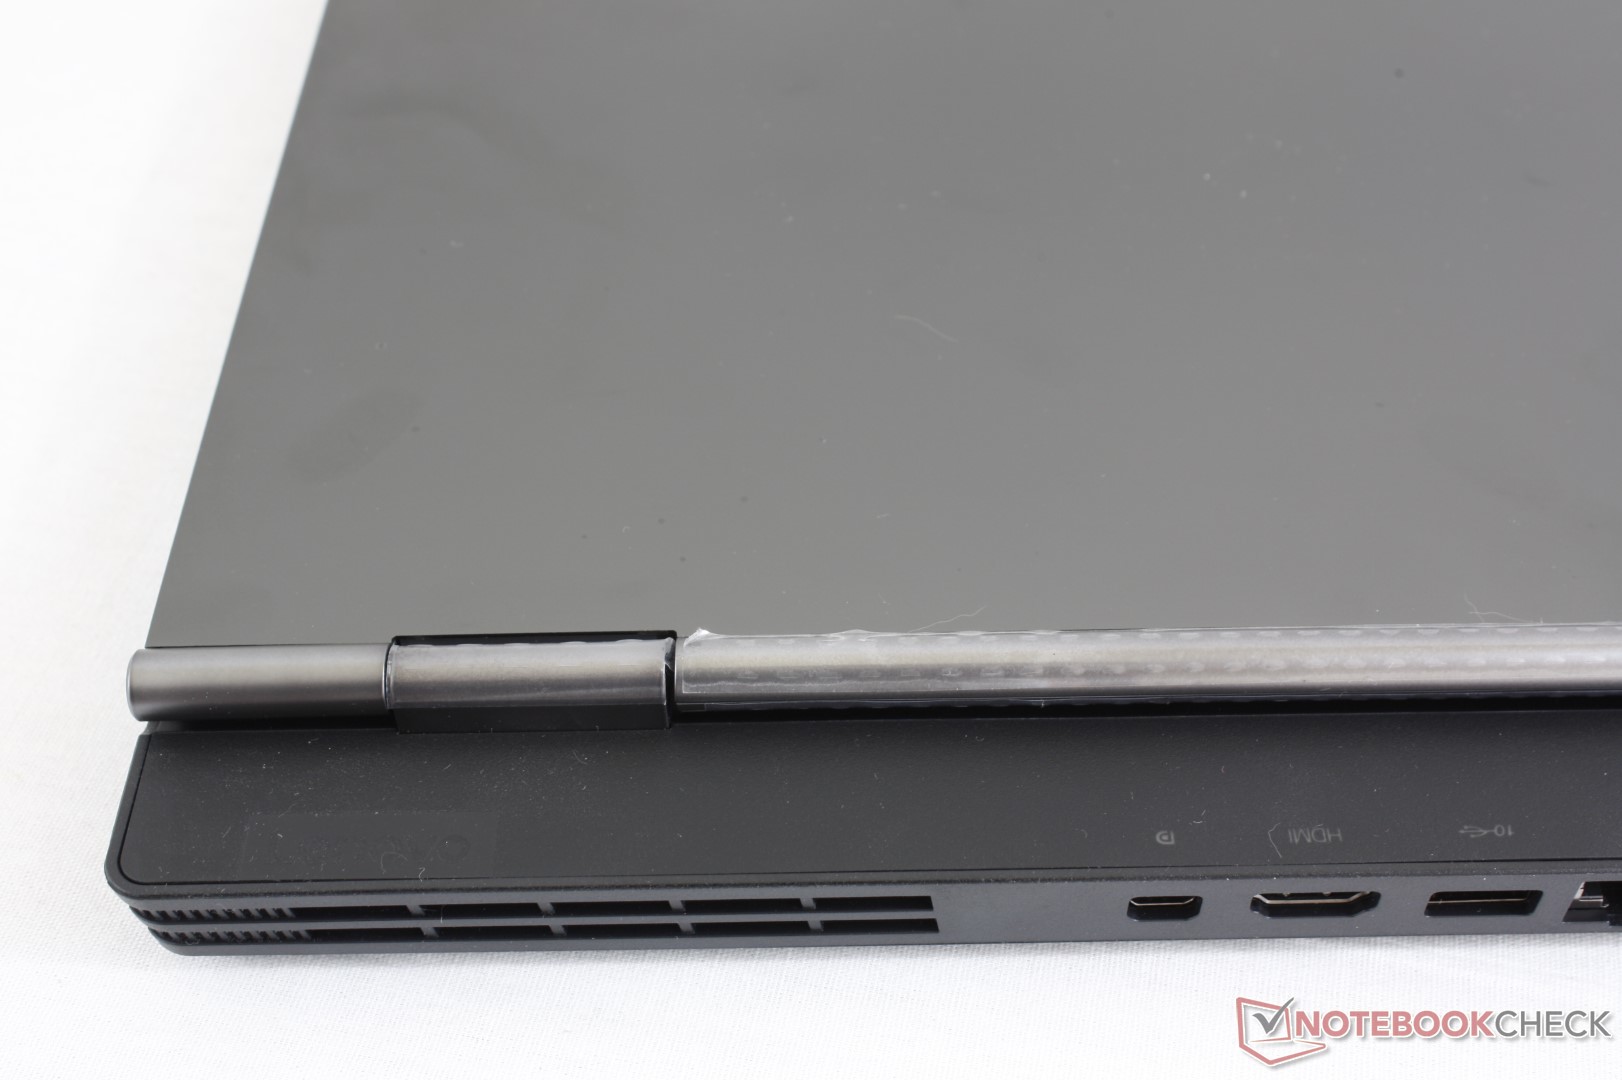
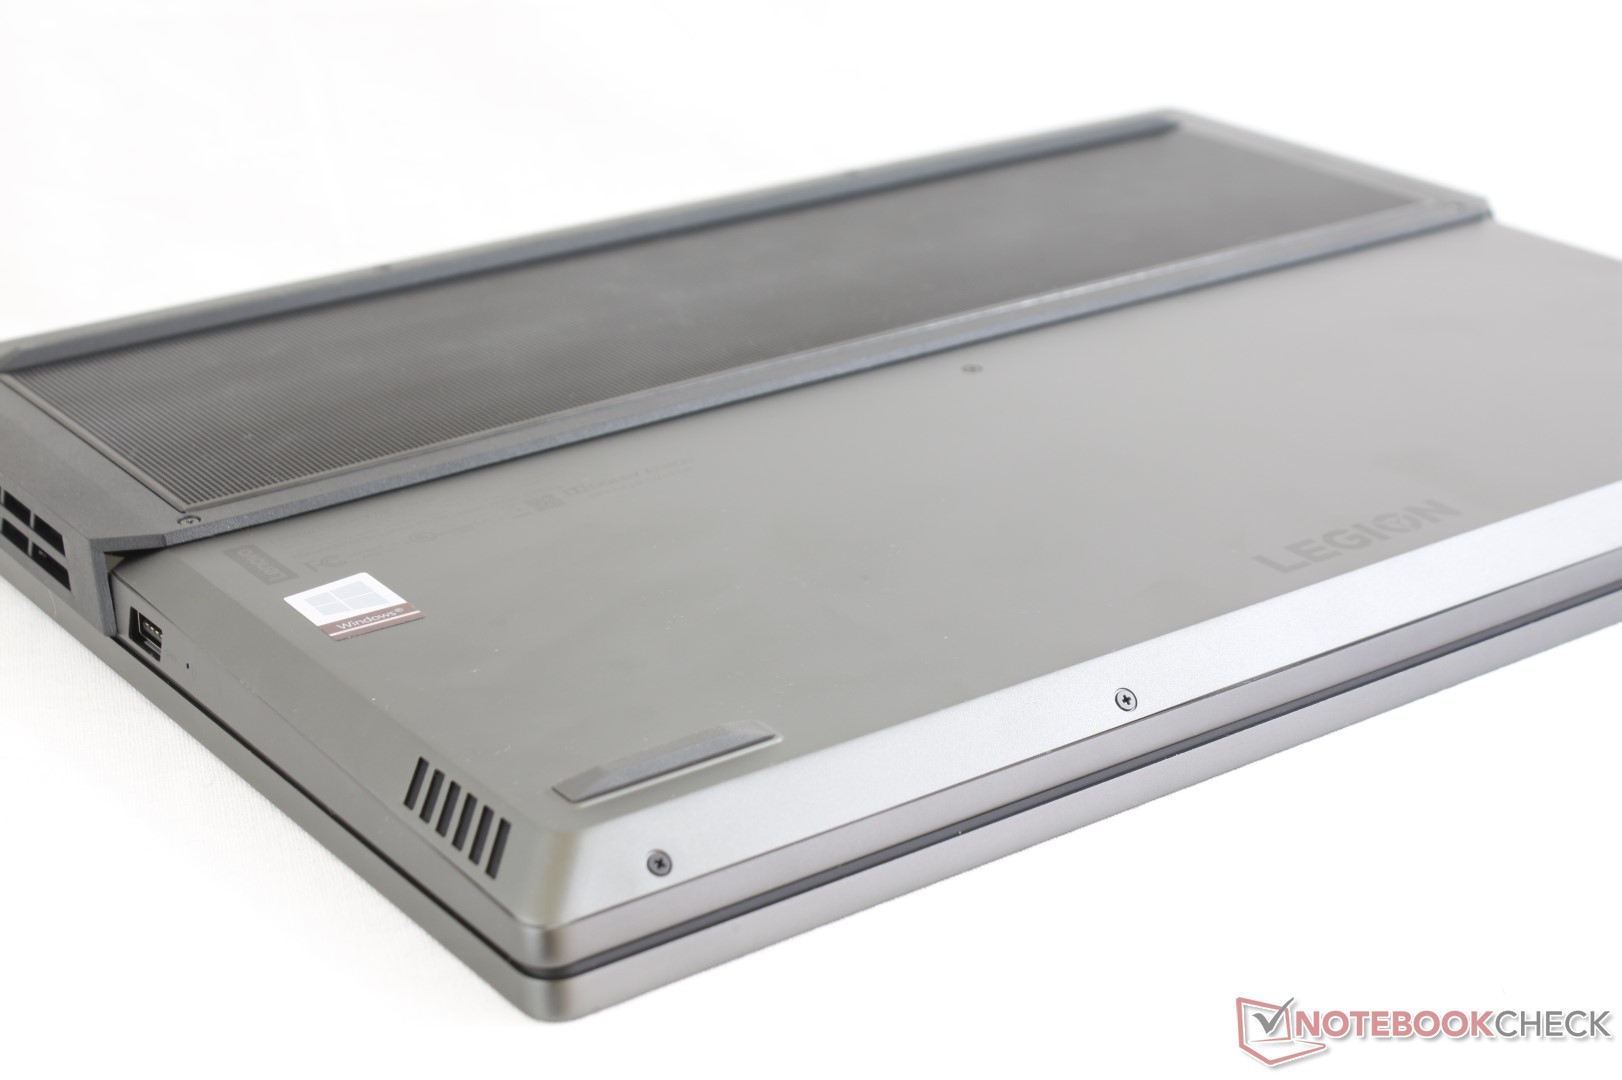
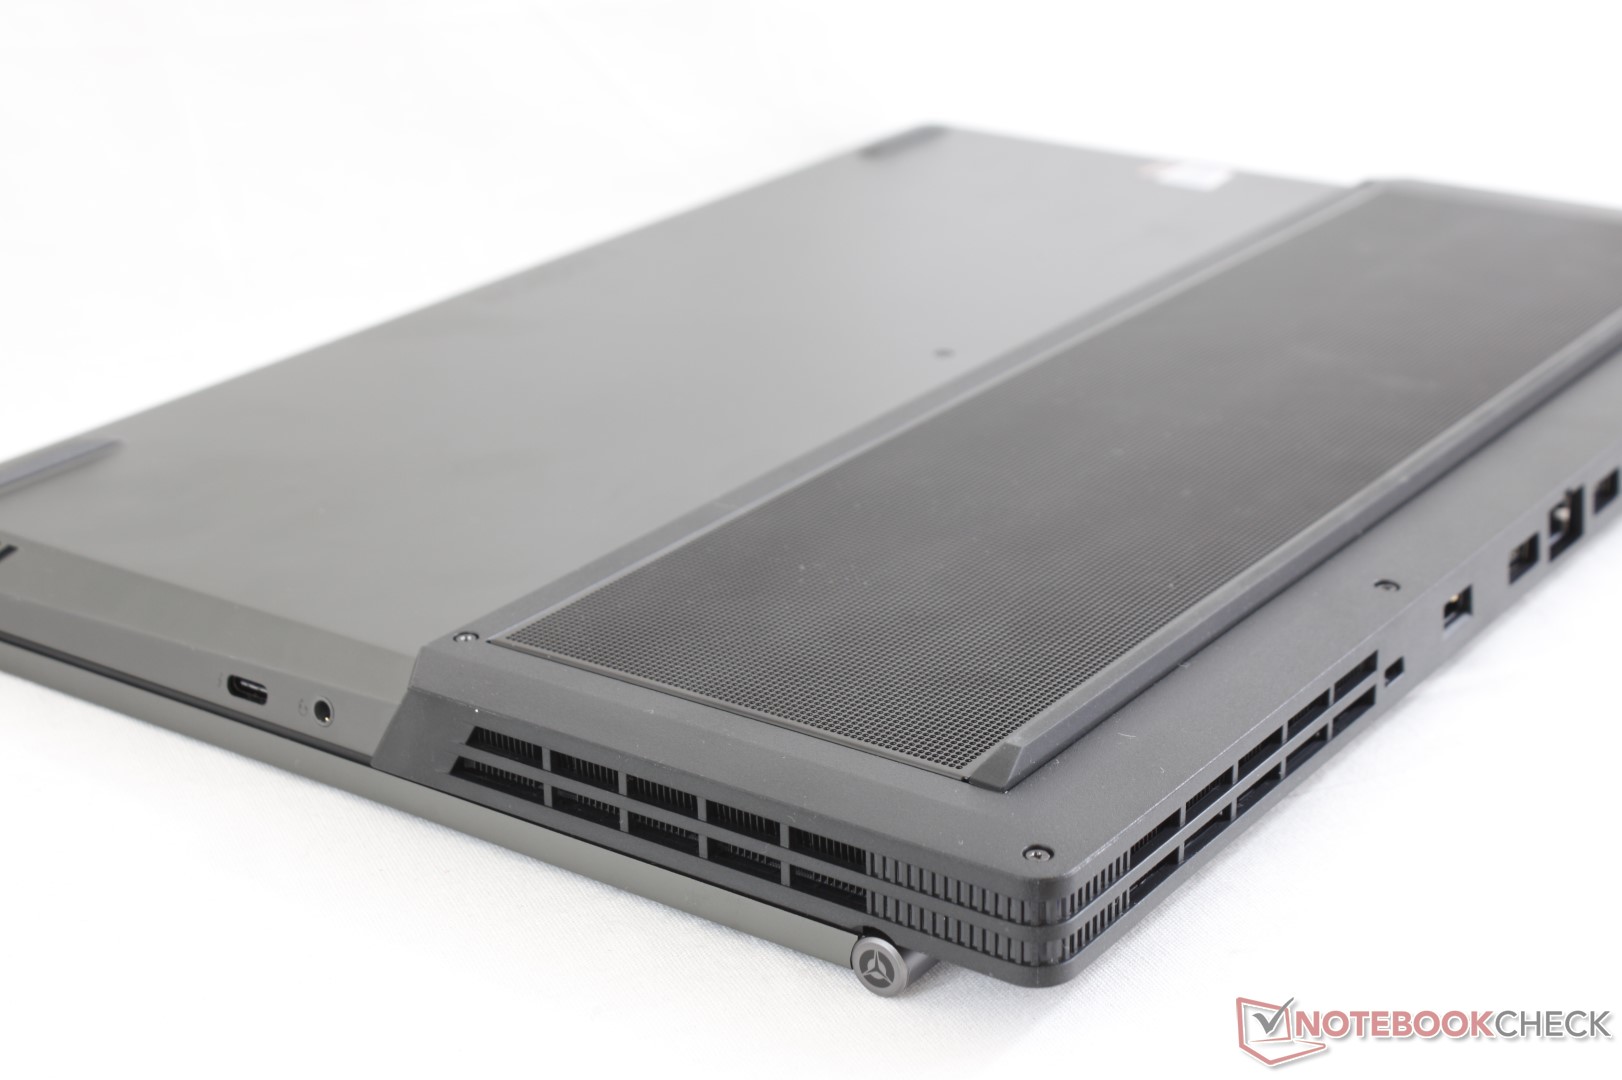
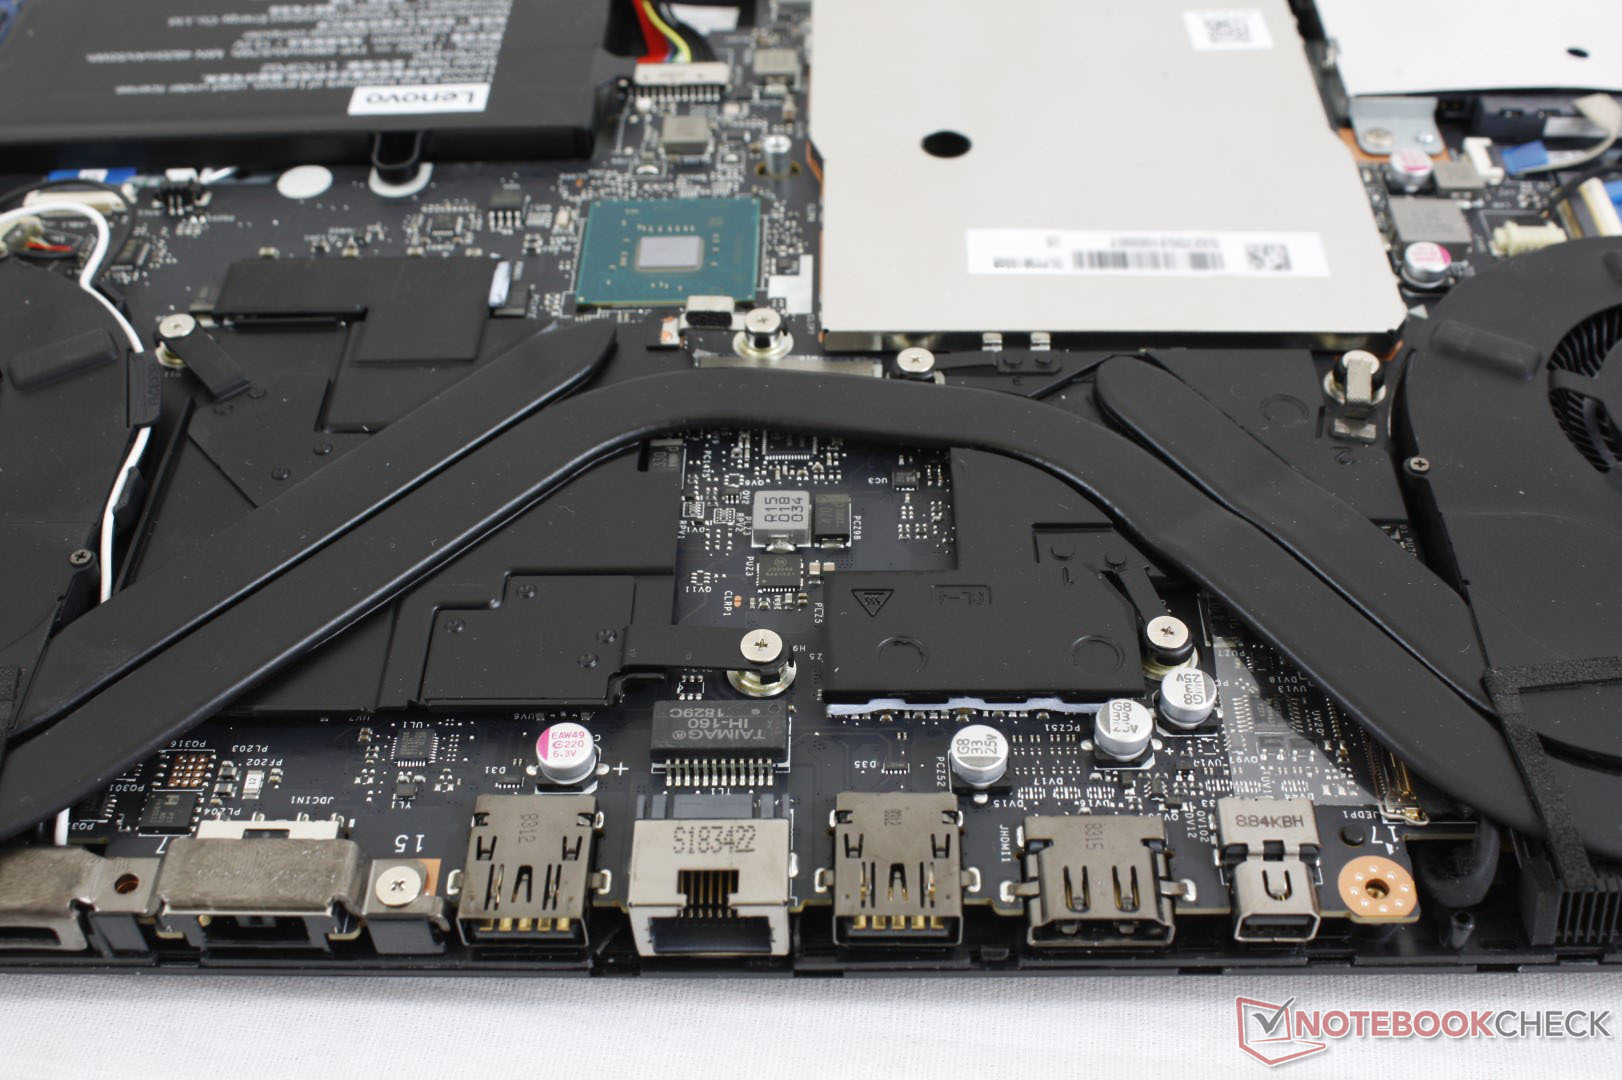
拯救者Y730处于一个不上不下的定位。它是拯救者Y7000更薄,更轻,更高端的版本,有更多的花哨设计,如LED灯,铝合金表面和雷电3,但它缺乏同价位竞品中的GeForce GTX 1060 GPU选项。为什么拯救者Y730坚持使用GTX 1050 Ti GPU我们无法知晓,特别是因为这台电脑具有出色的CPU Turbo Boost性能且游戏运行时散热很好。机箱显然能够压得住性能更强的GPU,我们期待下一代Nvidia显卡将很快更新。
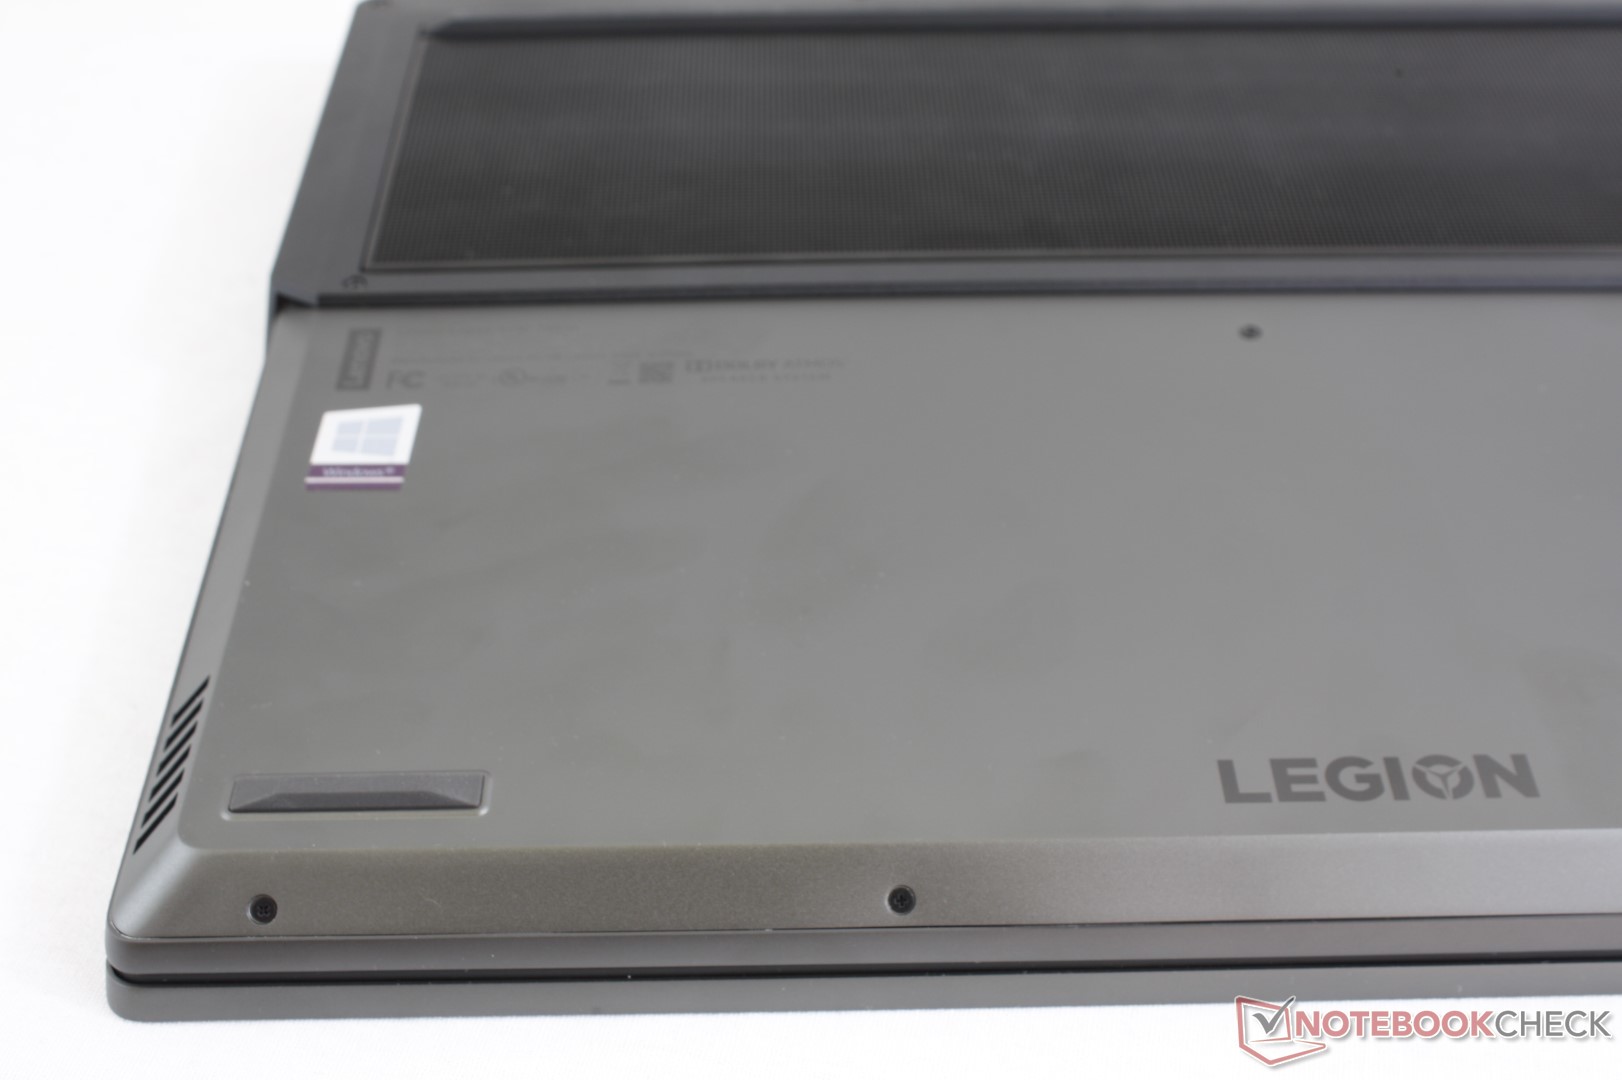
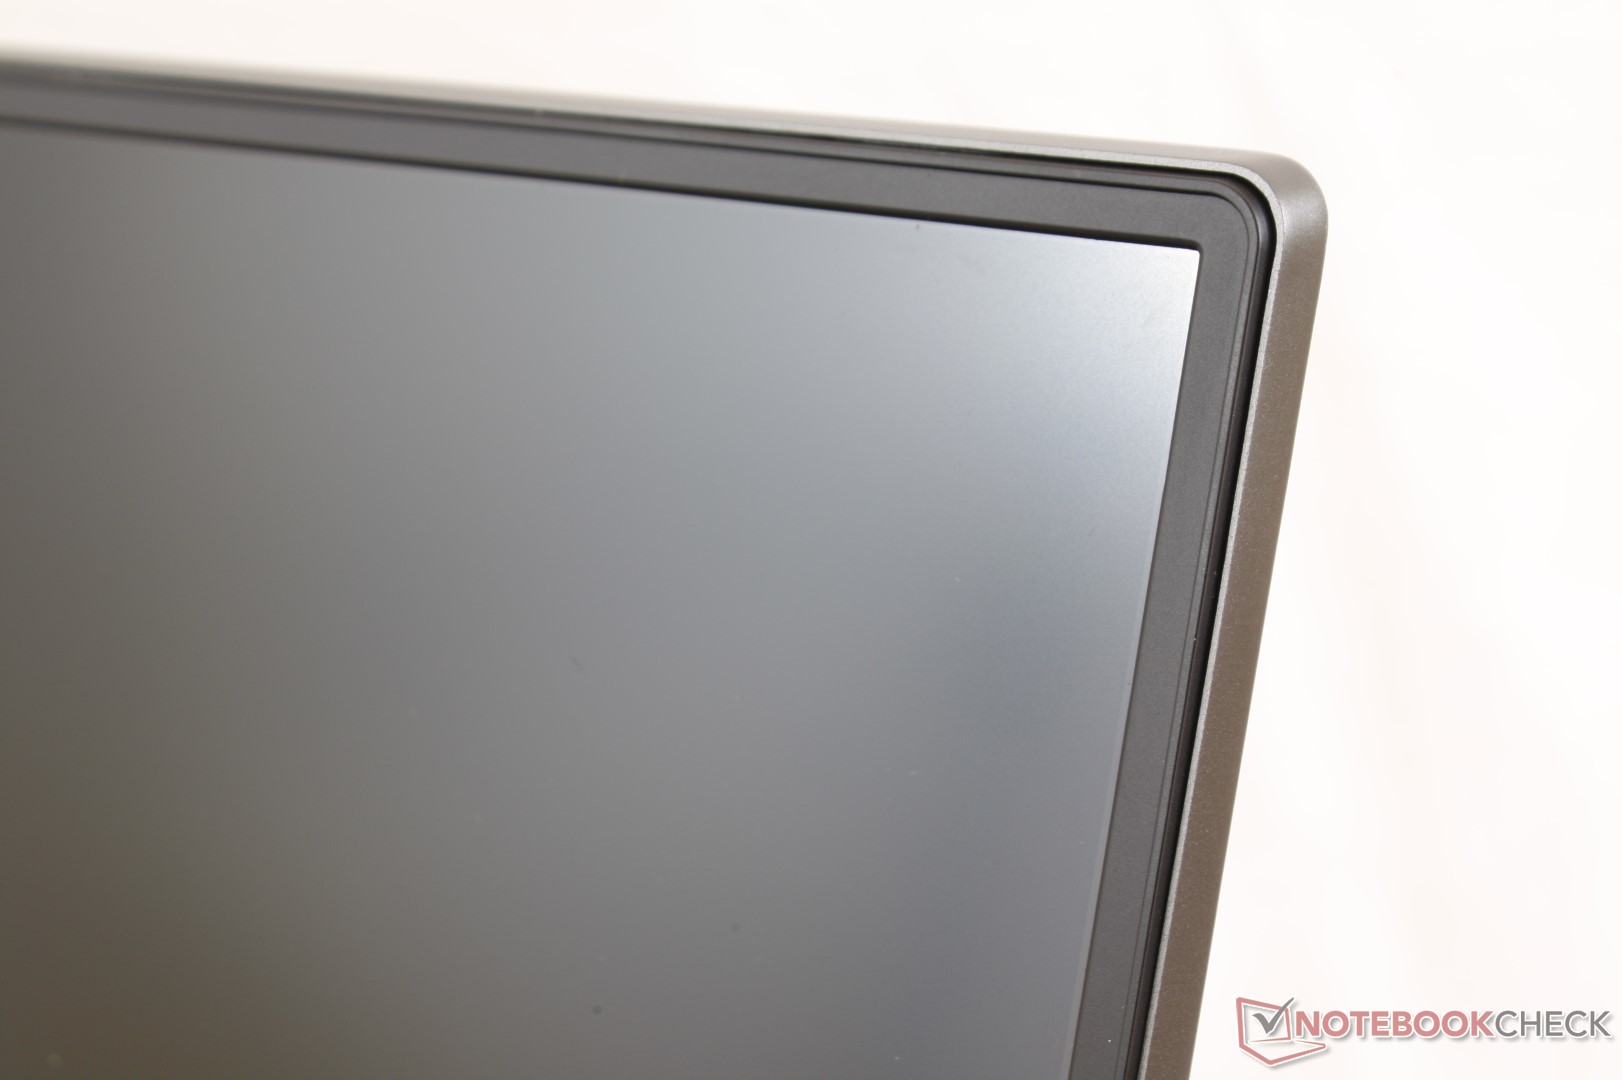
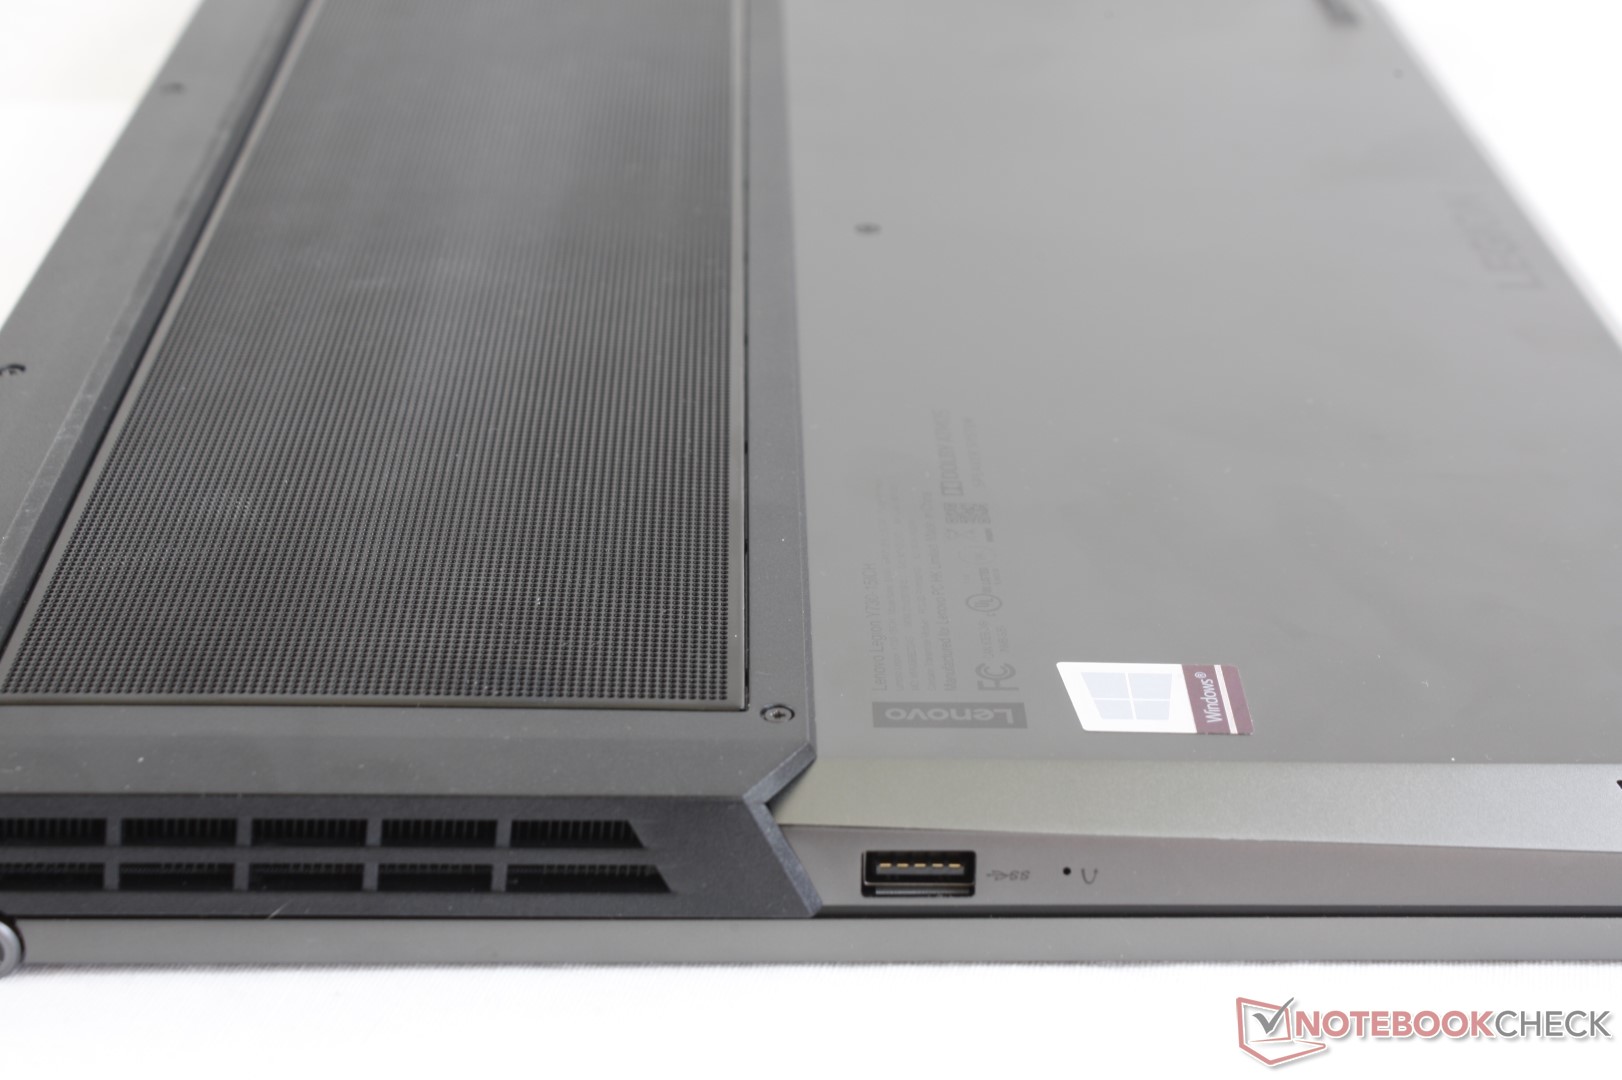
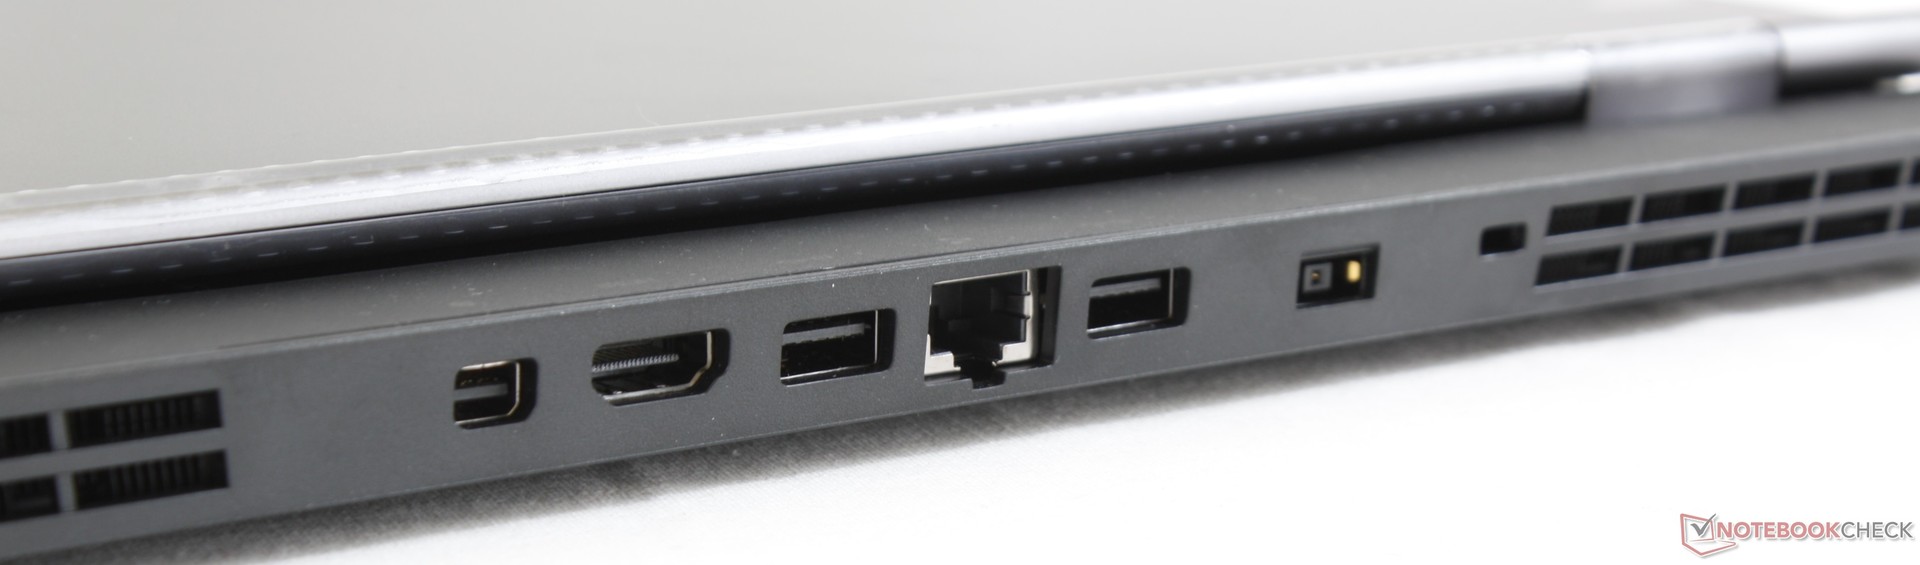
Y730的最大卖点是其单键RGB灯和雷电3端口,价格低至7000元。事实上,大多数入门级游戏竞争对手,如MSI GF63,技嘉Sabre 15或华硕TUF FX504都缺少这些功能中的一个或两个。然而,笔记本电脑的其余部分仅仅是马马虎虎,包括缓慢的响应时间,软绵绵的键盘响应和脆弱的屏幕盖。游戏玩家最好只是等待Y730更新性能更强的GPU选项,或者选择更便宜的Y7000和更好的GTX 1060 SKU。
“高端功能和外观的奇怪融合被很一般的GPU选项和脆弱的屏幕盖所束缚。拯救者Y730的当前版本应该在其机身刚性和GPU选项方面尽早作出更新。”
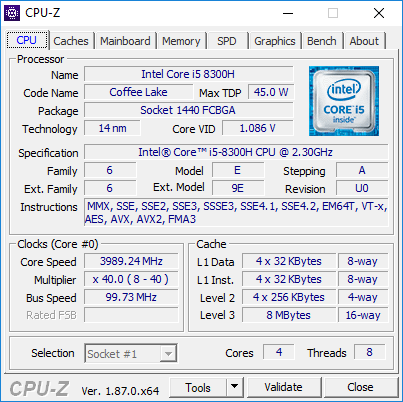
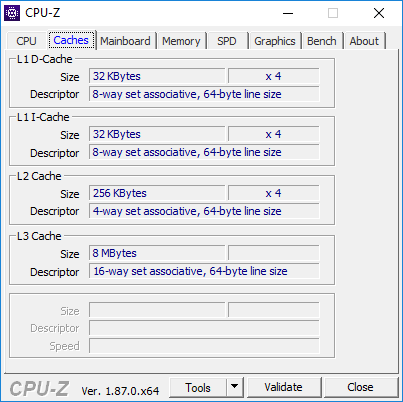
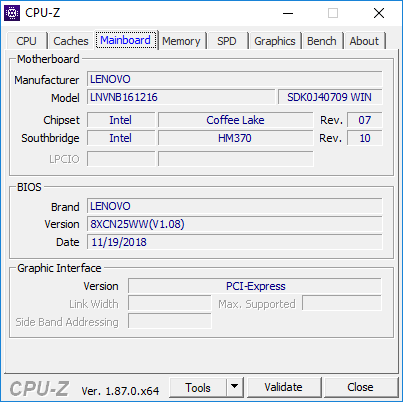
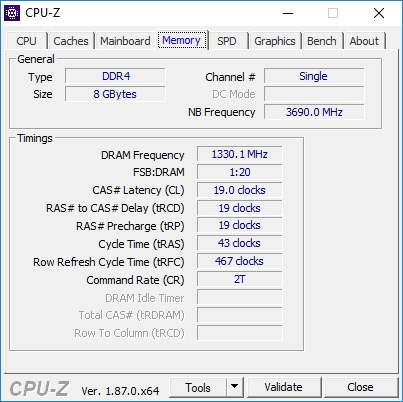
Lenovo Legion Y730-15ICH i5-8300H
- 01/04/2019 v6 (old)
Allen Ngo
Price comparison

