评语 - MacBook Neo 是一款令人惊喜的笔记本电脑,售价 599 美元
全新 MacBook Neo 给人的感觉就像一台典型的 MacBook,这意味着你不必在机身质量、打字体验和显示屏方面做出任何妥协。是的,屏幕不如 MacBook Air,但也相差不大,考虑到低廉的价格,质量确实不错。面板不支持 P3 色域(这并不是什么大问题)或 True Tone,尽管配备了亮度传感器。屏幕非常锐利,还原准确,因此甚至可以进行图片编辑。没有 PWM 闪烁,但屏幕使用了时间抖动。尽管与 MacBook Air 相比反射率更高,但亮度也不错,超过 500 尼特。
在性能方面,A18 Pro 智能手机处理器出人意料地强大,与高通公司的入门级骁龙 X 处理器相比,它提供了更强的单核性能和图形性能,只是多核性能较低。不过,它仍然足以胜任日常任务,整体体验感觉非常迅捷。当然,繁重的多任务处理会是个问题,也会让 8GB 内存很快耗尽,但无论如何这都不是 MacBook Neo 的目标应用场景。如果你保持轻便,主要使用Apple 的原生应用程序,它将是一个非常迅捷、安静的日常伴侣。虽然内存和固态硬盘都不能升级,但部件的可维修性其实很好(无需胶水,所有部件都可拆卸)。
但也有其他缺点:只有两个 USB-C 端口,其中一个还仅限于旧的 2.0 标准,但至少可以用来充电。只有配备 512 GB SSD 存储空间的昂贵机型才有 Touch-ID,但我们认为最大的问题无疑是缺少键盘背光。当你使用较高的显示屏亮度时,电池的运行时间也会明显缩短。
当然 MacBook Air M4如果你想购买售价 699 美元的 MacBook Neo,它可能是一个替代选择,但我们认为售价 599 美元(教育用户为 499 美元)的基本机型将非常成功。是的,你可以购买翻新机或二手设备,但这并不是新款 MacBook Neo 的目标受众。现在的 Neo 也可以做得更好(A19 Pro,12 GB 内存,背光键盘),但我们可以肯定的是,它的价格会更高,而且Apple 可能还想为改进后的第二代 MacBook Neo 保留一些东西。
Pros
Cons
- $664.05Apple 2026 MacBook Neo 13-inch Laptop with A18 Pro chip: Built for AI and Apple Intelligence, Liquid Retina Display, 8GB Unified Memory, 256GB SSD Storage, 1080p FaceTime HD Camera; Indigo
- $699.00Apple 2026 MacBook Neo 13-inch Laptop with A18 Pro chip: Built for AI and Apple Intelligence, Liquid Retina Display, 8GB Unified Memory, 256GB SSD Storage, 1080p FaceTime HD Camera; Silver
- $689.99Apple 2026 MacBook Neo 13-inch Laptop with A18 Pro chip: Built for AI and Apple Intelligence, Liquid Retina Display, 8GB Unified Memory, 256GB SSD Storage, 1080p FaceTime HD Camera; Blush
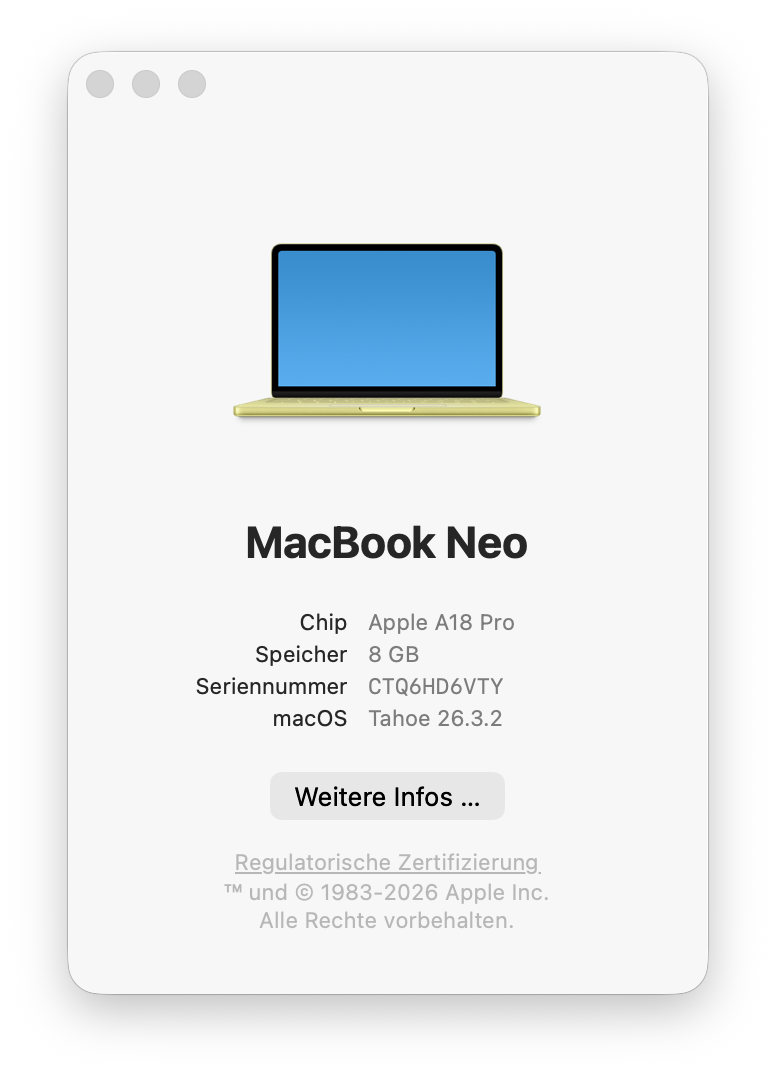
Apple 新款 13 英寸 MacBook Neo 进入了未知领域,起价仅为 599 美元(教育用户为 499 美元),搭载智能手机芯片 A18 Pro、8 GB 内存和 256 GB SSD 存储器。我们是在发布当天在当地的Apple 商店购买的基本机型。699 美元的可选型号提供更大的 512 GB 固态硬盘和 Touch-ID 指纹扫描仪。
规格
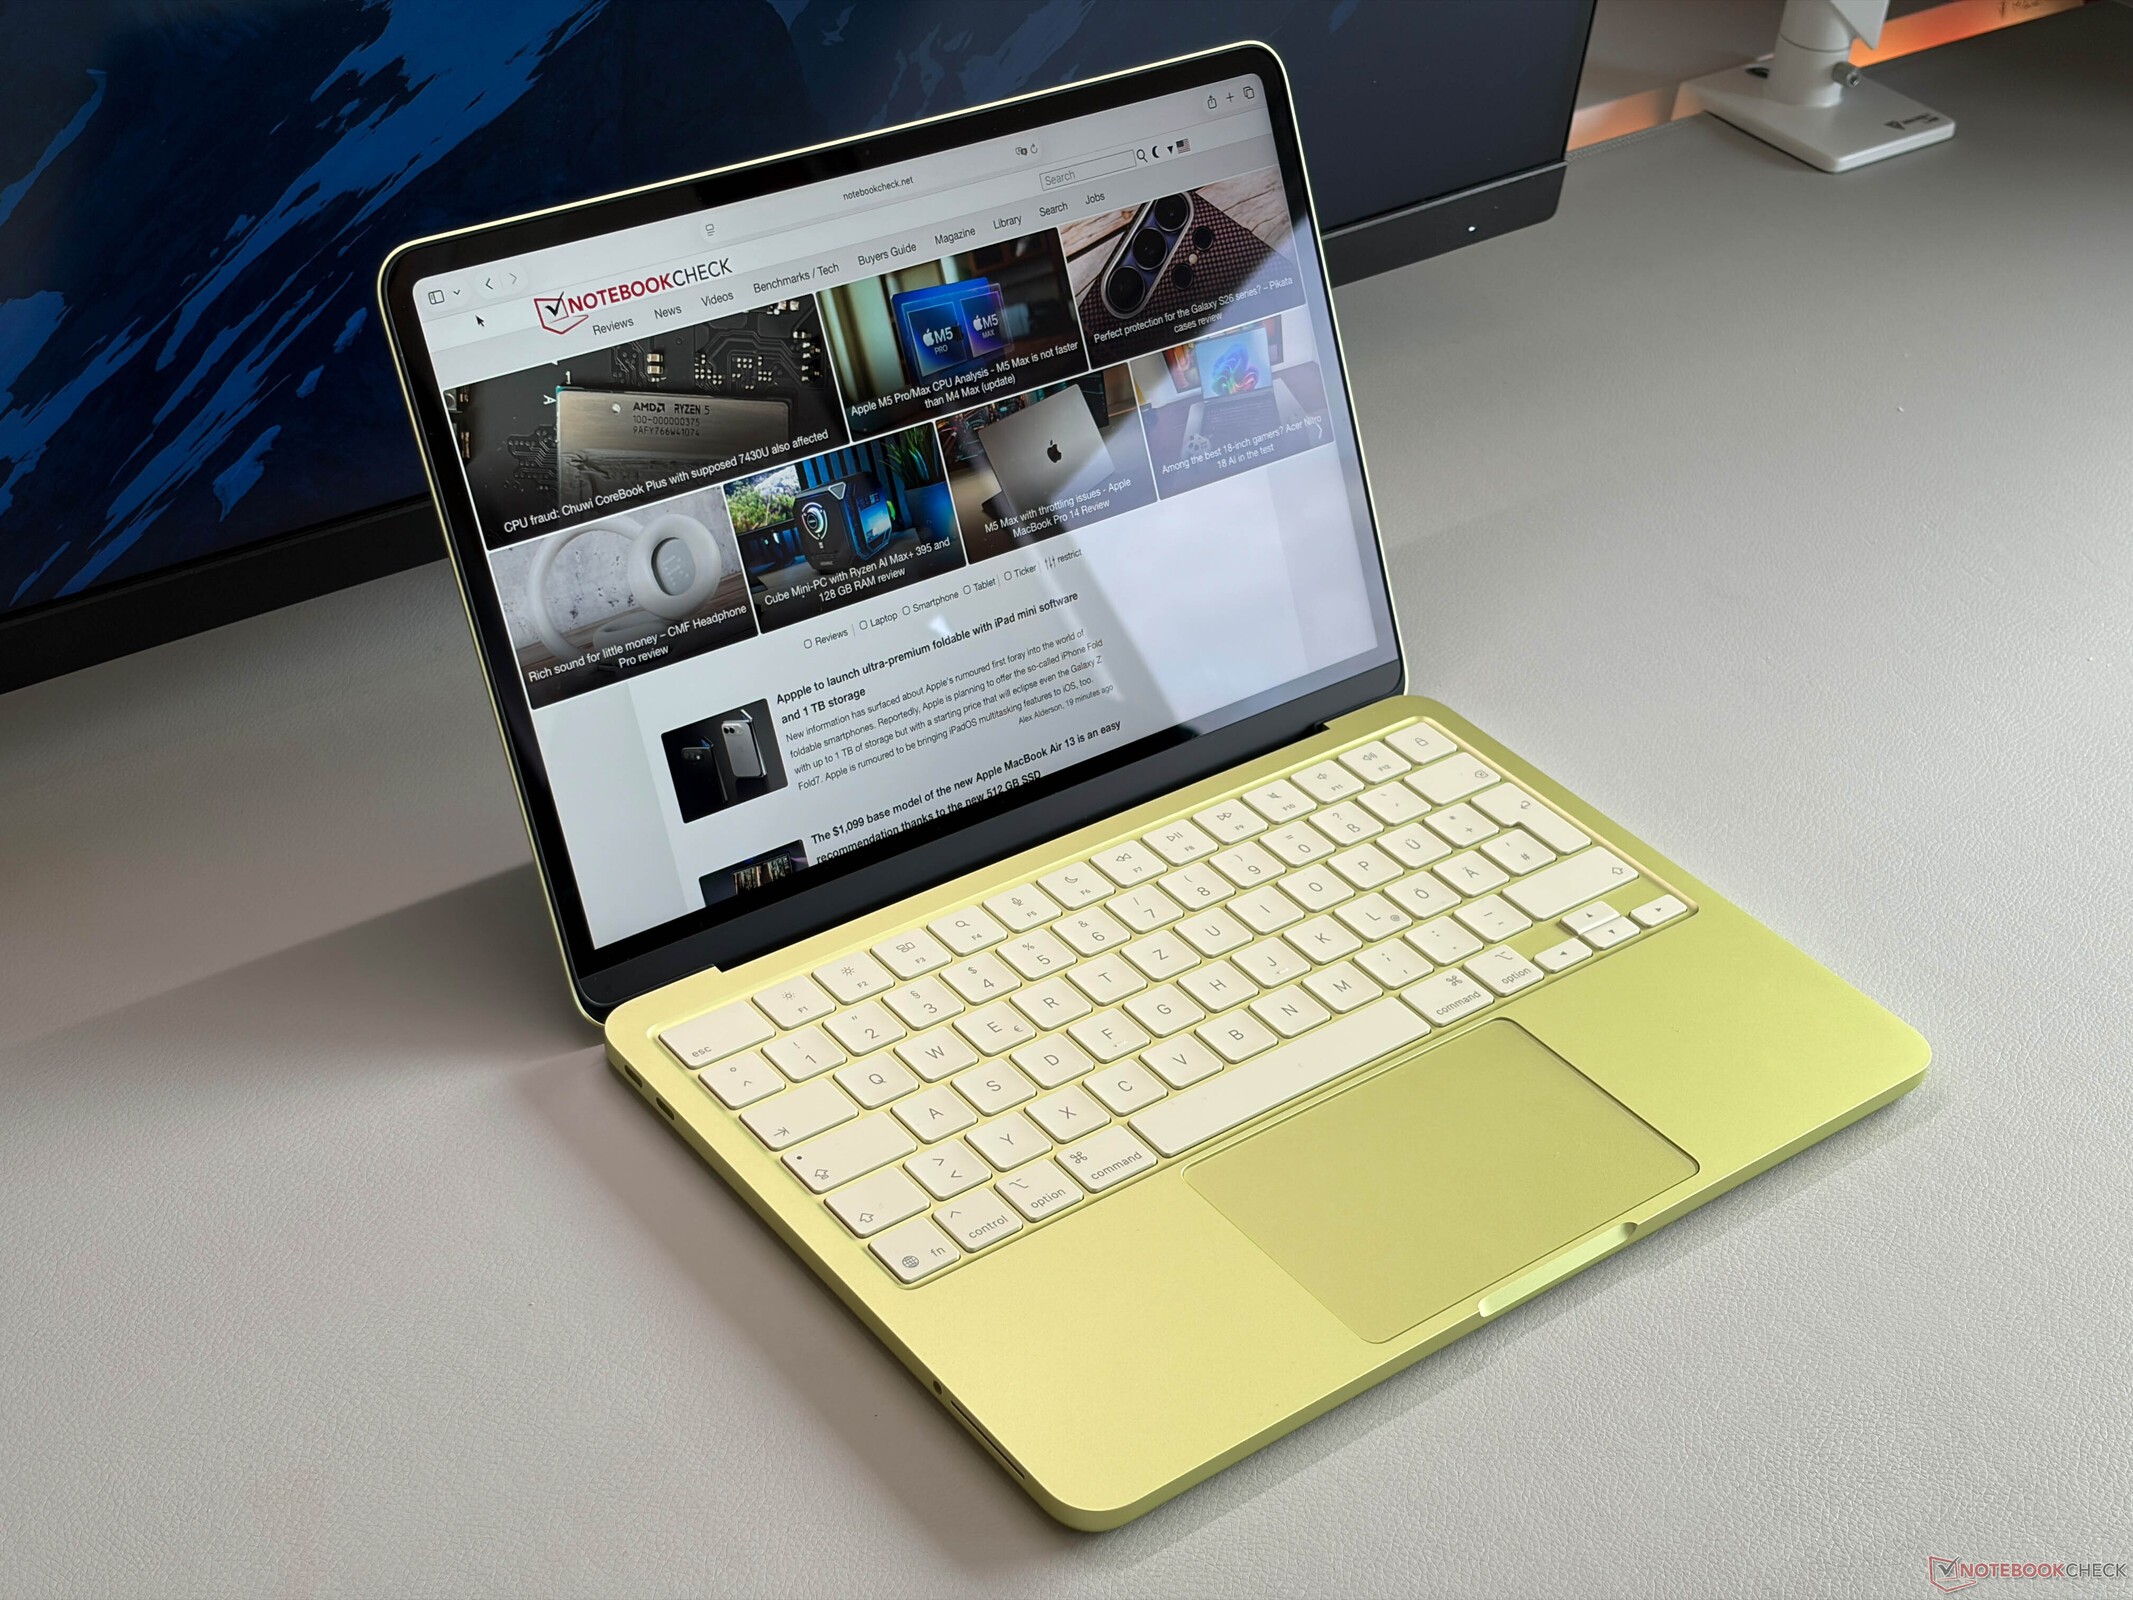
外壳 - MacBook Neo 感觉与普通 MacBook 无异

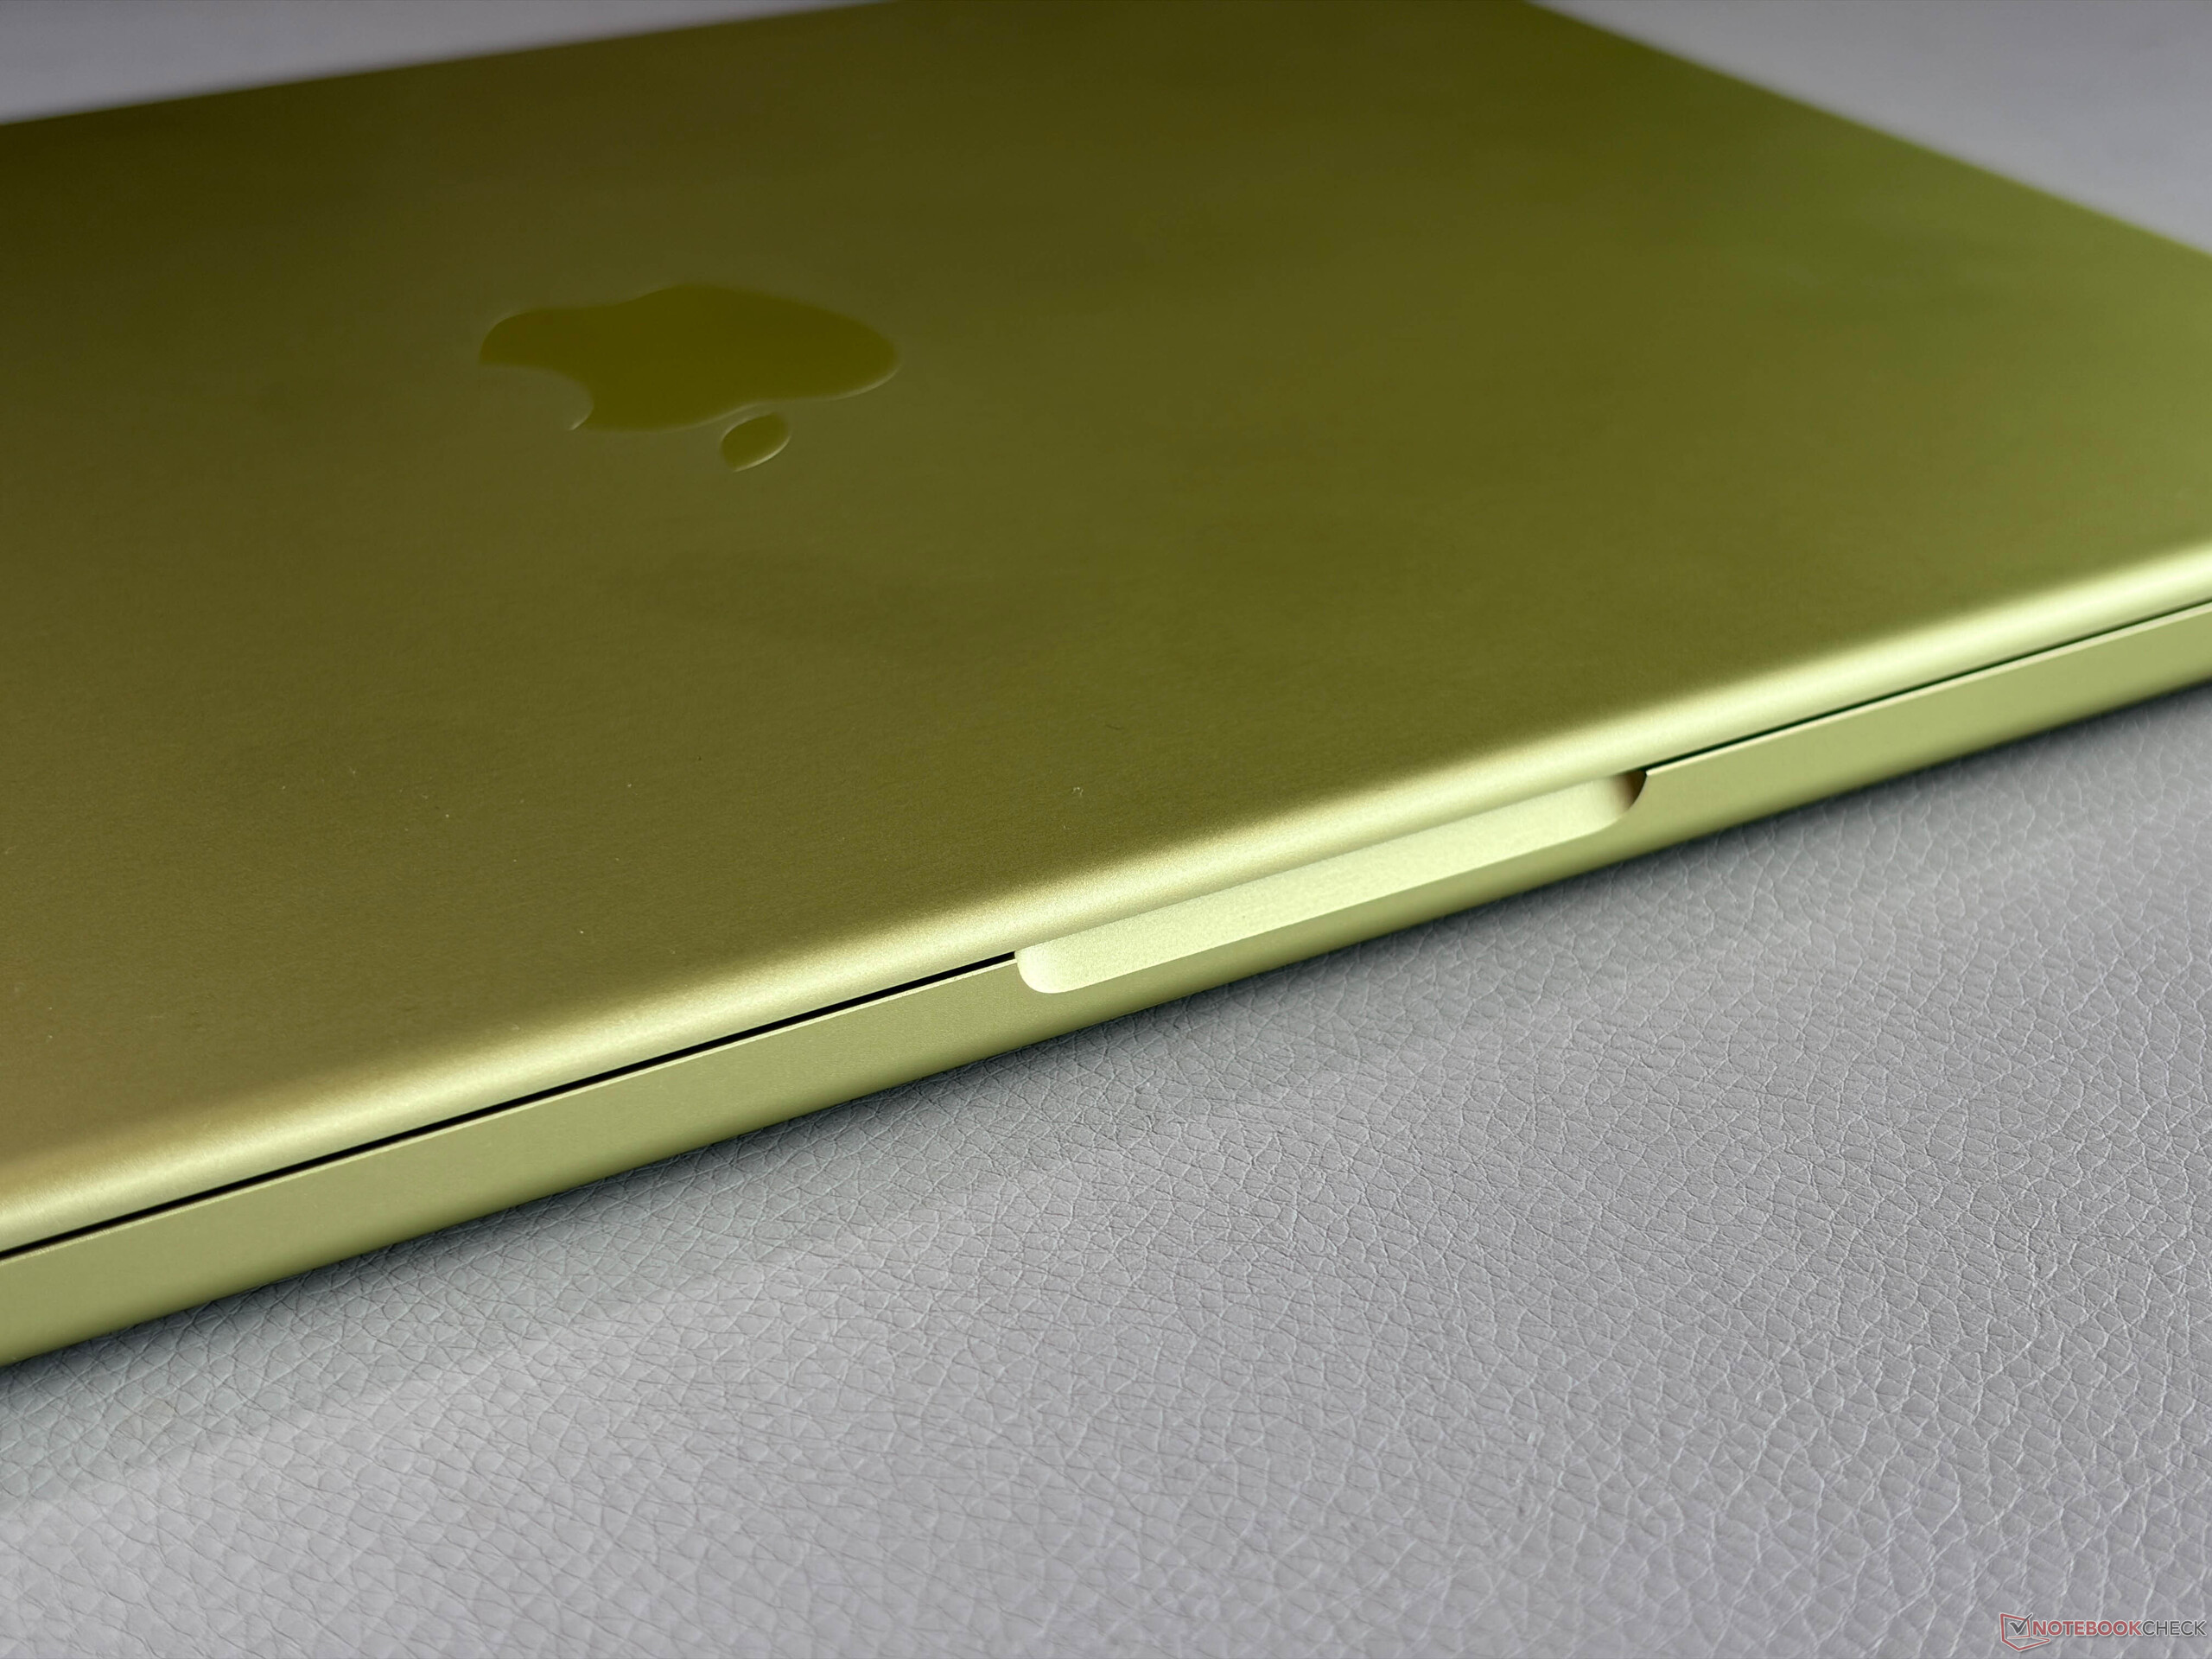
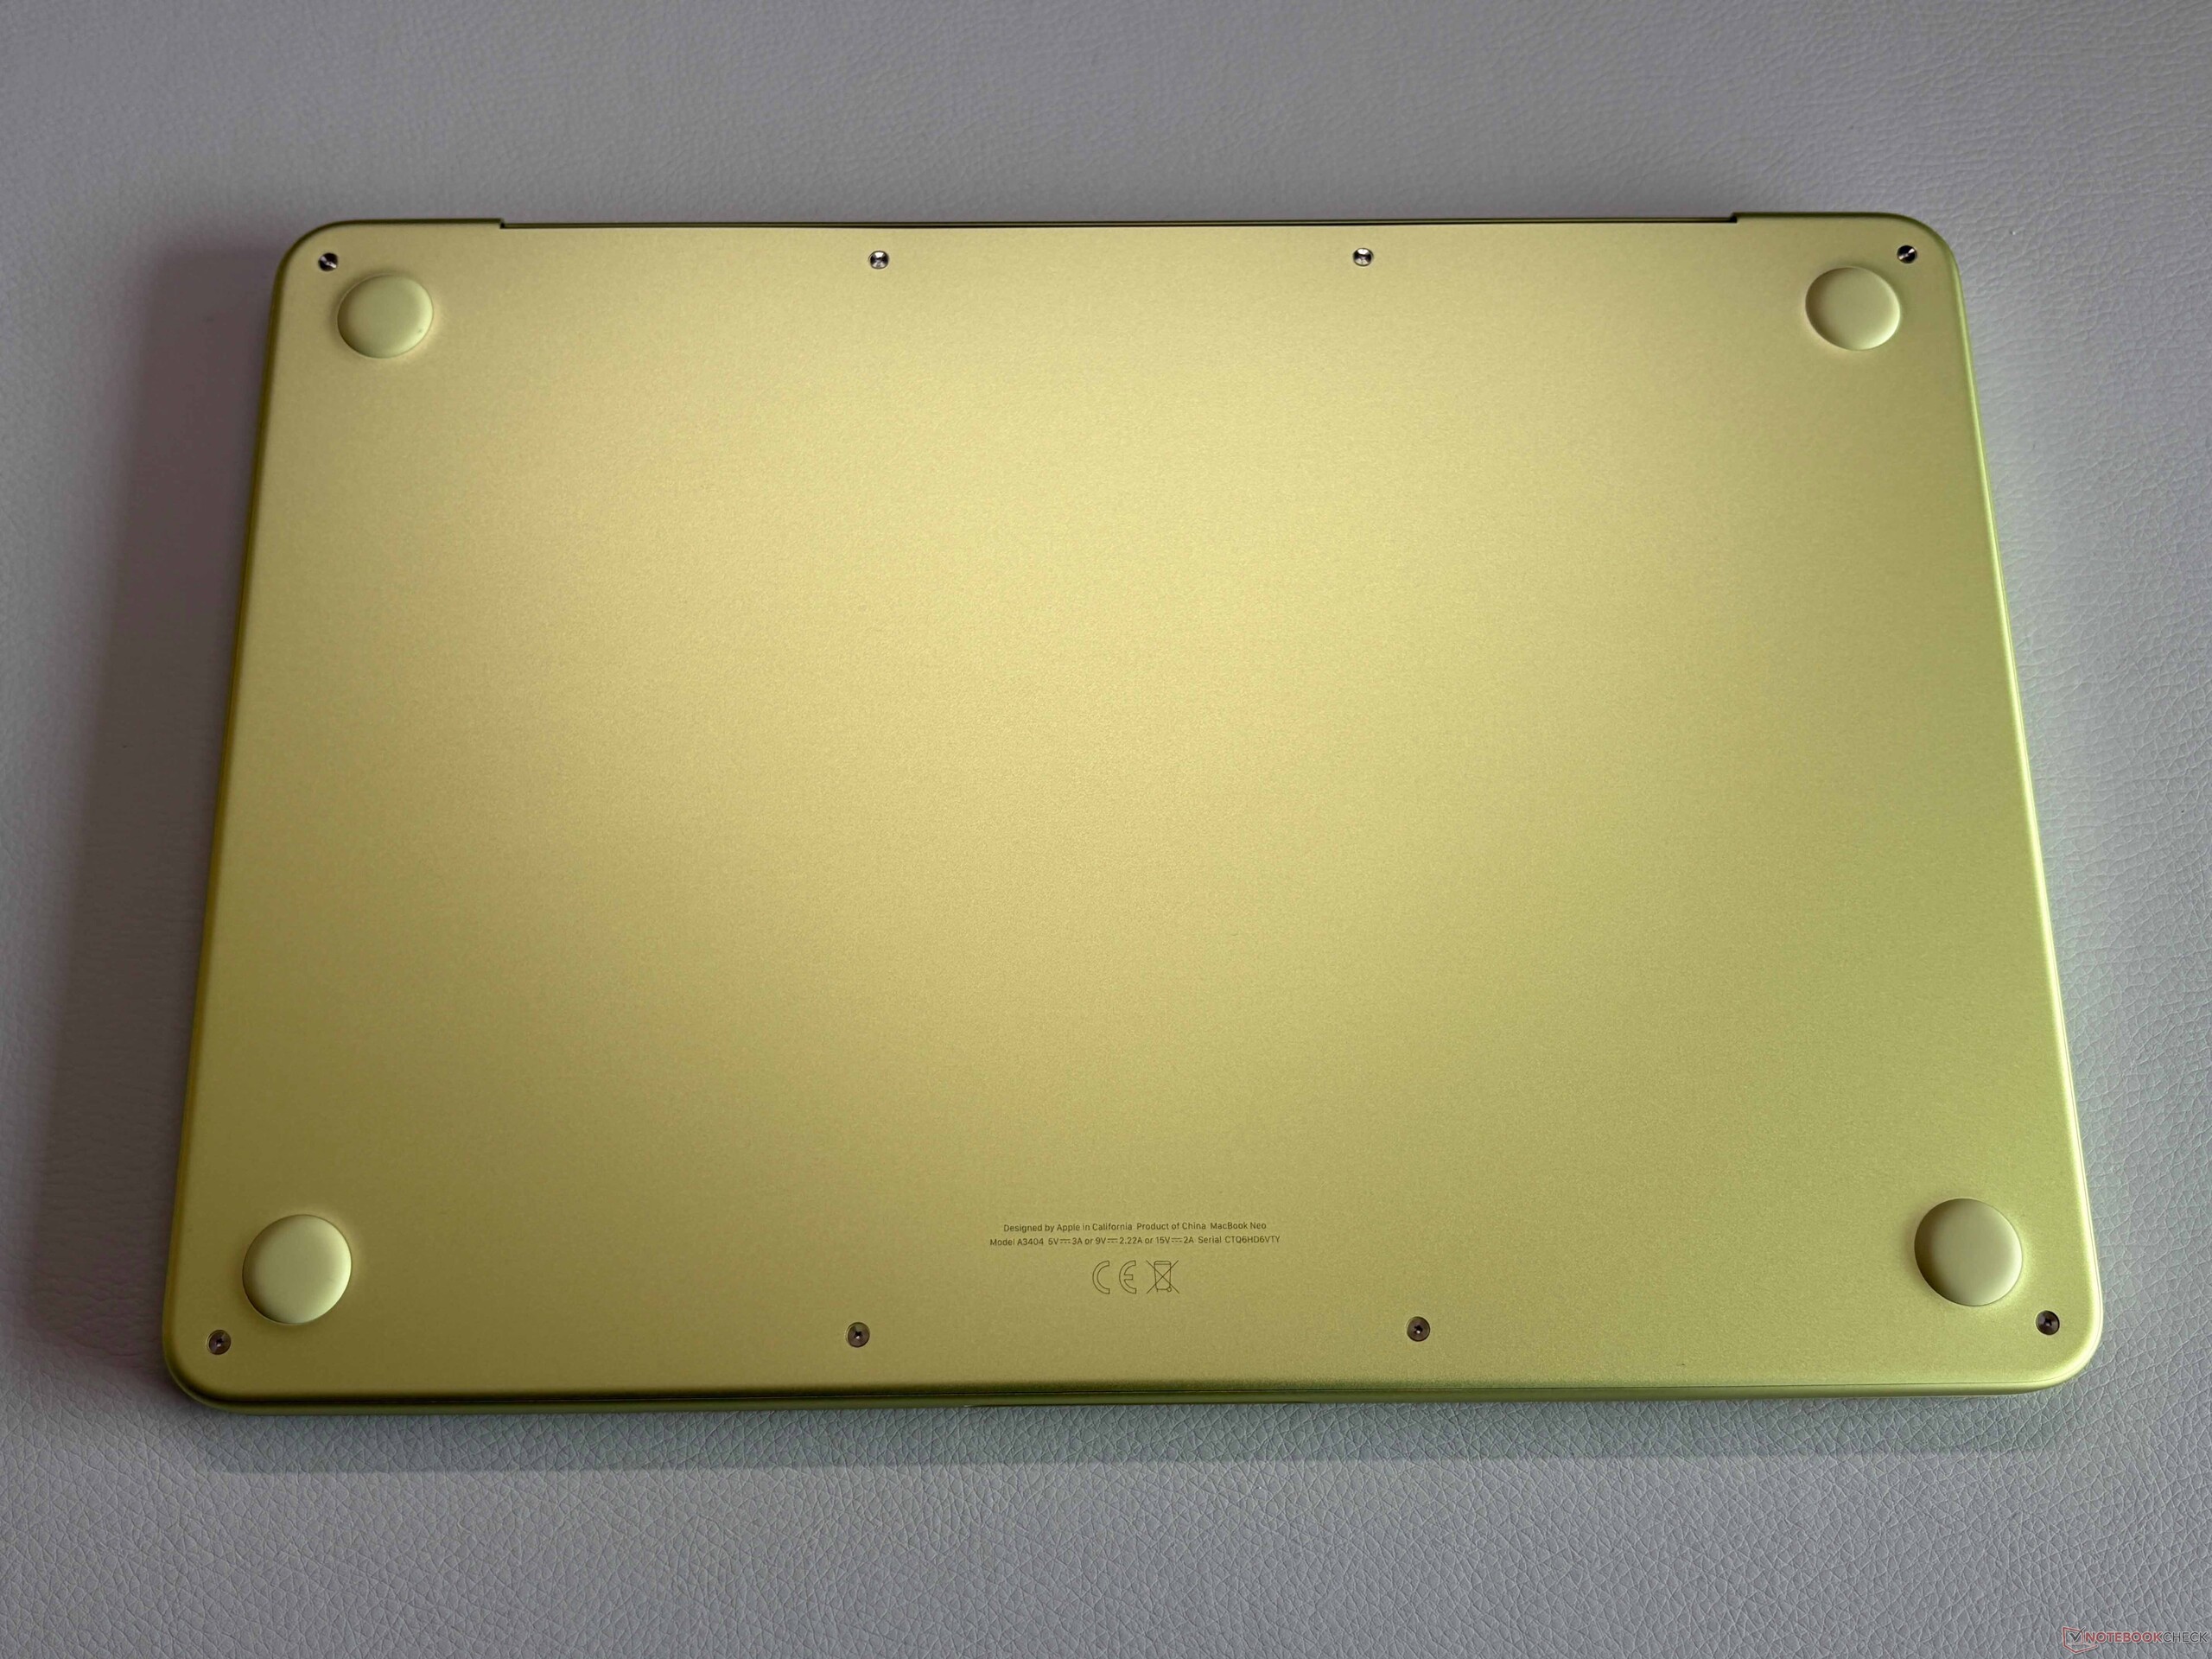
Apple 新款 MacBook Neo 有四种不同的颜色,我们拿到的是柑橘色版本。这无疑是相当清新的,但这显然是品味问题。如果你喜欢低调,还有银色版本。Apple 还为橡胶脚垫和 macOS 颜色上了色,尽管这可以更改。我们机型上的键盘也略微偏向黄色,但很细微。
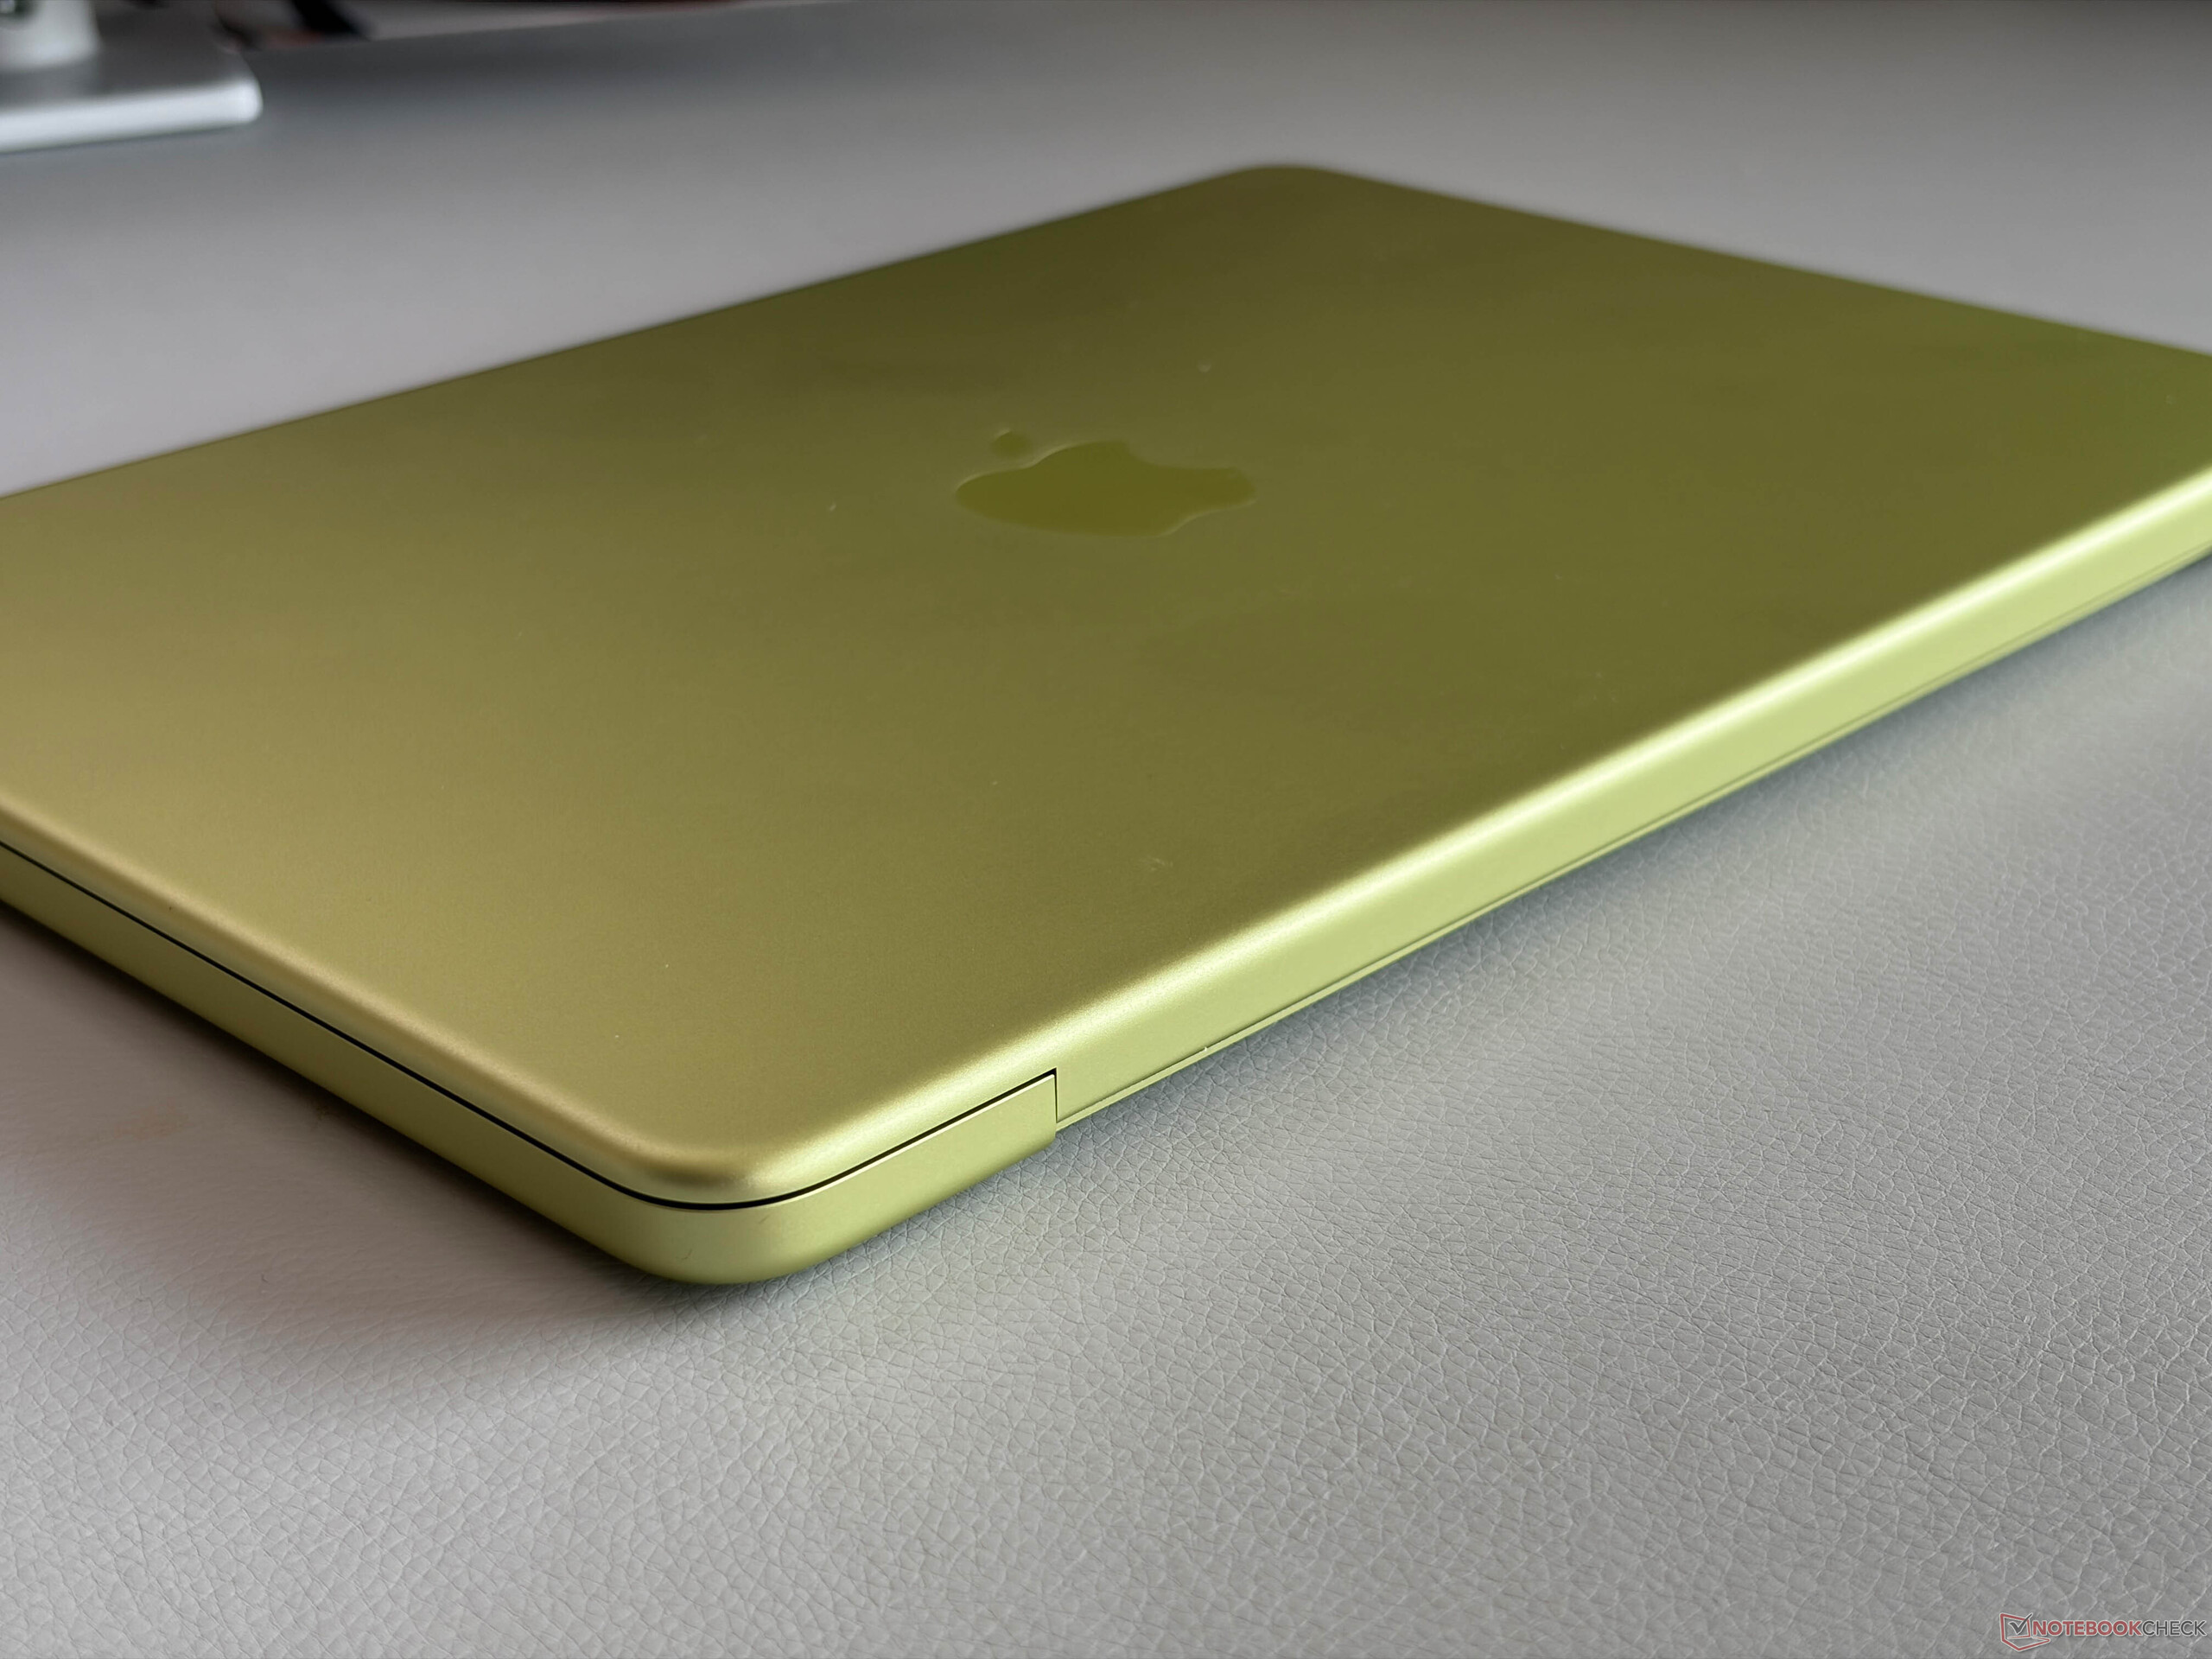
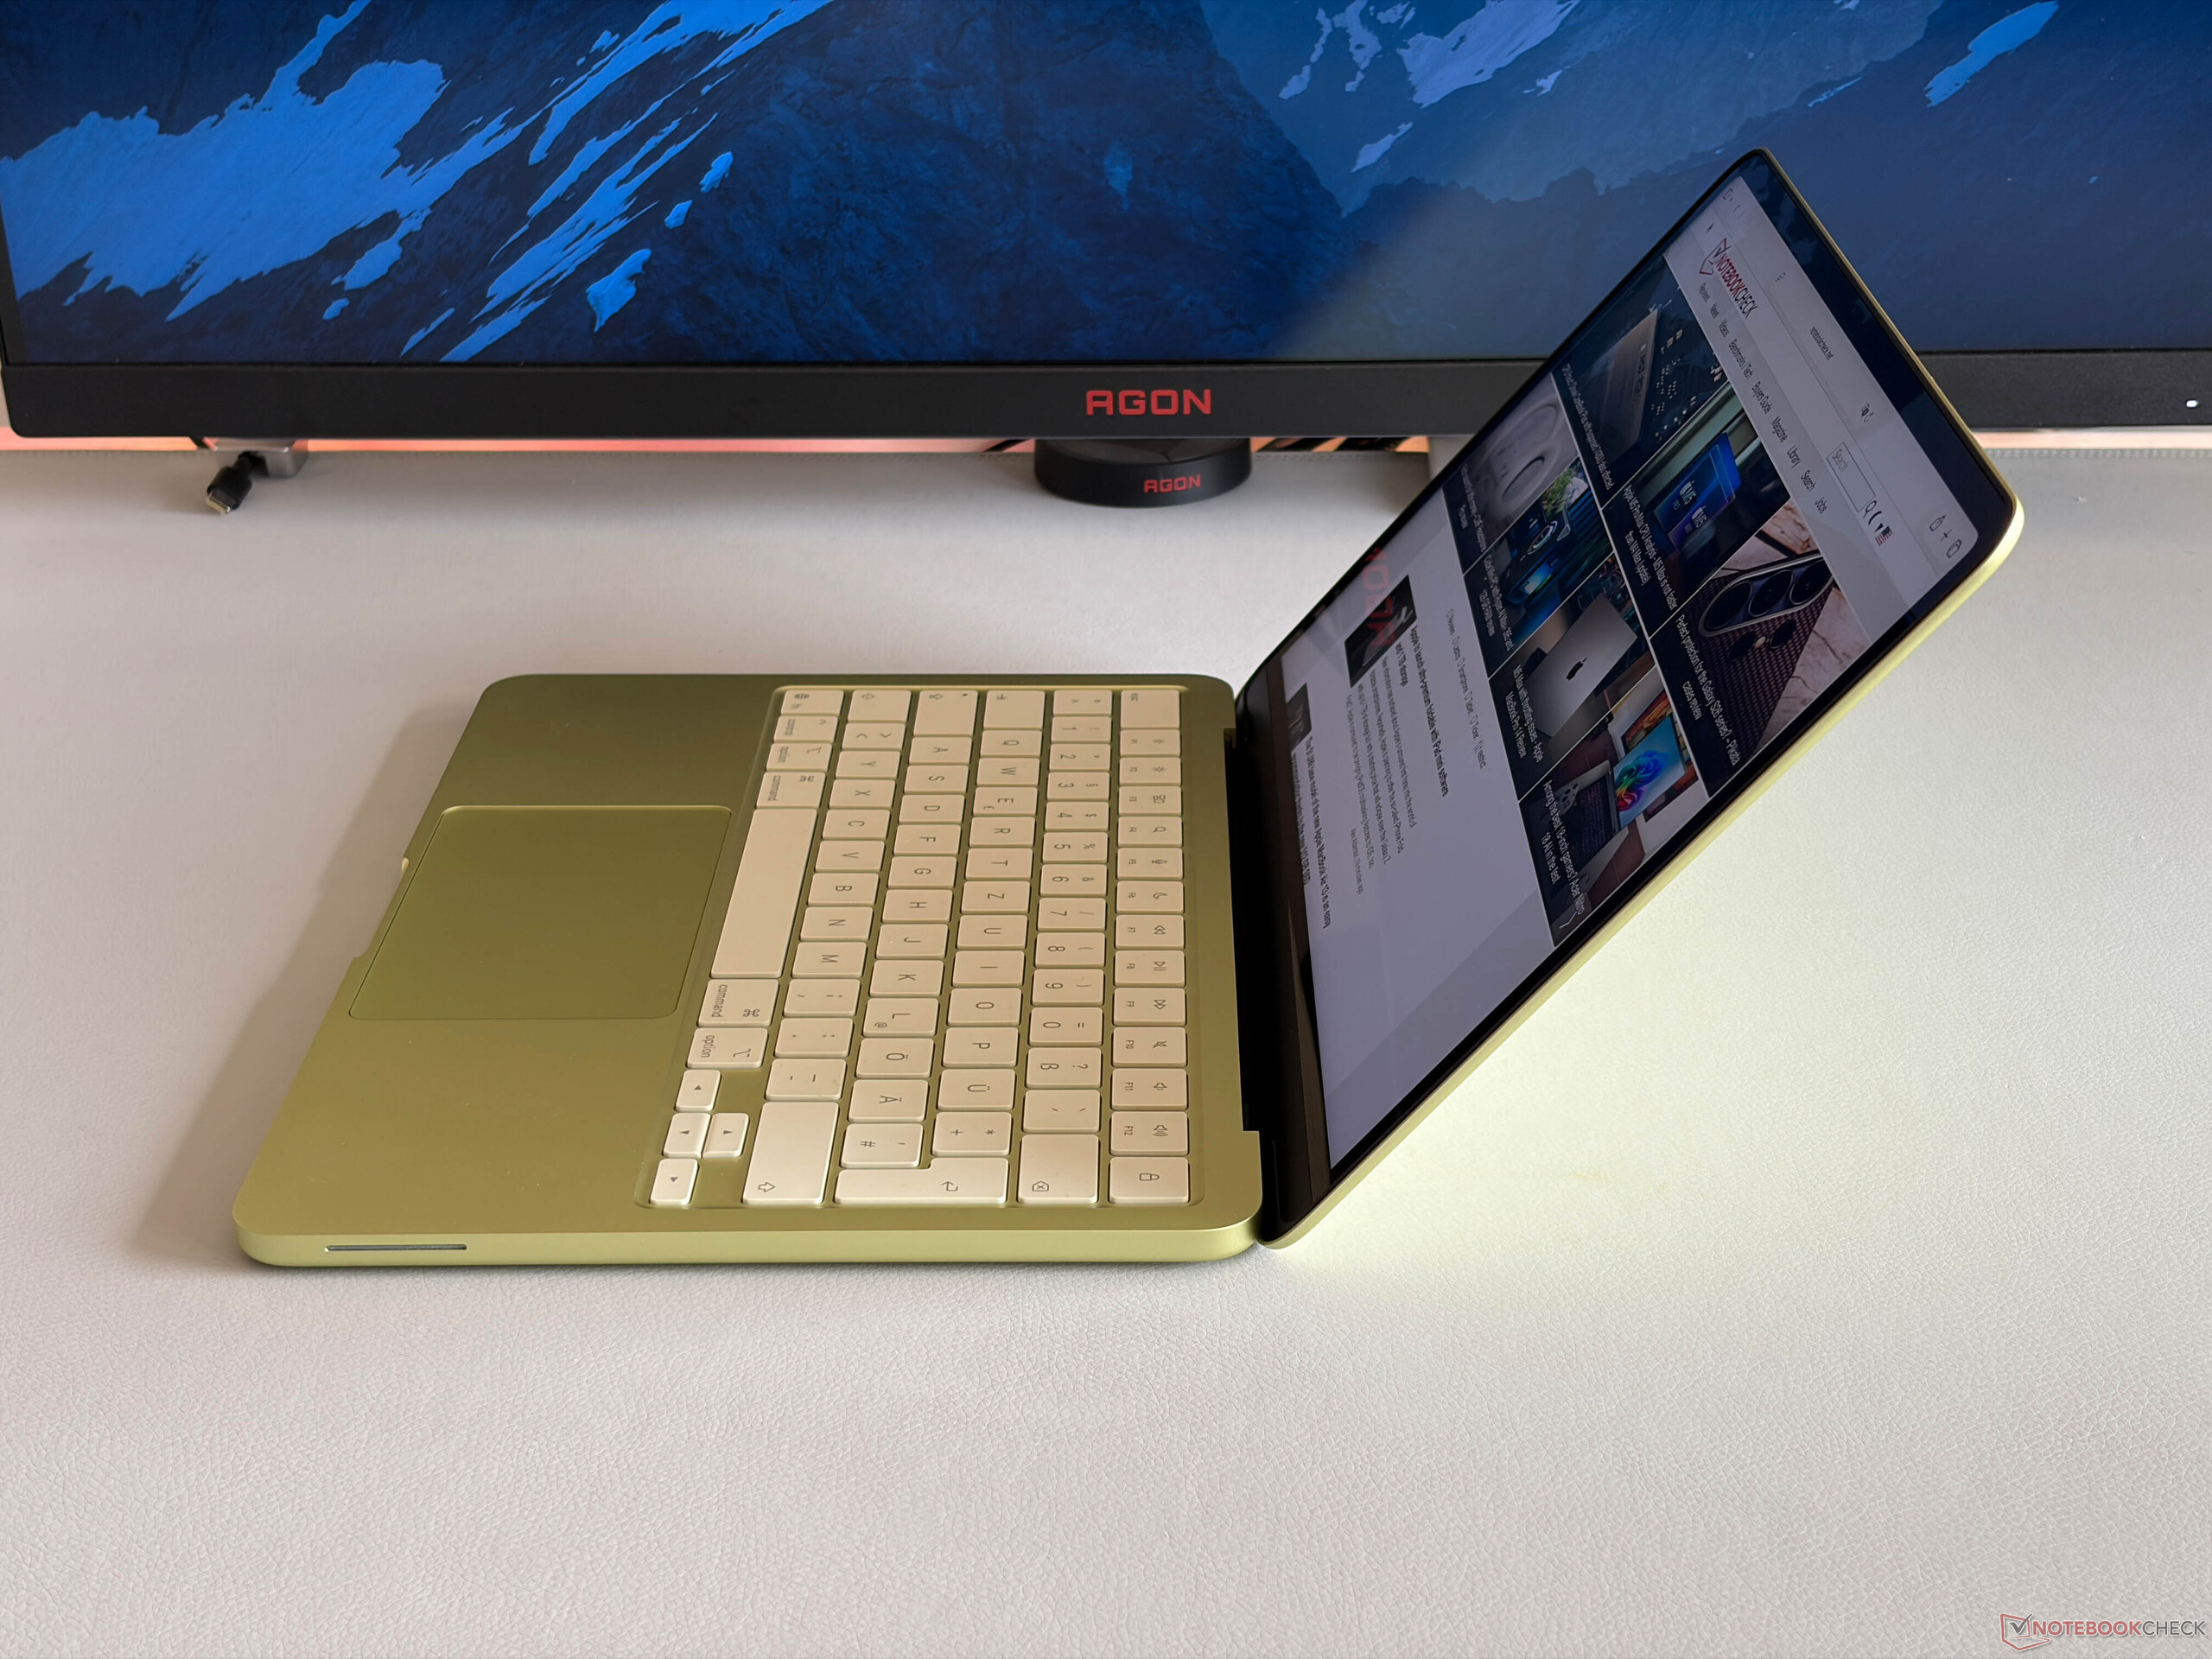
Apple 这款 MacBook 采用铝制机身,质量比 599 美元的预期要好,与所有其他更昂贵的 MacBook 几乎一样。使用它时,感觉就像一台普通的 MacBook,制造质量和稳定性都非常好。盖子也是如此,我们从背面按压也不会造成图片变形。铰链调整得很好,没有明显的晃动,同时单手就能轻松打开盖子(最大开启角度 135 度)。虽然边框很厚,但没有显示屏凹槽,这在我们看来改进了设计。
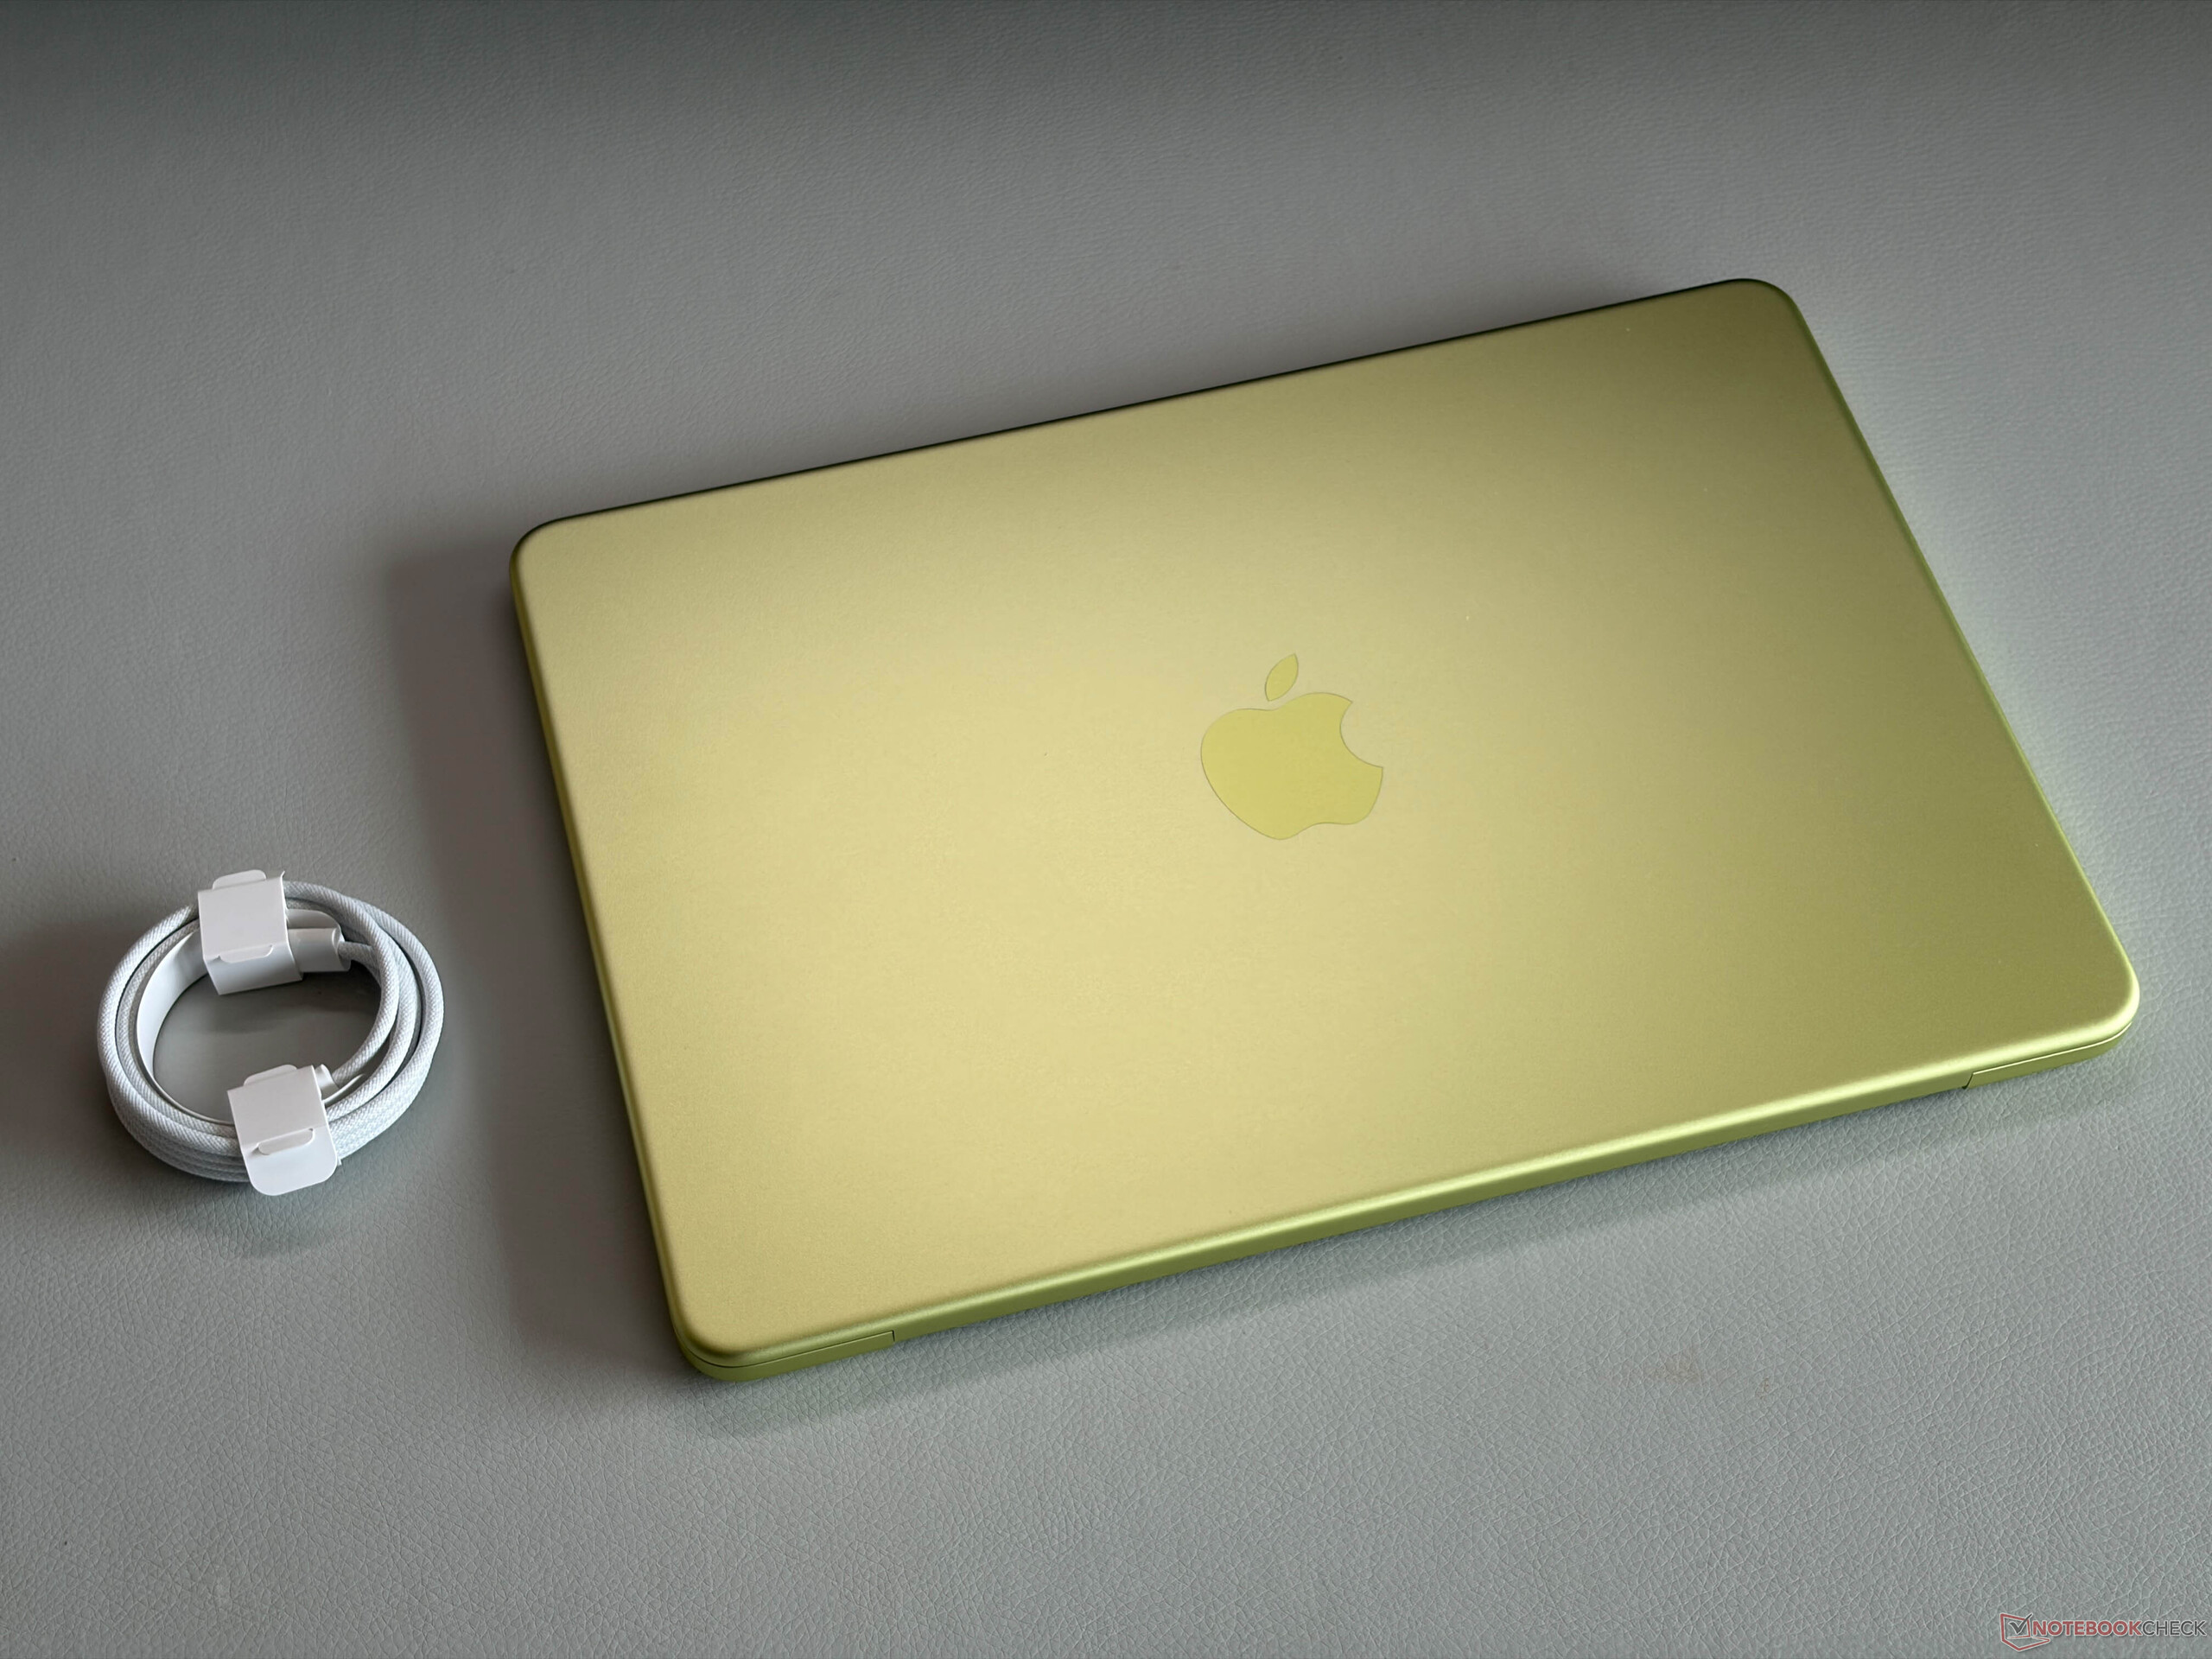

MacBook Neo(12.7 毫米)比目前的 MacBook Air 厚一些。 MacBook Air(11.3 毫米)厚一些。它的重量与目前的 MacBook Air 基本相同,都是 1.235 千克,因此整体非常小巧。我们还用自己的 MacBook Air M1 拍了一些照片进行对比,它的占地面积稍大一些。


连接性 - Neo 配备 USB 3.0 和 2.0

Apple 仅包含两个 USB-C 端口,其中一个仅限于旧的 USB 2.0 标准。它至少还能用于充电,因此并非完全无用。后部的 USB-C 端口(3.2 Gen. 2)可用于连接外接屏幕,除内置屏幕外,Neo 还支持一块分辨率高达 4K(60 Hz)的外接屏幕。我们用常规的桌面设置进行了试用,通过 USB-C 接口与屏幕连接(充电、使用扬声器以及直接连接到屏幕的输入设备),工作正常。两个 USB-C 端口位于左后方,而 3.5 毫米立体声插孔则位于更靠前的位置。
Wi-Fi 模块支持 Wi-Fi 6E,我们的标准化测试结果尚可。接收性能相当稳定,约为 1.1-1.3 Gbps,但在发送数据时,波动较大。不过,我们在下载游戏、文件或观看 YouTube 视频时没有遇到任何问题。1080p FaceTime HD 网络摄像头能拍出不错的照片,麦克风也能很好地工作,但它不支持 Center Stage。


| Networking | |
| Apple MacBook Neo 256 GB | |
| iperf3 transmit AXE11000 | |
| iperf3 receive AXE11000 | |
| Microsoft Surface Laptop 13 | |
| iperf3 transmit AXE11000 | |
| iperf3 receive AXE11000 | |
| HP Omnibook 5 14 | |
| iperf3 transmit AXE11000 | |
| iperf3 receive AXE11000 | |
| iperf3 transmit AXE11000 6GHz | |
| iperf3 receive AXE11000 6GHz | |
| Lenovo IdeaPad Slim 3 14 AHP G10 | |
| iperf3 transmit AXE11000 | |
| iperf3 receive AXE11000 | |


维护
底部面板由五角螺丝固定,可以轻松拆卸。虽然内存和存储空间都无法升级,但 MacBook Neo 的维修其实非常简单,电池、扬声器模块、端口等所有部件都用螺丝固定,Apple ,不使用粘合剂。这无疑是朝着正确方向迈出的一步。


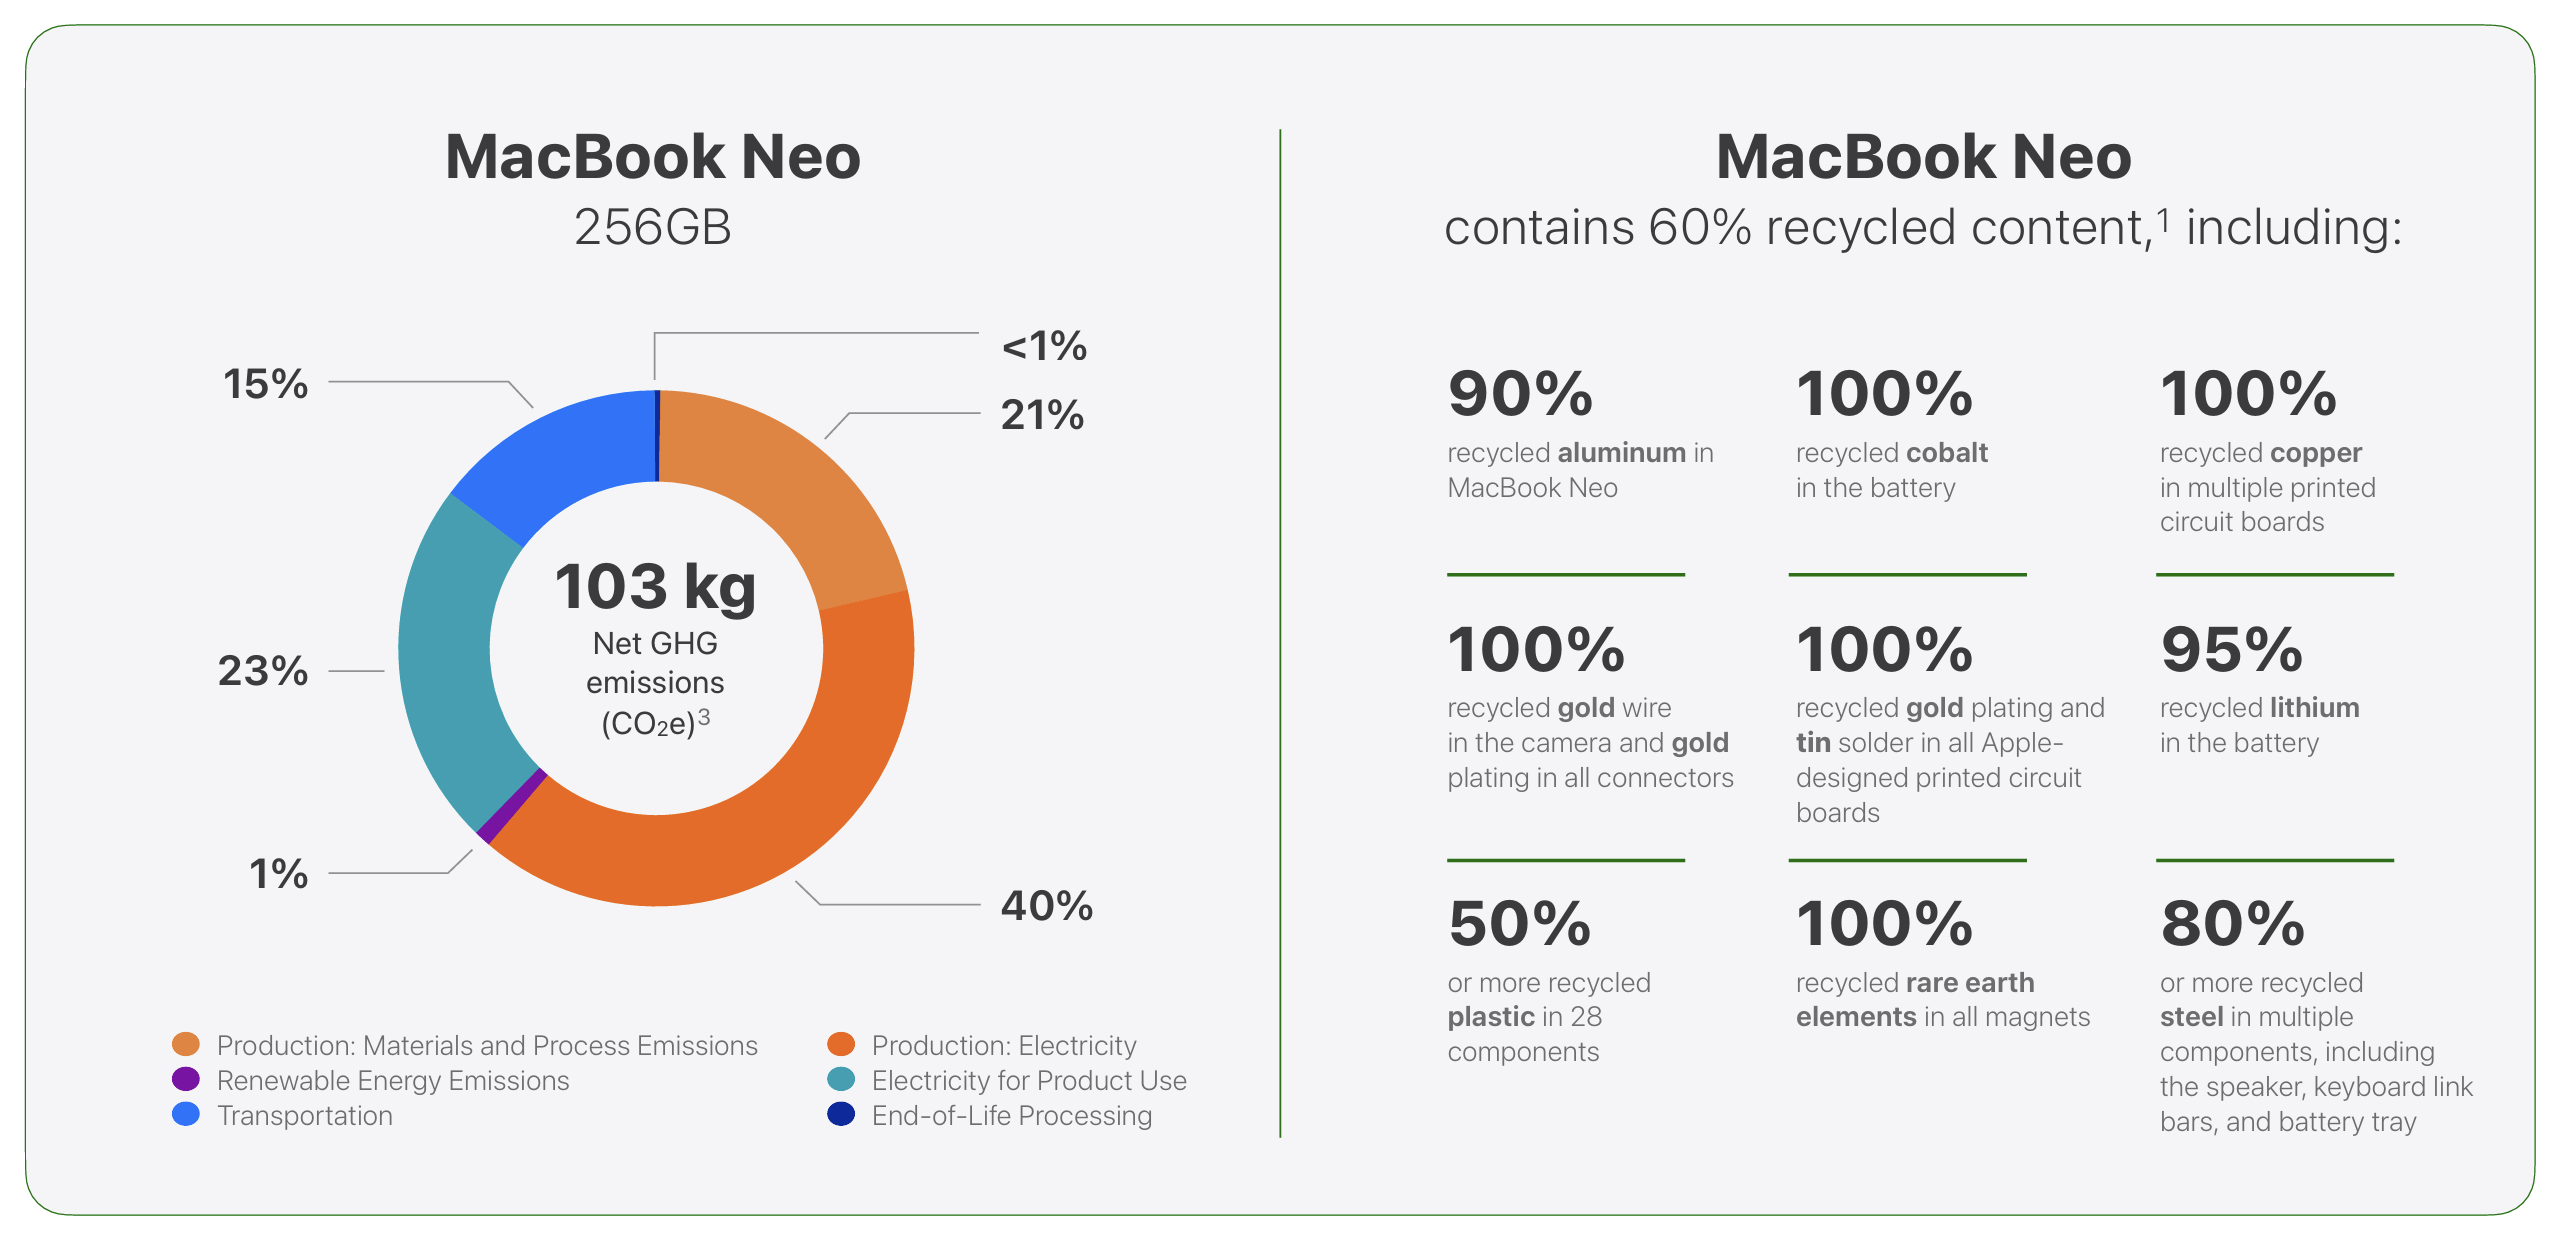
可持续性
Apple 为 MacBook Neo 提供了一份全面的环境报告,其中包含有关二氧化碳排放量以及设备和包装使用可回收材料的数据。基本机型的预计碳足迹为 103 千克CO2e。
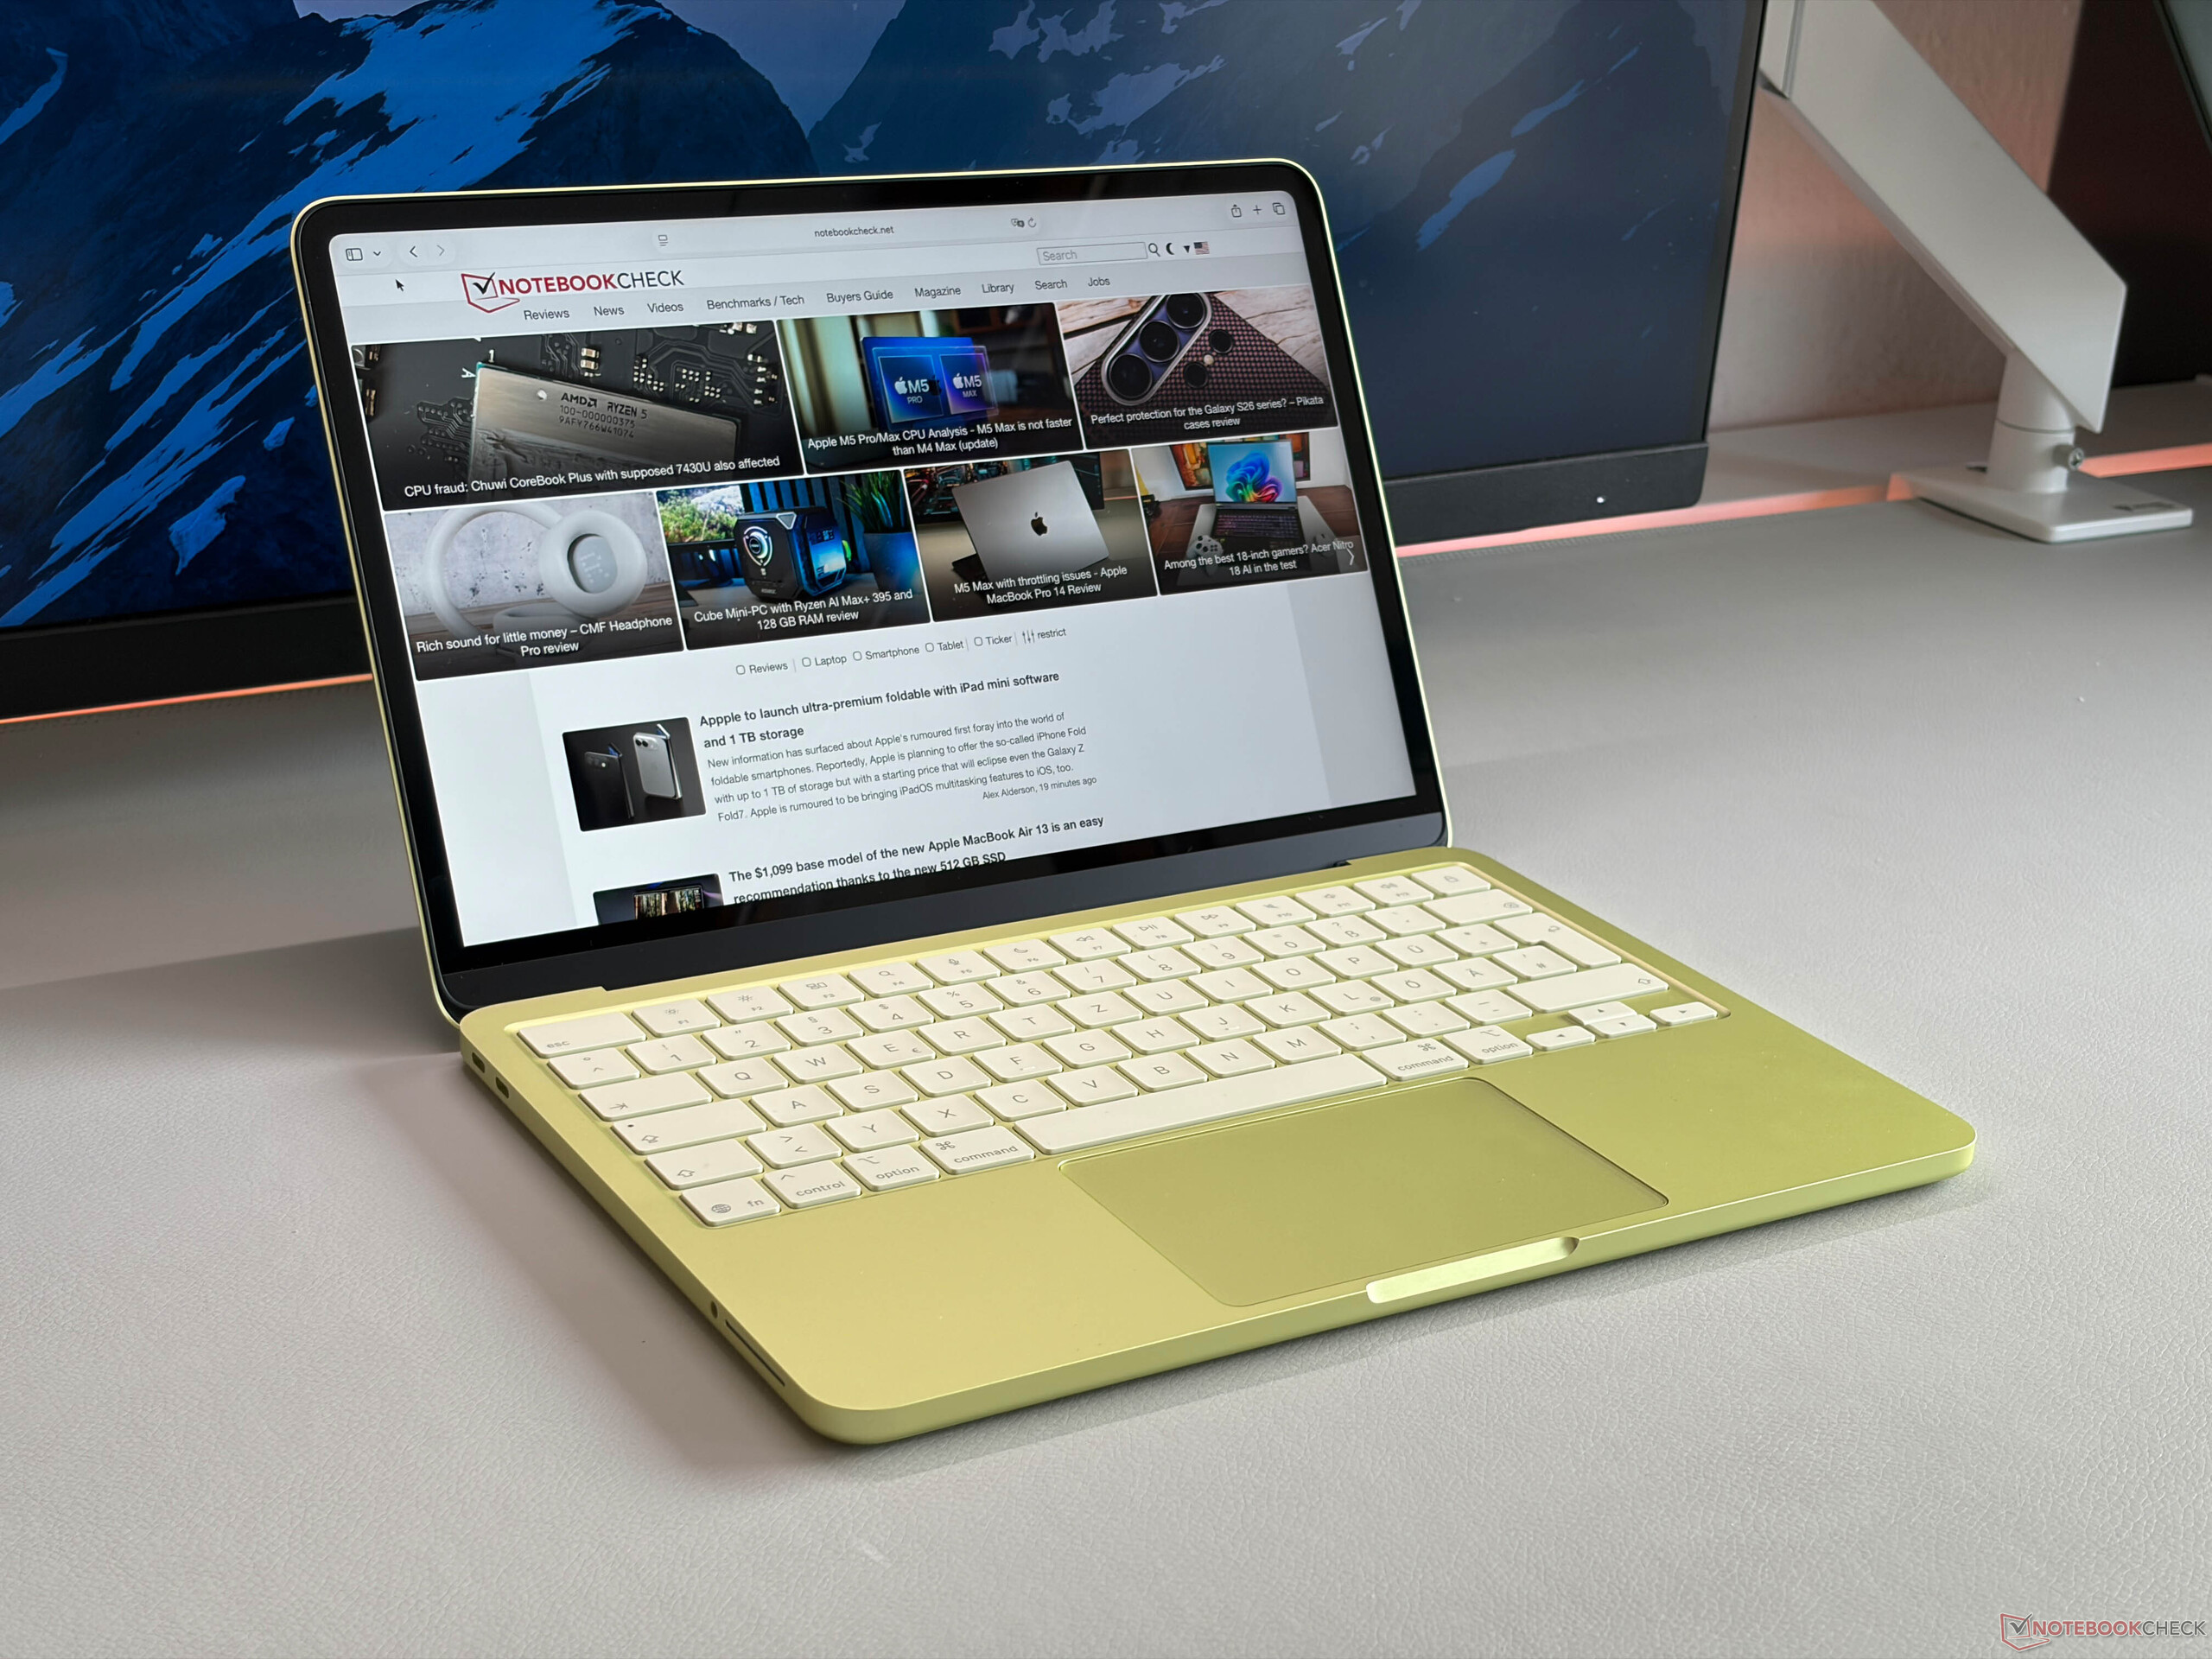
输入设备 - 熟悉的打字体验,良好的机械触控板
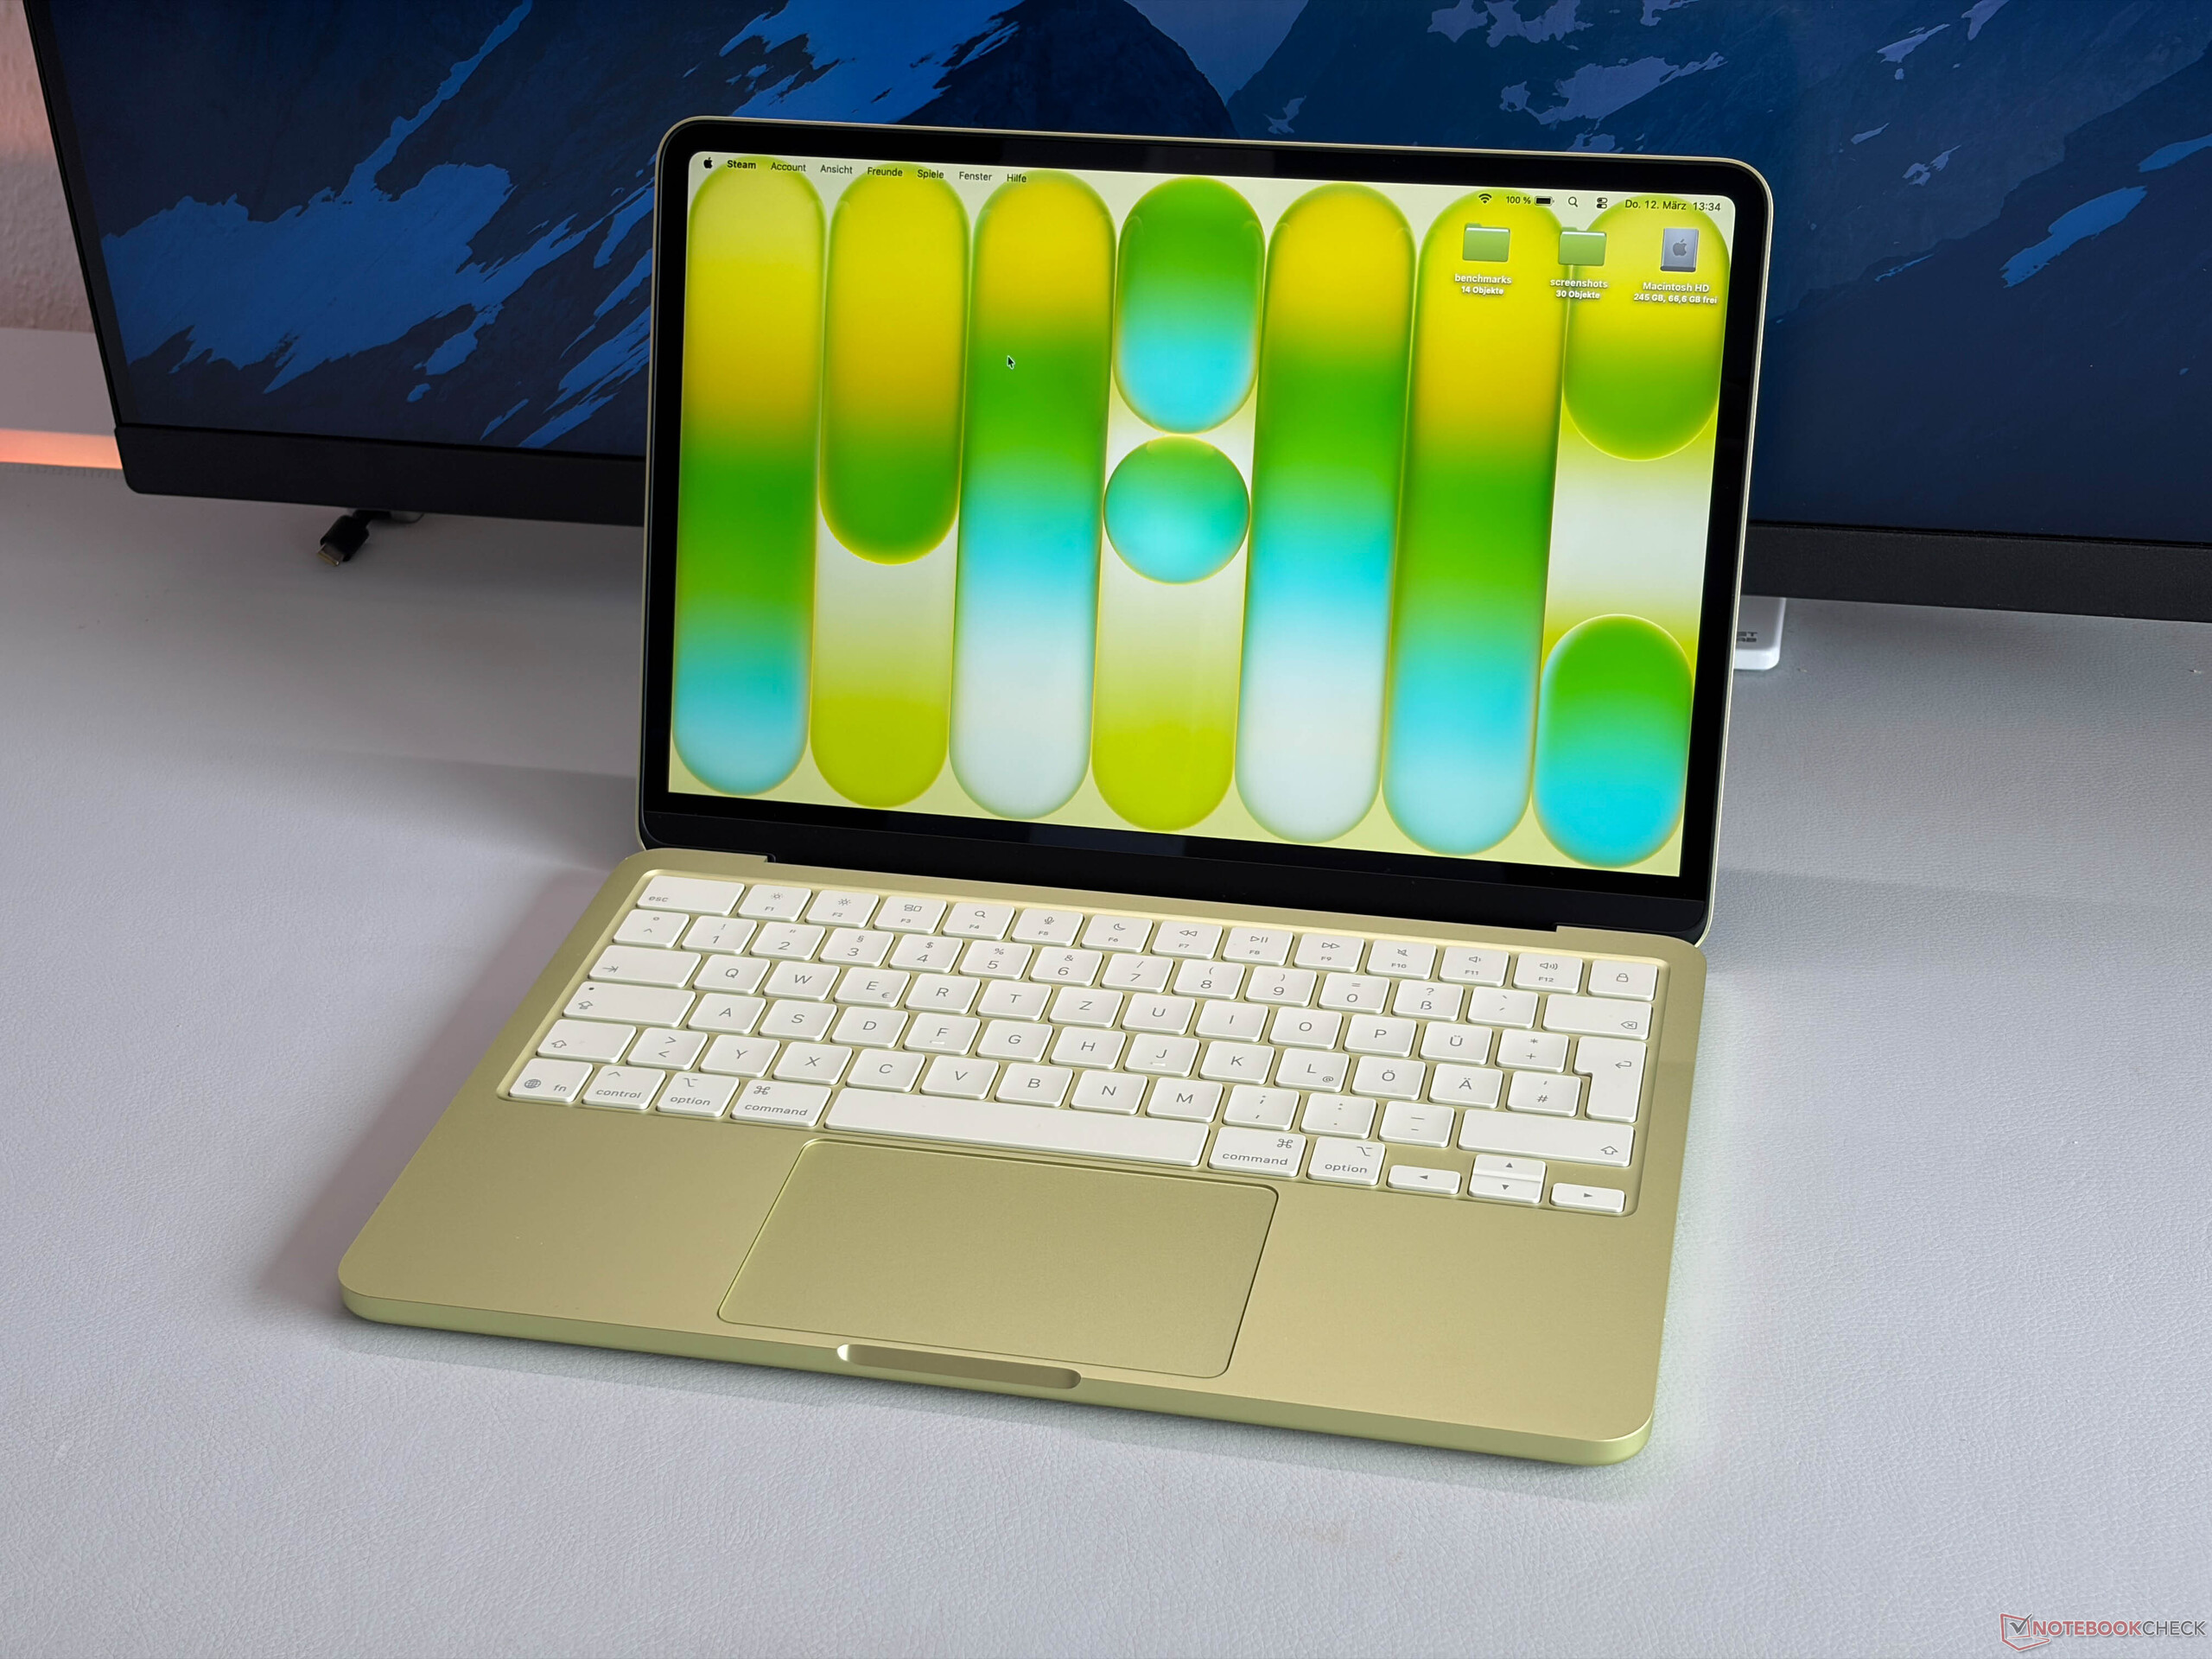
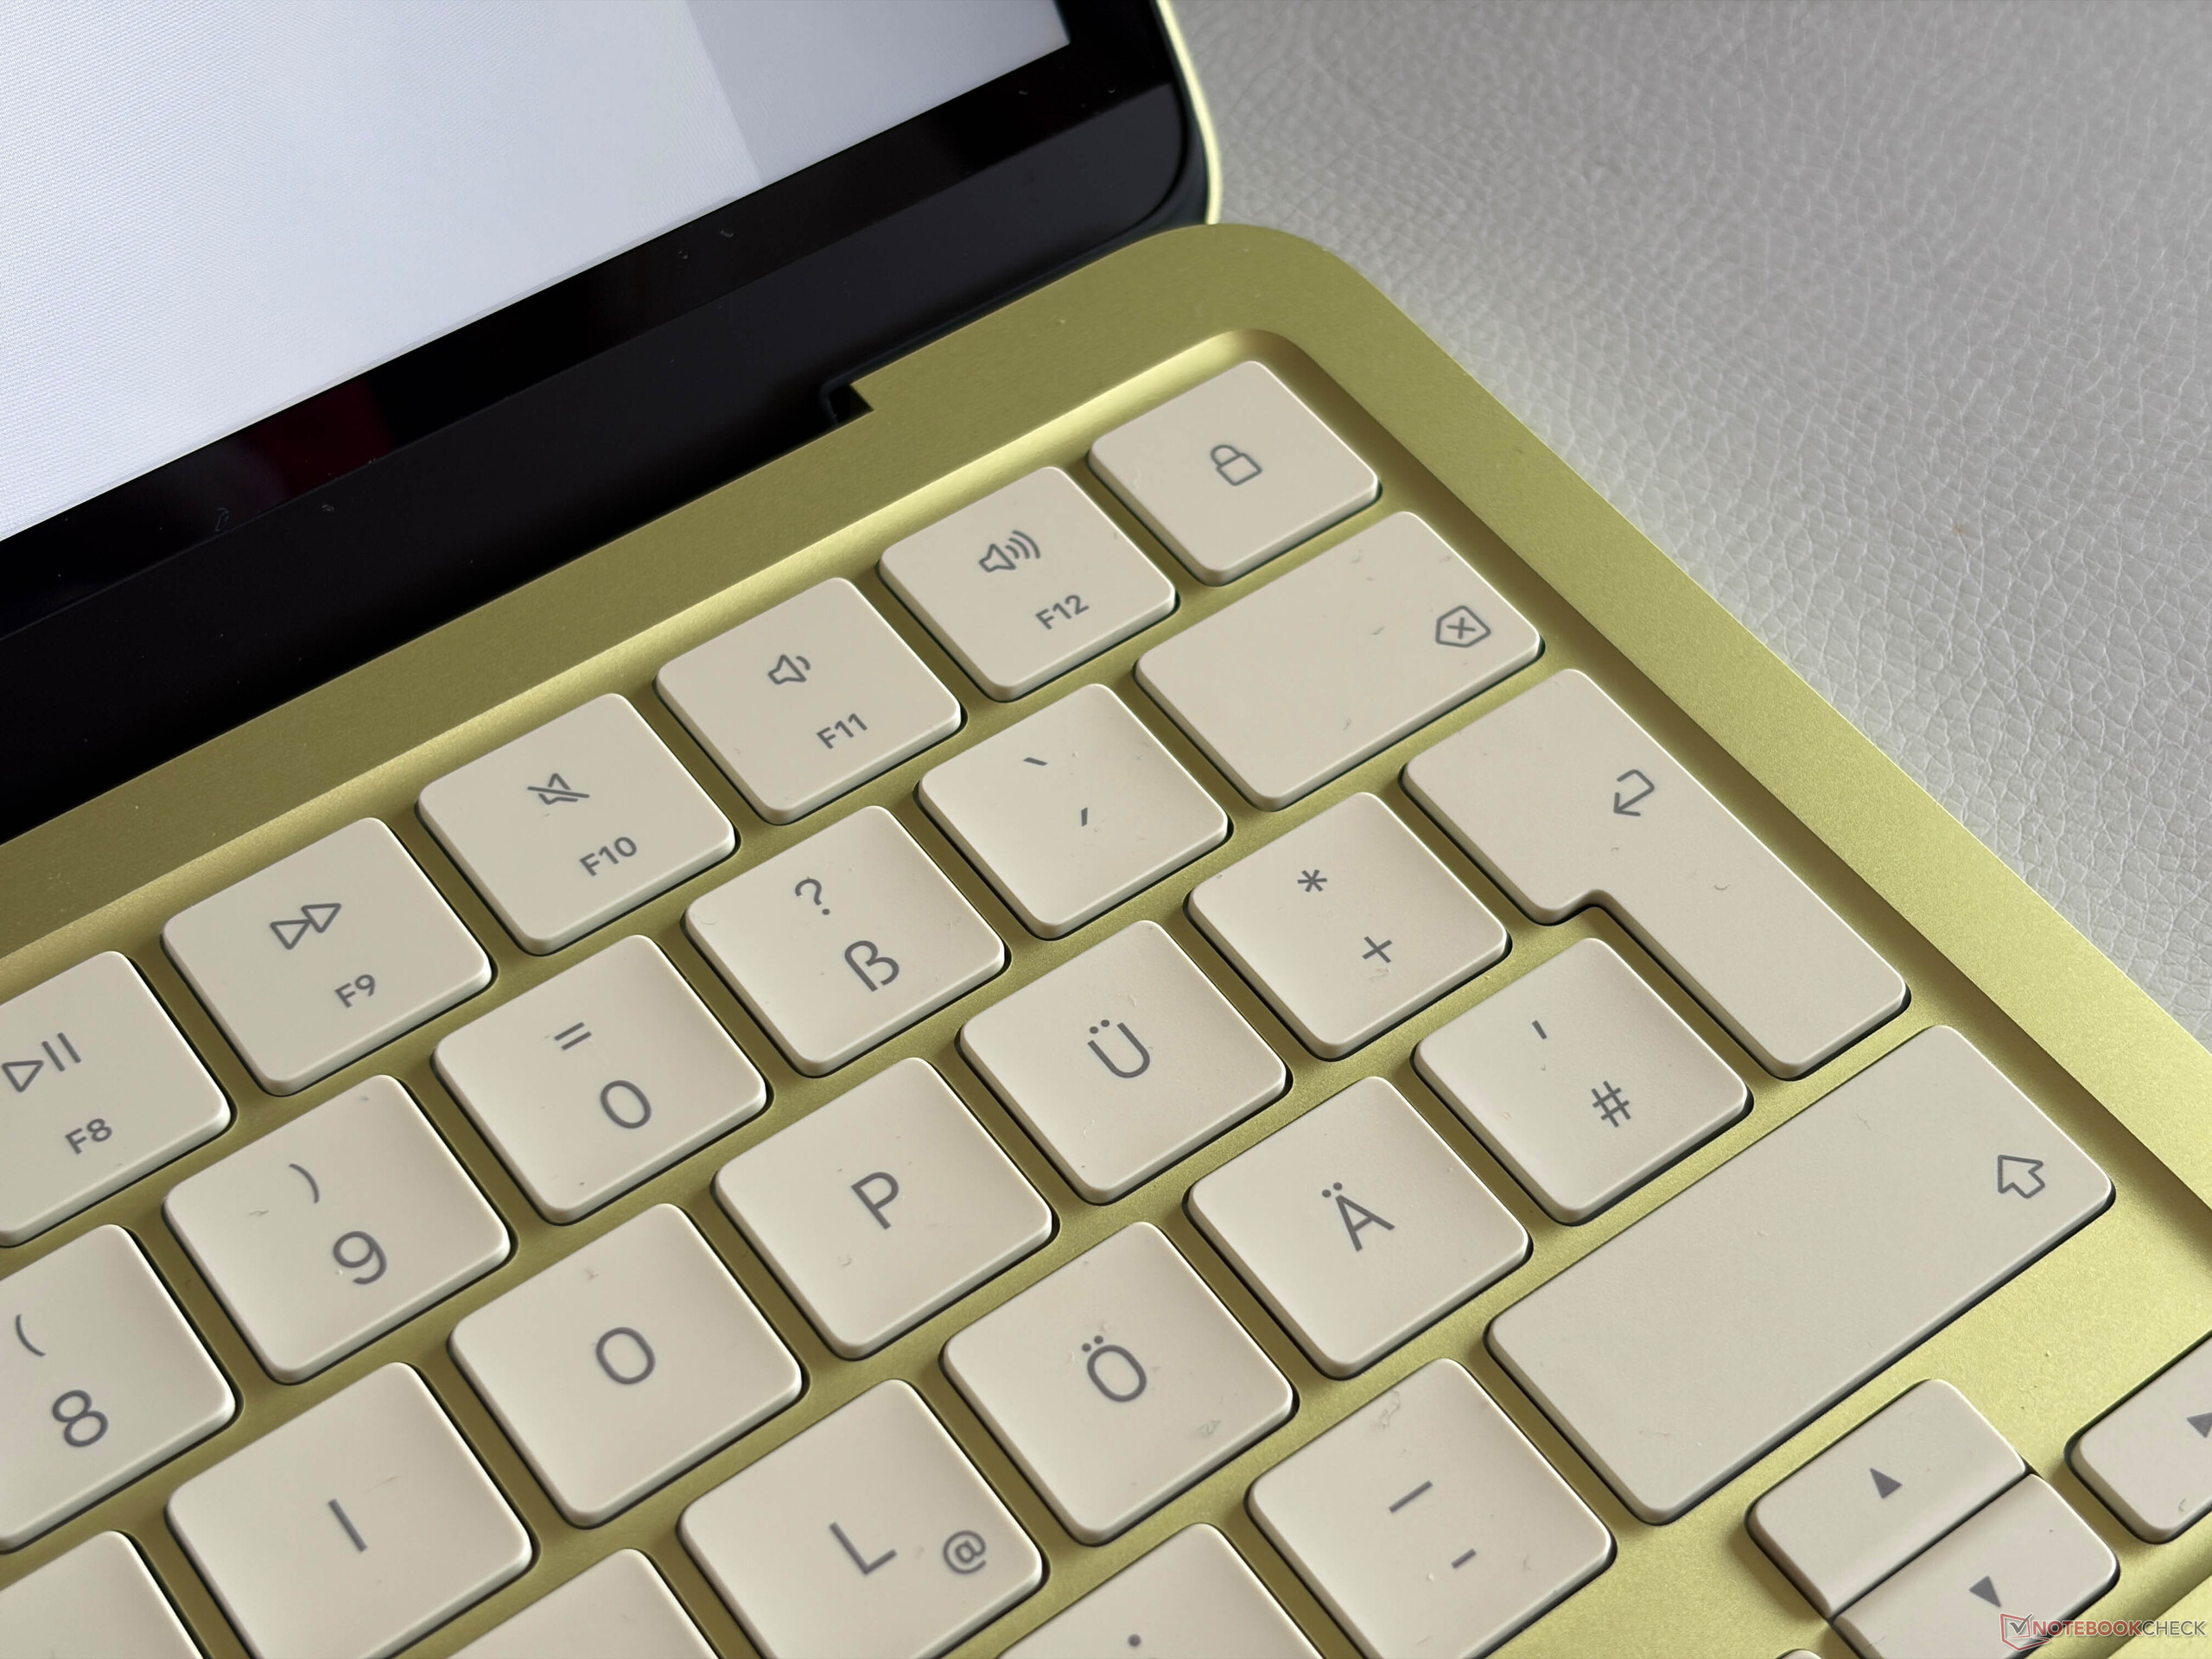
对于在过去几年中使用过 MacBook 的人来说,键盘提供了熟悉的键入体验。键程较浅,但反馈精确,整体感觉舒适。我们的基本机型没有 Touch-ID 指纹扫描仪,只有一个带锁定功能的普通电源按钮。键盘最大的问题是缺乏背景照明。

Apple MacBook Air 弃用了触觉触控板,改用机械式触控板。与 Windows 笔记本电脑上的点击式触控板(只能在下半部分点击)不同,Apple 的触控板可以在任何地方点击,因为机械触控板使用的是中间的按钮。尽管对于一款 11.5 x 7.2 厘米的现代笔记本电脑来说,它的尺寸非常小,但我们在使用过程中没有遇到任何问题。
显示屏 - 500 尼特的 IPS

Apple MacBook Air 采用 13 英寸 IPS 屏幕,分辨率为 2408 x 1506 像素(16:10),频率为 60 Hz,色彩清晰锐利。你会立即注意到的一点是没有了凹槽,但说实话,菜单栏现在吃掉了普通 16:10 显示屏的垂直空间,而 MacBook Air 却不是这样(菜单栏位于凹槽旁边和普通 16:10 屏幕之上)。总的来说,这个价位的屏幕画质确实不错。亮度可以自动调节,但没有 True Tone 功能。与其他亮面 MacBook 屏幕相比,MacBook Neo 的面板明显更容易反光,这在室外很快就会成为一个问题。
亮度非常好,超过 500 尼特,但黑色值相当高,只有 0.48,因此最大对比度只有约 1150:1,黑色内容看起来更像是深灰色。在高亮度值下,边角也会有一些背光渗出。
| |||||||||||||||||||||||||
Brightness Distribution: 91 %
Center on Battery: 548 cd/m²
Contrast: 1142:1 (Black: 0.48 cd/m²)
ΔE ColorChecker Calman: 1.4 | ∀{0.5-29.43 Ø4.71}
calibrated: 0.4
ΔE Greyscale Calman: 2.1 | ∀{0.09-98 Ø4.96}
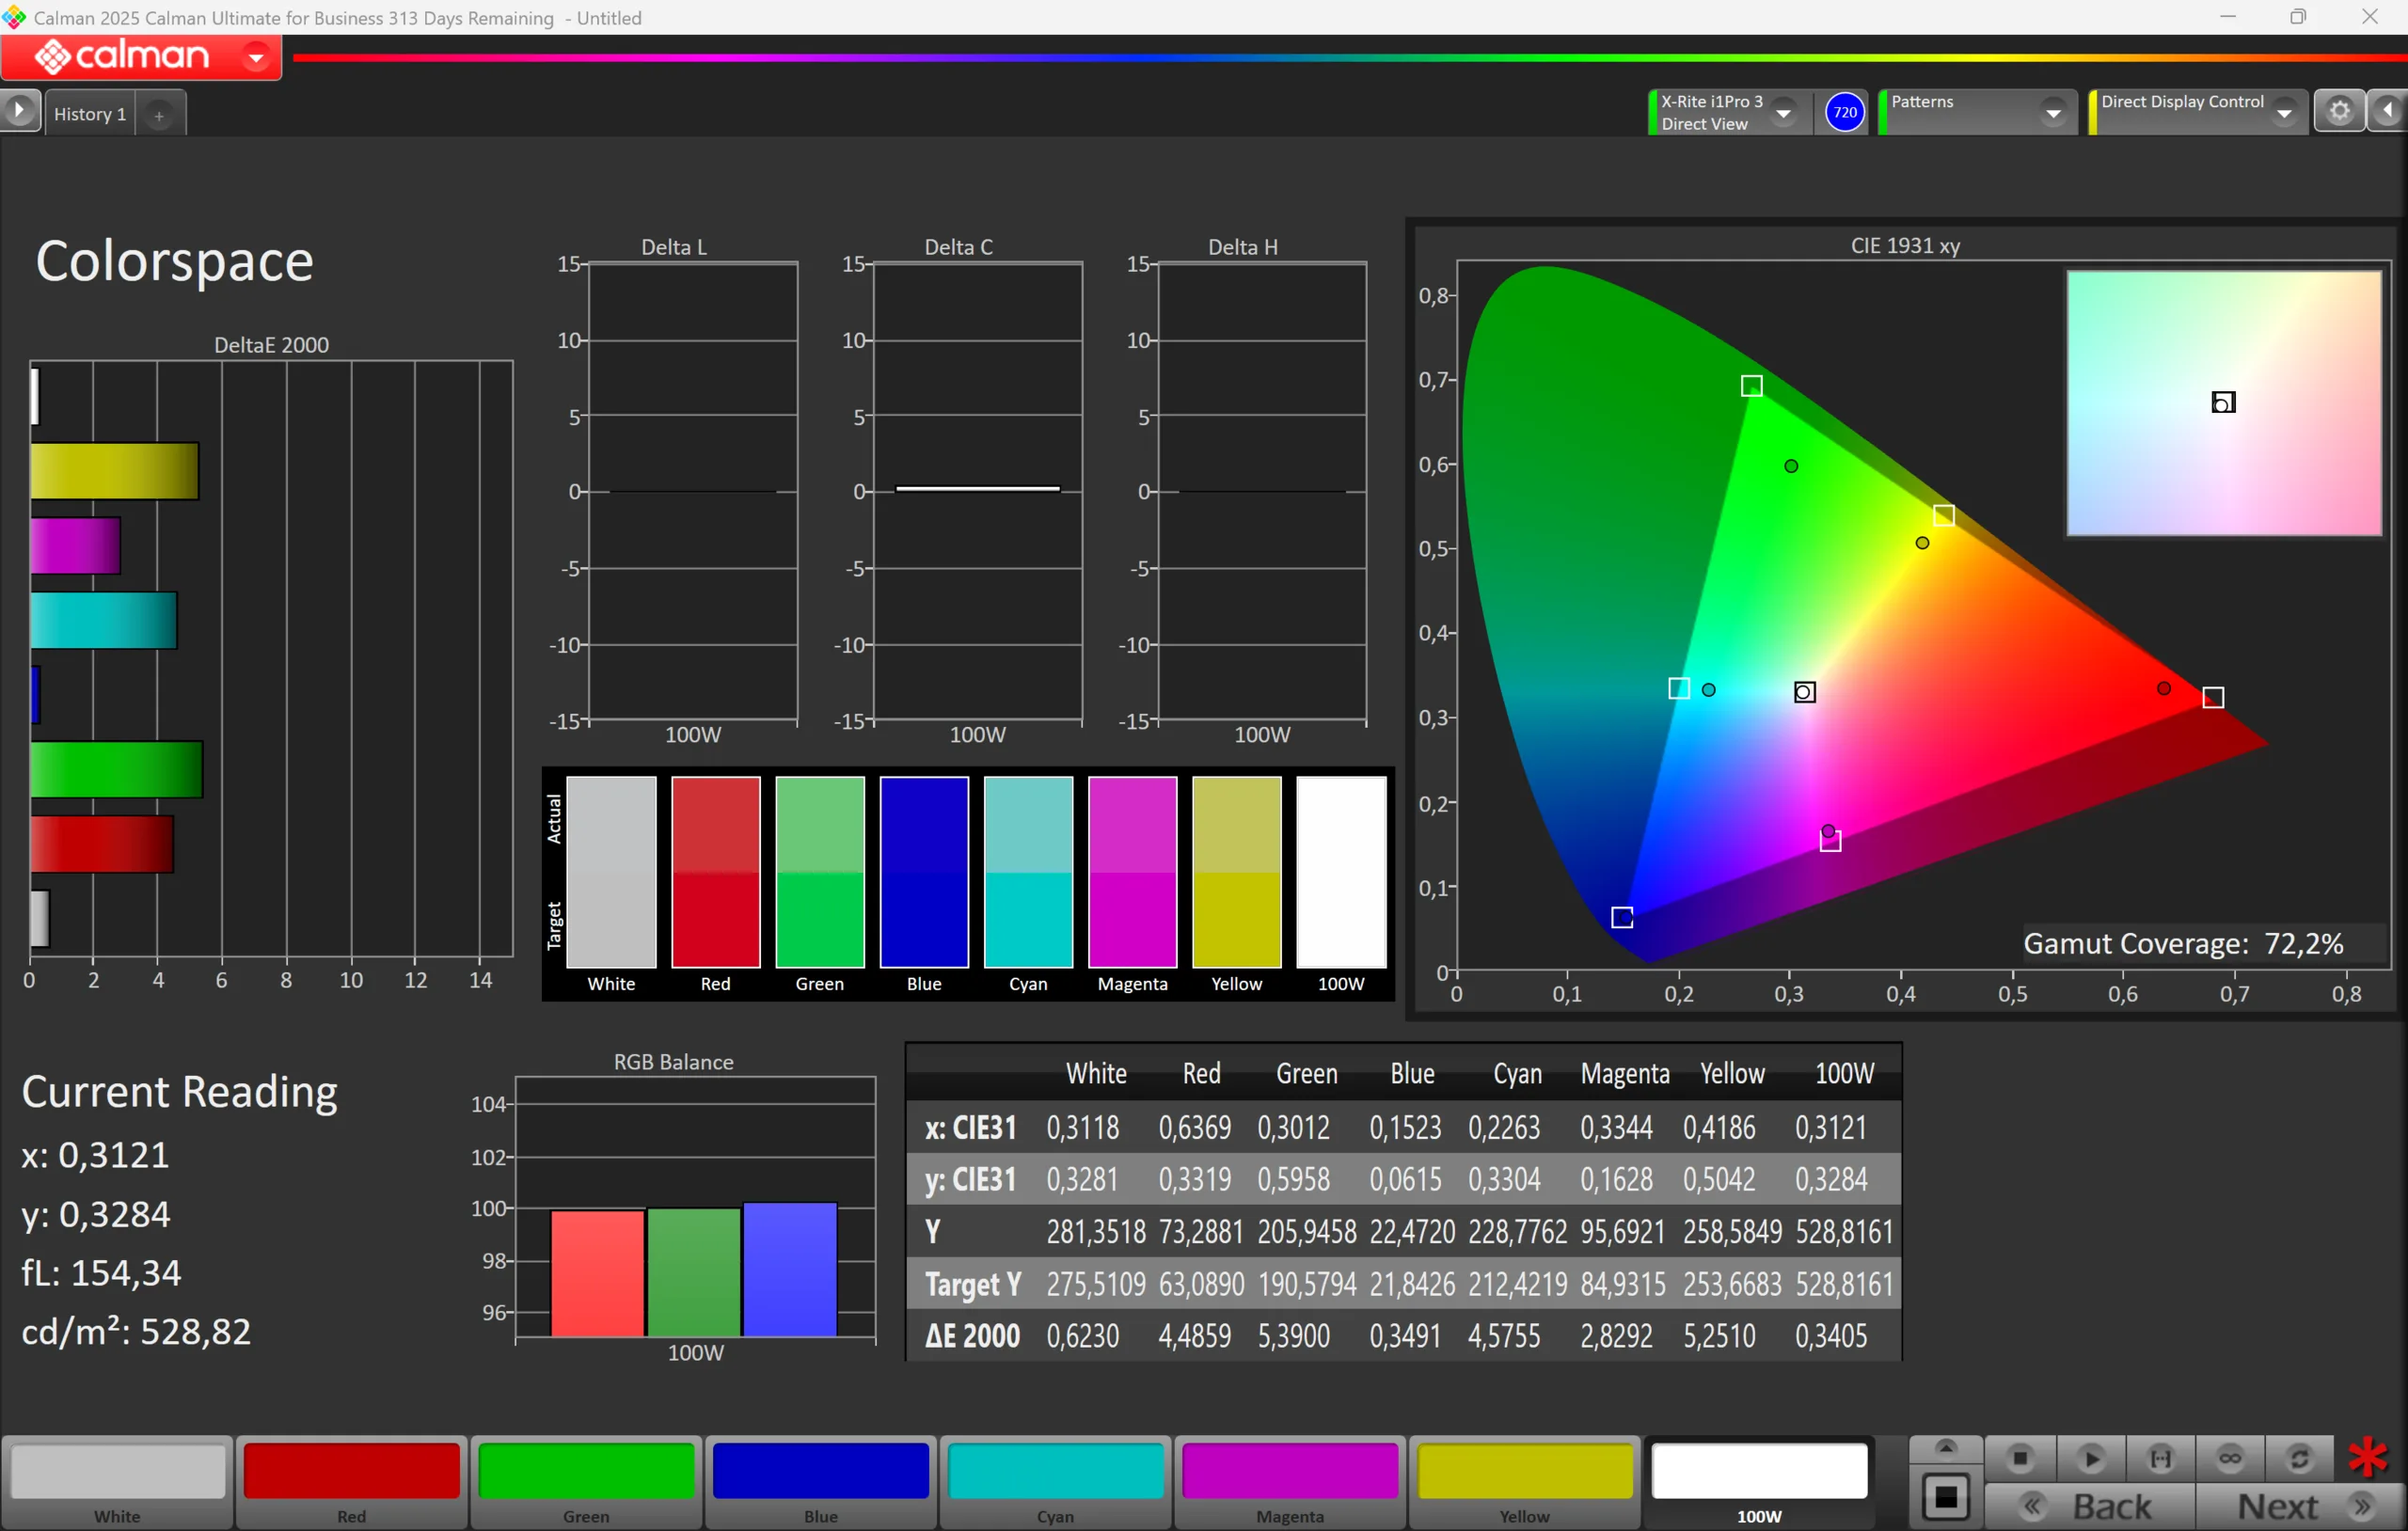
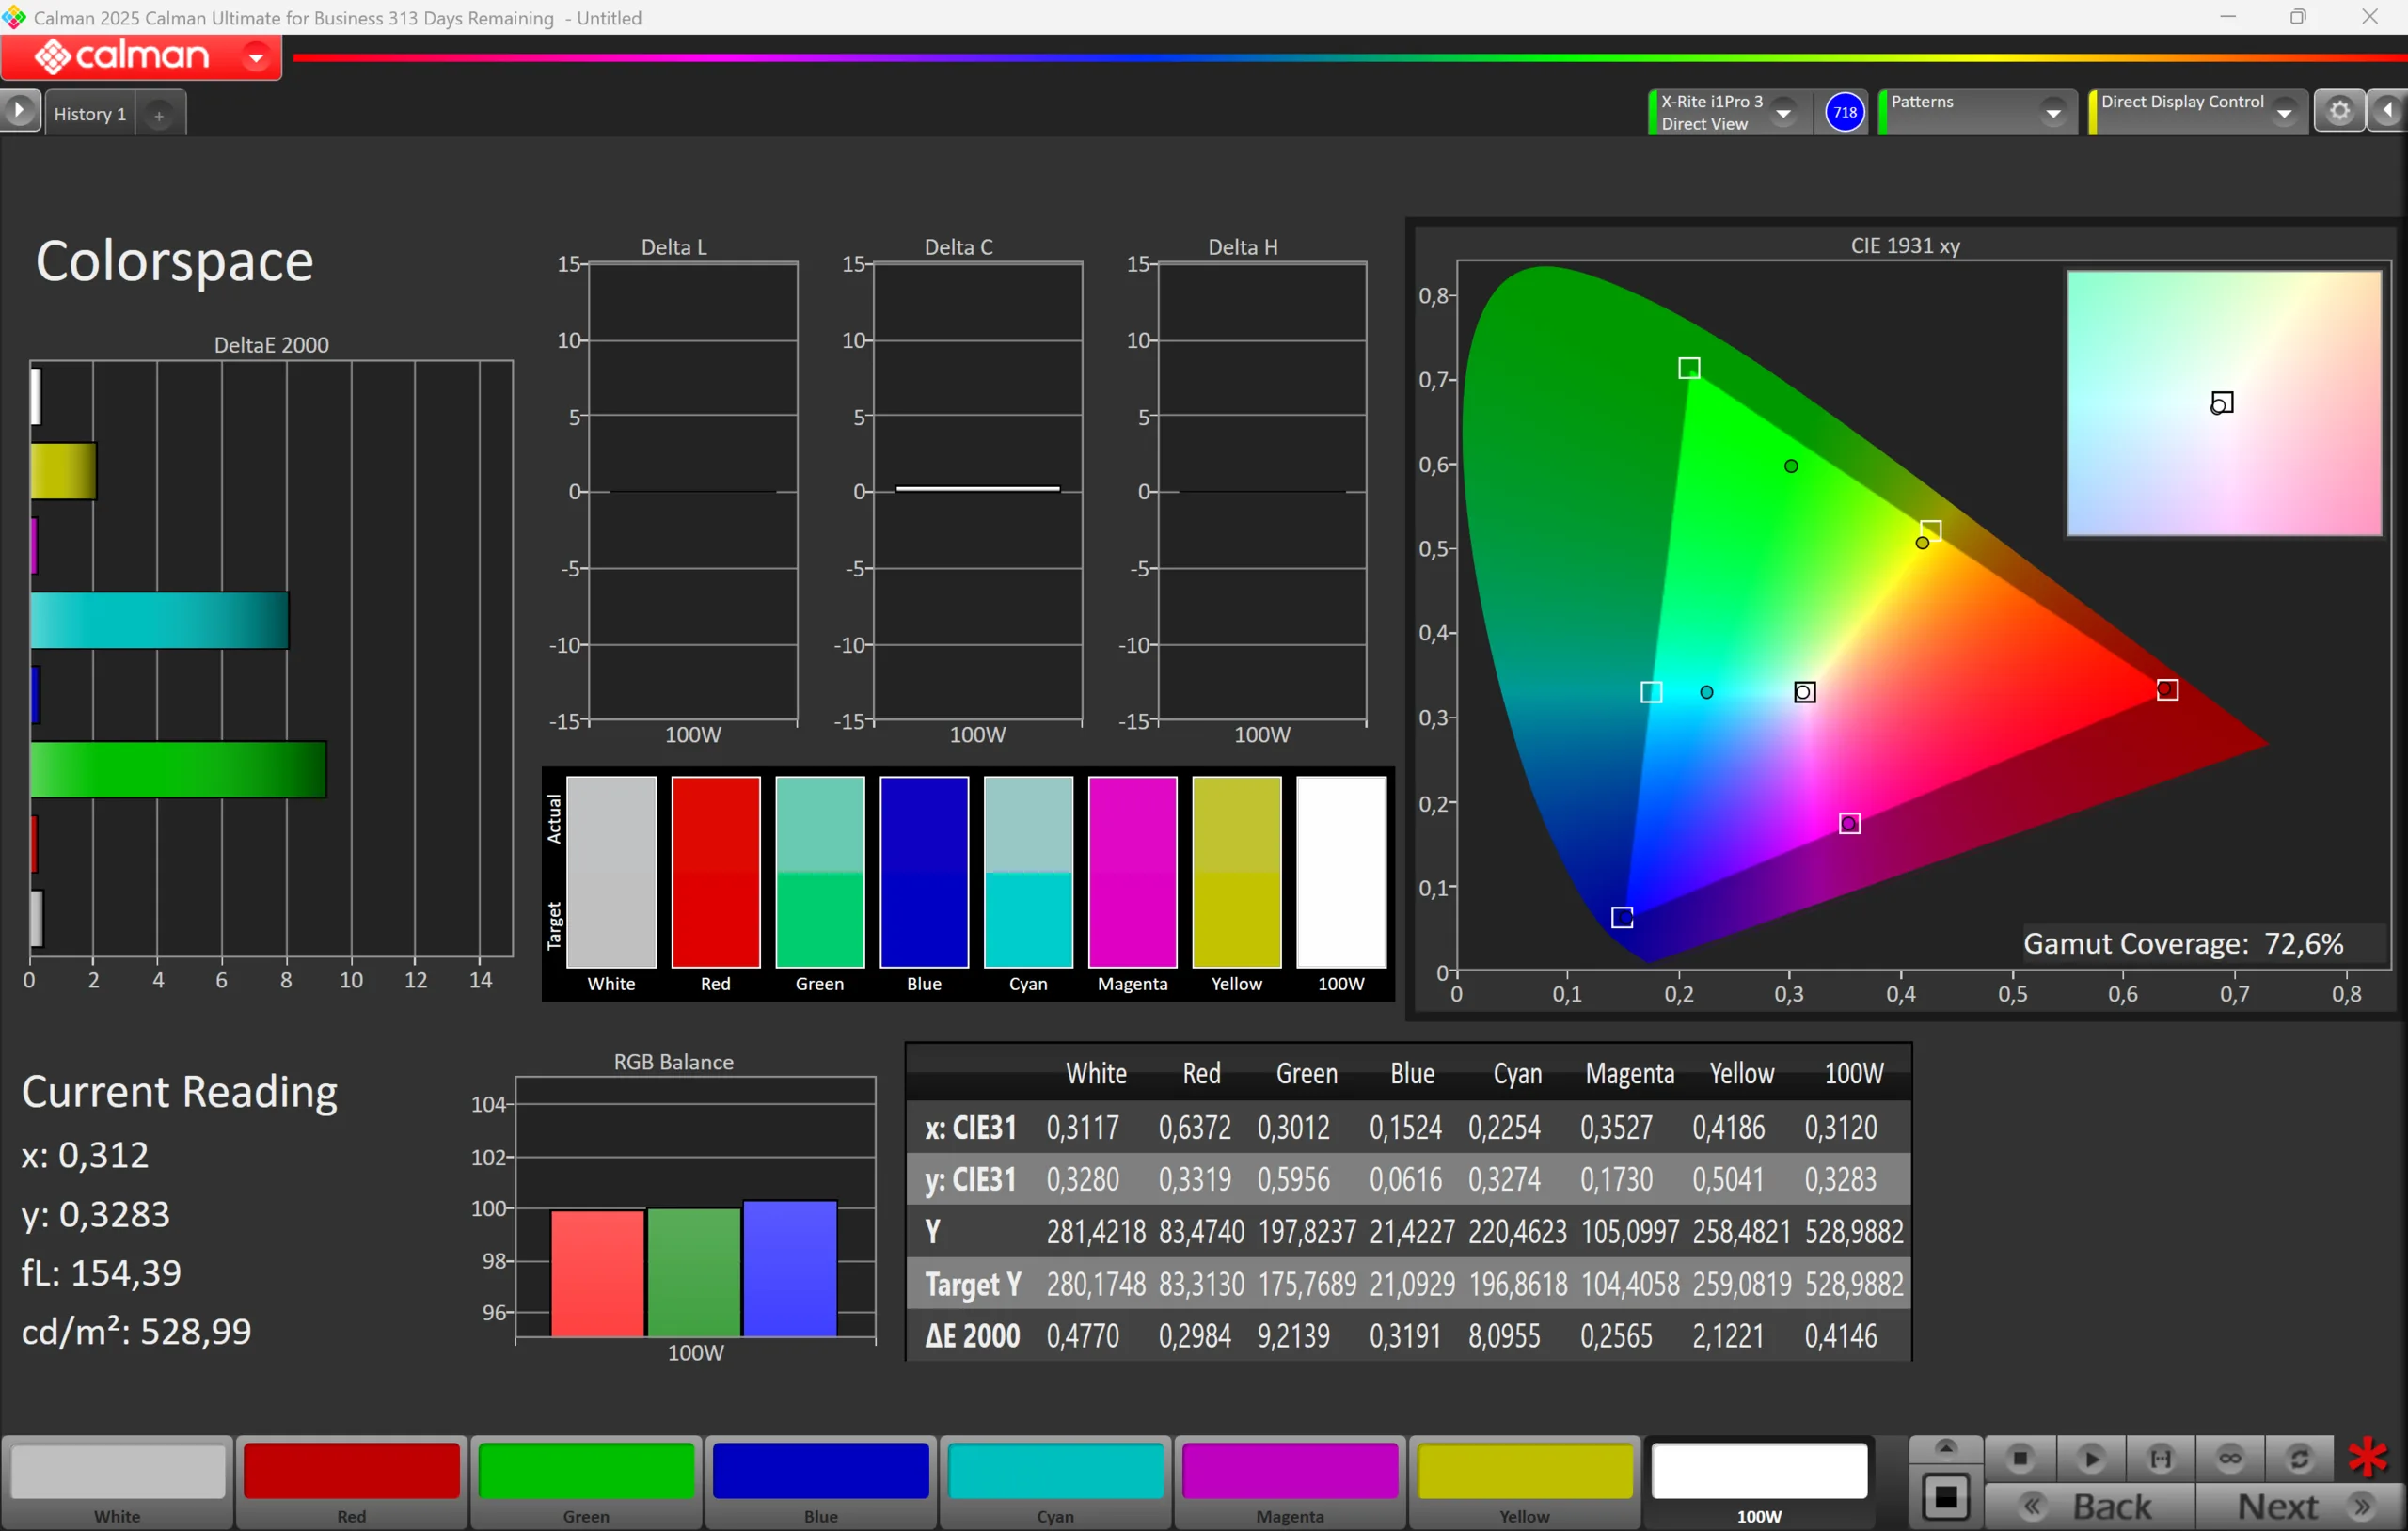
72.6% AdobeRGB 1998 (Argyll 3D)
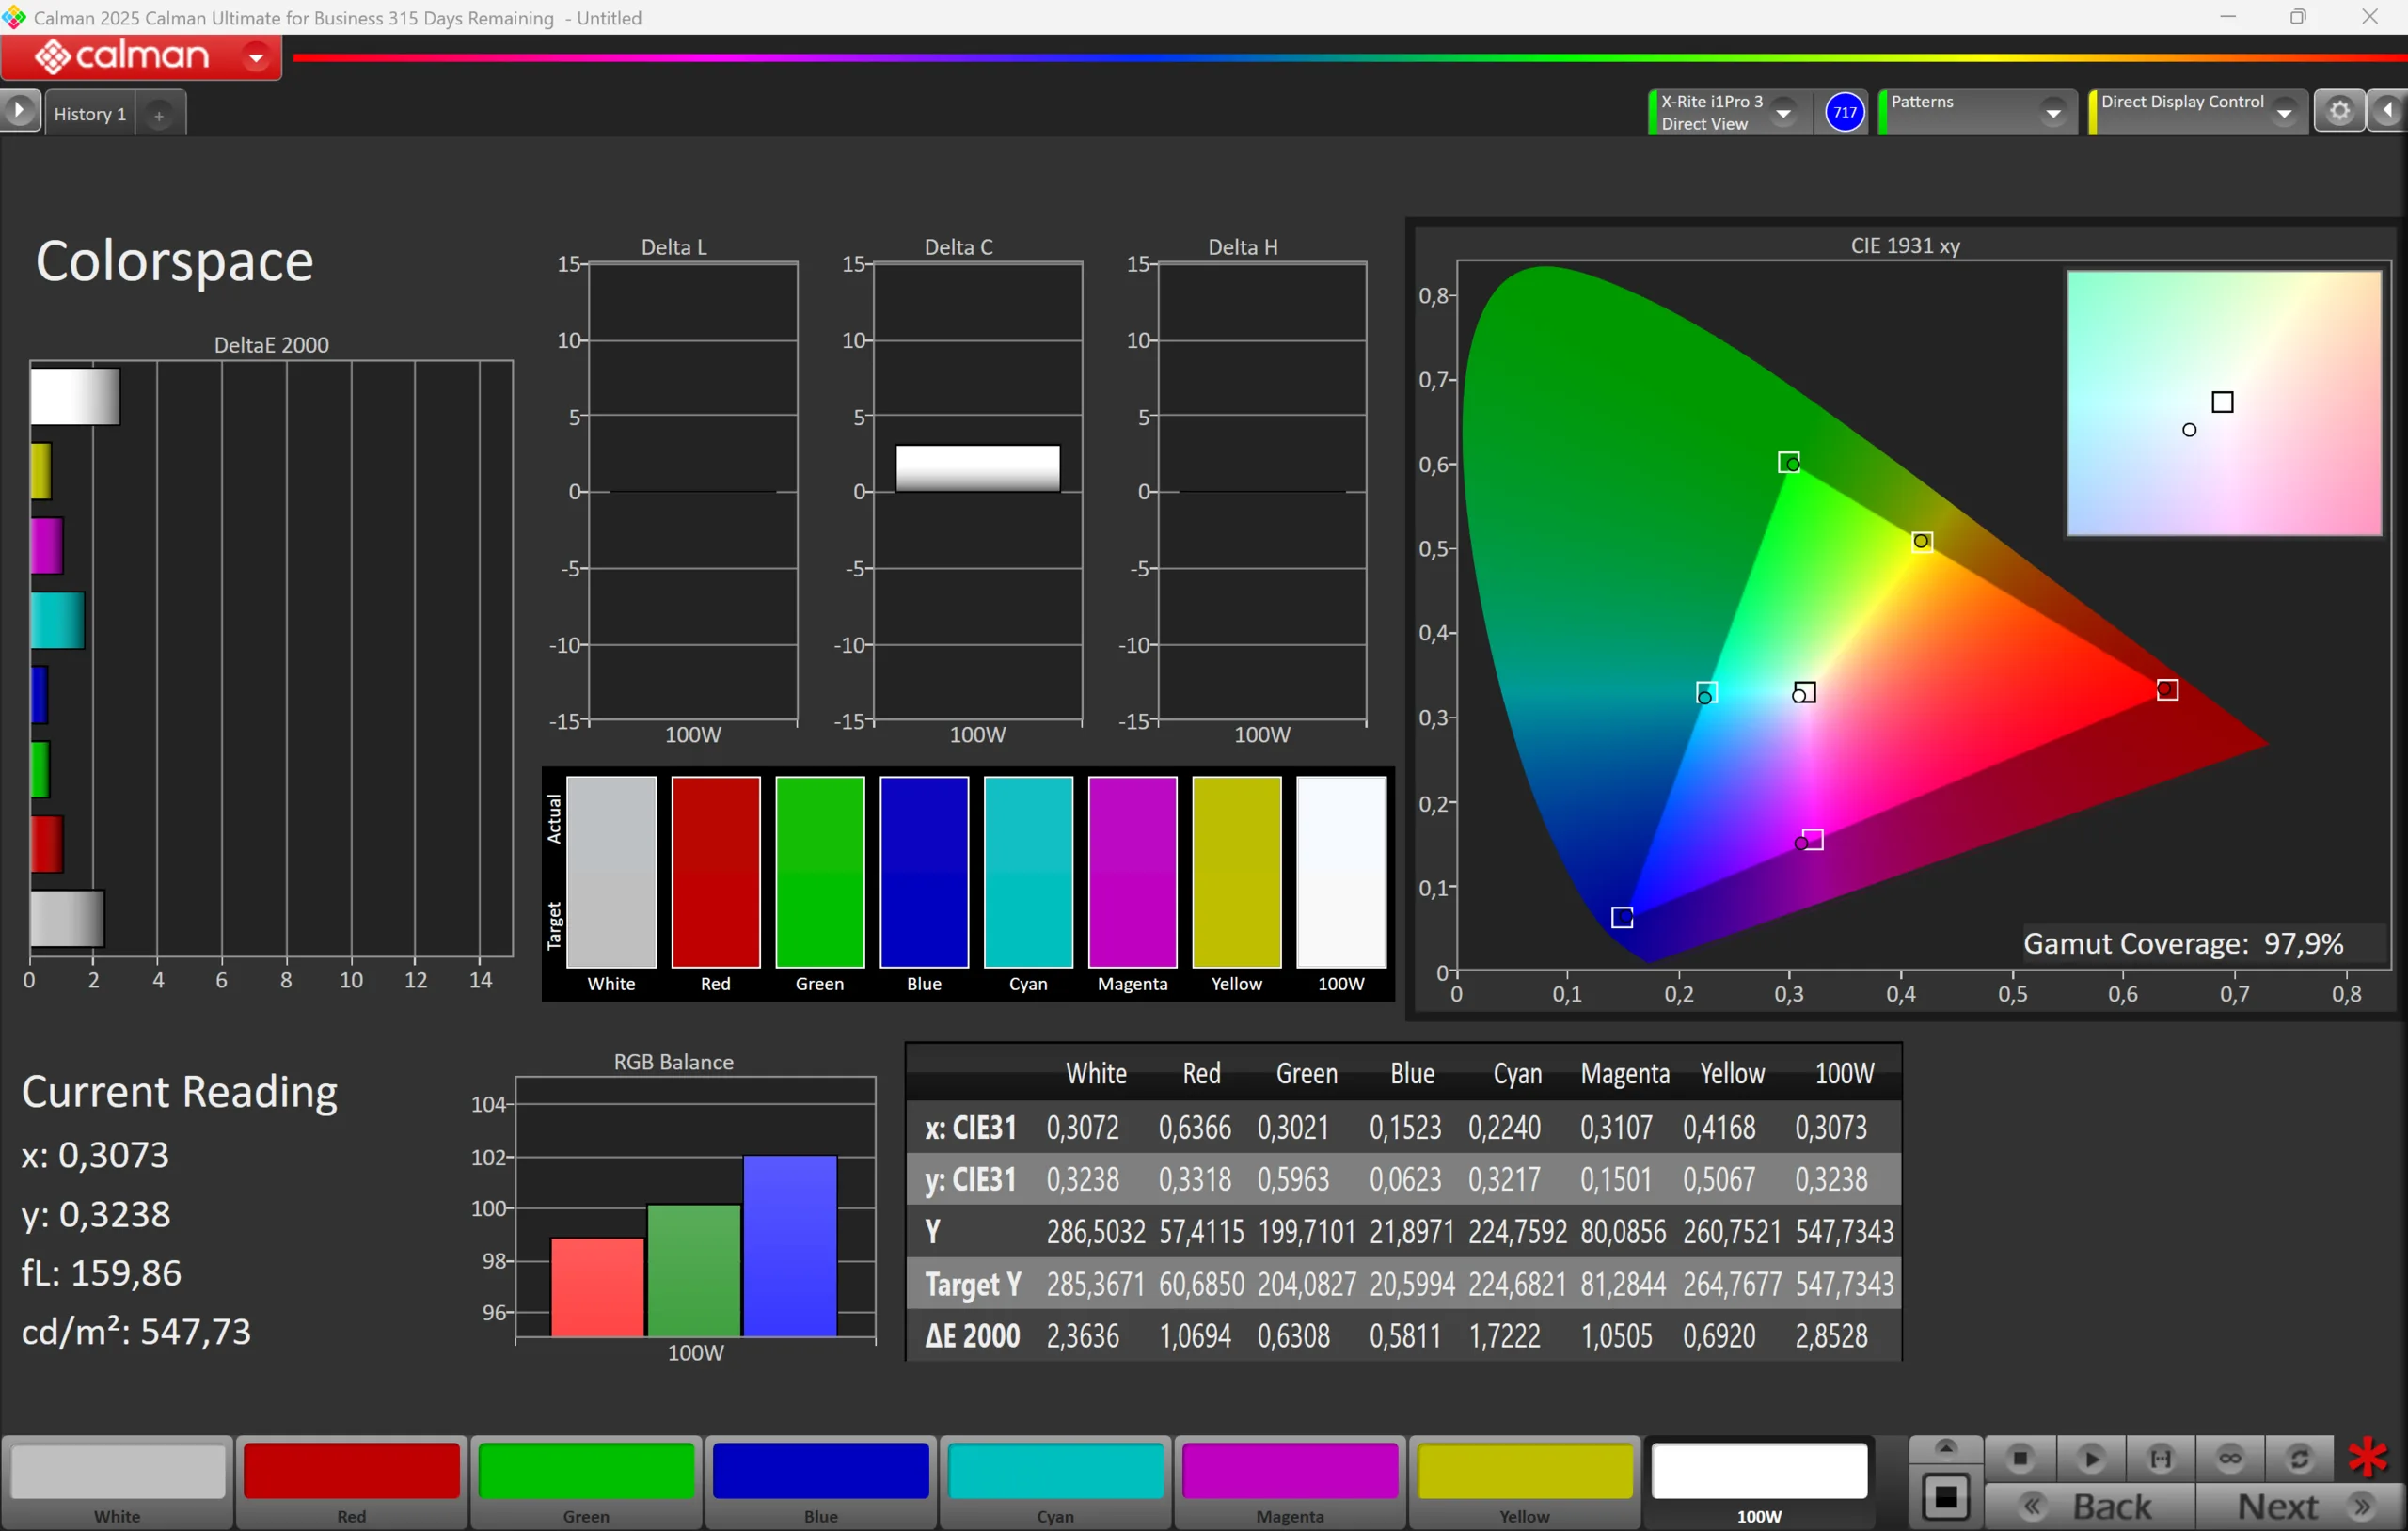
97.9% sRGB (Argyll 3D)
72.2% Display P3 (Argyll 3D)
Gamma: 2.24
CCT: 6870 K
| Apple MacBook Neo 256 GB IPS, 2408x1506, 13", 60 Hz | Microsoft Surface Laptop 13 LP130WU112413, IPS, 1920x1280, 13", 60 Hz | HP Omnibook 5 14 Samsung SDC4213, OLED, 1920x1200, 14", 60 Hz | Lenovo IdeaPad Slim 3 14 AHP G10 LEN140WUXGA, IPS, 1920x1200, 14", 60 Hz | Apple MacBook Air 13 M4 Entry IPS, 2560x1664, 13.6", 60 Hz | |
|---|---|---|---|---|---|
| Display | 0% | 32% | -43% | 20% | |
| Display P3 Coverage (%) | 72.2 | 72.4 0% | 95 32% | 39.1 -46% | 98.4 36% |
| sRGB Coverage (%) | 97.9 | 97.6 0% | 58.4 -40% | 99.9 2% | |
| AdobeRGB 1998 Coverage (%) | 72.6 | 72.6 0% | 40.4 -44% | 87.9 21% | |
| Response Times | -104% | 90% | -49% | -76% | |
| Response Time Grey 50% / Grey 80% * (ms) | 20.8 ? | 48.7 ? -134% | 1.67 ? 92% | 31.4 ? -51% | 34.5 ? -66% |
| Response Time Black / White * (ms) | 14.6 ? | 25.3 ? -73% | 1.84 ? 87% | 21.3 ? -46% | 27.2 ? -86% |
| PWM Frequency (Hz) | 480 | ||||
| PWM Amplitude * (%) | 13.5 | ||||
| Screen | 19% | -53% | -227% | 4% | |
| Brightness middle (cd/m²) | 548 | 417 -24% | 288.7 -47% | 304 -45% | 525 -4% |
| Brightness (cd/m²) | 519 | 409 -21% | 289 -44% | 281 -46% | 506 -3% |
| Brightness Distribution (%) | 91 | 92 1% | 98 8% | 89 -2% | 92 1% |
| Black Level * (cd/m²) | 0.48 | 0.17 65% | 0.22 54% | 0.42 12% | |
| Contrast (:1) | 1142 | 2453 115% | 1382 21% | 1250 9% | |
| Colorchecker dE 2000 * | 1.4 | 1.3 7% | 3.43 -145% | 5.9 -321% | 1.4 -0% |
| Colorchecker dE 2000 max. * | 3.1 | 2.9 6% | 7.04 -127% | 19.2 -519% | 2.8 10% |
| Colorchecker dE 2000 calibrated * | 0.4 | 4.7 -1075% | |||
| Greyscale dE 2000 * | 2.1 | 2 5% | 1.3 38% | 4.5 -114% | 2 5% |
| Gamma | 2.24 98% | 2.18 101% | 2.2 100% | 2.21 100% | 2.2 100% |
| CCT | 6870 95% | 6890 94% | 6336 103% | 6098 107% | 6876 95% |
| Total Average (Program / Settings) | -28% /
-4% | 23% /
-12% | -106% /
-162% | -17% /
-5% |
* ... smaller is better
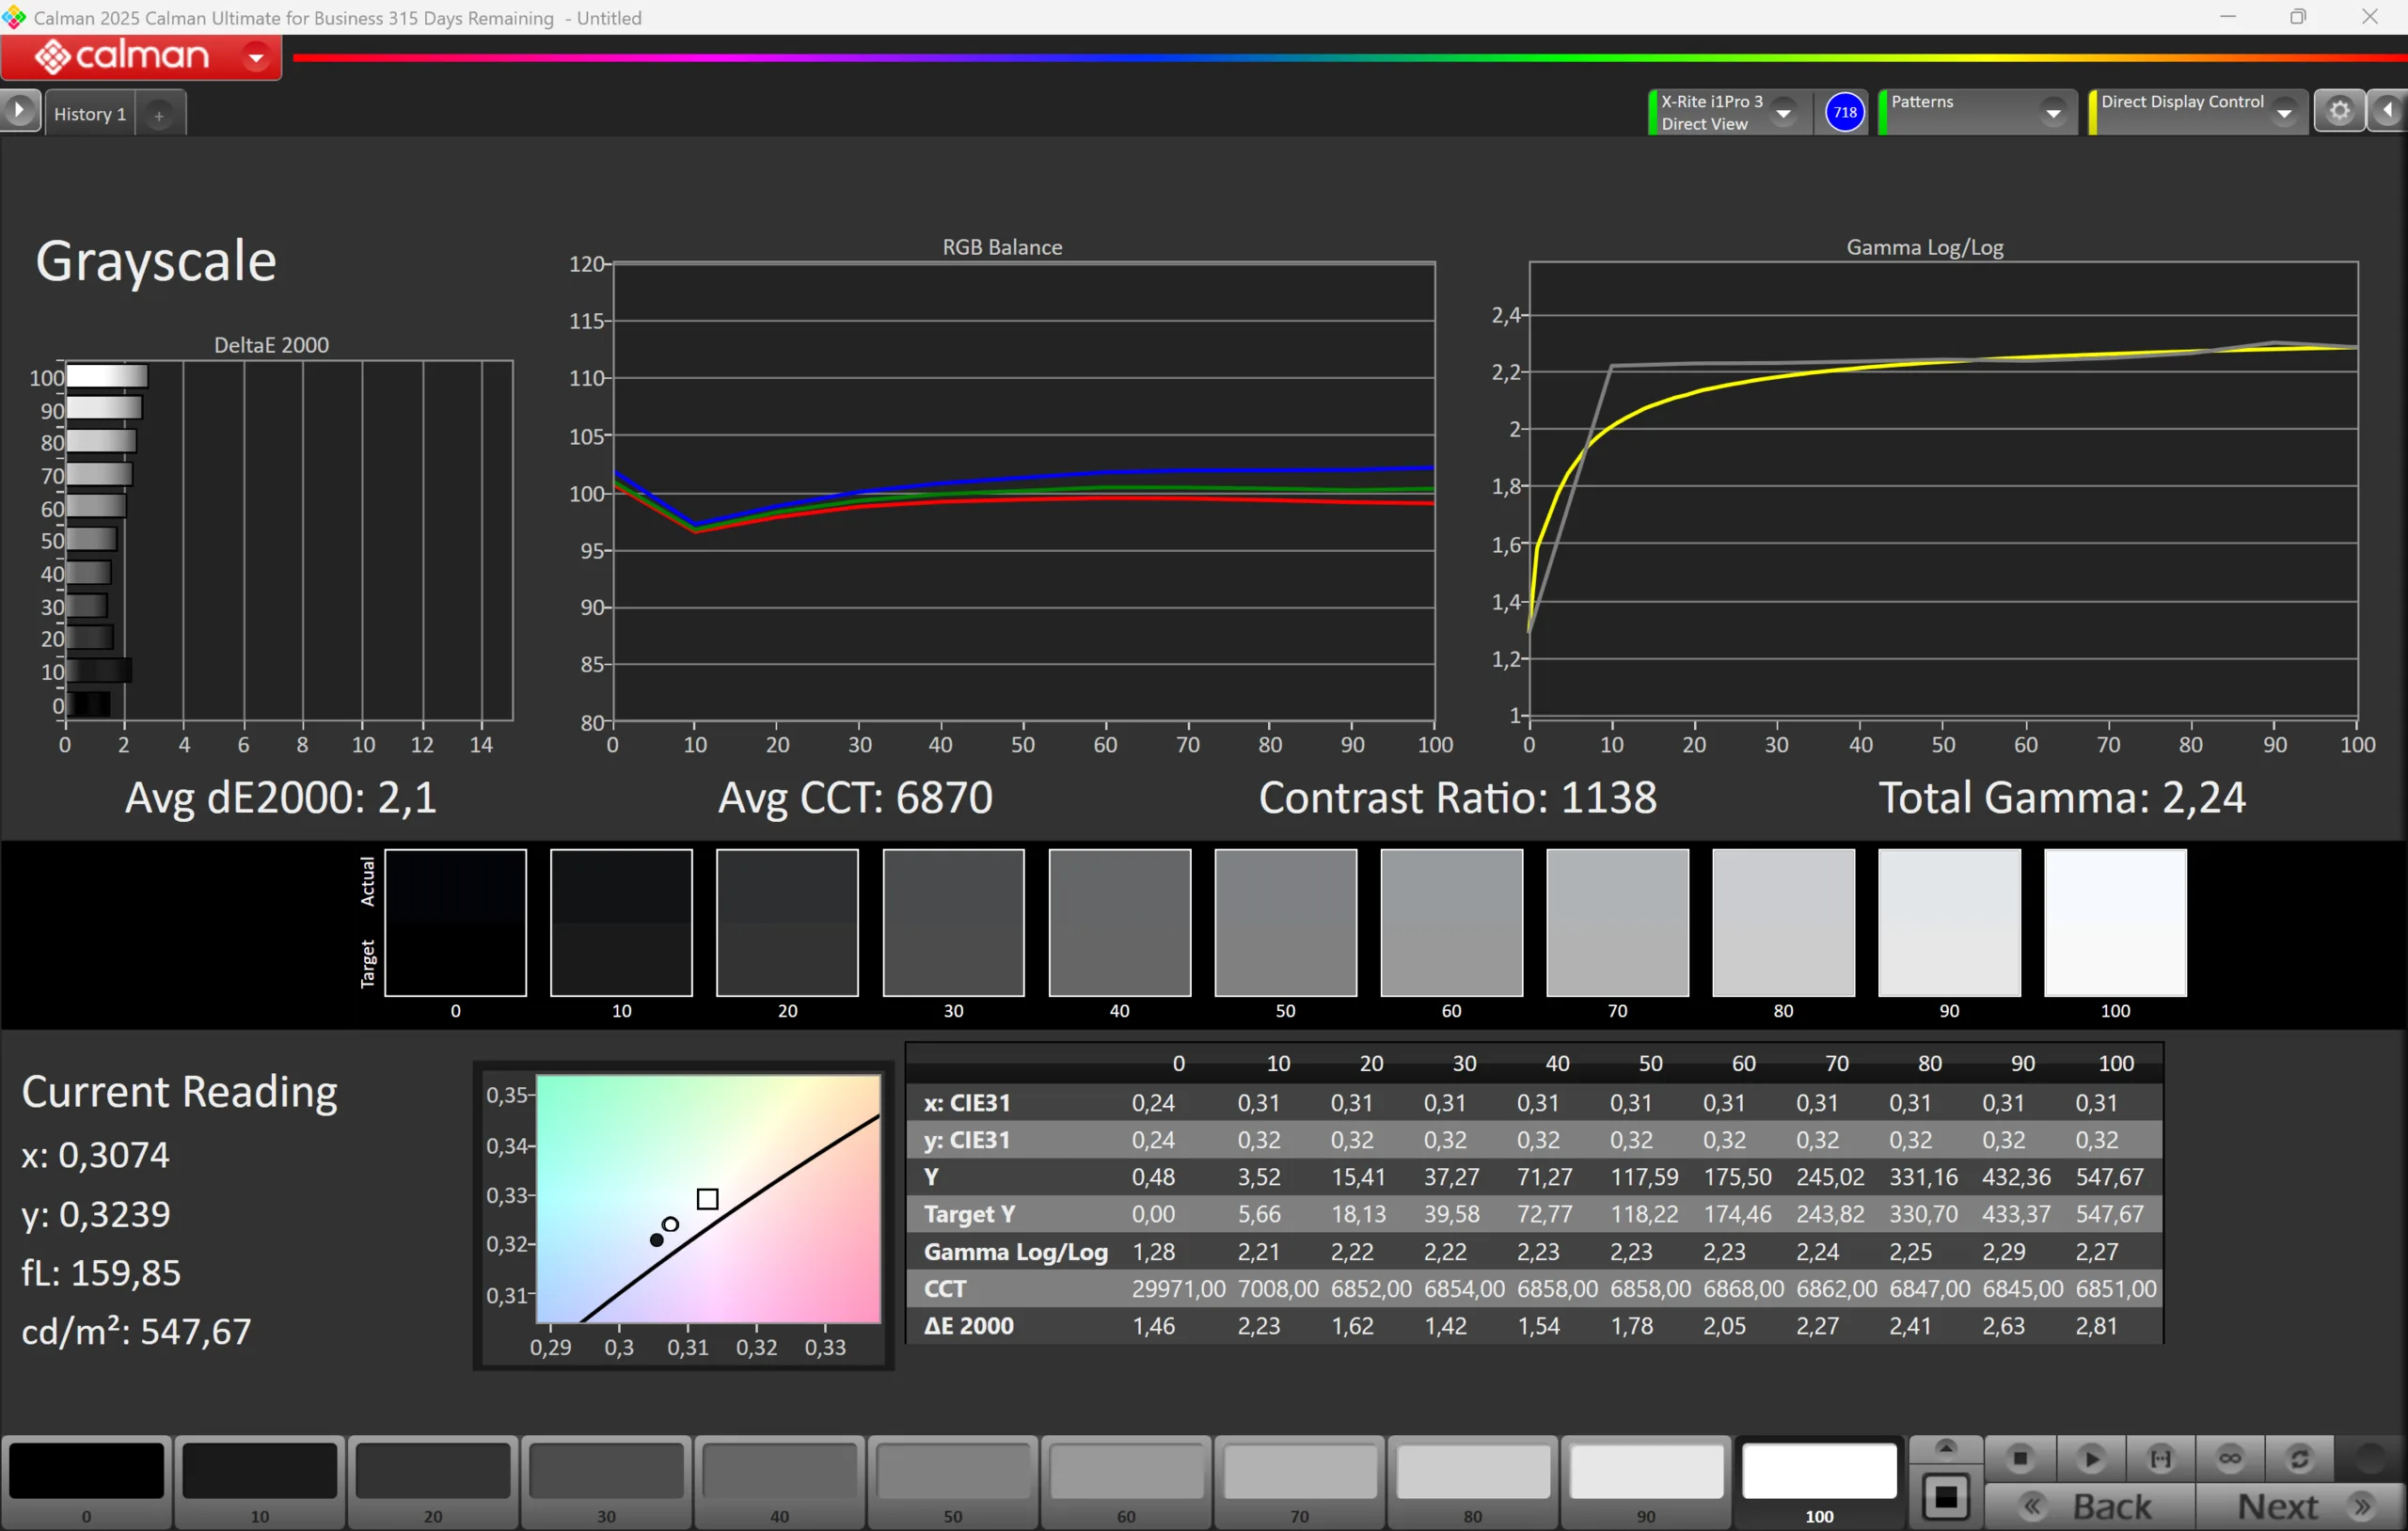
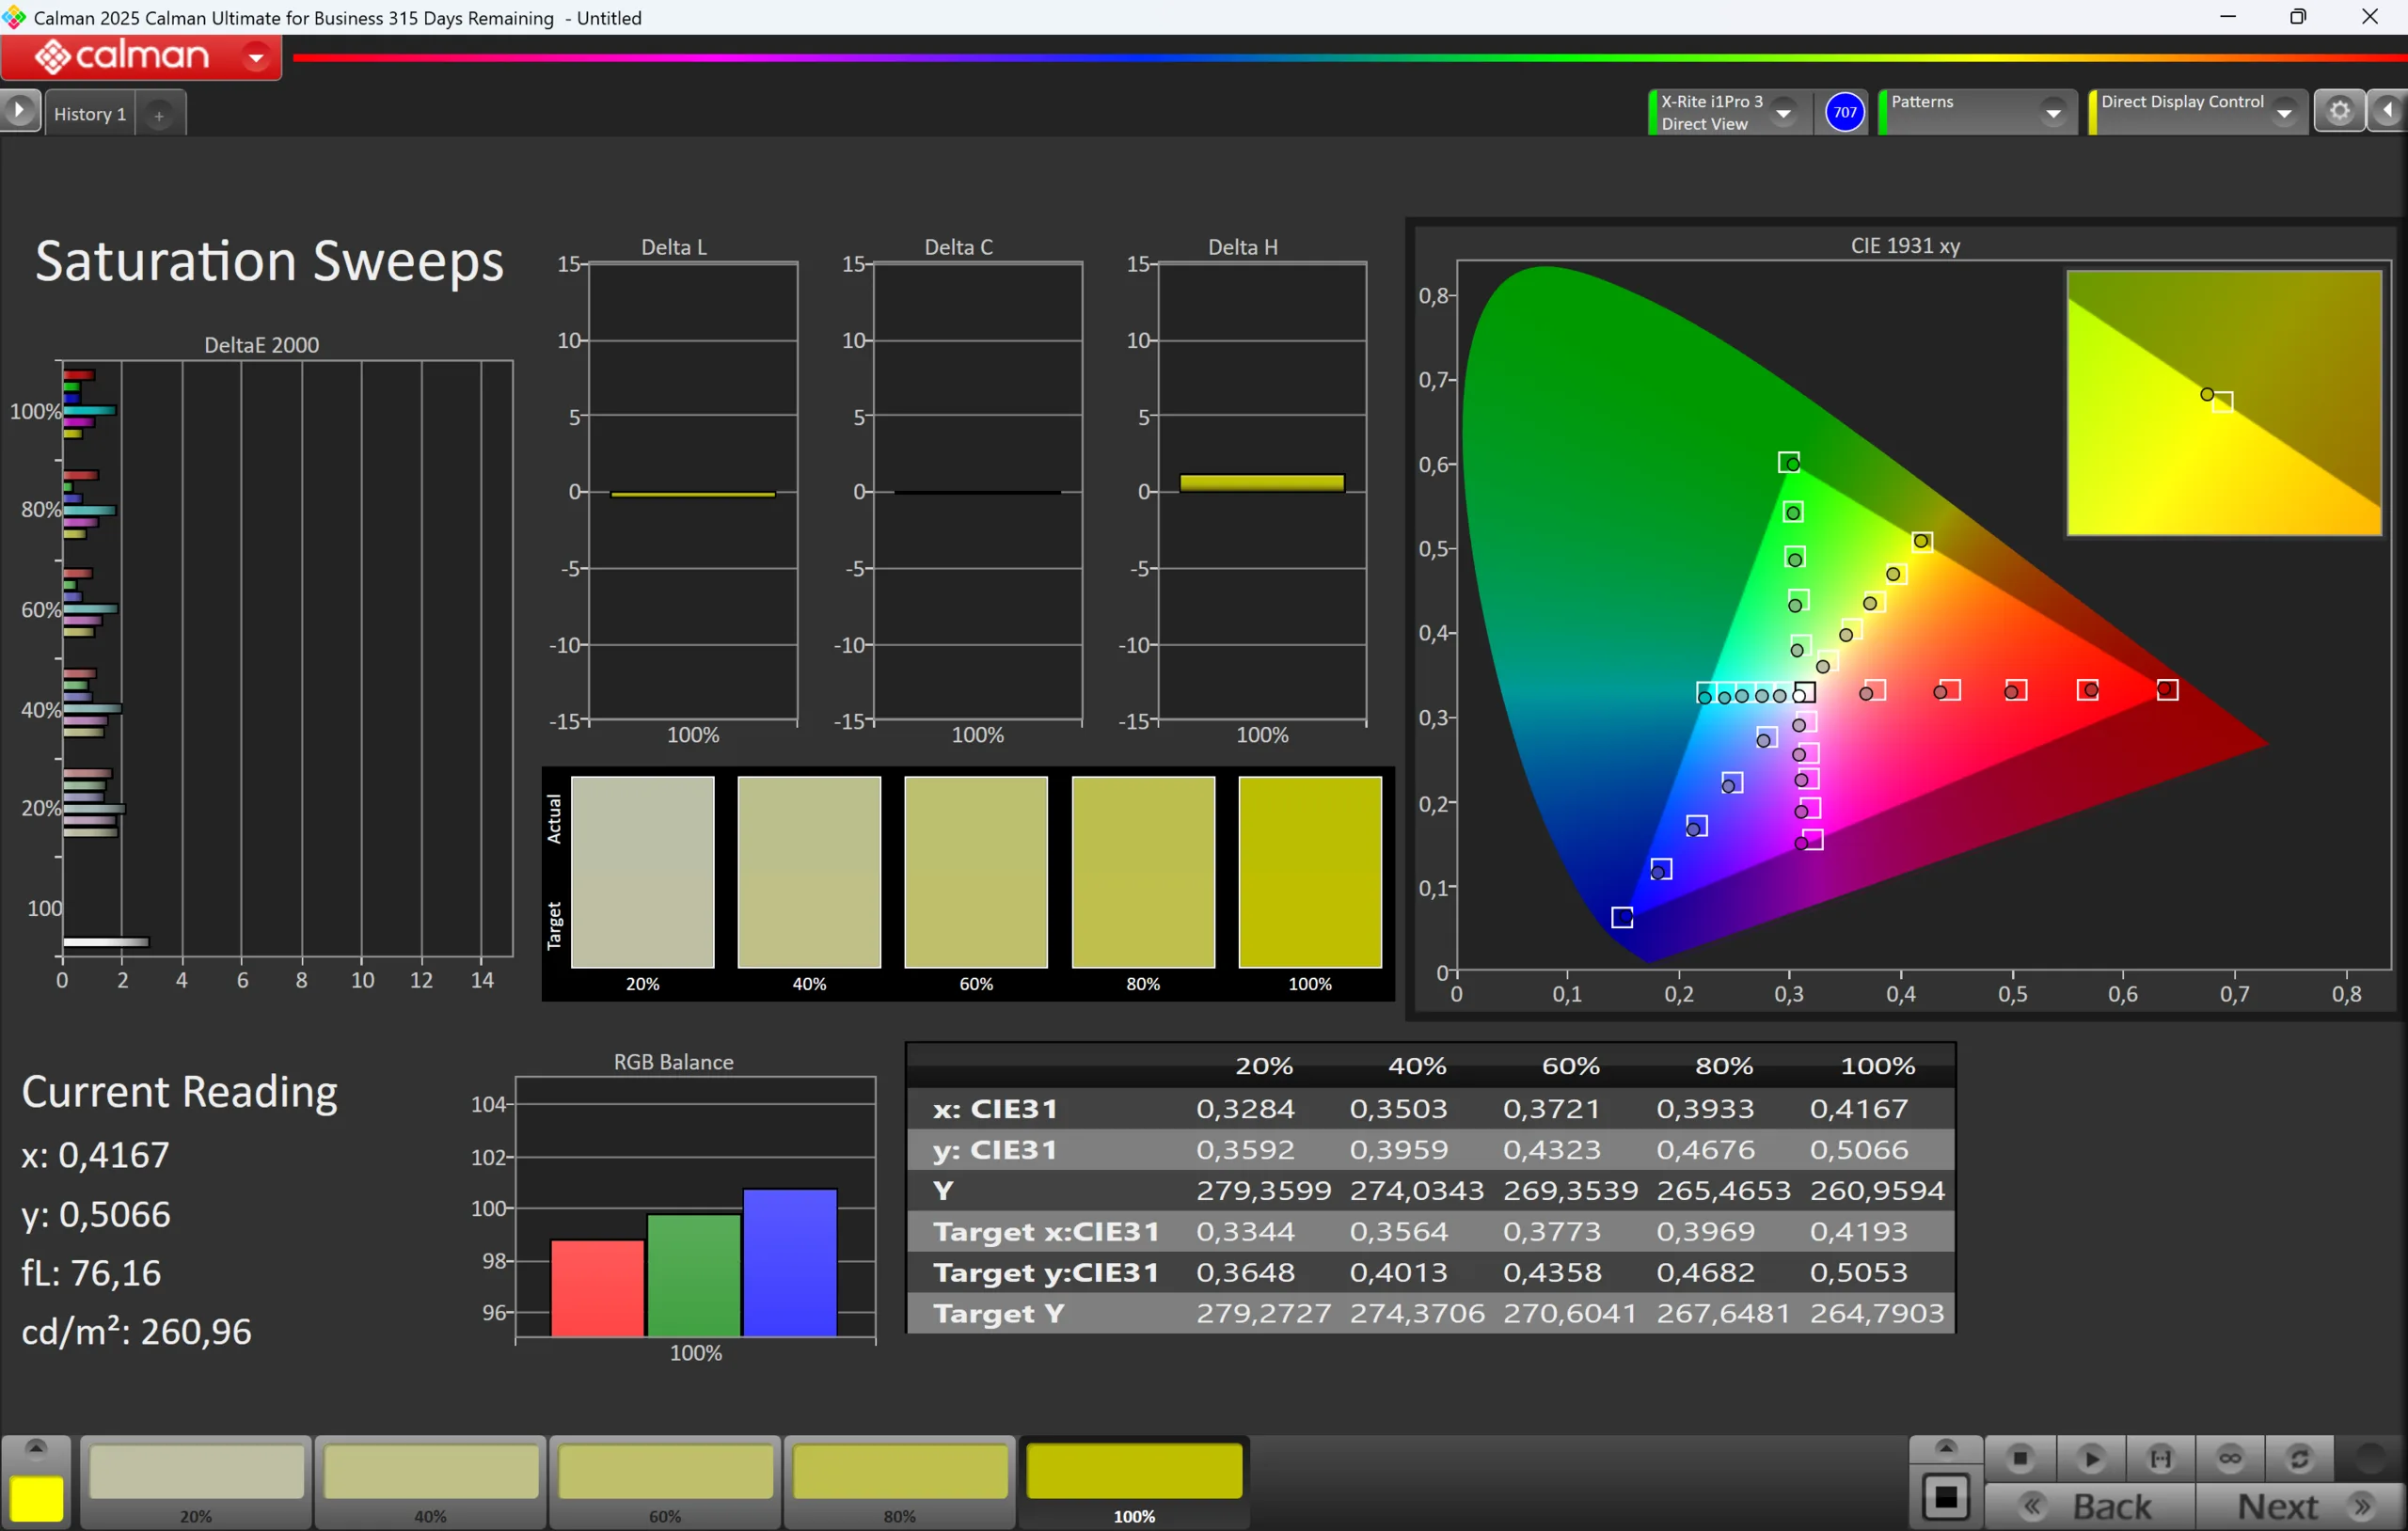


我们使用专业的 CalMAN 软件(X-Rite i1 Pro 3)对面板进行了分析,开箱后的画面已经非常不错。虽然有一点偏蓝,色温也有点偏冷,但除非把它放在经过校准的屏幕旁边,否则你不会真正注意到它。不过,这款面板还有更大的潜力,因为我们通过自己的校准,明显改善了灰度性能和色彩准确度。相应的色彩配置文件可在上面的框中免费下载。得益于全 sRGB 色域,你还可以使用 MacBook Neo 进行图片/视频编辑。
Display Response Times
| ↔ Response Time Black to White | ||
|---|---|---|
| 14.6 ms ... rise ↗ and fall ↘ combined | ↗ 4.3 ms rise | 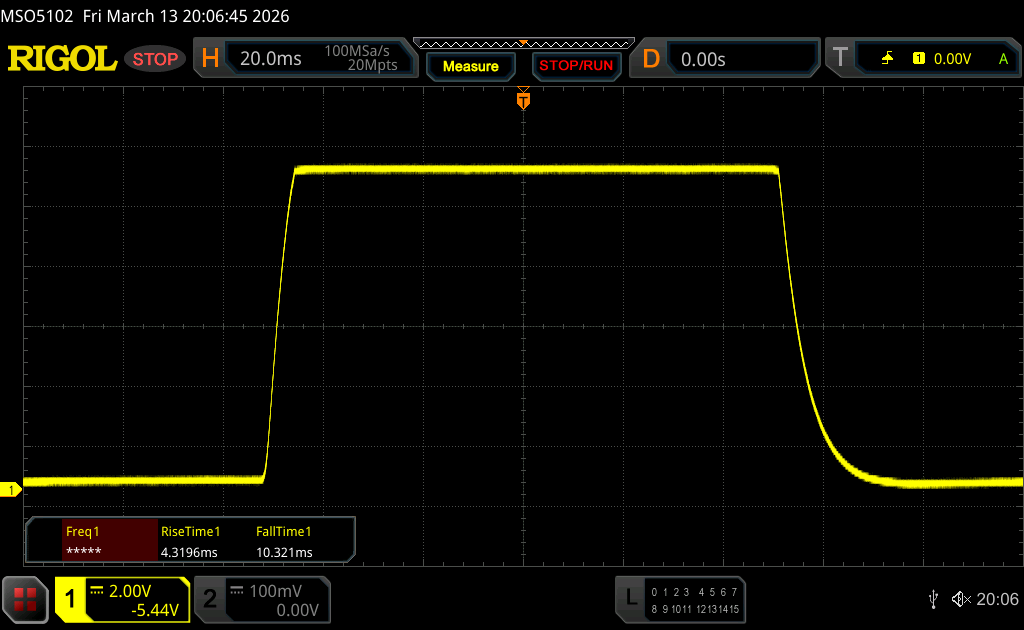 |
| ↘ 10.3 ms fall | ||
| The screen shows good response rates in our tests, but may be too slow for competitive gamers. In comparison, all tested devices range from 0.1 (minimum) to 240 (maximum) ms. » 36 % of all devices are better. This means that the measured response time is better than the average of all tested devices (19.8 ms). | ||
| ↔ Response Time 50% Grey to 80% Grey | ||
| 20.8 ms ... rise ↗ and fall ↘ combined | ↗ 9.2 ms rise | 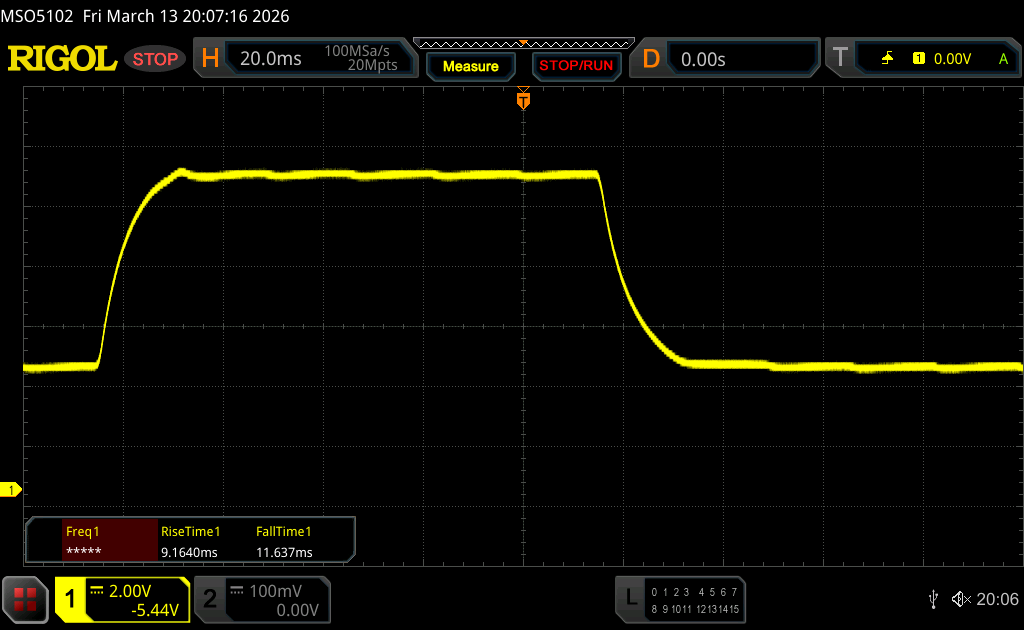 |
| ↘ 11.6 ms fall | ||
| The screen shows good response rates in our tests, but may be too slow for competitive gamers. In comparison, all tested devices range from 0.165 (minimum) to 636 (maximum) ms. » 33 % of all devices are better. This means that the measured response time is better than the average of all tested devices (31 ms). | ||
Screen Flickering / PWM (Pulse-Width Modulation)
| Screen flickering / PWM not detected | 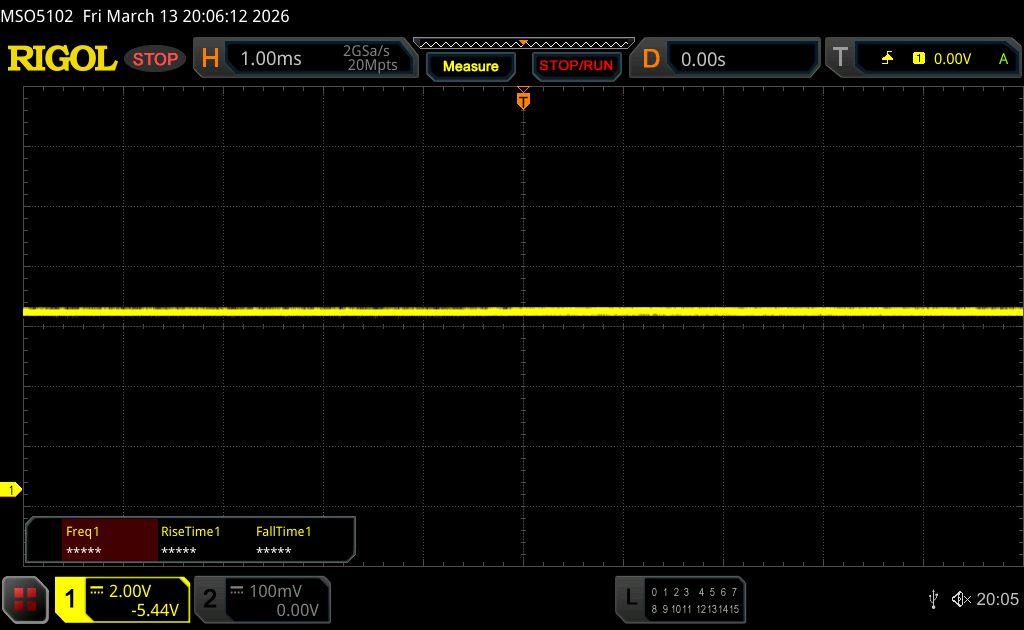 | ||
In comparison: 52 % of all tested devices do not use PWM to dim the display. If PWM was detected, an average of 7757 (minimum: 5 - maximum: 343500) Hz was measured. | |||
我们没有发现 PWM 闪烁,响应时间对于 IPS 屏幕来说也完全正常,但存在时间抖动。我们用慢动作视频(240 Hz)捕捉了这一现象,并通过不同的灰度级进行了处理,您可以在下面的视频中看到。灰度为 74% 时开始出现闪烁,而灰度为 60% 或更低时则非常明显。如果你对时间抖动敏感,MacBook Neo 将不会让你满意。


性能 - 配有 8GB 内存的 A18 Pro
处理器
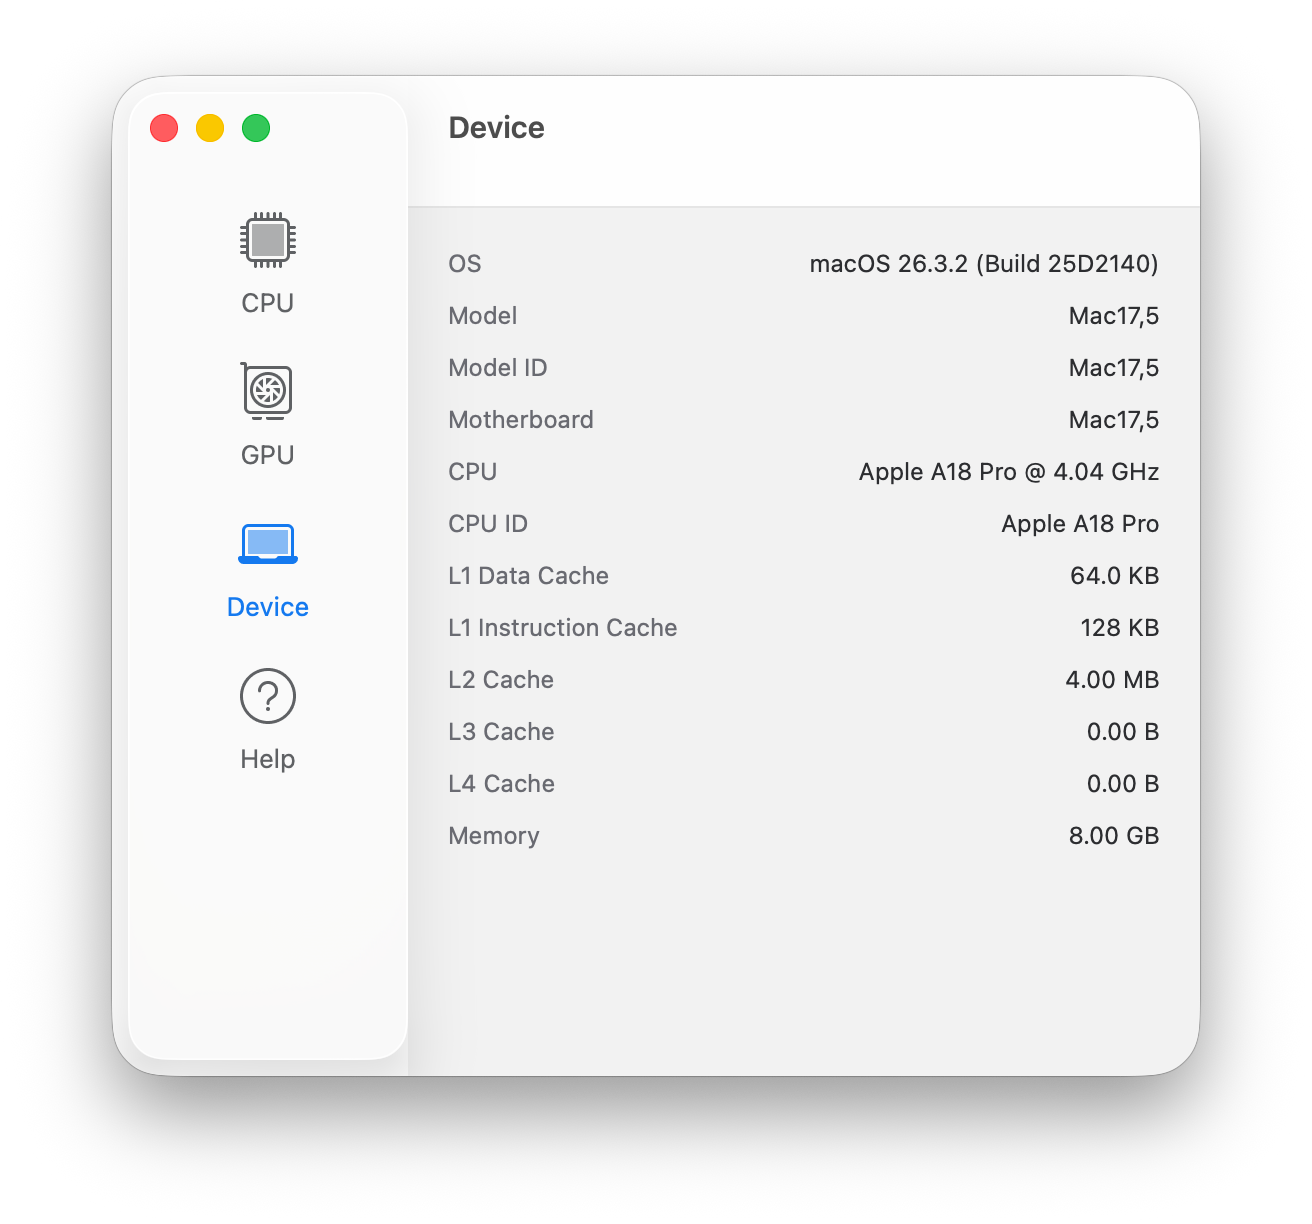
Apple 使用 A18 Pro SoC这是旧 iPhone 16 Pro 的处理器。它提供 6 个内核(2 倍性能,主频高达 4.0 GHz;4 倍效率,主频高达 2.4 GHz),多核情况下功耗高达 6 瓦(持续工作负载下功耗为 3.8 至 4 瓦),单核负载下功耗为 3.5 至 4 瓦。考虑到这些数值,其性能可谓出类拔萃。我们已经 我们已经报道过卓越的单核性能,其性能轻松超越了 AMD、英特尔或高通公司的所有其他移动处理器,只有Apple 的 M4 和 M5 代处理器无法与之匹敌。
多核性能较低,但请记住,Cinebench 20204 多核测试需要几分钟,而且它是被动冷却设备。它与英特尔的 Lunar Lake Core Ultra 5 芯片仍相差不远。在电池供电的情况下,性能也完全稳定。
Cinebench 2024: CPU Multi Core | CPU Single Core
Geekbench 6.7: Multi-Core | Single-Core
Cinebench 2024: CPU Multi Core | CPU Single Core
Geekbench 6.7: Multi-Core | Single-Core
系统性能
MacBook Neo 是一款迅捷的系统,基准测试成绩也非常出色。在 CrossMark 和浏览器基准测试中,它轻松击败了 Snapdragon 竞争对手。8GB 内存显然不是很宽裕,但如果你主要使用Apple 的原生应用程序,应该没问题。我们仍然每天使用配备 8GB 内存的入门级 MacBook Air M1,它仍然运行良好。
CrossMark: Overall | Productivity | Creativity | Responsiveness
WebXPRT 3: Overall
WebXPRT 4: Overall
Mozilla Kraken 1.1: Total
CrossMark: Overall | Productivity | Creativity | Responsiveness
WebXPRT 3: Overall
WebXPRT 4: Overall
Mozilla Kraken 1.1: Total
* ... smaller is better
存储设备
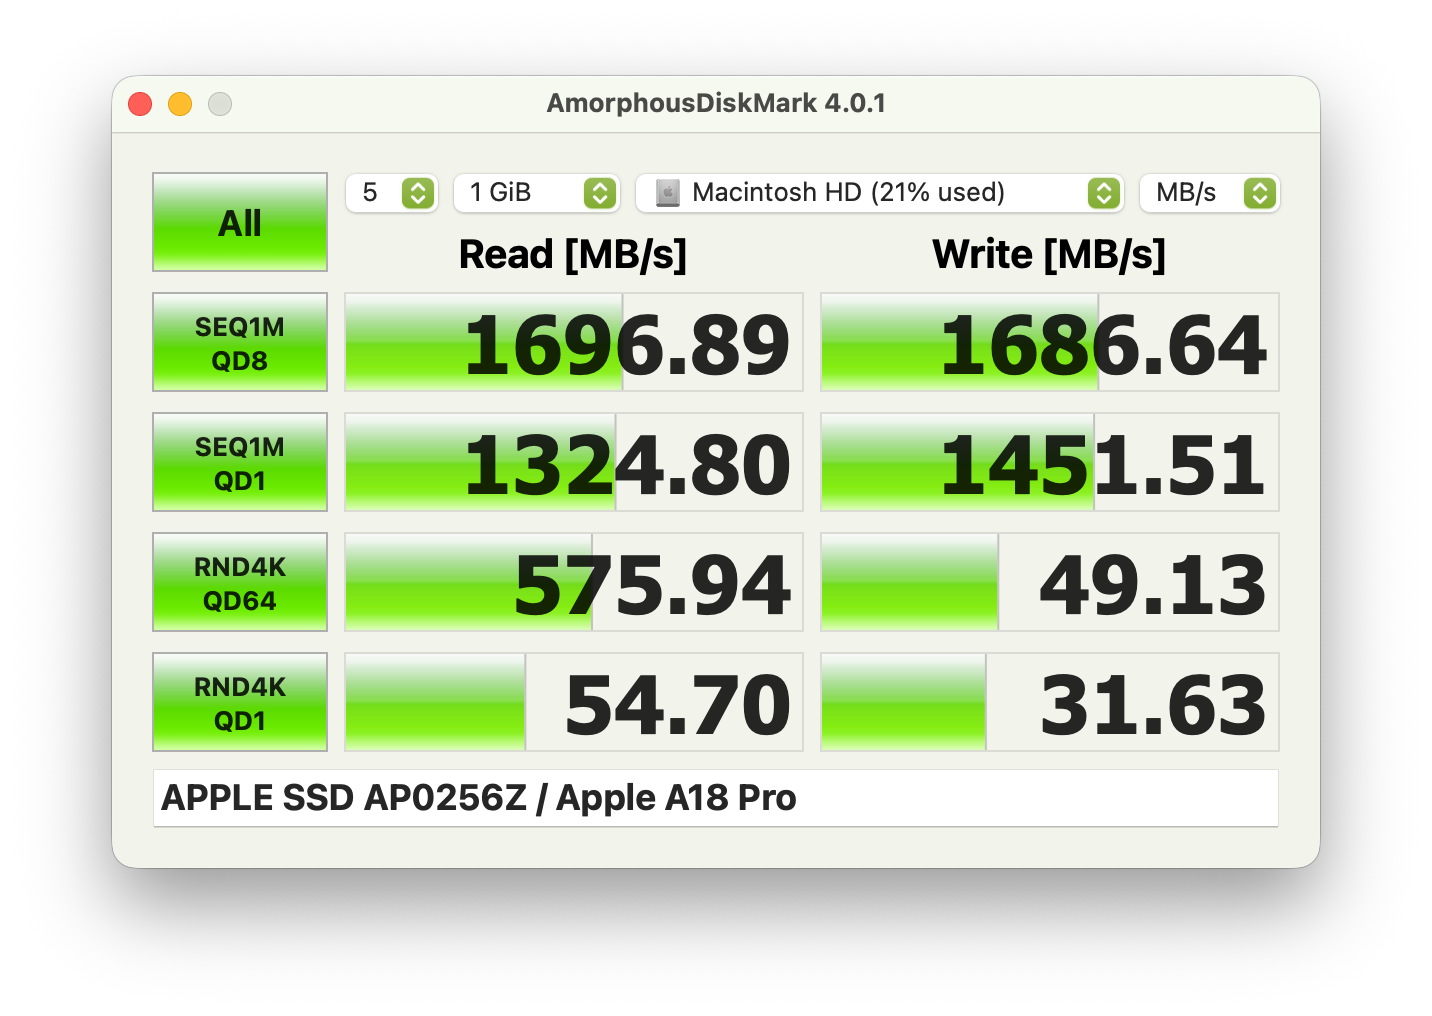
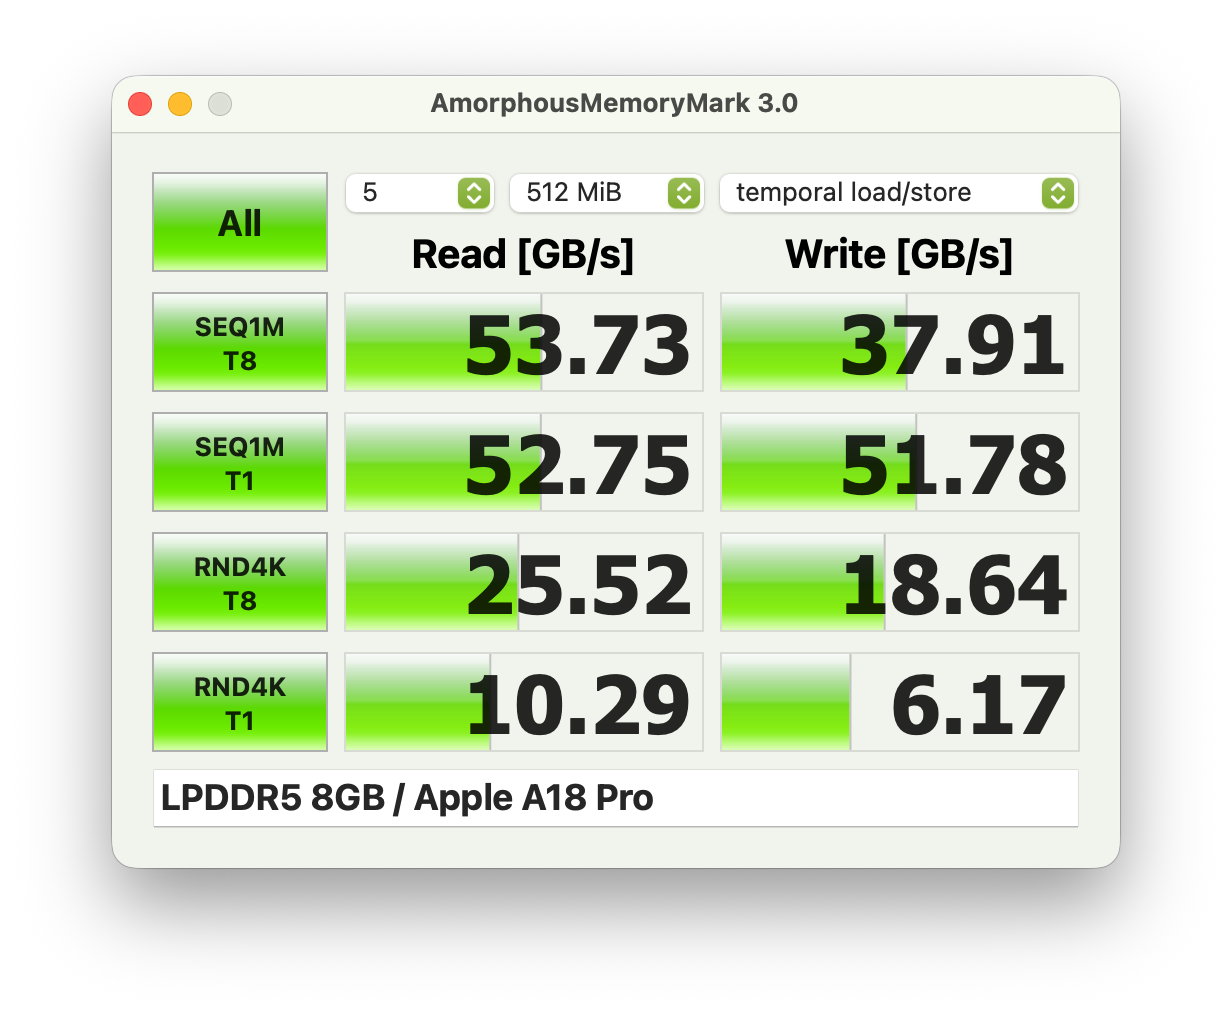
固态硬盘的性能约为 1.5 GB/s,因此与 MacBook Air M1 一样,它的速度足以满足日常工作和交换缓存的需要。你可以使用 194 GB 来存储自己的文件。
图形处理器性能

A18 Pro A18 Pro采用 6 核 GPU,最大功耗为 6 瓦,最终将降至 4.4 瓦。持续性能仍然相当不错,在Steel Nomad Light 压力测试中仅损失约 10%。图形性能也相当不错,轻松击败了 Adreno X1-45 GPU也不比 X1-85 型号在 Surface Laptop 7 13.8.与英特尔的 iGPU 相比,它比 Iris Xe Graphics G7更快。总之,它是一款能够胜任日常任务的 iGPU,包括高分辨率视频播放或一些轻量级视频编辑。
Geekbench 6.7: GPU Metal | GPU OpenCL
| 3DMark / Wild Life Extreme | |
| Apple MacBook Air 13 M4 Entry | |
| Average of class Subnotebook (659 - 11498, n=34, last 2 years) | |
| Lenovo IdeaPad Slim 3 14 AHP G10 | |
| Apple MacBook Air 2020 M1 Entry | |
| Apple MacBook Air 2020 M1 Entry | |
| Apple MacBook Neo 256 GB | |
| Xiaomi RedmiBook 14 2025 | |
| Average Apple A18 GPU (3330 - 4255, n=4) | |
| Lenovo ThinkPad L13 2in1 G5 21LNS4AM00 | |
| Microsoft Surface Laptop 13 | |
| 3DMark / Steel Nomad Light Score | |
| Apple MacBook Air 13 M4 Entry | |
| Average of class Subnotebook (1034 - 5084, n=27, last 2 years) | |
| Lenovo IdeaPad Slim 3 14 AHP G10 | |
| Microsoft Surface Laptop 7 13.8 Copilot+ | |
| Apple MacBook Air 2020 M1 Entry | |
| Apple MacBook Neo 256 GB | |
| Average Apple A18 GPU (1517 - 1803, n=4) | |
| Lenovo ThinkPad L13 2in1 G5 21LNS4AM00 | |
| Xiaomi RedmiBook 14 2025 | |
| Microsoft Surface Laptop 13 | |
| 3DMark / Steel Nomad Score | |
| Apple MacBook Air 13 M4 Entry | |
| Average of class Subnotebook (184 - 1095, n=31, last 2 years) | |
| Microsoft Surface Laptop 7 13.8 Copilot+ | |
| Lenovo IdeaPad Slim 3 14 AHP G10 | |
| Apple MacBook Air 2020 M1 Entry | |
| Apple MacBook Neo 256 GB | |
| Average Apple A18 GPU (n=1) | |
| Microsoft Surface Laptop 13 | |
| Alliwava GH9, i9-12900HK | |
| Alliwava GH9, i9-12900HK | |
| Geekbench 6.7 / GPU Metal | |
| Average of class Subnotebook (31469 - 76530, n=5, last 2 years) | |
| Apple MacBook Air 13 M4 Entry | |
| Apple MacBook Air 13 M3 10C GPU | |
| Apple MacBook Neo 256 GB | |
| Apple MacBook Air 2020 M1 Entry | |
| Average Apple A18 GPU (28031 - 31469, n=2) | |
Geekbench 6.7: GPU Metal | GPU OpenCL
| 3DMark Steel Nomad Score | 385 points | |
| 3DMark Steel Nomad Light Score | 1786 points | |
Help | ||
| Blender / v3.3 Classroom METAL | |
| Apple MacBook Air 2020 M1 Entry | |
| Apple MacBook Neo 256 GB | |
| Average Apple A18 GPU (n=1) | |
| Apple MacBook Air 13 M3 10C GPU | |
| Average of class Subnotebook (76.3 - 227, n=5, last 2 years) | |
| Apple MacBook Air 13 M4 Entry | |
| Blender / v3.3 Classroom oneAPI/Intel | |
| HP EliteBook 8 Flip G1i 13 | |
| Average of class Subnotebook (105 - 396, n=11, last 2 years) | |
* ... smaller is better
游戏性能
游戏性能非常有限,你应该专注于老游戏。赛博朋克 2077》等现代游戏只能在最低设置和分辨率下通过 MetalFX 升频勉强运行,但老实说,游戏看起来并不漂亮,而且在人多的地方,我们仍然会遇到帧数低于 30 fps 的情况。因此,你应该专注于Apple Arcade 游戏或使用流媒体服务。我们还使用内部显示屏分辨率进行了一些测试,但如下所示,对于要求较高的游戏,情况也没有好多少。我们将在接下来的几天里增加更多的游戏测试。
| 低速 | 中速 | 高速 | 超高速 | |
|---|---|---|---|---|
| 赛博朋克 2077 | 24.2 帧 | 19.3 帧 | 13.8 帧 | 11.3 帧 |
| 赛博朋克 2077 MetalFX Auto | 33.1 fps | 28.5 fps | 17 fps | 15.4 fps |
| 博德之门 3 | 26.3 帧 | 21.5 帧 | 18.1 帧 | 17.7 帧 |
| Shadow of the Tomb Raider - 1280x720 Lowest Preset | |
| Apple MacBook Air 13 M3 10C GPU | |
| Apple MacBook Air 13 M4 Entry | |
| Average of class Subnotebook (41 - 109, n=7, last 2 years) | |
| Apple MacBook Air 2020 M1 Entry | |
| Microsoft Surface Laptop 7 13.8 Copilot+ | |
| Apple MacBook Neo 256 GB | |
| low | med. | high | ultra | |
|---|---|---|---|---|
| Shadow of the Tomb Raider (2018) | 43 | 20 | 18 | 17 |
| Baldur's Gate 3 (2023) | 19.1 | 15.5 | 13.9 | 13.6 |
| Cyberpunk 2077 (2023) | 12.4 | 9.2 | 7 | 5.6 |
| Total War Pharaoh (2023) | 54.9 | 36.4 | 19.9 | 14.9 |
废气排放 - MacBook Neo 始终保持静音
系统噪音
MacBook Neo 不使用风扇,因此始终保持静音,这是与 Windows 竞争对手相比的一大优势。我们也没有听到任何其他电子噪音。
| Apple MacBook Neo 256 GB A18 Pro, A18 GPU | Microsoft Surface Laptop 13 SD X Plus X1P-42-100, Adreno X1-45 1.7 TFLOPS | HP Omnibook 5 14 SD X Plus X1P-42-100, Adreno X1-45 1.7 TFLOPS | Lenovo IdeaPad Slim 3 14 AHP G10 R7 8840HS, Radeon 780M | Apple MacBook Air 13 M4 Entry M4 10-Core, M4 8-Core GPU | |
|---|---|---|---|---|---|
| Noise | |||||
| off / environment * (dB) | 23.5 | 25.8 | 24.2 | ||
| Idle Minimum * (dB) | 23.5 | 25.8 | 24.2 | ||
| Idle Average * (dB) | 23.5 | 25.8 | 24.2 | ||
| Idle Maximum * (dB) | 23.5 | 25.8 | 26.8 | ||
| Load Average * (dB) | 23.5 | 29 | 40.8 | ||
| Cyberpunk 2077 ultra * (dB) | 29.9 | 29.2 | 38 | ||
| Load Maximum * (dB) | 43.6 | 37.8 | 40.8 |
* ... smaller is better
温度
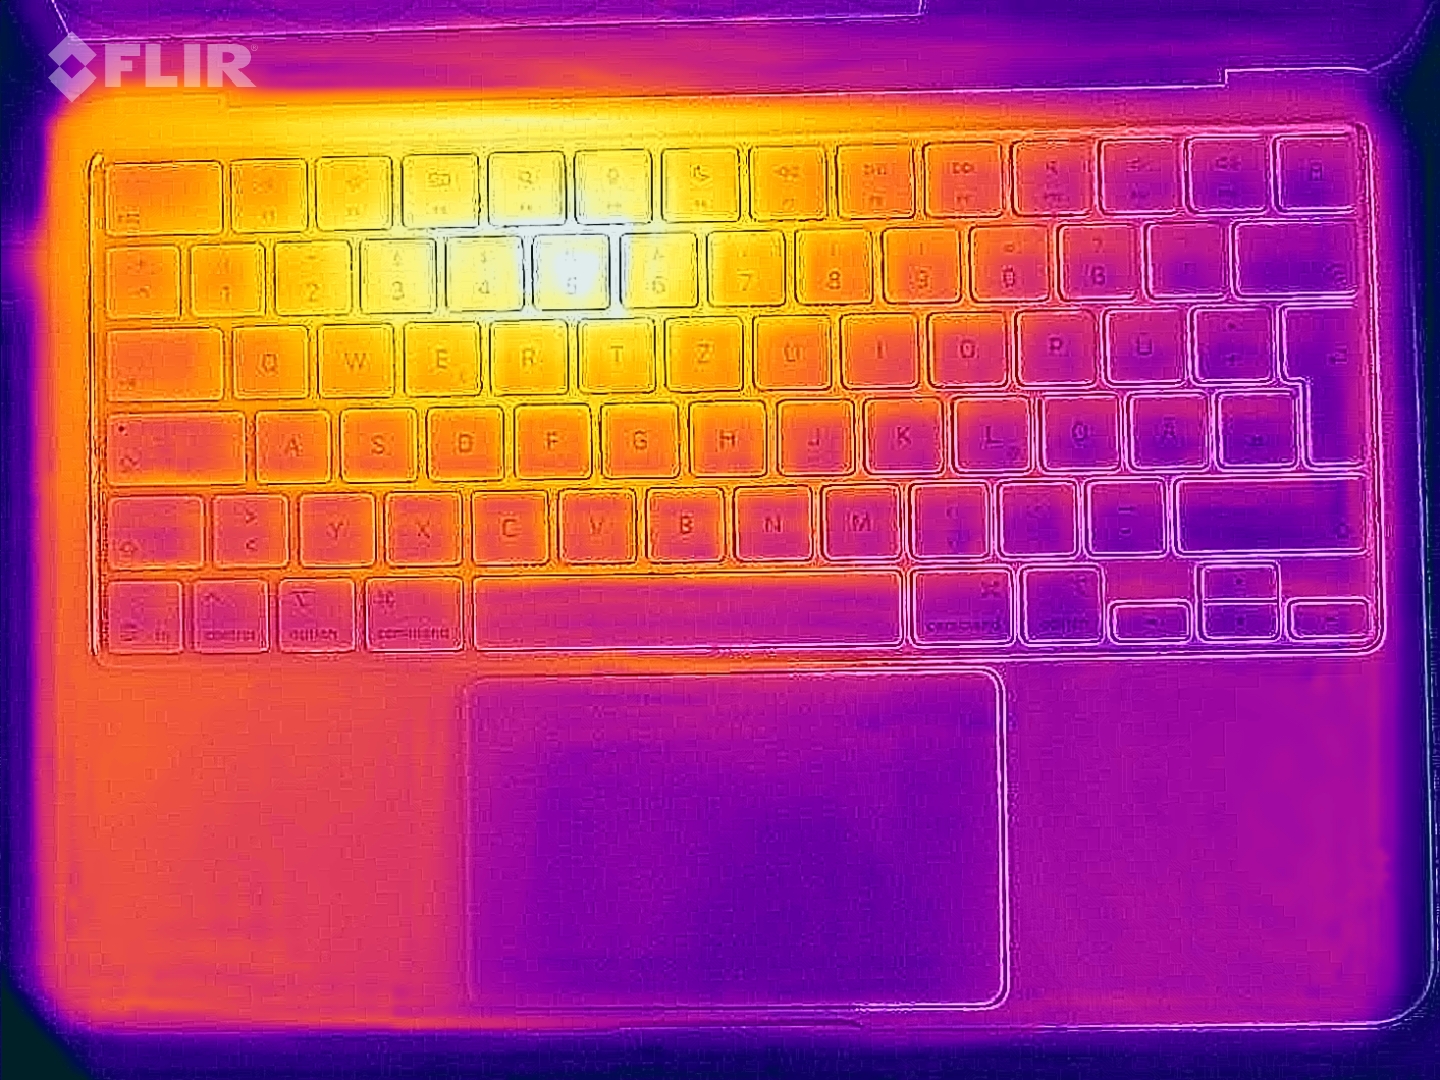
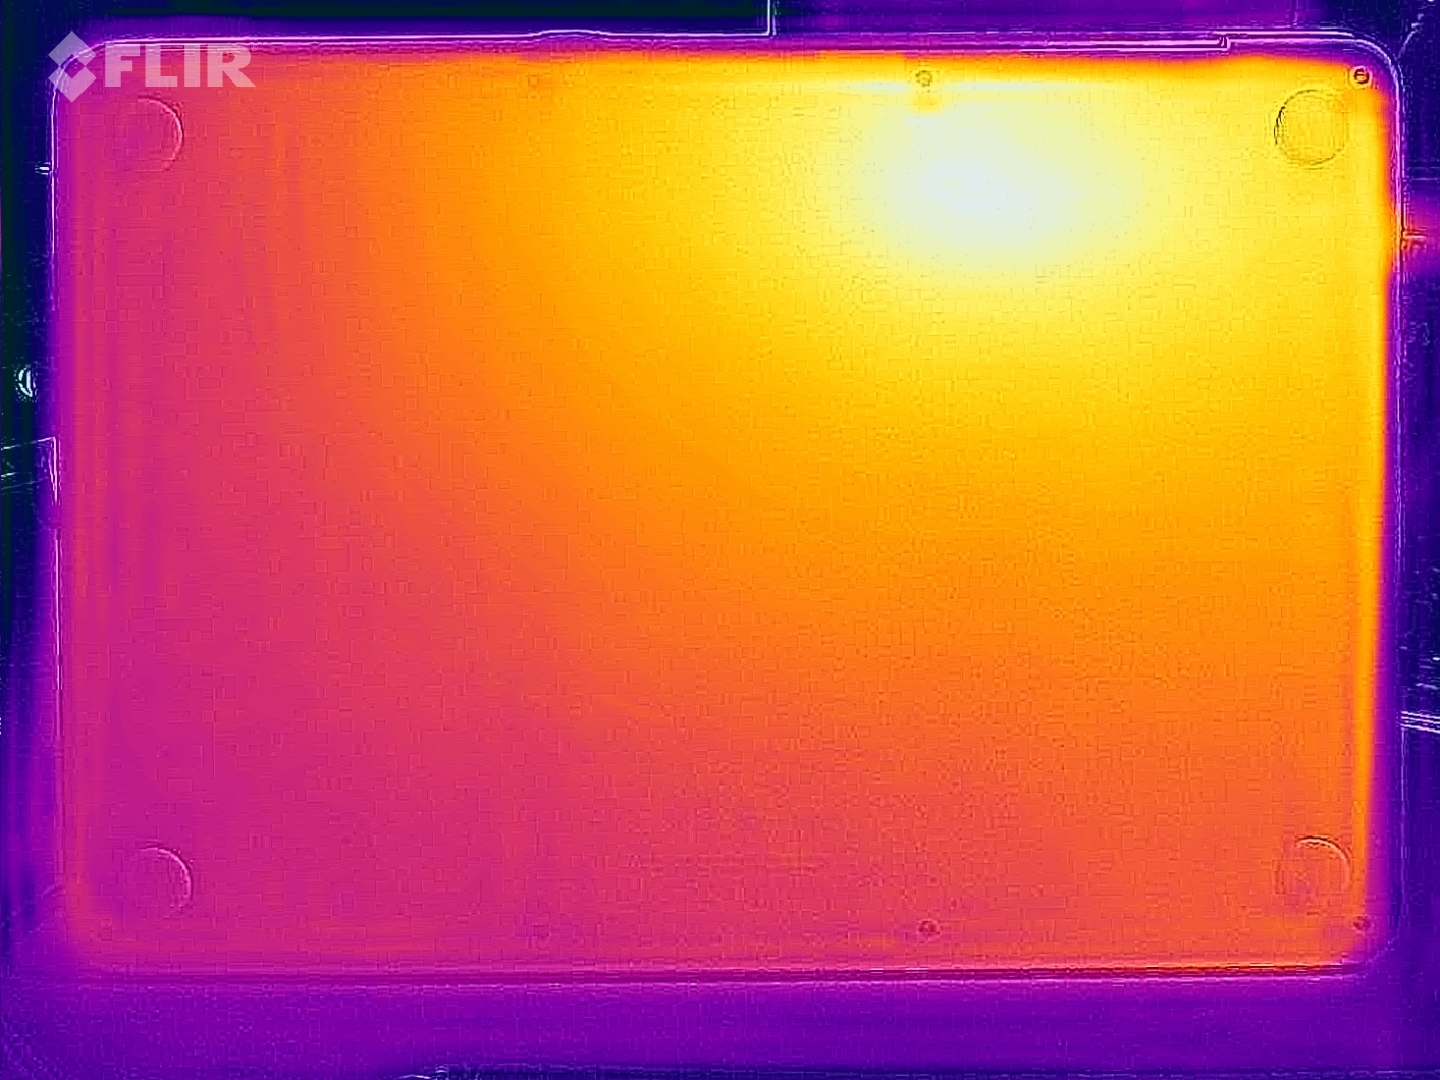
铝制机箱的表面温度始终很低,即使在系统承受压力的情况下也是如此。我们仅在两个位置测得 40 °C,其他所有区域的温度都要低得多,因此绝对没有任何限制。在压力测试期间,A18 Pro 的功耗高达 8.8 瓦,但很快就降到了 5 瓦左右。
(±) The maximum temperature on the upper side is 40.8 °C / 105 F, compared to the average of 35.9 °C / 97 F, ranging from 21.4 to 59 °C for the class Subnotebook.
(+) The bottom heats up to a maximum of 38 °C / 100 F, compared to the average of 39.2 °C / 103 F
(+) In idle usage, the average temperature for the upper side is 23.1 °C / 74 F, compared to the device average of 30.8 °C / 87 F.
(+) 3: The average temperature for the upper side is 31 °C / 88 F, compared to the average of 30.8 °C / 87 F for the class Subnotebook.
(+) The palmrests and touchpad are cooler than skin temperature with a maximum of 30.3 °C / 86.5 F and are therefore cool to the touch.
(-) The average temperature of the palmrest area of similar devices was 28.2 °C / 82.8 F (-2.1 °C / -3.7 F).
| Apple MacBook Neo 256 GB A18 Pro, A18 GPU | Microsoft Surface Laptop 13 SD X Plus X1P-42-100, Adreno X1-45 1.7 TFLOPS | HP Omnibook 5 14 SD X Plus X1P-42-100, Adreno X1-45 1.7 TFLOPS | Lenovo IdeaPad Slim 3 14 AHP G10 R7 8840HS, Radeon 780M | Apple MacBook Air 13 M4 Entry M4 10-Core, M4 8-Core GPU | |
|---|---|---|---|---|---|
| Heat | -3% | -9% | -17% | -7% | |
| Maximum Upper Side * (°C) | 40.8 | 39 4% | 32.4 21% | 38.3 6% | 44.9 -10% |
| Maximum Bottom * (°C) | 38 | 42.2 -11% | 33.6 12% | 51.5 -36% | 42.6 -12% |
| Idle Upper Side * (°C) | 23.8 | 23.9 -0% | 30.2 -27% | 25.8 -8% | 23.9 -0% |
| Idle Bottom * (°C) | 22.8 | 24 -5% | 32 -40% | 29.5 -29% | 24 -5% |
* ... smaller is better
发言人

机身内的两个扬声器模块非常大,声音效果非常好。与 MacBook Air 等产品相比,它们的音效稍显不足,但考虑到价格区间,效果还是非常出色的。
Apple MacBook Neo 256 GB audio analysis
(+) | speakers can play relatively loud (83 dB)
Bass 100 - 315 Hz
(±) | reduced bass - on average 7.7% lower than median
(±) | linearity of bass is average (7% delta to prev. frequency)
Mids 400 - 2000 Hz
(+) | balanced mids - only 1.3% away from median
(+) | mids are linear (3.3% delta to prev. frequency)
Highs 2 - 16 kHz
(+) | balanced highs - only 4.4% away from median
(+) | highs are linear (4.3% delta to prev. frequency)
Overall 100 - 16.000 Hz
(+) | overall sound is linear (9% difference to median)
Compared to same class
» 4% of all tested devices in this class were better, 1% similar, 95% worse
» The best had a delta of 5%, average was 18%, worst was 53%
Compared to all devices tested
» 3% of all tested devices were better, 1% similar, 96% worse
» The best had a delta of 4%, average was 23%, worst was 134%
Microsoft Surface Laptop 13 audio analysis
(+) | speakers can play relatively loud (83.5 dB)
Bass 100 - 315 Hz
(-) | nearly no bass - on average 15.5% lower than median
(±) | linearity of bass is average (10.7% delta to prev. frequency)
Mids 400 - 2000 Hz
(+) | balanced mids - only 3.3% away from median
(+) | mids are linear (4.3% delta to prev. frequency)
Highs 2 - 16 kHz
(+) | balanced highs - only 1.5% away from median
(+) | highs are linear (4.7% delta to prev. frequency)
Overall 100 - 16.000 Hz
(+) | overall sound is linear (11.1% difference to median)
Compared to same class
» 11% of all tested devices in this class were better, 2% similar, 87% worse
» The best had a delta of 5%, average was 18%, worst was 53%
Compared to all devices tested
» 7% of all tested devices were better, 2% similar, 91% worse
» The best had a delta of 4%, average was 23%, worst was 134%
HP Omnibook 5 14 audio analysis
(+) | speakers can play relatively loud (92.7 dB)
Bass 100 - 315 Hz
(-) | nearly no bass - on average 19.3% lower than median
(+) | bass is linear (5.5% delta to prev. frequency)
Mids 400 - 2000 Hz
(+) | balanced mids - only 3% away from median
(+) | mids are linear (4% delta to prev. frequency)
Highs 2 - 16 kHz
(+) | balanced highs - only 1.3% away from median
(+) | highs are linear (2% delta to prev. frequency)
Overall 100 - 16.000 Hz
(+) | overall sound is linear (12.8% difference to median)
Compared to same class
» 19% of all tested devices in this class were better, 4% similar, 76% worse
» The best had a delta of 5%, average was 18%, worst was 53%
Compared to all devices tested
» 12% of all tested devices were better, 3% similar, 85% worse
» The best had a delta of 4%, average was 23%, worst was 134%
Lenovo IdeaPad Slim 3 14 AHP G10 audio analysis
(+) | speakers can play relatively loud (82.6 dB)
Bass 100 - 315 Hz
(-) | nearly no bass - on average 29.7% lower than median
(±) | linearity of bass is average (9.5% delta to prev. frequency)
Mids 400 - 2000 Hz
(±) | higher mids - on average 6.8% higher than median
(±) | linearity of mids is average (7% delta to prev. frequency)
Highs 2 - 16 kHz
(+) | balanced highs - only 3.8% away from median
(+) | highs are linear (4.9% delta to prev. frequency)
Overall 100 - 16.000 Hz
(±) | linearity of overall sound is average (24.3% difference to median)
Compared to same class
» 82% of all tested devices in this class were better, 3% similar, 14% worse
» The best had a delta of 5%, average was 18%, worst was 53%
Compared to all devices tested
» 74% of all tested devices were better, 6% similar, 21% worse
» The best had a delta of 4%, average was 23%, worst was 134%
能源管理
耗电量

在我们的功耗测量中,最大亮度下的空闲值相当高,高达 9 瓦,这是由明亮的 IPS 屏幕造成的。在负载情况下,我们测得的最高功率为 24 瓦,稳定在约 18.5 瓦。Apple 在欧洲没有提供电源适配器;为安全起见,我们建议使用 30 瓦的型号。
| Off / Standby | |
| Idle | |
| Load |
|
Key:
min: | |
| Apple MacBook Neo 256 GB A18 Pro, A18 GPU, Apple SSD AP0256Z, IPS, 2408x1506, 13" | Microsoft Surface Laptop 13 SD X Plus X1P-42-100, Adreno X1-45 1.7 TFLOPS, , IPS, 1920x1280, 13" | HP Omnibook 5 14 SD X Plus X1P-42-100, Adreno X1-45 1.7 TFLOPS, Samsung PM9C1 MZVL81T0HELB-00BTW, OLED, 1920x1200, 14" | Lenovo IdeaPad Slim 3 14 AHP G10 R7 8840HS, Radeon 780M, Micron 2500 MTFDKBA512QGN, IPS, 1920x1200, 14" | Apple MacBook Air 13 M4 Entry M4 10-Core, M4 8-Core GPU, Apple SSD AP0256Z, IPS, 2560x1664, 13.6" | Average Apple A18 GPU | Average of class Subnotebook | |
|---|---|---|---|---|---|---|---|
| Power Consumption | -31% | -38% | -112% | -38% | 52% | -76% | |
| Idle Minimum * (Watt) | 1.5 | 1.8 -20% | 1.9 -27% | 3.3 -120% | 1.9 -27% | 0.873 ? 42% | 3.76 ? -151% |
| Idle Average * (Watt) | 8.9 | 5.1 43% | 2.5 72% | 6.3 29% | 8.7 2% | 3.3 ? 63% | 6.54 ? 27% |
| Idle Maximum * (Watt) | 9 | 5.6 38% | 8.1 10% | 6.8 24% | 8.8 2% | 3.39 ? 62% | 7.89 ? 12% |
| Load Average * (Watt) | 18.9 | 13.8 27% | 17.8 6% | 45.7 -142% | 29.9 -58% | 9.09 ? 52% | 42 ? -122% |
| Cyberpunk 2077 ultra external monitor * (Watt) | 10.3 | 19.4 -88% | 19.1 -85% | 35.8 -248% | 21.5 -109% | ||
| Cyberpunk 2077 ultra * (Watt) | 11.5 | 21.8 -90% | 19.9 -73% | 38.2 -232% | 18.5 -61% | ||
| Load Maximum * (Watt) | 26.3 | 60.2 -129% | 70.3 -167% | 51.7 -97% | 30.8 -17% | 15 ? 43% | 64.8 ? -146% |
* ... smaller is better
功耗 赛博朋克/压力测试
外部显示器功耗
电池寿命

36.5 瓦特的电池容量相当小,但在我们以 150 尼特进行的 Wi-Fi 测试中,其运行时间仍然达到了近 13 小时。然而,当你提高亮度时,情况就会急转直下,Wi-Fi 的运行时间会降到 5 小时以下。这可能是一个问题,尤其是在明亮的环境中,你只需要更高的面板亮度。我们将很快增加更多的电池运行时间测试。
充电速度很慢,使用 65W 电源适配器充电两小时后电池才恢复到 100%(45 分钟后恢复到 50%,76 分钟后恢复到 80%)。
笔记本检查评级
Apple MacBook Neo 256 GB
- 03/13/2026 v8
Andreas Osthoff
 Total Sustainability Score:
 潜在竞争对手比较
Image | Model / Review | Price | Weight | Height | Display |
|---|---|---|---|---|---|
1. 86%  | Apple MacBook Neo 256 GB Apple A18 Pro ⎘ Apple A18 GPU ⎘ 8 GB Memory, 256 GB SSD | Amazon: List Price: 699€ | 1.2 kg | 12.7 mm | 13.00" 2408x1506 218 PPI IPS |
2. 84.3% 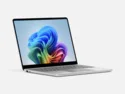 | Microsoft Surface Laptop 13 Qualcomm Snapdragon X Plus X1P-42-100 ⎘ Qualcomm SD X Adreno X1-45 1.7 TFLOPS ⎘ 16 GB Memory | Amazon: List Price: 1219€ | 1.2 kg | 15.6 mm | 13.00" 1920x1280 178 PPI IPS |
3. 85.5% 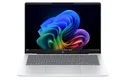 | HP Omnibook 5 14 Qualcomm Snapdragon X Plus X1P-42-100 ⎘ Qualcomm SD X Adreno X1-45 1.7 TFLOPS ⎘ 16 GB Memory, 1024 GB SSD | Amazon: List Price: 550 USD | 1.3 kg | 12.7 mm | 14.00" 1920x1200 162 PPI OLED |
4. 81.1% 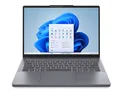 | Lenovo IdeaPad Slim 3 14 AHP G10 AMD Ryzen 7 8840HS ⎘ AMD Radeon 780M ⎘ 16 GB Memory, 512 GB SSD | Amazon: 1. $9.50 KEANBOLL 3-Pack Matte Anti-G... 2. $12.99 HSXIRQA 65W 45W AC Charger F... 3. $248.00 Lenovo IdeaPad Slim 3i 15.6"... List Price: 649€ | 1.5 kg | 17.9 mm | 14.00" 1920x1200 162 PPI IPS |
5. 91.2% 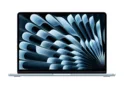 | Apple MacBook Air 13 M4 Entry Apple M4 10-Core ⎘ Apple M4 8-Core GPU ⎘ 16 GB Memory, 256 GB SSD | Amazon: List Price: 1039€ | 1.2 kg | 11.3 mm | 13.60" 2560x1664 225 PPI IPS |
Transparency
The selection of devices to be reviewed is made by our editorial team. The test sample was provided to the author as a loan by the manufacturer or retailer for the purpose of this review. The lender had no influence on this review, nor did the manufacturer receive a copy of this review before publication. There was no obligation to publish this review. As an independent media company, Notebookcheck is not subjected to the authority of manufacturers, retailers or publishers.
This is how Notebookcheck is testing
Every year, Notebookcheck independently reviews hundreds of laptops and smartphones using standardized procedures to ensure that all results are comparable. We have continuously developed our test methods for around 20 years and set industry standards in the process. In our test labs, high-quality measuring equipment is utilized by experienced technicians and editors. These tests involve a multi-stage validation process. Our complex rating system is based on hundreds of well-founded measurements and benchmarks, which maintains objectivity. Further information on our test methods can be found here.

