
结论 - 新款 MacBook Air 13 M5 是一款出色的笔记本电脑,适合许多人使用
旧款 MacBook Air 13 已经是一款出色的日常笔记本电脑,而新款 M5 机型则进一步提高了标准。AppleMacBook Air 13 的 M5 SoC 是目前能买到的最快的单核处理器,多核性能也非常出色,即使几分钟后由于散热限制而导致功耗下降。令人惊叹的是,一台完全静音的笔记本电脑竟然能达到如此高的性能,而且配备 8 核 GPU 的基本版 M5 在游戏时也非常高效,即使在大量游戏过程中,笔记本电脑也不会节流。
考虑到Apple 现在还包括 Wi-Fi 7,并将基本机型的存储容量翻倍至 512 GB,配备速度更快的 PCIe 4.0 驱动器,对于大多数用户来说,售价 1099 美元的新基本机型是最值得关注的版本,几乎不可能超越新 MacBook Air 13 M5 的性价比。考虑到之前 M4 版本的价格发展,用不了多久你就能以低于 1000 美元的价格买到这款机器。
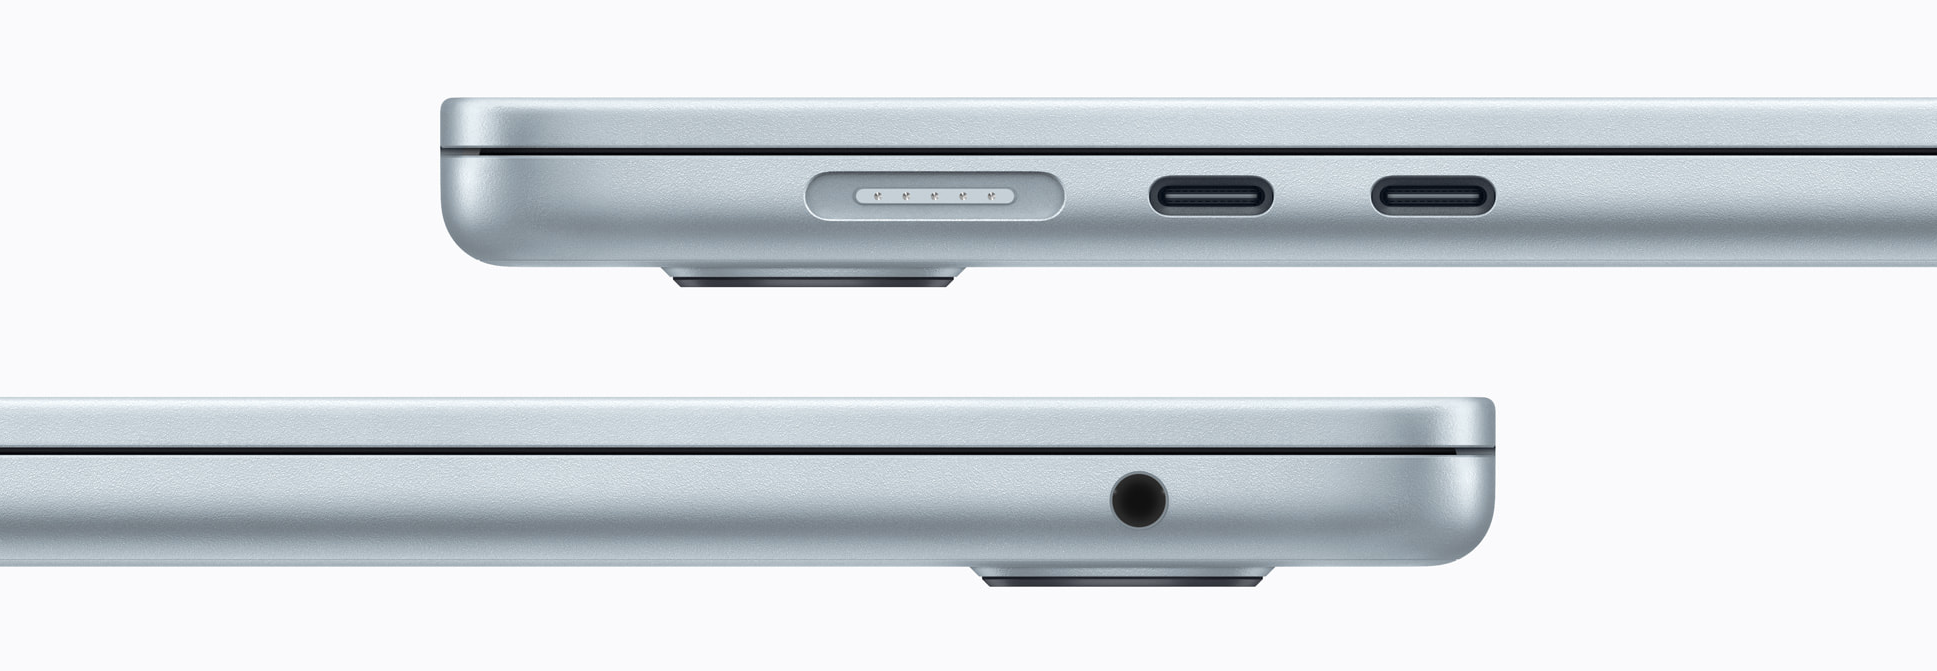
当然,缺点还是有的,包括端口数量有限、缺少 Face-ID、焊接内存和固态硬盘以及 60 Hz 的屏幕。我们并不介意采用 IPS 面板,因为它不会受到 PWM 闪烁的影响,但如果刷新率能更高一些就更好了。查看 MacBook Pro 14 M5然而,我们认为Apple 对销售配备更好屏幕的 MacBook Air 并不感兴趣,因为它可能会蚕食入门级 MacBook Pro 的销售数字。
Pros
Cons
价格和供应情况
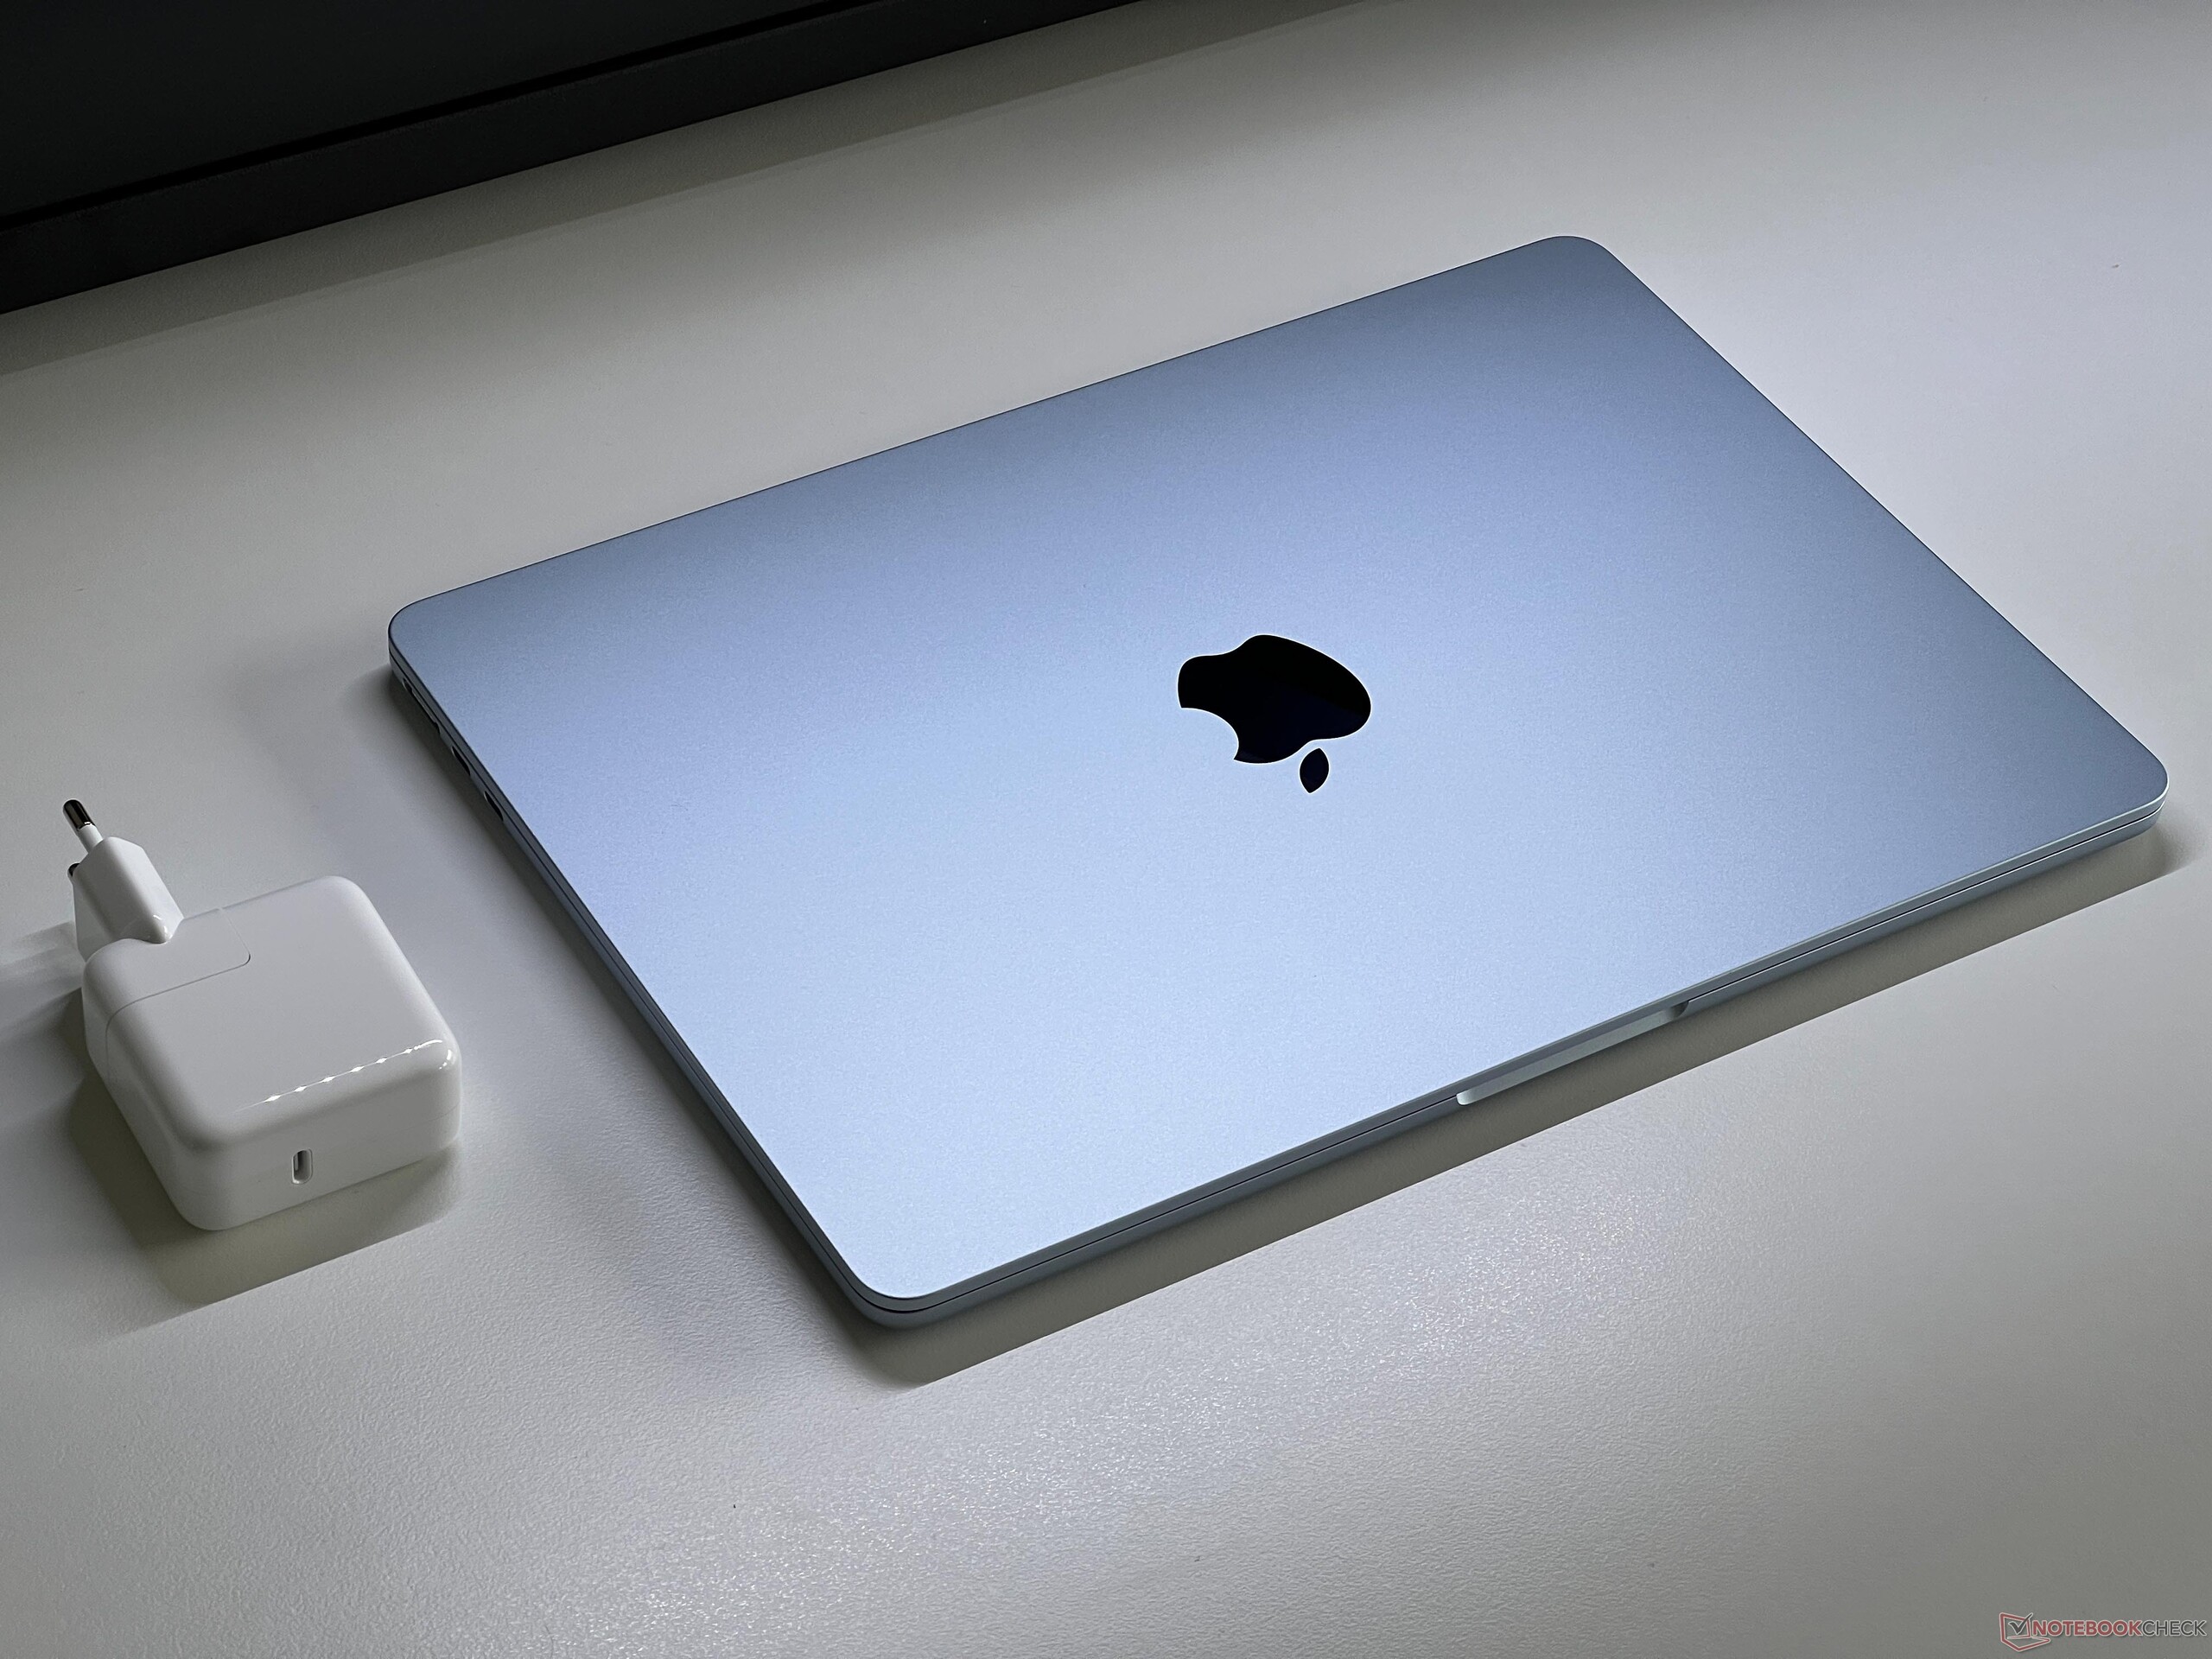
新款 MacBook Air 13 M5 于 3 月 11 日上市,售价 1099 美元。
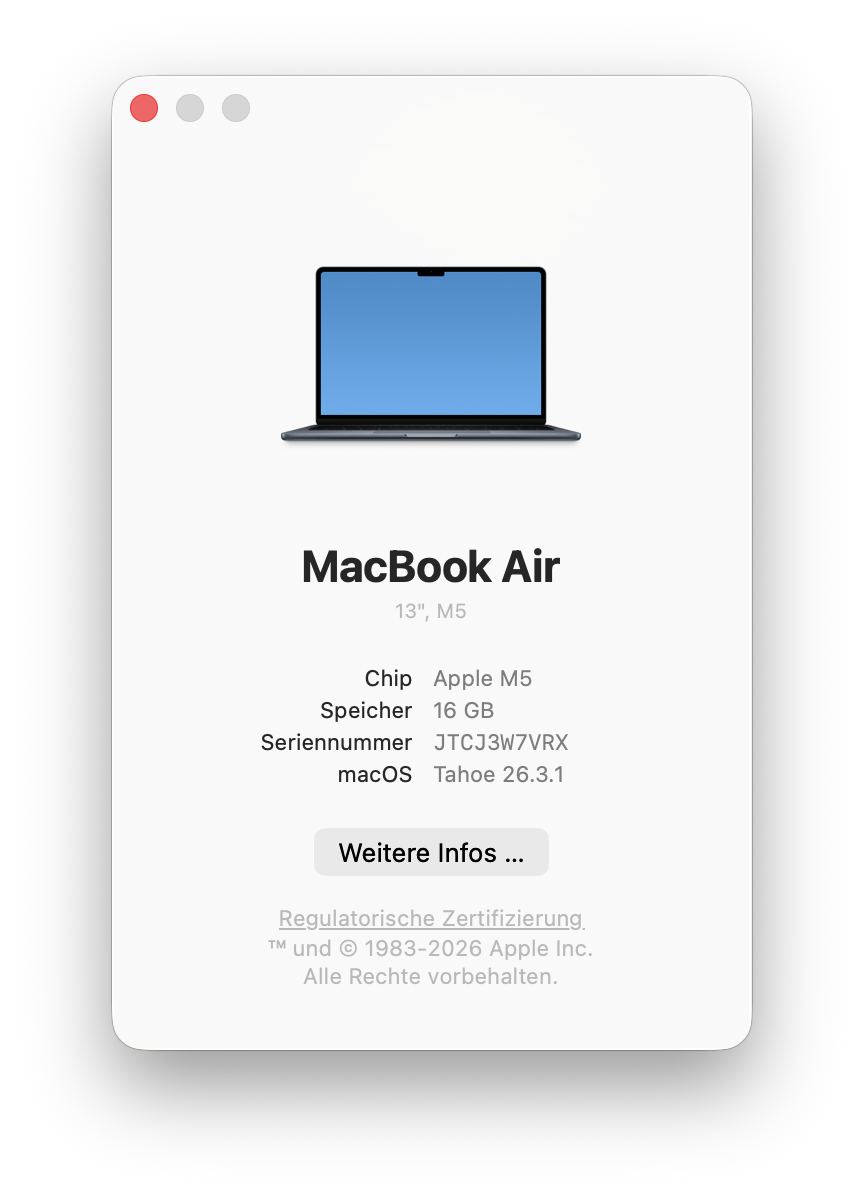
Apple 苹果公司更新了 MacBook Air 产品线,配备了新的 M5 SoC、Wi-Fi 7 芯片和两倍的存储空间,售价 1099 美元。我们对配备 16GB 内存和更快的 512GB SSD(PCIe 4.0)的新入门级机型进行了评测。
规格
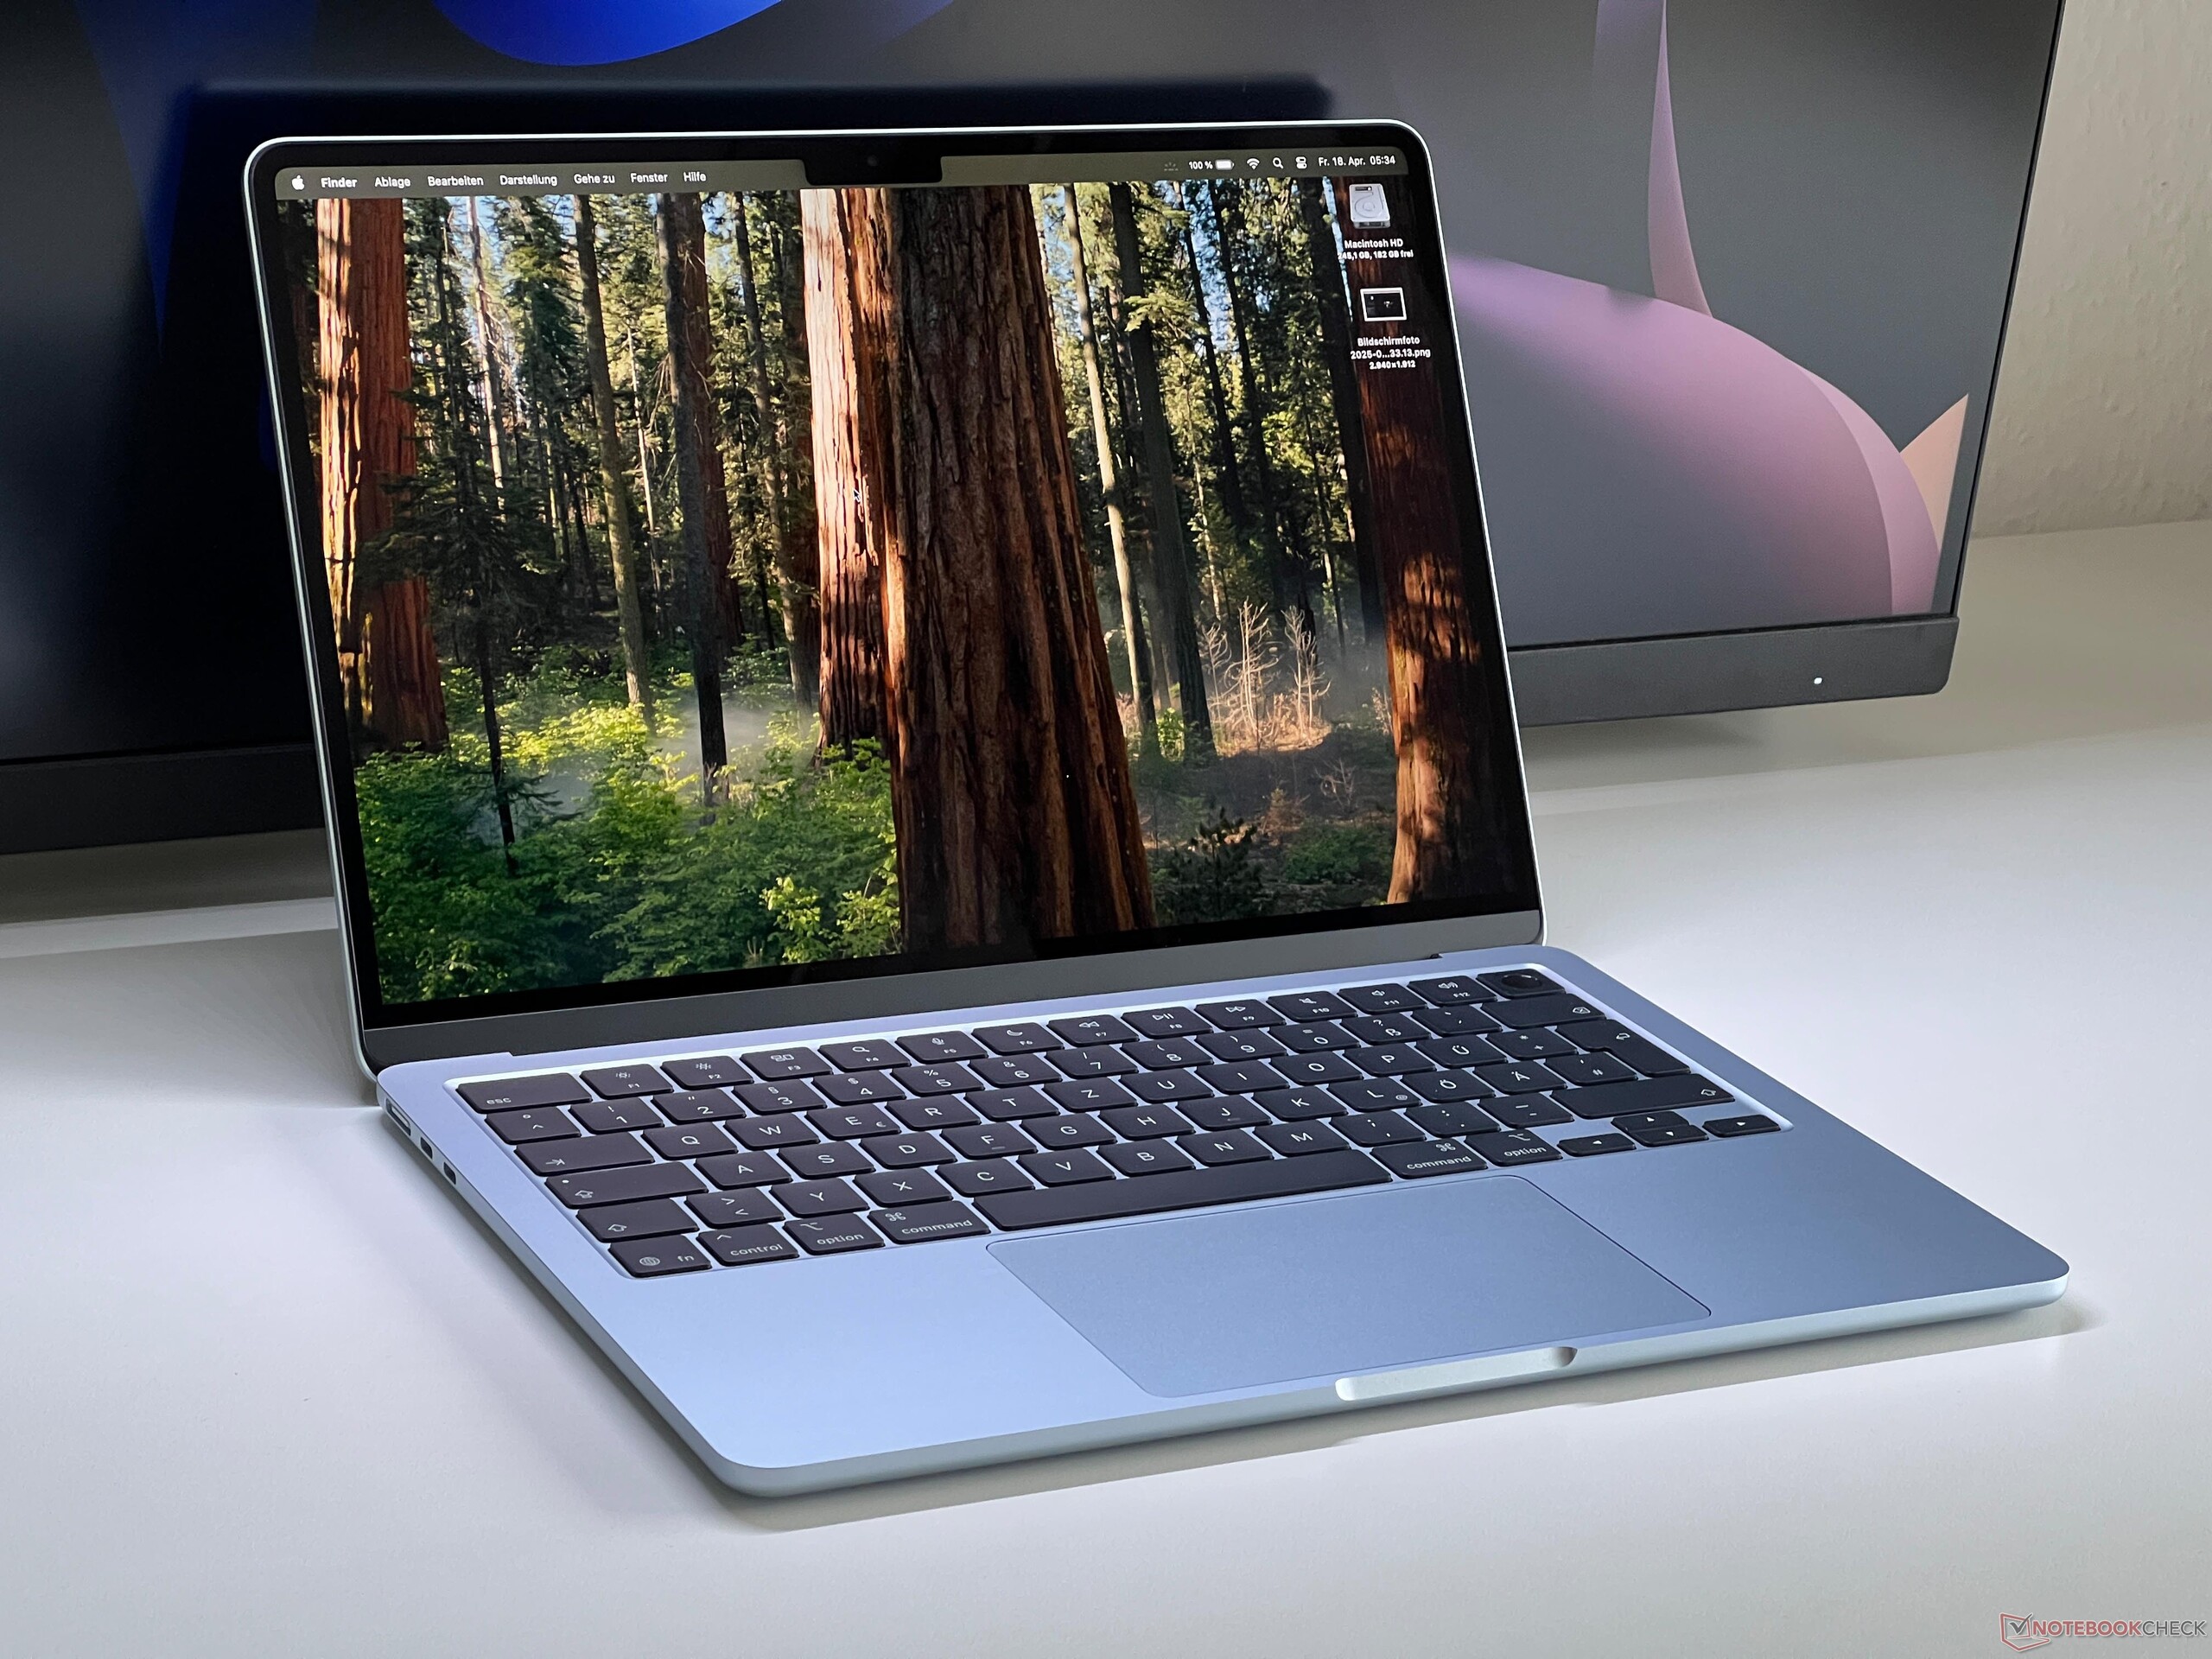
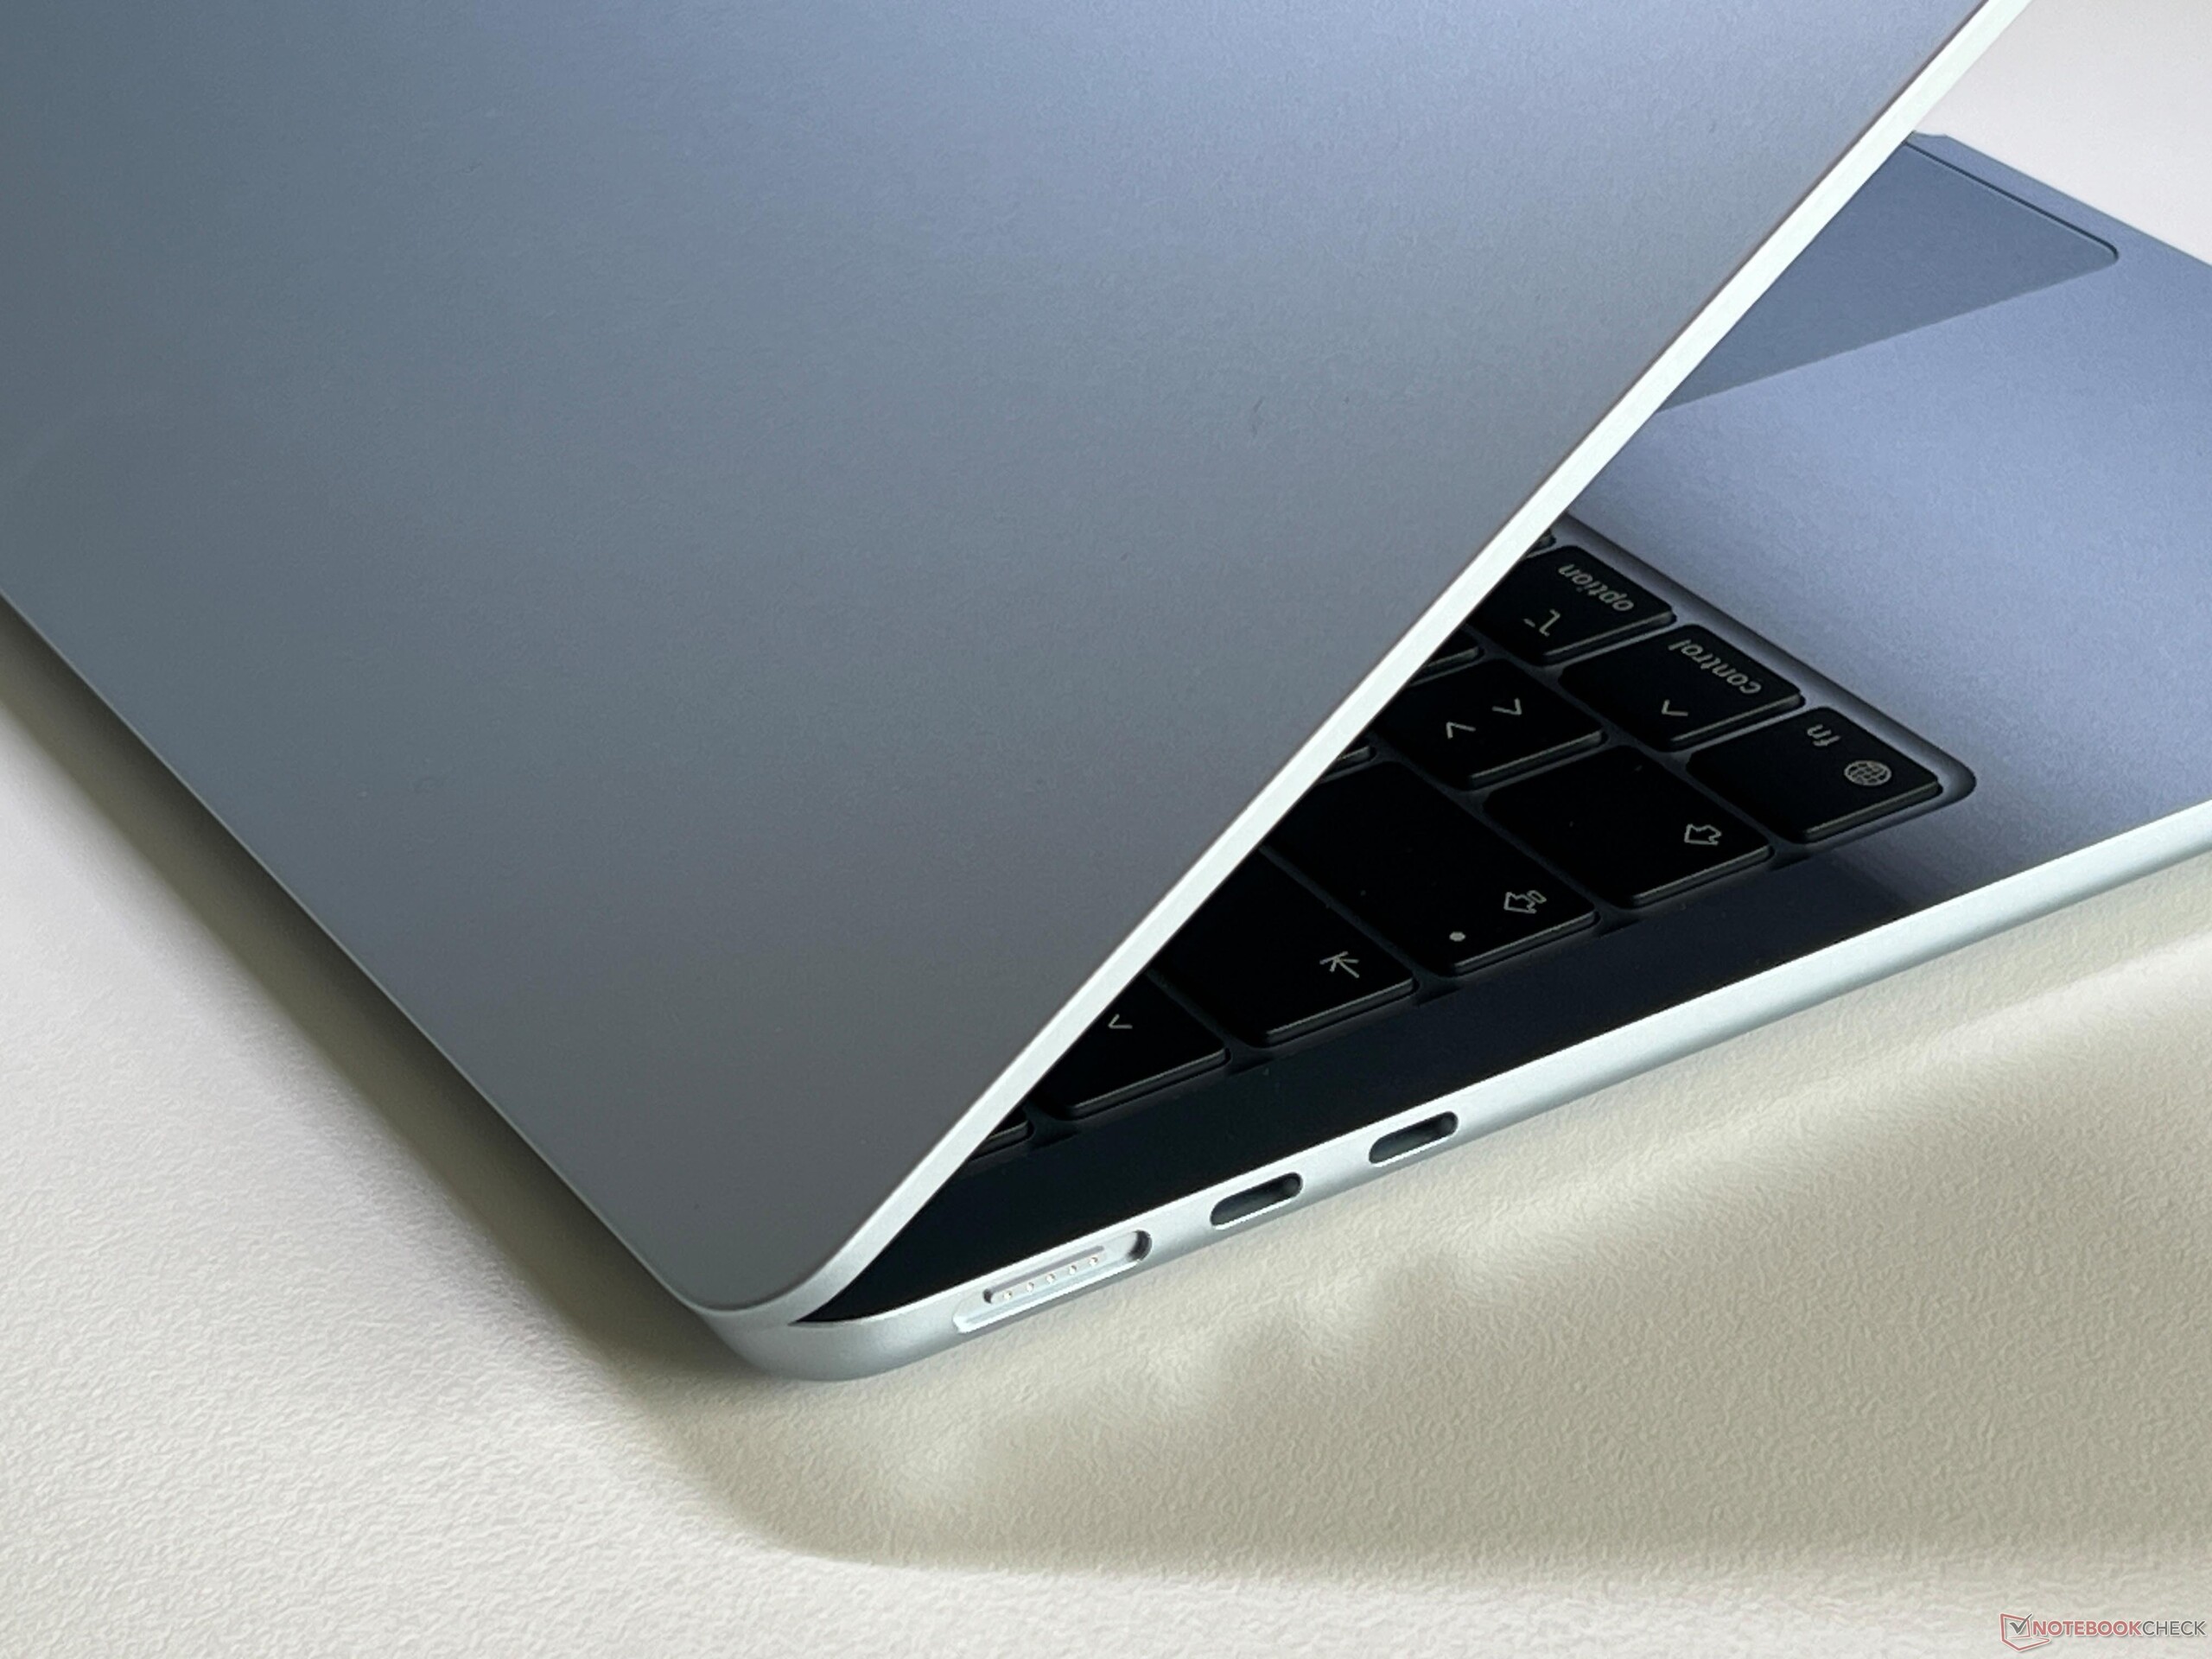
外壳和连接
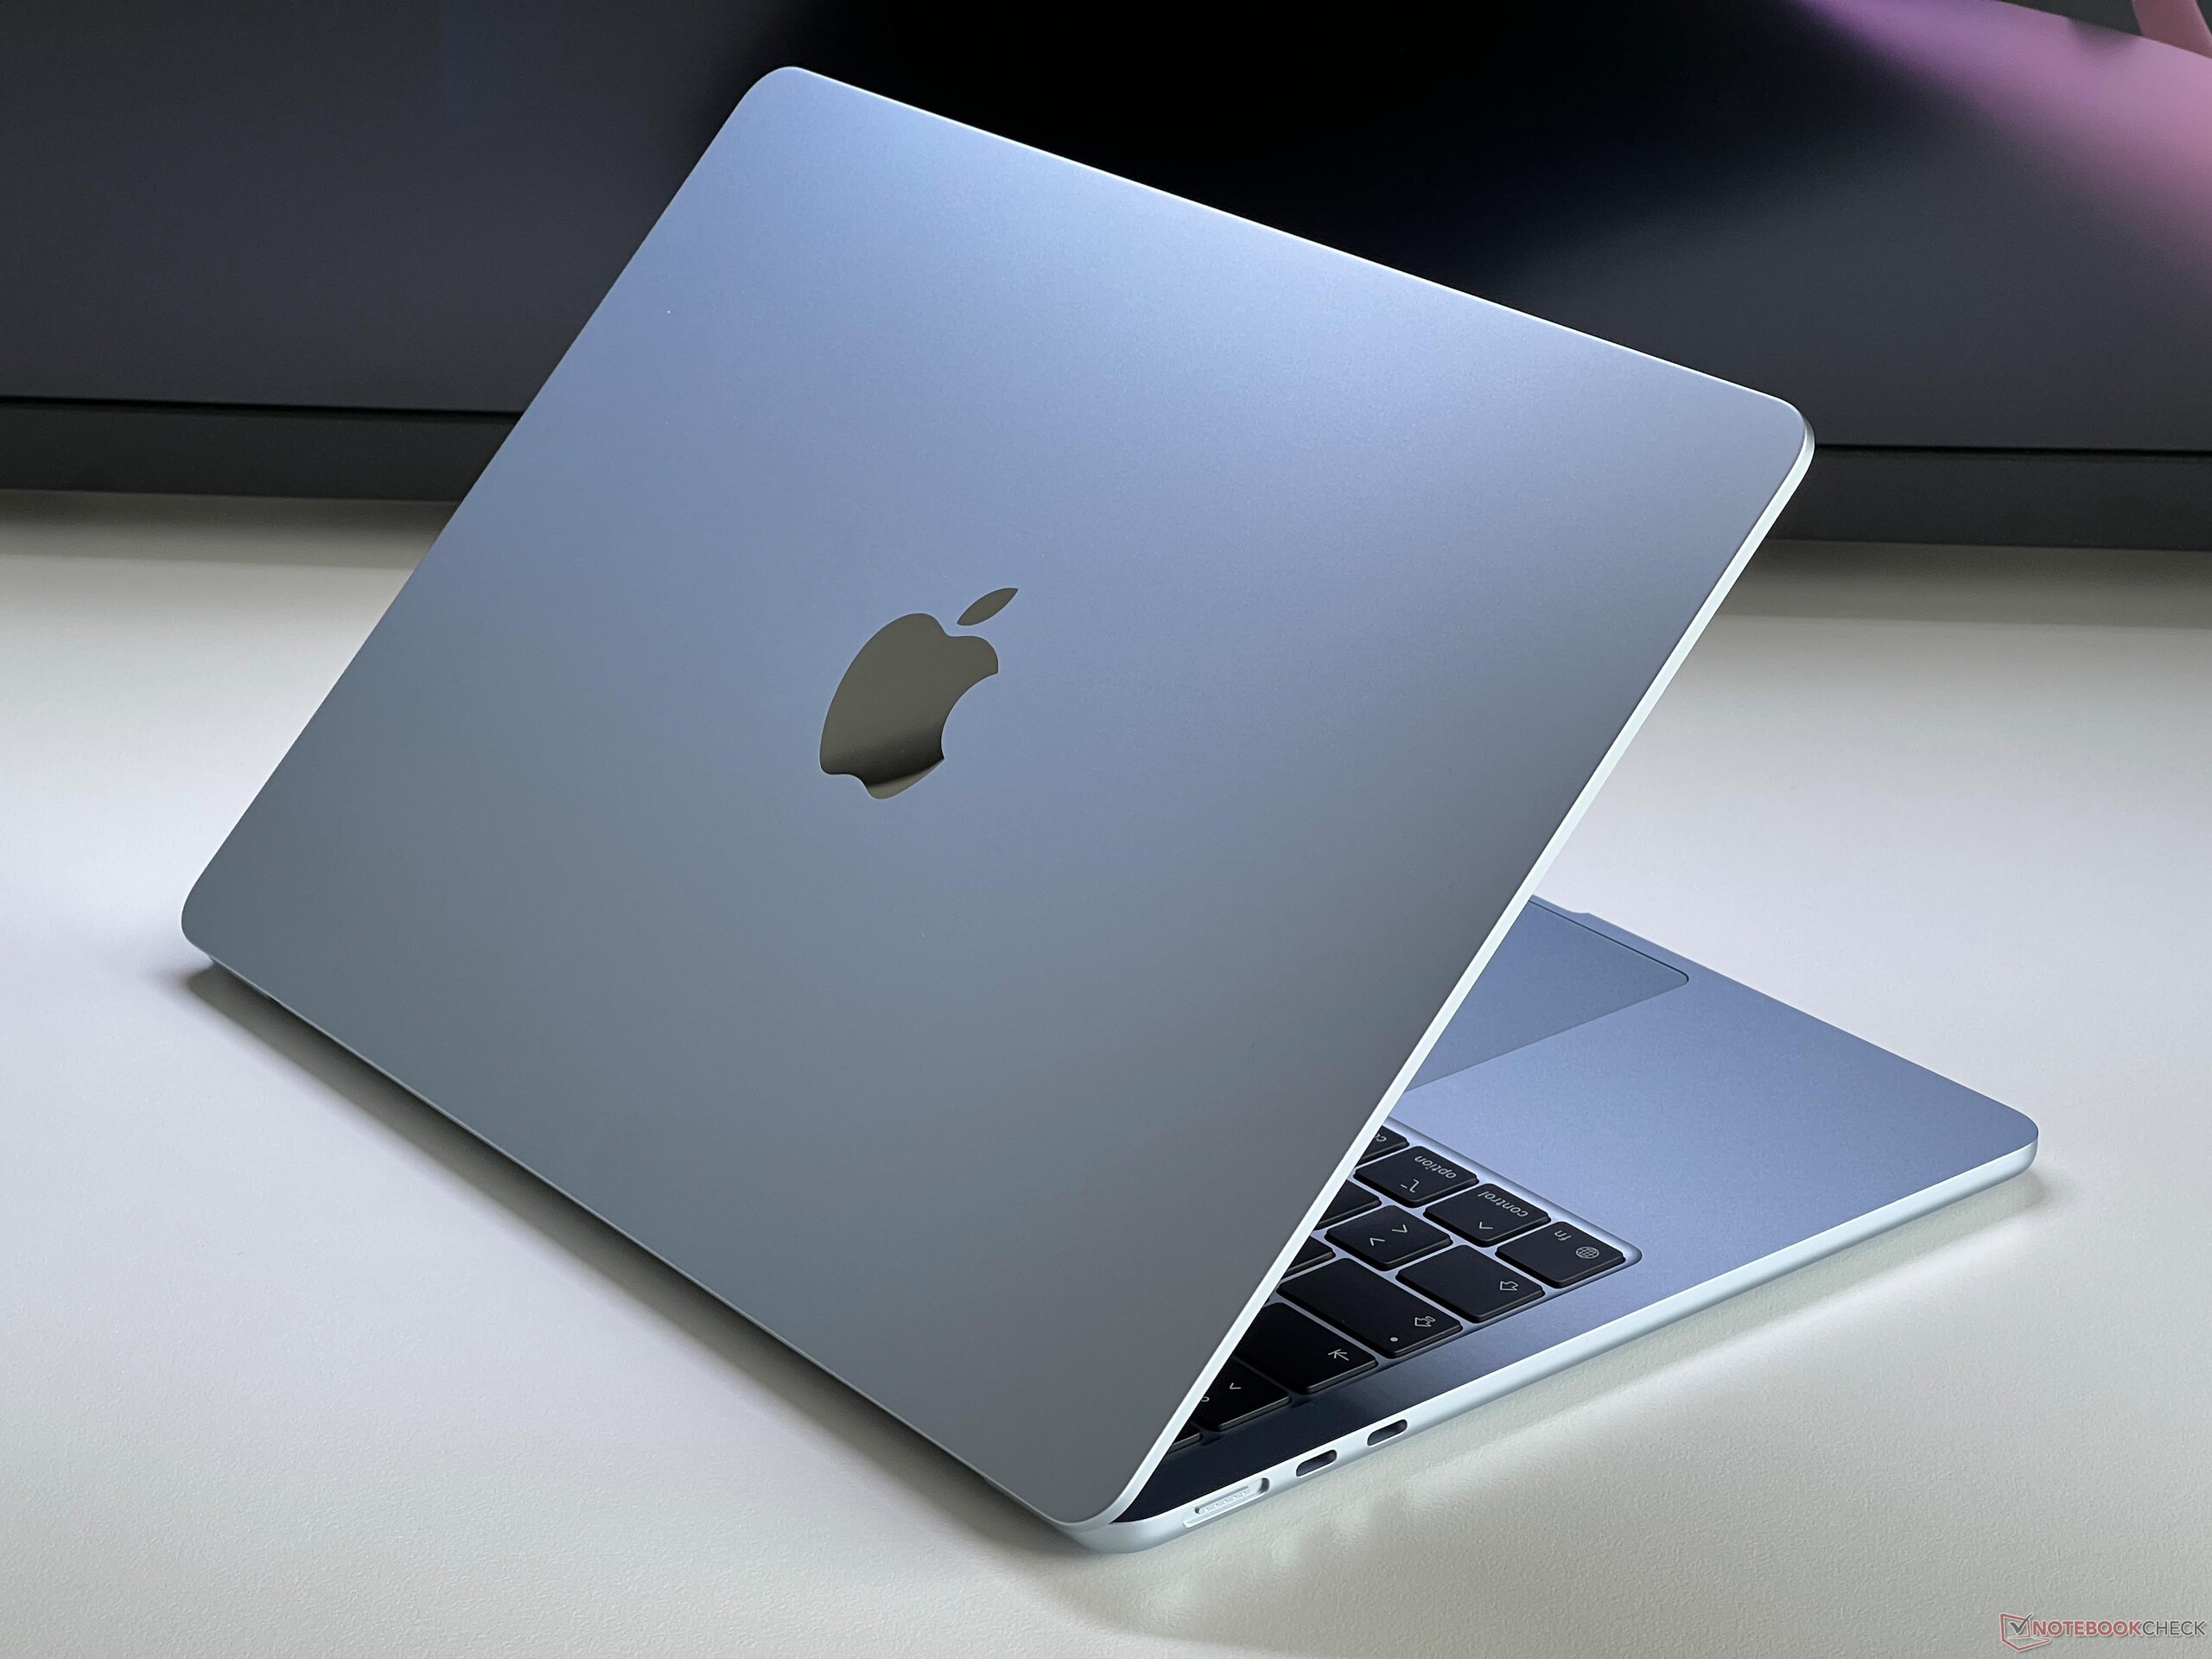
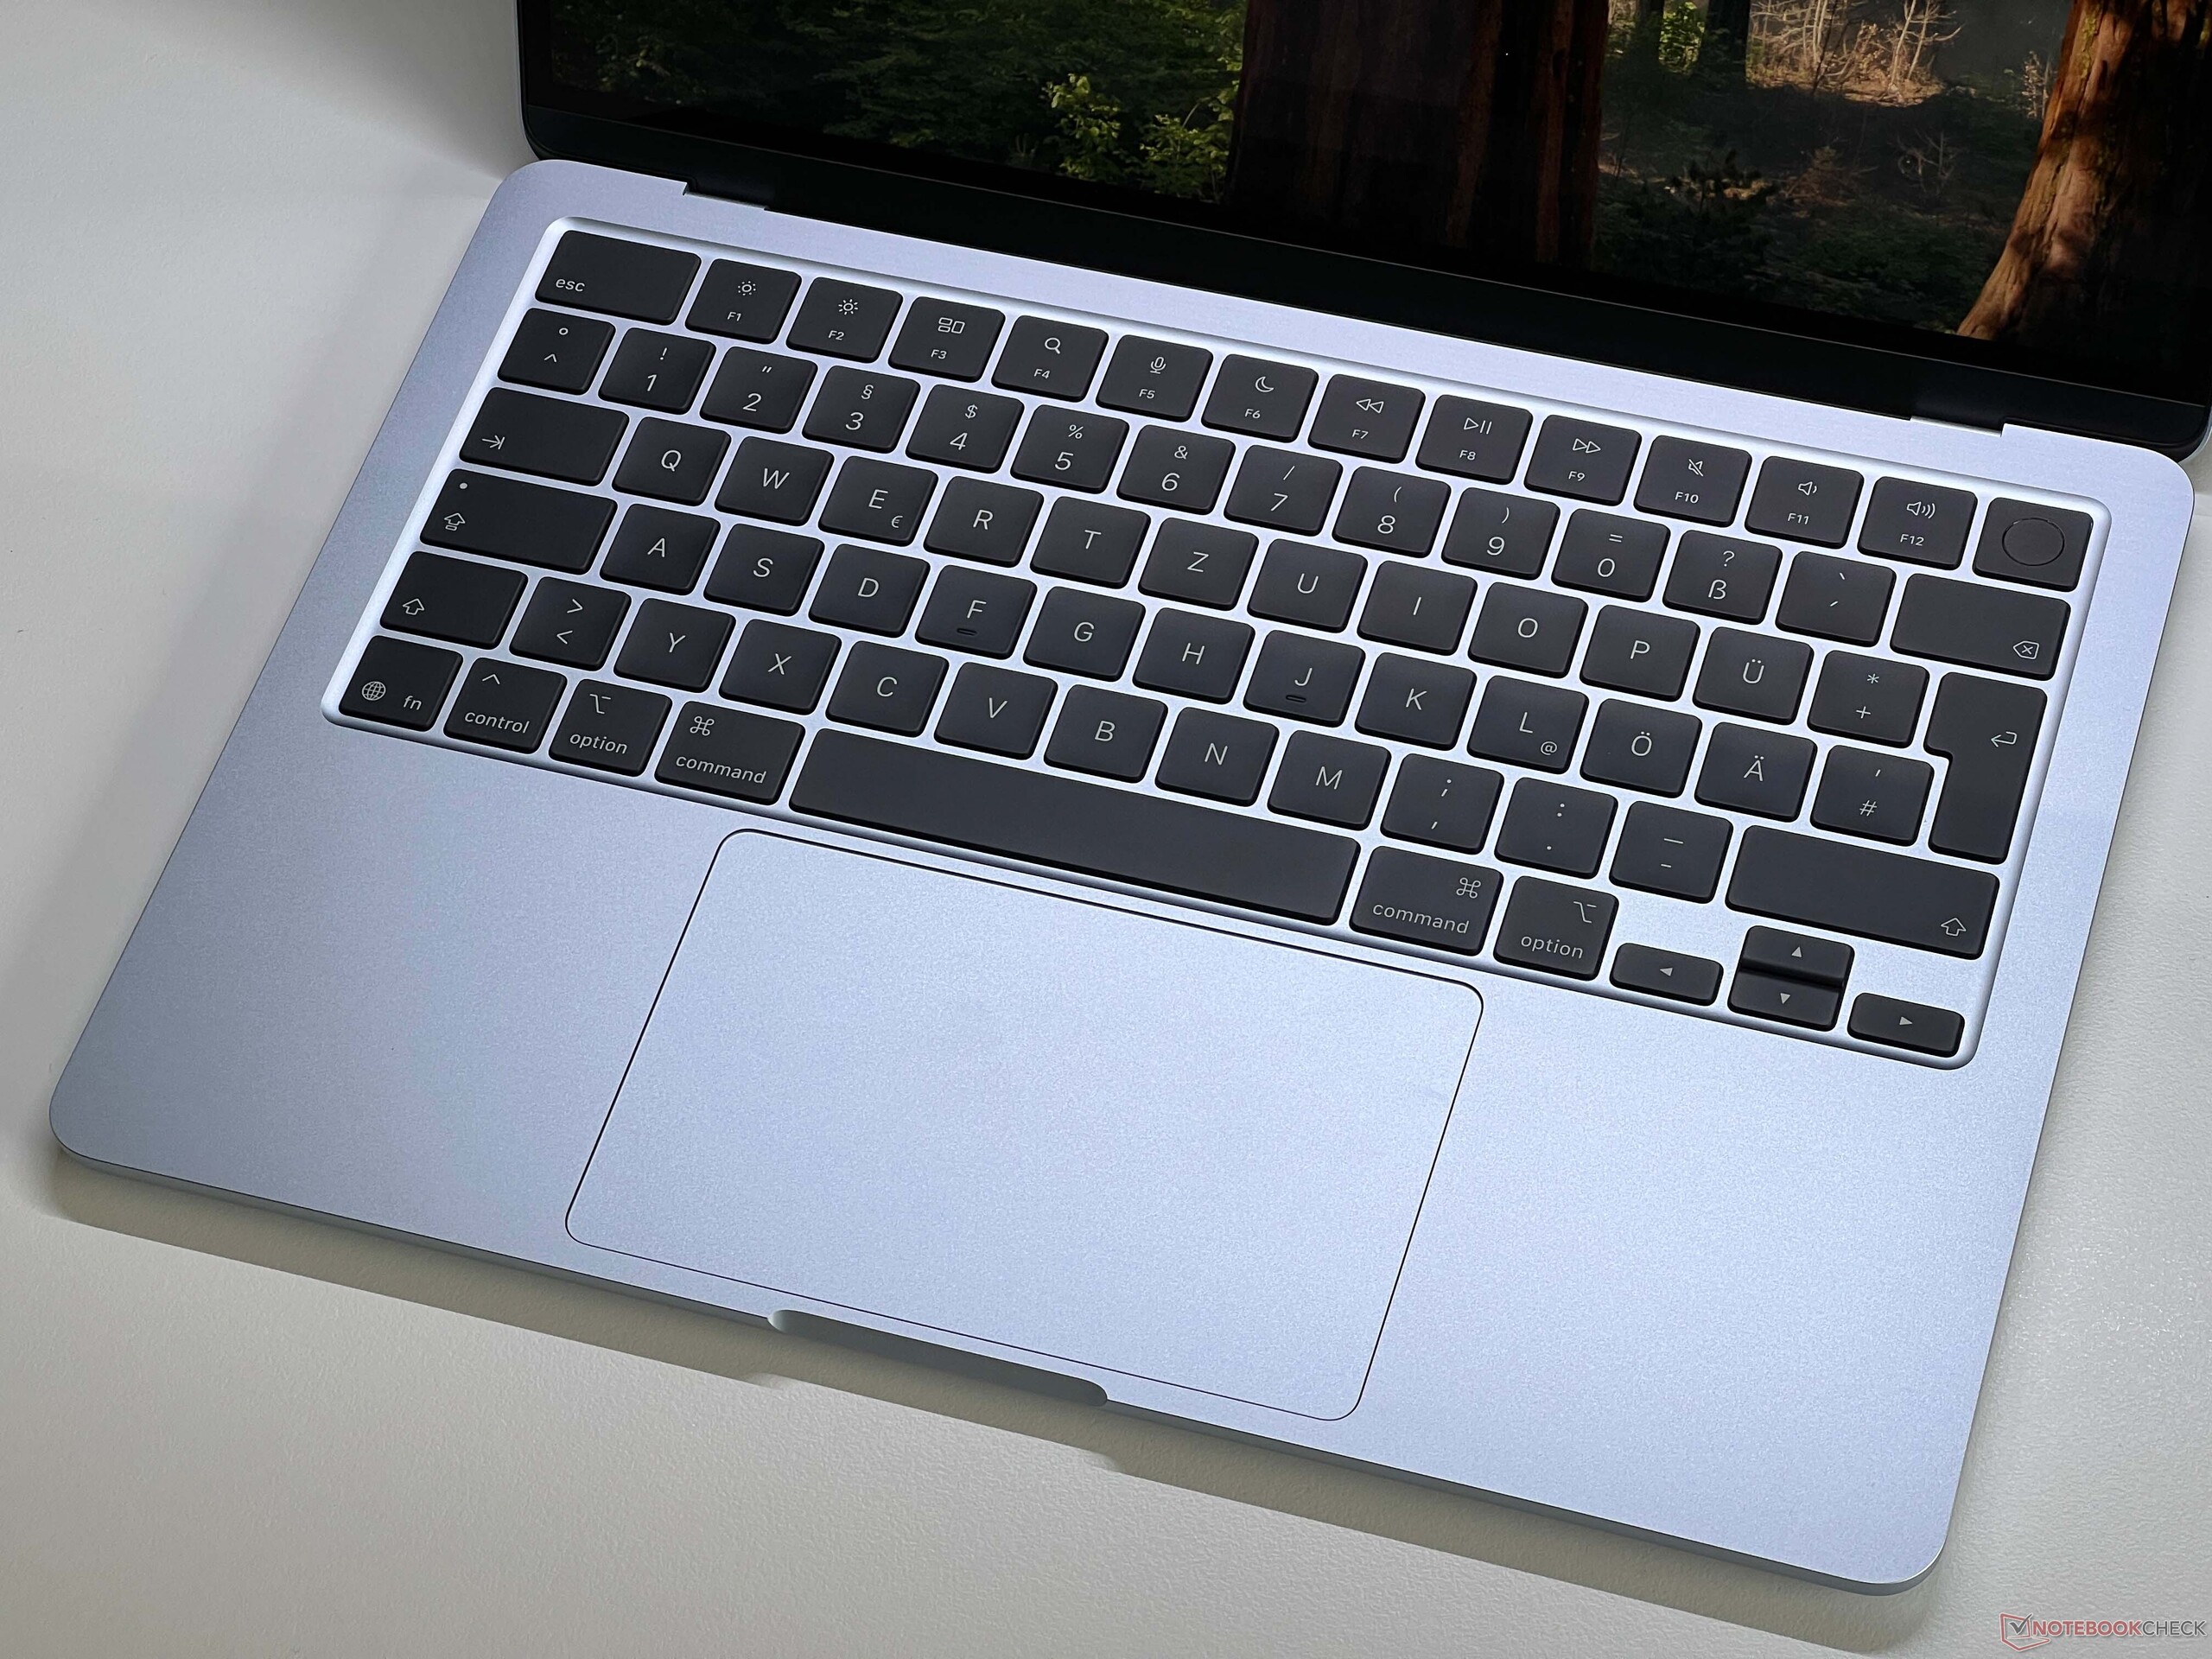
包括输入设备在内的机箱设计与上一代机型相同 前代机型尽管 Air 1.xx 千克的重量仍略高于某些竞争对手,但它仍然采用了非常纤薄的铝合金一体成型机身。Apple 修正了我们对 Wi-Fi 的批评,现在 Air 通过Apple 自己的 N1 芯片支持最新的 Wi-Fi 7,包括蓝牙 6.0。不过,在我们的标准化 Wi-Fi 测试中,Air 的表现并不完全一致,结果可能会更好,但对日常使用的影响可以忽略不计。以下图片来自上一代机型。

| Networking | |
| Apple MacBook Air 13 M5 | |
| iperf3 transmit AXE11000 | |
| iperf3 receive AXE11000 | |
| MSI Prestige 13 AI Plus Evo A2VMG | |
| iperf3 transmit AXE11000 | |
| iperf3 receive AXE11000 | |
| iperf3 transmit AXE11000 6GHz | |
| iperf3 receive AXE11000 6GHz | |
| Dell XPS 13 9350 | |
| iperf3 transmit AXE11000 | |
| iperf3 receive AXE11000 | |
| iperf3 transmit AXE11000 6GHz | |
| iperf3 receive AXE11000 6GHz | |
| Microsoft Surface Laptop 7 13.8 Copilot+ | |
| iperf3 transmit AXE11000 | |
| iperf3 receive AXE11000 | |
| iperf3 transmit AXE11000 6GHz | |
| iperf3 receive AXE11000 6GHz | |


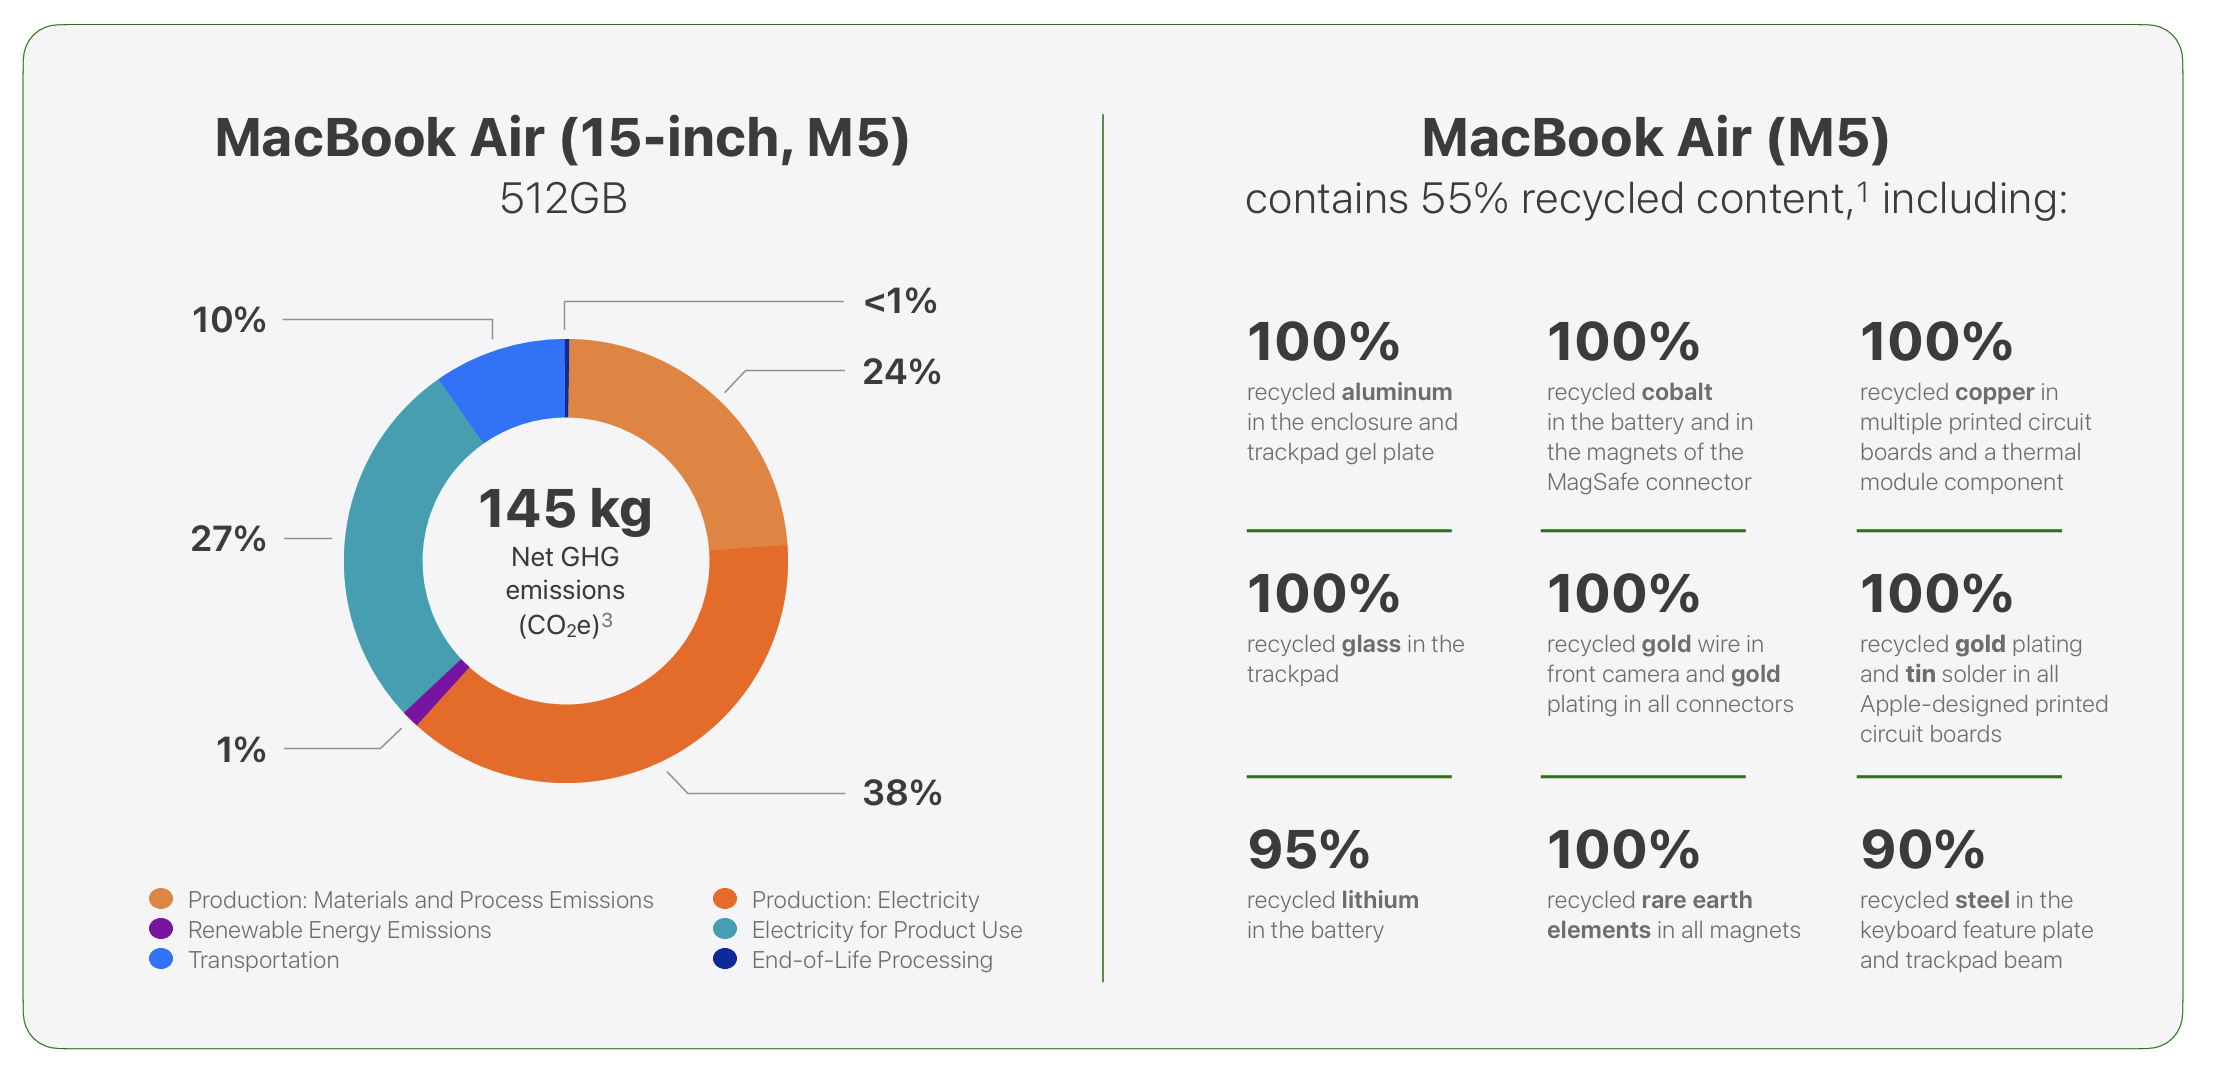
可持续性
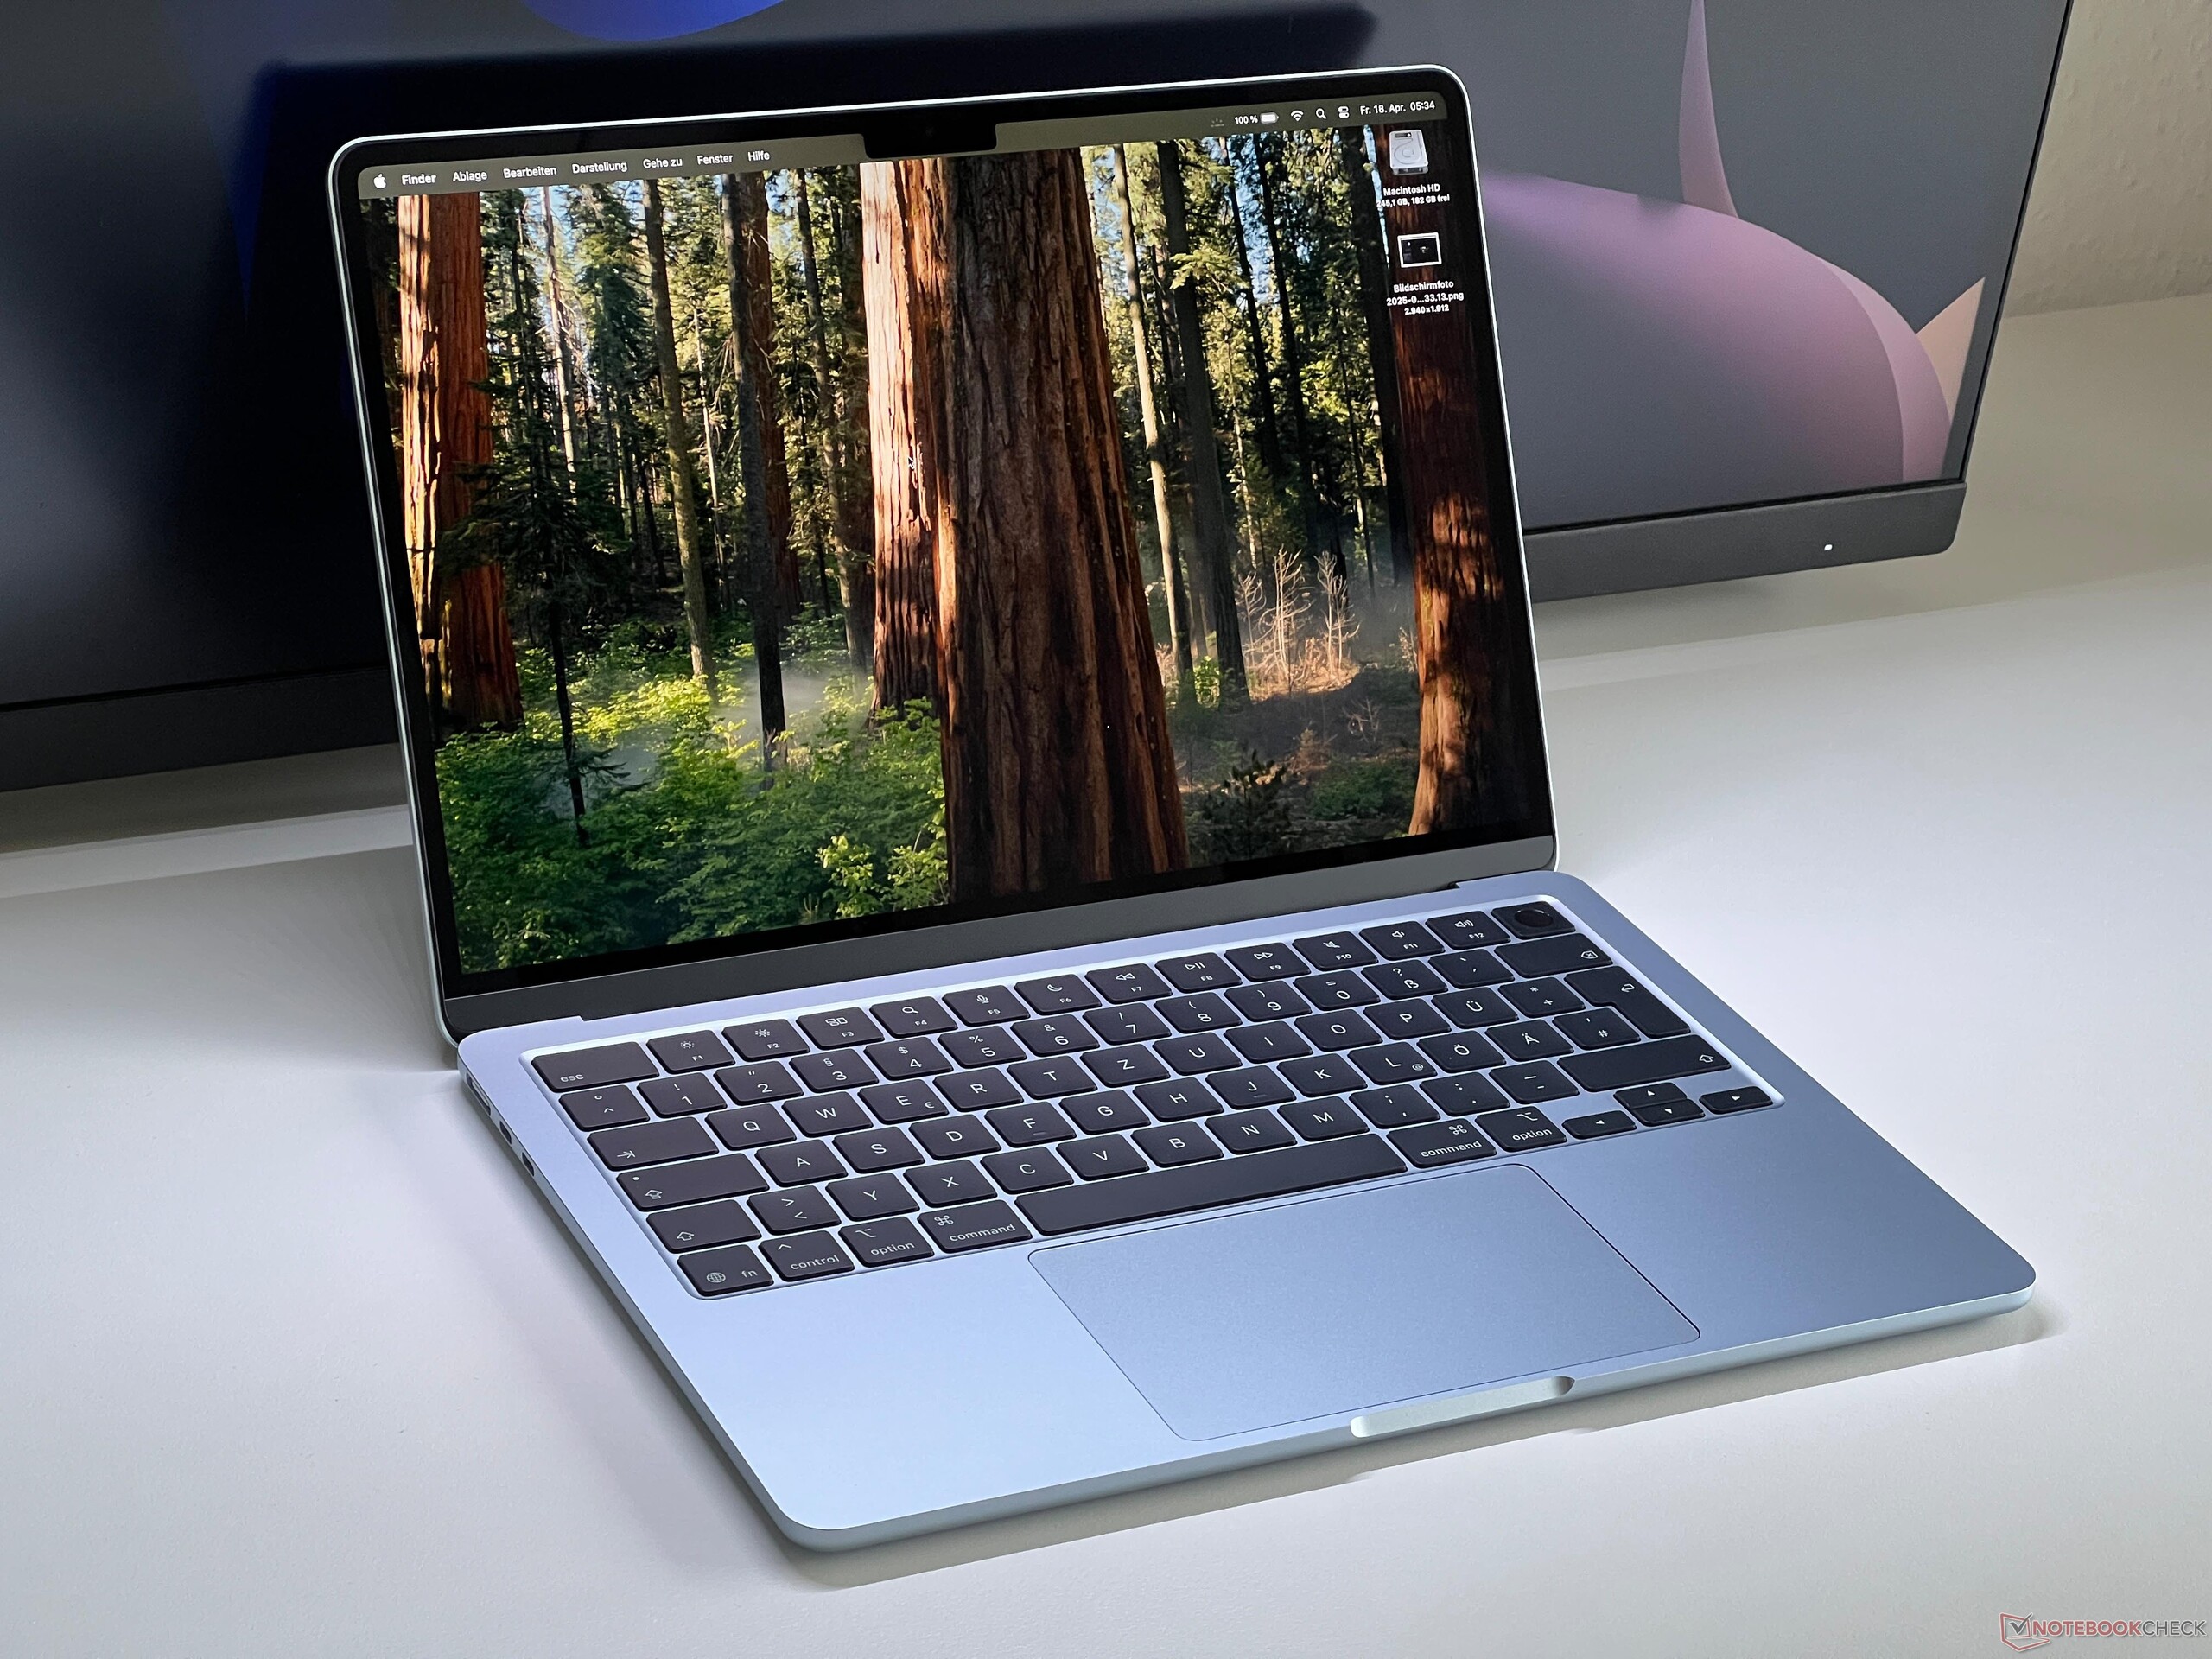
显示屏 - 仍为 60 Hz IPS
Apple 由于没有改变显示屏,因此我们仍然可以获得一块 60 Hz 的 IPS 屏幕(2560 x 1664 像素,16:10),并提供良好的图像质量,但低频是一个问题。屏幕表面具有防反射功能,与其他大多数亮面屏幕相比具有明显的优势,这一点在下面的户外拍摄中也很明显。几乎没有背光出血现象,也没有 PWM 闪烁,同时响应时间也不明显。亮度和色温都可以自动调节。
亮度仍在 500 尼特以内,但黑色值稍高,为 0.38,最大对比度约为 1300:1。我们使用专业的 CalMAN 软件进行分析后发现,出厂时的校准效果并不是很好,有明显的蓝色情况,同时色温偏冷。这提升了最大亮度,在使用 True Tone 时并不明显,但对于图片编辑来说并不理想。我们对面板进行了校准,明显提高了精确度(可在下面的框中免费下载相应的配置文件),因此图片编辑不成问题(P3 和 sRGB)。
| |||||||||||||||||||||||||
Brightness Distribution: 90 %
Center on Battery: 546 cd/m²
Contrast: 1437:1 (Black: 0.38 cd/m²)
ΔE ColorChecker Calman: 2.1 | ∀{0.5-29.43 Ø4.72}
calibrated: 0.9
ΔE Greyscale Calman: 3.3 | ∀{0.09-98 Ø4.97}
86.8% AdobeRGB 1998 (Argyll 3D)
98.6% sRGB (Argyll 3D)
98.1% Display P3 (Argyll 3D)
Gamma: 2.22
CCT: 7127 K
| Apple MacBook Air 13 M5 IPS, 2560x1664, 13.6", 60 Hz | Apple MacBook Air 13 M4 Entry IPS, 2560x1664, 13.6", 60 Hz | MSI Prestige 13 AI Plus Evo A2VMG ATNA33AA07-0, OLED, 2880x1800, 13.3", 60 Hz | Dell XPS 13 9350 LG Philips 134WU2, IPS, 1920x1200, 13.4", 120 Hz | Microsoft Surface Laptop 7 13.8 Copilot+ LQ138P1JX61, IPS, 2304x1536, 13.8", 120 Hz | |
|---|---|---|---|---|---|
| Display | 1% | 4% | -17% | 0% | |
| Display P3 Coverage (%) | 98.1 | 98.4 0% | 99.9 2% | 67.3 -31% | 97.8 0% |
| sRGB Coverage (%) | 98.6 | 99.9 1% | 100 1% | 99 0% | 98.2 0% |
| AdobeRGB 1998 Coverage (%) | 86.8 | 87.9 1% | 95.8 10% | 68.6 -21% | 87.3 1% |
| Response Times | -64% | 89% | -65% | -39% | |
| Response Time Grey 50% / Grey 80% * (ms) | 24.3 ? | 34.5 ? -42% | 1.94 ? 92% | 37.3 ? -53% | 38.9 ? -60% |
| Response Time Black / White * (ms) | 14.7 ? | 27.2 ? -85% | 2.02 ? 86% | 25.9 ? -76% | 17.4 ? -18% |
| PWM Frequency (Hz) | 60 ? | ||||
| PWM Amplitude * (%) | 21.9 | ||||
| Screen | 9% | -9% | 26% | 17% | |
| Brightness middle (cd/m²) | 546 | 525 -4% | 382.4 -30% | 462.8 -15% | 606 11% |
| Brightness (cd/m²) | 519 | 506 -3% | 383 -26% | 435 -16% | 592 14% |
| Brightness Distribution (%) | 90 | 92 2% | 99 10% | 87 -3% | 94 4% |
| Black Level * (cd/m²) | 0.38 | 0.42 -11% | 0.19 50% | 0.43 -13% | |
| Contrast (:1) | 1437 | 1250 -13% | 2436 70% | 1409 -2% | |
| Colorchecker dE 2000 * | 2.1 | 1.4 33% | 3.84 -83% | 1.92 9% | 1.3 38% |
| Colorchecker dE 2000 max. * | 4 | 2.8 30% | 6.66 -67% | 3.45 14% | 2.1 47% |
| Colorchecker dE 2000 calibrated * | 0.9 | 0.41 54% | 0.48 47% | ||
| Greyscale dE 2000 * | 3.3 | 2 39% | 0.7 79% | 0.6 82% | 2.1 36% |
| Gamma | 2.22 99% | 2.2 100% | 2.23 99% | 2.19 100% | 2.16 102% |
| CCT | 7127 91% | 6876 95% | 6475 100% | 6539 99% | 6842 95% |
| Total Average (Program / Settings) | -18% /
-4% | 28% /
11% | -19% /
4% | -7% /
4% |
* ... smaller is better


Display Response Times
| ↔ Response Time Black to White | ||
|---|---|---|
| 14.7 ms ... rise ↗ and fall ↘ combined | ↗ 5.1 ms rise | 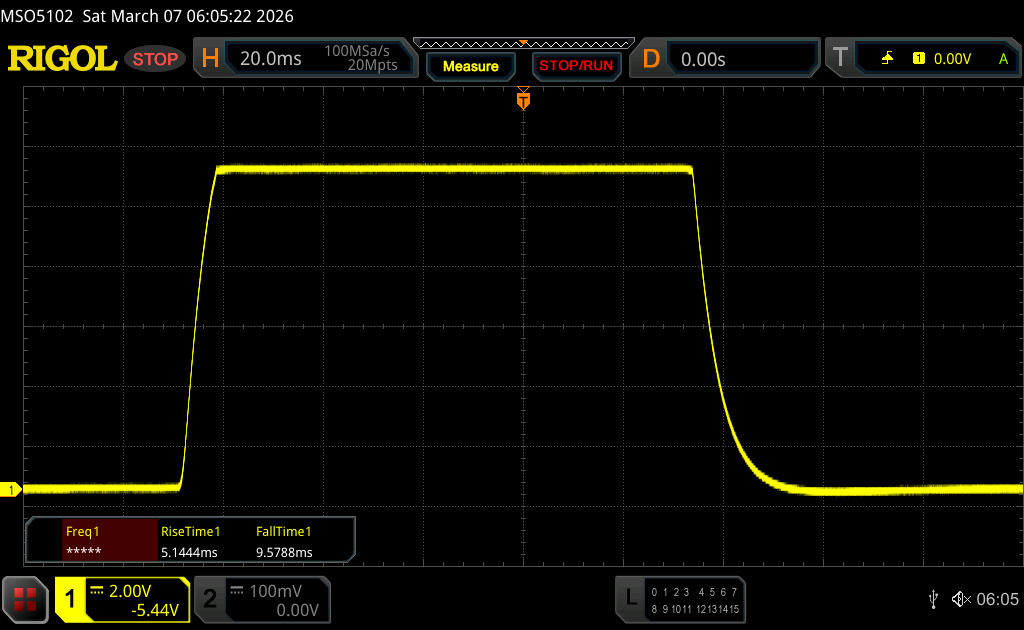 |
| ↘ 9.6 ms fall | ||
| The screen shows good response rates in our tests, but may be too slow for competitive gamers. In comparison, all tested devices range from 0.1 (minimum) to 240 (maximum) ms. » 36 % of all devices are better. This means that the measured response time is better than the average of all tested devices (19.8 ms). | ||
| ↔ Response Time 50% Grey to 80% Grey | ||
| 24.3 ms ... rise ↗ and fall ↘ combined | ↗ 11.5 ms rise | 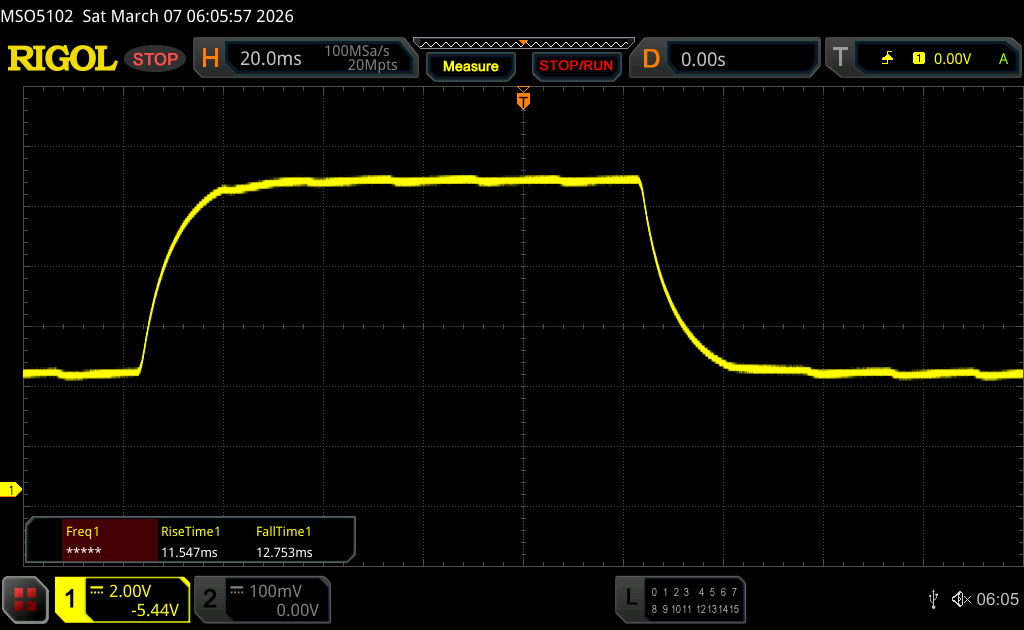 |
| ↘ 12.8 ms fall | ||
| The screen shows good response rates in our tests, but may be too slow for competitive gamers. In comparison, all tested devices range from 0.165 (minimum) to 636 (maximum) ms. » 35 % of all devices are better. This means that the measured response time is better than the average of all tested devices (31 ms). | ||
Screen Flickering / PWM (Pulse-Width Modulation)
| Screen flickering / PWM not detected | 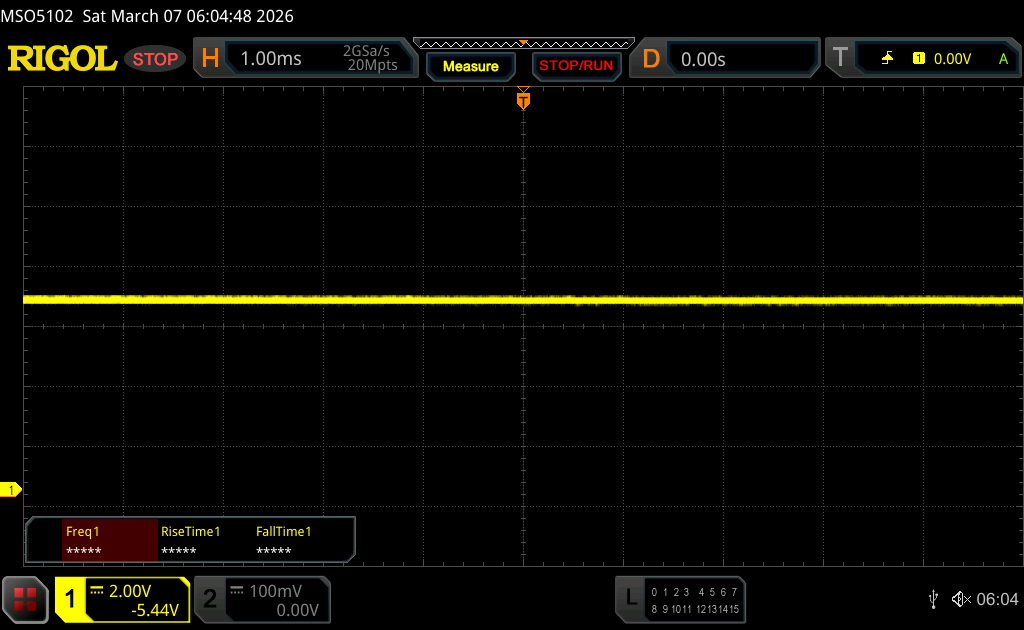 | ||
In comparison: 52 % of all tested devices do not use PWM to dim the display. If PWM was detected, an average of 7747 (minimum: 5 - maximum: 343500) Hz was measured. | |||


性能 - M5 效能超群
新款 MacBook Air 13 M5 的基本型号有 10 个 CPU 内核、8 个 GPU 内核、16 GB 内存和 512 GB SSD 存储空间。你可以升级到速度更快的 10 核 GPU 版本、最多 32 GB 内存和最多 4 TB SSD 存储空间。
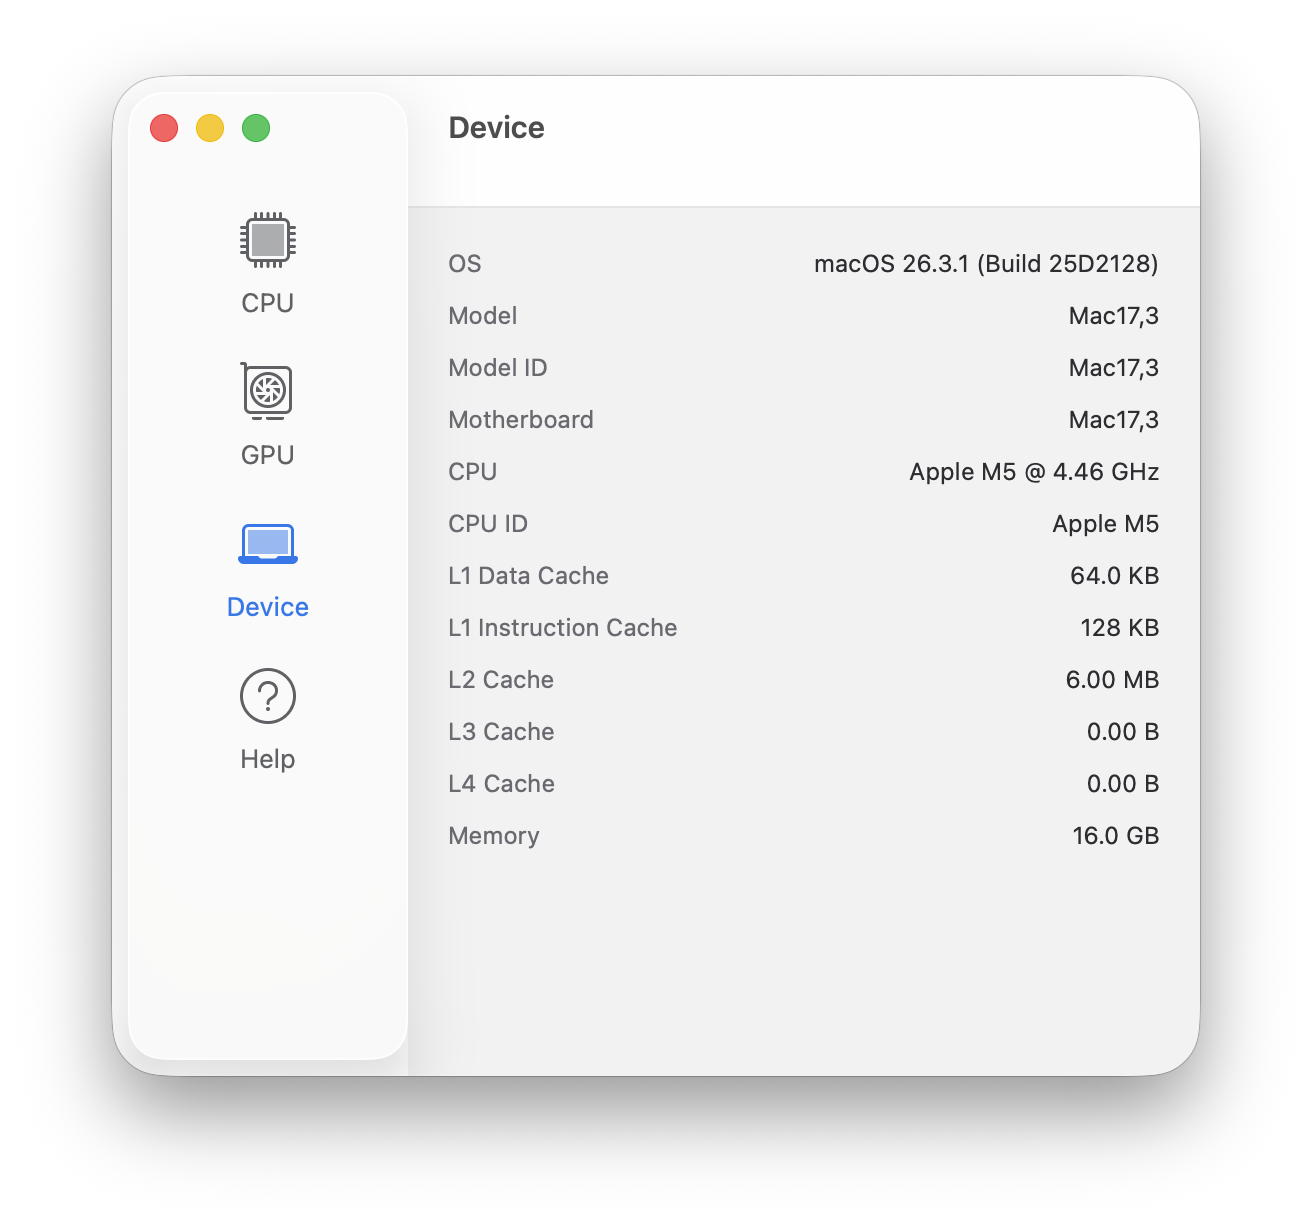
处理器
新款Apple M5(4 个超级内核、6 个效率内核)的 CPU 性能非常惊人,是目前能买到的最快的单核处理器,而且速度还相当快。多核性能也非常出色,尽管系统必须很快降低功耗限制。在 Cinebench 2024 多核测试中,与配备主动散热系统的 MacBook Pro 14 M5 相比,功耗只下降了 18%。经过 CB24 Multi 压力测试(30 分钟)后,在 9 瓦的情况下,结果仍为 820 分。在电池供电情况下,CPU 性能并未降低。
Cinebench 2024: CPU Multi Core | CPU Single Core
Geekbench 6.7: Multi-Core | Single-Core
| CPU Performance rating | |
| Apple MacBook Pro 14 2025 M5 | |
| Average Apple M5 10-Core | |
| Apple MacBook Air 13 M5 | |
| Apple MacBook Air 13 M4 Entry | |
| Microsoft Surface Laptop 7 13.8 Copilot+ | |
| Apple MacBook Air 13 M3 8C GPU | |
| Average of class Subnotebook | |
| MSI Prestige 13 AI Plus Evo A2VMG | |
| Dell XPS 13 9350 | |
| Cinebench 2024 / CPU Multi Core | |
| Apple MacBook Pro 14 2025 M5 | |
| Average Apple M5 10-Core (957 - 1172, n=3) | |
| Apple MacBook Air 13 M5 | |
| Microsoft Surface Laptop 7 13.8 Copilot+ | |
| Apple MacBook Air 13 M4 Entry | |
| Average of class Subnotebook (148 - 1471, n=66, last 2 years) | |
| MSI Prestige 13 AI Plus Evo A2VMG | |
| Apple MacBook Air 13 M3 8C GPU | |
| Dell XPS 13 9350 | |
| Cinebench 2024 / CPU Single Core | |
| Apple MacBook Pro 14 2025 M5 | |
| Apple MacBook Air 13 M5 | |
| Average Apple M5 10-Core (199 - 200, n=3) | |
| Apple MacBook Air 13 M4 Entry | |
| Apple MacBook Air 13 M3 8C GPU | |
| Microsoft Surface Laptop 7 13.8 Copilot+ | |
| Average of class Subnotebook (35 - 200, n=55, last 2 years) | |
| Dell XPS 13 9350 | |
| MSI Prestige 13 AI Plus Evo A2VMG | |
| Geekbench 6.7 / Multi-Core | |
| Apple MacBook Pro 14 2025 M5 | |
| Average Apple M5 10-Core (16544 - 18054, n=5) | |
| Apple MacBook Air 13 M5 | |
| Apple MacBook Air 13 M4 Entry | |
| Microsoft Surface Laptop 7 13.8 Copilot+ | |
| Average of class Subnotebook (2244 - 20325, n=63, last 2 years) | |
| Apple MacBook Air 13 M3 8C GPU | |
| MSI Prestige 13 AI Plus Evo A2VMG | |
| Dell XPS 13 9350 | |
| Geekbench 6.7 / Single-Core | |
| Apple MacBook Pro 14 2025 M5 | |
| Average Apple M5 10-Core (4128 - 4326, n=5) | |
| Apple MacBook Air 13 M5 | |
| Apple MacBook Air 13 M4 Entry | |
| Apple MacBook Air 13 M3 8C GPU | |
| Microsoft Surface Laptop 7 13.8 Copilot+ | |
| Average of class Subnotebook (960 - 4195, n=62, last 2 years) | |
| Dell XPS 13 9350 | |
| MSI Prestige 13 AI Plus Evo A2VMG | |
系统性能
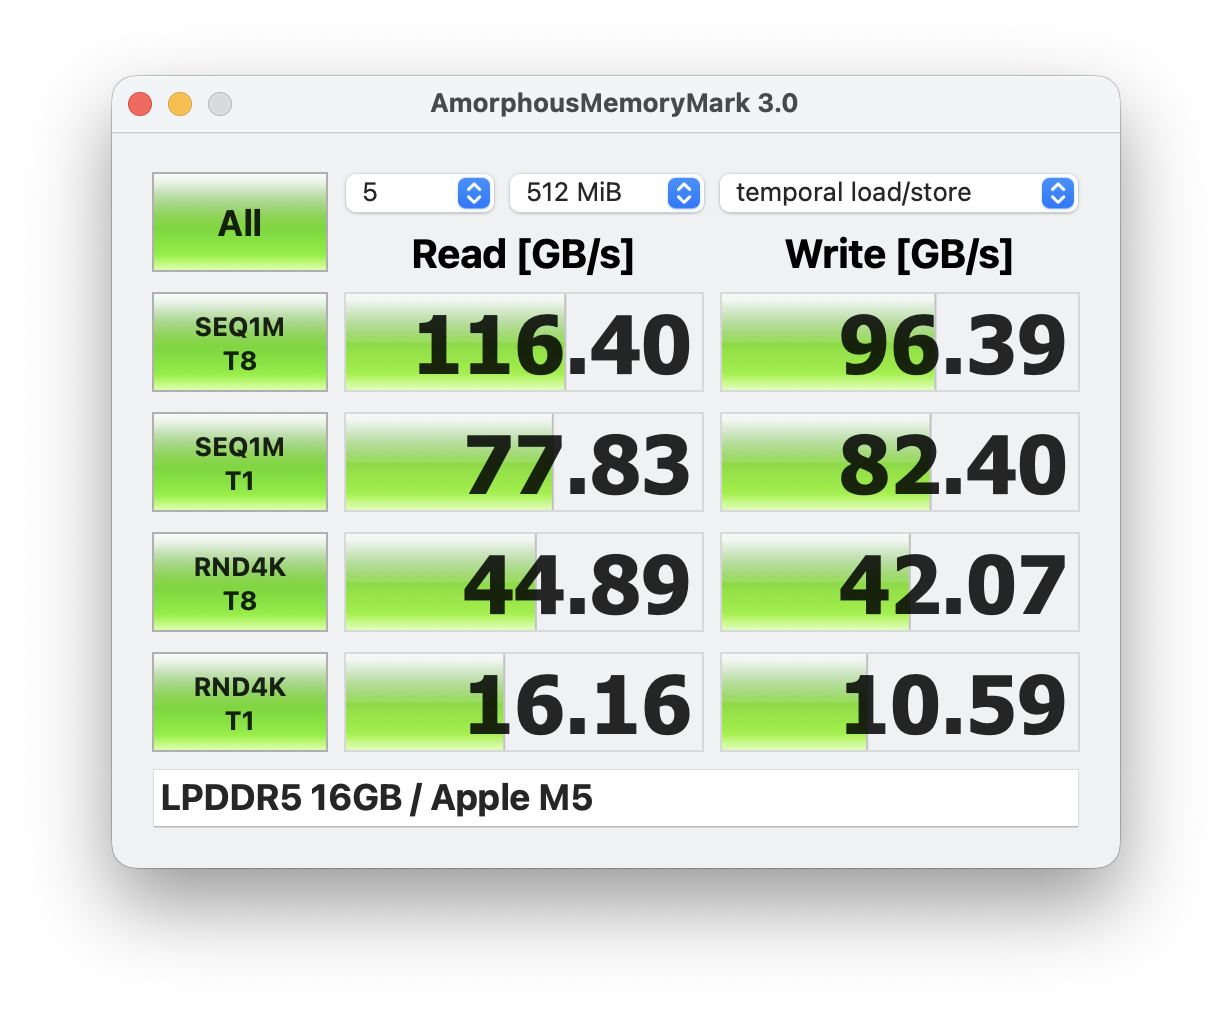
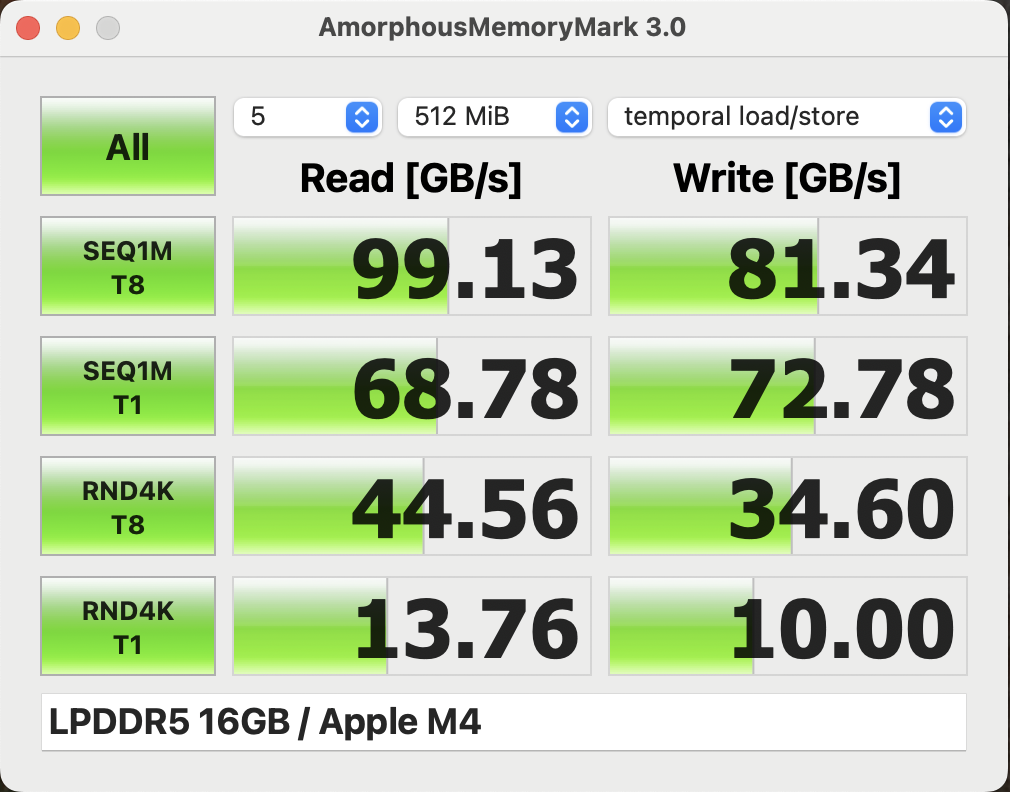
Apple 还比 M4 增加了内存带宽。总的来说,在日常使用中,你不会发现与更昂贵的 MacBook Pro 机型相比有什么不同。
CrossMark: Overall | Productivity | Creativity | Responsiveness
WebXPRT 3: Overall
WebXPRT 4: Overall
Mozilla Kraken 1.1: Total
| Performance rating | |
| Apple MacBook Pro 14 2025 M5 | |
| Apple MacBook Air 13 M5 | |
| Average Apple M5 10-Core, Apple M5 8-Core GPU | |
| Apple MacBook Air 13 M4 Entry | |
| Microsoft Surface Laptop 7 13.8 Copilot+ | |
| Dell XPS 13 9350 | |
| MSI Prestige 13 AI Plus Evo A2VMG | |
| Average of class Subnotebook | |
| CrossMark / Overall | |
| Apple MacBook Pro 14 2025 M5 | |
| Apple MacBook Air 13 M5 | |
| Average Apple M5 10-Core, Apple M5 8-Core GPU (n=1) | |
| Apple MacBook Air 13 M4 Entry | |
| Dell XPS 13 9350 | |
| MSI Prestige 13 AI Plus Evo A2VMG | |
| Average of class Subnotebook (365 - 2356, n=60, last 2 years) | |
| Microsoft Surface Laptop 7 13.8 Copilot+ | |
| CrossMark / Productivity | |
| Apple MacBook Pro 14 2025 M5 | |
| Apple MacBook Air 13 M5 | |
| Average Apple M5 10-Core, Apple M5 8-Core GPU (n=1) | |
| Apple MacBook Air 13 M4 Entry | |
| Dell XPS 13 9350 | |
| MSI Prestige 13 AI Plus Evo A2VMG | |
| Average of class Subnotebook (364 - 2277, n=60, last 2 years) | |
| Microsoft Surface Laptop 7 13.8 Copilot+ | |
| CrossMark / Creativity | |
| Apple MacBook Pro 14 2025 M5 | |
| Apple MacBook Air 13 M5 | |
| Average Apple M5 10-Core, Apple M5 8-Core GPU (n=1) | |
| Apple MacBook Air 13 M4 Entry | |
| MSI Prestige 13 AI Plus Evo A2VMG | |
| Dell XPS 13 9350 | |
| Average of class Subnotebook (372 - 2743, n=60, last 2 years) | |
| Microsoft Surface Laptop 7 13.8 Copilot+ | |
| CrossMark / Responsiveness | |
| Apple MacBook Pro 14 2025 M5 | |
| Apple MacBook Air 13 M5 | |
| Average Apple M5 10-Core, Apple M5 8-Core GPU (n=1) | |
| Apple MacBook Air 13 M4 Entry | |
| Average of class Subnotebook (312 - 1854, n=60, last 2 years) | |
| Dell XPS 13 9350 | |
| Microsoft Surface Laptop 7 13.8 Copilot+ | |
| MSI Prestige 13 AI Plus Evo A2VMG | |
| WebXPRT 3 / Overall | |
| Apple MacBook Pro 14 2025 M5 | |
| Apple MacBook Air 13 M5 | |
| Average Apple M5 10-Core, Apple M5 8-Core GPU (n=1) | |
| Apple MacBook Air 13 M4 Entry | |
| Microsoft Surface Laptop 7 13.8 Copilot+ | |
| Average of class Subnotebook (156 - 530, n=56, last 2 years) | |
| Dell XPS 13 9350 | |
| MSI Prestige 13 AI Plus Evo A2VMG | |
| WebXPRT 4 / Overall | |
| Apple MacBook Pro 14 2025 M5 | |
| Apple MacBook Air 13 M5 | |
| Average Apple M5 10-Core, Apple M5 8-Core GPU (n=1) | |
| Apple MacBook Air 13 M4 Entry | |
| Microsoft Surface Laptop 7 13.8 Copilot+ | |
| MSI Prestige 13 AI Plus Evo A2VMG | |
| Dell XPS 13 9350 | |
| Average of class Subnotebook (132 - 378, n=61, last 2 years) | |
| Mozilla Kraken 1.1 / Total | |
| Average of class Subnotebook (234 - 1104, n=61, last 2 years) | |
| MSI Prestige 13 AI Plus Evo A2VMG | |
| Dell XPS 13 9350 | |
| Microsoft Surface Laptop 7 13.8 Copilot+ | |
| Apple MacBook Air 13 M4 Entry | |
| Apple MacBook Air 13 M5 | |
| Average Apple M5 10-Core, Apple M5 8-Core GPU (n=1) | |
| Apple MacBook Pro 14 2025 M5 | |
* ... smaller is better
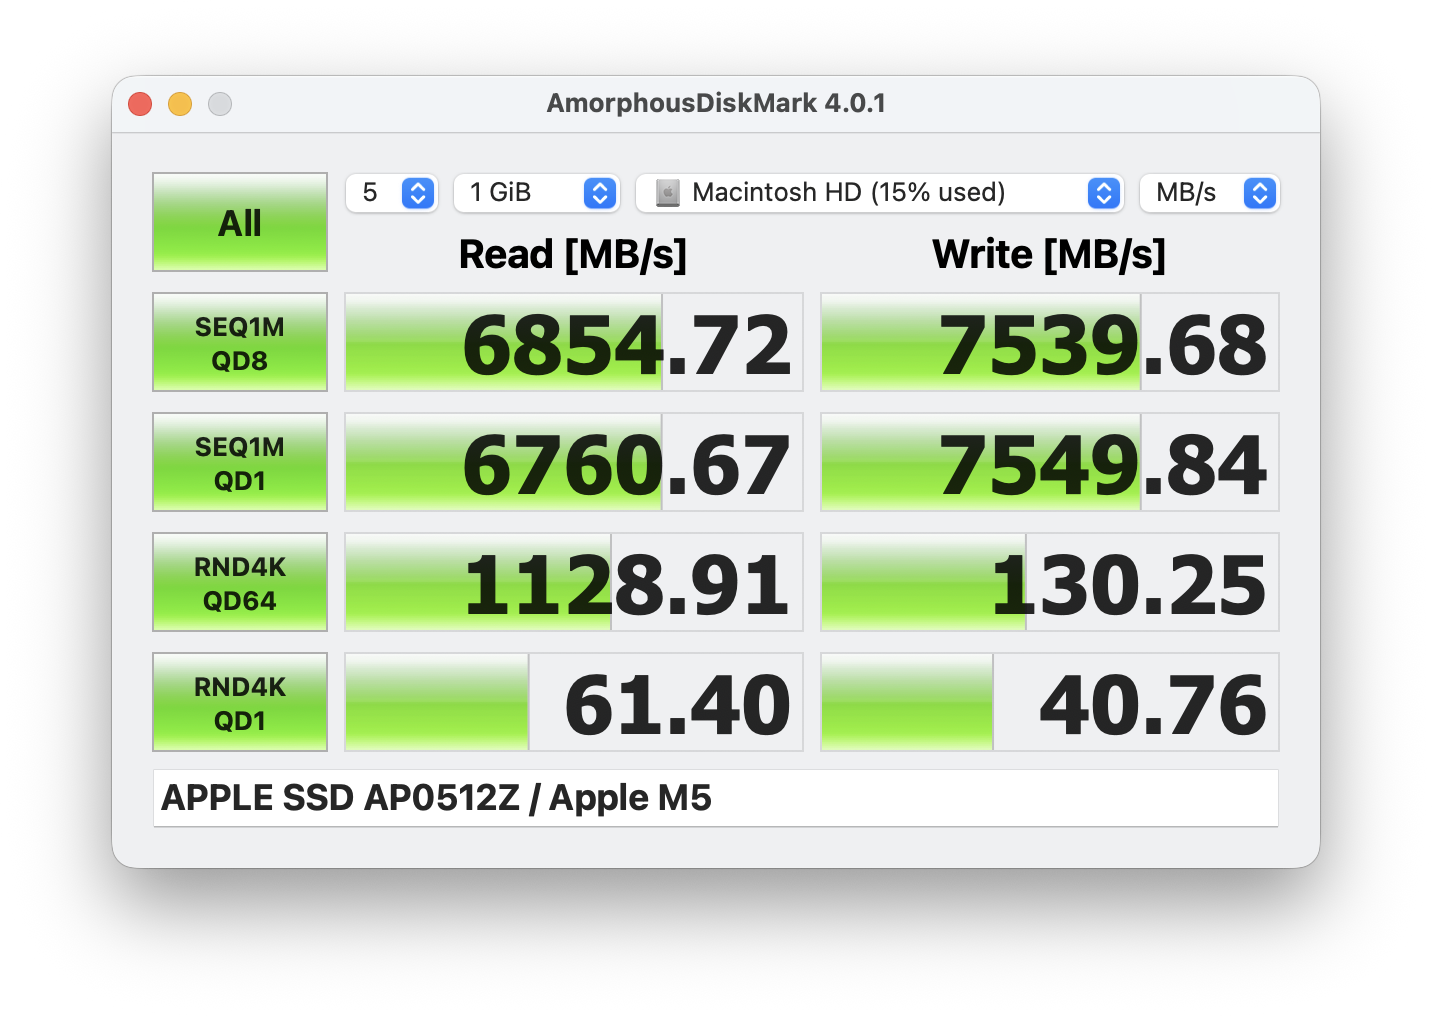
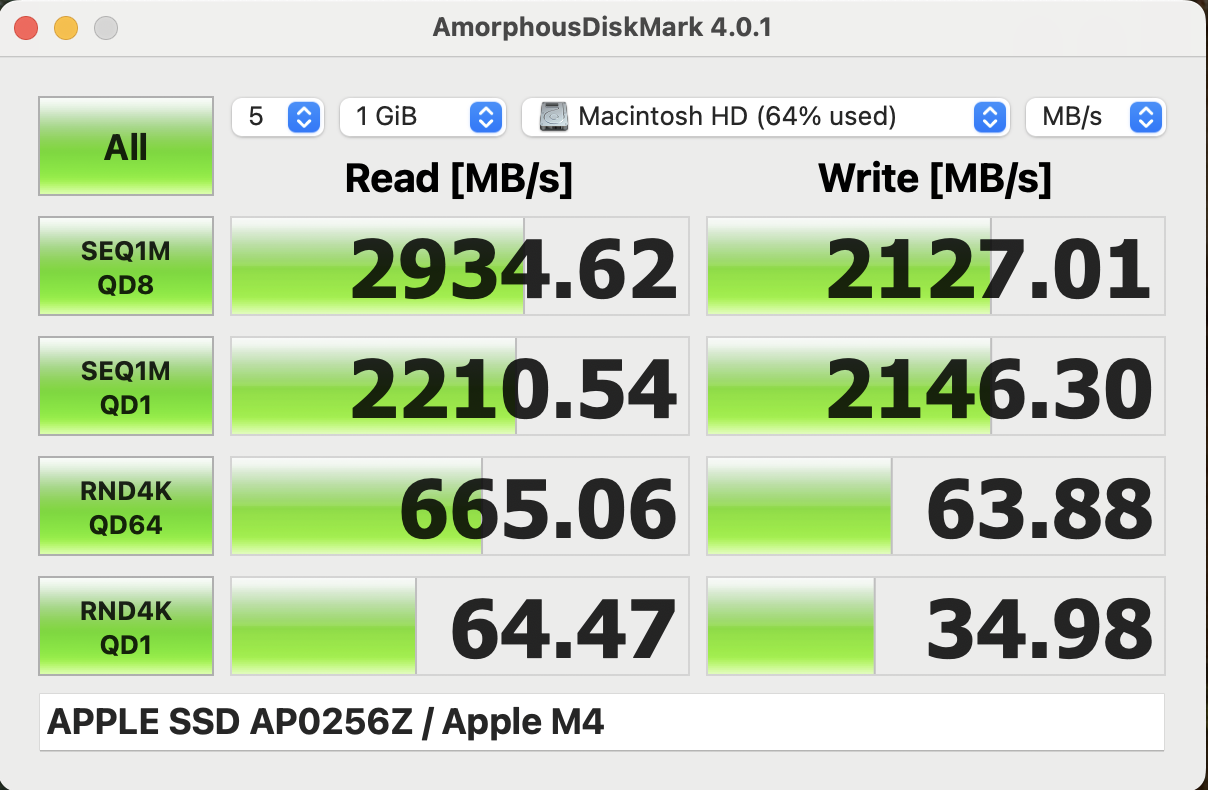
存储设备
基本机型现在默认使用 512 GB SSD 存储,速度提高到 PCIe 4.0,因此传输速率与 MacBook Pro 机型相当,约为 7 GB/s。固态硬盘也是板载的,但最大容量从 2 TB 增加到了 4 TB。
图形处理器性能
M5-SoC 的基本型号配备了 8 个 GPU 内核,最大功耗为 16.5 瓦,整体性能非常出色。与 MBP 14 M5 的 10 核 GPU 相比,性能差距在 12-20% 之间,与旧款 M4 8 核 GPU 相比,优势在 30-50% 之间,具体取决于基准测试。
在合成 3DMark 压力测试(Steel Nomad Light)中,性能下降了约 18%,但在玩游戏时情况完全不同。在我们测试的所有游戏中,SoC 的功耗都在 7-8 瓦之间,效率极高,这也意味着不会出现节流现象。我们对《赛博朋克 2077》进行了一小时的测试,1080p/Ultra 下的帧速率稳定在 19.6 fps。
| Cinebench 2024 - GPU | |
| Apple MacBook Pro 14 2025 M5 | |
| Apple MacBook Air 13 M5 | |
| Average Apple M5 8-Core GPU (n=1) | |
| Average of class Subnotebook (3574 - 6071, n=4, last 2 years) | |
| Apple MacBook Air 13 M4 Entry | |
| 3DMark Steel Nomad Score | 941 points | |
| 3DMark Steel Nomad Light Score | 4405 points | |
Help | ||
| Blender / v3.3 Classroom METAL | |
| Average of class Subnotebook (76.3 - 227, n=5, last 2 years) | |
| Apple MacBook Air 13 M4 Entry | |
| Apple MacBook Air 13 M5 | |
| Average Apple M5 8-Core GPU (n=1) | |
| Apple MacBook Pro 14 2025 M5 | |
| Blender / v3.3 Classroom CPU | |
| Microsoft Surface Laptop 7 13.8 Copilot+ | |
| Dell XPS 13 9350 | |
| MSI Prestige 13 AI Plus Evo A2VMG | |
| Average of class Subnotebook (241 - 861, n=60, last 2 years) | |
| Apple MacBook Pro 14 2025 M5 | |
| Apple MacBook Air 13 M4 Entry | |
| Apple MacBook Air 13 M5 | |
| Average Apple M5 8-Core GPU (n=1) | |
| Blender / v3.3 Classroom oneAPI/Intel | |
| Average of class Subnotebook (105 - 396, n=11, last 2 years) | |
| Dell XPS 13 9350 | |
| MSI Prestige 13 AI Plus Evo A2VMG | |
* ... smaller is better
| Cyberpunk 2077 - 1920x1080 Ultra Preset (FSR off) | |
| Apple MacBook Pro 14 2025 M5 | |
| MSI Prestige 13 AI Plus Evo A2VMG | |
| Apple MacBook Air 13 M5 | |
| Dell XPS 13 9350 | |
| Microsoft Surface Laptop 7 13.8 Copilot+ | |
| Apple MacBook Air 13 M4 Entry | |
| Baldur's Gate 3 - 1920x1080 Ultra Preset AA:T | |
| Apple MacBook Pro 14 2025 M5 | |
| MSI Prestige 13 AI Plus Evo A2VMG | |
| Apple MacBook Air 13 M5 | |
| Dell XPS 13 9350 | |
| Apple MacBook Air 13 M4 Entry | |
| Microsoft Surface Laptop 7 13.8 Copilot+ | |
| Assassin's Creed Shadows - 1920x1080 Low | |
| Apple MacBook Pro 14 2025 M5 | |
| Apple MacBook Air 13 M5 | |
| Total War Pharaoh - 1920x1080 Ultra Preset | |
| Apple MacBook Pro 14 2025 M5 | |
| Apple MacBook Air 13 M5 | |
| Apple MacBook Air 13 M4 Entry | |
| Shadow of the Tomb Raider - 1920x1080 Highest Preset AA:T | |
| Apple MacBook Pro 14 2025 M5 | |
| Apple MacBook Air 13 M5 | |
| Apple MacBook Air 13 M4 Entry | |
赛博朋克 2077》超 FPS 图表
| low | med. | high | ultra | |
|---|---|---|---|---|
| Shadow of the Tomb Raider (2018) | 87 | 45 | 42 | 38 |
| Baldur's Gate 3 (2023) | 46 | 35.1 | 29.2 | 28.5 |
| Cyberpunk 2077 (2023) | 35.8 | 27.3 | 22.8 | 19.5 |
| Total War Pharaoh (2023) | 58.8 | 54.9 | 51 | 38.1 |
| Assassin's Creed Shadows (2025) | 22 | 20 | 17 | 11 |
排放与功耗
系统噪音
MacBook Air 仍然使用无风扇散热装置,因此笔记本电脑始终保持静音,我们也没有感受到任何其他电子噪音。与 Windows 竞争对手相比,这是一个巨大的优势。
| Apple MacBook Air 13 M5 M5 10-Core, M5 8-Core GPU | MSI Prestige 13 AI Plus Evo A2VMG Core Ultra 7 258V, Arc 140V | Dell XPS 13 9350 Core Ultra 7 256V, Arc 140V | Microsoft Surface Laptop 7 13.8 Copilot+ SD X Elite X1E-80-100, Adreno X1-85 3.8 TFLOPS | Apple MacBook Pro 14 2025 M5 M5 10-Core, M5 10-Core GPU | |
|---|---|---|---|---|---|
| Noise | |||||
| off / environment * (dB) | 24.1 | 24.1 | 23.8 | 24.5 | |
| Idle Minimum * (dB) | 24.8 | 24.4 | 23.8 | 24.5 | |
| Idle Average * (dB) | 24.8 | 24.4 | 23.8 | 24.5 | |
| Idle Maximum * (dB) | 26.7 | 24.4 | 23.8 | 24.5 | |
| Load Average * (dB) | 36.8 | 26.2 | 26 | 25.2 | |
| Cyberpunk 2077 ultra * (dB) | 44.5 | 34.2 | 31.5 | 30 | |
| Load Maximum * (dB) | 50.8 | 45.2 | 40.3 | 48 |
* ... smaller is better
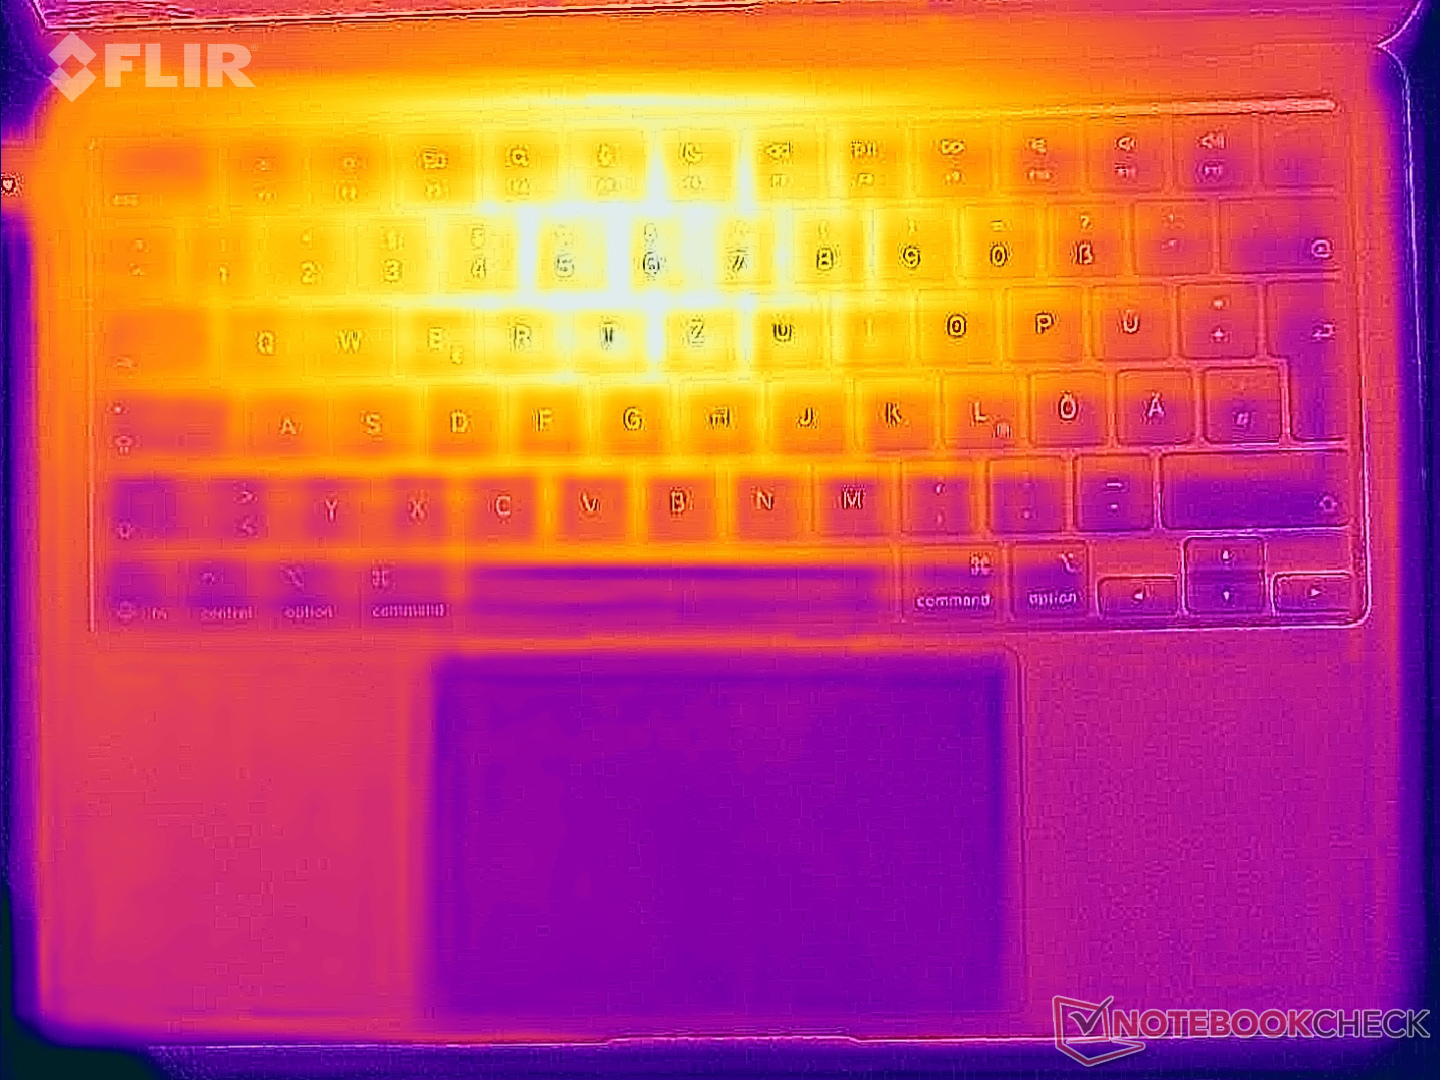
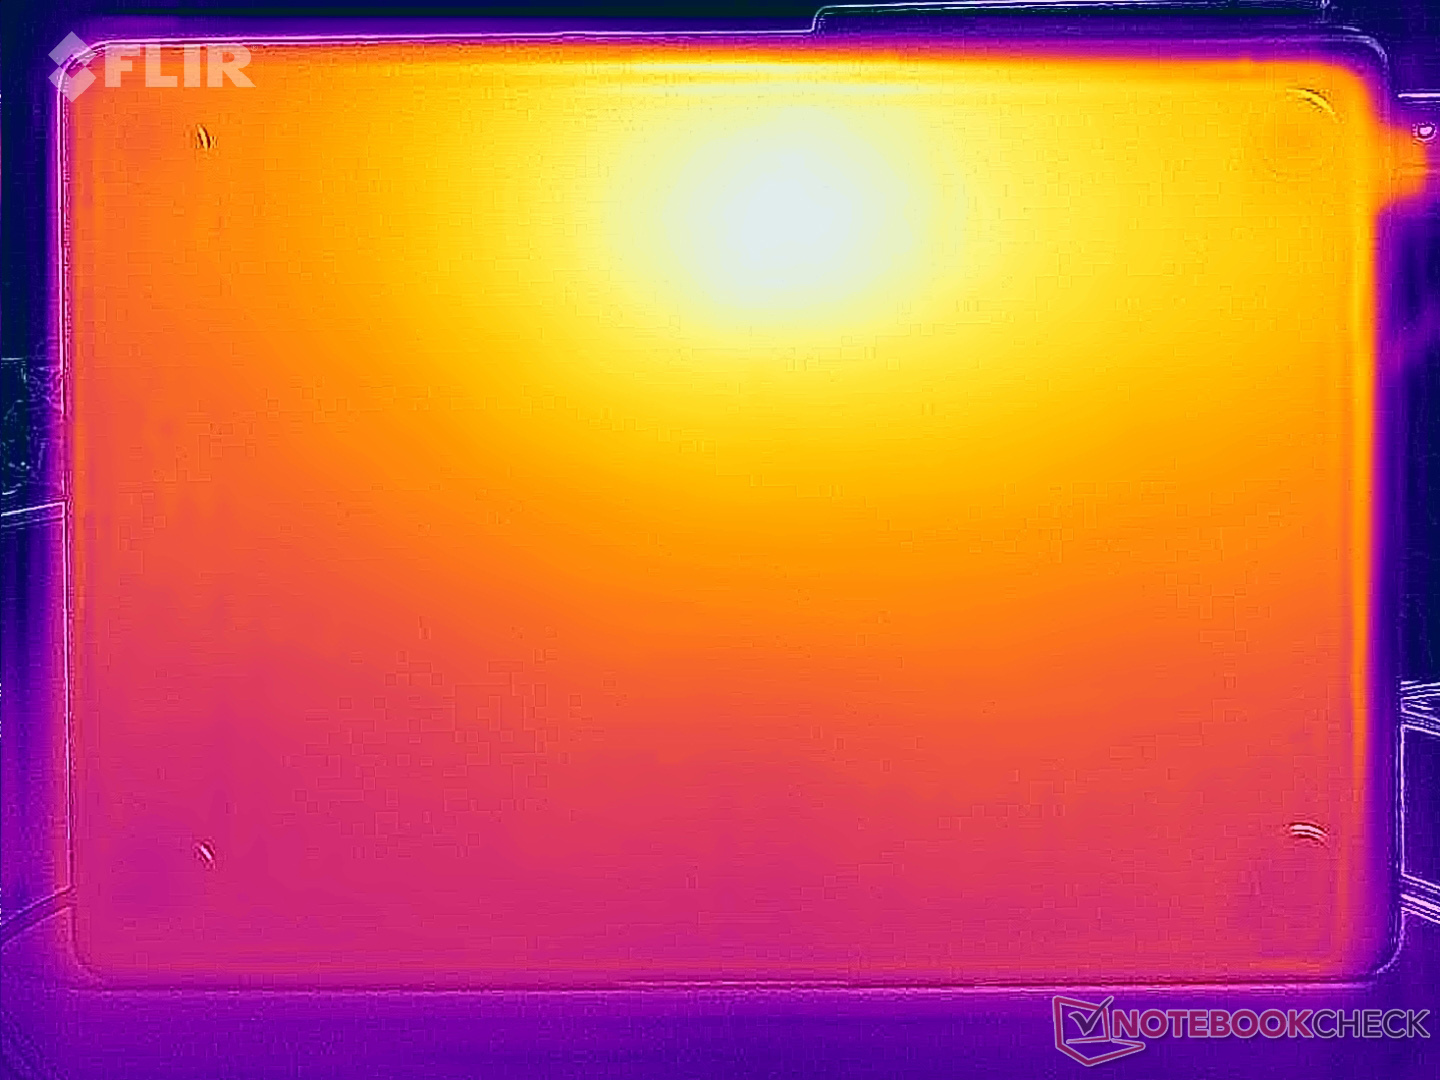
温度
表面温度绝对没有问题,MacBook Air 通常会保持非常凉爽。如果压力很大,温度会略高于 40 °C,但这不成问题。在 CPU/GPU 综合负载的压力测试中,M5 SoC 的功耗高达 26 瓦,然后迅速降至 8 瓦左右。
(±) The maximum temperature on the upper side is 44.1 °C / 111 F, compared to the average of 35.9 °C / 97 F, ranging from 21.4 to 59 °C for the class Subnotebook.
(±) The bottom heats up to a maximum of 42.4 °C / 108 F, compared to the average of 39.2 °C / 103 F
(+) In idle usage, the average temperature for the upper side is 23.3 °C / 74 F, compared to the device average of 30.8 °C / 87 F.
(±) 3: The average temperature for the upper side is 36.4 °C / 98 F, compared to the average of 30.8 °C / 87 F for the class Subnotebook.
(+) The palmrests and touchpad are reaching skin temperature as a maximum (32.9 °C / 91.2 F) and are therefore not hot.
(-) The average temperature of the palmrest area of similar devices was 28.2 °C / 82.8 F (-4.7 °C / -8.4 F).
| Apple MacBook Air 13 M5 M5 10-Core, M5 8-Core GPU | Apple MacBook Air 13 M4 Entry M4 10-Core, M4 8-Core GPU | MSI Prestige 13 AI Plus Evo A2VMG Core Ultra 7 258V, Arc 140V | Dell XPS 13 9350 Core Ultra 7 256V, Arc 140V | Microsoft Surface Laptop 7 13.8 Copilot+ SD X Elite X1E-80-100, Adreno X1-85 3.8 TFLOPS | |
|---|---|---|---|---|---|
| Heat | -1% | -3% | 4% | -5% | |
| Maximum Upper Side * (°C) | 44.1 | 44.9 -2% | 43.4 2% | 34.8 21% | 47.1 -7% |
| Maximum Bottom * (°C) | 42.4 | 42.6 -0% | 42.4 -0% | 37.4 12% | 44.6 -5% |
| Idle Upper Side * (°C) | 23.7 | 23.9 -1% | 25.4 -7% | 25.4 -7% | 24.7 -4% |
| Idle Bottom * (°C) | 23.8 | 24 -1% | 25.6 -8% | 26.2 -10% | 24.5 -3% |
* ... smaller is better
发言人
小型 MBA 13 的扬声器系统音质良好,你很少会错过外部扬声器。
Apple MacBook Air 13 M5 audio analysis
(+) | speakers can play relatively loud (82.1 dB)
Bass 100 - 315 Hz
(±) | reduced bass - on average 10.5% lower than median
(±) | linearity of bass is average (10.2% delta to prev. frequency)
Mids 400 - 2000 Hz
(+) | balanced mids - only 2% away from median
(+) | mids are linear (2.7% delta to prev. frequency)
Highs 2 - 16 kHz
(±) | higher highs - on average 5.1% higher than median
(+) | highs are linear (3% delta to prev. frequency)
Overall 100 - 16.000 Hz
(+) | overall sound is linear (11.7% difference to median)
Compared to same class
» 13% of all tested devices in this class were better, 3% similar, 83% worse
» The best had a delta of 5%, average was 18%, worst was 53%
Compared to all devices tested
» 8% of all tested devices were better, 3% similar, 89% worse
» The best had a delta of 4%, average was 23%, worst was 134%
MSI Prestige 13 AI Plus Evo A2VMG audio analysis
(+) | speakers can play relatively loud (84.5 dB)
Bass 100 - 315 Hz
(-) | nearly no bass - on average 19.4% lower than median
(±) | linearity of bass is average (9.6% delta to prev. frequency)
Mids 400 - 2000 Hz
(±) | higher mids - on average 6.4% higher than median
(+) | mids are linear (5.1% delta to prev. frequency)
Highs 2 - 16 kHz
(±) | higher highs - on average 6.1% higher than median
(+) | highs are linear (4.6% delta to prev. frequency)
Overall 100 - 16.000 Hz
(±) | linearity of overall sound is average (18.2% difference to median)
Compared to same class
» 52% of all tested devices in this class were better, 7% similar, 40% worse
» The best had a delta of 5%, average was 18%, worst was 53%
Compared to all devices tested
» 39% of all tested devices were better, 8% similar, 53% worse
» The best had a delta of 4%, average was 23%, worst was 134%
Dell XPS 13 9350 audio analysis
(+) | speakers can play relatively loud (82.6 dB)
Bass 100 - 315 Hz
(±) | reduced bass - on average 8.5% lower than median
(±) | linearity of bass is average (8.3% delta to prev. frequency)
Mids 400 - 2000 Hz
(±) | higher mids - on average 6.2% higher than median
(+) | mids are linear (5.9% delta to prev. frequency)
Highs 2 - 16 kHz
(±) | higher highs - on average 5.3% higher than median
(+) | highs are linear (5.1% delta to prev. frequency)
Overall 100 - 16.000 Hz
(+) | overall sound is linear (13% difference to median)
Compared to same class
» 21% of all tested devices in this class were better, 4% similar, 75% worse
» The best had a delta of 5%, average was 18%, worst was 53%
Compared to all devices tested
» 13% of all tested devices were better, 2% similar, 85% worse
» The best had a delta of 4%, average was 23%, worst was 134%
Microsoft Surface Laptop 7 13.8 Copilot+ audio analysis
(±) | speaker loudness is average but good (81.8 dB)
Bass 100 - 315 Hz
(±) | reduced bass - on average 12.7% lower than median
(±) | linearity of bass is average (9.8% delta to prev. frequency)
Mids 400 - 2000 Hz
(+) | balanced mids - only 4.1% away from median
(+) | mids are linear (2.4% delta to prev. frequency)
Highs 2 - 16 kHz
(+) | balanced highs - only 2.1% away from median
(+) | highs are linear (2.5% delta to prev. frequency)
Overall 100 - 16.000 Hz
(+) | overall sound is linear (12.1% difference to median)
Compared to same class
» 15% of all tested devices in this class were better, 5% similar, 81% worse
» The best had a delta of 5%, average was 18%, worst was 53%
Compared to all devices tested
» 10% of all tested devices were better, 2% similar, 88% worse
» The best had a delta of 4%, average was 23%, worst was 134%
耗电量
与前代机型相比,功耗数据并无太大变化,也不会出现意外。在压力测试中,30 瓦的 PSU 会在几秒钟内限制功耗,但很快就会降到 24 瓦左右。
| Off / Standby | |
| Idle | |
| Load |
|
Key:
min: | |
| Apple MacBook Air 13 M5 M5 10-Core, M5 8-Core GPU, Apple SSD AP0512Z, IPS, 2560x1664, 13.6" | Apple MacBook Air 13 M4 Entry M4 10-Core, M4 8-Core GPU, Apple SSD AP0256Z, IPS, 2560x1664, 13.6" | MSI Prestige 13 AI Plus Evo A2VMG Core Ultra 7 258V, Arc 140V, , OLED, 2880x1800, 13.3" | Dell XPS 13 9350 Core Ultra 7 256V, Arc 140V, Micron 2550 512GB, IPS, 1920x1200, 13.4" | Microsoft Surface Laptop 7 13.8 Copilot+ SD X Elite X1E-80-100, Adreno X1-85 3.8 TFLOPS, Samsung MZ9L4512HBLU-00BMV, IPS, 2304x1536, 13.8" | Average Apple M5 8-Core GPU | Average of class Subnotebook | |
|---|---|---|---|---|---|---|---|
| Power Consumption | -2% | -71% | -36% | -9% | 0% | -44% | |
| Idle Minimum * (Watt) | 1.8 | 1.9 -6% | 3.5 -94% | 1.3 28% | 1.4 22% | 1.8 ? -0% | 3.76 ? -109% |
| Idle Average * (Watt) | 9.3 | 8.7 6% | 5.9 37% | 2.5 73% | 6.3 32% | 9.3 ? -0% | 6.54 ? 30% |
| Idle Maximum * (Watt) | 9.4 | 8.8 6% | 10 -6% | 4.1 56% | 7.6 19% | 9.4 ? -0% | 7.89 ? 16% |
| Load Average * (Watt) | 29.4 | 29.9 -2% | 38.7 -32% | 40.1 -36% | 26.9 9% | 29.4 ? -0% | 42 ? -43% |
| Cyberpunk 2077 ultra * (Watt) | 18.9 | 18.5 2% | 46.3 -145% | 46.1 -144% | 38.5 -104% | ||
| Cyberpunk 2077 ultra external monitor * (Watt) | 17.7 | 21.5 -21% | 45.6 -158% | 43.1 -144% | |||
| Load Maximum * (Watt) | 30.4 | 30.8 -1% | 61.5 -102% | 57.3 -88% | 40.7 -34% | 30.4 ? -0% | 64.8 ? -113% |
* ... smaller is better
功耗 赛博朋克/压力测试
外部显示器功耗
电池寿命
在 150 尼特的 Wi-Fi 测试中,电池续航时间略高于 16 小时,因此与前代机型相同。Lunar Lake Dell XPS 13 9350 的续航时间多出 4 个小时,但显示屏分辨率较低。
笔记本检查评级
Apple MacBook Air 13 M5
- 03/07/2026 v8
Andreas Osthoff
 Total Sustainability Score:
 潜在竞争对手比较
Image | Model / Review | Price | Weight | Height | Display |
|---|---|---|---|---|---|
1. 91.6%  | Apple MacBook Air 13 M5 Apple M5 10-Core ⎘ Apple M5 8-Core GPU ⎘ 16 GB Memory, 512 GB SSD | Amazon: List Price: 1199€ | 1.2 kg | 11.3 mm | 13.60" 2560x1664 225 PPI IPS |
2. 91.2%  | Apple MacBook Air 13 M4 Entry Apple M4 10-Core ⎘ Apple M4 8-Core GPU ⎘ 16 GB Memory, 256 GB SSD | Amazon: List Price: 1039€ | 1.2 kg | 11.3 mm | 13.60" 2560x1664 225 PPI IPS |
3. 85%  | MSI Prestige 13 AI Plus Evo A2VMG Intel Core Ultra 7 258V ⎘ Intel Arc Graphics 140V ⎘ 32 GB Memory | Amazon: 1. $1,149.49 msi Prestige 13 AI Evo Lapto... 2. $31.99 CPU Cooling Fan Replacement ... 3. $1,349.00 HIDevolution [2024] MSI Pres... List Price: 1400 USD | 970 g | 16.9 mm | 13.30" 2880x1800 255 PPI OLED |
4. 85.3%  | Dell XPS 13 9350 Intel Core Ultra 7 256V ⎘ Intel Arc Graphics 140V ⎘ 16 GB Memory, 512 GB SSD | Amazon: List Price: 1400 USD | 1.2 kg | 15.3 mm | 13.40" 1920x1200 169 PPI IPS |
5. 86.2%  | Microsoft Surface Laptop 7 13.8 Copilot+ Qualcomm Snapdragon X Elite X1E-80-100 ⎘ Qualcomm SD X Adreno X1-85 3.8 TFLOPS ⎘ 16 GB Memory, 512 GB SSD | Amazon: List Price: 1649€ | 1.3 kg | 17.5 mm | 13.80" 2304x1536 201 PPI IPS |
Transparency
The selection of devices to be reviewed is made by our editorial team. The test sample was provided to the author as a loan by the manufacturer or retailer for the purpose of this review. The lender had no influence on this review, nor did the manufacturer receive a copy of this review before publication. There was no obligation to publish this review. As an independent media company, Notebookcheck is not subjected to the authority of manufacturers, retailers or publishers.
This is how Notebookcheck is testing
Every year, Notebookcheck independently reviews hundreds of laptops and smartphones using standardized procedures to ensure that all results are comparable. We have continuously developed our test methods for around 20 years and set industry standards in the process. In our test labs, high-quality measuring equipment is utilized by experienced technicians and editors. These tests involve a multi-stage validation process. Our complex rating system is based on hundreds of well-founded measurements and benchmarks, which maintains objectivity. Further information on our test methods can be found here.

