
结论:新款 Surface 13 笔记本电脑太贵了
就其本身而言,新款 Surface Laptop 13 是一款足够安静和快速的日常伴侣,电池续航时间也很长。其 IPS 触摸屏可提供不错的图像质量,但频率只有 60 赫兹。
在性能方面,最小的骁龙 X Plus 已经足够,作为 Copilot+ 笔记本电脑,它还支持 Windows 的所有人工智能功能,但其瘦身后的 GPU 尤其非常薄弱,进一步限制了笔记本电脑本已有限的游戏性能。Surface 笔记本电脑的性能只能媲美被动散热的 MacBook Air M4。至少,只要处理器不超负荷工作,该设备几乎始终保持静音状态。
最大的问题是 Surface Laptop 13.8,虽然它的运行时间更短,但在基本配置中已经配备了速度稍快的 10 核骁龙 X Plus。此外,它还配备了触觉触控板,最重要的是,它的 120 Hz 显示屏要好得多。与此同时 Surface 13.8 笔记本电脑的当前在线价格与之相当,有时甚至更便宜一些,而且它还配备了电源,但遗憾的是,新款 Surface Laptop 13 却没有配备电源。
如果把新款 Surface Laptop 13 看作是 Surface Laptop Go 3 的直接继承者 Surface Laptop Go 3的直接继承者,那么新机型的体积稍大,但几乎在所有方面都更胜一筹。尽管如此,考虑到目前的价格,不选择更好的 Surface Laptop 13.8 是毫无意义的。
Pros
Cons
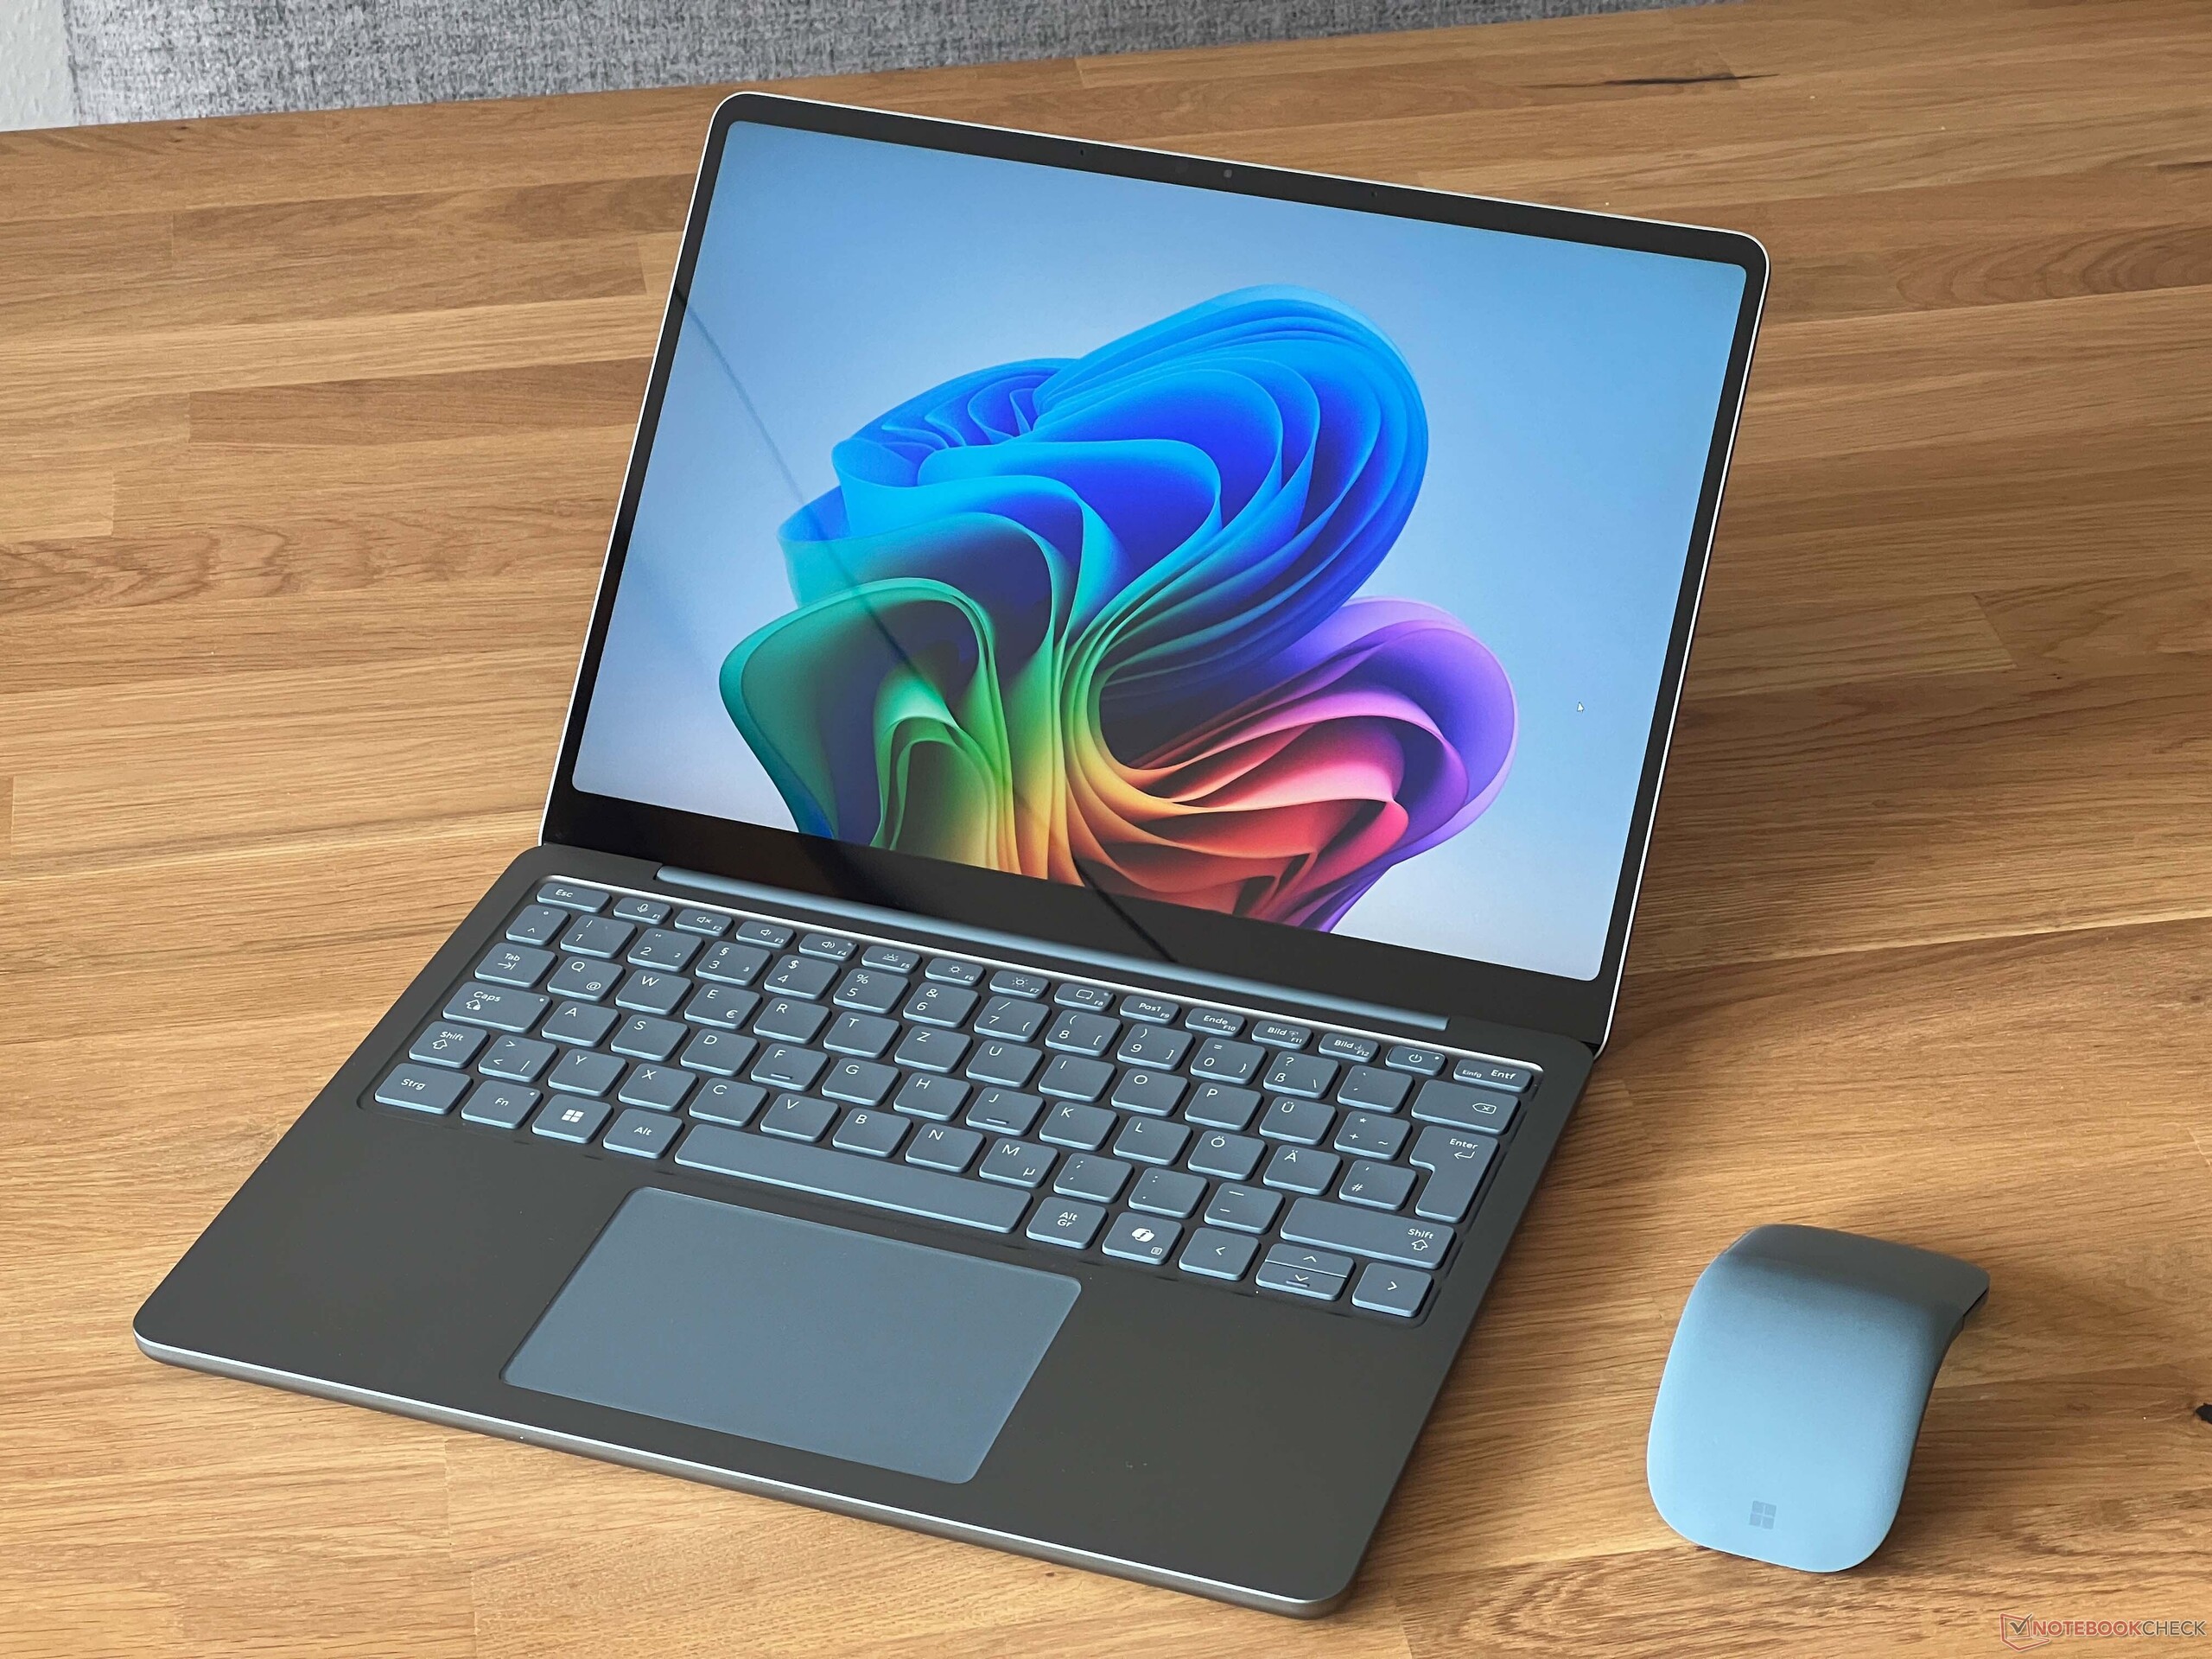
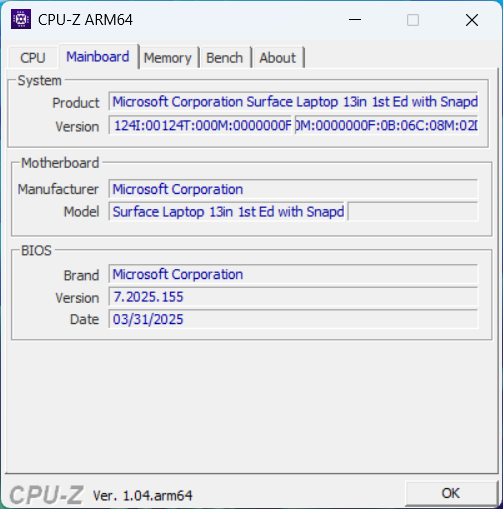
微软正在扩大其 Surface 笔记本电脑阵容,并推出了一款新的 13 英寸机型,它比我们熟悉的 13.8 英寸机型只小一点点。它配备了小巧的骁龙 X Plus、16 GB 内存和刷新率为 60 Hz 的全高清触摸屏,因此没有真正的亮点。配备 256 GB SSD 存储空间的版本的 MRSP 为 899.99 美元;我们测试的是配备 512 GB 存储空间的版本,售价为 999.99 美元。
规格
外壳和连接
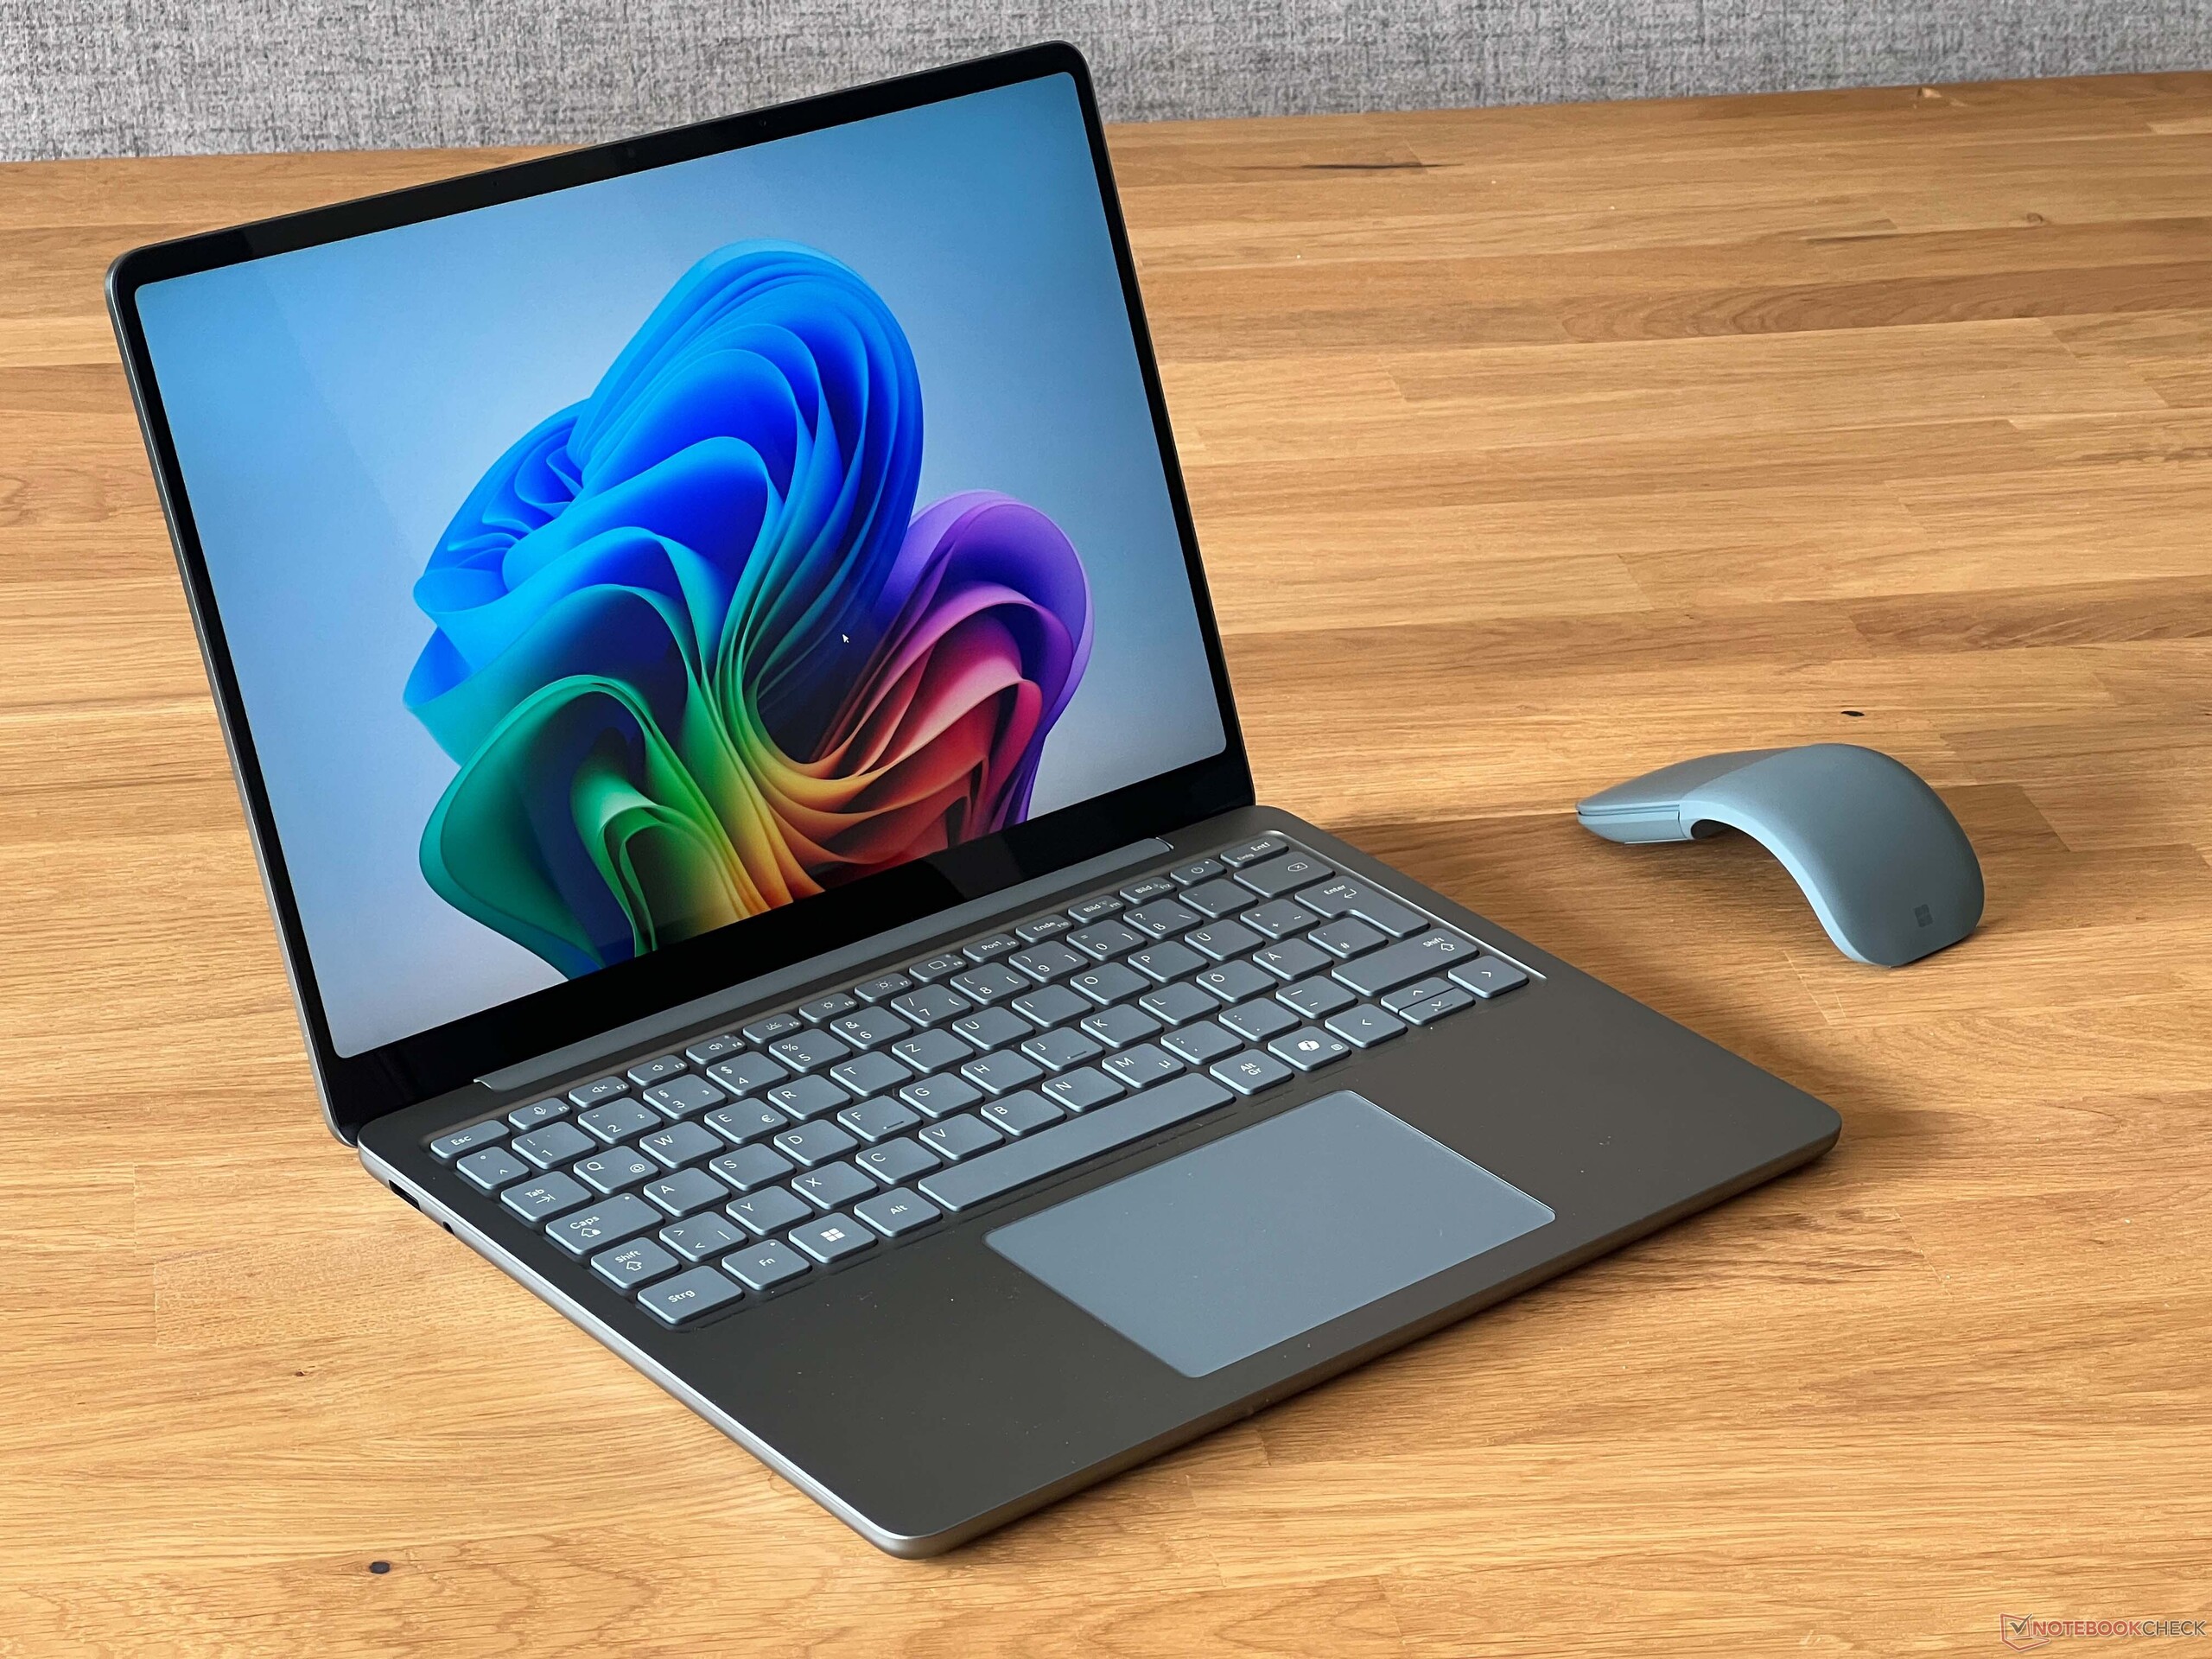
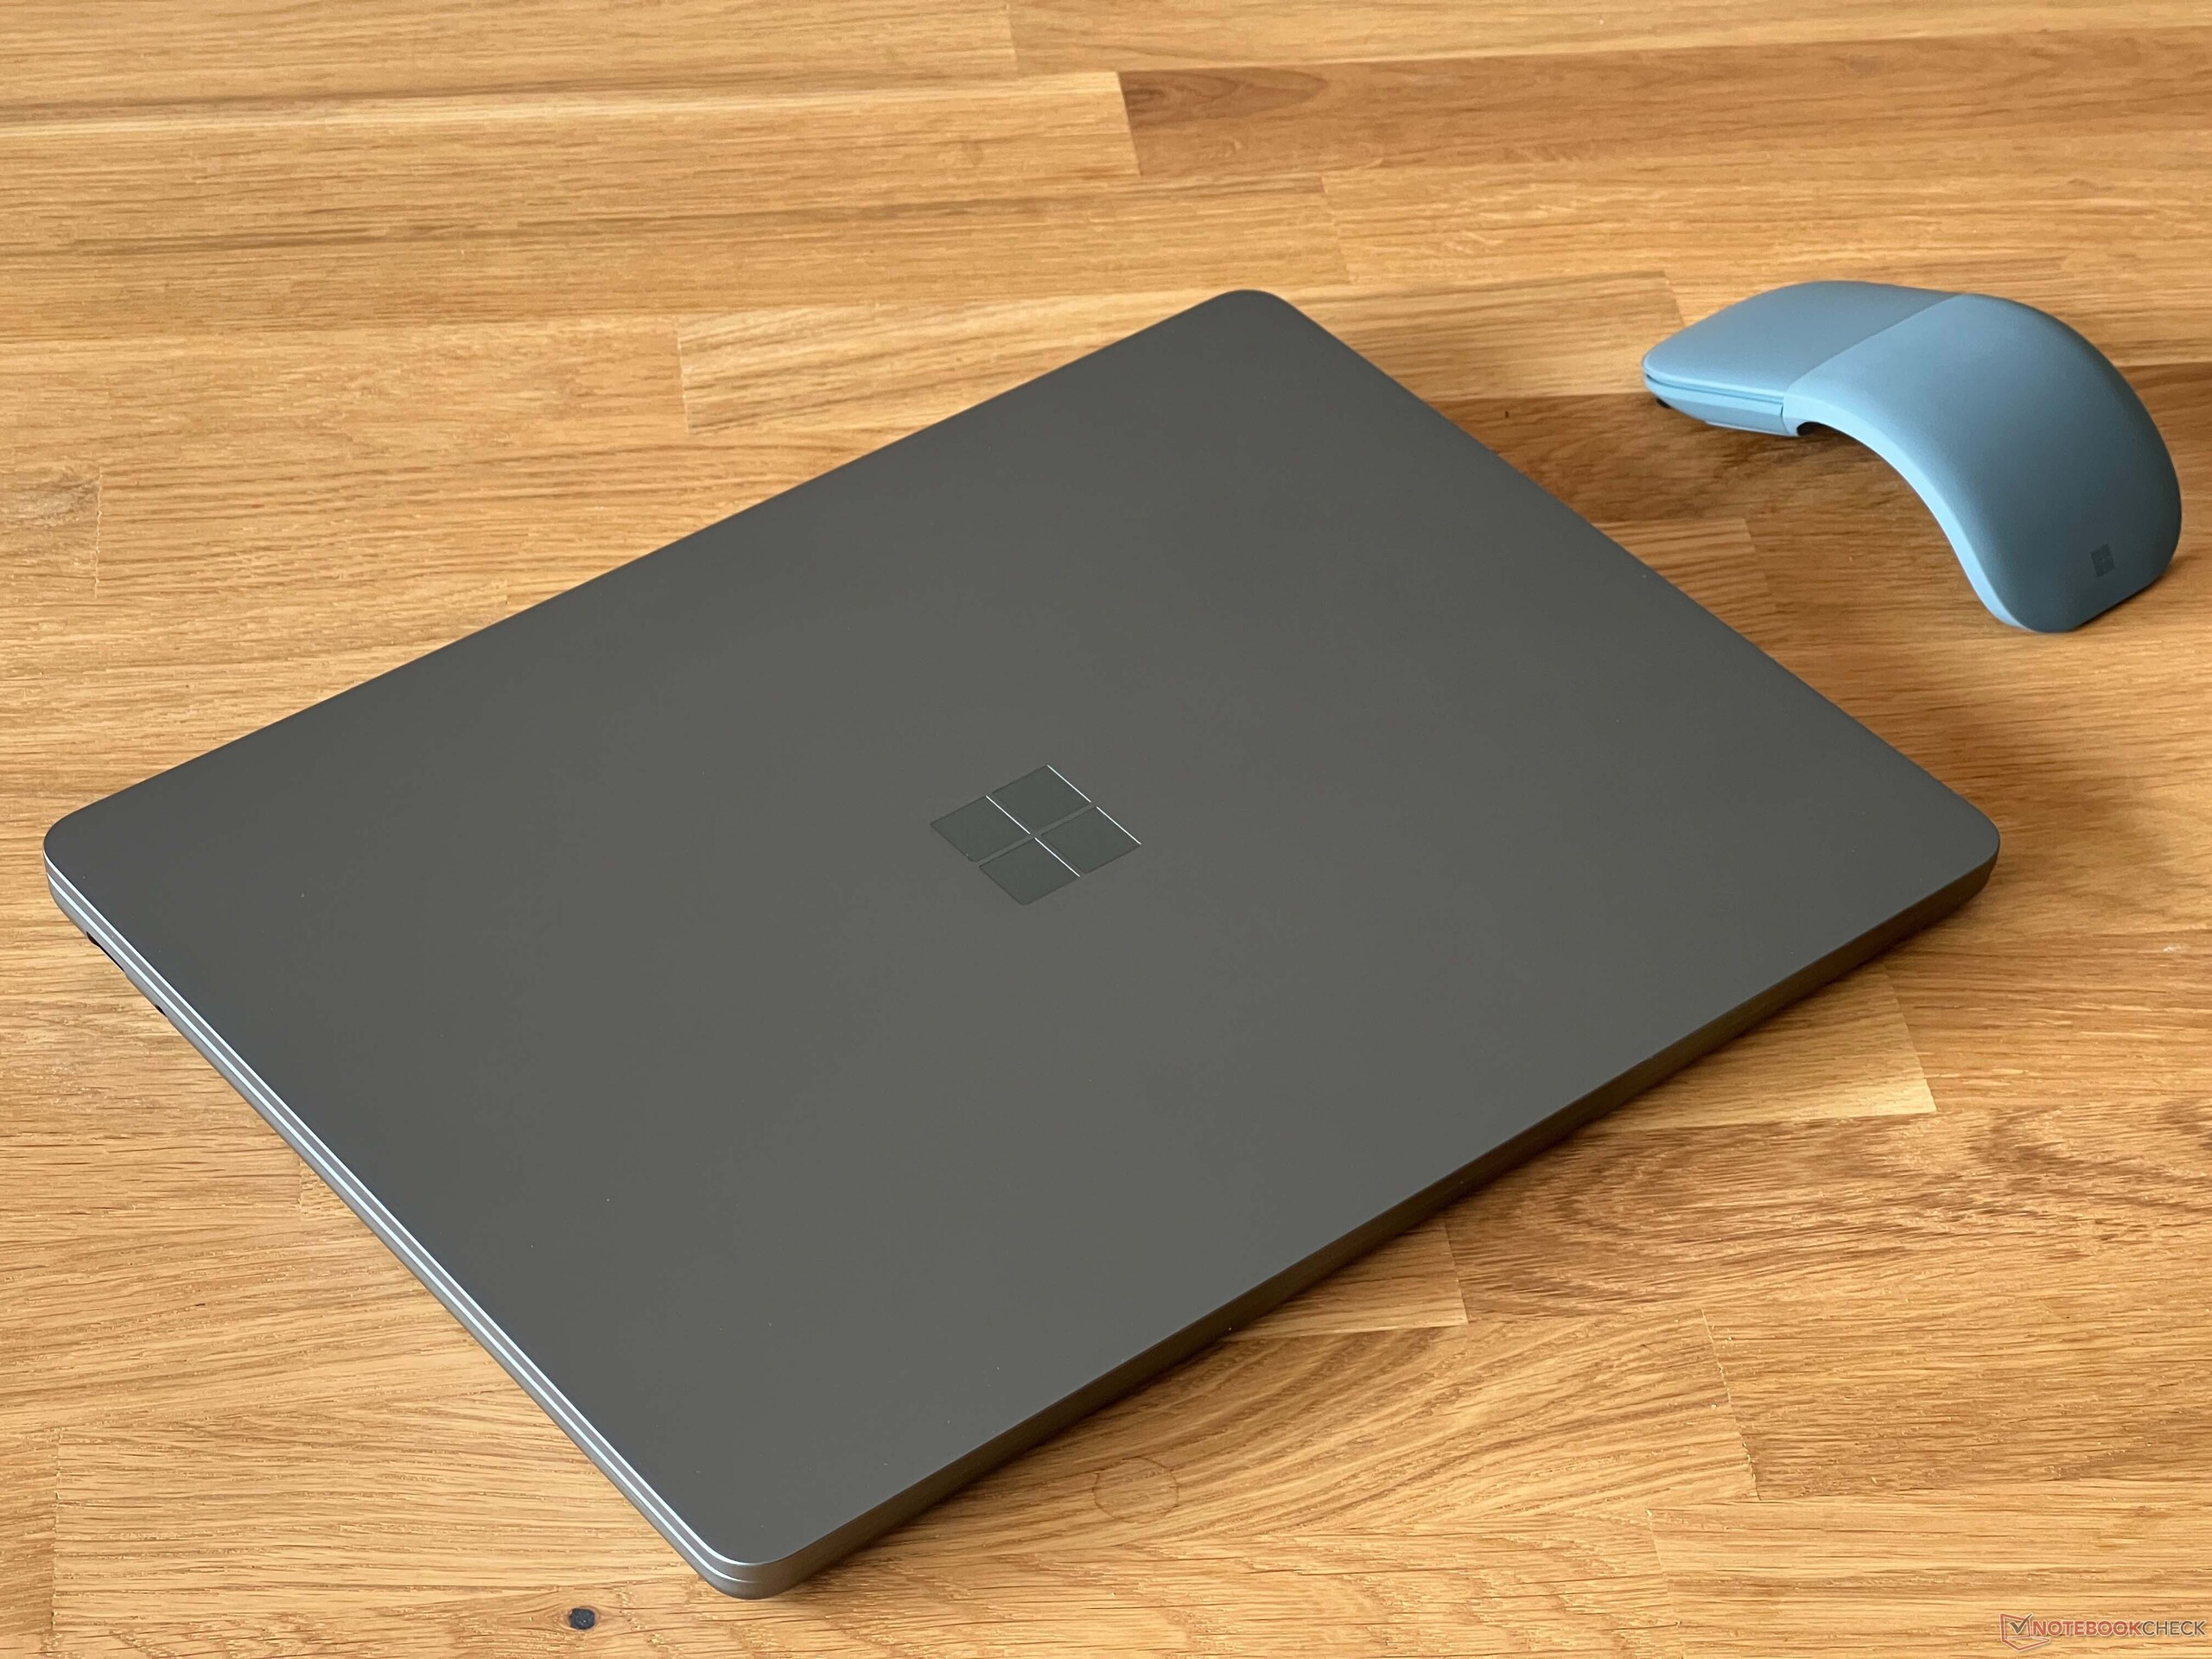
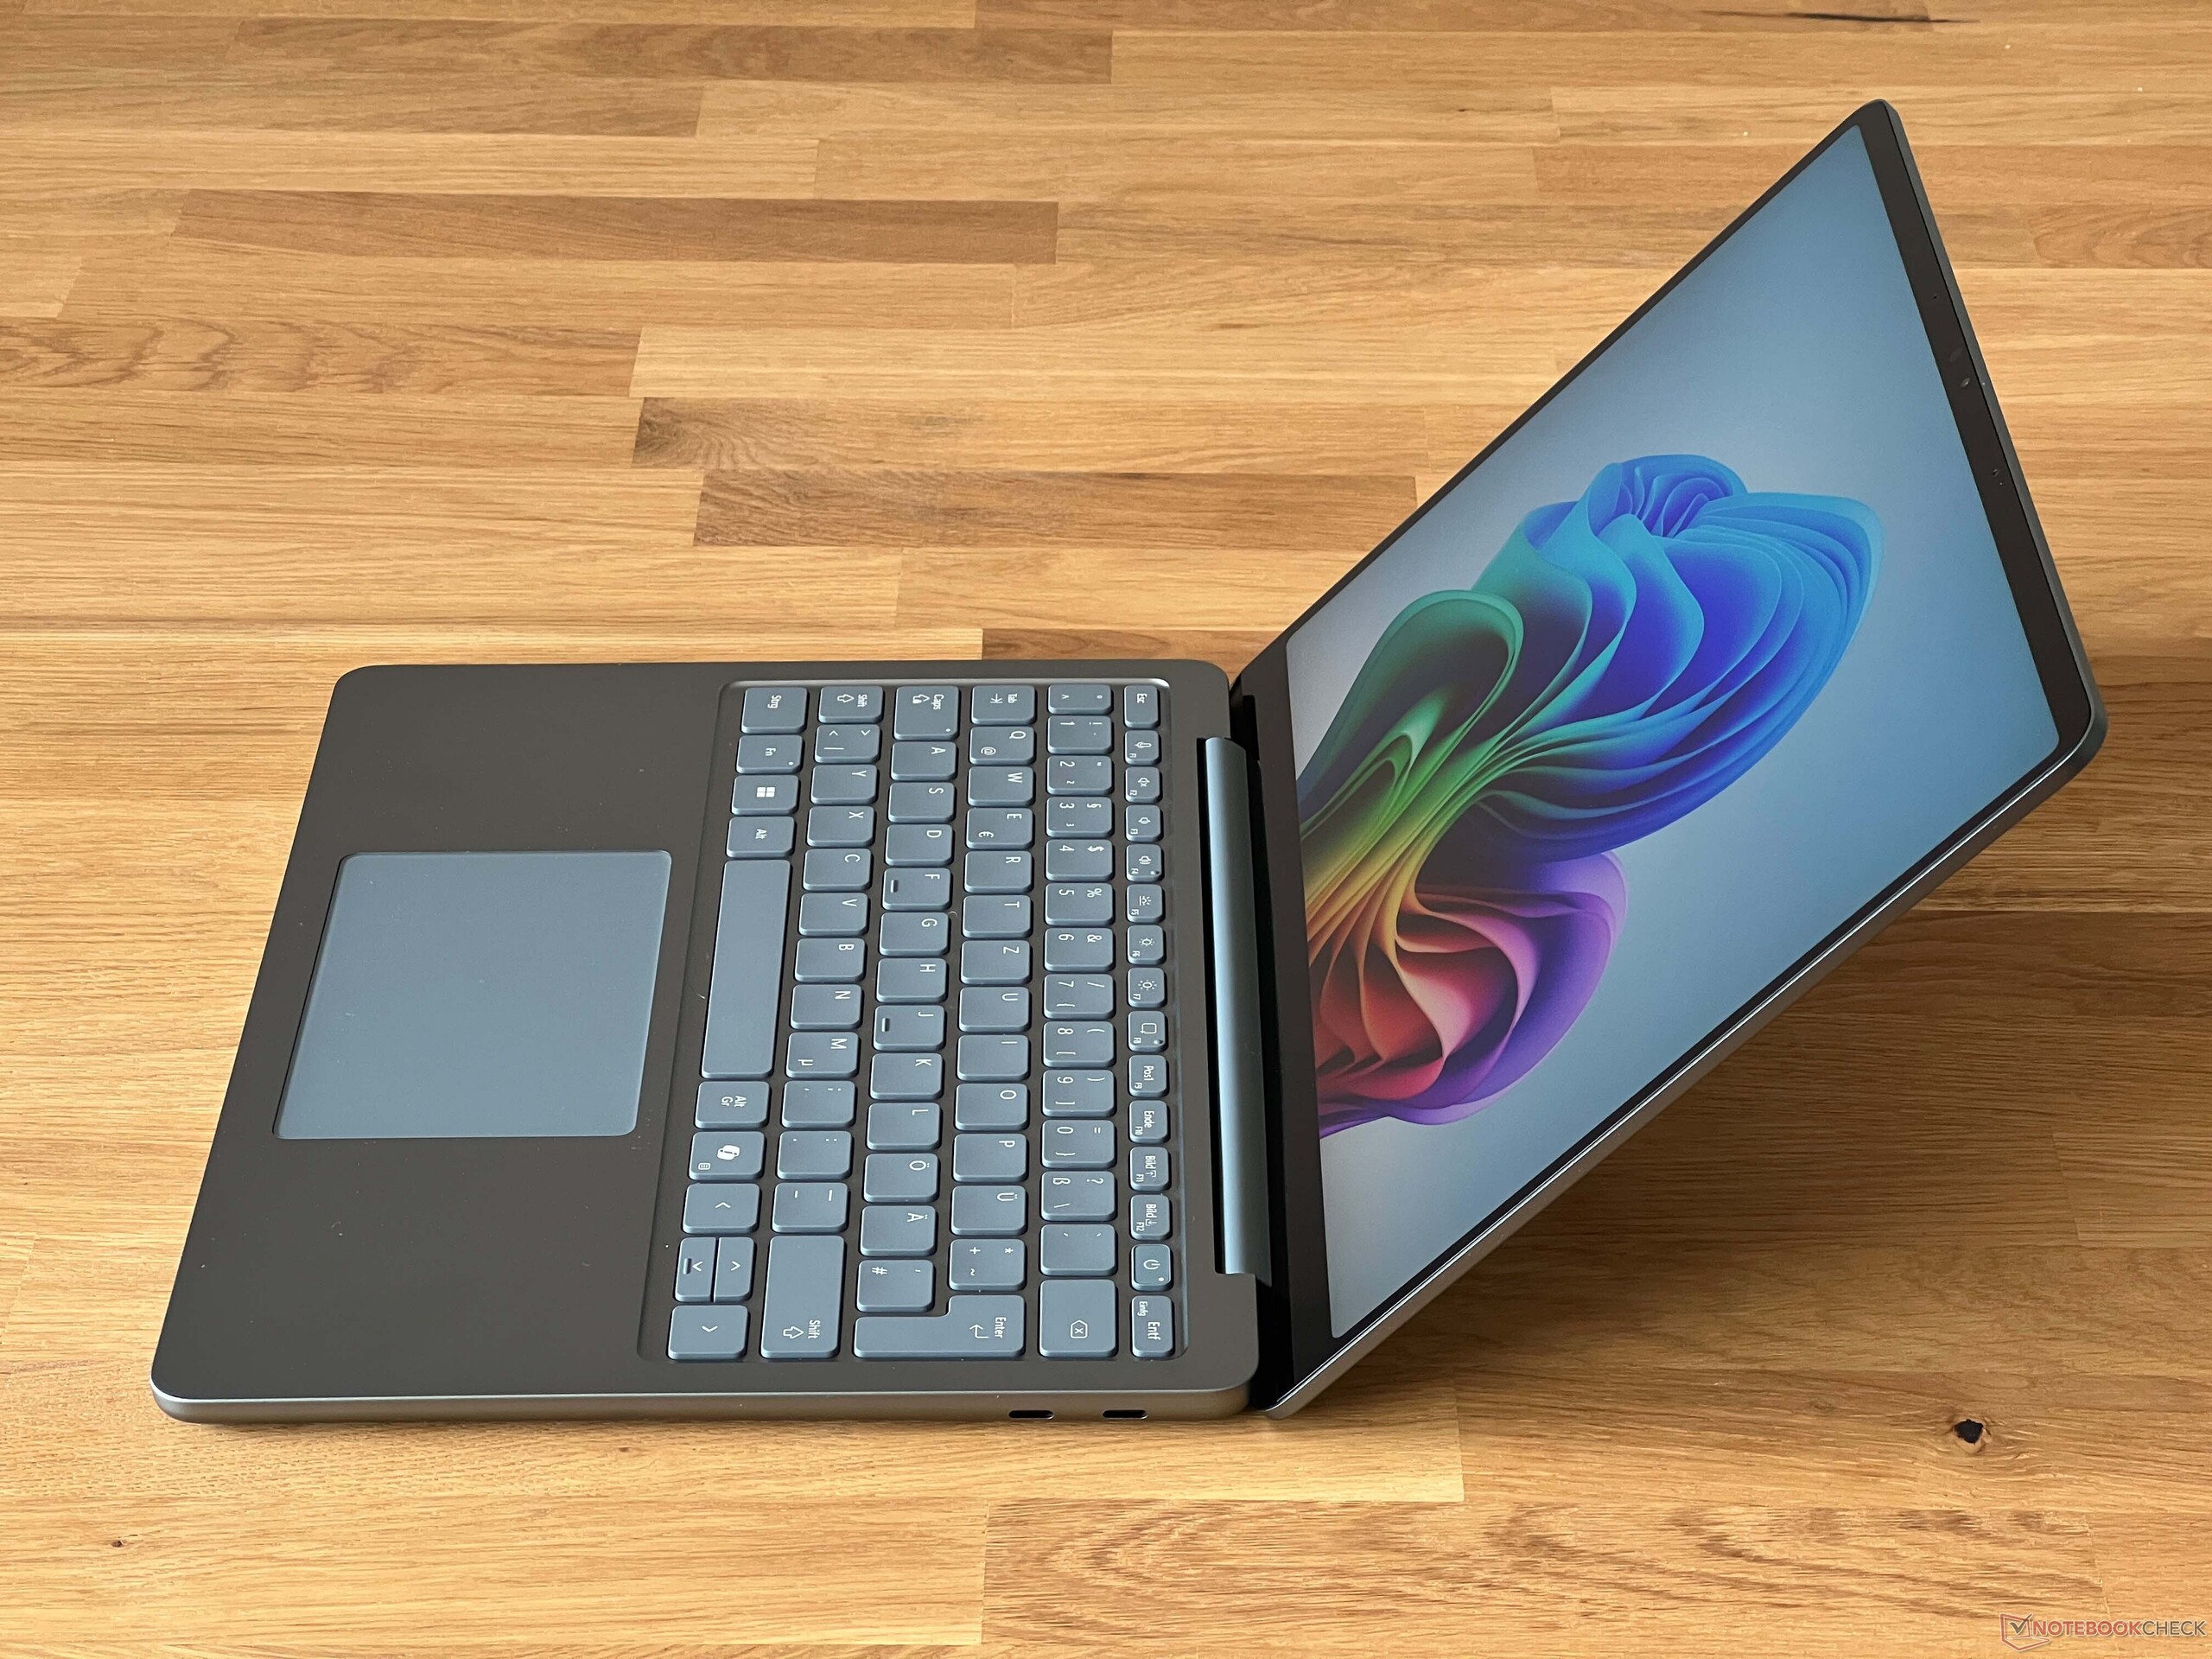
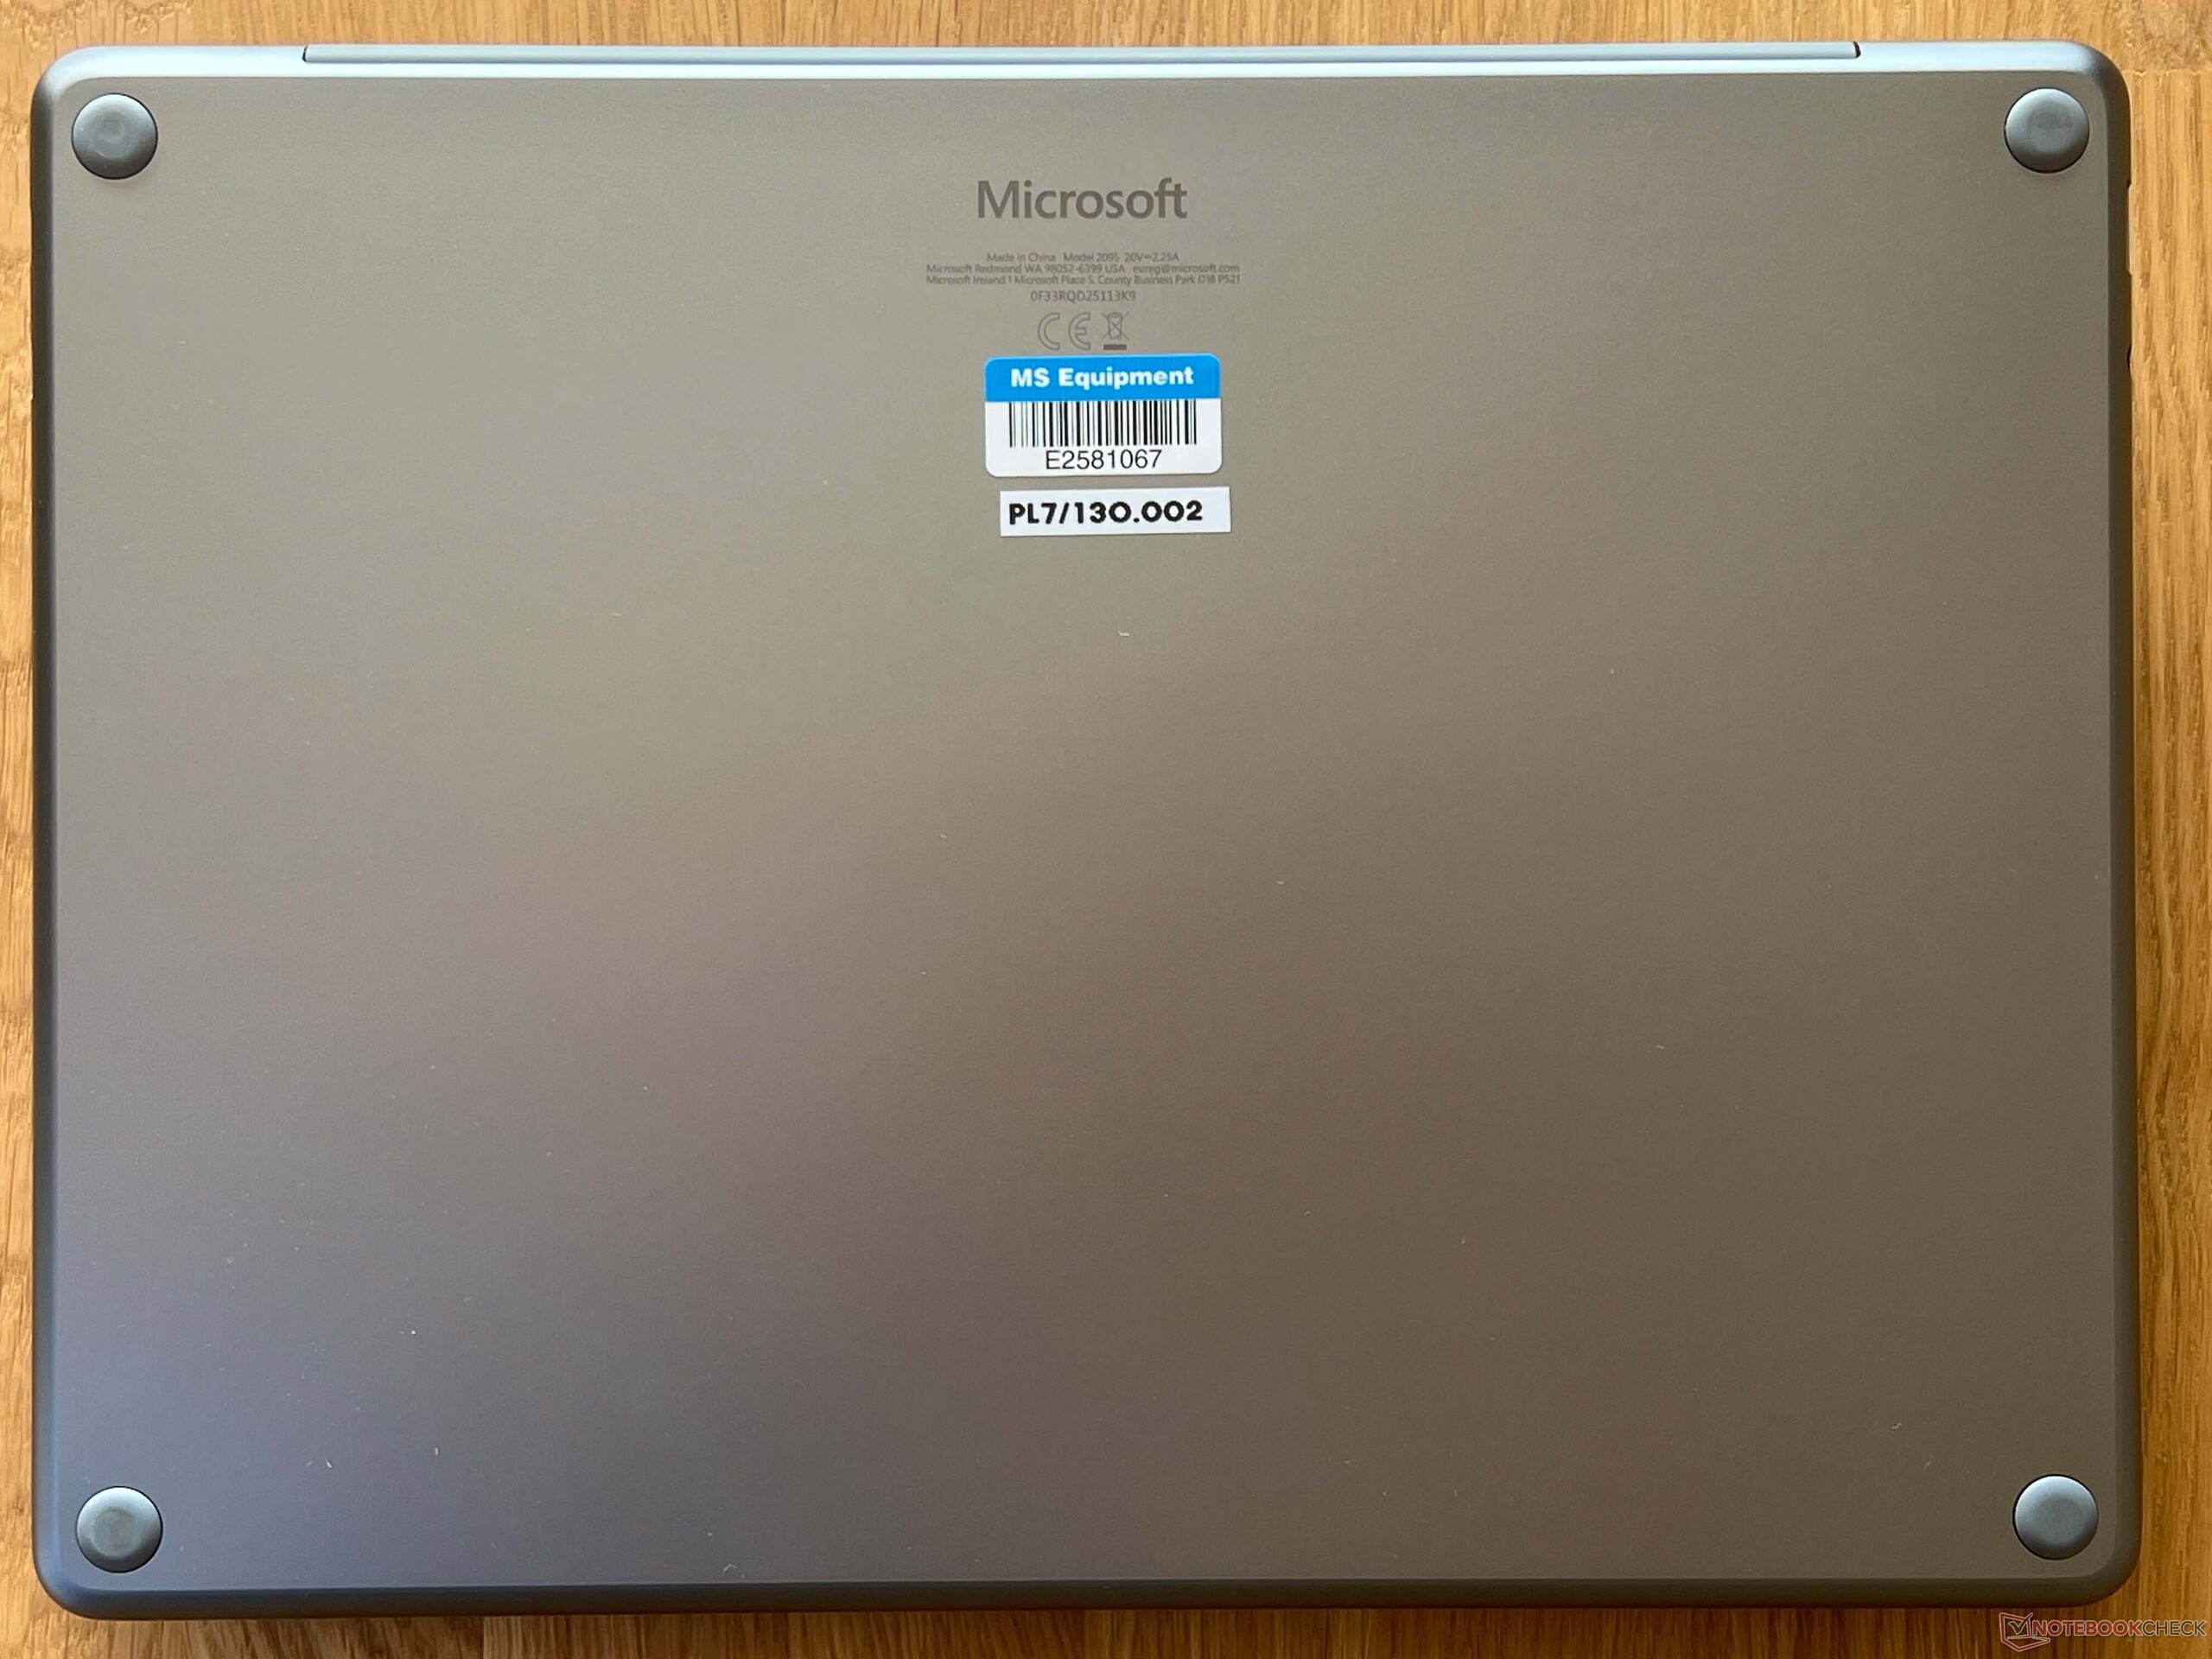
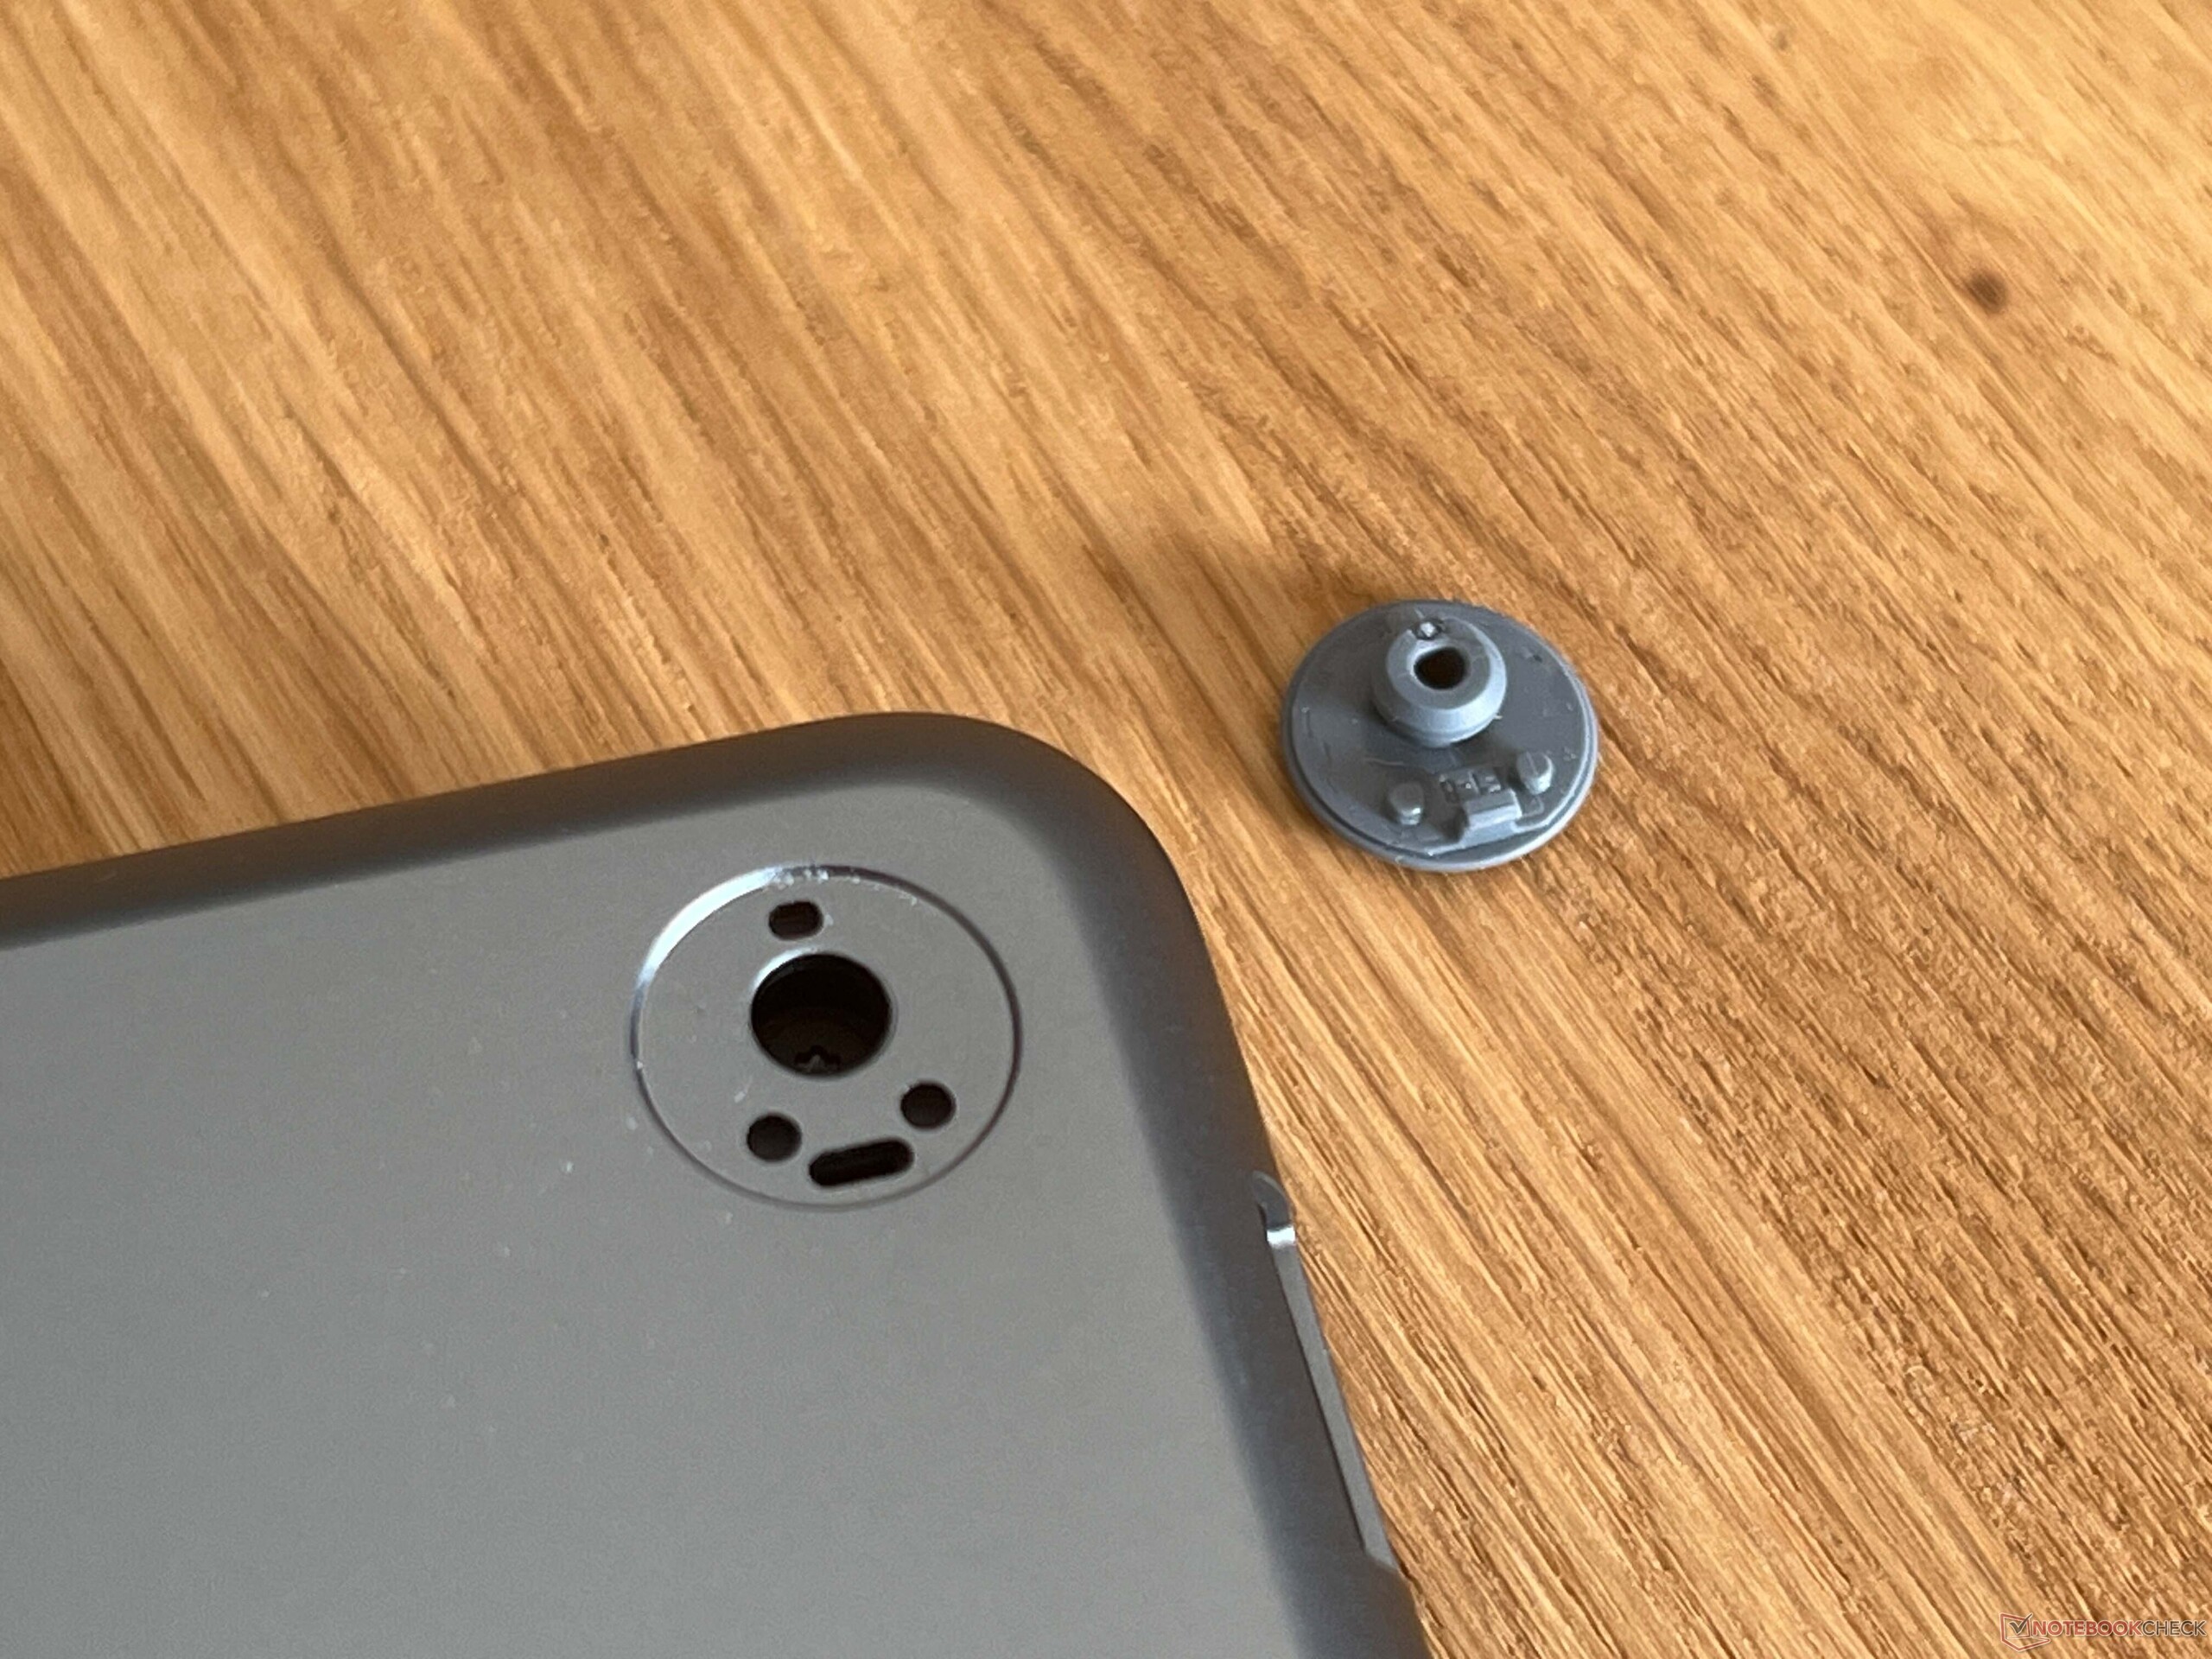
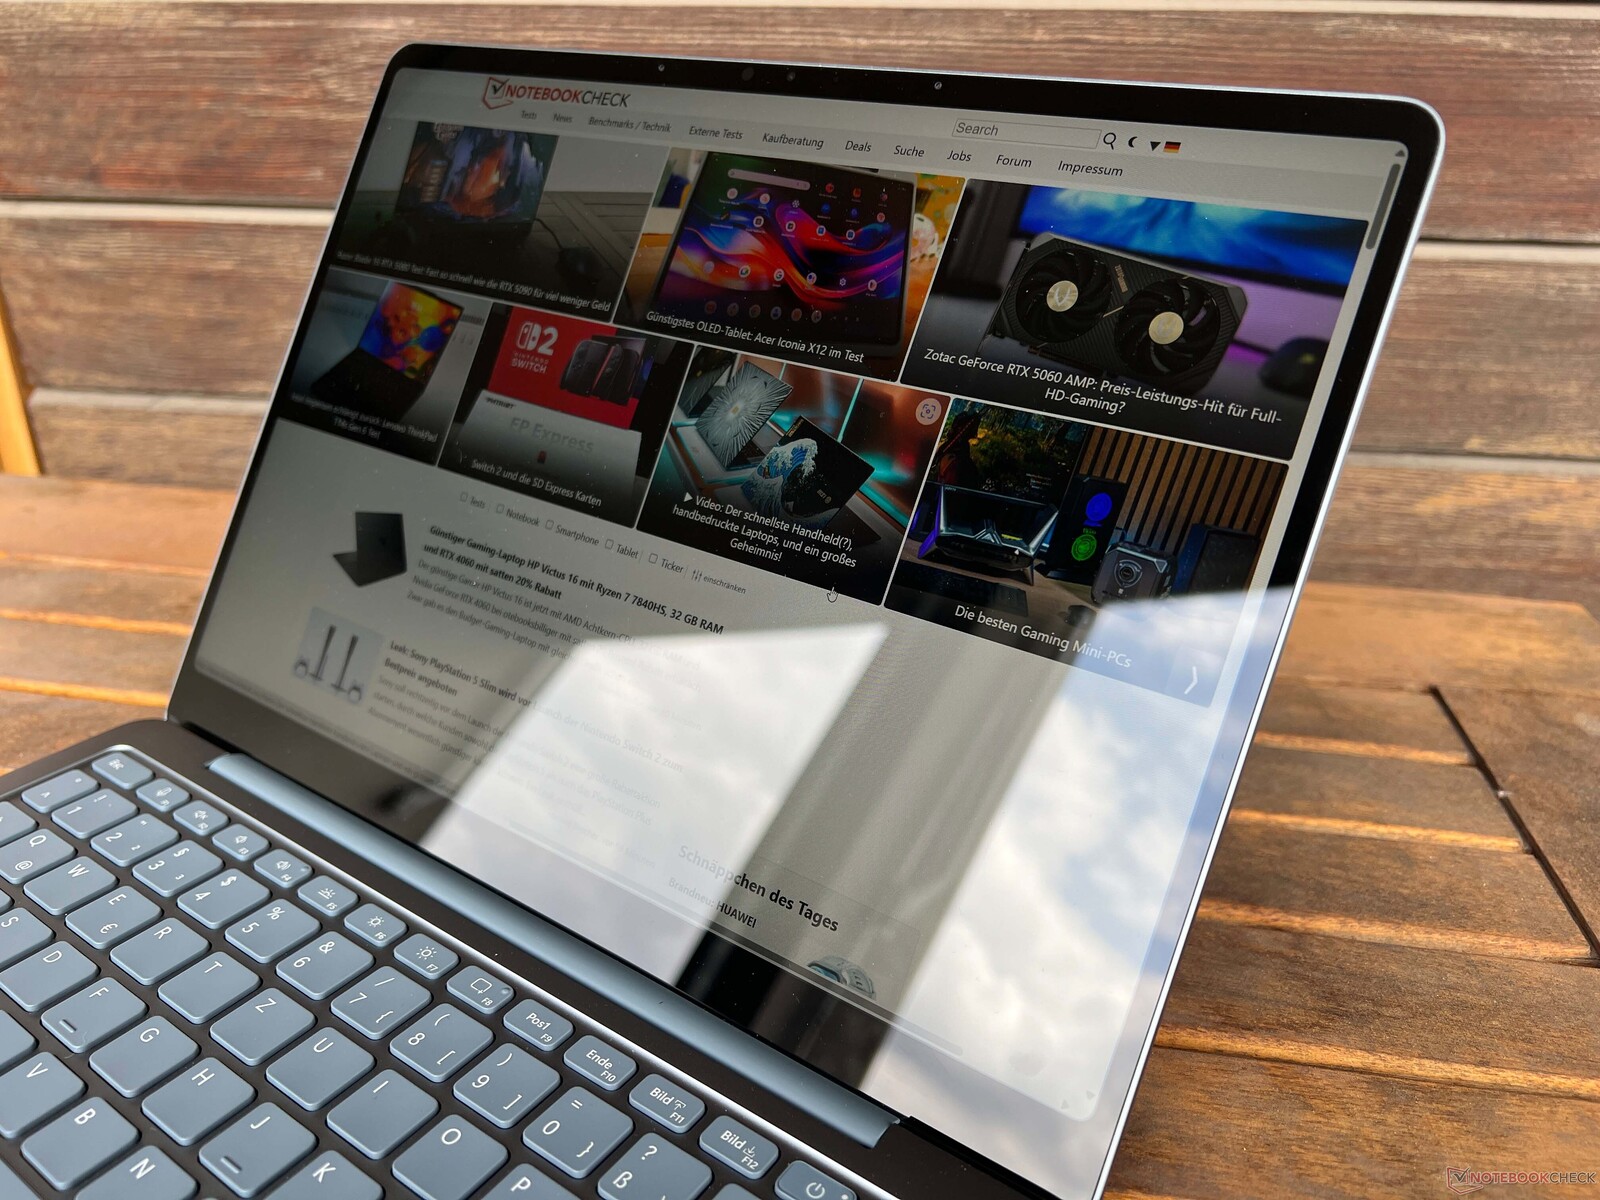
在设计方面,新款 Surface Laptop 与大型机型相比略有不同,其底座略微圆润。该设备重 1.2 千克,不算特别重,但背面部分(15.9 毫米)给人的感觉尤其笨重。它的制造质量很好,金属外壳的稳定性也没让人失望。不过,我们还是注意到在打开盖子(最大约 135 度)时有一些嘎吱嘎吱的声音,而且单手很难打开。四个胶粘的橡胶脚垫下隐藏着螺钉,但即使取下这些螺钉,盖子在我们的测试设备上还是非常紧,我们无法将其取下。保护套有银色、紫色和海洋色可供选择,我们测试设备的配色为海洋色。
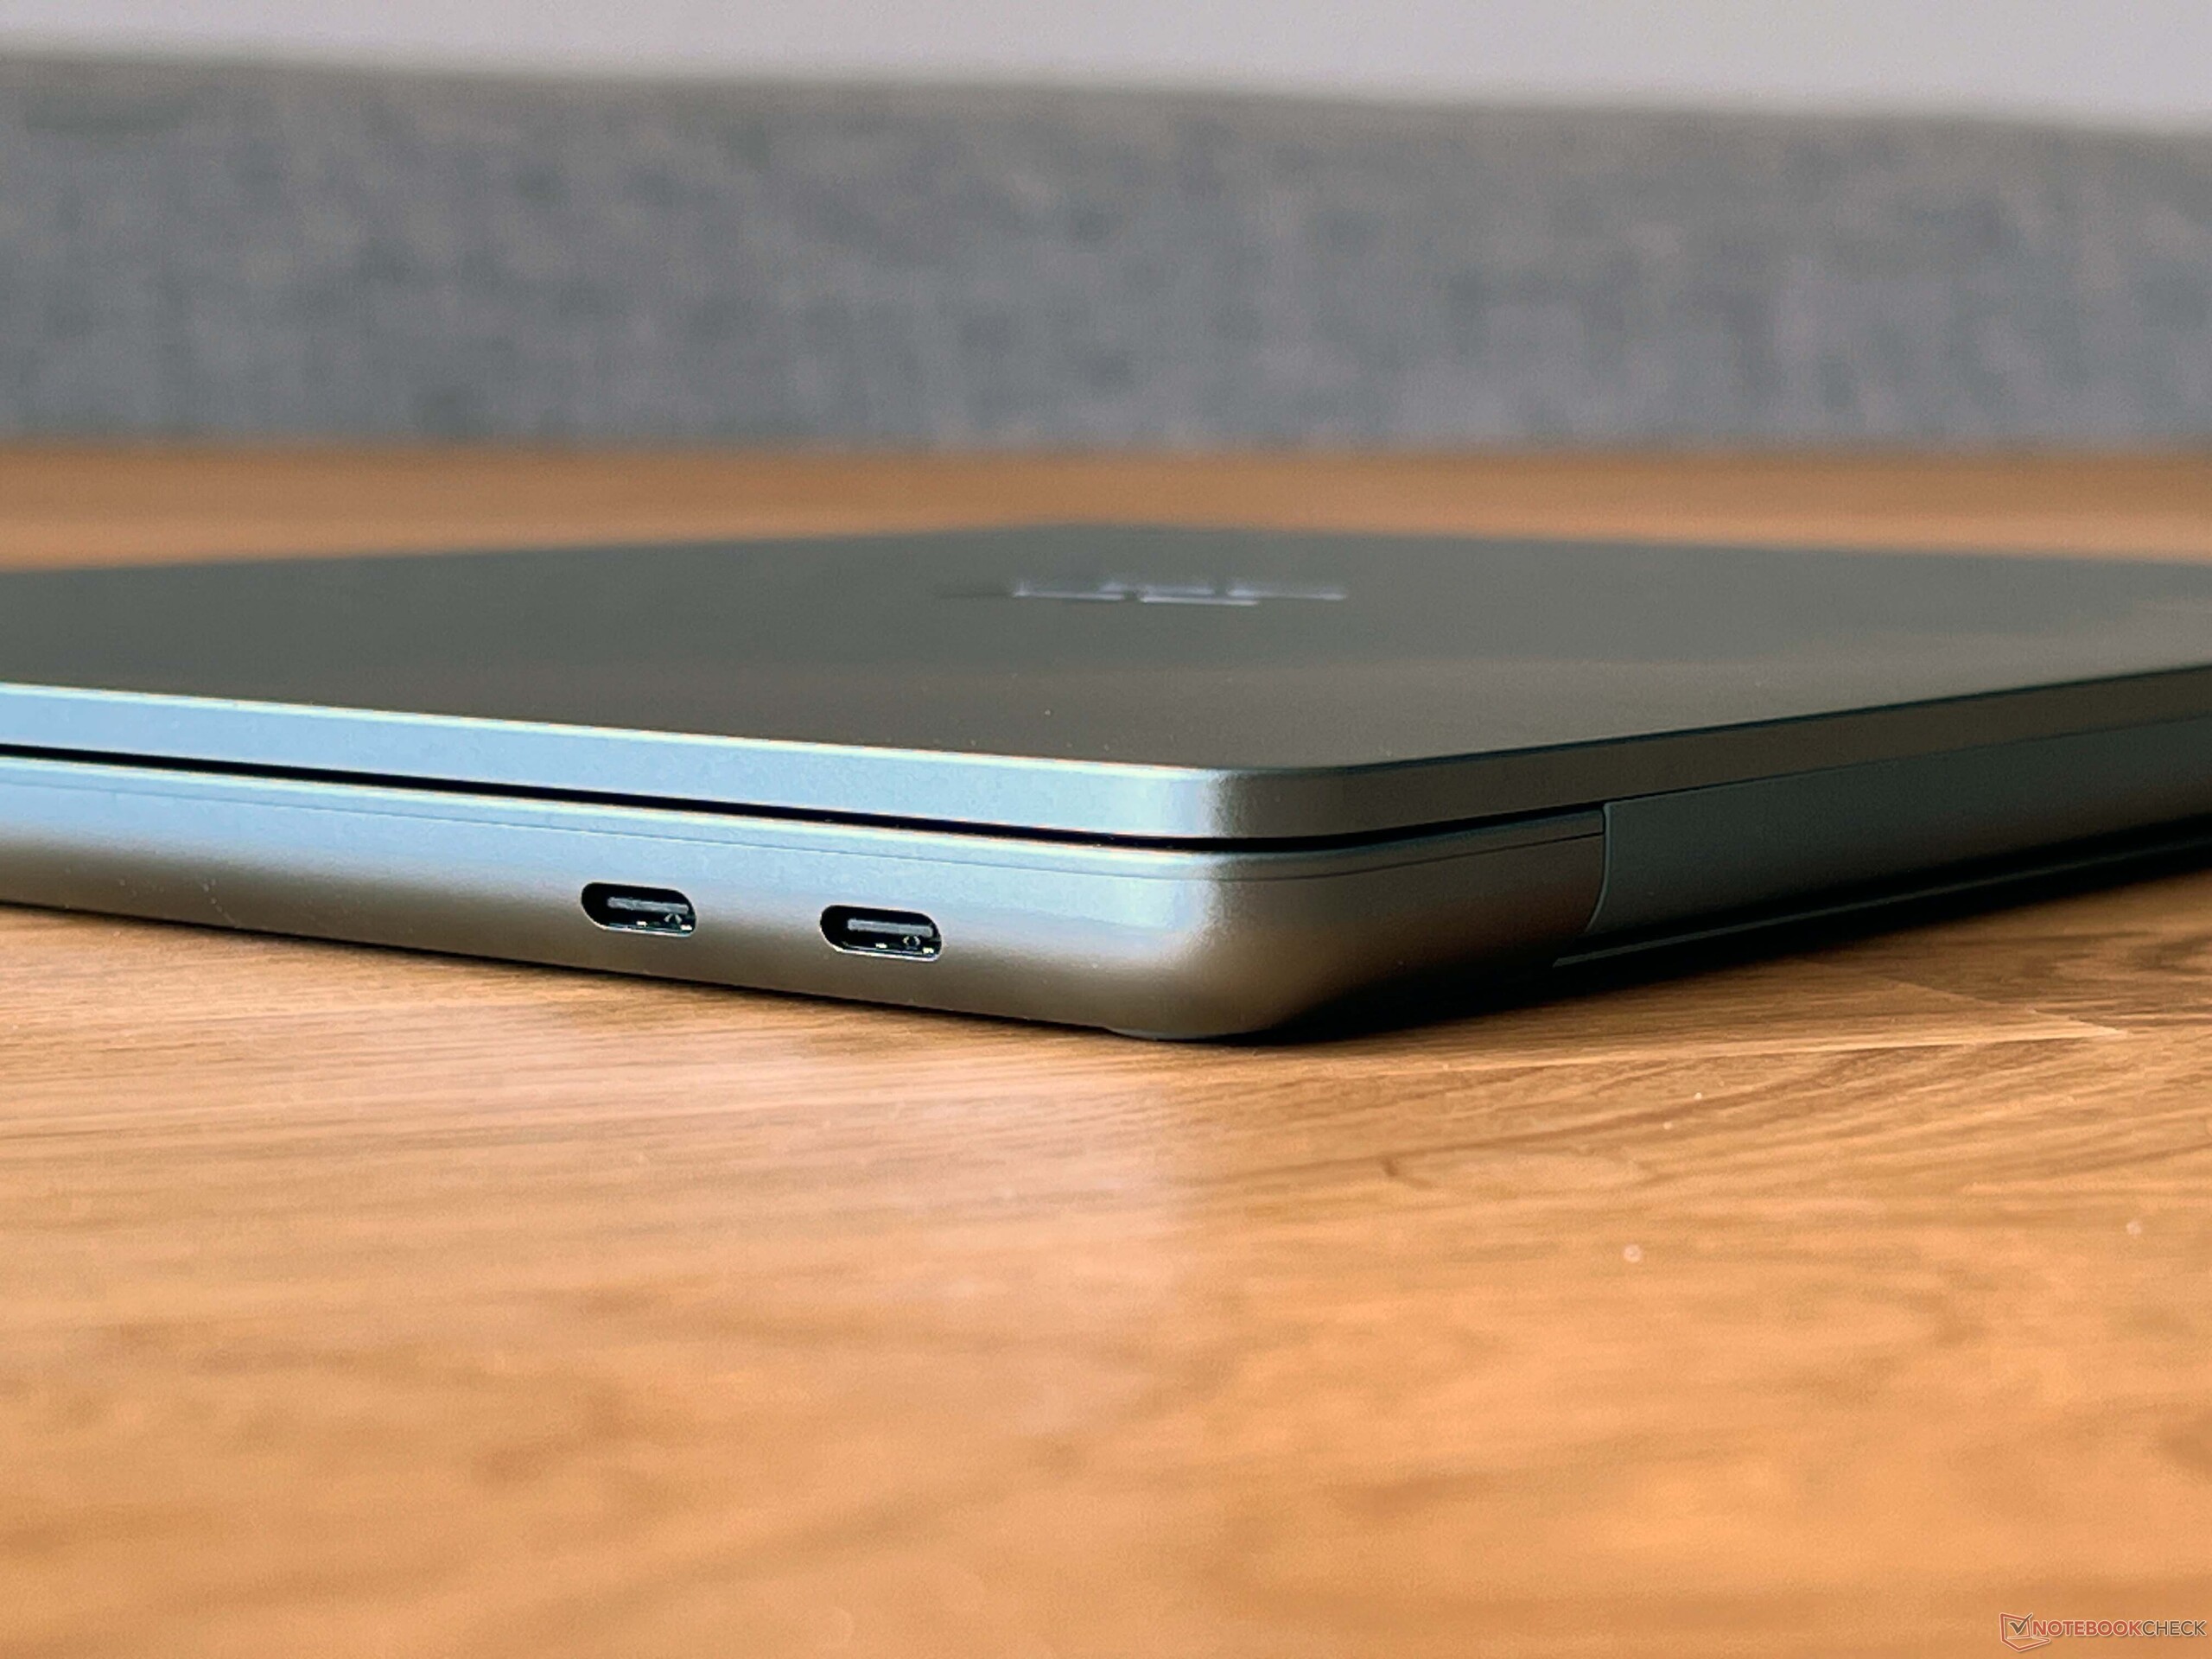
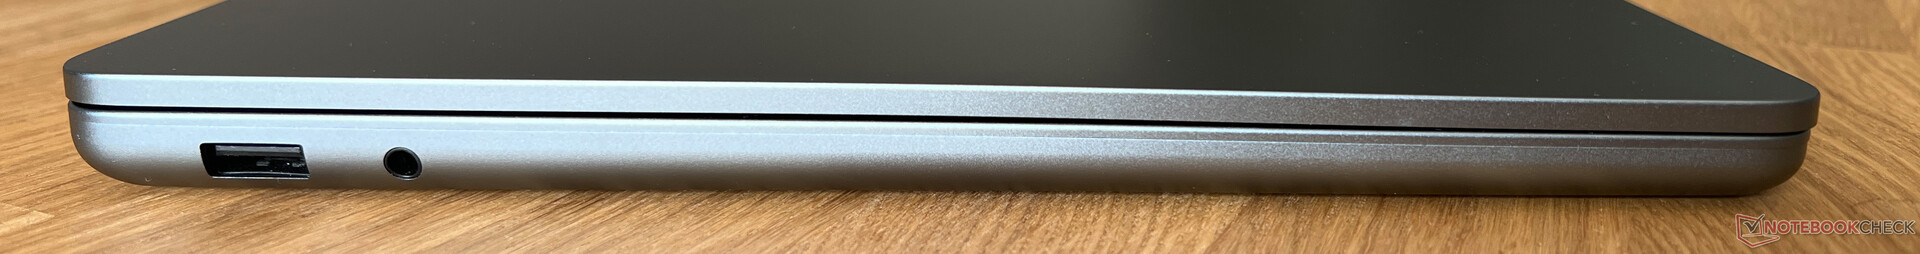
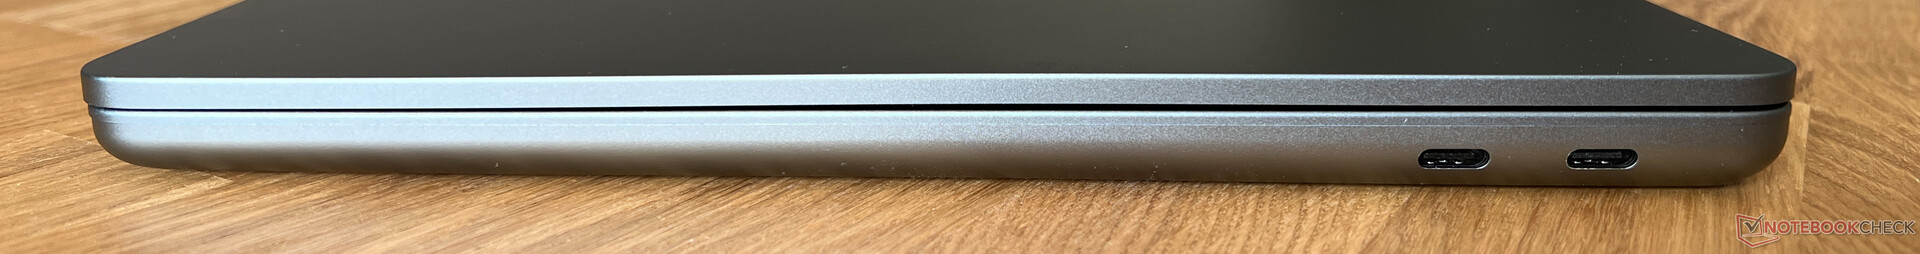
在连接性方面,微软取消了 Surface 连接器,如果你还有相应的配件,这可能会成为一个问题。两个 USB-C 端口仅支持 3.2 标准。不过,这款笔记本支持 Wi-Fi 7,在我们的测试中传输速率非常出色。它的 1080p 网络摄像头能拍出不错的照片,而且该设备是一款 Copilot+ 笔记本电脑。
| Networking | |
| Microsoft Surface Laptop 13 | |
| iperf3 transmit AXE11000 | |
| iperf3 receive AXE11000 | |
| Microsoft Surface Laptop 7 13.8 Copilot+ | |
| iperf3 transmit AXE11000 | |
| iperf3 receive AXE11000 | |
| iperf3 transmit AXE11000 6GHz | |
| iperf3 receive AXE11000 6GHz | |
| Apple MacBook Air 13 M3 10C GPU | |
| iperf3 transmit AXE11000 | |
| iperf3 receive AXE11000 | |
| Dell XPS 13 9345 | |
| iperf3 transmit AXE11000 | |
| iperf3 receive AXE11000 | |
| iperf3 transmit AXE11000 6GHz | |
| iperf3 receive AXE11000 6GHz | |
| Framework Laptop 13.5 Core Ultra 7 155H | |
| iperf3 transmit AXE11000 | |
| iperf3 receive AXE11000 | |
| iperf3 transmit AXE11000 6GHz | |
| iperf3 receive AXE11000 6GHz | |
| Microsoft Surface Laptop Go 3 | |
| iperf3 transmit AXE11000 | |
| iperf3 receive AXE11000 | |


可持续性
Surface Laptop 13 获得了 "能源之星"(Energy Star)认证,微软还在其网站上说明了哪些部件是由可回收材料制成的。不过,与 Surface Laptop 13.8 不同的是,微软没有提供有关外壳本身的详细信息。其包装可完全回收。
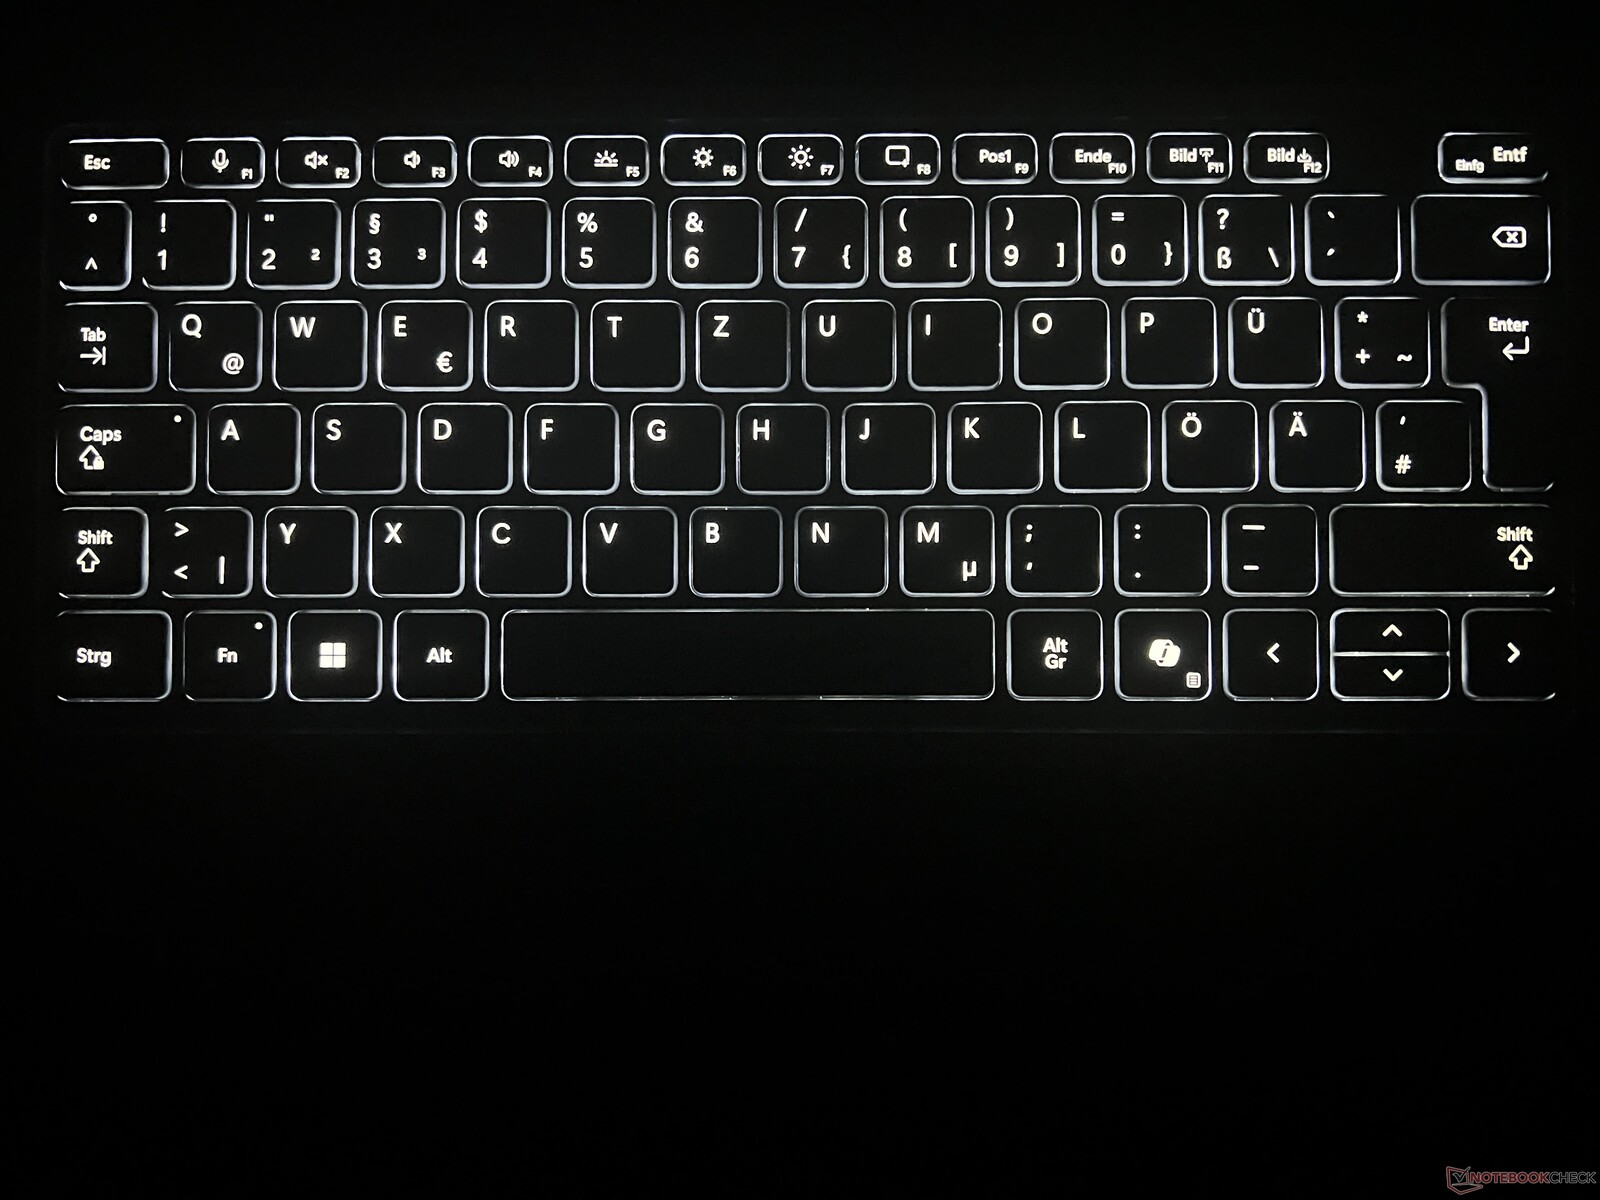
输入设备 - 背光键盘
笔记本电脑的背光键盘输入感觉舒适,右上方的电源按钮集成了指纹传感器。与 Surface Laptop 13.8 相比,该机型没有配备触觉触控板,但普通的点击式触控板却能很好地完成任务。它手感舒适顺滑,并能发出安静的机械点击声。
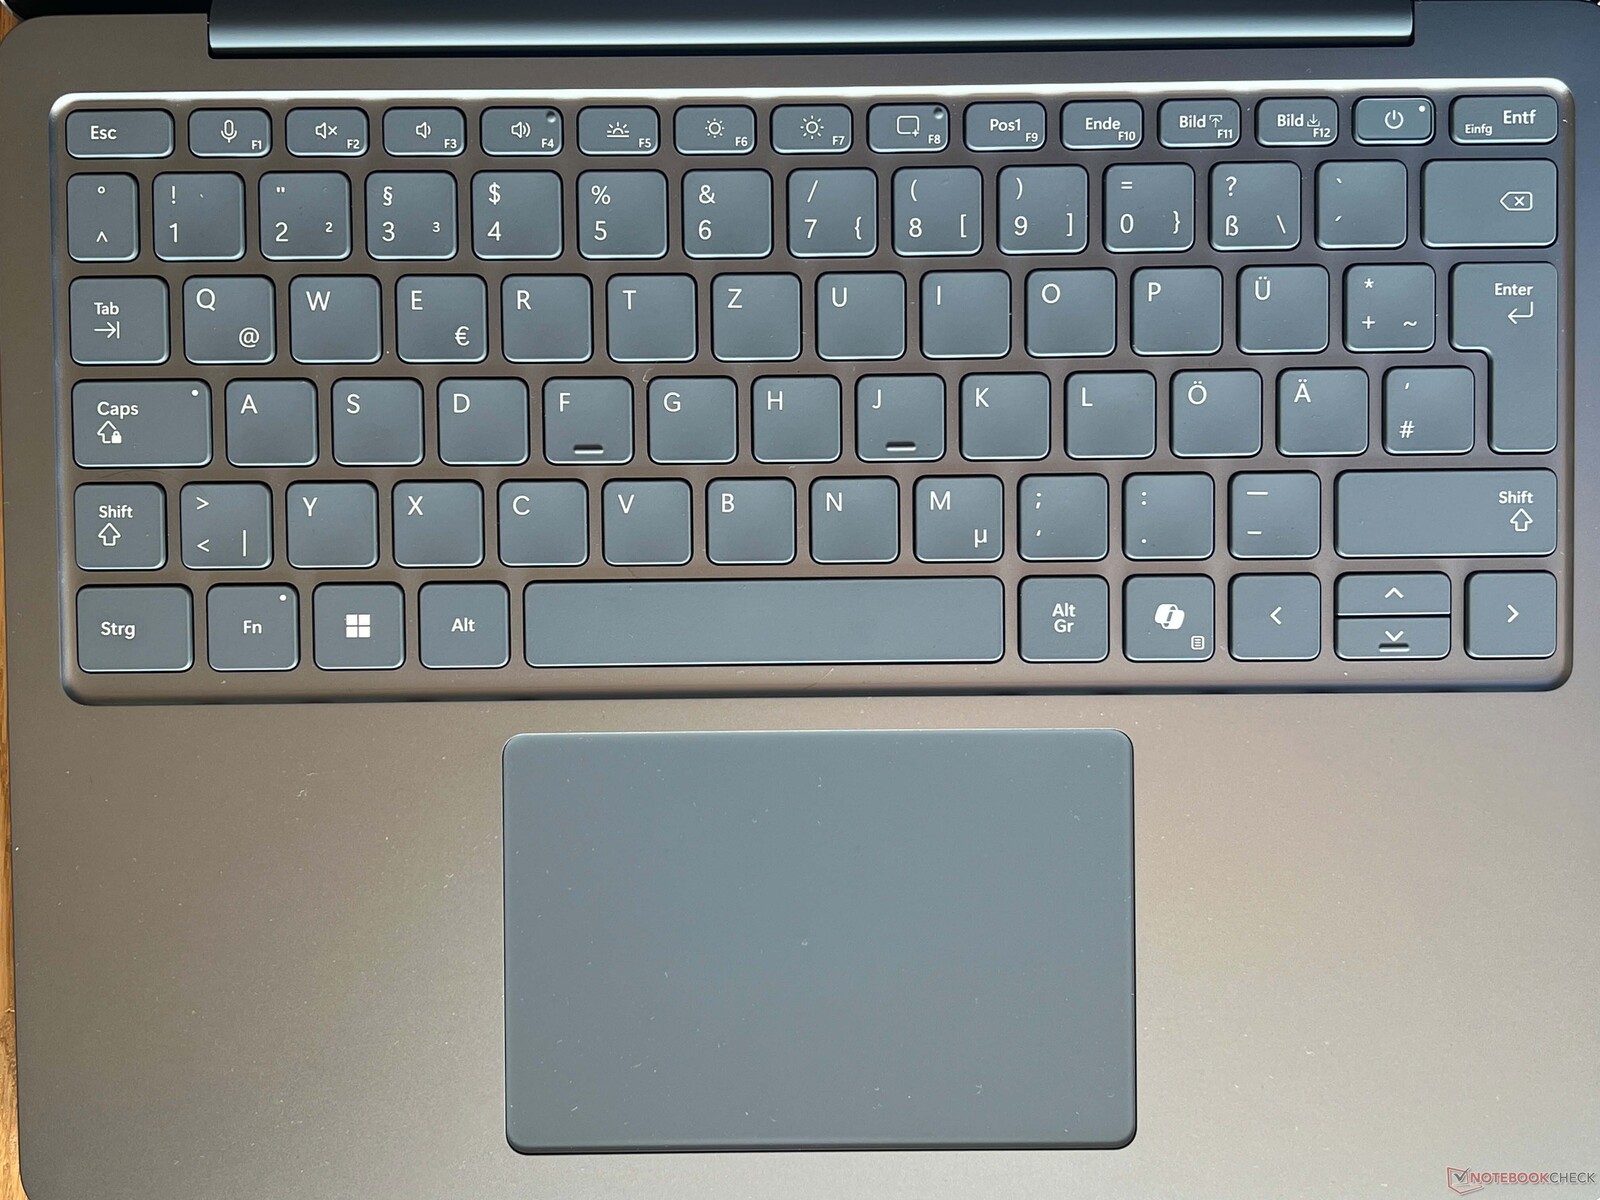
此外,微软还为我们带来了新款 Surface Arc 鼠标,它可以做成扁平状以便运输。不过,它只能在弯曲时使用,而且只支持一种姿势。就人体工学而言,这款鼠标的手感并不好,因为其纤细的设计意味着你的无名指和小拇指几乎总是悬在空中。机械按键是一个小的 ClickPad,你还可以在上面滚动。这样做效果还不错,但有些累赘,总的来说,我们无法推荐 Surface Arc 鼠标。
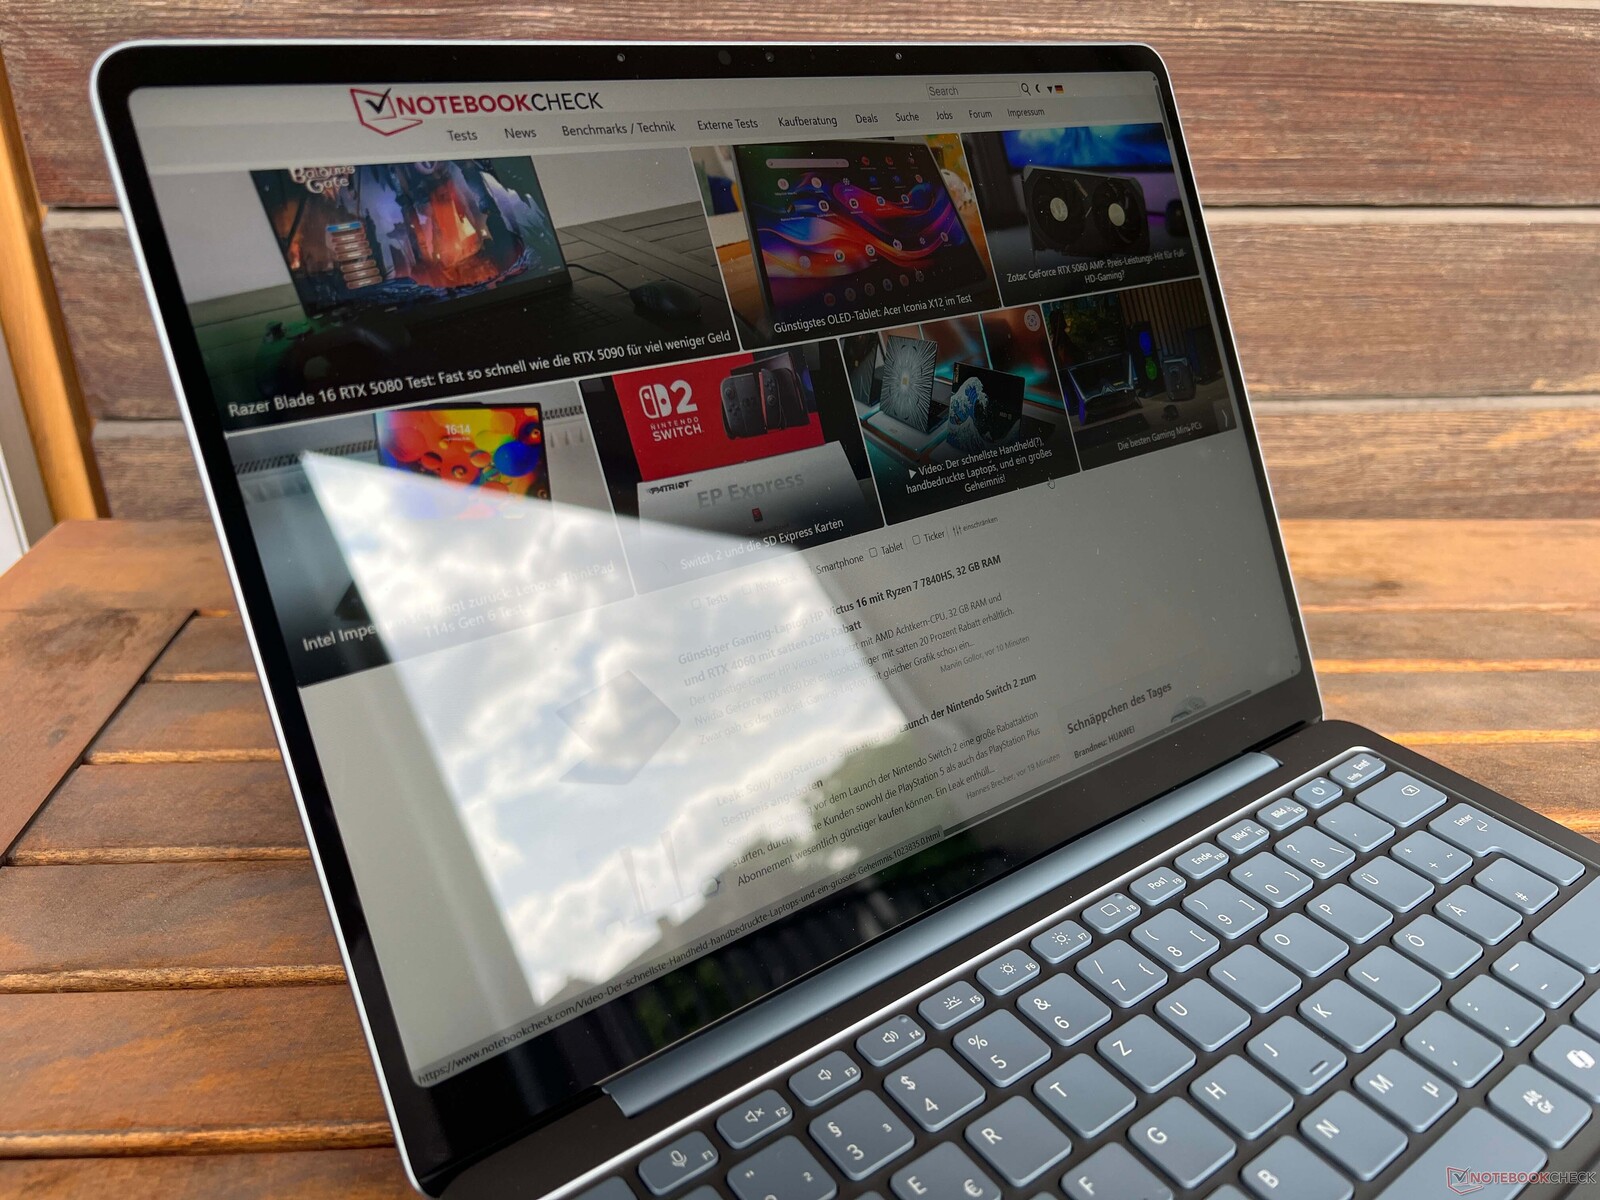
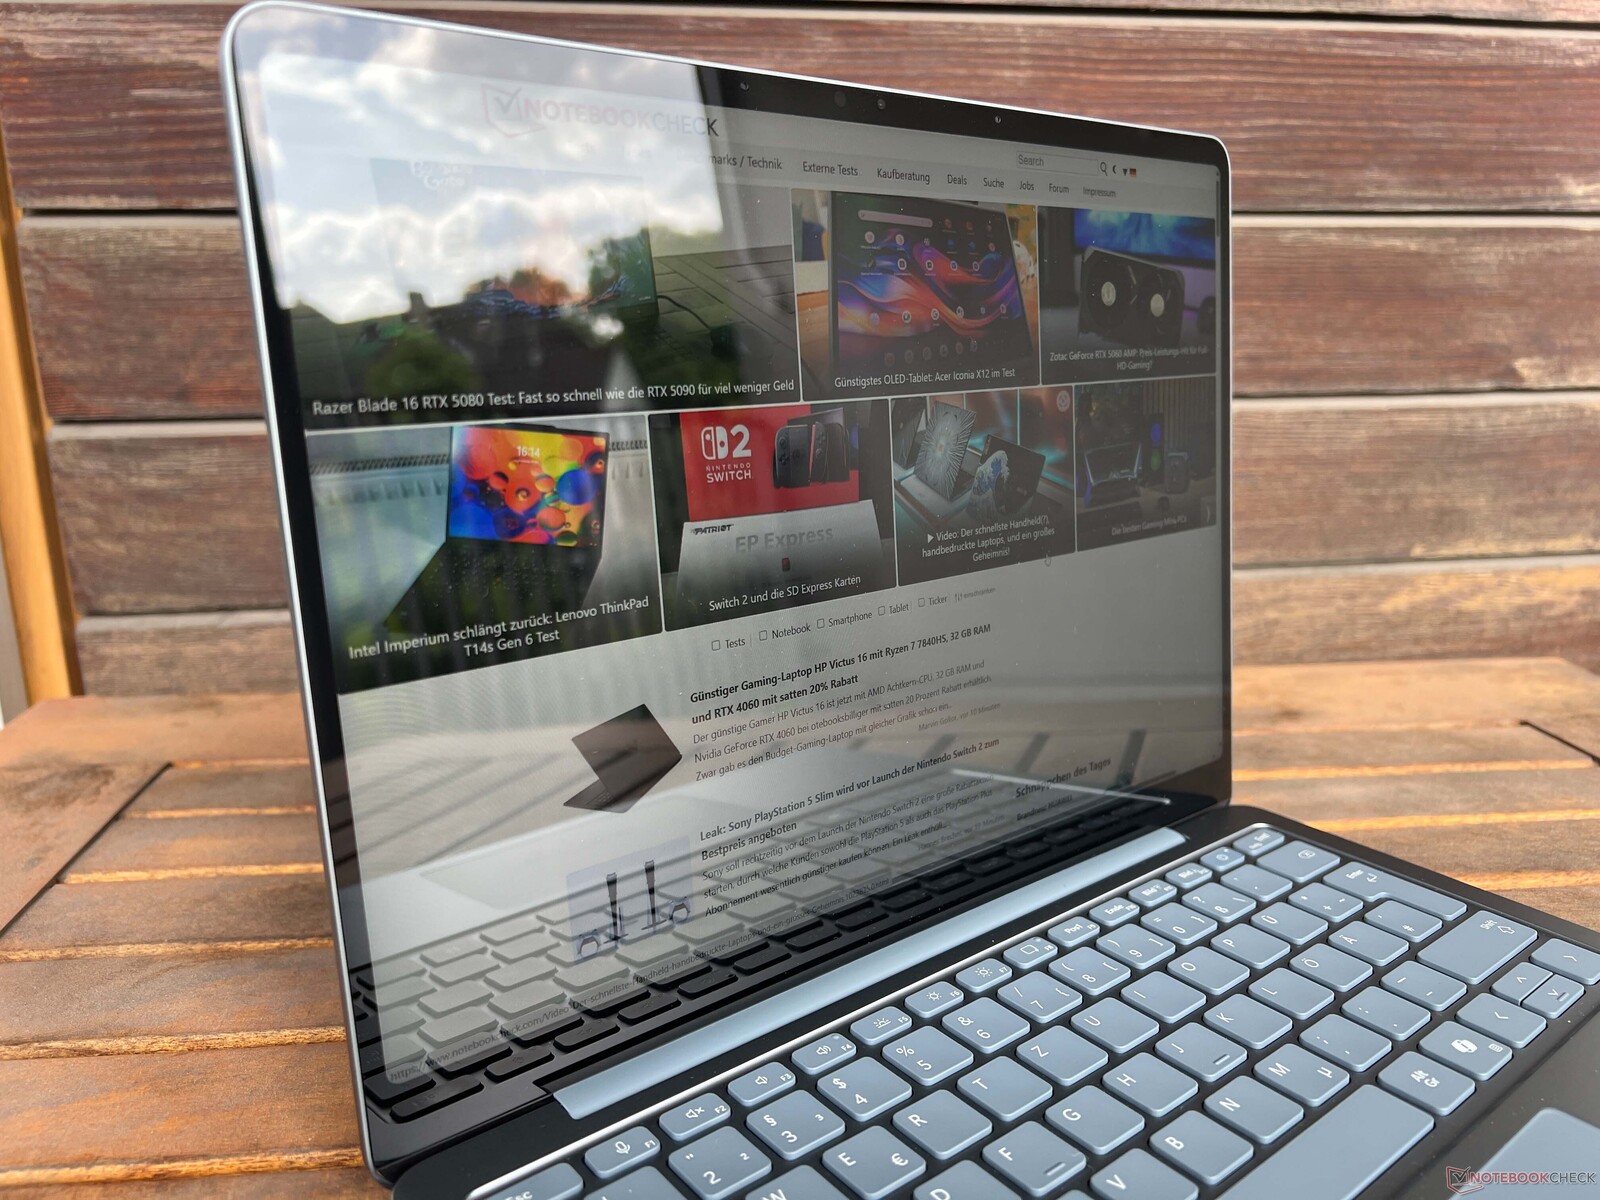
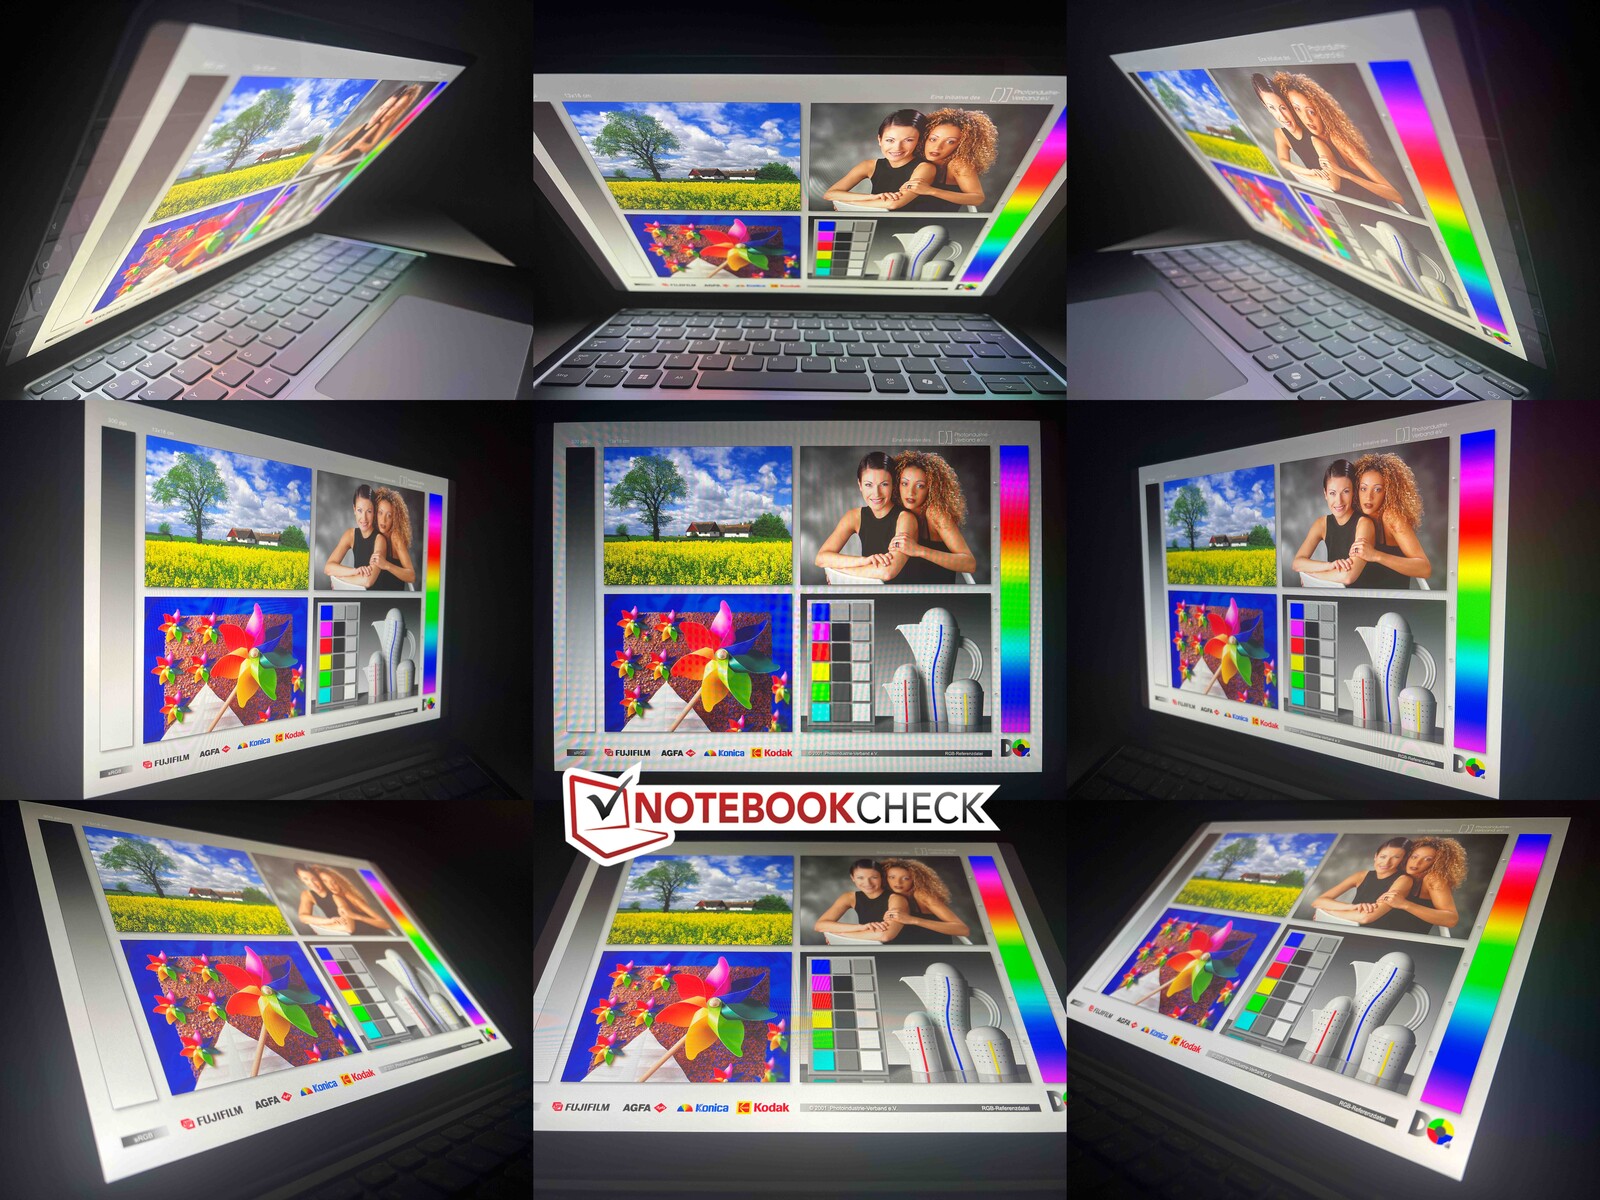
显示屏 - IPS,60 赫兹
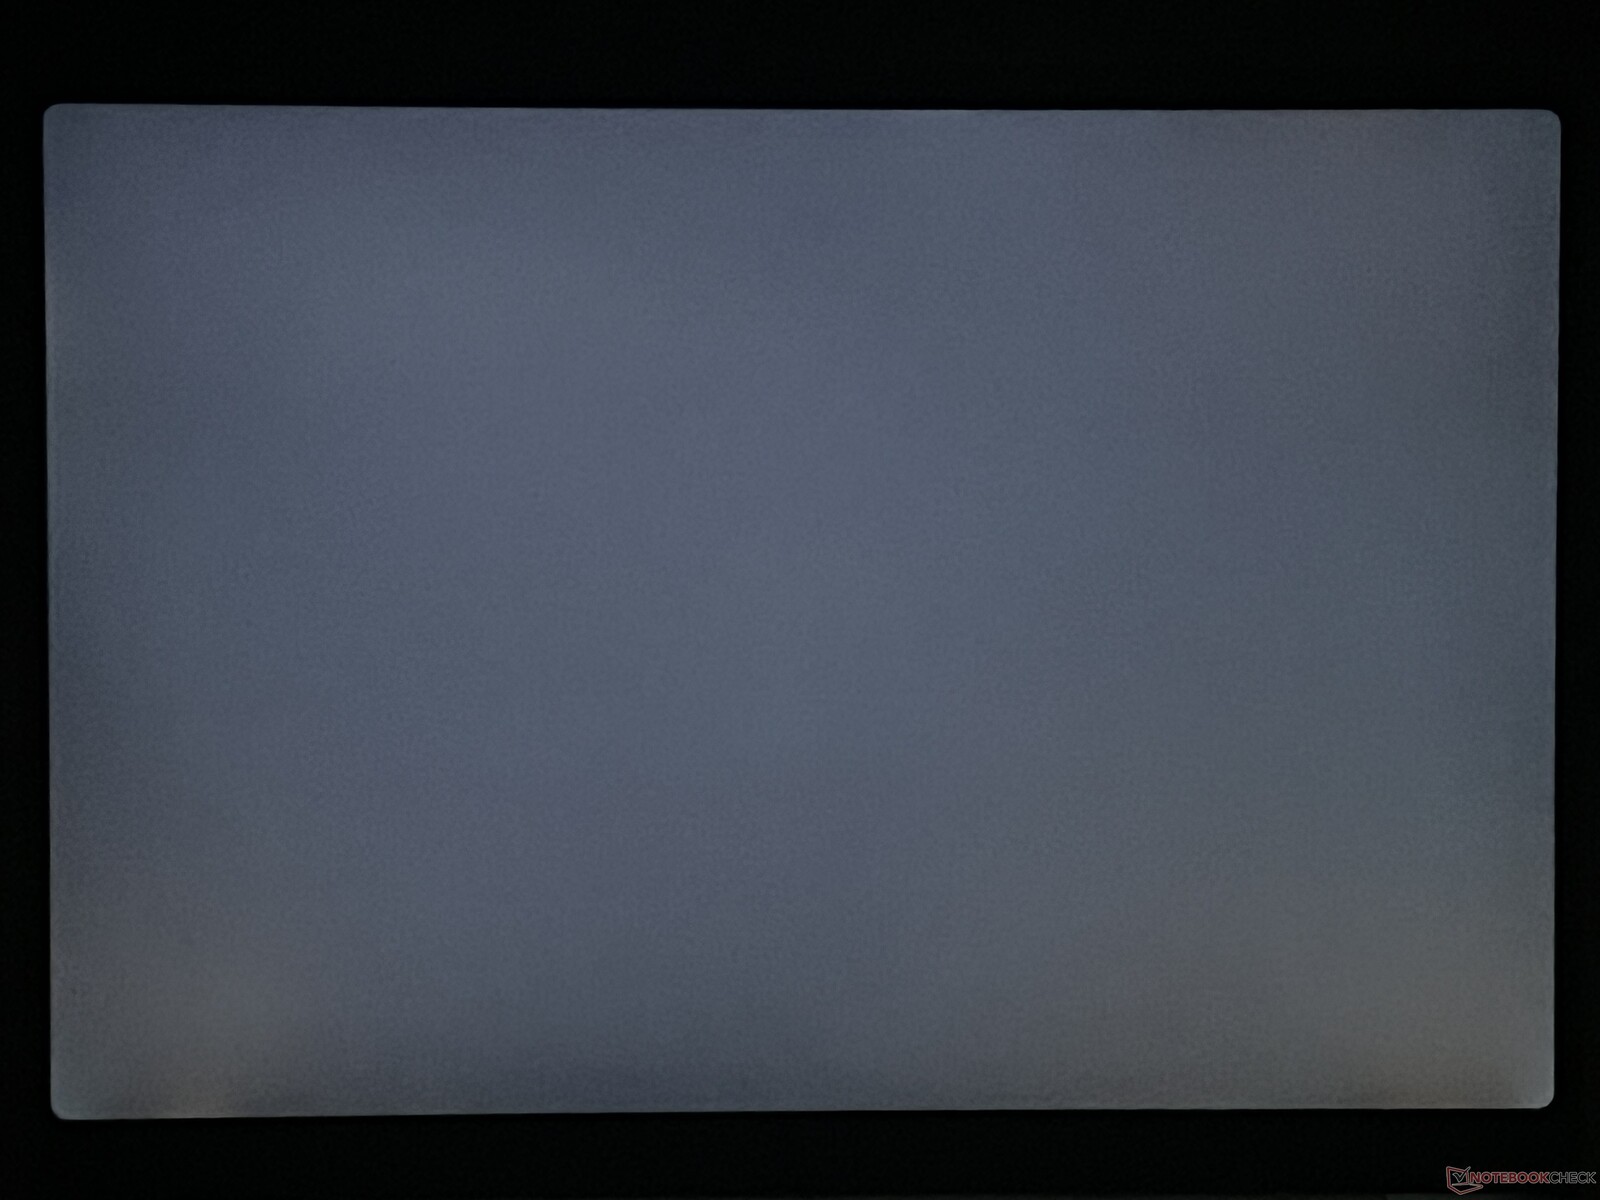
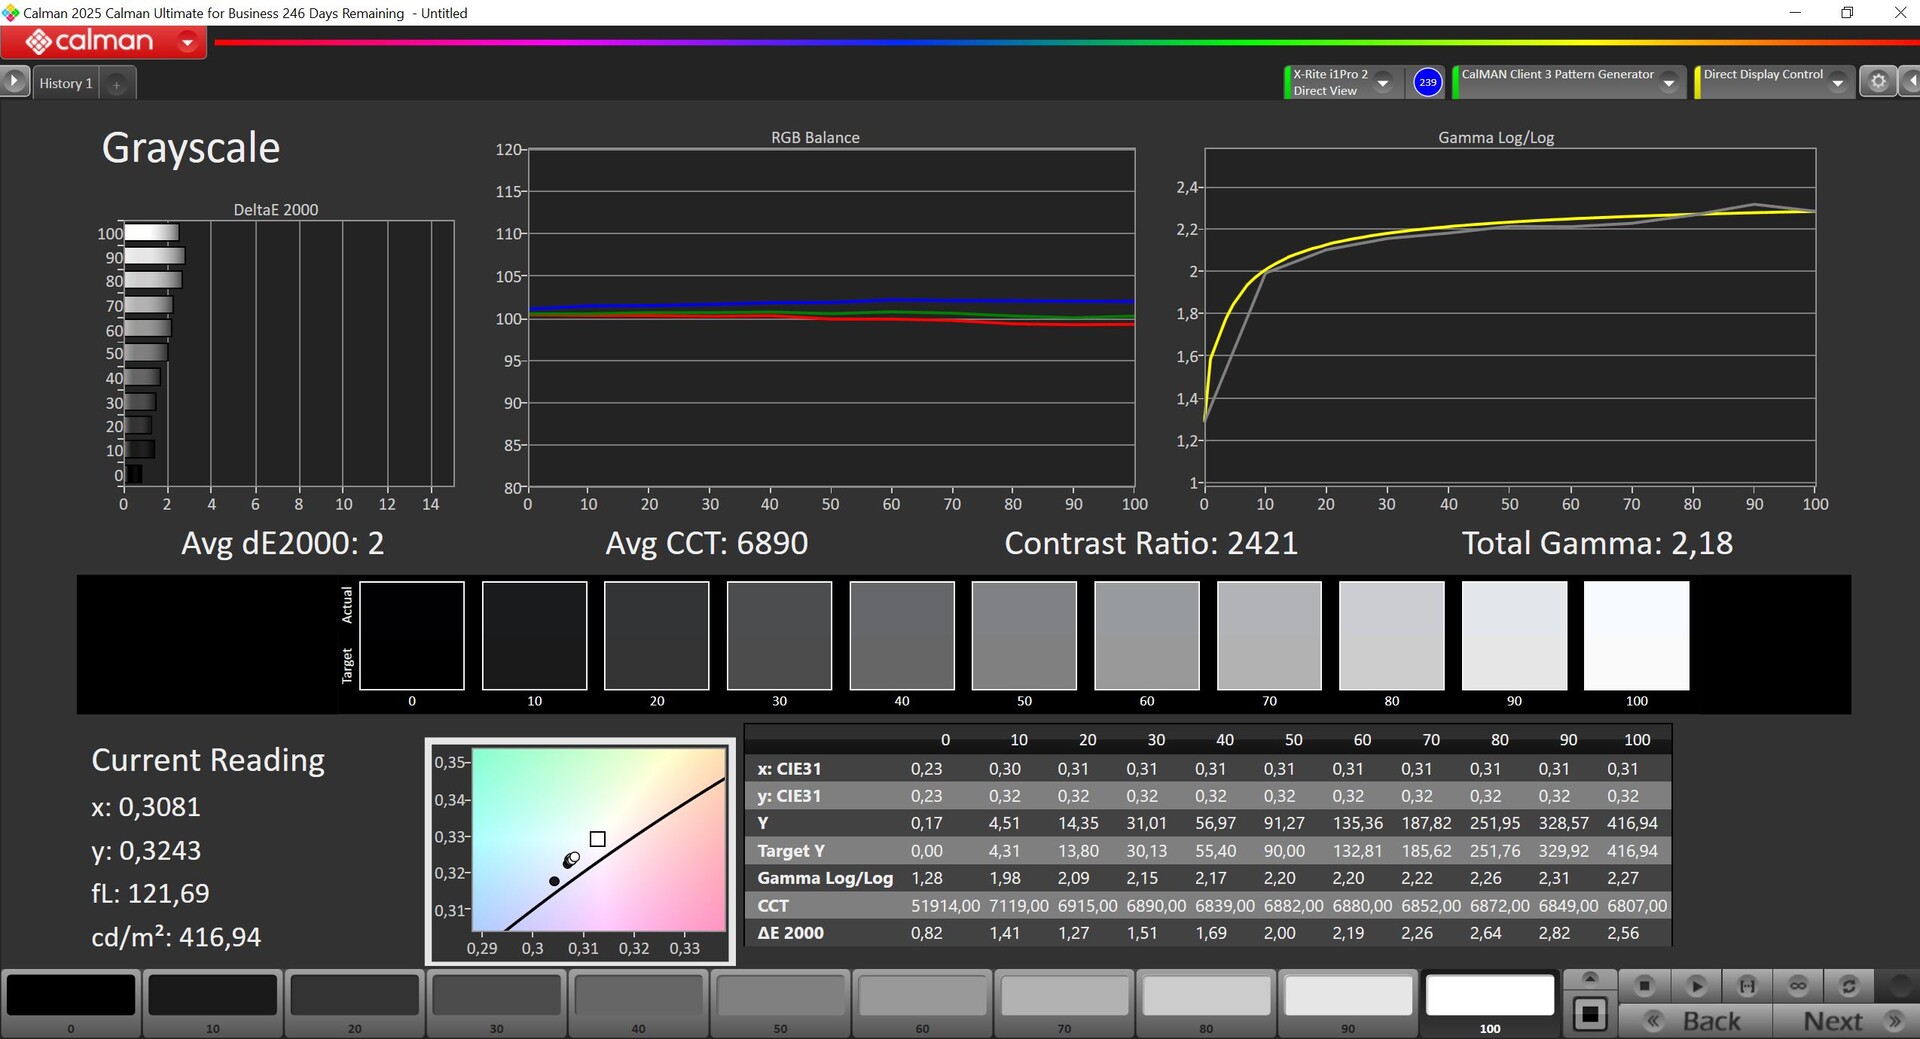
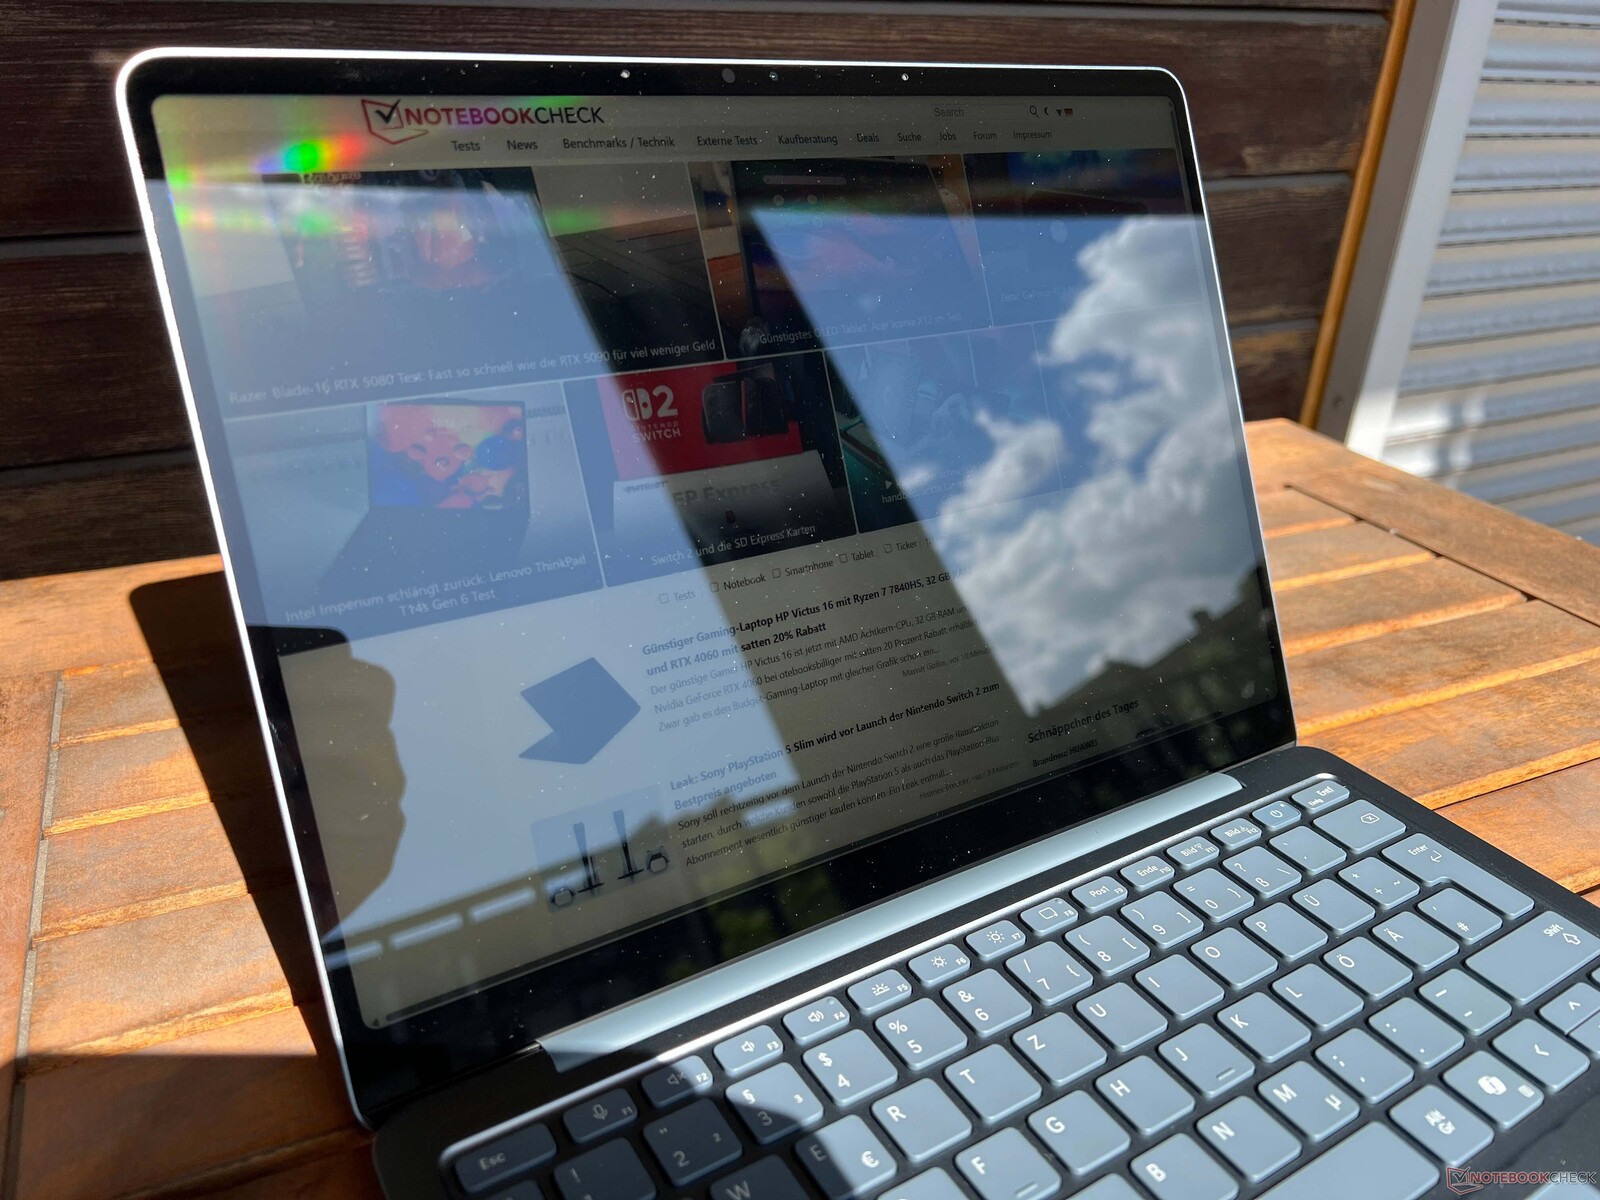
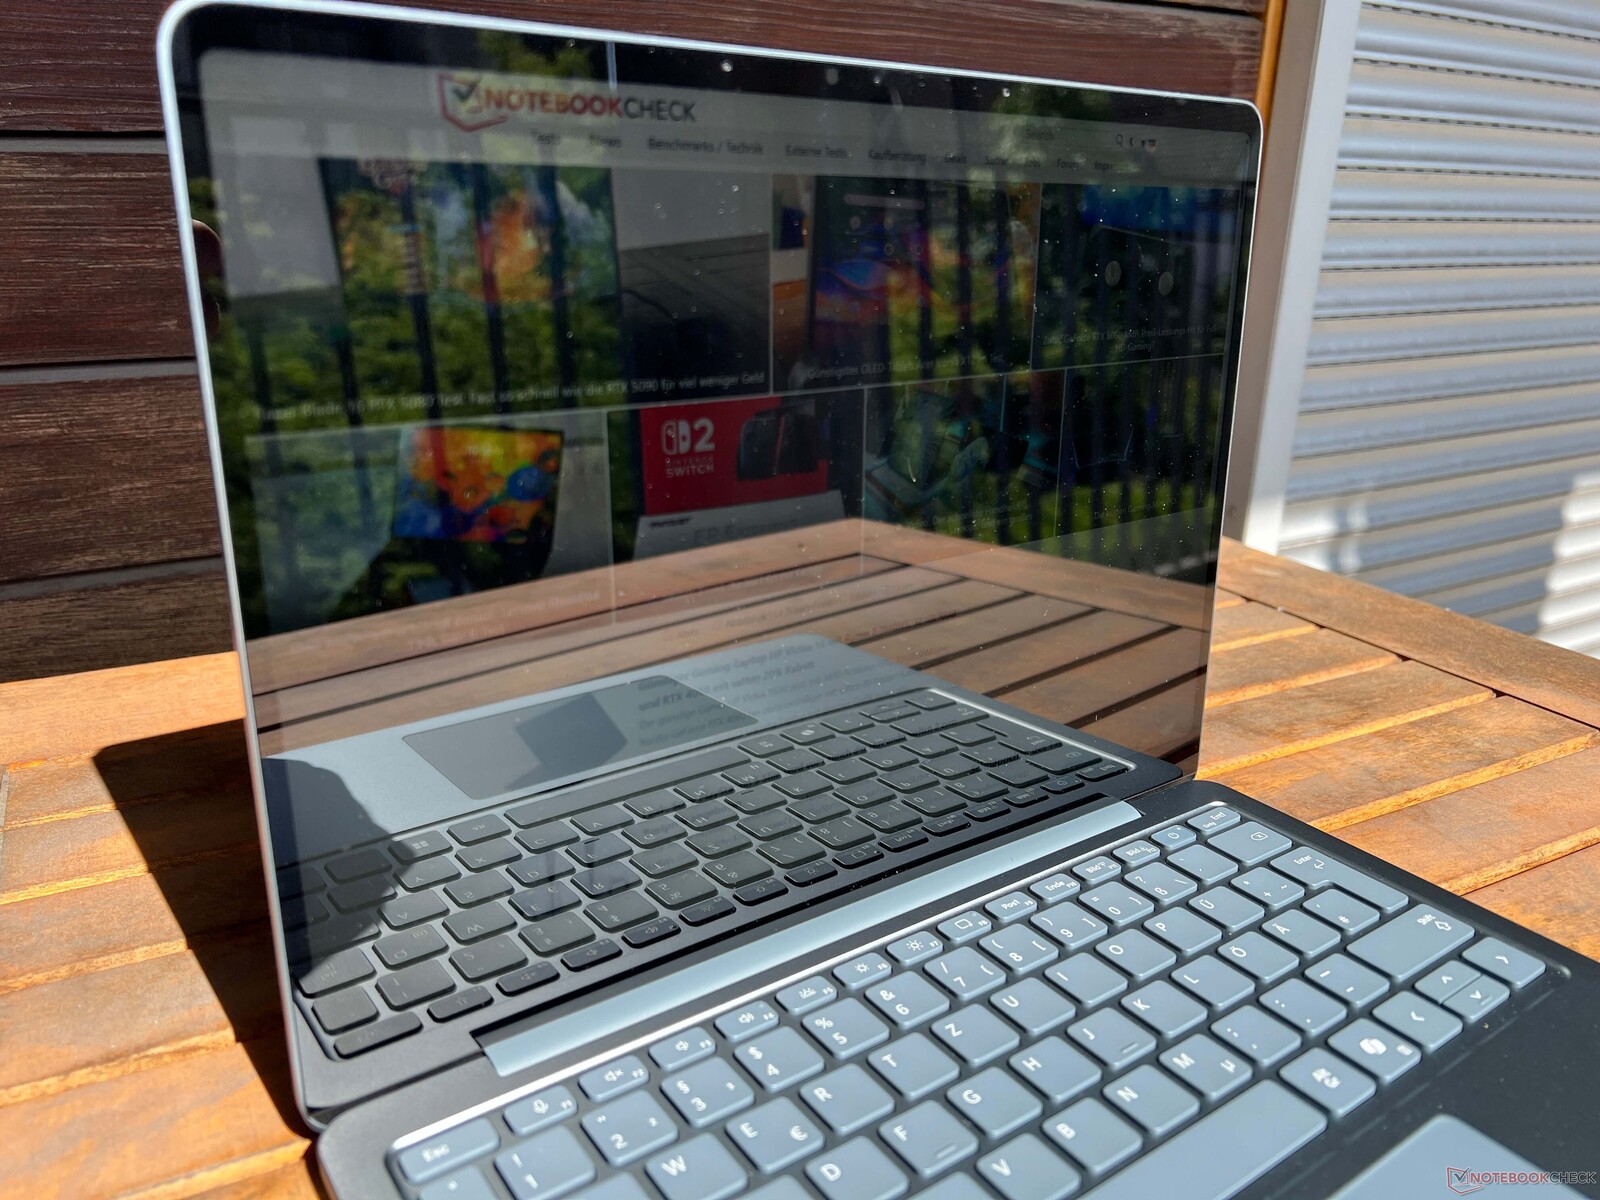
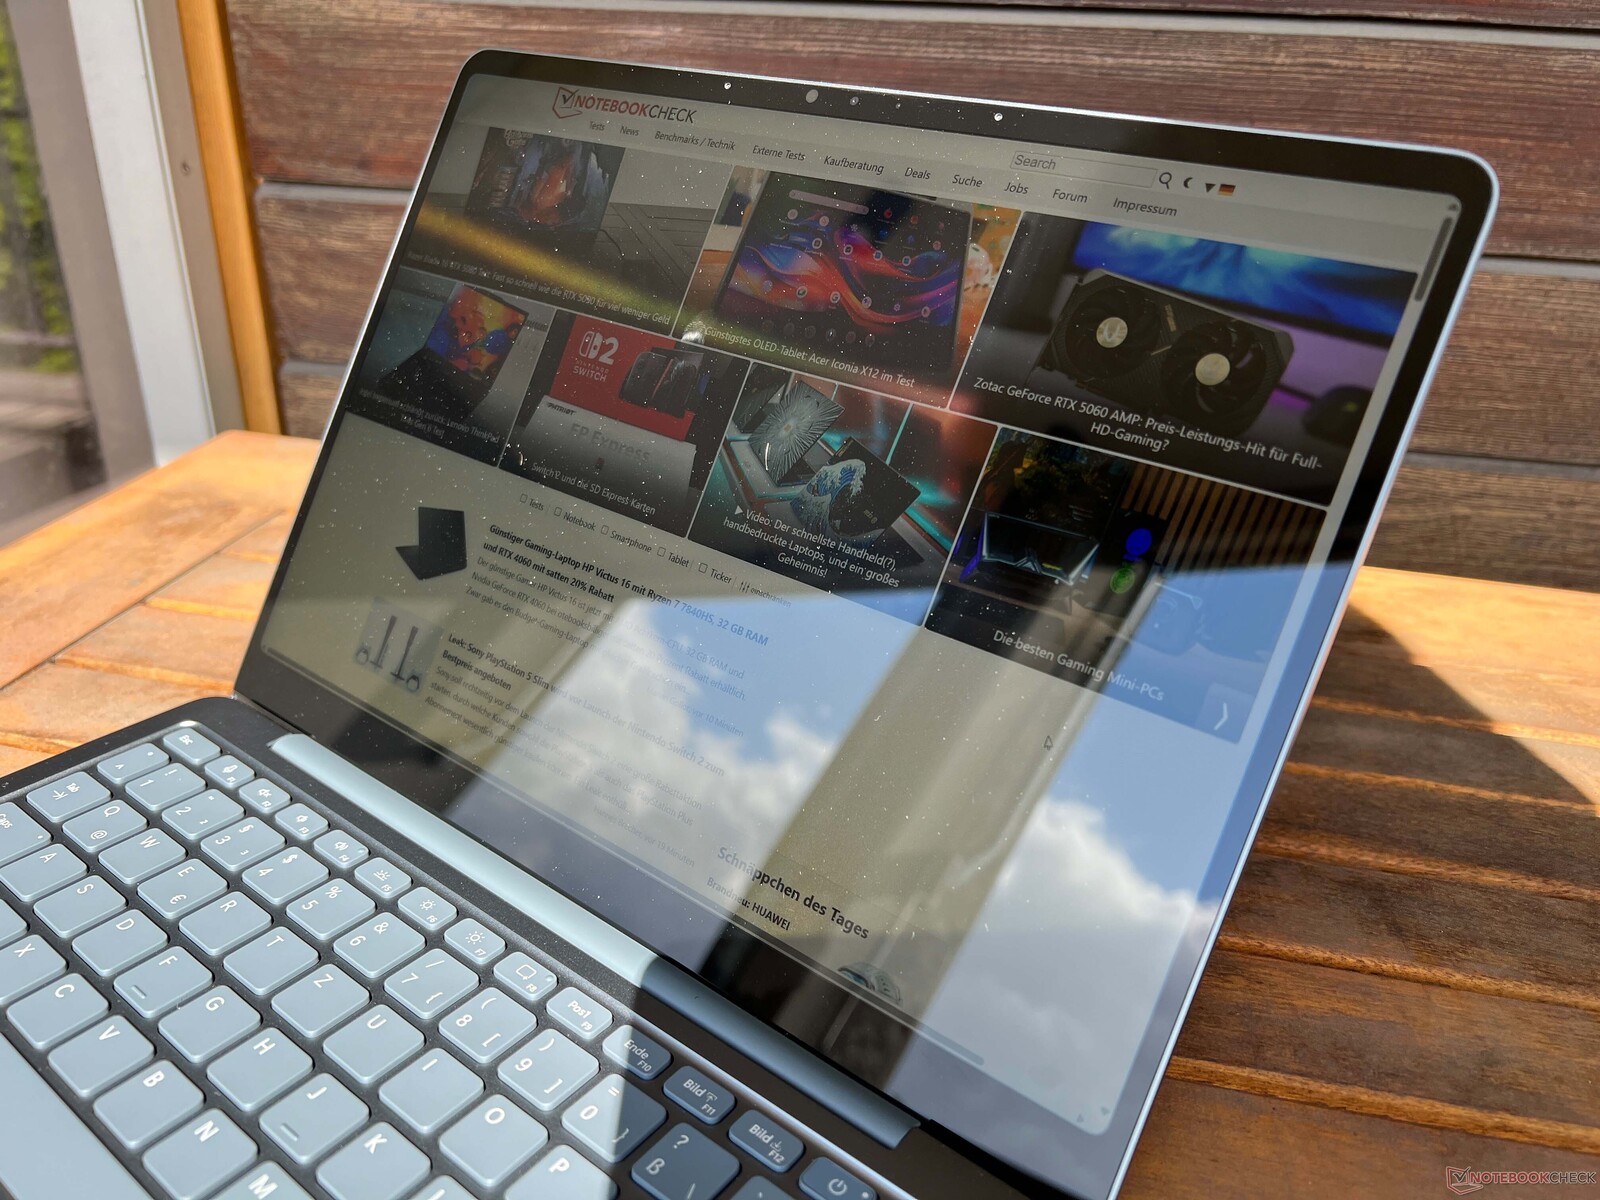
这款笔记本的 13 英寸 IPS 屏幕分辨率为 1,920 x 1,280 像素(3:2),主观上看,画质不错,即使是明亮的表面也不会出现颗粒感。色彩鲜艳(sRGB),内容足够锐利,但遗憾的是刷新率只有 60 Hz。我们没有注意到任何 PWM 闪烁,虽然其响应时间不是最快的,但在日常使用中应该不会注意到这一点。您可以通过传感器调节亮度和色温。由于面板的反光性很强,室外使用时会遇到一些问题。
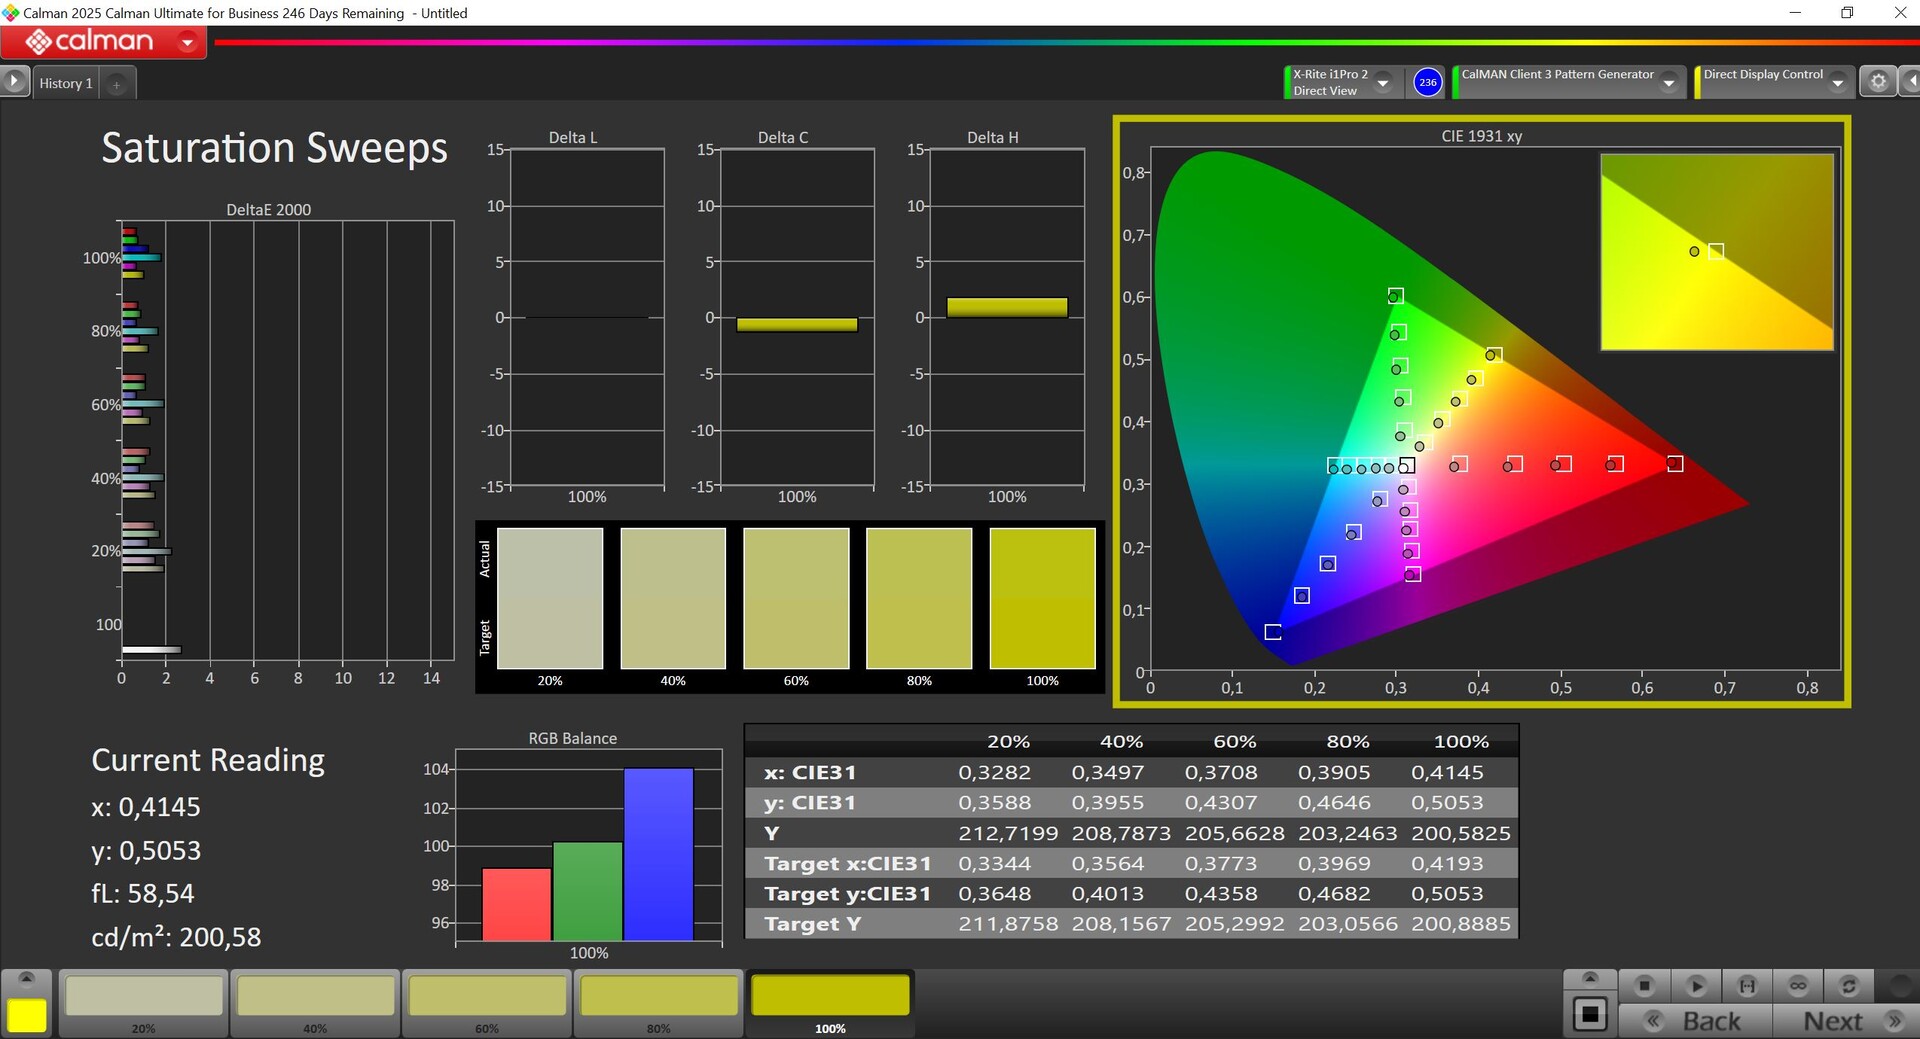
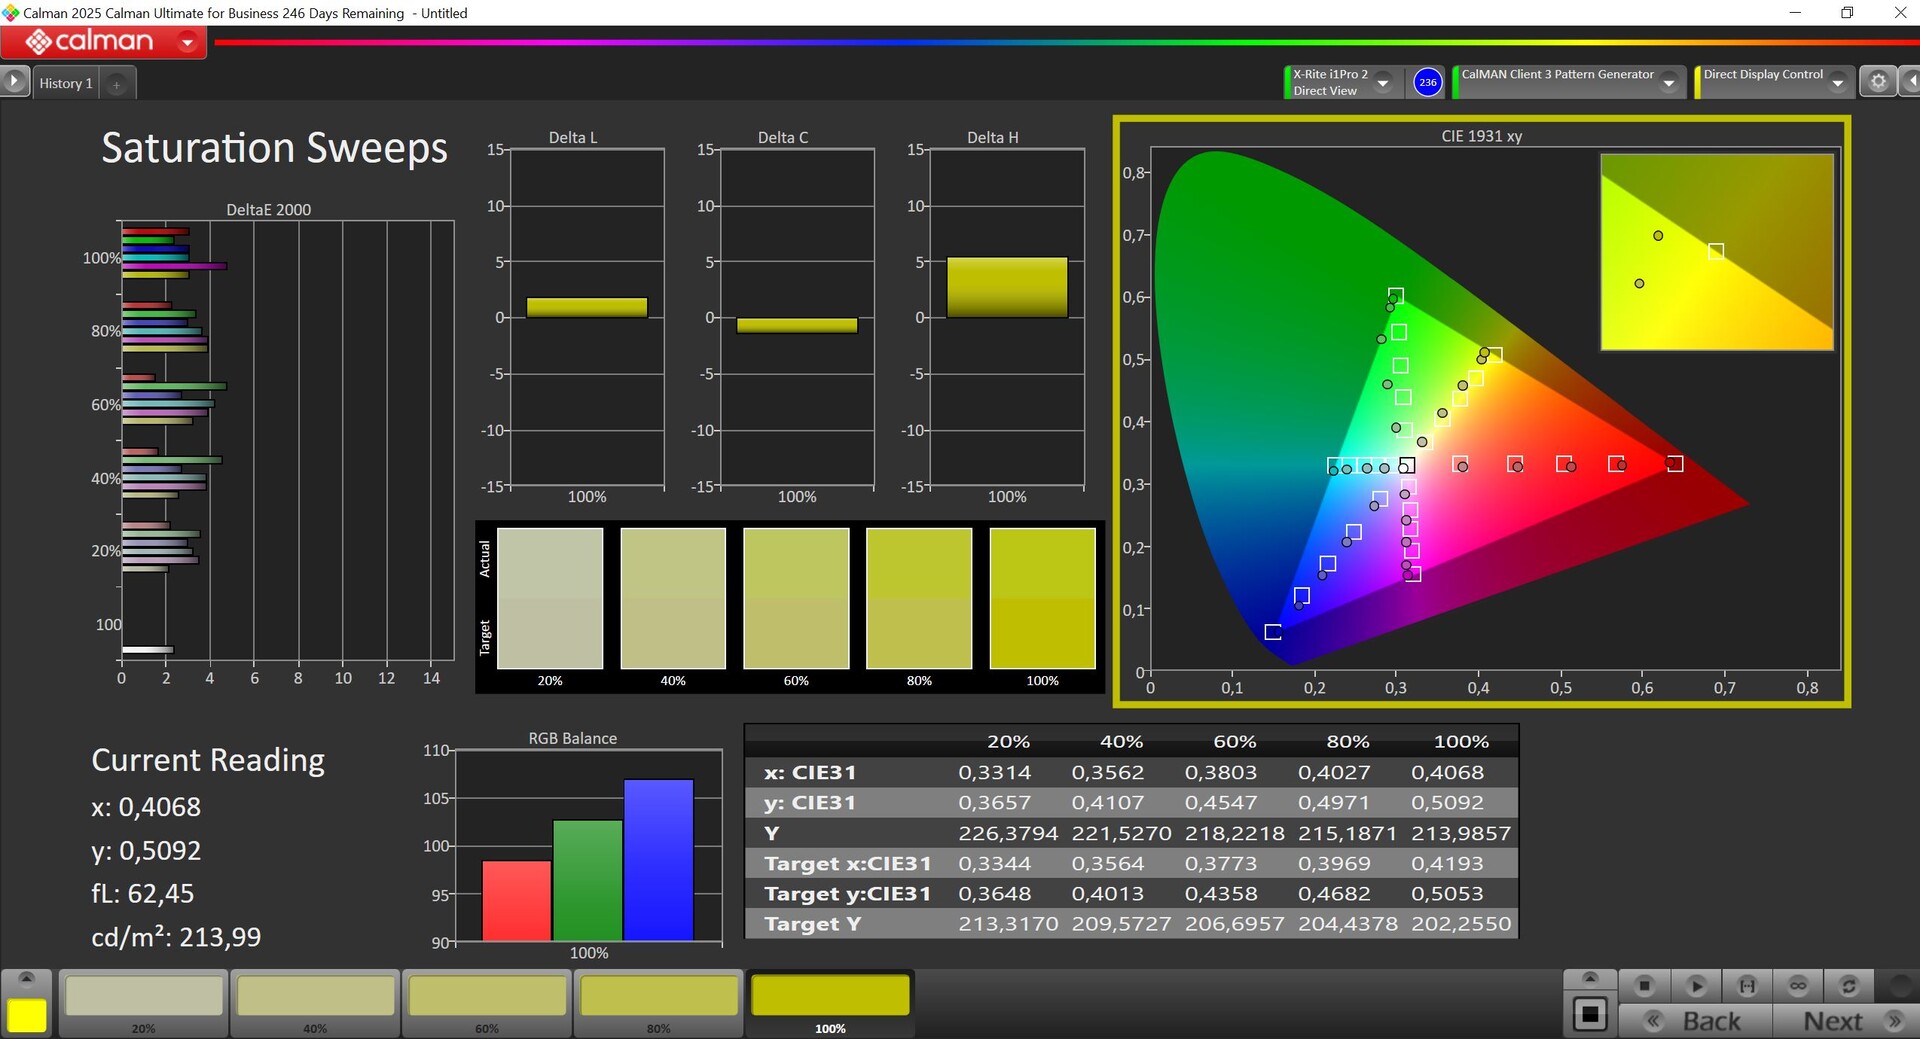
它的亮度略高于 400 cd/m2,加上较低的黑阶(0.17),最大对比度非常高。我们使用专业的 CalMAN 软件对预装的两个色彩配置文件进行了分析。增强型配置文件显示的色彩有点过饱和,而 sRGB 配置文件则非常准确,因此编辑图像时不会出现任何问题。不过,Surface 13.8 笔记本电脑的屏幕 表面笔记本电脑 13.8(更亮、120 Hz、P3)显然更好。
| |||||||||||||||||||||||||
Brightness Distribution: 92 %
Center on Battery: 417 cd/m²
Contrast: 2453:1 (Black: 0.17 cd/m²)
ΔE ColorChecker Calman: 1.3 | ∀{0.5-29.43 Ø4.71}
ΔE Greyscale Calman: 2 | ∀{0.09-98 Ø4.96}
72.6% AdobeRGB 1998 (Argyll 3D)
97.6% sRGB (Argyll 3D)
72.4% Display P3 (Argyll 3D)
Gamma: 2.18
CCT: 6890 K
| Microsoft Surface Laptop 13 LP130WU112413, IPS, 1920x1280, 13", 60 Hz | Microsoft Surface Laptop 7 13.8 Copilot+ LQ138P1JX61, IPS, 2304x1536, 13.8", 120 Hz | Apple MacBook Air 13 M4 Entry IPS, 2560x1664, 13.6", 60 Hz | Apple MacBook Air 13 M3 10C GPU IPS, 2560x1664, 13.6", 60 Hz | Dell XPS 13 9345 IPS, 1920x1200, 13.4", 120 Hz | Framework Laptop 13.5 Core Ultra 7 155H BOE NE135A1M-NY1, IPS, 2880x1920, 13.5", 120 Hz | Microsoft Surface Laptop Go 3 LP125WX172403, IPS, 1536x1024, 12.4", 60 Hz | |
|---|---|---|---|---|---|---|---|
| Display | 19% | 20% | 20% | -2% | 1% | -7% | |
| Display P3 Coverage (%) | 72.4 | 97.8 35% | 98.4 36% | 98.4 36% | 69.4 -4% | 72.8 1% | 64.5 -11% |
| sRGB Coverage (%) | 97.6 | 98.2 1% | 99.9 2% | 99.9 2% | 97.8 0% | 98.6 1% | 96.9 -1% |
| AdobeRGB 1998 Coverage (%) | 72.6 | 87.3 20% | 87.9 21% | 87.9 21% | 71.7 -1% | 72.9 0% | 66.6 -8% |
| Response Times | 26% | 11% | 11% | 21% | 10% | 9% | |
| Response Time Grey 50% / Grey 80% * (ms) | 48.7 ? | 38.9 ? 20% | 34.5 ? 29% | 34.5 ? 29% | 35.2 ? 28% | 41.9 ? 14% | 36.7 ? 25% |
| Response Time Black / White * (ms) | 25.3 ? | 17.4 ? 31% | 27.2 ? -8% | 27.2 ? -8% | 21.8 ? 14% | 23.7 ? 6% | 27.1 ? -7% |
| PWM Frequency (Hz) | 60000 ? | ||||||
| Screen | -10% | -19% | -19% | -51% | -80% | -15% | |
| Brightness middle (cd/m²) | 417 | 606 45% | 525 26% | 525 26% | 518.3 24% | 498.5 20% | 339 -19% |
| Brightness (cd/m²) | 409 | 592 45% | 506 24% | 506 24% | 487 19% | 464 13% | 337 -18% |
| Brightness Distribution (%) | 92 | 94 2% | 92 0% | 92 0% | 86 -7% | 86 -7% | 96 4% |
| Black Level * (cd/m²) | 0.17 | 0.43 -153% | 0.42 -147% | 0.42 -147% | 0.26 -53% | 0.36 -112% | 0.34 -100% |
| Contrast (:1) | 2453 | 1409 -43% | 1250 -49% | 1250 -49% | 1993 -19% | 1385 -44% | 997 -59% |
| Colorchecker dE 2000 * | 1.3 | 1.3 -0% | 1.4 -8% | 1.4 -8% | 3.4 -162% | 4.27 -228% | 0.9 31% |
| Colorchecker dE 2000 max. * | 2.9 | 2.1 28% | 2.8 3% | 2.8 3% | 5.68 -96% | 7.08 -144% | 2.4 17% |
| Greyscale dE 2000 * | 2 | 2.1 -5% | 2 -0% | 2 -0% | 4.2 -110% | 4.7 -135% | 1.5 25% |
| Gamma | 2.18 101% | 2.16 102% | 2.2 100% | 2.2 100% | 2.29 96% | 2.09 105% | 2.23 99% |
| CCT | 6890 94% | 6842 95% | 6876 95% | 6876 95% | 7235 90% | 7417 88% | 6523 100% |
| Colorchecker dE 2000 calibrated * | 1.26 | ||||||
| Total Average (Program / Settings) | 12% /
2% | 4% /
-5% | 4% /
-5% | -11% /
-28% | -23% /
-47% | -4% /
-9% |
* ... smaller is better


Display Response Times
| ↔ Response Time Black to White | ||
|---|---|---|
| 25.3 ms ... rise ↗ and fall ↘ combined | ↗ 12.4 ms rise | 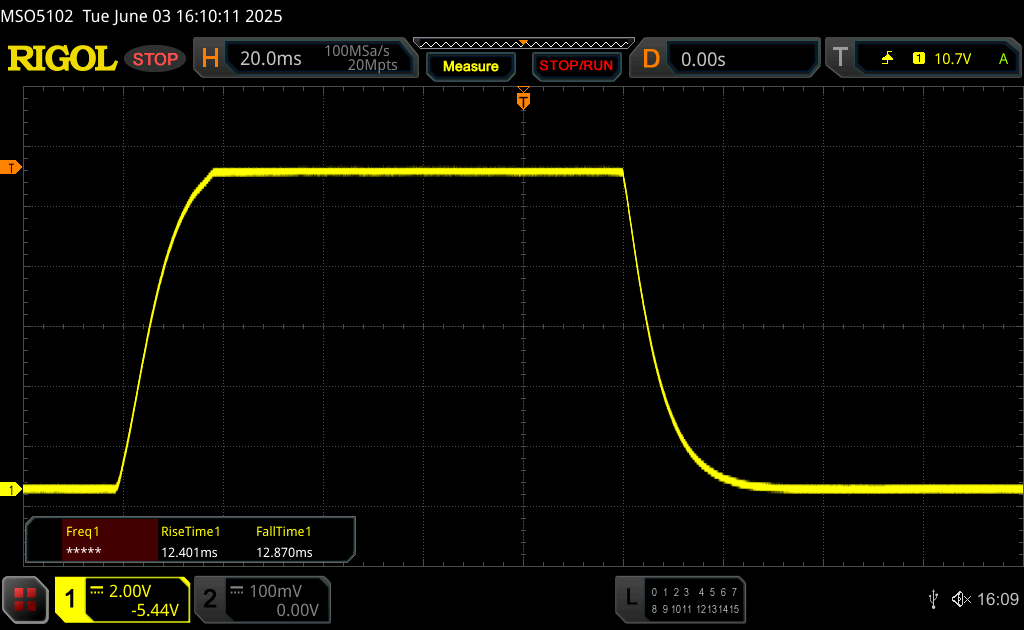 |
| ↘ 12.9 ms fall | ||
| The screen shows relatively slow response rates in our tests and may be too slow for gamers. In comparison, all tested devices range from 0.1 (minimum) to 240 (maximum) ms. » 61 % of all devices are better. This means that the measured response time is worse than the average of all tested devices (19.8 ms). | ||
| ↔ Response Time 50% Grey to 80% Grey | ||
| 48.7 ms ... rise ↗ and fall ↘ combined | ↗ 22.5 ms rise | 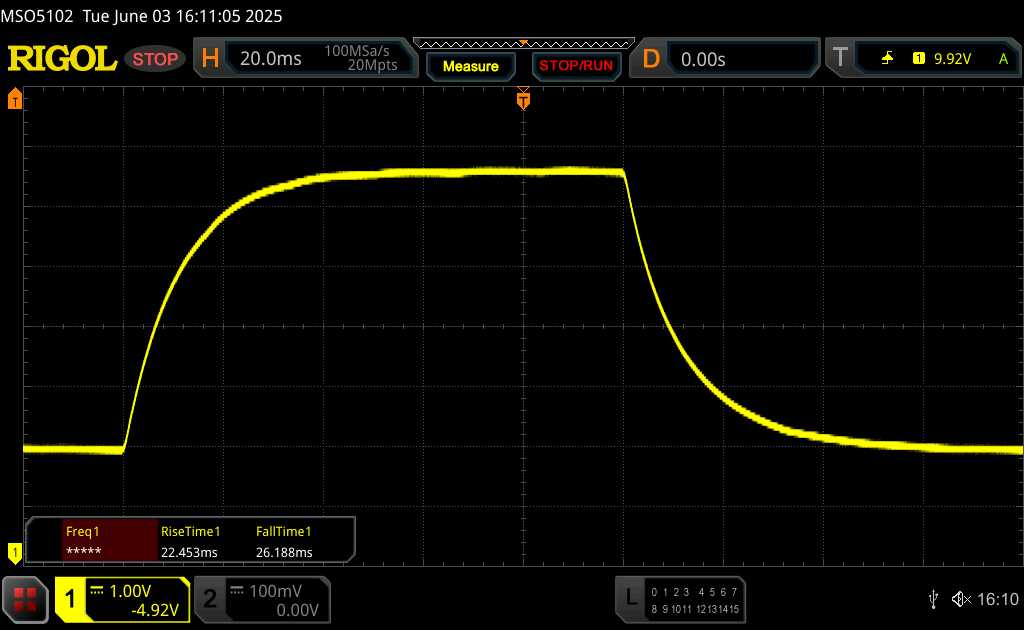 |
| ↘ 26.2 ms fall | ||
| The screen shows slow response rates in our tests and will be unsatisfactory for gamers. In comparison, all tested devices range from 0.165 (minimum) to 636 (maximum) ms. » 84 % of all devices are better. This means that the measured response time is worse than the average of all tested devices (31 ms). | ||
Screen Flickering / PWM (Pulse-Width Modulation)
| Screen flickering / PWM not detected | 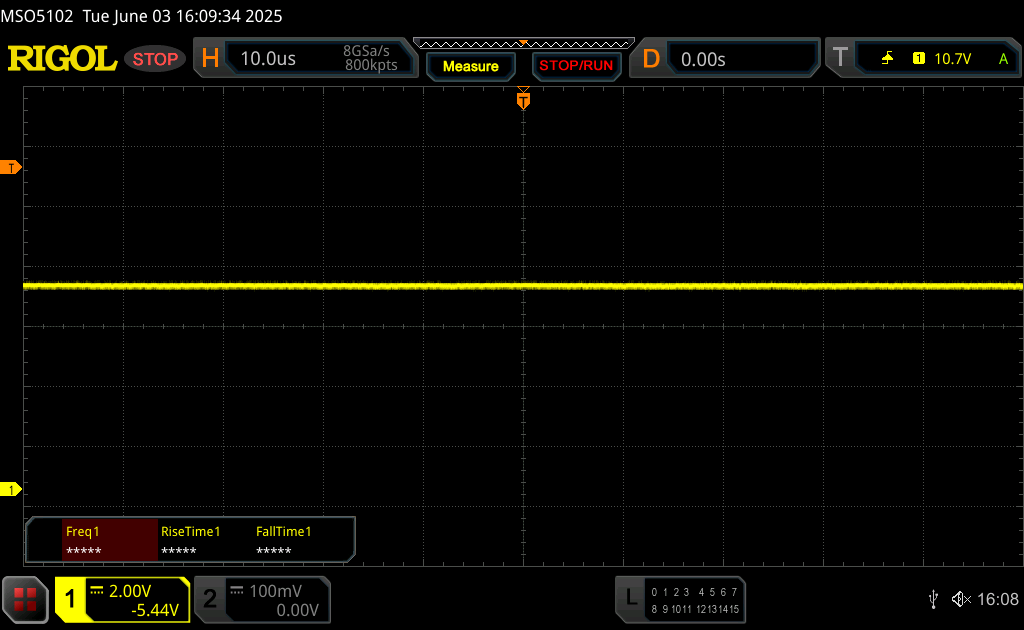 | ||
In comparison: 52 % of all tested devices do not use PWM to dim the display. If PWM was detected, an average of 7747 (minimum: 5 - maximum: 343500) Hz was measured. | |||
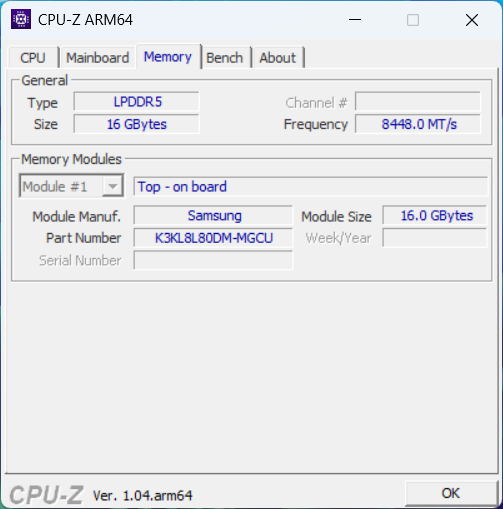
性能 - 骁龙 X Plus 和 16GB 内存
Surface Laptop 13 只配备了最小的骁龙 X Plus 处理器(X1P-42-100)和 16 GB 内存。
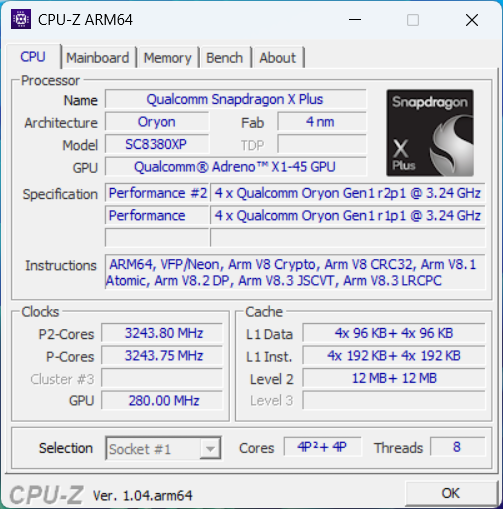
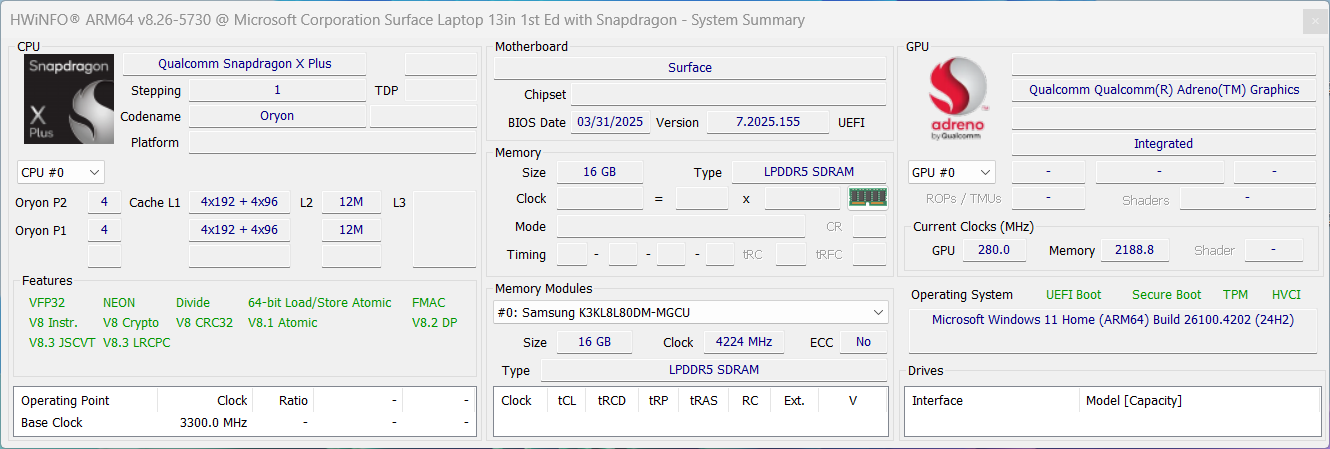
处理器 - Snapdragon X1P-42-100
Snapdragon X1P-42-100 配备了 8 个内核,主频高达 3.4 GHz,根据我们的能耗测量结果,它的短时间能耗高达 45 瓦,然后永久能耗为 35 瓦。Cinebench 2024 和 Geekbench 6.4 这两项基准测试都是原生运行的,但 Surface Laptop 在我们的测试中总是排在最后。在模拟测试中,它甚至不得不向老款 Surface Laptop Go 3.不过,它的性能即使在电池电量不足的情况下也能保持稳定,仍然足以胜任简单的日常工作。
Cinebench 2024: CPU Multi Core | CPU Single Core
Geekbench 6.7: Multi-Core | Single-Core
| CPU Performance rating | |
| Apple MacBook Air 13 M4 Entry | |
| Dell XPS 13 9345 | |
| Microsoft Surface Laptop 7 13.8 Copilot+ | |
| Average of class Subnotebook | |
| Apple MacBook Air 13 M3 10C GPU | |
| Framework Laptop 13.5 Core Ultra 7 155H | |
| Average Qualcomm Snapdragon X Plus X1P-42-100 | |
| Microsoft Surface Laptop 13 | |
| Cinebench 2024 / CPU Multi Core | |
| Dell XPS 13 9345 | |
| Microsoft Surface Laptop 7 13.8 Copilot+ | |
| Apple MacBook Air 13 M4 Entry | |
| Average of class Subnotebook (148 - 1471, n=66, last 2 years) | |
| Microsoft Surface Laptop 13 | |
| Average Qualcomm Snapdragon X Plus X1P-42-100 (554 - 763, n=11) | |
| Framework Laptop 13.5 Core Ultra 7 155H | |
| Apple MacBook Air 13 M3 10C GPU | |
| Cinebench 2024 / CPU Single Core | |
| Apple MacBook Air 13 M4 Entry | |
| Apple MacBook Air 13 M3 10C GPU | |
| Microsoft Surface Laptop 7 13.8 Copilot+ | |
| Dell XPS 13 9345 | |
| Average of class Subnotebook (35 - 200, n=55, last 2 years) | |
| Microsoft Surface Laptop 13 | |
| Average Qualcomm Snapdragon X Plus X1P-42-100 (107 - 109, n=10) | |
| Framework Laptop 13.5 Core Ultra 7 155H | |
| Geekbench 6.7 / Multi-Core | |
| Apple MacBook Air 13 M4 Entry | |
| Dell XPS 13 9345 | |
| Microsoft Surface Laptop 7 13.8 Copilot+ | |
| Average of class Subnotebook (2244 - 20325, n=63, last 2 years) | |
| Apple MacBook Air 13 M3 10C GPU | |
| Framework Laptop 13.5 Core Ultra 7 155H | |
| Average Qualcomm Snapdragon X Plus X1P-42-100 (7609 - 14998, n=10) | |
| Microsoft Surface Laptop 13 | |
| Geekbench 6.7 / Single-Core | |
| Apple MacBook Air 13 M4 Entry | |
| Apple MacBook Air 13 M3 10C GPU | |
| Dell XPS 13 9345 | |
| Microsoft Surface Laptop 7 13.8 Copilot+ | |
| Average of class Subnotebook (960 - 4195, n=62, last 2 years) | |
| Framework Laptop 13.5 Core Ultra 7 155H | |
| Average Qualcomm Snapdragon X Plus X1P-42-100 (2271 - 2675, n=9) | |
| Microsoft Surface Laptop 13 | |
Cinebench R15 Multi continuous test
Cinebench R23: Multi Core | Single Core
Cinebench R20: CPU (Multi Core) | CPU (Single Core)
Cinebench R15: CPU Multi 64Bit | CPU Single 64Bit
Blender: v2.79 BMW27 CPU
7-Zip 18.03: 7z b 4 | 7z b 4 -mmt1
HWBOT x265 Benchmark v2.2: 4k Preset
LibreOffice : 20 Documents To PDF
R Benchmark 2.5: Overall mean
| CPU Performance rating | |
| Framework Laptop 13.5 Core Ultra 7 155H | |
| Average of class Subnotebook | |
| Microsoft Surface Laptop 7 13.8 Copilot+ | |
| Dell XPS 13 9345 | |
| Apple MacBook Air 13 M3 10C GPU -9! | |
| Microsoft Surface Laptop Go 3 | |
| Average Qualcomm Snapdragon X Plus X1P-42-100 | |
| Microsoft Surface Laptop 13 | |
| Cinebench R23 / Multi Core | |
| Framework Laptop 13.5 Core Ultra 7 155H | |
| Average of class Subnotebook (1555 - 21812, n=60, last 2 years) | |
| Apple MacBook Air 13 M3 10C GPU | |
| Microsoft Surface Laptop 7 13.8 Copilot+ | |
| Dell XPS 13 9345 | |
| Average Qualcomm Snapdragon X Plus X1P-42-100 (6062 - 8284, n=10) | |
| Microsoft Surface Laptop 13 | |
| Microsoft Surface Laptop Go 3 | |
| Cinebench R23 / Single Core | |
| Apple MacBook Air 13 M3 10C GPU | |
| Framework Laptop 13.5 Core Ultra 7 155H | |
| Average of class Subnotebook (358 - 2213, n=61, last 2 years) | |
| Microsoft Surface Laptop Go 3 | |
| Microsoft Surface Laptop 7 13.8 Copilot+ | |
| Dell XPS 13 9345 | |
| Average Qualcomm Snapdragon X Plus X1P-42-100 (1065 - 1134, n=10) | |
| Microsoft Surface Laptop 13 | |
| Cinebench R20 / CPU (Multi Core) | |
| Framework Laptop 13.5 Core Ultra 7 155H | |
| Average of class Subnotebook (579 - 8541, n=57, last 2 years) | |
| Microsoft Surface Laptop 7 13.8 Copilot+ | |
| Dell XPS 13 9345 | |
| Average Qualcomm Snapdragon X Plus X1P-42-100 (2361 - 3125, n=10) | |
| Microsoft Surface Laptop 13 | |
| Microsoft Surface Laptop Go 3 | |
| Cinebench R20 / CPU (Single Core) | |
| Framework Laptop 13.5 Core Ultra 7 155H | |
| Average of class Subnotebook (128 - 832, n=57, last 2 years) | |
| Microsoft Surface Laptop Go 3 | |
| Microsoft Surface Laptop 7 13.8 Copilot+ | |
| Dell XPS 13 9345 | |
| Microsoft Surface Laptop 13 | |
| Average Qualcomm Snapdragon X Plus X1P-42-100 (406 - 427, n=10) | |
| Cinebench R15 / CPU Multi 64Bit | |
| Framework Laptop 13.5 Core Ultra 7 155H | |
| Microsoft Surface Laptop 7 13.8 Copilot+ | |
| Average of class Subnotebook (327 - 3345, n=57, last 2 years) | |
| Dell XPS 13 9345 | |
| Average Qualcomm Snapdragon X Plus X1P-42-100 (1191 - 1560, n=10) | |
| Microsoft Surface Laptop 13 | |
| Microsoft Surface Laptop Go 3 | |
| Cinebench R15 / CPU Single 64Bit | |
| Average of class Subnotebook (72.4 - 322, n=57, last 2 years) | |
| Framework Laptop 13.5 Core Ultra 7 155H | |
| Microsoft Surface Laptop 7 13.8 Copilot+ | |
| Dell XPS 13 9345 | |
| Microsoft Surface Laptop Go 3 | |
| Microsoft Surface Laptop 13 | |
| Average Qualcomm Snapdragon X Plus X1P-42-100 (206 - 215, n=10) | |
| Blender / v2.79 BMW27 CPU | |
| Microsoft Surface Laptop Go 3 | |
| Apple MacBook Air 13 M3 10C GPU | |
| Average Qualcomm Snapdragon X Plus X1P-42-100 (398 - 683, n=10) | |
| Microsoft Surface Laptop 13 | |
| Average of class Subnotebook (159 - 2271, n=58, last 2 years) | |
| Dell XPS 13 9345 | |
| Microsoft Surface Laptop 7 13.8 Copilot+ | |
| Framework Laptop 13.5 Core Ultra 7 155H | |
| 7-Zip 18.03 / 7z b 4 | |
| Framework Laptop 13.5 Core Ultra 7 155H | |
| Microsoft Surface Laptop 7 13.8 Copilot+ | |
| Average of class Subnotebook (11668 - 77867, n=57, last 2 years) | |
| Dell XPS 13 9345 | |
| Microsoft Surface Laptop 13 | |
| Average Qualcomm Snapdragon X Plus X1P-42-100 (29238 - 32811, n=10) | |
| Microsoft Surface Laptop Go 3 | |
| 7-Zip 18.03 / 7z b 4 -mmt1 | |
| Average of class Subnotebook (2643 - 6699, n=59, last 2 years) | |
| Framework Laptop 13.5 Core Ultra 7 155H | |
| Microsoft Surface Laptop 7 13.8 Copilot+ | |
| Dell XPS 13 9345 | |
| Microsoft Surface Laptop Go 3 | |
| Microsoft Surface Laptop 13 | |
| Average Qualcomm Snapdragon X Plus X1P-42-100 (4087 - 4675, n=10) | |
| HWBOT x265 Benchmark v2.2 / 4k Preset | |
| Framework Laptop 13.5 Core Ultra 7 155H | |
| Average of class Subnotebook (0.97 - 25.1, n=57, last 2 years) | |
| Microsoft Surface Laptop 7 13.8 Copilot+ | |
| Dell XPS 13 9345 | |
| Microsoft Surface Laptop Go 3 | |
| Average Qualcomm Snapdragon X Plus X1P-42-100 (3.16 - 6.18, n=10) | |
| Microsoft Surface Laptop 13 | |
| LibreOffice / 20 Documents To PDF | |
| Microsoft Surface Laptop 7 13.8 Copilot+ | |
| Microsoft Surface Laptop 13 | |
| Average Qualcomm Snapdragon X Plus X1P-42-100 (49.8 - 62.7, n=10) | |
| Average of class Subnotebook (39.9 - 220, n=56, last 2 years) | |
| Microsoft Surface Laptop Go 3 | |
| Dell XPS 13 9345 | |
| Framework Laptop 13.5 Core Ultra 7 155H | |
| R Benchmark 2.5 / Overall mean | |
| Microsoft Surface Laptop 13 | |
| Average Qualcomm Snapdragon X Plus X1P-42-100 (0.728 - 0.777, n=10) | |
| Dell XPS 13 9345 | |
| Microsoft Surface Laptop 7 13.8 Copilot+ | |
| Microsoft Surface Laptop Go 3 | |
| Average of class Subnotebook (0.4024 - 1.456, n=58, last 2 years) | |
| Framework Laptop 13.5 Core Ultra 7 155H | |
* ... smaller is better
AIDA64: FP32 Ray-Trace | FPU Julia | CPU SHA3 | CPU Queen | FPU SinJulia | FPU Mandel | CPU AES | CPU ZLib | FP64 Ray-Trace | CPU PhotoWorxx
| Performance rating | |
| Framework Laptop 13.5 Core Ultra 7 155H | |
| Average of class Subnotebook | |
| Microsoft Surface Laptop 7 13.8 Copilot+ | |
| Dell XPS 13 9345 | |
| Average Qualcomm Snapdragon X Plus X1P-42-100 | |
| Microsoft Surface Laptop 13 | |
| Microsoft Surface Laptop Go 3 | |
| AIDA64 / FP32 Ray-Trace | |
| Average of class Subnotebook (1135 - 32888, n=58, last 2 years) | |
| Framework Laptop 13.5 Core Ultra 7 155H | |
| Microsoft Surface Laptop 7 13.8 Copilot+ | |
| Dell XPS 13 9345 | |
| Microsoft Surface Laptop 13 | |
| Average Qualcomm Snapdragon X Plus X1P-42-100 (1480 - 6208, n=9) | |
| Microsoft Surface Laptop Go 3 | |
| AIDA64 / FPU Julia | |
| Average of class Subnotebook (5218 - 123315, n=58, last 2 years) | |
| Framework Laptop 13.5 Core Ultra 7 155H | |
| Microsoft Surface Laptop 7 13.8 Copilot+ | |
| Dell XPS 13 9345 | |
| Microsoft Surface Laptop Go 3 | |
| Microsoft Surface Laptop 13 | |
| Average Qualcomm Snapdragon X Plus X1P-42-100 (14234 - 17629, n=9) | |
| AIDA64 / CPU SHA3 | |
| Average of class Subnotebook (444 - 5287, n=58, last 2 years) | |
| Microsoft Surface Laptop 7 13.8 Copilot+ | |
| Dell XPS 13 9345 | |
| Framework Laptop 13.5 Core Ultra 7 155H | |
| Average Qualcomm Snapdragon X Plus X1P-42-100 (2036 - 2642, n=9) | |
| Microsoft Surface Laptop 13 | |
| Microsoft Surface Laptop Go 3 | |
| AIDA64 / CPU Queen | |
| Framework Laptop 13.5 Core Ultra 7 155H | |
| Microsoft Surface Laptop 7 13.8 Copilot+ | |
| Dell XPS 13 9345 | |
| Average of class Subnotebook (10579 - 95002, n=49, last 2 years) | |
| Microsoft Surface Laptop Go 3 | |
| Microsoft Surface Laptop 13 | |
| Average Qualcomm Snapdragon X Plus X1P-42-100 (44346 - 48641, n=9) | |
| AIDA64 / FPU SinJulia | |
| Framework Laptop 13.5 Core Ultra 7 155H | |
| Average of class Subnotebook (744 - 18418, n=58, last 2 years) | |
| Microsoft Surface Laptop Go 3 | |
| Microsoft Surface Laptop 7 13.8 Copilot+ | |
| Dell XPS 13 9345 | |
| Microsoft Surface Laptop 13 | |
| Average Qualcomm Snapdragon X Plus X1P-42-100 (1240 - 1502, n=9) | |
| AIDA64 / FPU Mandel | |
| Average of class Subnotebook (3341 - 65433, n=58, last 2 years) | |
| Framework Laptop 13.5 Core Ultra 7 155H | |
| Microsoft Surface Laptop 7 13.8 Copilot+ | |
| Dell XPS 13 9345 | |
| Microsoft Surface Laptop Go 3 | |
| Microsoft Surface Laptop 13 | |
| Average Qualcomm Snapdragon X Plus X1P-42-100 (4929 - 9953, n=9) | |
| AIDA64 / CPU AES | |
| Microsoft Surface Laptop 7 13.8 Copilot+ | |
| Dell XPS 13 9345 | |
| Framework Laptop 13.5 Core Ultra 7 155H | |
| Average of class Subnotebook (638 - 96917, n=58, last 2 years) | |
| Microsoft Surface Laptop 13 | |
| Average Qualcomm Snapdragon X Plus X1P-42-100 (37646 - 45232, n=9) | |
| Microsoft Surface Laptop Go 3 | |
| AIDA64 / CPU ZLib | |
| Framework Laptop 13.5 Core Ultra 7 155H | |
| Average of class Subnotebook (164.9 - 1379, n=58, last 2 years) | |
| Microsoft Surface Laptop 7 13.8 Copilot+ | |
| Dell XPS 13 9345 | |
| Microsoft Surface Laptop 13 | |
| Average Qualcomm Snapdragon X Plus X1P-42-100 (473 - 524, n=9) | |
| Microsoft Surface Laptop Go 3 | |
| AIDA64 / FP64 Ray-Trace | |
| Average of class Subnotebook (610 - 17495, n=58, last 2 years) | |
| Framework Laptop 13.5 Core Ultra 7 155H | |
| Microsoft Surface Laptop 7 13.8 Copilot+ | |
| Dell XPS 13 9345 | |
| Average Qualcomm Snapdragon X Plus X1P-42-100 (2262 - 3430, n=9) | |
| Microsoft Surface Laptop 13 | |
| Microsoft Surface Laptop Go 3 | |
| AIDA64 / CPU PhotoWorxx | |
| Average of class Subnotebook (6569 - 85600, n=58, last 2 years) | |
| Framework Laptop 13.5 Core Ultra 7 155H | |
| Microsoft Surface Laptop 7 13.8 Copilot+ | |
| Dell XPS 13 9345 | |
| Microsoft Surface Laptop Go 3 | |
| Microsoft Surface Laptop 13 | |
| Average Qualcomm Snapdragon X Plus X1P-42-100 (31088 - 32478, n=9) | |
系统性能
Surface Laptop 13 在日常使用中反应灵敏,大多数用户应该不会遇到任何兼容性问题,不过在使用旧版软件时应事先做一些研究。总的来说,在我们的测试中没有出现稳定性问题,只有在游戏基准测试中,我们的测试设备出现了两次挂起。
CrossMark: Overall | Productivity | Creativity | Responsiveness
WebXPRT 3: Overall
WebXPRT 4: Overall
Mozilla Kraken 1.1: Total
| Performance rating | |
| Apple MacBook Air 13 M4 Entry | |
| Apple MacBook Air 13 M3 10C GPU | |
| Microsoft Surface Laptop 7 13.8 Copilot+ | |
| Average of class Subnotebook | |
| Dell XPS 13 9345 | |
| Framework Laptop 13.5 Core Ultra 7 155H | |
| Microsoft Surface Laptop 13 | |
| Average Qualcomm Snapdragon X Plus X1P-42-100, Qualcomm SD X Adreno X1-45 1.7 TFLOPS | |
| Microsoft Surface Laptop Go 3 | |
| CrossMark / Overall | |
| Apple MacBook Air 13 M4 Entry | |
| Apple MacBook Air 13 M3 10C GPU | |
| Framework Laptop 13.5 Core Ultra 7 155H | |
| Average of class Subnotebook (365 - 2356, n=60, last 2 years) | |
| Microsoft Surface Laptop 7 13.8 Copilot+ | |
| Dell XPS 13 9345 | |
| Microsoft Surface Laptop Go 3 | |
| Average Qualcomm Snapdragon X Plus X1P-42-100, Qualcomm SD X Adreno X1-45 1.7 TFLOPS (1061 - 1463, n=10) | |
| Microsoft Surface Laptop 13 | |
| CrossMark / Productivity | |
| Apple MacBook Air 13 M4 Entry | |
| Apple MacBook Air 13 M3 10C GPU | |
| Framework Laptop 13.5 Core Ultra 7 155H | |
| Average of class Subnotebook (364 - 2277, n=60, last 2 years) | |
| Microsoft Surface Laptop 7 13.8 Copilot+ | |
| Microsoft Surface Laptop Go 3 | |
| Dell XPS 13 9345 | |
| Average Qualcomm Snapdragon X Plus X1P-42-100, Qualcomm SD X Adreno X1-45 1.7 TFLOPS (1059 - 1284, n=10) | |
| Microsoft Surface Laptop 13 | |
| CrossMark / Creativity | |
| Apple MacBook Air 13 M4 Entry | |
| Apple MacBook Air 13 M3 10C GPU | |
| Framework Laptop 13.5 Core Ultra 7 155H | |
| Average of class Subnotebook (372 - 2743, n=60, last 2 years) | |
| Microsoft Surface Laptop 7 13.8 Copilot+ | |
| Dell XPS 13 9345 | |
| Microsoft Surface Laptop Go 3 | |
| Average Qualcomm Snapdragon X Plus X1P-42-100, Qualcomm SD X Adreno X1-45 1.7 TFLOPS (1070 - 1660, n=10) | |
| Microsoft Surface Laptop 13 | |
| CrossMark / Responsiveness | |
| Apple MacBook Air 13 M4 Entry | |
| Apple MacBook Air 13 M3 10C GPU | |
| Average of class Subnotebook (312 - 1854, n=60, last 2 years) | |
| Framework Laptop 13.5 Core Ultra 7 155H | |
| Microsoft Surface Laptop 7 13.8 Copilot+ | |
| Dell XPS 13 9345 | |
| Average Qualcomm Snapdragon X Plus X1P-42-100, Qualcomm SD X Adreno X1-45 1.7 TFLOPS (989 - 1563, n=10) | |
| Microsoft Surface Laptop Go 3 | |
| Microsoft Surface Laptop 13 | |
| WebXPRT 3 / Overall | |
| Apple MacBook Air 13 M4 Entry | |
| Apple MacBook Air 13 M3 10C GPU | |
| Microsoft Surface Laptop 7 13.8 Copilot+ | |
| Dell XPS 13 9345 | |
| Average Qualcomm Snapdragon X Plus X1P-42-100, Qualcomm SD X Adreno X1-45 1.7 TFLOPS (129.9 - 426, n=10) | |
| Microsoft Surface Laptop 13 | |
| Average of class Subnotebook (156 - 530, n=56, last 2 years) | |
| Framework Laptop 13.5 Core Ultra 7 155H | |
| Microsoft Surface Laptop Go 3 | |
| WebXPRT 4 / Overall | |
| Apple MacBook Air 13 M4 Entry | |
| Dell XPS 13 9345 | |
| Apple MacBook Air 13 M3 10C GPU | |
| Microsoft Surface Laptop 7 13.8 Copilot+ | |
| Average of class Subnotebook (132 - 378, n=61, last 2 years) | |
| Microsoft Surface Laptop 13 | |
| Average Qualcomm Snapdragon X Plus X1P-42-100, Qualcomm SD X Adreno X1-45 1.7 TFLOPS (130.3 - 289, n=10) | |
| Framework Laptop 13.5 Core Ultra 7 155H | |
| Microsoft Surface Laptop Go 3 | |
| Mozilla Kraken 1.1 / Total | |
| Microsoft Surface Laptop Go 3 | |
| Average Qualcomm Snapdragon X Plus X1P-42-100, Qualcomm SD X Adreno X1-45 1.7 TFLOPS (396 - 1145, n=10) | |
| Framework Laptop 13.5 Core Ultra 7 155H | |
| Average of class Subnotebook (234 - 1104, n=61, last 2 years) | |
| Dell XPS 13 9345 | |
| Microsoft Surface Laptop 13 | |
| Microsoft Surface Laptop 7 13.8 Copilot+ | |
| Apple MacBook Air 13 M3 10C GPU | |
| Apple MacBook Air 13 M4 Entry | |
* ... smaller is better
| AIDA64 / Memory Copy | |
| Average of class Subnotebook (14554 - 131023, n=58, last 2 years) | |
| Framework Laptop 13.5 Core Ultra 7 155H | |
| Dell XPS 13 9345 | |
| Microsoft Surface Laptop 13 | |
| Microsoft Surface Laptop 7 13.8 Copilot+ | |
| Average Qualcomm Snapdragon X Plus X1P-42-100 (61258 - 63933, n=9) | |
| Microsoft Surface Laptop Go 3 | |
| AIDA64 / Memory Read | |
| Microsoft Surface Laptop 13 | |
| Average Qualcomm Snapdragon X Plus X1P-42-100 (112408 - 128030, n=9) | |
| Dell XPS 13 9345 | |
| Microsoft Surface Laptop 7 13.8 Copilot+ | |
| Average of class Subnotebook (15948 - 127174, n=58, last 2 years) | |
| Framework Laptop 13.5 Core Ultra 7 155H | |
| Microsoft Surface Laptop Go 3 | |
| AIDA64 / Memory Write | |
| Average of class Subnotebook (15709 - 135141, n=58, last 2 years) | |
| Microsoft Surface Laptop Go 3 | |
| Framework Laptop 13.5 Core Ultra 7 155H | |
| Microsoft Surface Laptop 13 | |
| Average Qualcomm Snapdragon X Plus X1P-42-100 (45782 - 49288, n=9) | |
| Dell XPS 13 9345 | |
| Microsoft Surface Laptop 7 13.8 Copilot+ | |
| AIDA64 / Memory Latency | |
| Framework Laptop 13.5 Core Ultra 7 155H | |
| Microsoft Surface Laptop Go 3 | |
| Average of class Subnotebook (6.1 - 159.9, n=56, last 2 years) | |
| Dell XPS 13 9345 | |
| Average Qualcomm Snapdragon X Plus X1P-42-100 (6.8 - 8.7, n=5) | |
| Microsoft Surface Laptop 7 13.8 Copilot+ | |
| Microsoft Surface Laptop 13 | |
* ... smaller is better
存储设备
Surface Laptop 13 配备了可移动 UFS 4.0 存储设备,我们的测试设备是 512 GB 版本(用户可免费使用 411 GB)。它的最大传输速率略低于 4 GB/s,完全可以满足日常使用需求,而且即使在持续负载的情况下,传输速率也能保持稳定。

* ... smaller is better
Reading continuous performance: DiskSpd Read Loop, Queue Depth 8
图形处理器性能
Adreno X1-45 的图形处理性能非常低,也低于旧版的 Surface Laptop Go 3.播放高分辨率视频等日常任务对该设备来说不成问题,但这对于游戏来说就很难满足要求了。不过,不得不说的是,兼容性问题在这里也起到了一定的作用。如果你想玩游戏,你应该依赖 Xbox Game Pass 等流媒体服务。
| 3DMark 11 Performance | 4568 points | |
| 3DMark Fire Strike Score | 3653 points | |
| 3DMark Time Spy Score | 1069 points | |
| 3DMark Steel Nomad Score | 228 points | |
| 3DMark Steel Nomad Light Score | 1096 points | |
| 3DMark Steel Nomad Light Unlimited Score | 1085 points | |
Help | ||
| Blender / v3.3 Classroom CPU | |
| Microsoft Surface Laptop Go 3 | |
| Microsoft Surface Laptop 13 | |
| Average Qualcomm SD X Adreno X1-45 1.7 TFLOPS (711 - 1226, n=13) | |
| Microsoft Surface Laptop 7 13.8 Copilot+ | |
| Dell XPS 13 9345 | |
| Average of class Subnotebook (241 - 861, n=60, last 2 years) | |
| Apple MacBook Air 13 M3 10C GPU | |
| Framework Laptop 13.5 Core Ultra 7 155H | |
| Apple MacBook Air 13 M4 Entry | |
| Blender / v3.3 Classroom METAL | |
| Apple MacBook Air 13 M3 10C GPU | |
| Average of class Subnotebook (76.3 - 227, n=5, last 2 years) | |
| Apple MacBook Air 13 M4 Entry | |
| Blender / v3.3 Classroom oneAPI/Intel | |
| Framework Laptop 13.5 Core Ultra 7 155H | |
| Average of class Subnotebook (105 - 396, n=11, last 2 years) | |
* ... smaller is better
| Cyberpunk 2077 - 1920x1080 Ultra Preset (FSR off) | |
| Framework Laptop 13.5 Core Ultra 7 155H | |
| Average of class Subnotebook (5.6 - 44.9, n=63, last 2 years) | |
| Dell XPS 13 9345 | |
| Microsoft Surface Laptop 7 13.8 Copilot+ | |
| Apple MacBook Air 13 M4 Entry | |
| Microsoft Surface Laptop 13 | |
| GTA V - 1920x1080 Highest AA:4xMSAA + FX AF:16x | |
| Average of class Subnotebook (10.7 - 43.7, n=56, last 2 years) | |
| Microsoft Surface Laptop 7 13.8 Copilot+ | |
| Dell XPS 13 9345 | |
| Framework Laptop 13.5 Core Ultra 7 155H | |
| Microsoft Surface Laptop 13 | |
| Final Fantasy XV Benchmark - 1280x720 Lite Quality | |
| Average of class Subnotebook (21.4 - 129.8, n=55, last 2 years) | |
| Framework Laptop 13.5 Core Ultra 7 155H | |
| Microsoft Surface Laptop 7 13.8 Copilot+ | |
| Dell XPS 13 9345 | |
| Microsoft Surface Laptop 13 | |
| Strange Brigade - 1920x1080 ultra AA:ultra AF:16 | |
| Average of class Subnotebook (19 - 101.3, n=50, last 2 years) | |
| Framework Laptop 13.5 Core Ultra 7 155H | |
| Microsoft Surface Laptop 7 13.8 Copilot+ | |
| Dell XPS 13 9345 | |
| Microsoft Surface Laptop 13 | |
| Dota 2 Reborn - 1920x1080 ultra (3/3) best looking | |
| Average of class Subnotebook (13 - 97, n=61, last 2 years) | |
| Framework Laptop 13.5 Core Ultra 7 155H | |
| Microsoft Surface Laptop 7 13.8 Copilot+ | |
| Dell XPS 13 9345 | |
| Microsoft Surface Laptop 13 | |
Cyberpunk 2077 ultra FPS diagram
| low | med. | high | ultra | |
|---|---|---|---|---|
| GTA V (2015) | 98.3 | 88.7 | 34 | 15.3 |
| Dota 2 Reborn (2015) | 80.4 | 64.1 | 37 | 29.9 |
| Final Fantasy XV Benchmark (2018) | 21.4 | |||
| X-Plane 11.11 (2018) | 33.3 | |||
| Strange Brigade (2018) | 86.7 | 29.8 | 23 | 20 |
| Baldur's Gate 3 (2023) | 13.4 | 11.1 | ||
| Cyberpunk 2077 (2023) | 15.3 | 11.7 | 9.96 | 8.55 |
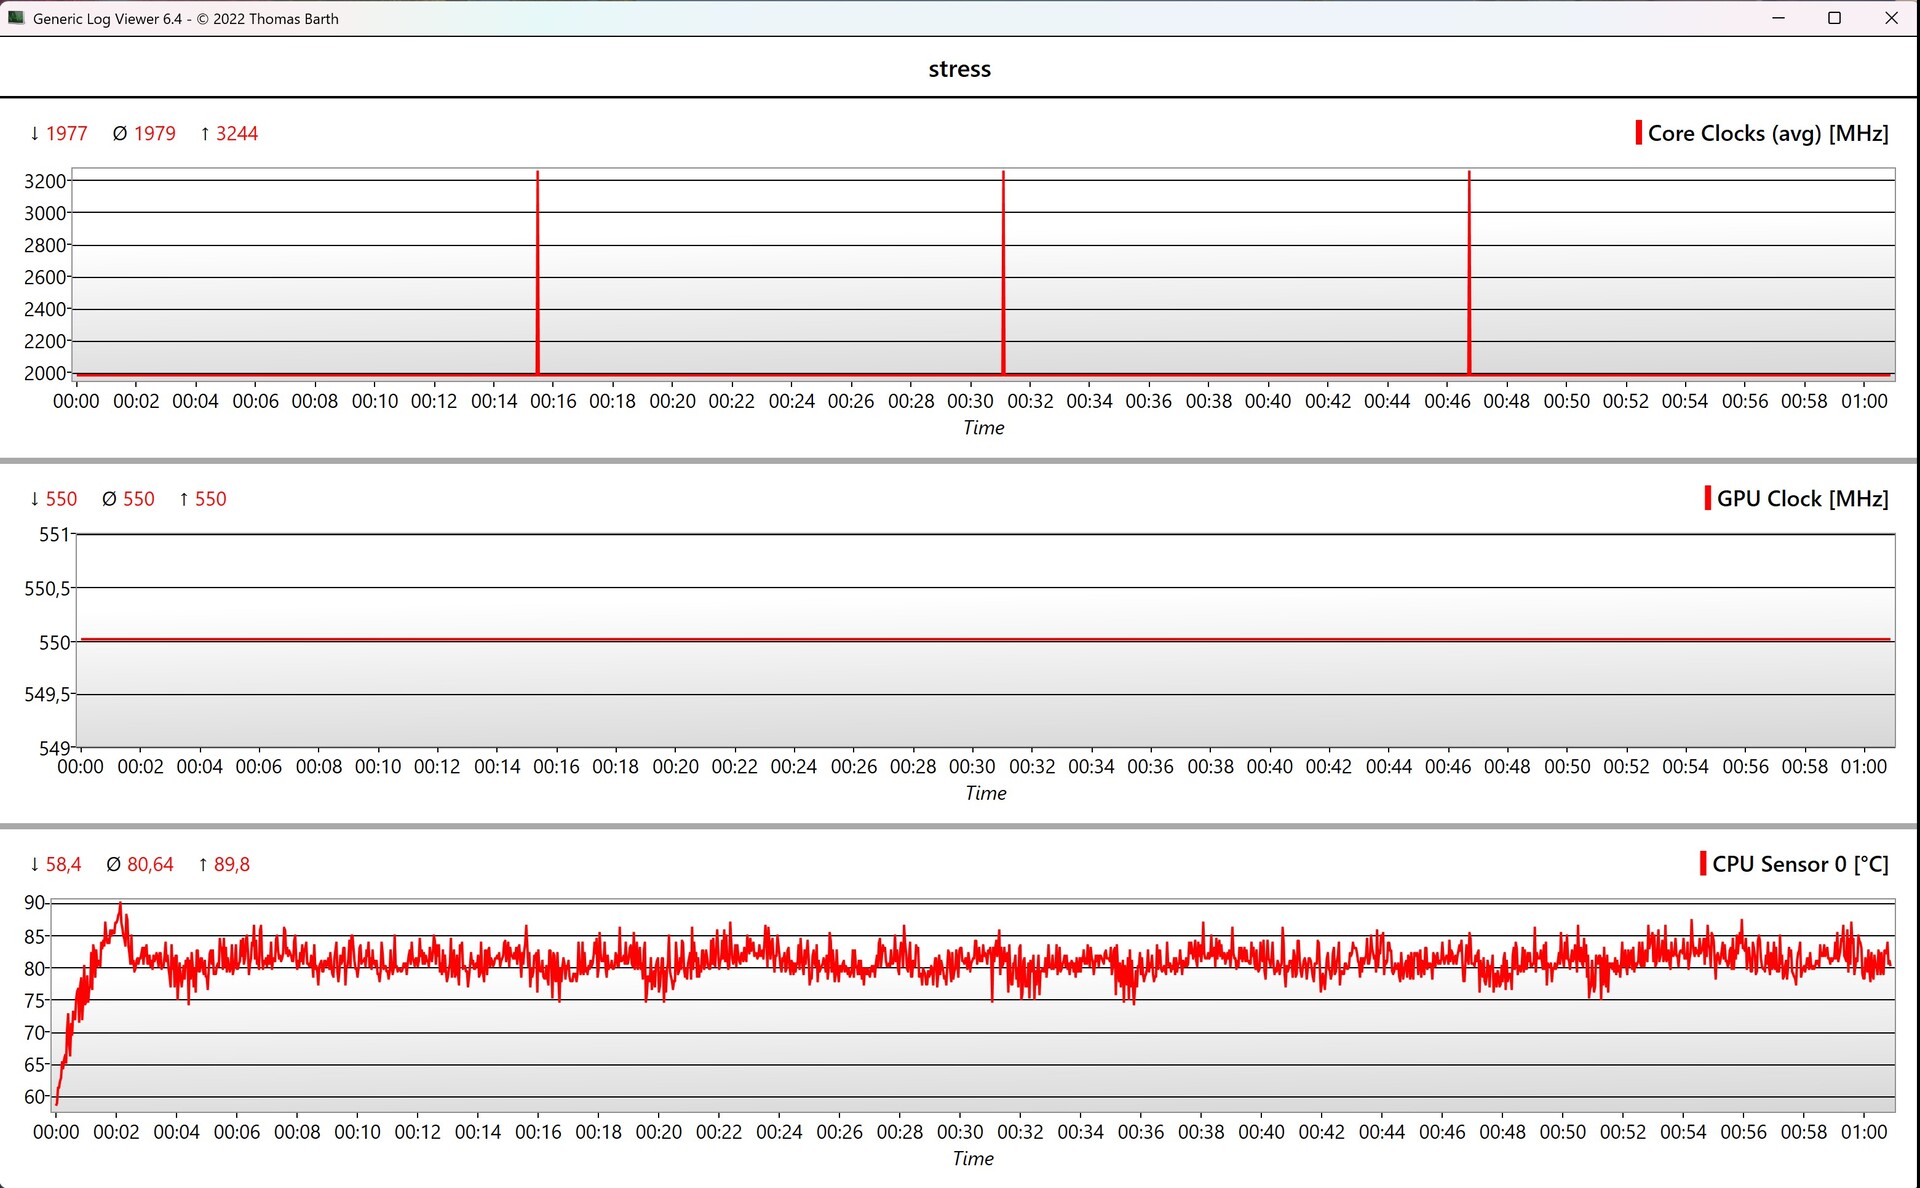
排放与能源
噪音排放
在日常使用中,Surface Laptop 13 几乎始终保持静音状态,通常只有在玩游戏或处理器处于负载状态时才能听到风扇的声音。这时,声音会变得非常大--我们测得的噪音值为 43.6 dB(A)。在测试过程中,我们的测试设备没有发出其他电子噪音。
Noise level
| Idle |
| 23.5 / 23.5 / 23.5 dB(A) |
| Load |
| 23.5 / 43.6 dB(A) |
 | ||
30 dB silent 40 dB(A) audible 50 dB(A) loud |
||
min: | ||
| Microsoft Surface Laptop 13 Adreno X1-45 1.7 TFLOPS, SD X Plus X1P-42-100 | Microsoft Surface Laptop 7 13.8 Copilot+ Adreno X1-85 3.8 TFLOPS, SD X Elite X1E-80-100, Samsung MZ9L4512HBLU-00BMV | Apple MacBook Air 13 M4 Entry M4 8-Core GPU, M4 10-Core, Apple SSD AP0256Z | Apple MacBook Air 13 M3 10C GPU M3 10-Core GPU, M3, Apple SSD AP0512Z | Dell XPS 13 9345 Adreno X1-85 3.8 TFLOPS, SD X Elite X1E-80-100 | Framework Laptop 13.5 Core Ultra 7 155H Arc 8-Core, Ultra 7 155H | Microsoft Surface Laptop Go 3 Iris Xe G7 80EUs, i5-1235U, Kioxia BG5 KBG50ZNS256G | |
|---|---|---|---|---|---|---|---|
| Noise | -2% | -8% | -20% | -1% | |||
| off / environment * (dB) | 23.5 | 23.8 -1% | 22.9 3% | 24 -2% | 22.5 4% | ||
| Idle Minimum * (dB) | 23.5 | 23.8 -1% | 22.9 3% | 24.1 -3% | 22.5 4% | ||
| Idle Average * (dB) | 23.5 | 23.8 -1% | 22.9 3% | 25.1 -7% | 22.5 4% | ||
| Idle Maximum * (dB) | 23.5 | 23.8 -1% | 22.9 3% | 27 -15% | 22.5 4% | ||
| Load Average * (dB) | 23.5 | 26 -11% | 32.8 -40% | 38.4 -63% | 31.3 -33% | ||
| Cyberpunk 2077 ultra * (dB) | 29.9 | 31.5 -5% | 40.6 -36% | 43.7 -46% | |||
| Load Maximum * (dB) | 43.6 | 40.3 8% | 40.6 7% | 45.8 -5% | 39.1 10% | ||
| Witcher 3 ultra * (dB) | 37.8 |
* ... smaller is better
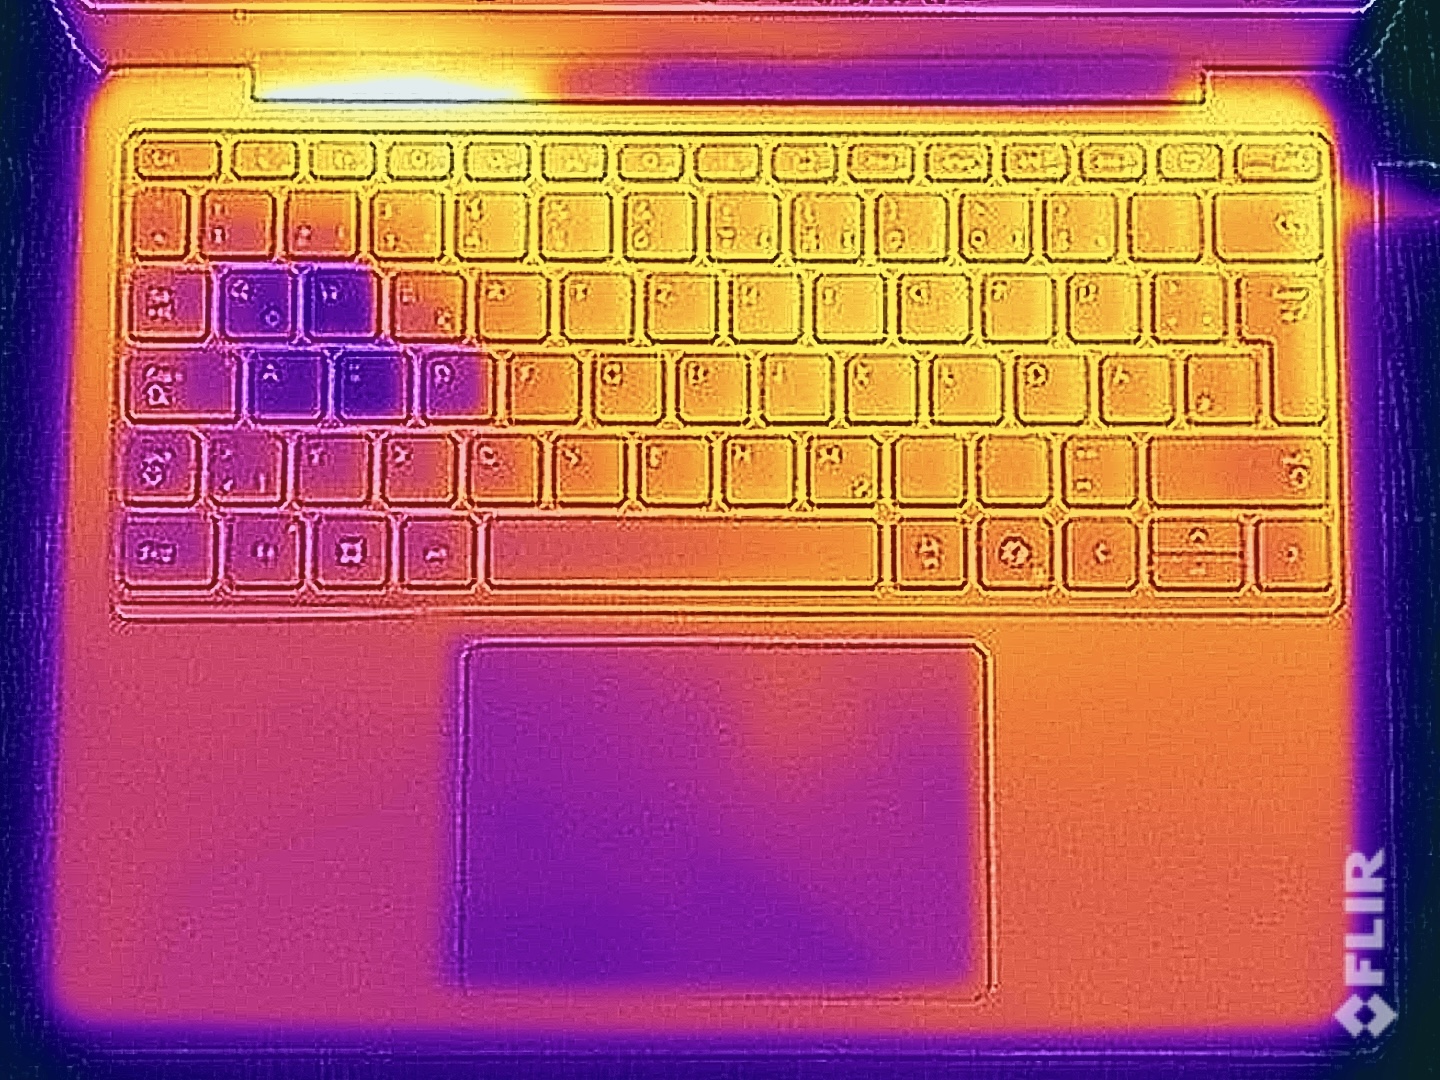
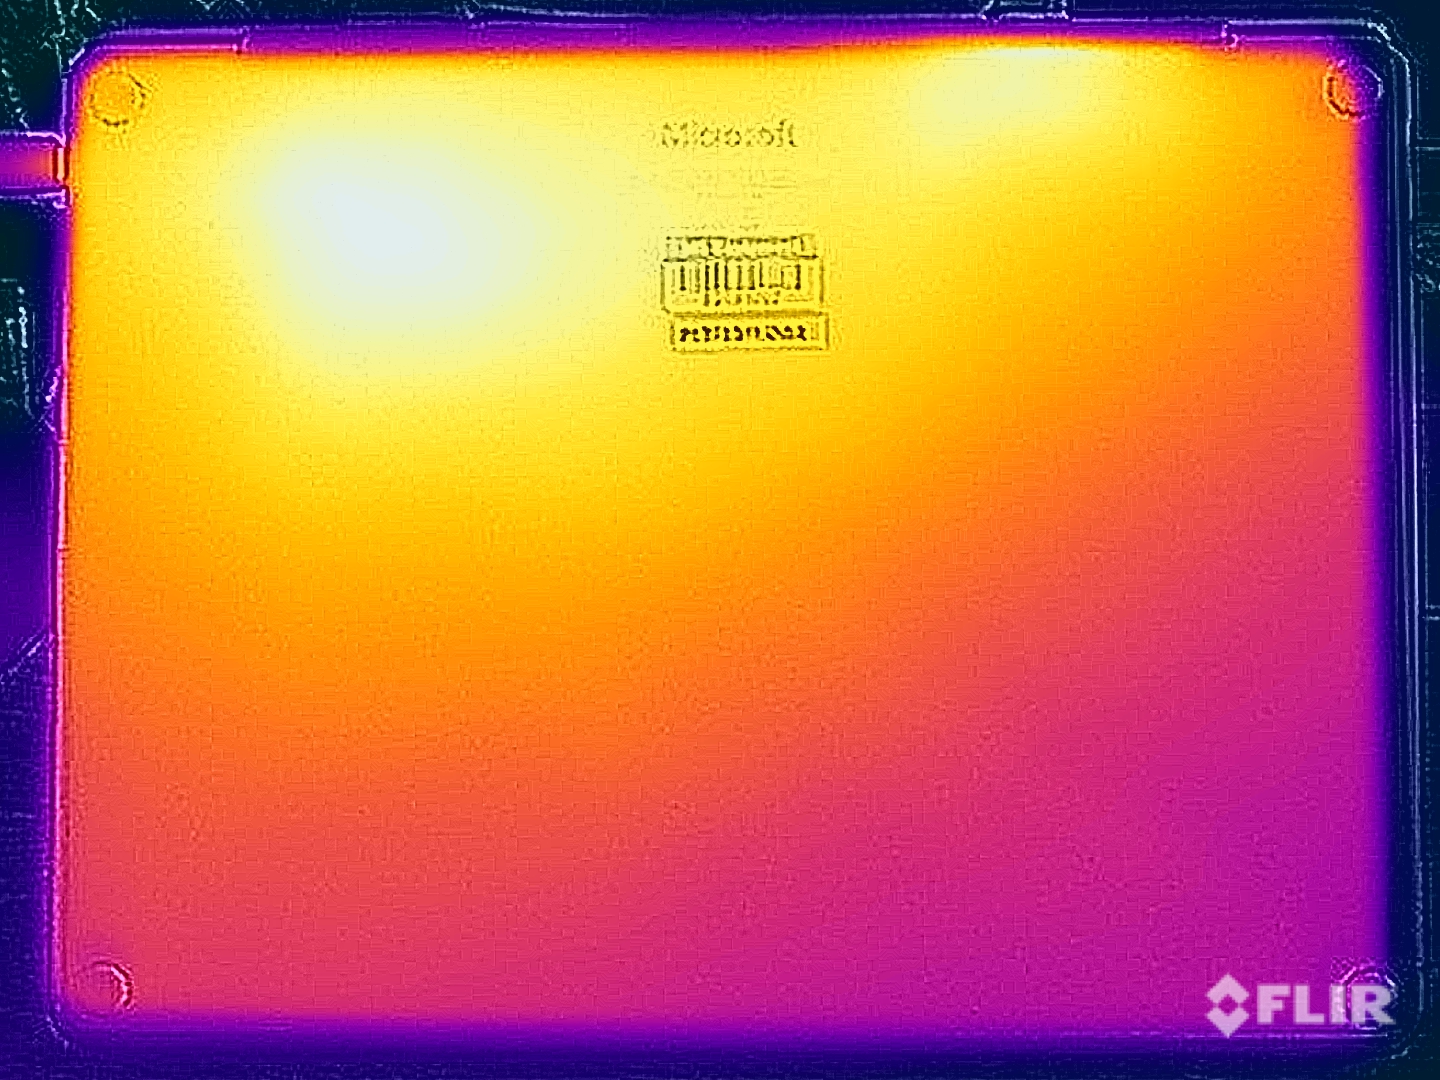
温度
Surface Laptop 13 在日常使用过程中保持超低温,即使在满载的情况下也不会出现温度问题,因此您可以将设备放在大腿上而不会出现任何问题。
(+) The maximum temperature on the upper side is 39 °C / 102 F, compared to the average of 35.9 °C / 97 F, ranging from 21.4 to 59 °C for the class Subnotebook.
(±) The bottom heats up to a maximum of 42.2 °C / 108 F, compared to the average of 39.2 °C / 103 F
(+) In idle usage, the average temperature for the upper side is 23.7 °C / 75 F, compared to the device average of 30.8 °C / 87 F.
(+) 3: The average temperature for the upper side is 31.7 °C / 89 F, compared to the average of 30.8 °C / 87 F for the class Subnotebook.
(+) The palmrests and touchpad are reaching skin temperature as a maximum (34.3 °C / 93.7 F) and are therefore not hot.
(-) The average temperature of the palmrest area of similar devices was 28.2 °C / 82.8 F (-6.1 °C / -10.9 F).
| Microsoft Surface Laptop 13 Qualcomm Snapdragon X Plus X1P-42-100, Qualcomm SD X Adreno X1-45 1.7 TFLOPS | Microsoft Surface Laptop 7 13.8 Copilot+ Qualcomm Snapdragon X Elite X1E-80-100, Qualcomm SD X Adreno X1-85 3.8 TFLOPS | Apple MacBook Air 13 M4 Entry Apple M4 10-Core, Apple M4 8-Core GPU | Apple MacBook Air 13 M3 10C GPU Apple M3, Apple M3 10-Core GPU | Dell XPS 13 9345 Qualcomm Snapdragon X Elite X1E-80-100, Qualcomm SD X Adreno X1-85 3.8 TFLOPS | Framework Laptop 13.5 Core Ultra 7 155H Intel Core Ultra 7 155H, Intel Arc 8-Core iGPU | Microsoft Surface Laptop Go 3 Intel Core i5-1235U, Intel Iris Xe Graphics G7 80EUs | |
|---|---|---|---|---|---|---|---|
| Heat | -8% | -4% | -1% | -20% | -13% | -7% | |
| Maximum Upper Side * (°C) | 39 | 47.1 -21% | 44.9 -15% | 44.3 -14% | 45.2 -16% | 42.8 -10% | 40.9 -5% |
| Maximum Bottom * (°C) | 42.2 | 44.6 -6% | 42.6 -1% | 43.4 -3% | 44.2 -5% | 45.2 -7% | 47.2 -12% |
| Idle Upper Side * (°C) | 23.9 | 24.7 -3% | 23.9 -0% | 22.3 7% | 30.4 -27% | 27.2 -14% | 24.9 -4% |
| Idle Bottom * (°C) | 24 | 24.5 -2% | 24 -0% | 22.1 8% | 31.6 -32% | 28.6 -19% | 25.9 -8% |
* ... smaller is better
发言人
虽然扬声器缺少一点低音,但笔记本电脑的整体音质还是不错的。
Microsoft Surface Laptop 13 audio analysis
(+) | speakers can play relatively loud (83.5 dB)
Bass 100 - 315 Hz
(-) | nearly no bass - on average 15.5% lower than median
(±) | linearity of bass is average (10.7% delta to prev. frequency)
Mids 400 - 2000 Hz
(+) | balanced mids - only 3.3% away from median
(+) | mids are linear (4.3% delta to prev. frequency)
Highs 2 - 16 kHz
(+) | balanced highs - only 1.5% away from median
(+) | highs are linear (4.7% delta to prev. frequency)
Overall 100 - 16.000 Hz
(+) | overall sound is linear (11.1% difference to median)
Compared to same class
» 11% of all tested devices in this class were better, 2% similar, 87% worse
» The best had a delta of 5%, average was 18%, worst was 53%
Compared to all devices tested
» 7% of all tested devices were better, 2% similar, 92% worse
» The best had a delta of 4%, average was 23%, worst was 134%
Microsoft Surface Laptop 7 13.8 Copilot+ audio analysis
(±) | speaker loudness is average but good (81.8 dB)
Bass 100 - 315 Hz
(±) | reduced bass - on average 12.7% lower than median
(±) | linearity of bass is average (9.8% delta to prev. frequency)
Mids 400 - 2000 Hz
(+) | balanced mids - only 4.1% away from median
(+) | mids are linear (2.4% delta to prev. frequency)
Highs 2 - 16 kHz
(+) | balanced highs - only 2.1% away from median
(+) | highs are linear (2.5% delta to prev. frequency)
Overall 100 - 16.000 Hz
(+) | overall sound is linear (12.1% difference to median)
Compared to same class
» 15% of all tested devices in this class were better, 5% similar, 81% worse
» The best had a delta of 5%, average was 18%, worst was 53%
Compared to all devices tested
» 10% of all tested devices were better, 2% similar, 88% worse
» The best had a delta of 4%, average was 23%, worst was 134%
Dell XPS 13 9345 audio analysis
(+) | speakers can play relatively loud (82.3 dB)
Bass 100 - 315 Hz
(±) | reduced bass - on average 9.9% lower than median
(±) | linearity of bass is average (12.4% delta to prev. frequency)
Mids 400 - 2000 Hz
(+) | balanced mids - only 1.9% away from median
(+) | mids are linear (3.2% delta to prev. frequency)
Highs 2 - 16 kHz
(+) | balanced highs - only 1.5% away from median
(+) | highs are linear (3% delta to prev. frequency)
Overall 100 - 16.000 Hz
(+) | overall sound is linear (8.2% difference to median)
Compared to same class
» 2% of all tested devices in this class were better, 1% similar, 97% worse
» The best had a delta of 5%, average was 18%, worst was 53%
Compared to all devices tested
» 2% of all tested devices were better, 1% similar, 97% worse
» The best had a delta of 4%, average was 23%, worst was 134%
Framework Laptop 13.5 Core Ultra 7 155H audio analysis
(±) | speaker loudness is average but good (79.8 dB)
Bass 100 - 315 Hz
(±) | reduced bass - on average 14.5% lower than median
(±) | linearity of bass is average (8.2% delta to prev. frequency)
Mids 400 - 2000 Hz
(+) | balanced mids - only 3.6% away from median
(+) | mids are linear (3.5% delta to prev. frequency)
Highs 2 - 16 kHz
(+) | balanced highs - only 2.5% away from median
(+) | highs are linear (4.1% delta to prev. frequency)
Overall 100 - 16.000 Hz
(+) | overall sound is linear (14.7% difference to median)
Compared to same class
» 13% of all tested devices in this class were better, 4% similar, 84% worse
» The best had a delta of 7%, average was 21%, worst was 53%
Compared to all devices tested
» 19% of all tested devices were better, 4% similar, 77% worse
» The best had a delta of 4%, average was 23%, worst was 134%
Microsoft Surface Laptop Go 3 audio analysis
(±) | speaker loudness is average but good (79 dB)
Bass 100 - 315 Hz
(-) | nearly no bass - on average 18.7% lower than median
(±) | linearity of bass is average (9.8% delta to prev. frequency)
Mids 400 - 2000 Hz
(+) | balanced mids - only 4.8% away from median
(+) | mids are linear (5.2% delta to prev. frequency)
Highs 2 - 16 kHz
(+) | balanced highs - only 1.1% away from median
(+) | highs are linear (2.7% delta to prev. frequency)
Overall 100 - 16.000 Hz
(±) | linearity of overall sound is average (15.4% difference to median)
Compared to same class
» 35% of all tested devices in this class were better, 6% similar, 59% worse
» The best had a delta of 5%, average was 18%, worst was 53%
Compared to all devices tested
» 23% of all tested devices were better, 4% similar, 73% worse
» The best had a delta of 4%, average was 23%, worst was 134%
耗电量
全新 Surface Laptop 13 非常节俭,空闲时仅需 5 瓦多。在负载情况下,它所需的功率可达 60 瓦,然后在 40 瓦左右趋于稳定。微软推荐使用 45 瓦的电源装置,但我们建议使用 65 瓦的模块。
| Off / Standby | |
| Idle | |
| Load |
|
Key:
min: | |
| Microsoft Surface Laptop 13 Adreno X1-45 1.7 TFLOPS, SD X Plus X1P-42-100 | Microsoft Surface Laptop 7 13.8 Copilot+ Adreno X1-85 3.8 TFLOPS, SD X Elite X1E-80-100, Samsung MZ9L4512HBLU-00BMV | Apple MacBook Air 13 M4 Entry M4 8-Core GPU, M4 10-Core, Apple SSD AP0256Z | Apple MacBook Air 13 M3 10C GPU M3 10-Core GPU, M3, Apple SSD AP0512Z | Dell XPS 13 9345 Adreno X1-85 3.8 TFLOPS, SD X Elite X1E-80-100 | Framework Laptop 13.5 Core Ultra 7 155H Arc 8-Core, Ultra 7 155H | Microsoft Surface Laptop Go 3 Iris Xe G7 80EUs, i5-1235U, Kioxia BG5 KBG50ZNS256G | |
|---|---|---|---|---|---|---|---|
| Power Consumption | -30% | -28% | -49% | -63% | -87% | -81% | |
| Idle Minimum * (Watt) | 1.8 | 1.4 22% | 1.9 -6% | 1.95 -8% | 2.8 -56% | 2.5 -39% | 4.8 -167% |
| Idle Average * (Watt) | 5.1 | 6.3 -24% | 8.7 -71% | 8.7 -71% | 4.9 4% | 5.2 -2% | 8.3 -63% |
| Idle Maximum * (Watt) | 5.6 | 7.6 -36% | 8.8 -57% | 8.9 -59% | 5.7 -2% | 5.8 -4% | 8.9 -59% |
| Load Average * (Watt) | 13.8 | 26.9 -95% | 29.9 -117% | 34.3 -149% | 40.6 -194% | 47.5 -244% | 34.7 -151% |
| Cyberpunk 2077 ultra * (Watt) | 21.8 | 38.5 -77% | 18.5 15% | 40.7 -87% | 54.5 -150% | ||
| Cyberpunk 2077 ultra external monitor * (Watt) | 19.4 | 21.5 -11% | 39.4 -103% | 52.4 -170% | |||
| Load Maximum * (Watt) | 60.2 | 40.7 32% | 30.8 49% | 35.4 41% | 64 -6% | 61.5 -2% | 38.6 36% |
| Witcher 3 ultra * (Watt) | 28.6 | 32.9 |
* ... smaller is better
Power consumption Cyberpunk / stress test
Power consumption with external monitor
运行时间
Surface Laptop 13 的续航时间非常出色,特别是考虑到其相对较小的 50 Wh 电池。在 150 cd/m²(测试设备最大亮度的 63%)的 WLAN 测试中,我们测得了 16:41 小时的良好运行时间,而在全亮度状态下,它仍能运行 11:22 小时。使用 65 瓦的电源充电需要 131 分钟(63 分钟后达到 80%)。
Notebookcheck 总评分
Microsoft Surface Laptop 13
- 06/05/2025 v8
Andreas Osthoff
 Total Sustainability Score:
 可能的替代品比较
Transparency
The selection of devices to be reviewed is made by our editorial team. The test sample was provided to the author as a loan by the manufacturer or retailer for the purpose of this review. The lender had no influence on this review, nor did the manufacturer receive a copy of this review before publication. There was no obligation to publish this review. As an independent media company, Notebookcheck is not subjected to the authority of manufacturers, retailers or publishers.
This is how Notebookcheck is testing
Every year, Notebookcheck independently reviews hundreds of laptops and smartphones using standardized procedures to ensure that all results are comparable. We have continuously developed our test methods for around 20 years and set industry standards in the process. In our test labs, high-quality measuring equipment is utilized by experienced technicians and editors. These tests involve a multi-stage validation process. Our complex rating system is based on hundreds of well-founded measurements and benchmarks, which maintains objectivity. Further information on our test methods can be found here.

