结论 - 实用且持久
EliteBook 8 Flip G1i 13 与即将推出的 EliteBook x360 830 G10 相比,是一个巨大的飞跃。 EliteBook x360 830 G10.除了如预期的那样更薄、更快之外,由于采用了 Arrow Lake-U CPU,新机型的效率更高,同时在键盘、点击板和端口等众多物理方面也有所改进。电池续航时间和扬声器的表现都高于平均水平,尤其是考虑到其小巧的外形,比预期的要好。核心商务功能,如广域网、智能卡和超亮 Sure View 显示屏,对于有需要的用户来说仍然是可选的。
新机型的一个主要缺点是缺乏显示选项,因为目前所有的配置都仅限于 1200p IPS 和 60 Hz。因此,要求 P3 颜色、OLED、HDR 支持或更流畅的图形用户界面的用户将不得不考虑更高端的机型,如 EliteBook Ultra或 EliteBook X 系列.Arc 4 GPU 虽然在 13 英寸可折叠本中还算不错,但与其他集成解决方案(如 Arc 140T 或 Radeon 800M/900M 系列)相比也偏弱。此外,附带的触控笔比 Surface 平板电脑的触控笔更细或更窄。 平板电脑更难握住。固态硬盘节流和相对较高的核心温度可能表明,小型散热解决方案可能需要升级。
Pros
Cons
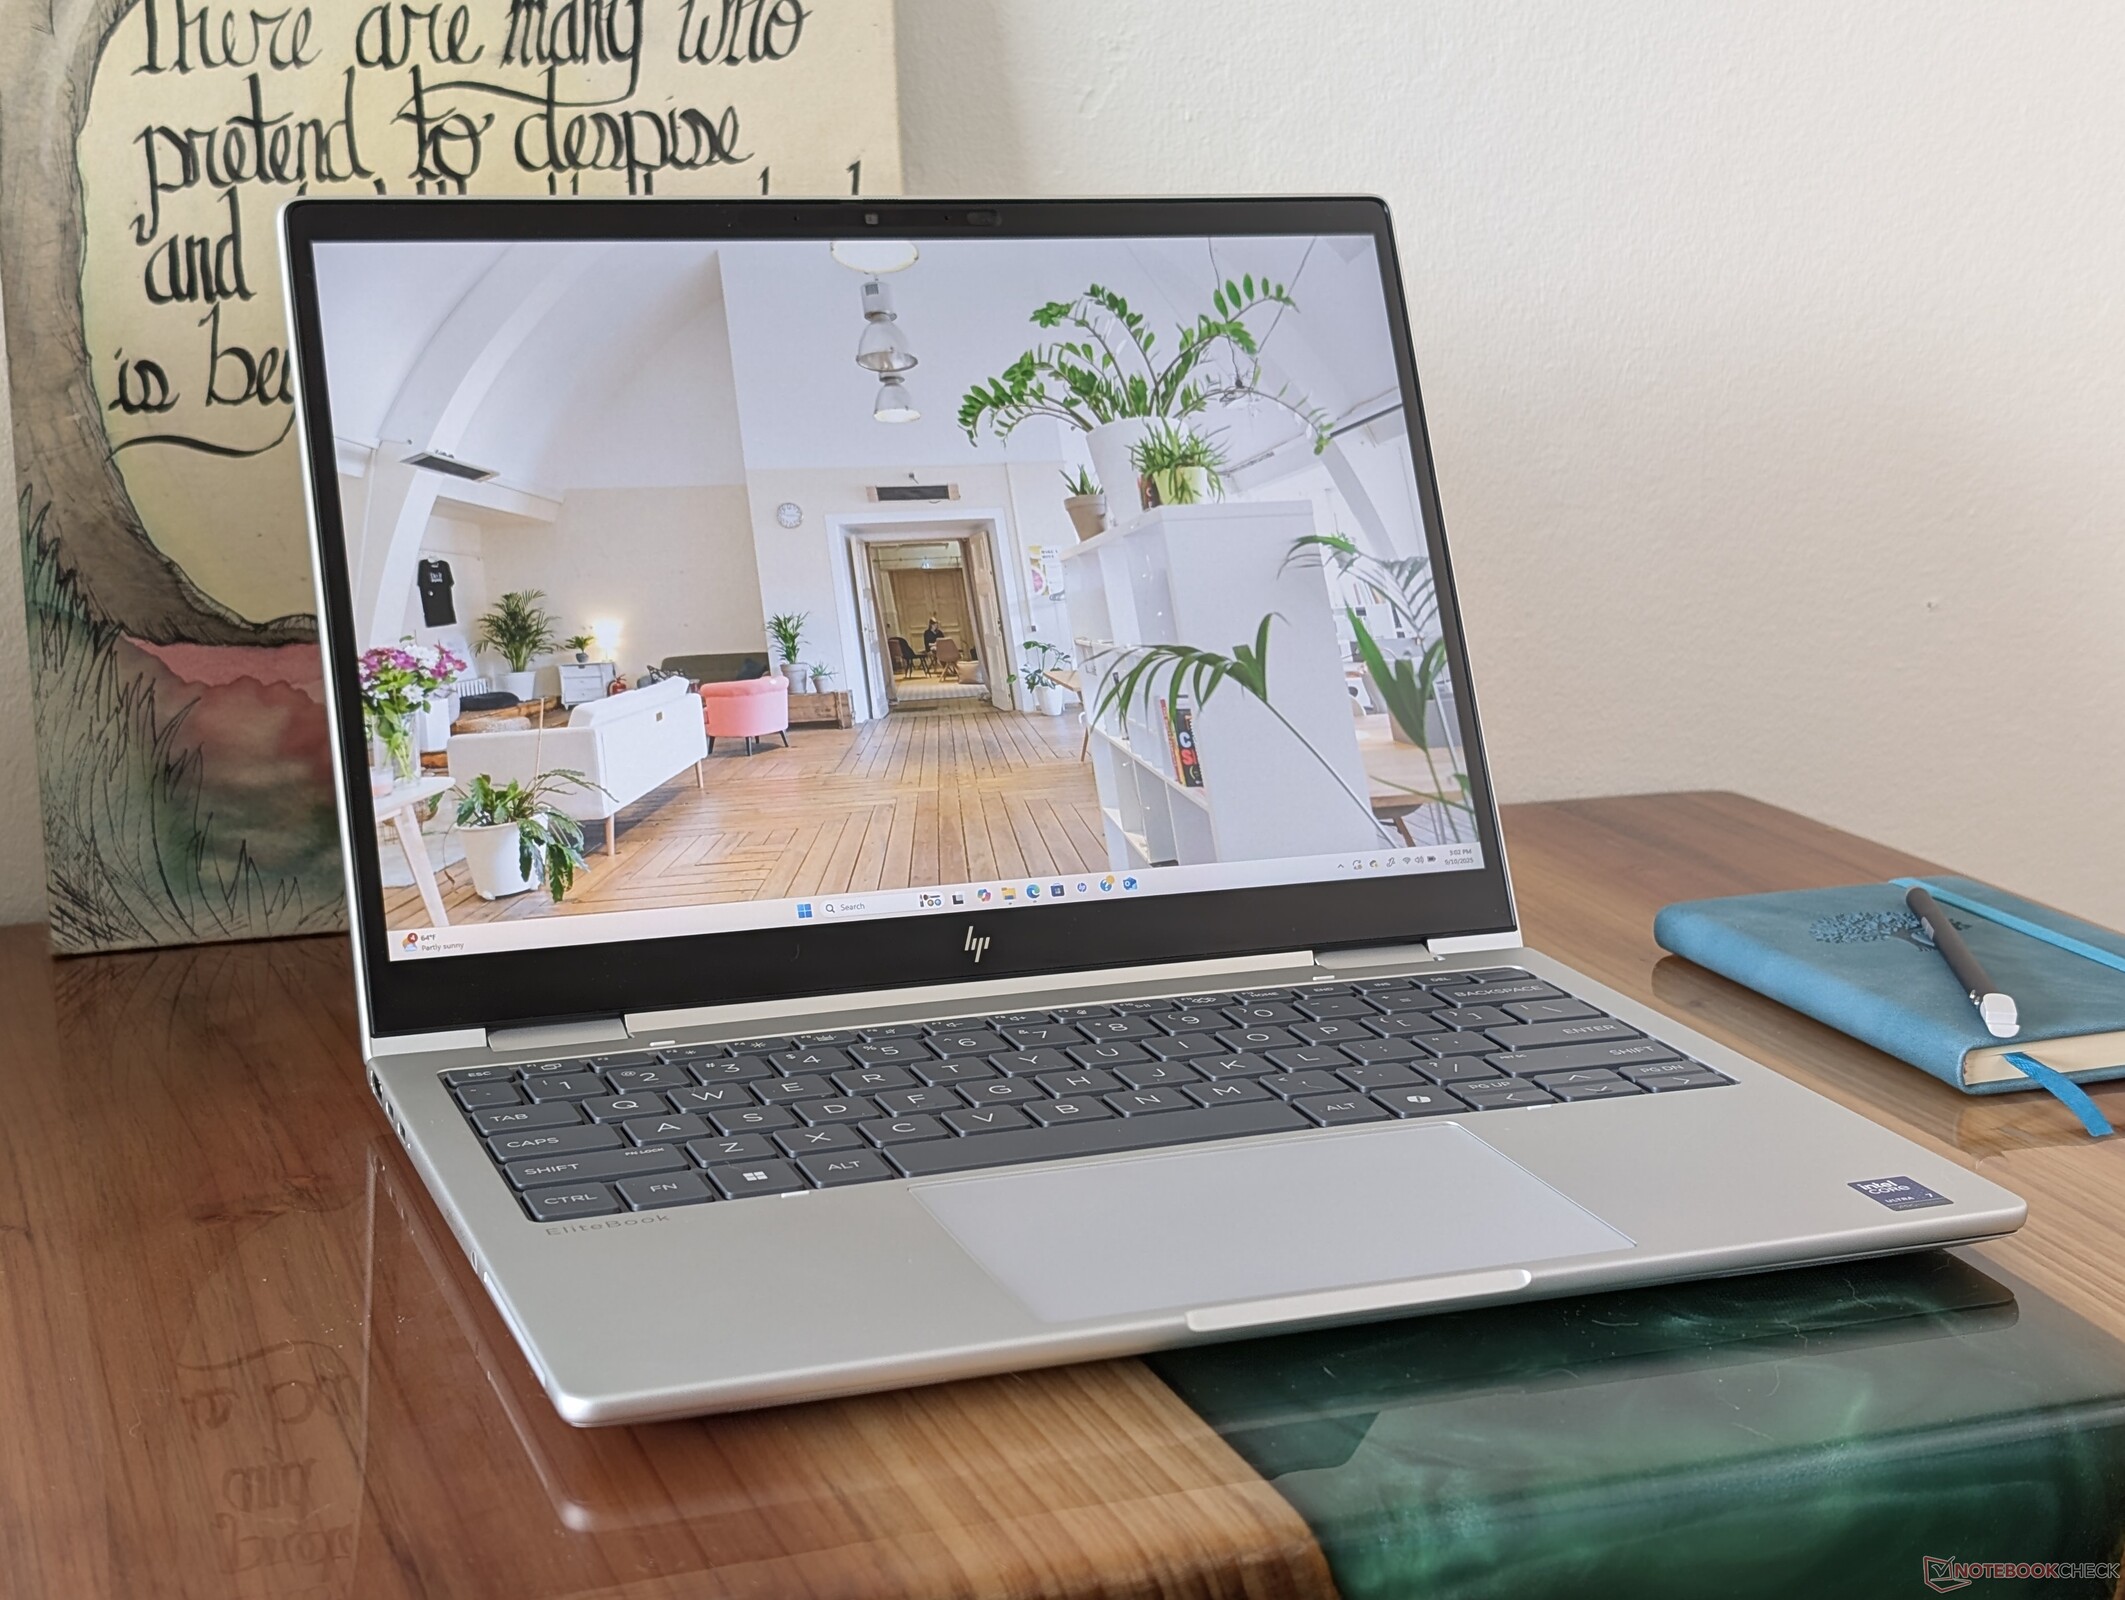
惠普 EliteBook 8 Flip G1i 13 取代了去年的 EliteBook x360 830 G10.它采用了全新的外观设计和新的 Arrow Lake-U 处理器选项,取代了老一代的 Raptor Lake-U。
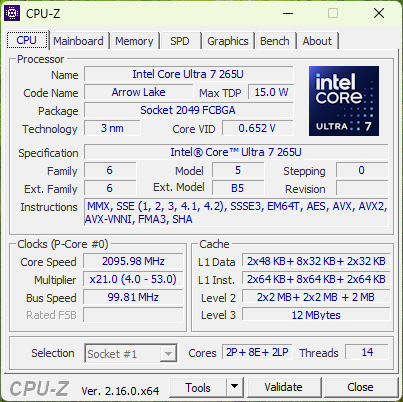
我们的测试机配置了 Core Ultra 7 265U CPU、32 GB 内存和 1200p IPS 触摸屏,惠普网站售价约 3600 美元。竞争对手包括其他 13 英寸消费级或以商务为中心的可转换设备,如 联想 ThinkPad L13 Yoga, 华硕 ProArt PZ13或 微星 Summit E13 AI Evo.
更多惠普评论:
规格
案例
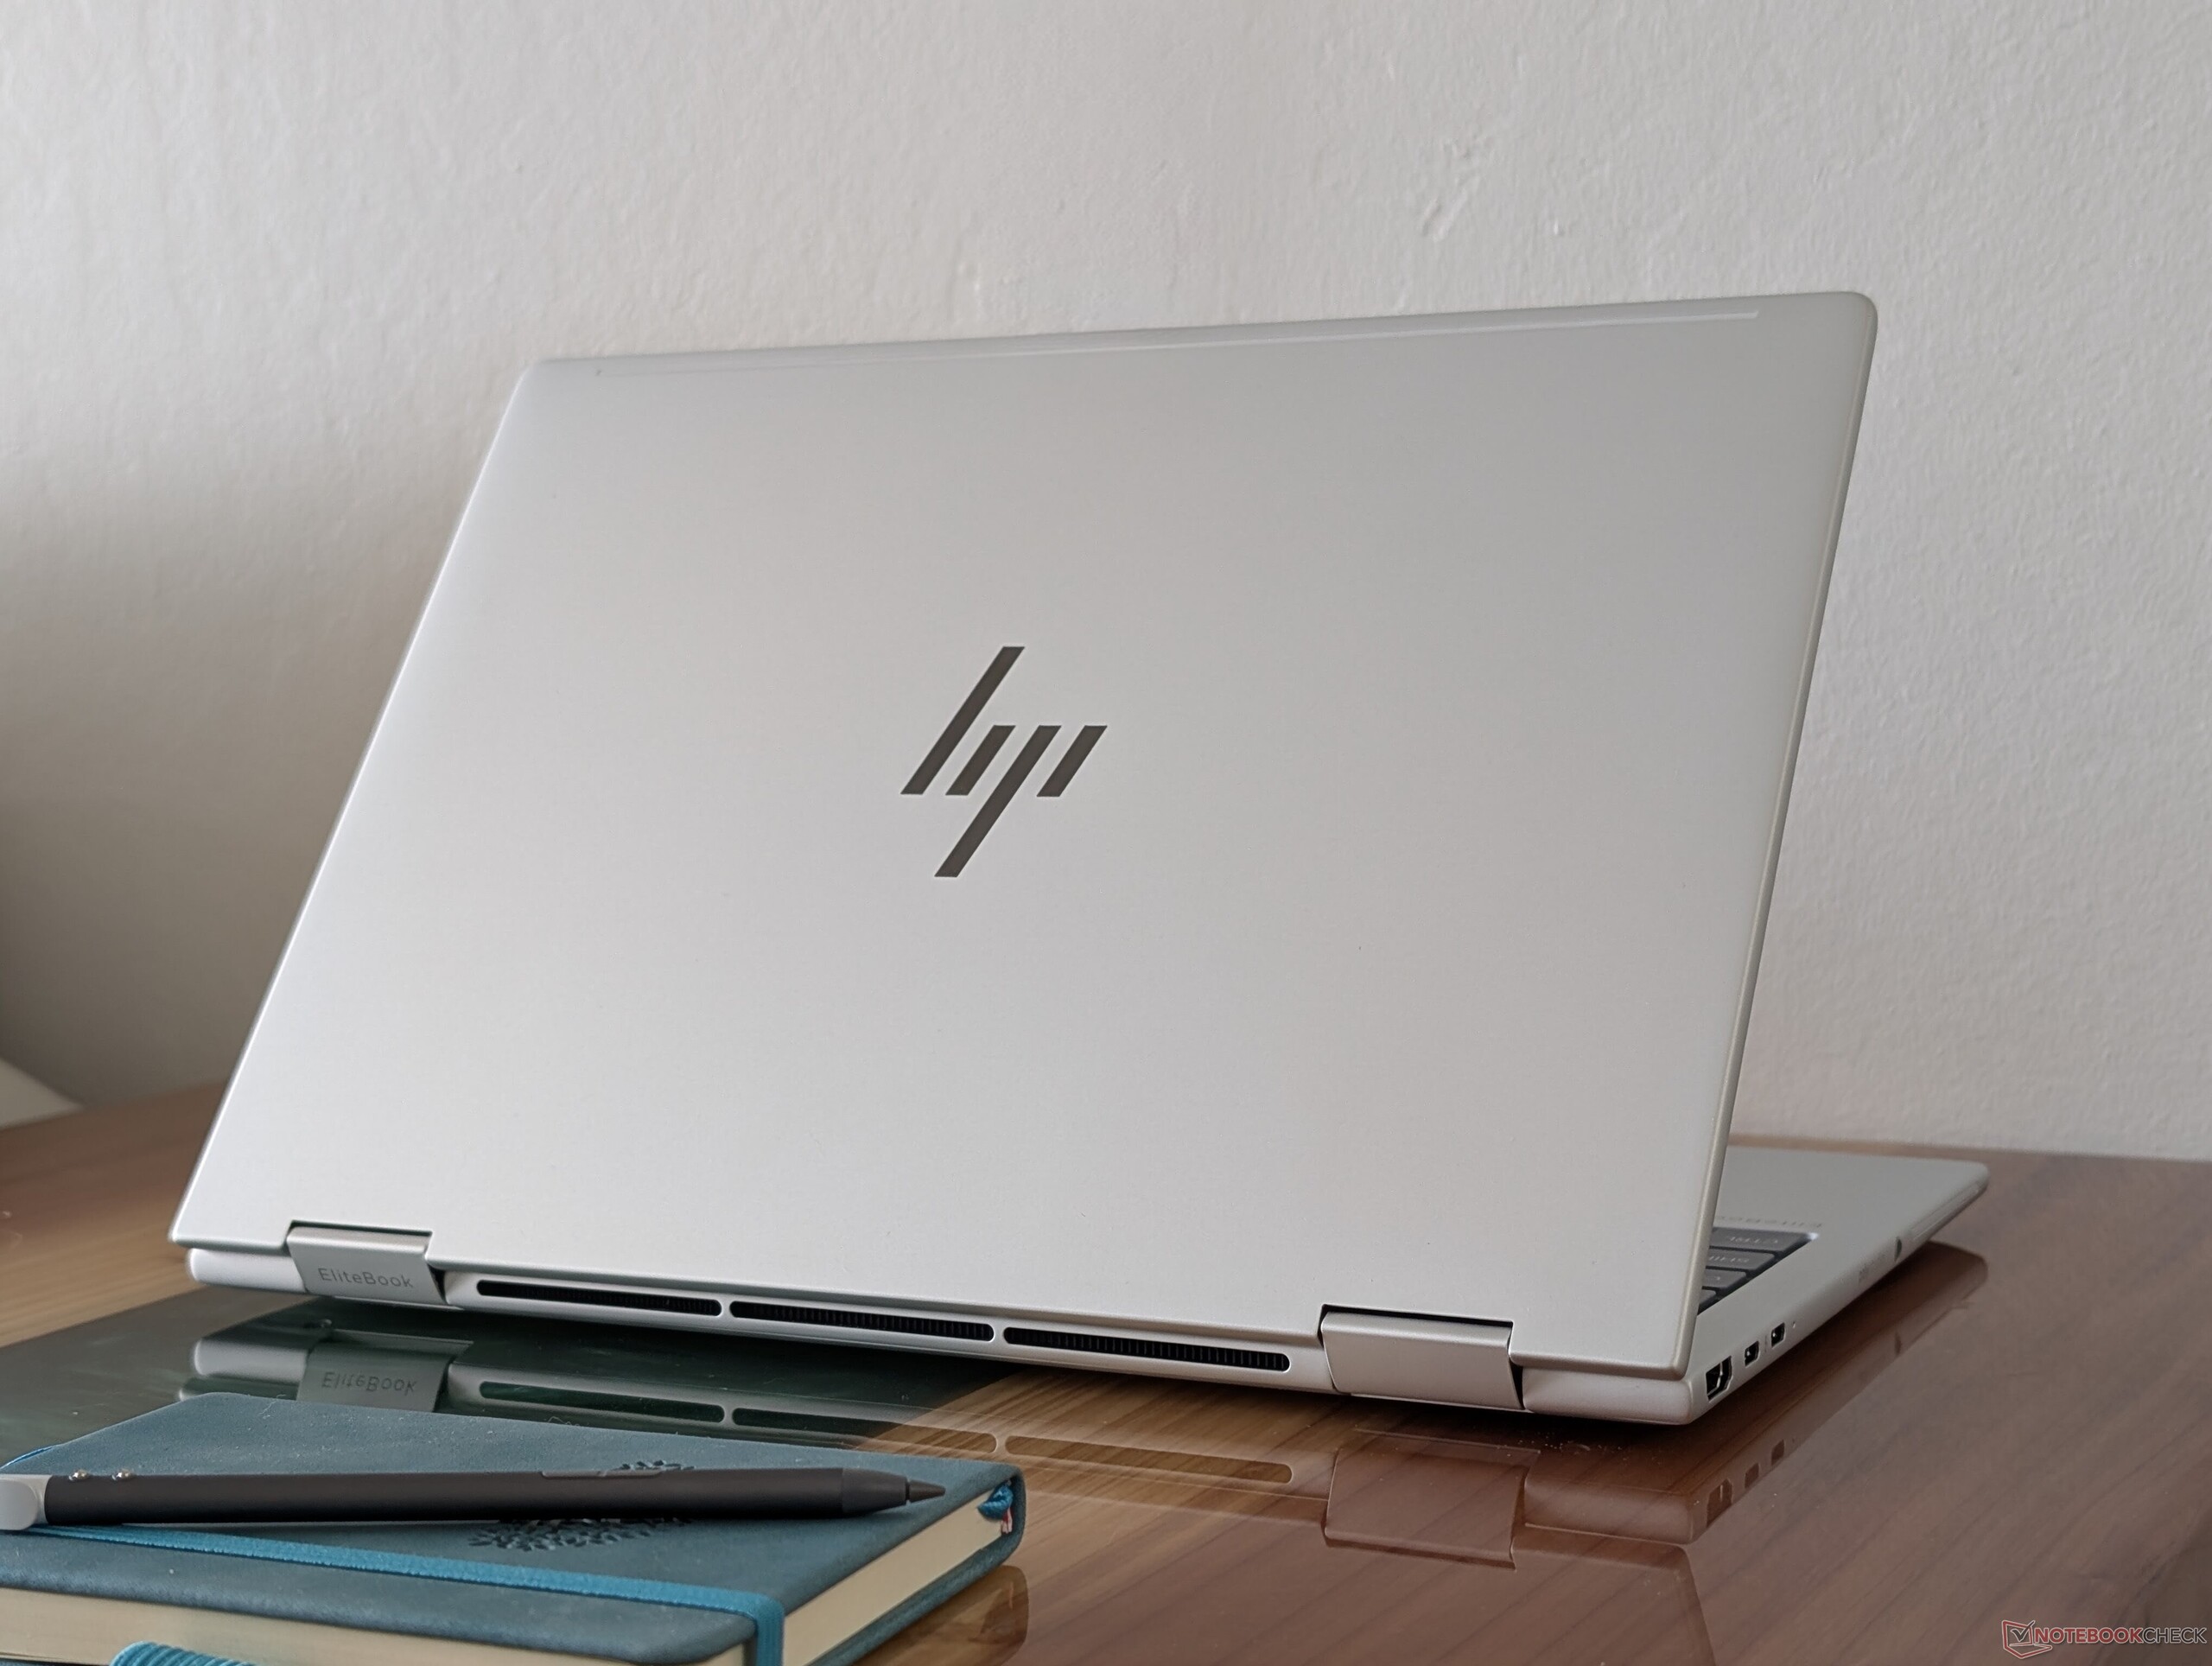
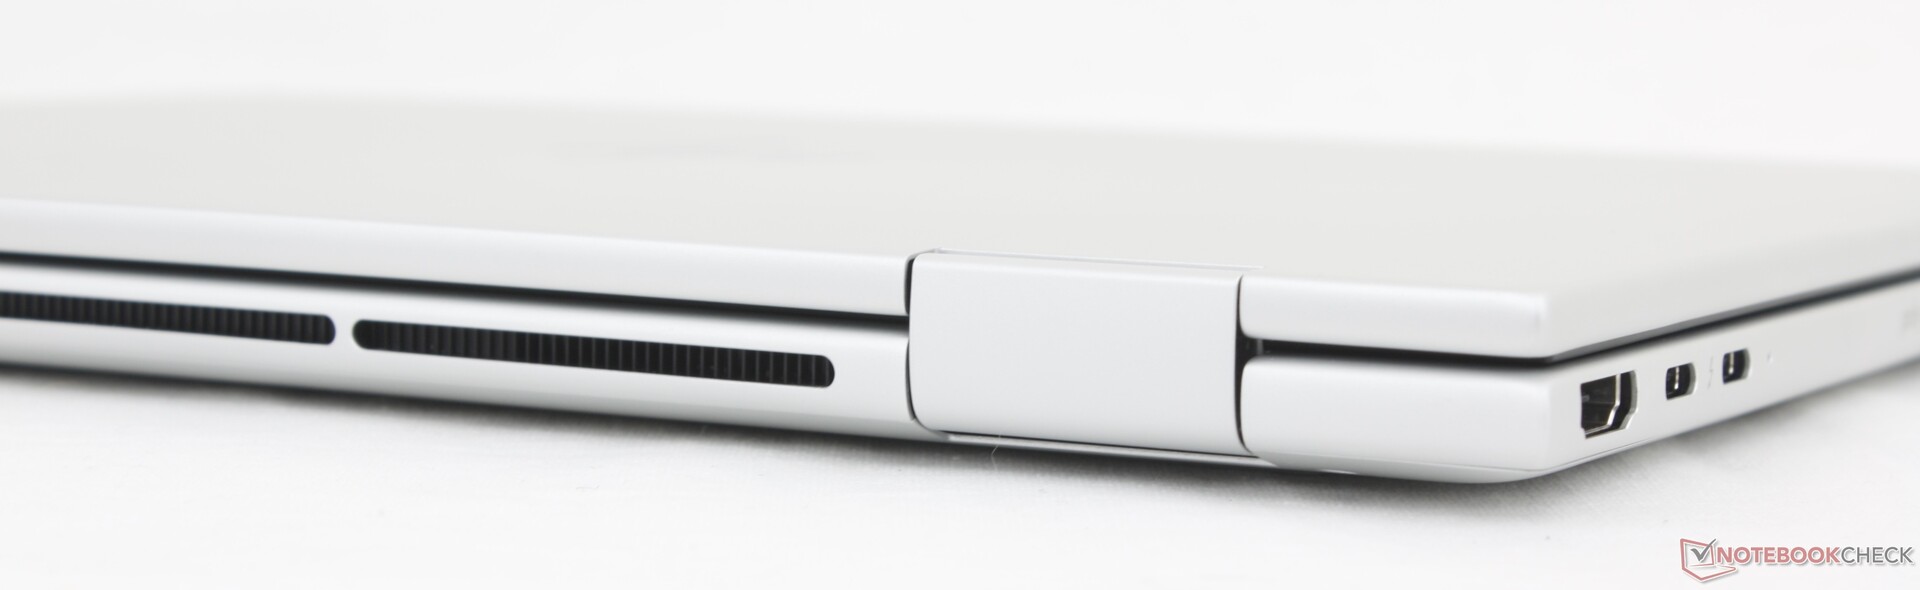
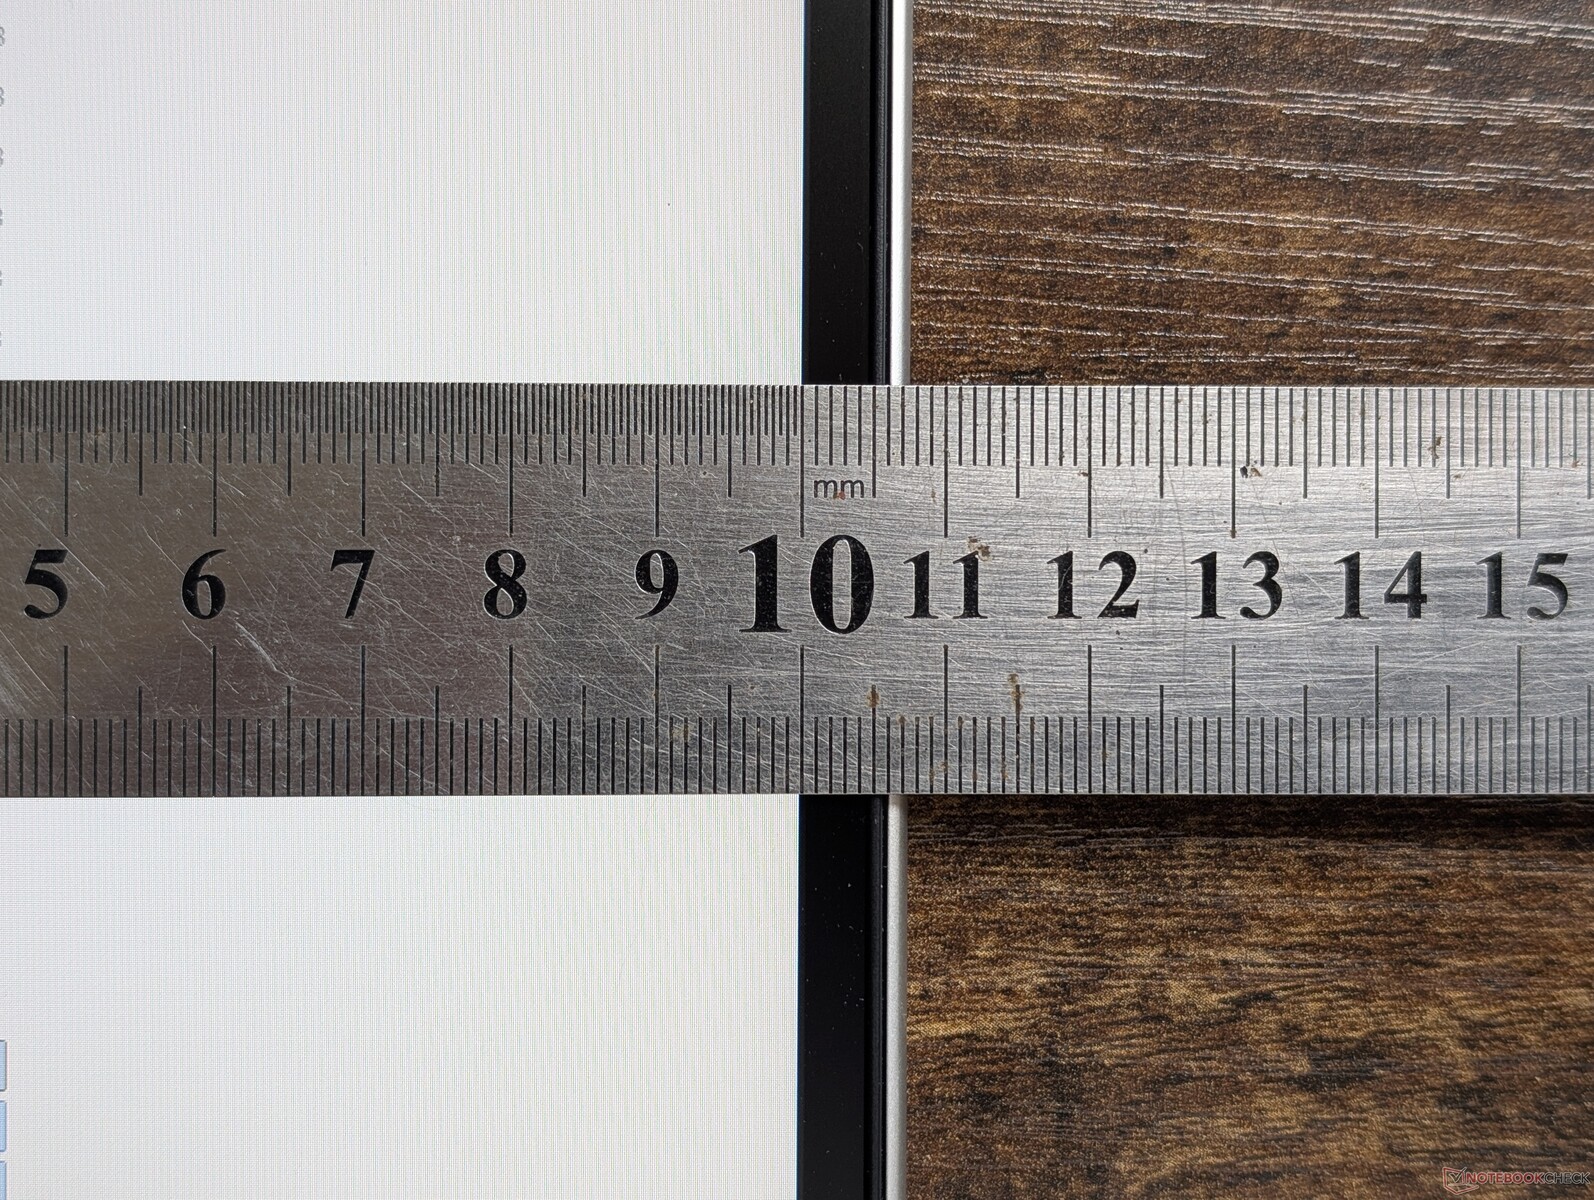
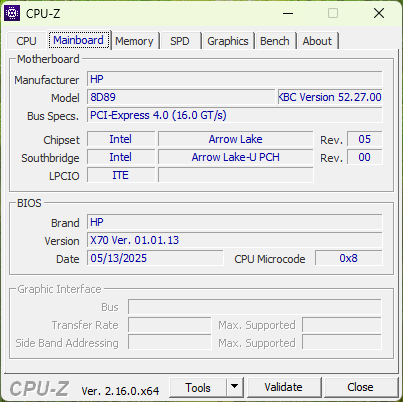
机身采用了与其他大多数 EliteBook 机型类似的金属材料,包括即将推出的 EliteBook x360 830 G10,给人一种熟悉的感觉。今年,新的骨架薄了几毫米,但长度、宽度和重量几乎保持不变。
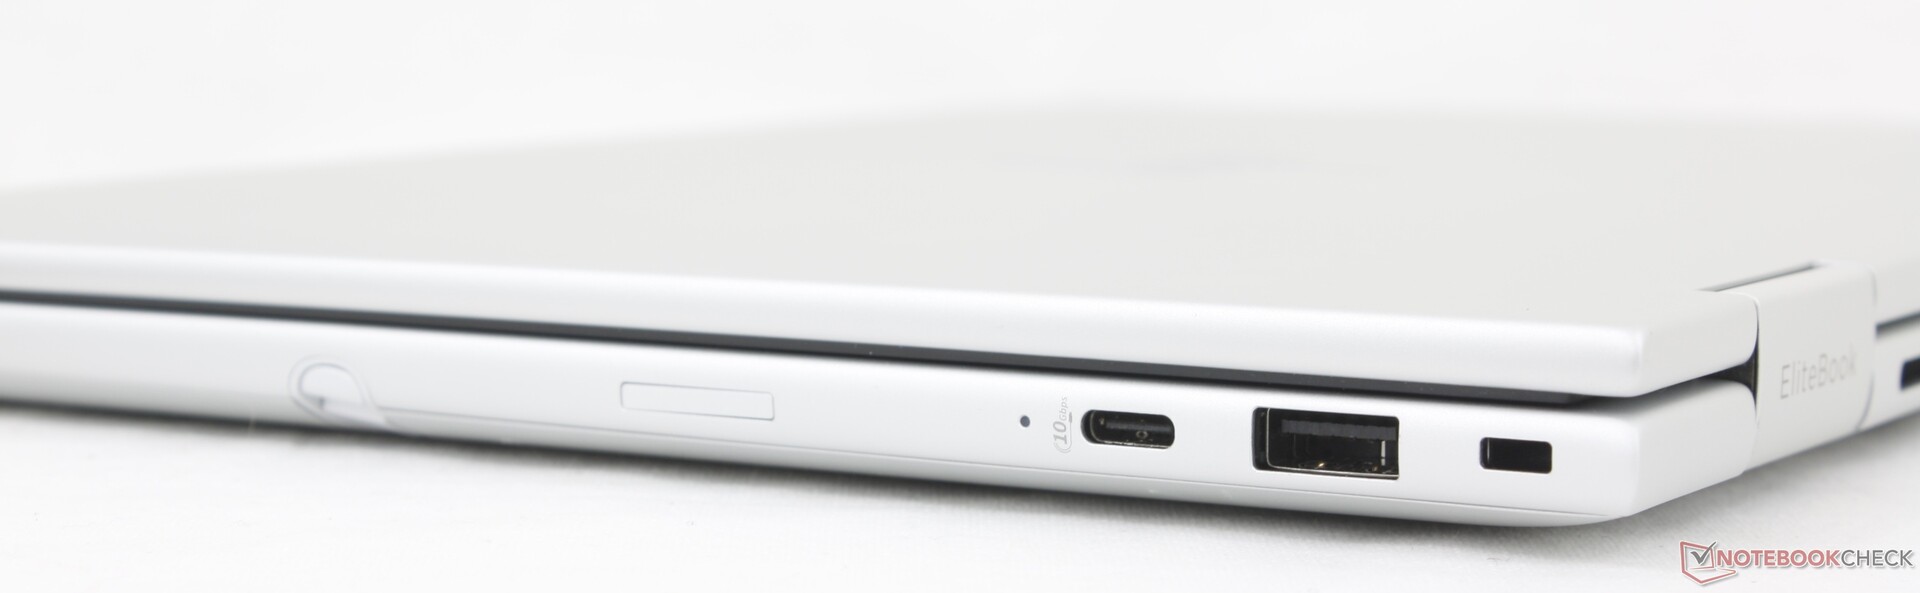
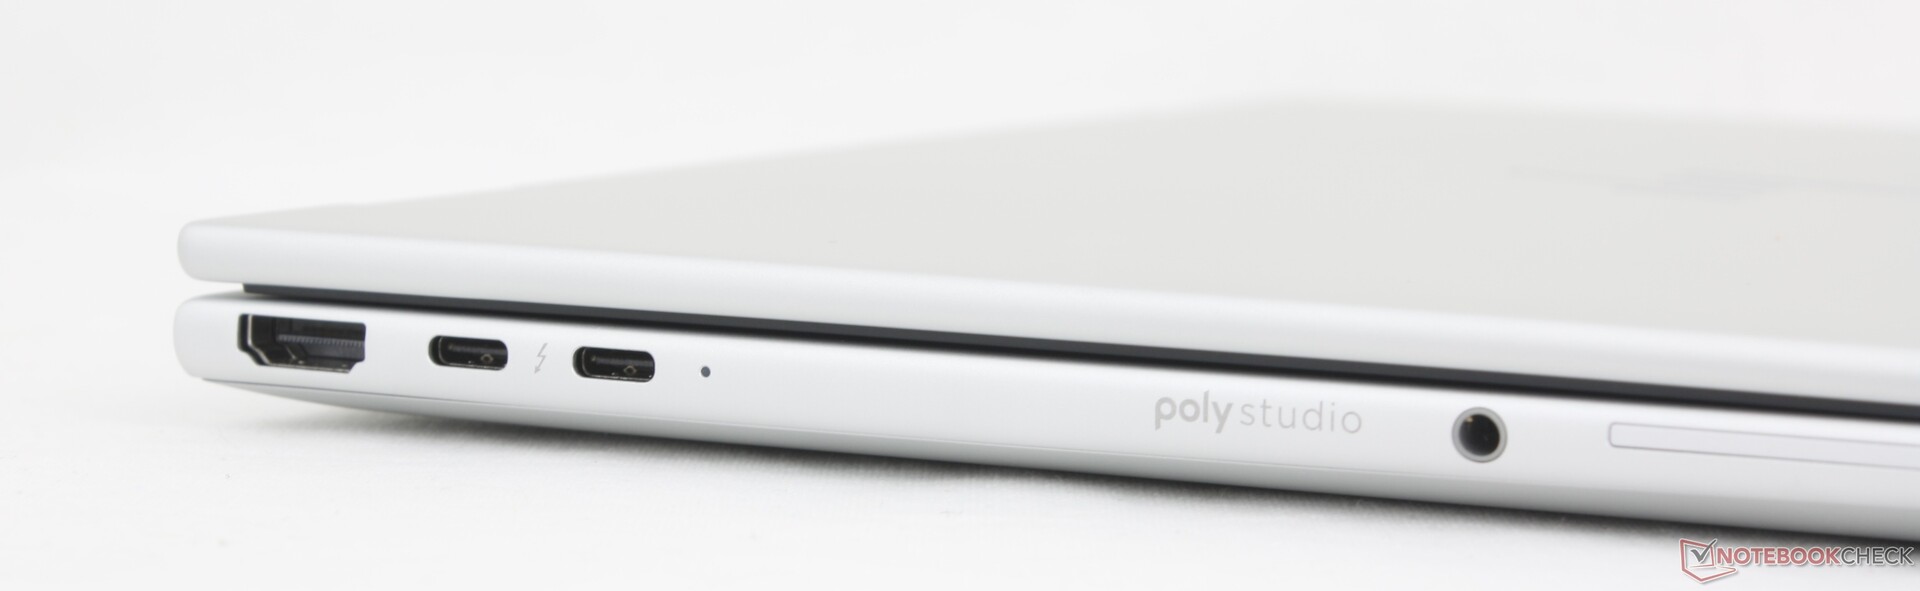
连接性
与 EliteBook x360 830 G10 相比,该机型将一个 USB-A 端口换成了第三个 USB-C 端口。
交流
网络摄像头
500 万像素网络摄像头标配红外和物理隐私快门。

, Ultra 7 265U, Samsung PM9A1 MZVL2512HCJQ")
, Ultra 7 265U, Samsung PM9A1 MZVL2512HCJQ")
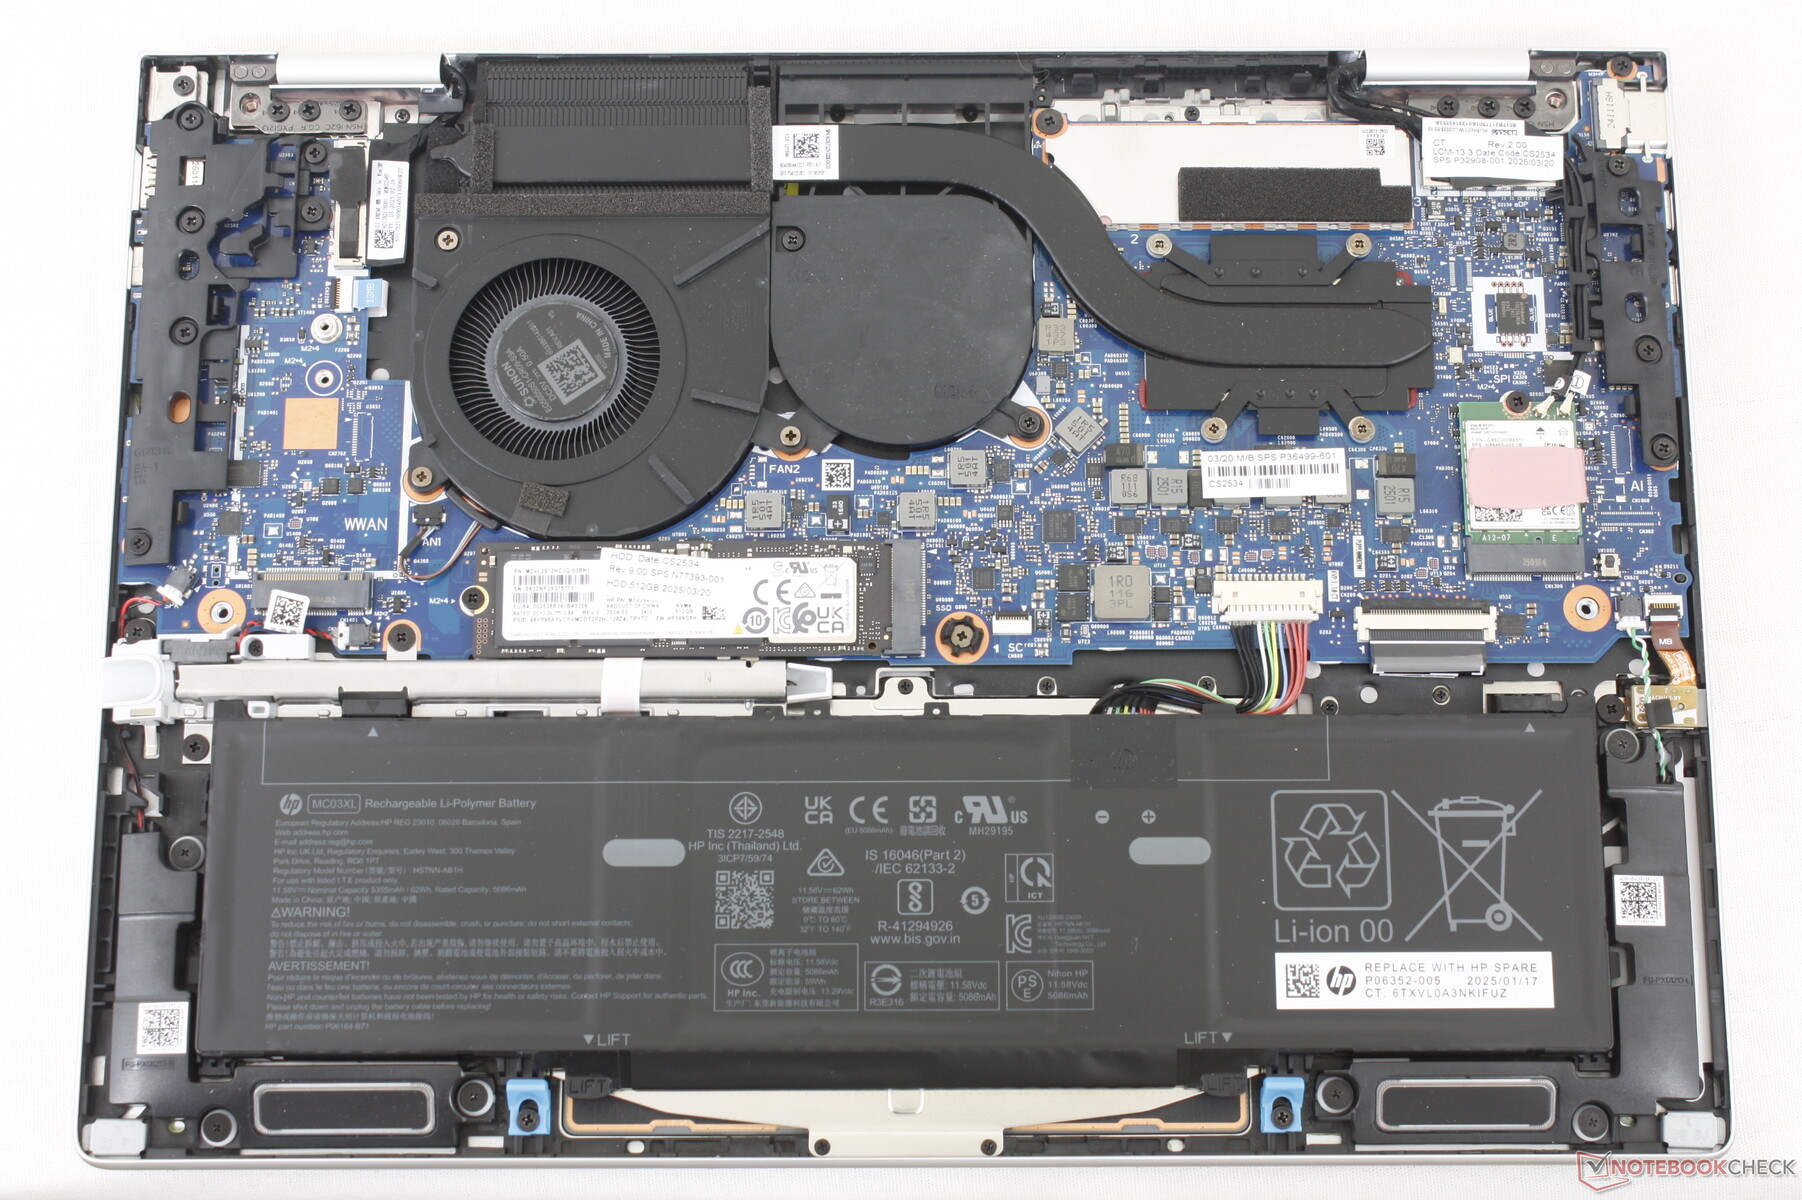
维护
底部面板只需一把十字螺丝刀即可轻松维修。
可持续性
生产过程中使用的大约 50% 至 70% 的塑料和 80% 的金属都来自回收资源。包装完全可回收,但交流适配器上仍有一些塑料包装。
配件和保修
随附的主动式触控笔可收纳在笔记本电脑右侧边缘的笔筒内。标配一年有限制造商保修。
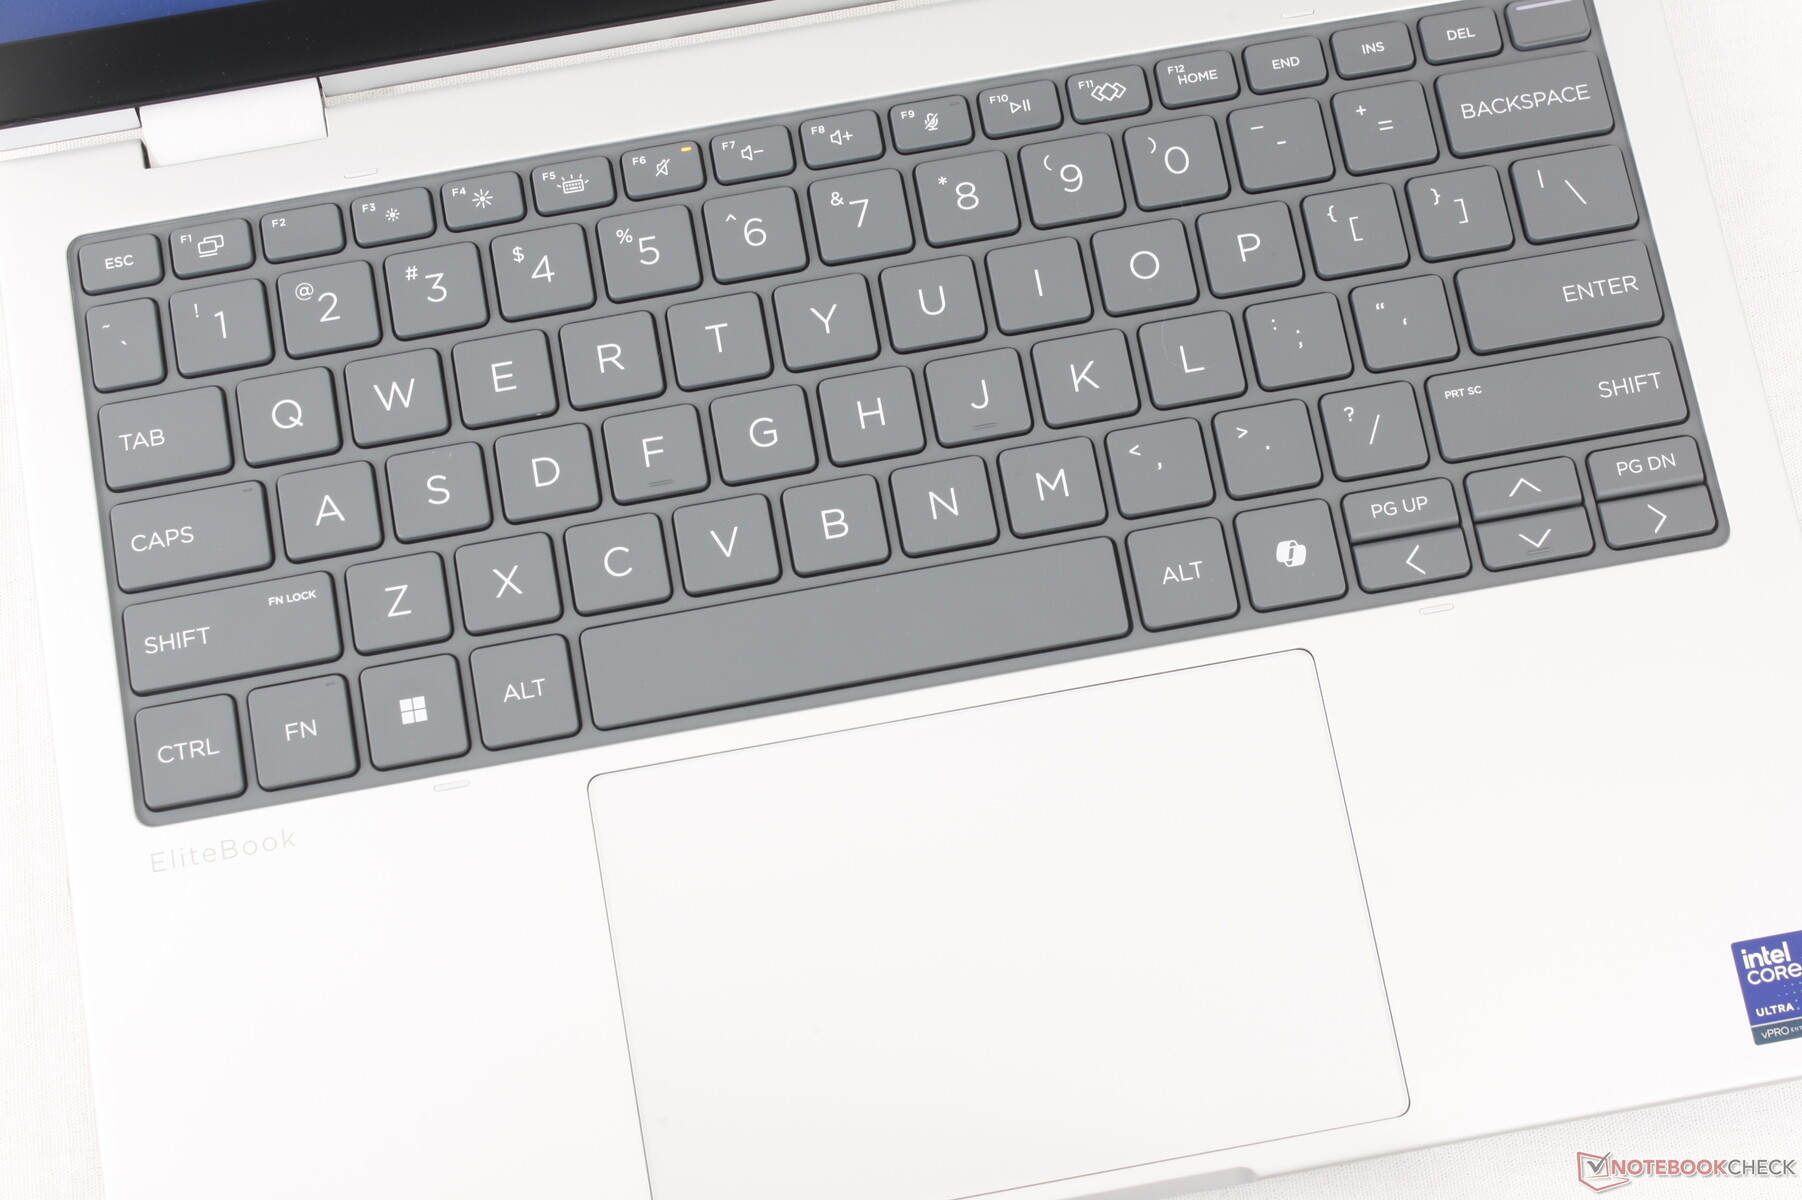
输入设备
键盘和触摸板
就像最近的 EliteBook 8 G1a 16EliteBook 8 Flip G1i 13 的键盘和点击板分别增加了字体大小和表面积,以改善人体工学。在所有 13 英寸可折叠本中,除了方向键比较拥挤外,打字体验是最好的。
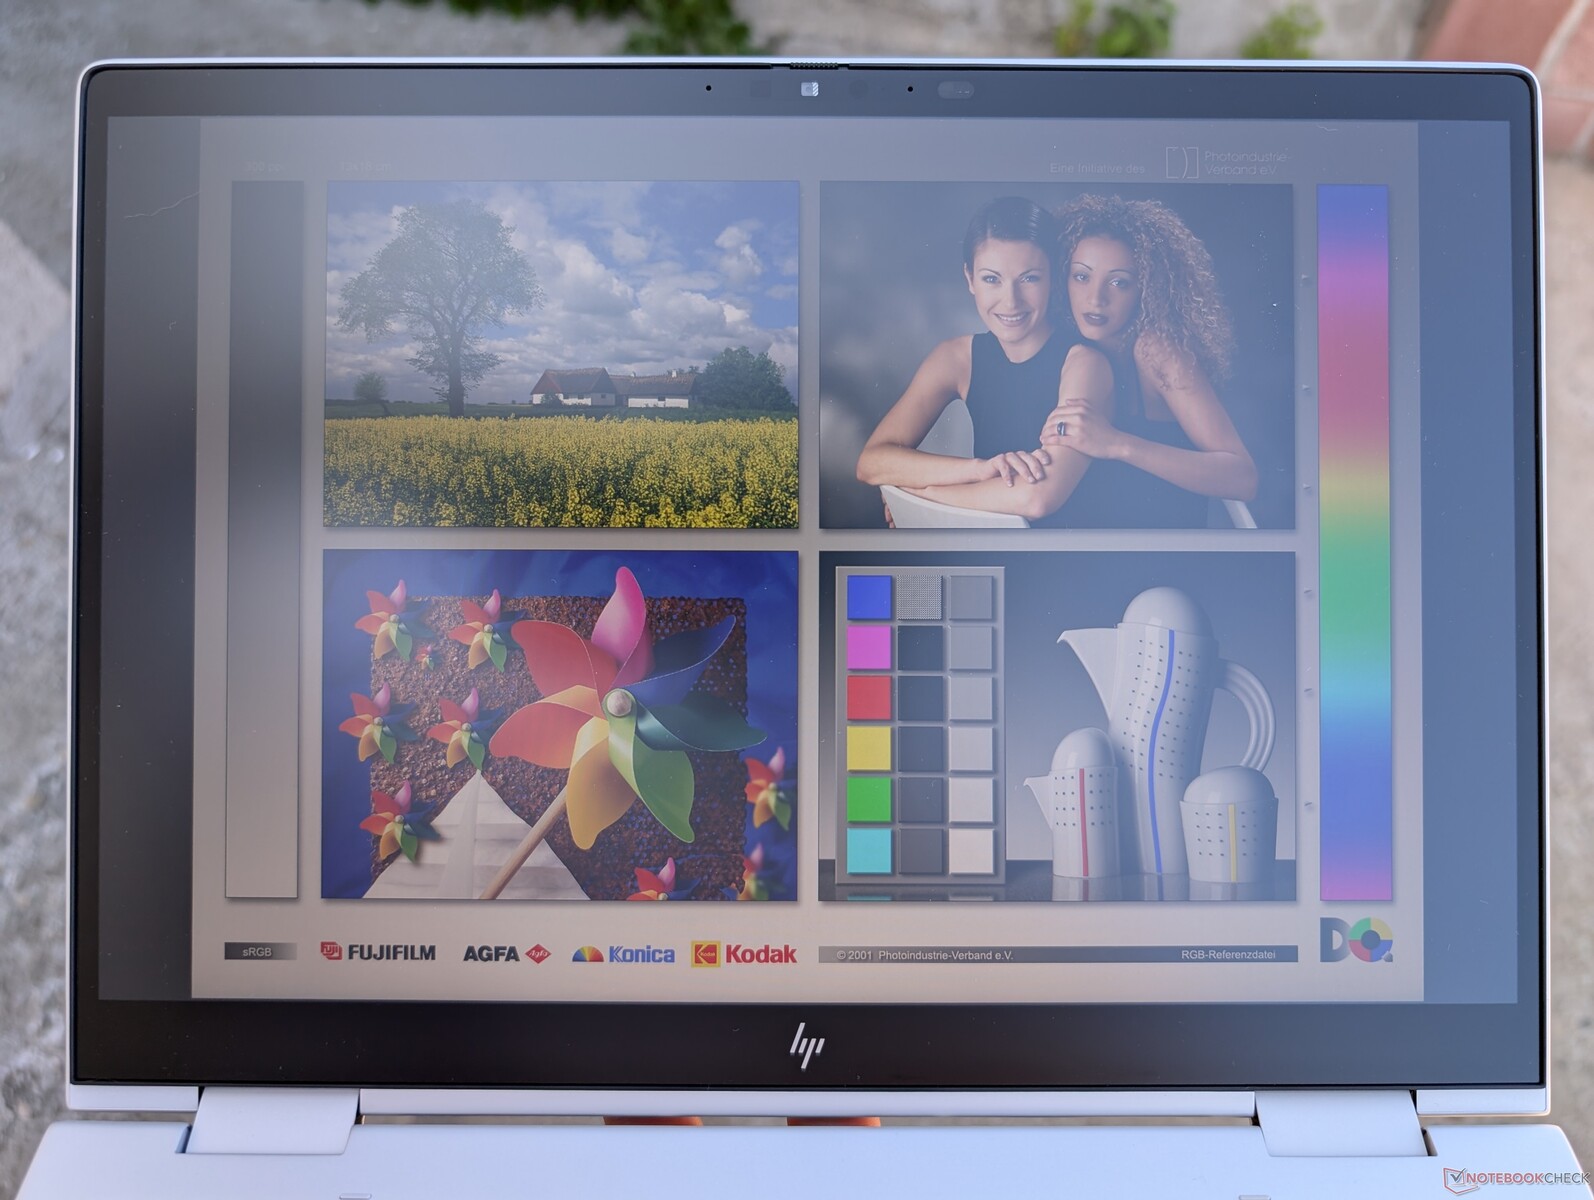
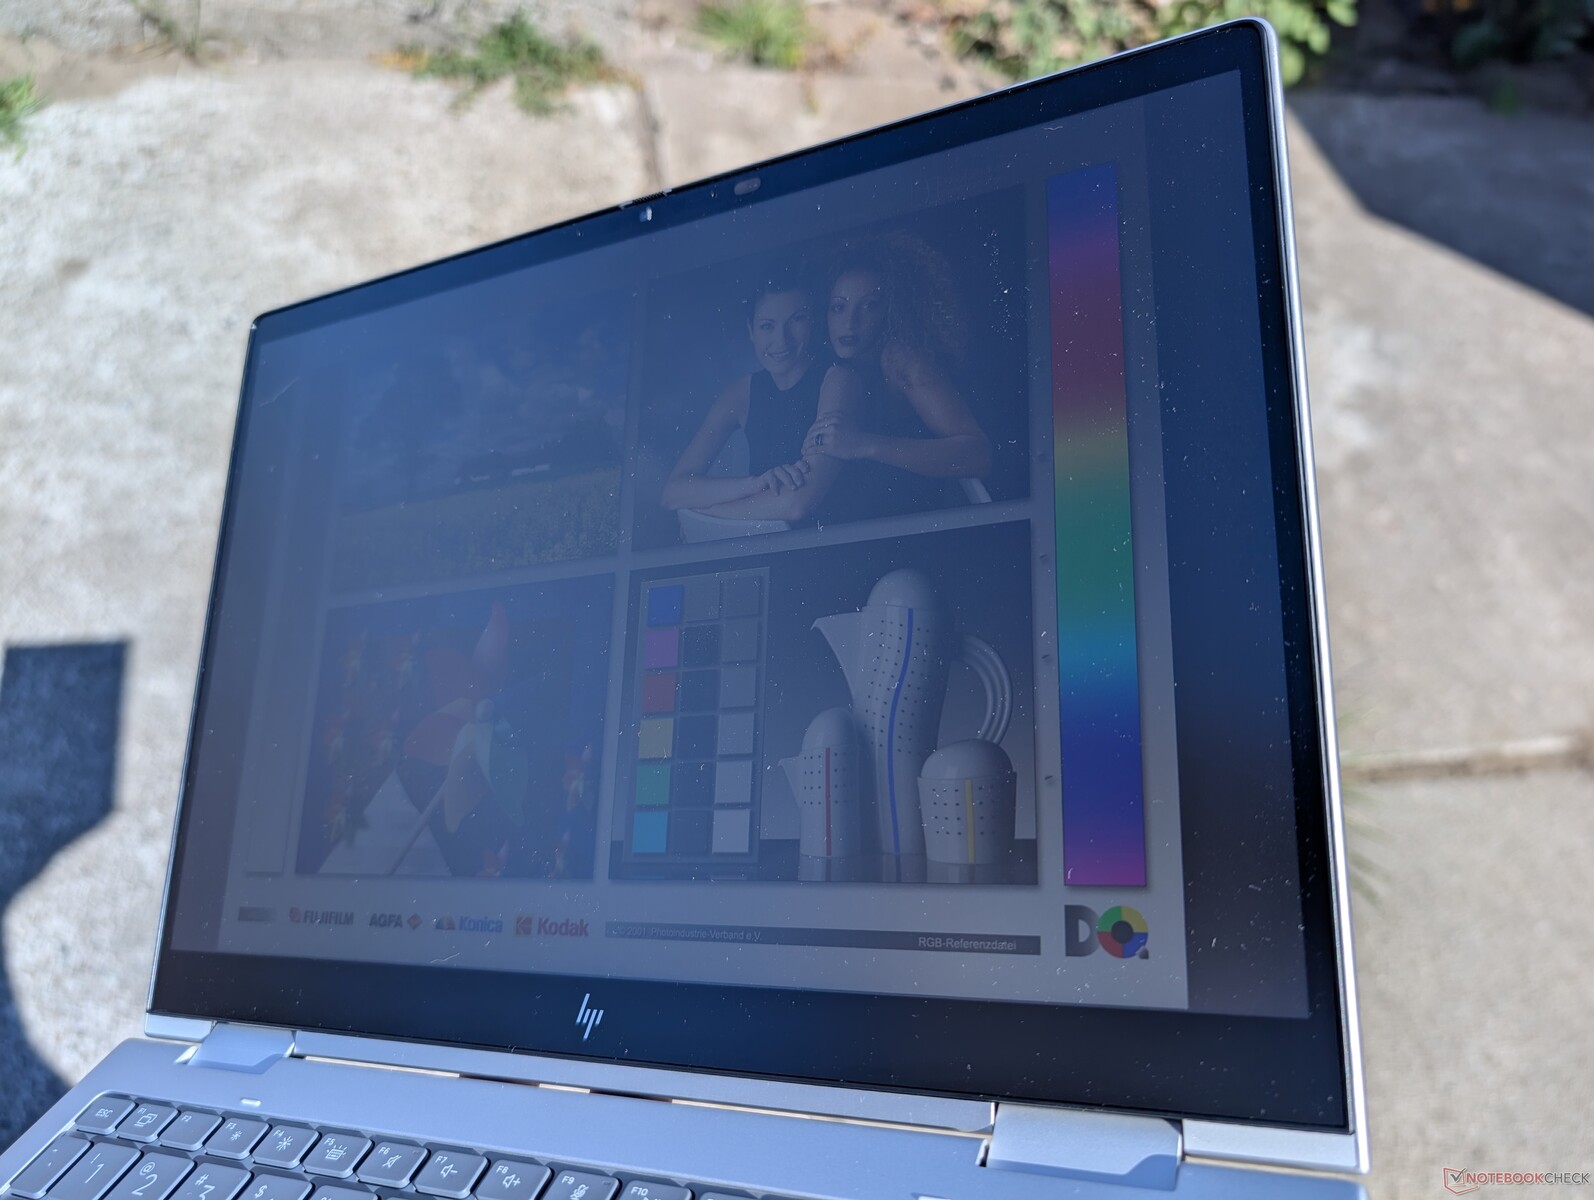
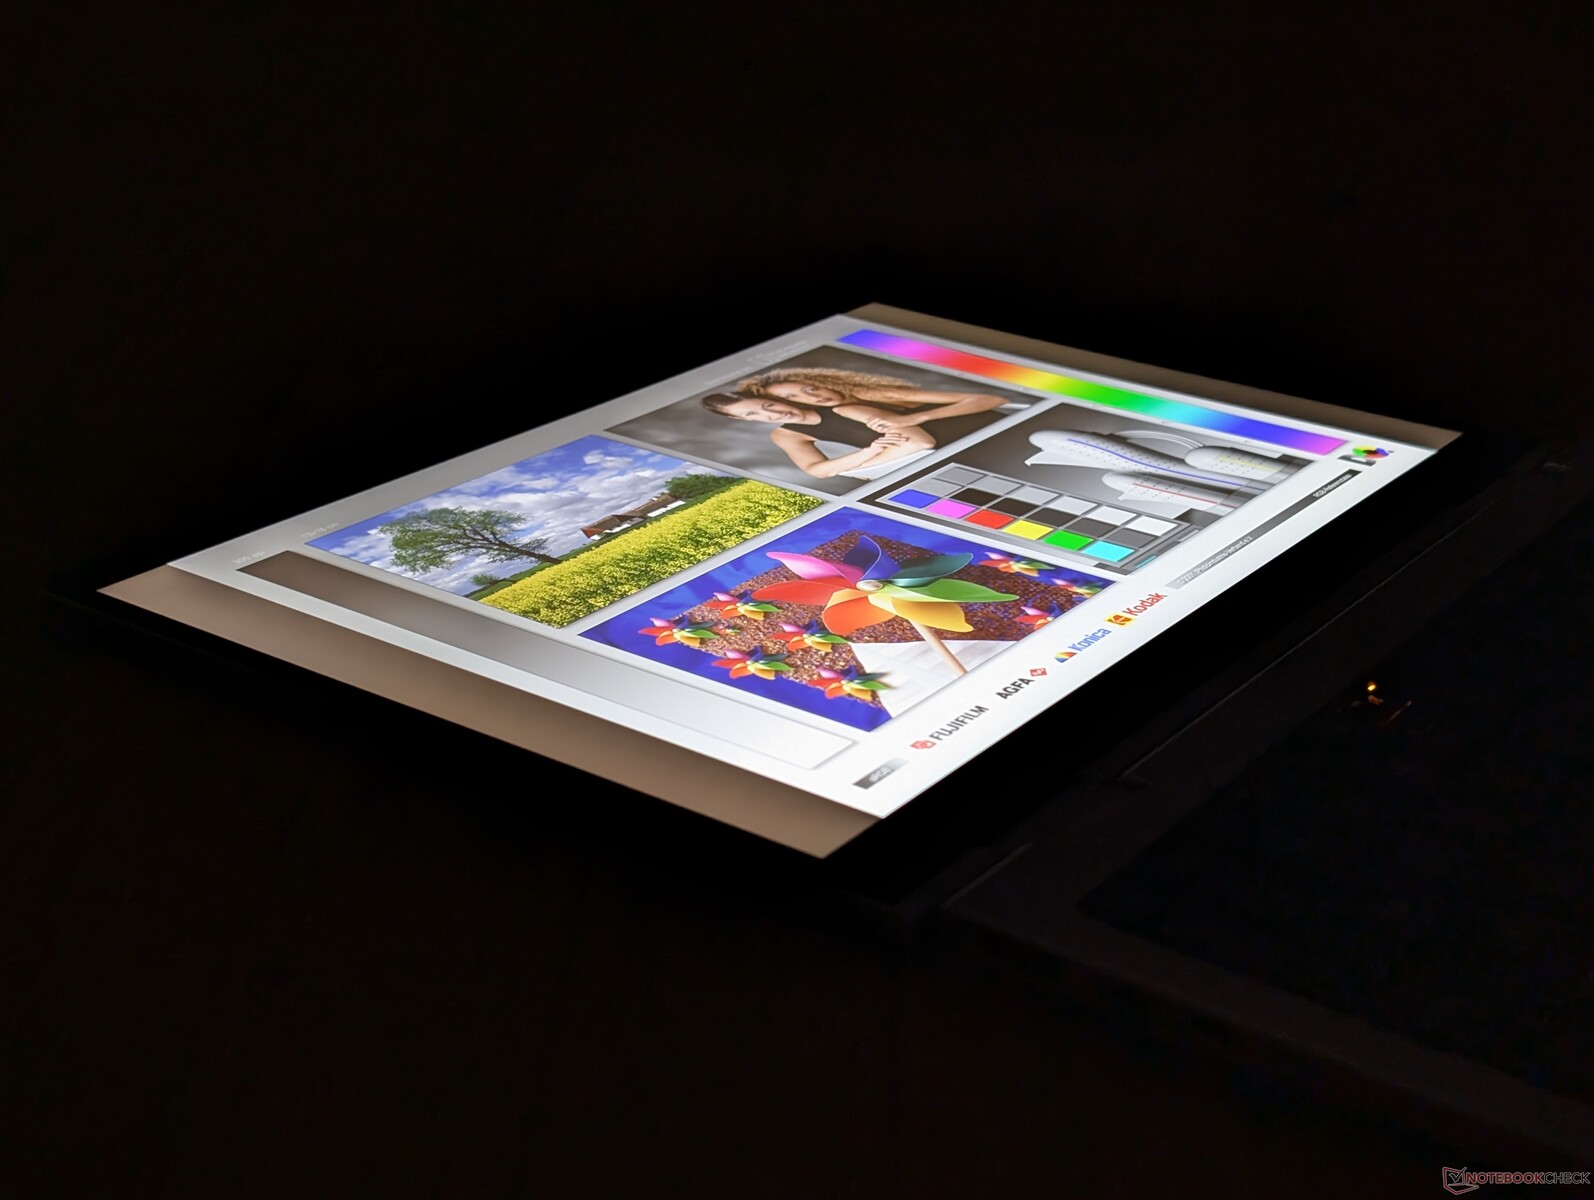
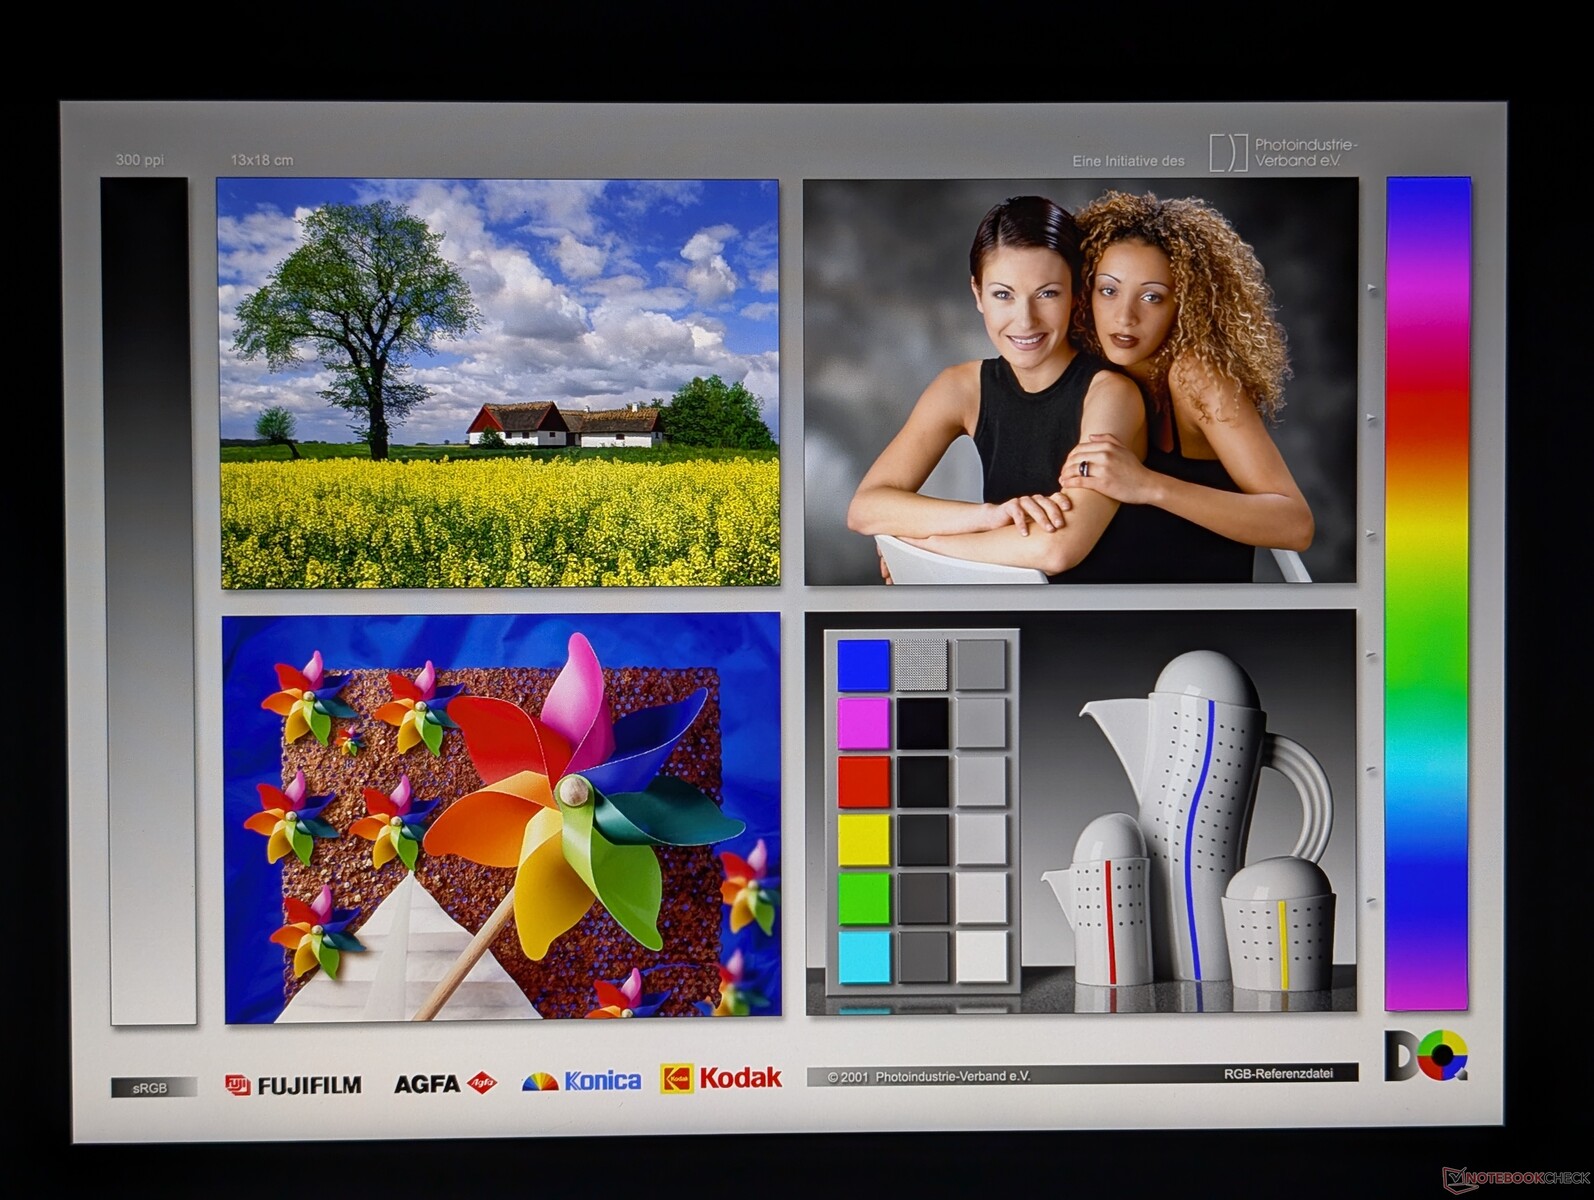
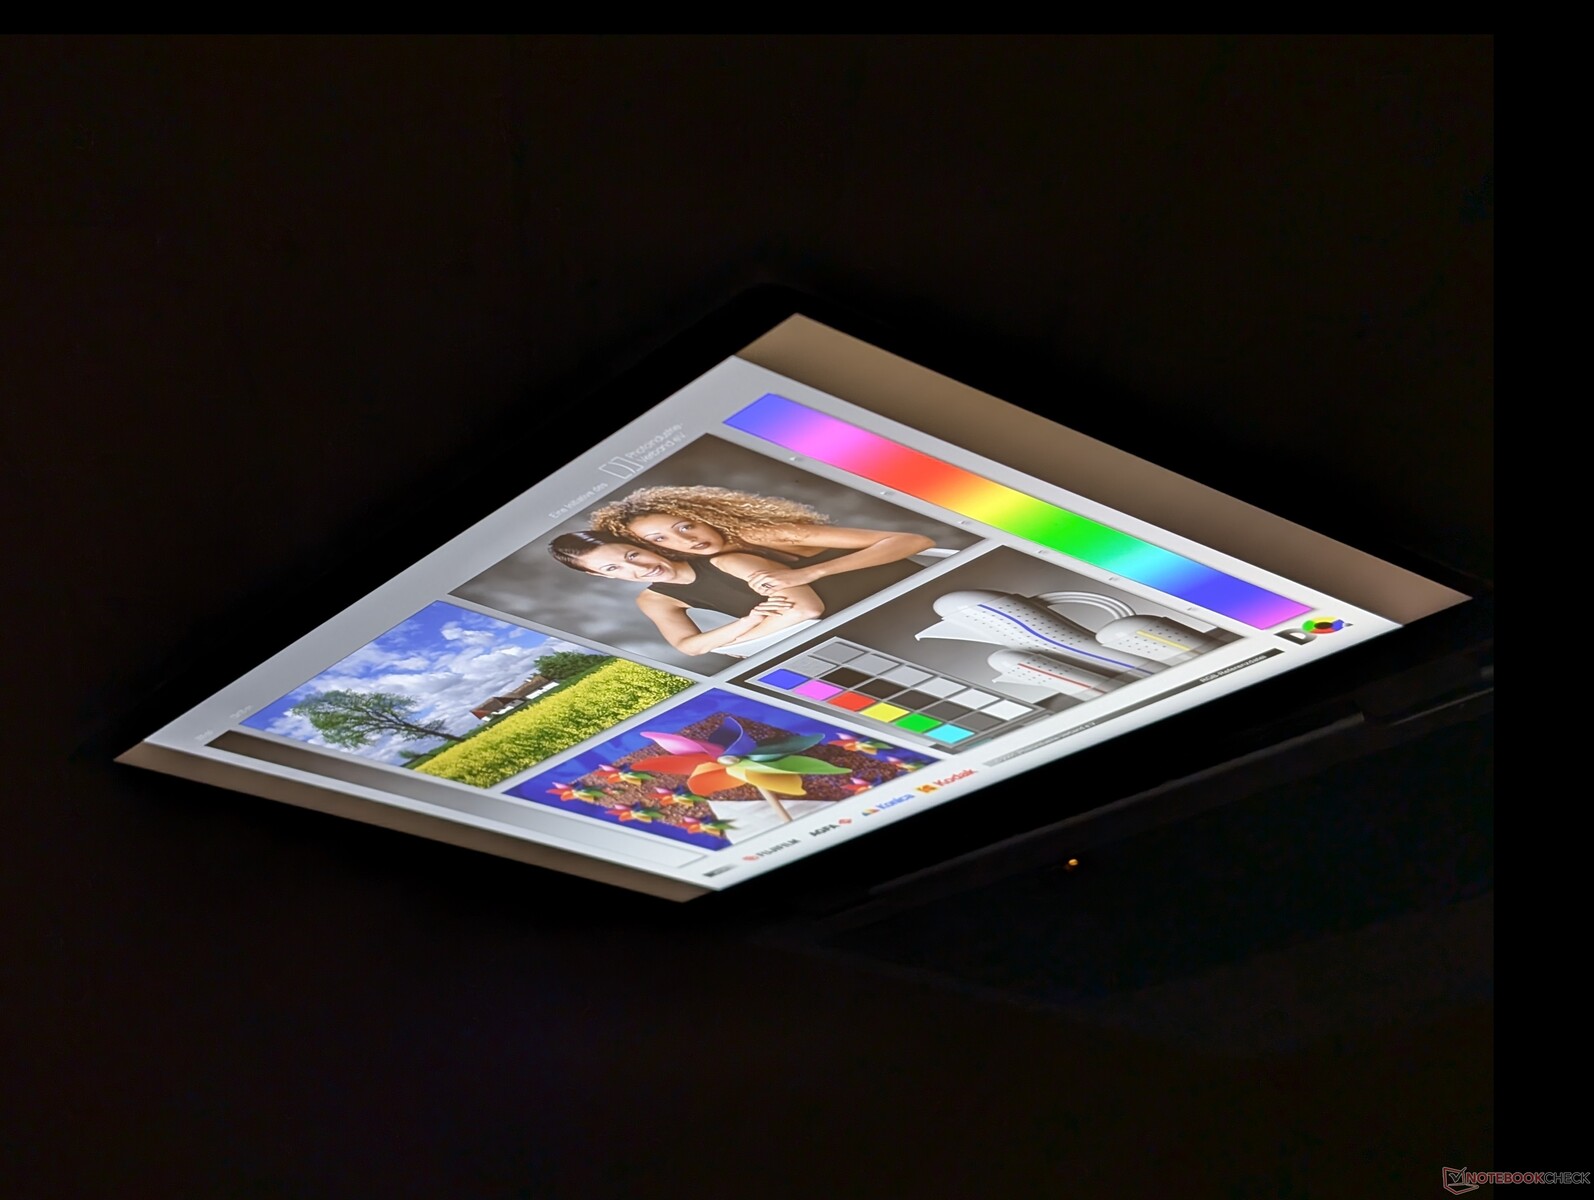
显示屏
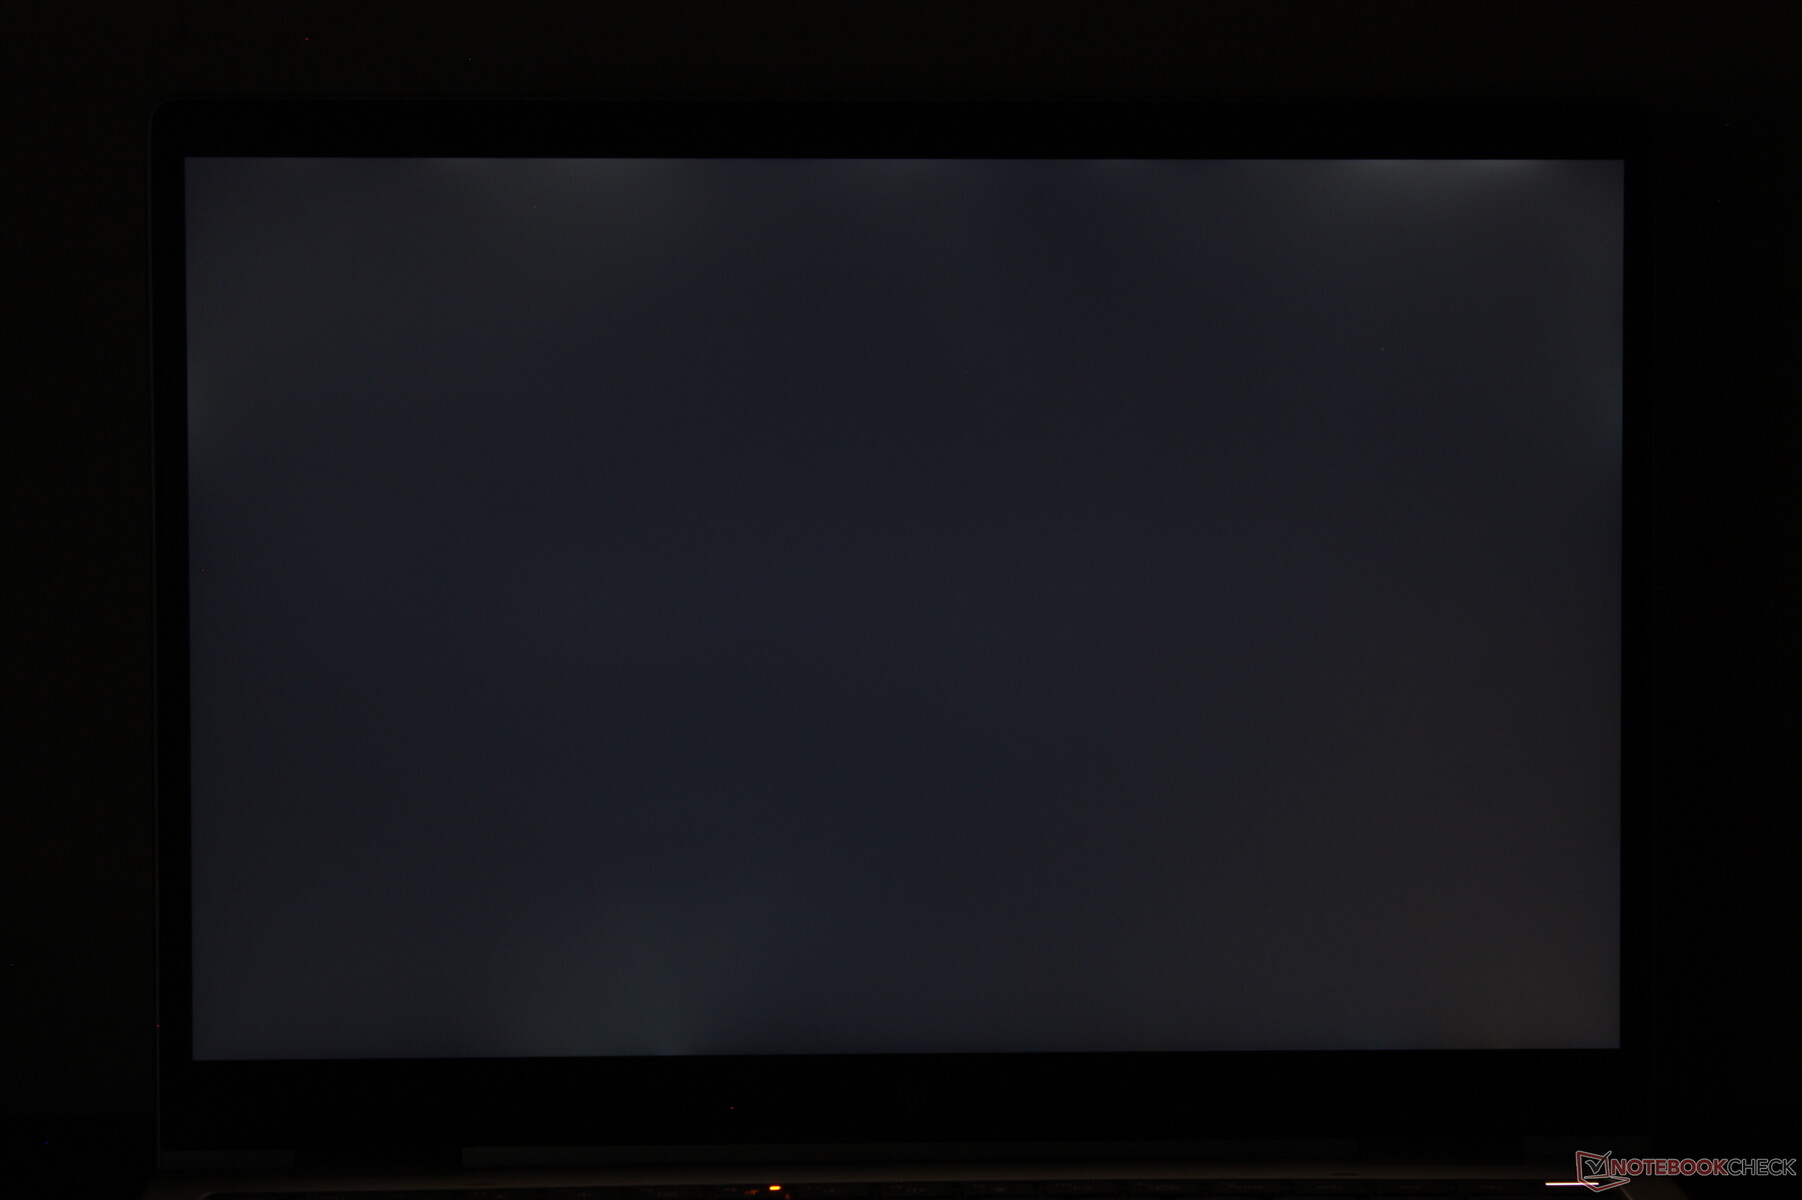
虽然 1920 x 1200 分辨率和 60 Hz 刷新率在当前所有 SKU 中都是固定的,但惠普提供了三种亮度选项来进行补偿:300、400 或 800 尼特。配置后者最适合室外可视性,但无论好坏,Sure View 都必须配置在这一级别。我们的测试机配置的是 400 尼特选项。
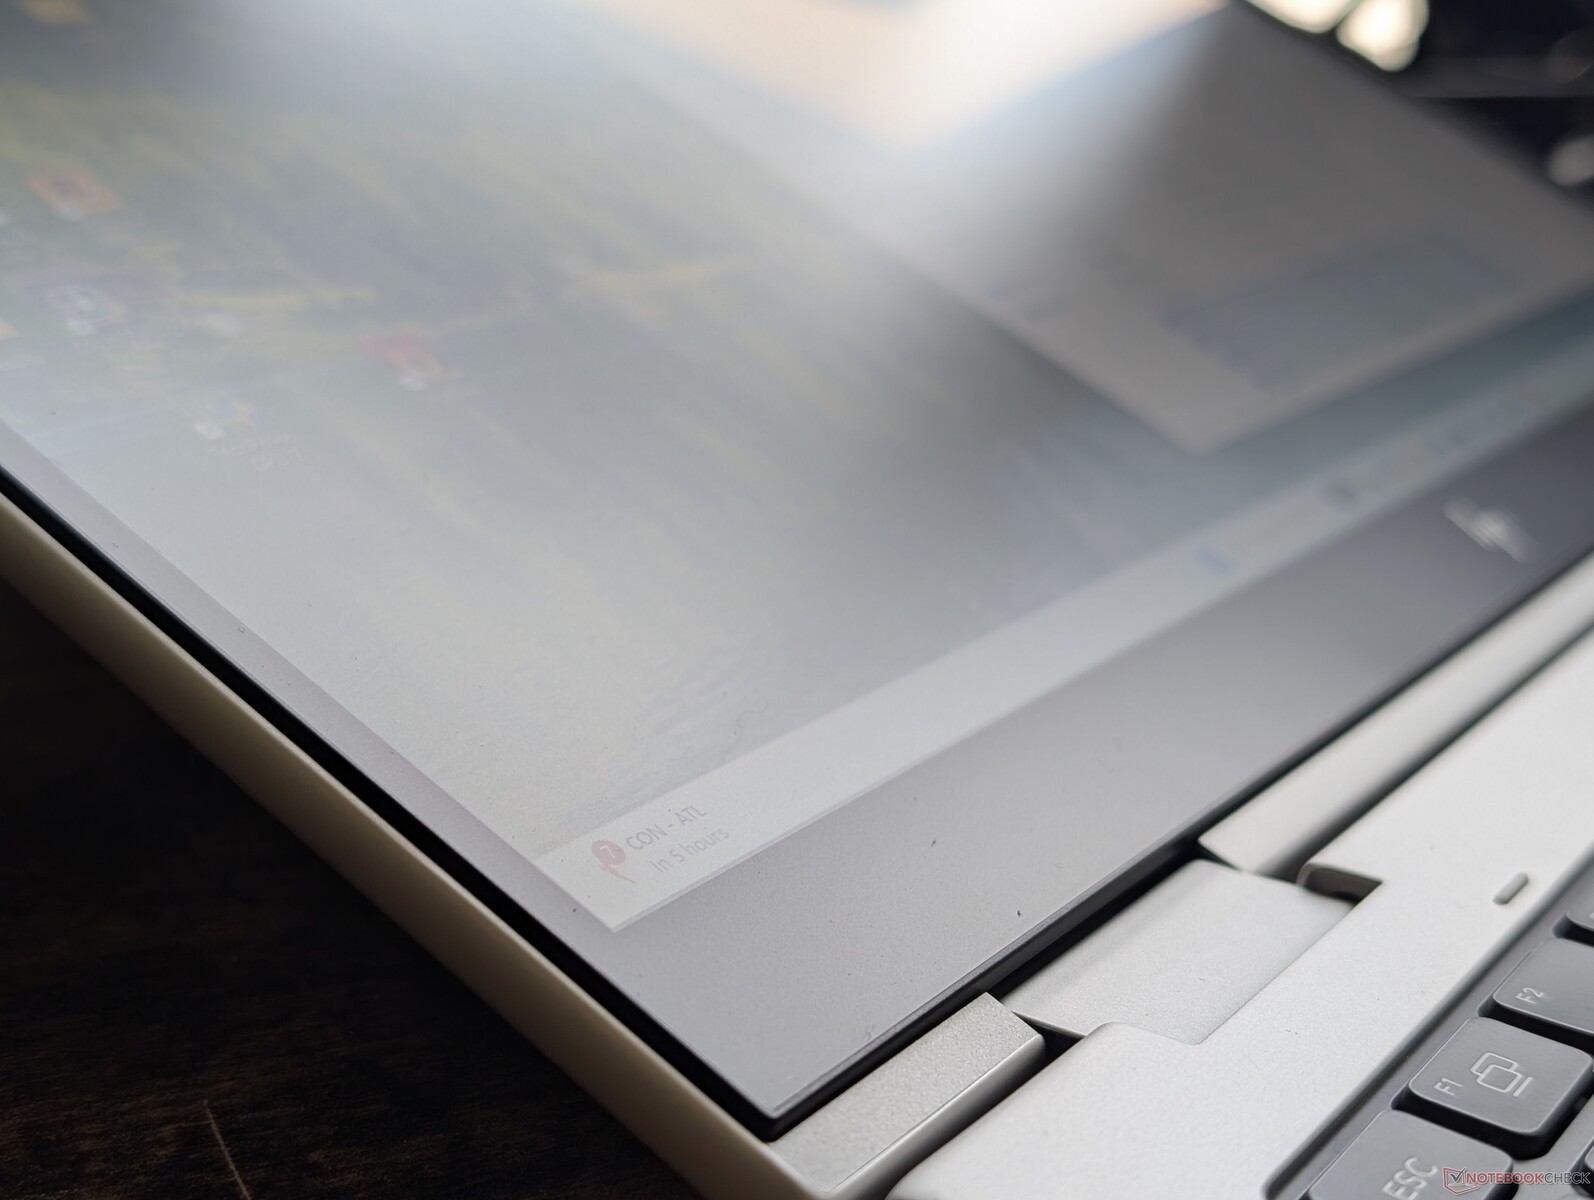
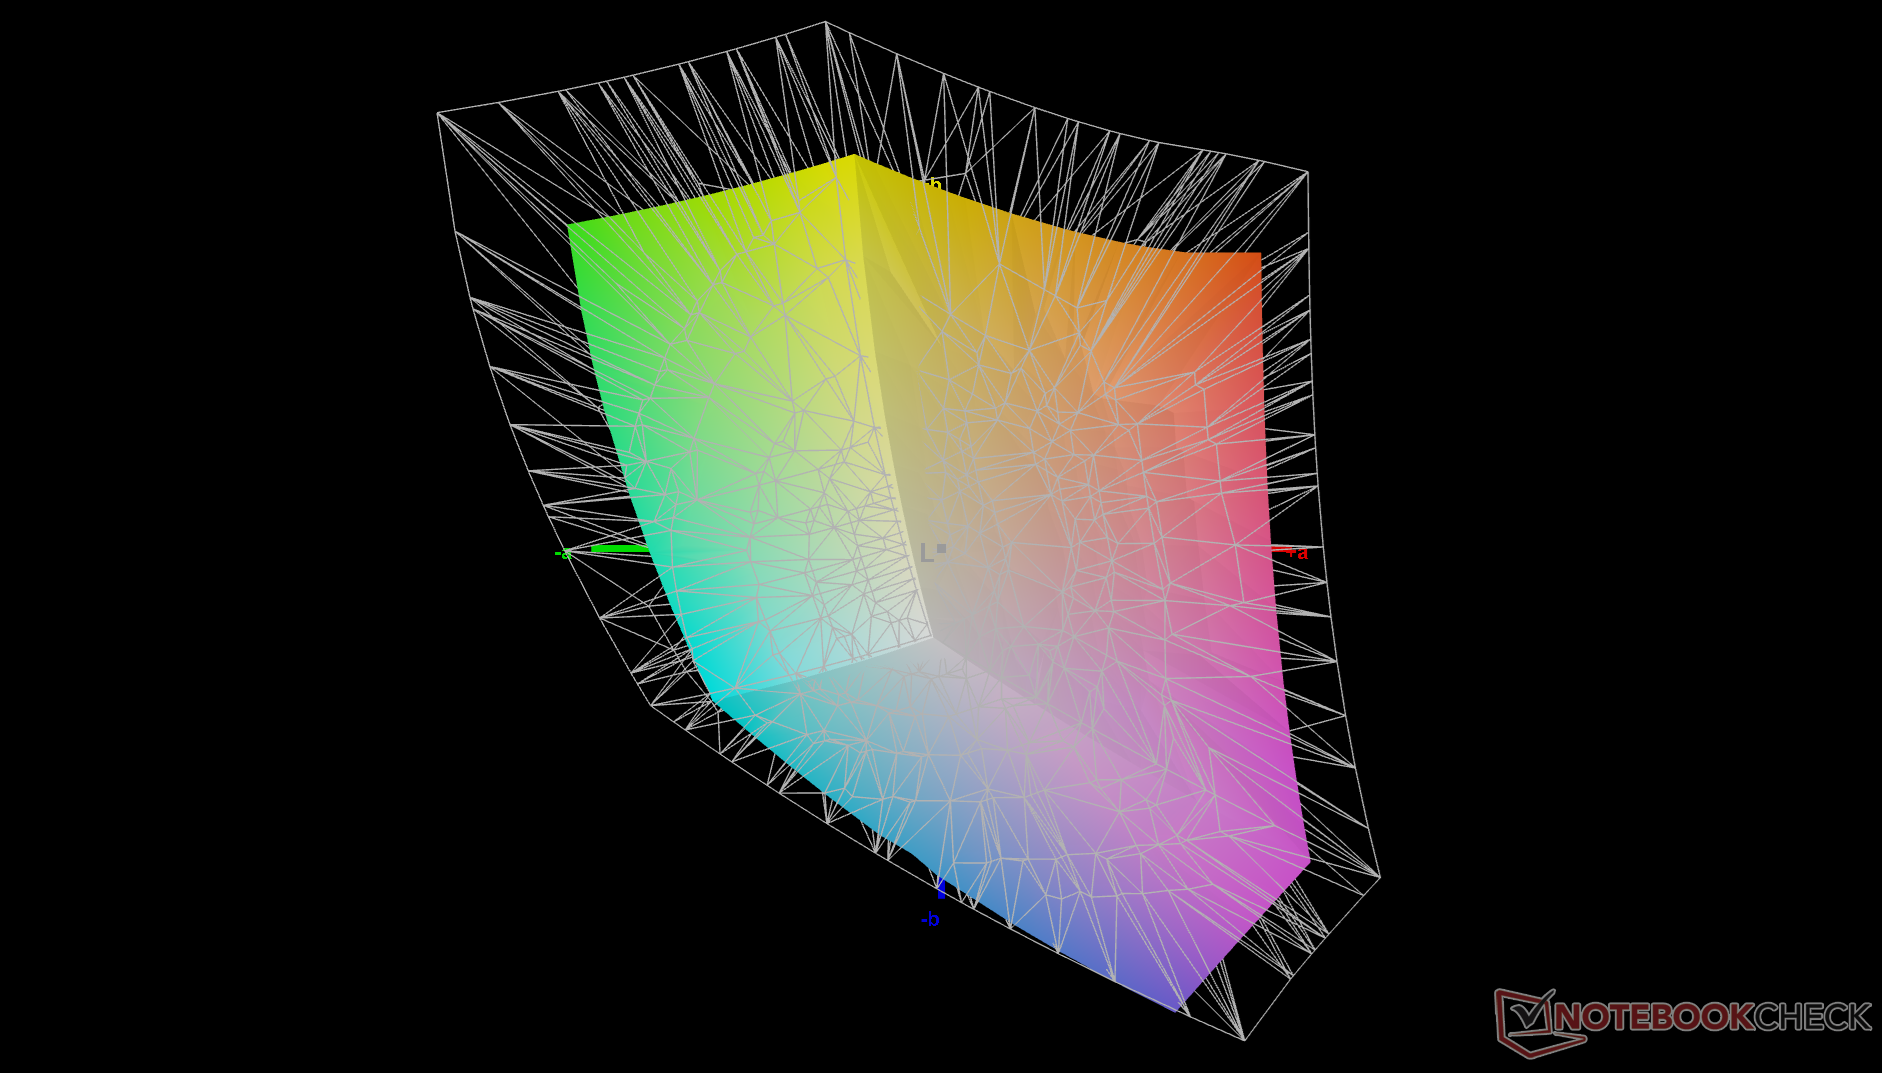
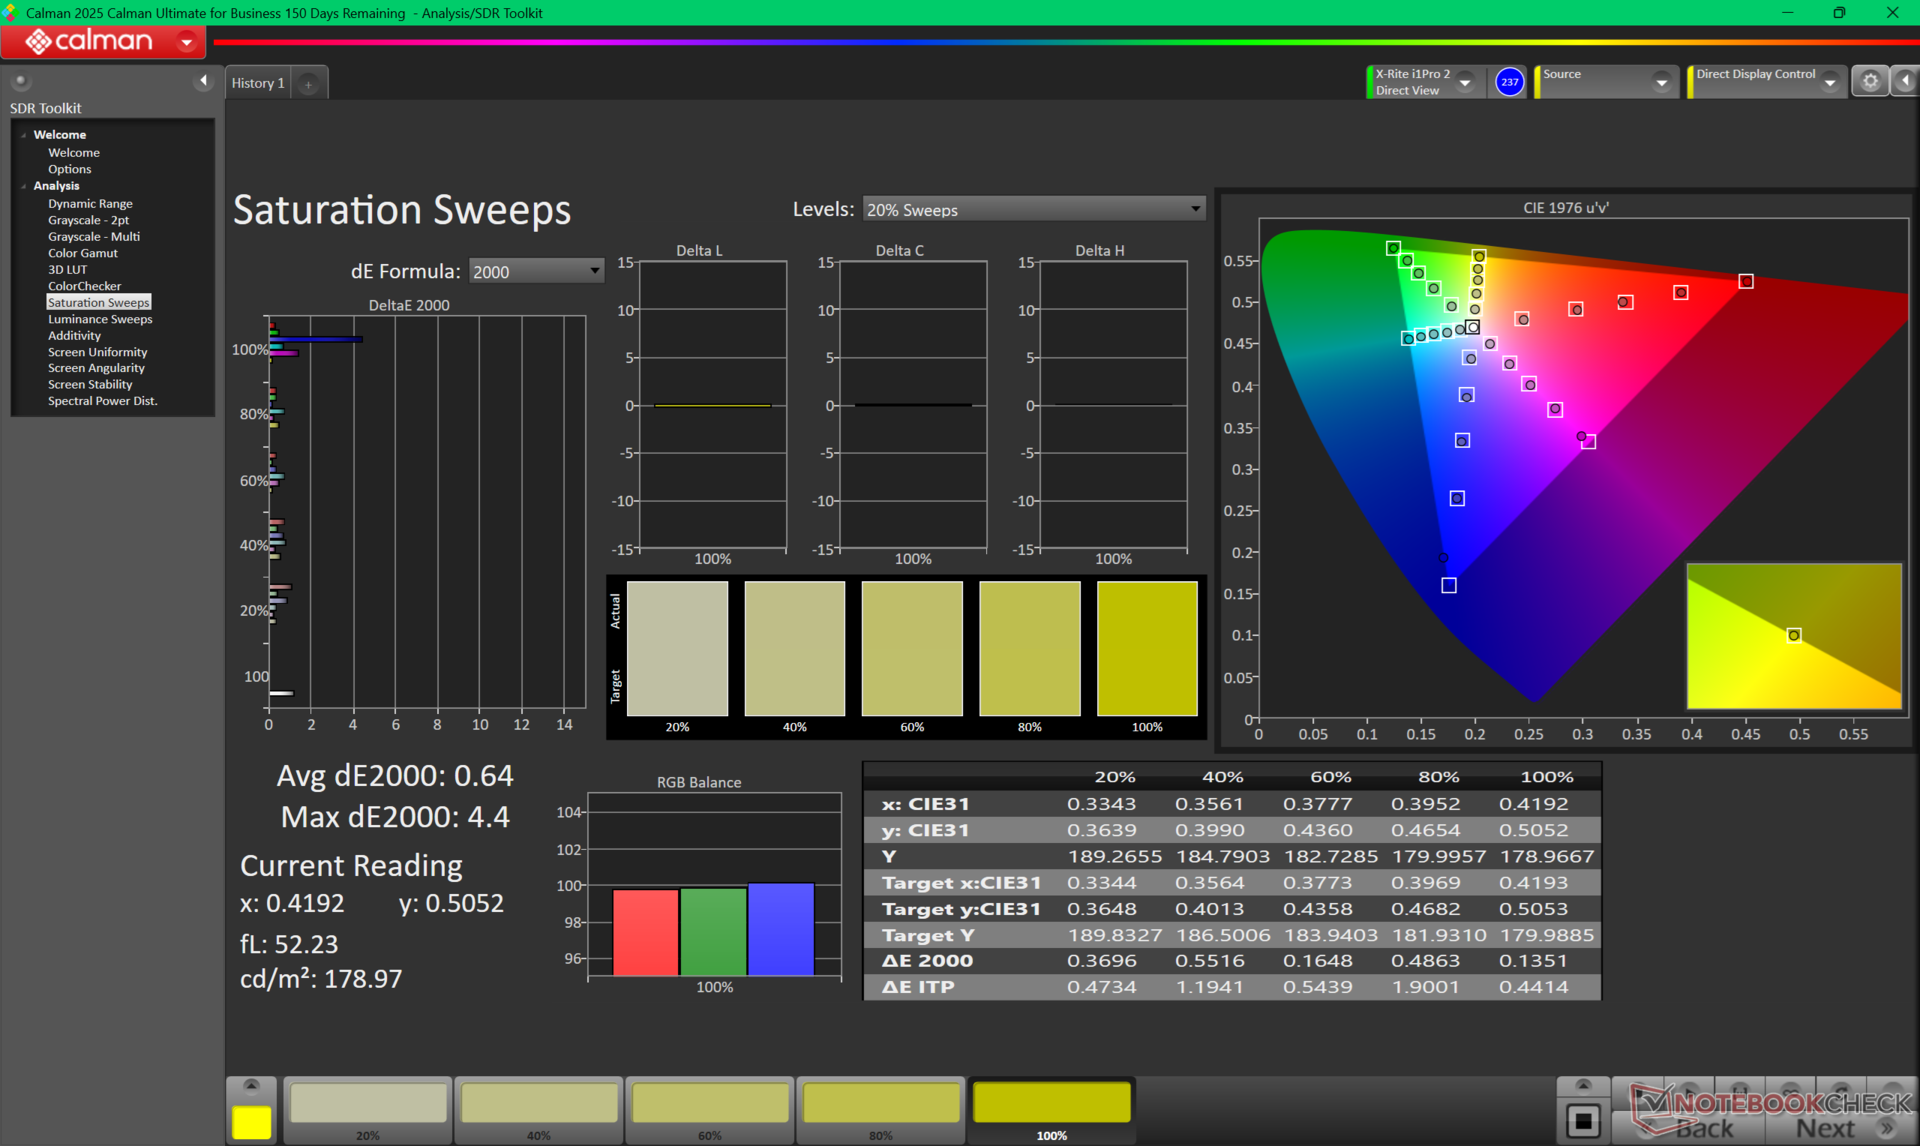
对于 IPS 面板来说,色彩和对比度都不错,分别为 >95% sRGB 和 ~1500:1。黑白响应时间较慢和磨砂面板带来的轻微颗粒感可能是它最大的缺点。

| |||||||||||||||||||||||||
Brightness Distribution: 90 %
Center on Battery: 390.1 cd/m²
Contrast: 1445:1 (Black: 0.27 cd/m²)
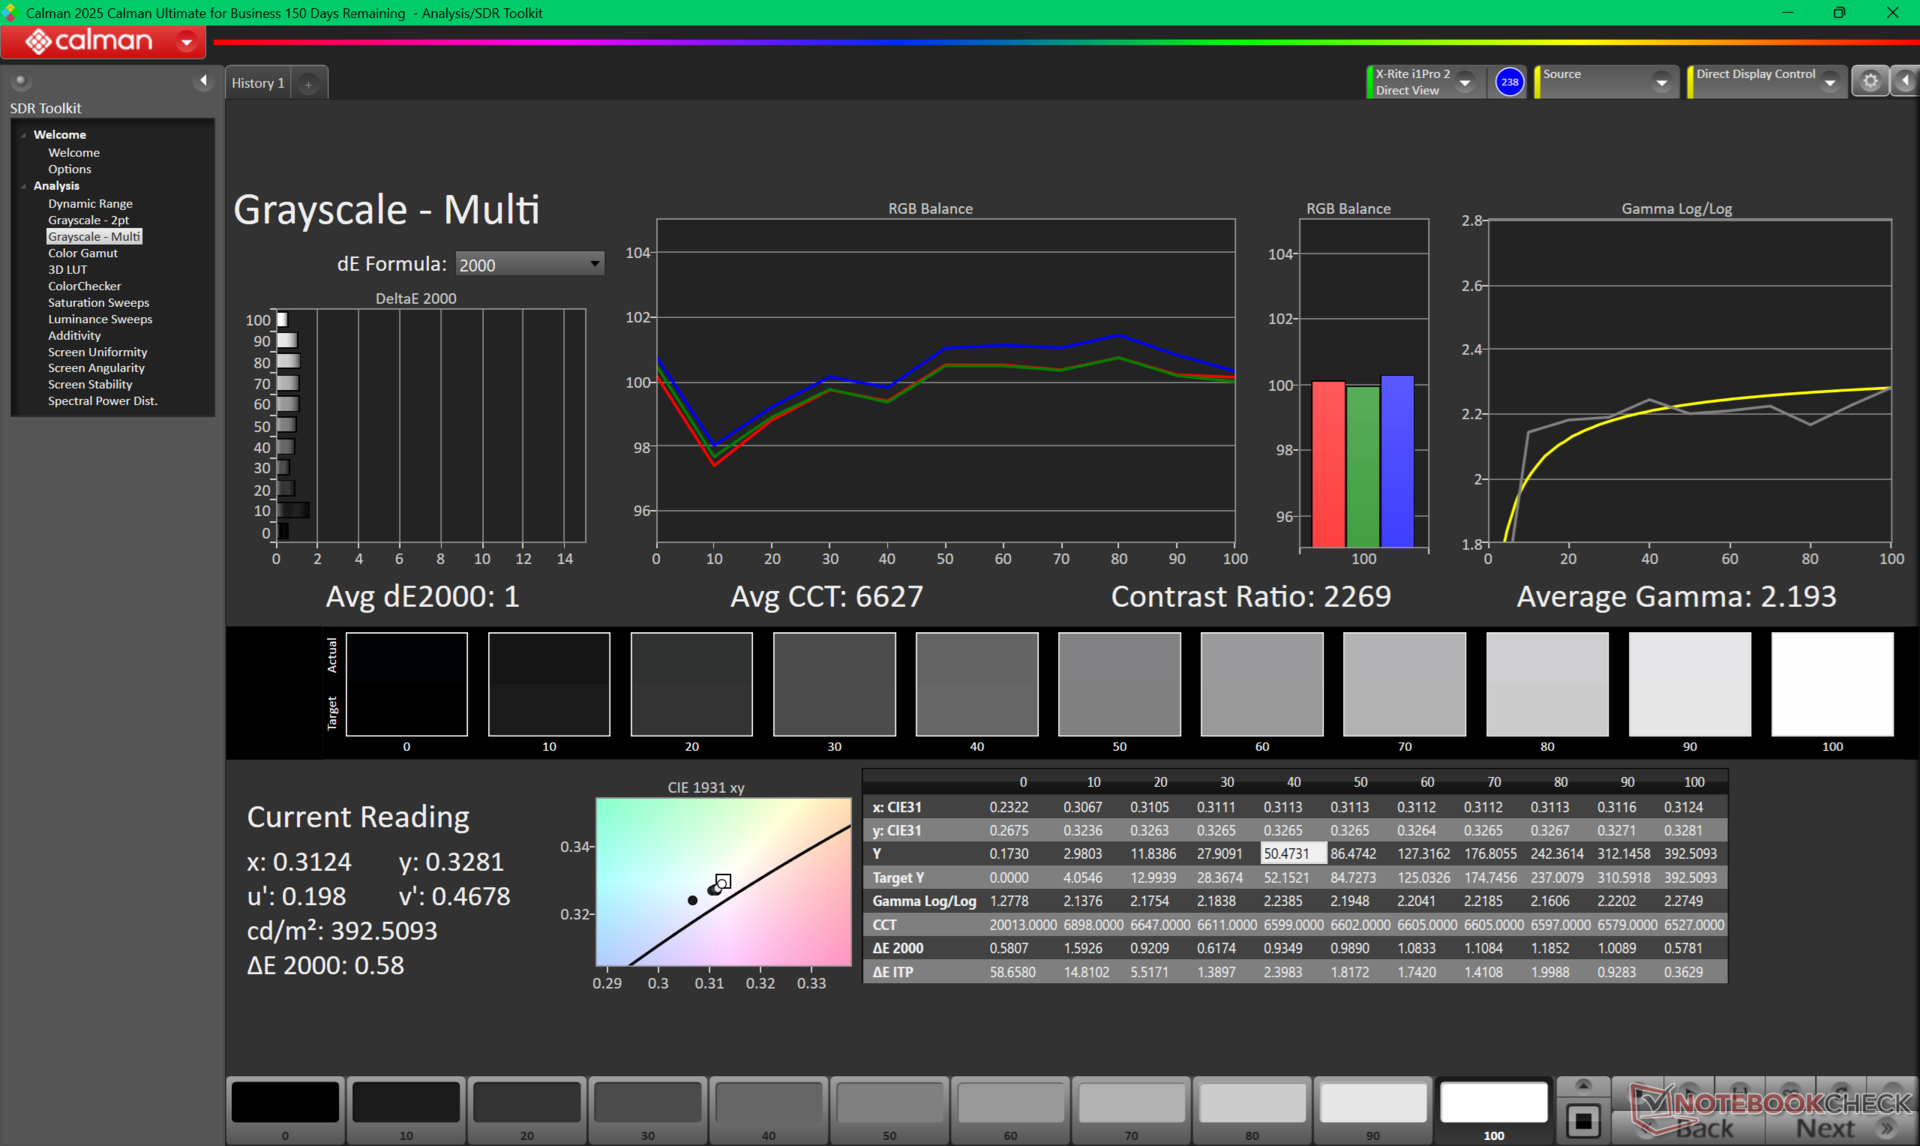
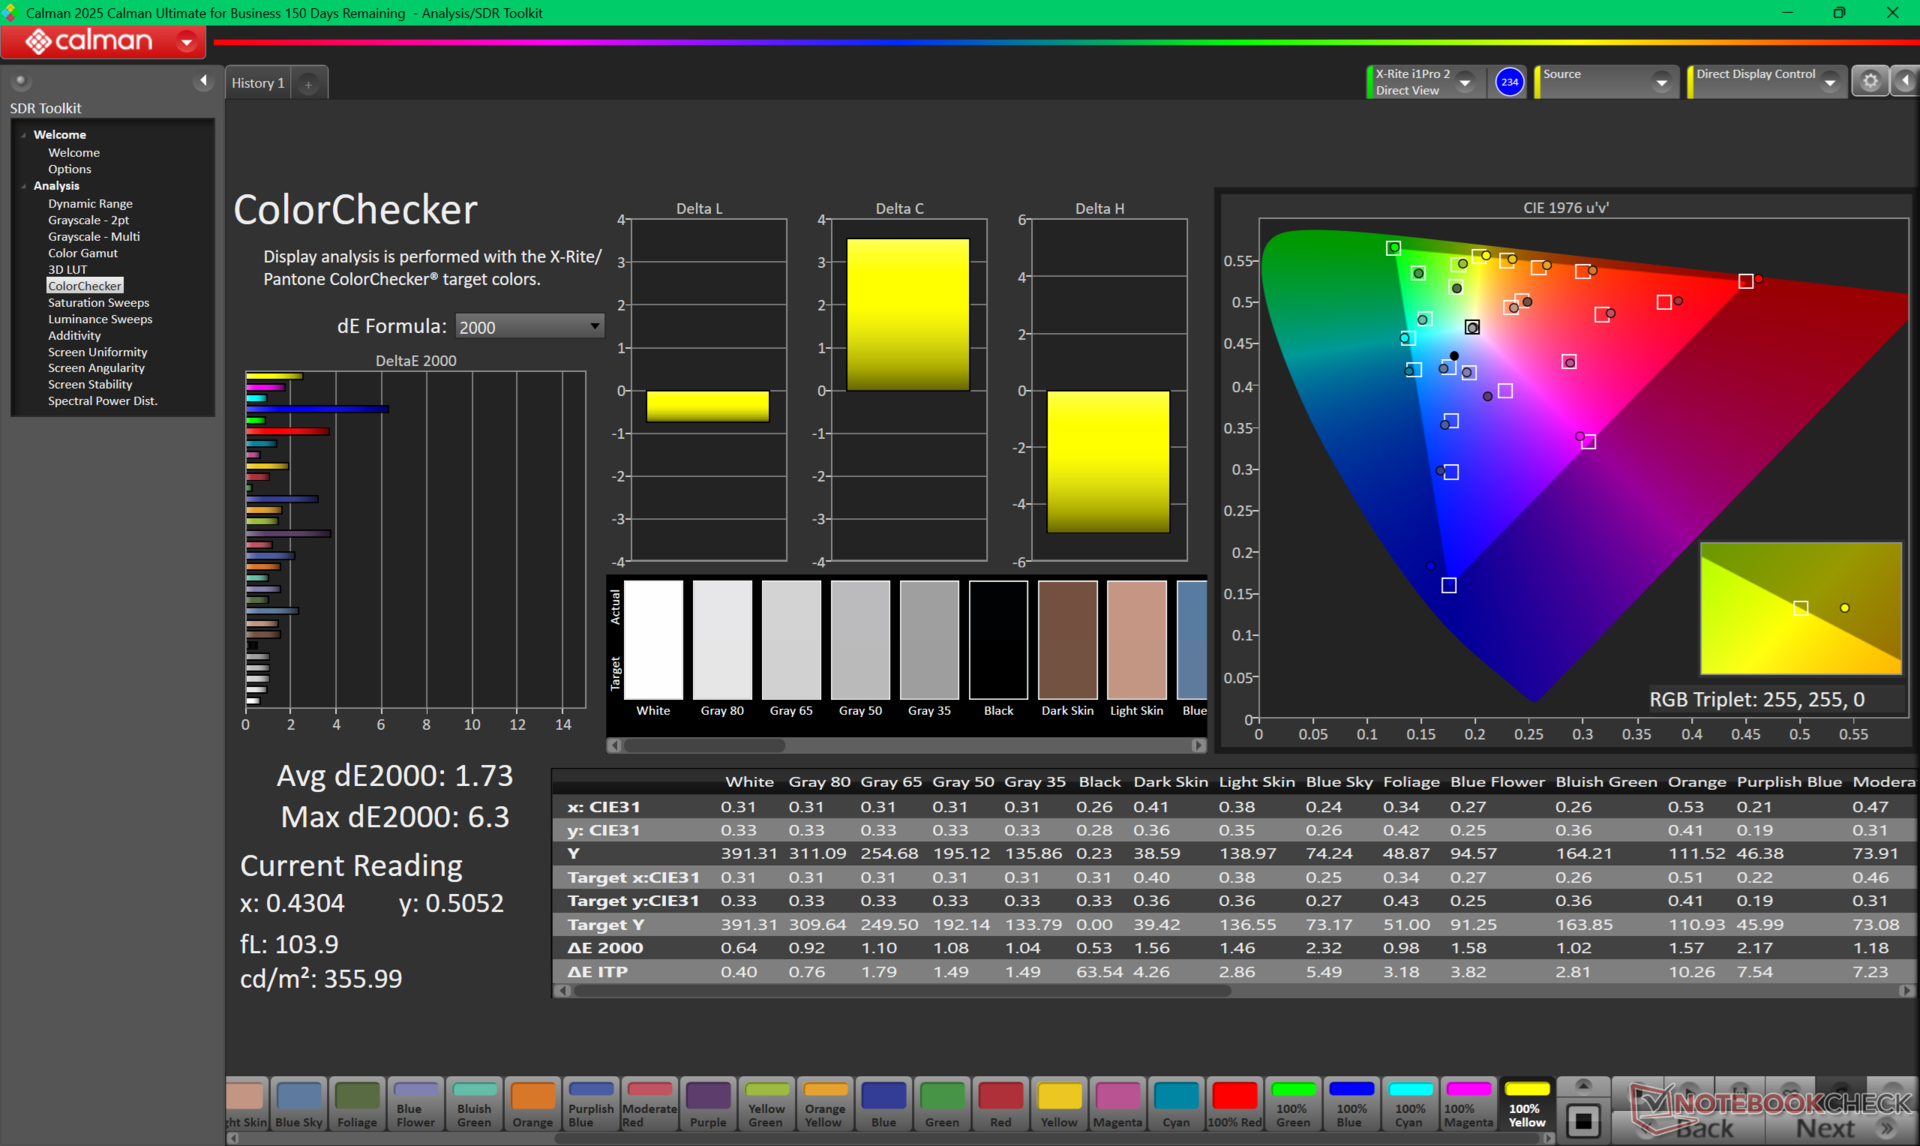
ΔE ColorChecker Calman: 1.73 | ∀{0.5-29.43 Ø4.71}
calibrated: 1
ΔE Greyscale Calman: 1 | ∀{0.09-98 Ø4.96}
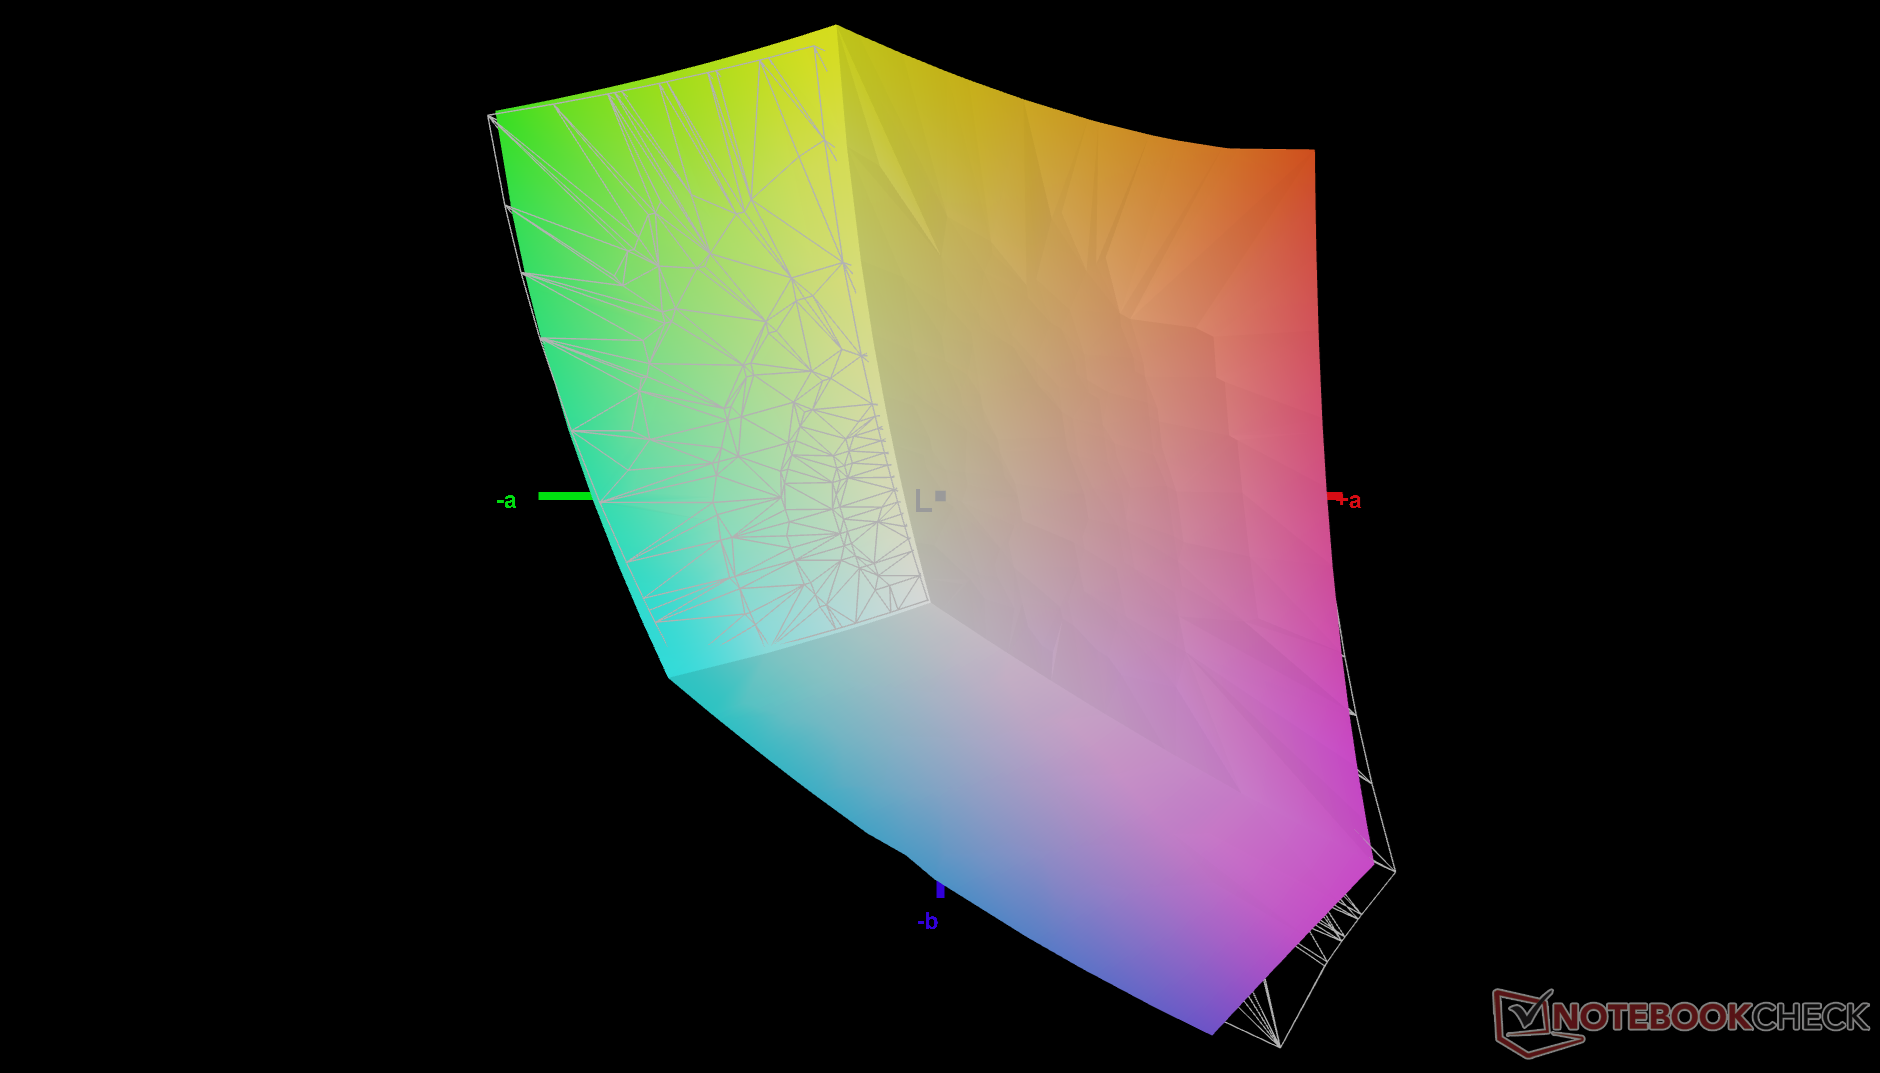
70.7% AdobeRGB 1998 (Argyll 3D)
96.4% sRGB (Argyll 3D)
68.9% Display P3 (Argyll 3D)
Gamma: 2.2
CCT: 6627 K
| HP EliteBook 8 Flip G1i 13 Chi Mei CMN13E4, IPS, 1920x1200, 13.3", 60 Hz | HP EliteBook x360 830 G10 7L7U1ET LGD06E5, IPS LED, 1920x1200, 13.3", Hz | Lenovo ThinkPad L13 Yoga G4 21FSS00100 B133UAN01.2 , IPS LED, 1920x1200, 13.3", Hz | MSI Summit E13 AI Evo A1MTG CMN13C6, IPS, 1920x1200, 13.3", 60 Hz | Asus ProArt PZ13 HT5306 ATNA33AA08-0, OLED, 2880x1800, 13.3", 60 Hz | Dell Latitude 9330 AU Optronics B133QAA, IPS, 2560x1600, 13.3", 60 Hz | |
|---|---|---|---|---|---|---|
| Display | -7% | 5% | 3% | 25% | 9% | |
| Display P3 Coverage (%) | 68.9 | 63.2 -8% | 74.1 8% | 71.6 4% | 99.5 44% | 77.8 13% |
| sRGB Coverage (%) | 96.4 | 92.7 -4% | 99.3 3% | 98.6 2% | 99.6 3% | 99.9 4% |
| AdobeRGB 1998 Coverage (%) | 70.7 | 65.1 -8% | 74.5 5% | 73.1 3% | 89.9 27% | 77.5 10% |
| Response Times | 13% | 7% | -22% | 96% | -57% | |
| Response Time Grey 50% / Grey 80% * (ms) | 49.3 ? | 39.8 ? 19% | 43.3 ? 12% | 60 ? -22% | 1.54 ? 97% | 67.6 ? -37% |
| Response Time Black / White * (ms) | 28.7 ? | 26.8 ? 7% | 28 ? 2% | 35.1 ? -22% | 1.41 ? 95% | 50.4 ? -76% |
| PWM Frequency (Hz) | 240 ? | |||||
| PWM Amplitude * (%) | 67 | |||||
| Screen | -80% | -44% | -9% | 314% | -25% | |
| Brightness middle (cd/m²) | 390.1 | 394 1% | 336 -14% | 405.2 4% | 362 -7% | 542.3 39% |
| Brightness (cd/m²) | 365 | 372 2% | 321 -12% | 372 2% | 364 0% | 516 41% |
| Brightness Distribution (%) | 90 | 84 -7% | 88 -2% | 88 -2% | 99 10% | 85 -6% |
| Black Level * (cd/m²) | 0.27 | 0.17 37% | 0.22 19% | 0.34 -26% | 0.01 96% | 0.38 -41% |
| Contrast (:1) | 1445 | 2318 60% | 1527 6% | 1192 -18% | 36200 2405% | 1427 -1% |
| Colorchecker dE 2000 * | 1.73 | 4.1 -137% | 2.8 -62% | 2.4 -39% | 1.5 13% | 3.18 -84% |
| Colorchecker dE 2000 max. * | 6.3 | 8.3 -32% | 6.9 -10% | 3.56 43% | 3.1 51% | 6.05 4% |
| Colorchecker dE 2000 calibrated * | 1 | 1.4 -40% | 0.54 46% | 0.67 33% | ||
| Greyscale dE 2000 * | 1 | 6.6 -560% | 3.8 -280% | 1.9 -90% | 1.6 -60% | 3.1 -210% |
| Gamma | 2.2 100% | 2.17 101% | 2.15 102% | 2 110% | 2.12 104% | 2.08 106% |
| CCT | 6627 98% | 6019 108% | 6664 98% | 6503 100% | 6514 100% | 6140 106% |
| Total Average (Program / Settings) | -25% /
-48% | -11% /
-26% | -9% /
-8% | 145% /
213% | -24% /
-22% |
* ... smaller is better
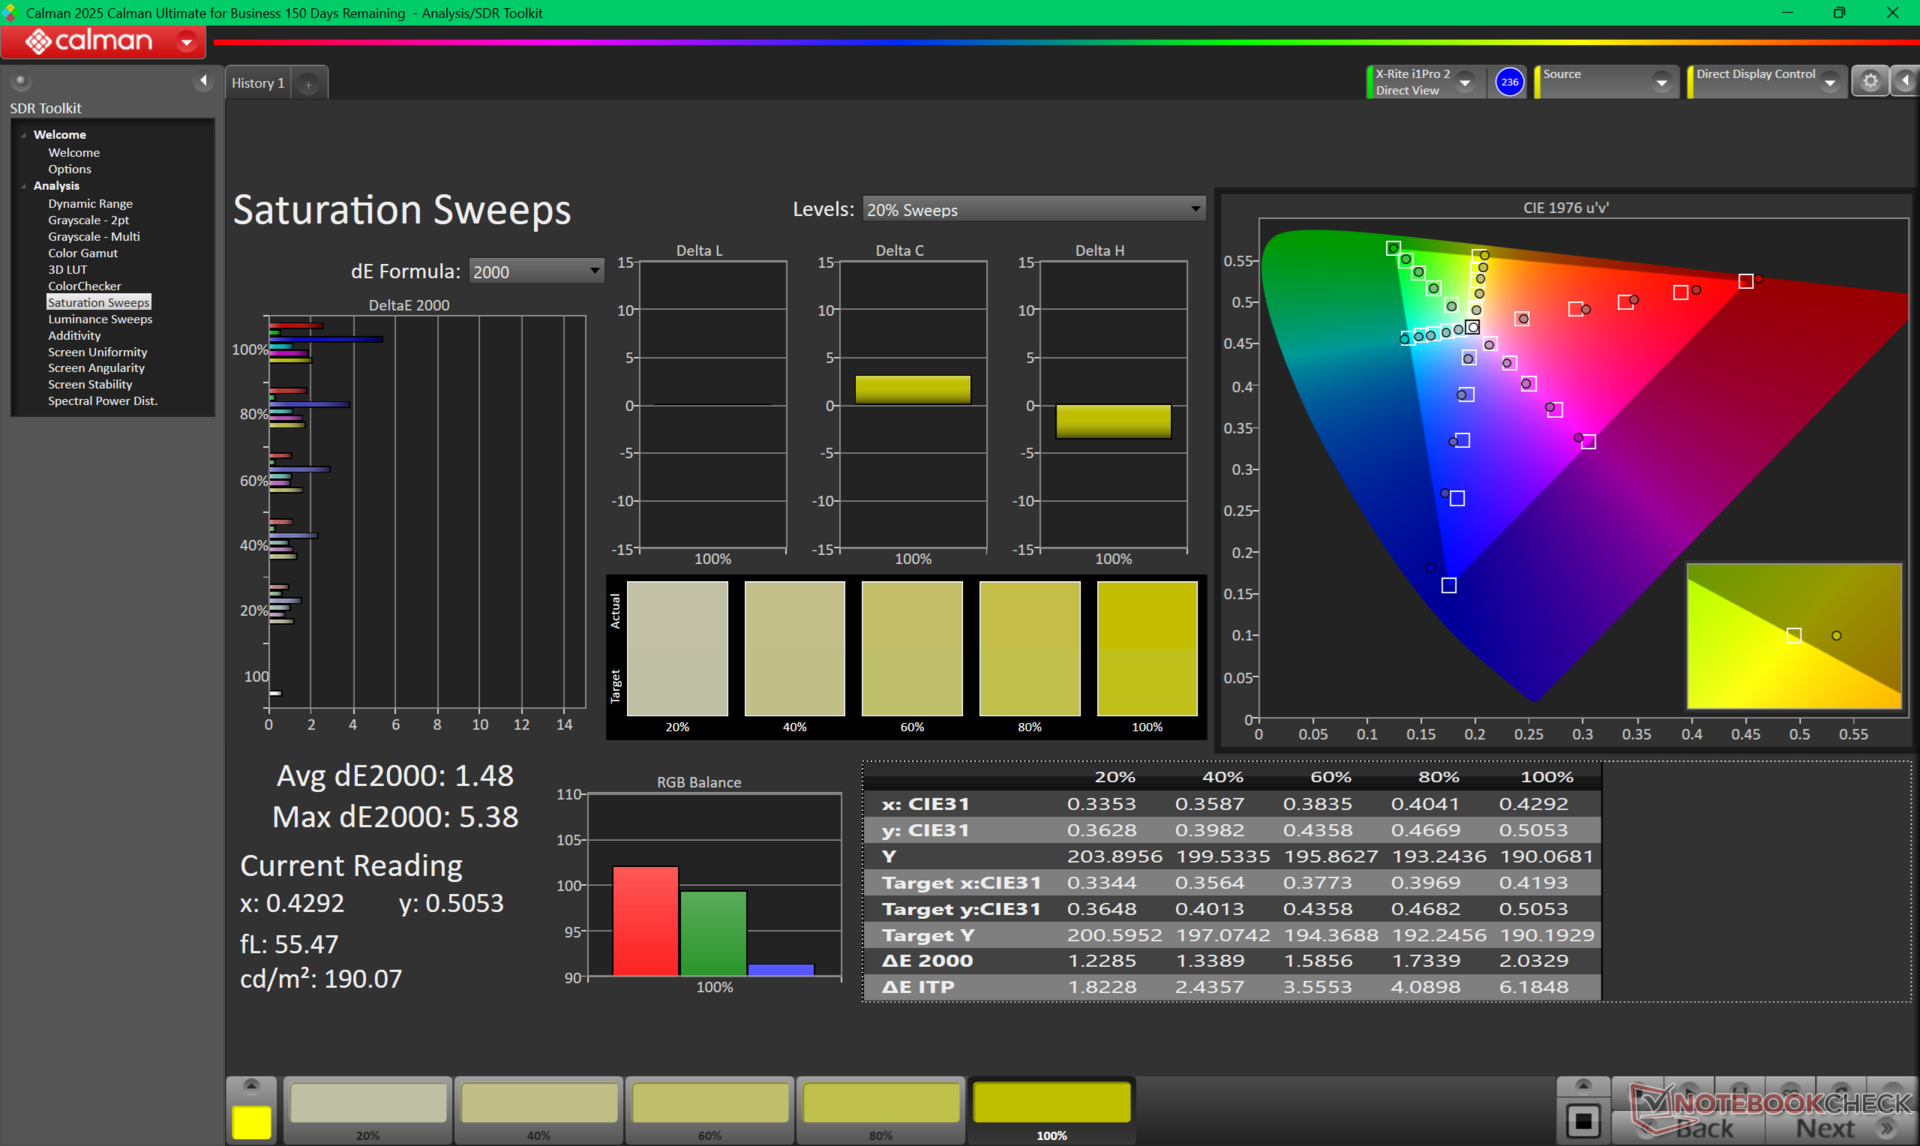
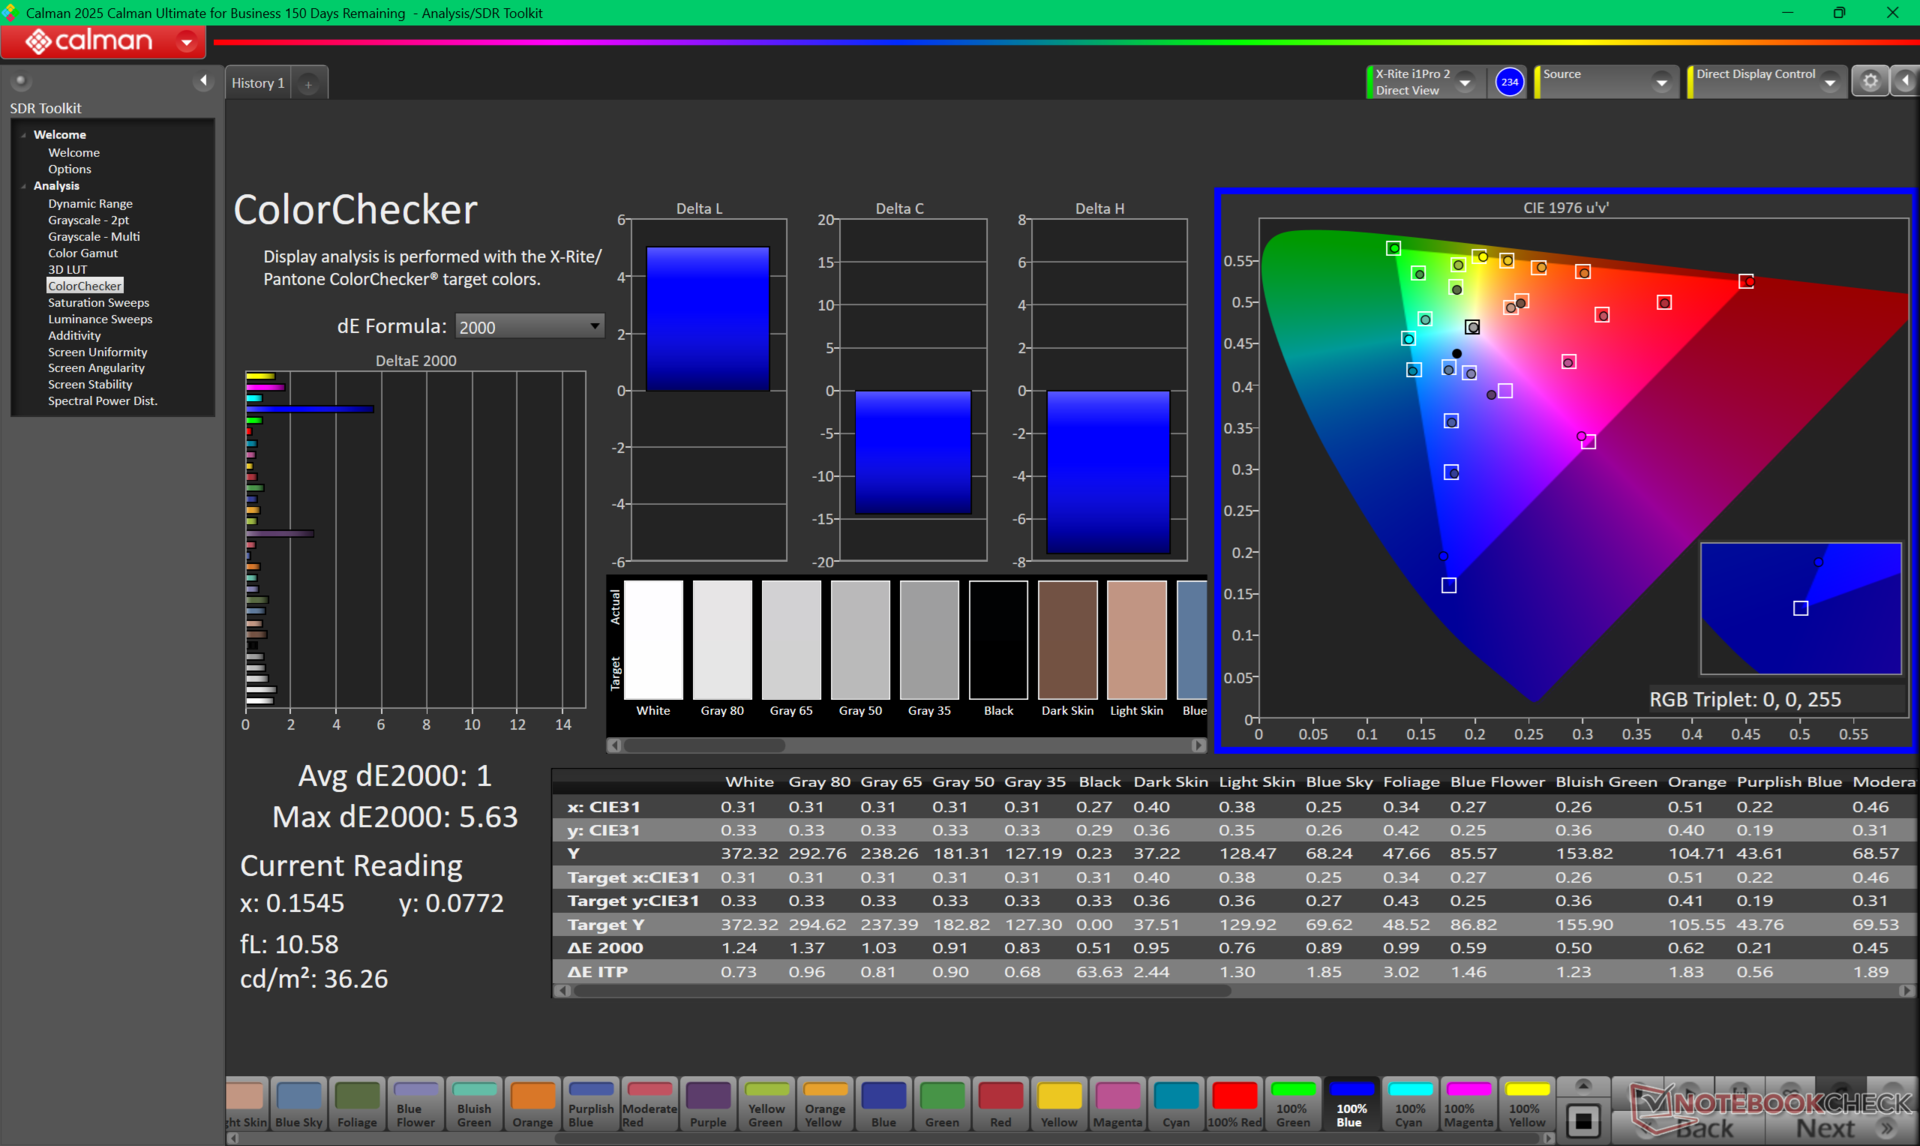
显示器开箱即进行了良好校准,灰度和色彩 deltaE 平均值分别仅为 1.0 和 1.73。因此,在大多数情况下无需进行最终用户校准。

Display Response Times
| ↔ Response Time Black to White | ||
|---|---|---|
| 28.7 ms ... rise ↗ and fall ↘ combined | ↗ 14.4 ms rise | 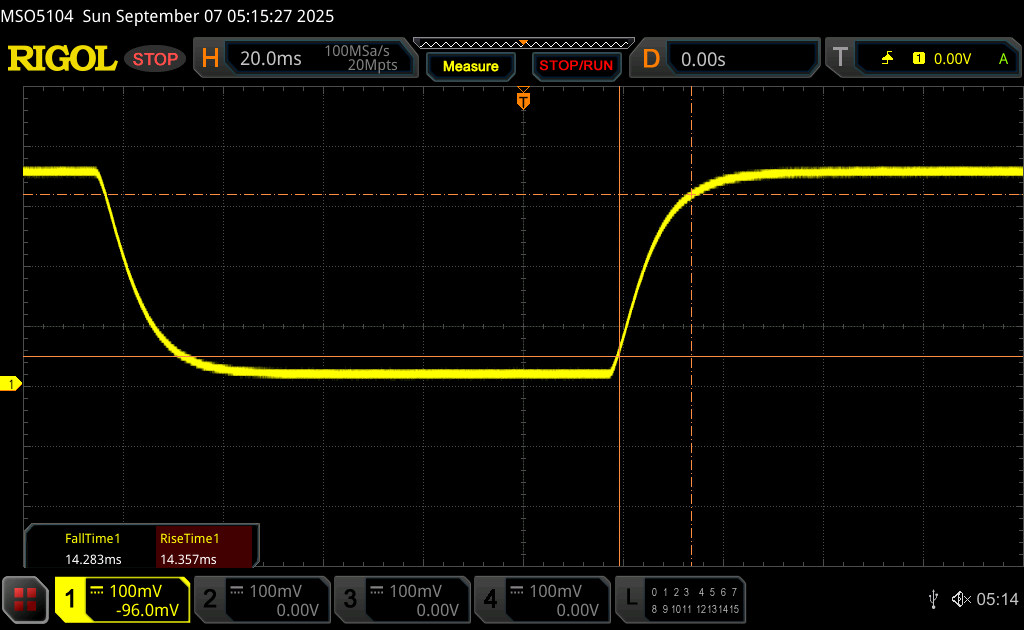 |
| ↘ 14.3 ms fall | ||
| The screen shows relatively slow response rates in our tests and may be too slow for gamers. In comparison, all tested devices range from 0.1 (minimum) to 240 (maximum) ms. » 76 % of all devices are better. This means that the measured response time is worse than the average of all tested devices (19.8 ms). | ||
| ↔ Response Time 50% Grey to 80% Grey | ||
| 49.3 ms ... rise ↗ and fall ↘ combined | ↗ 23.1 ms rise | 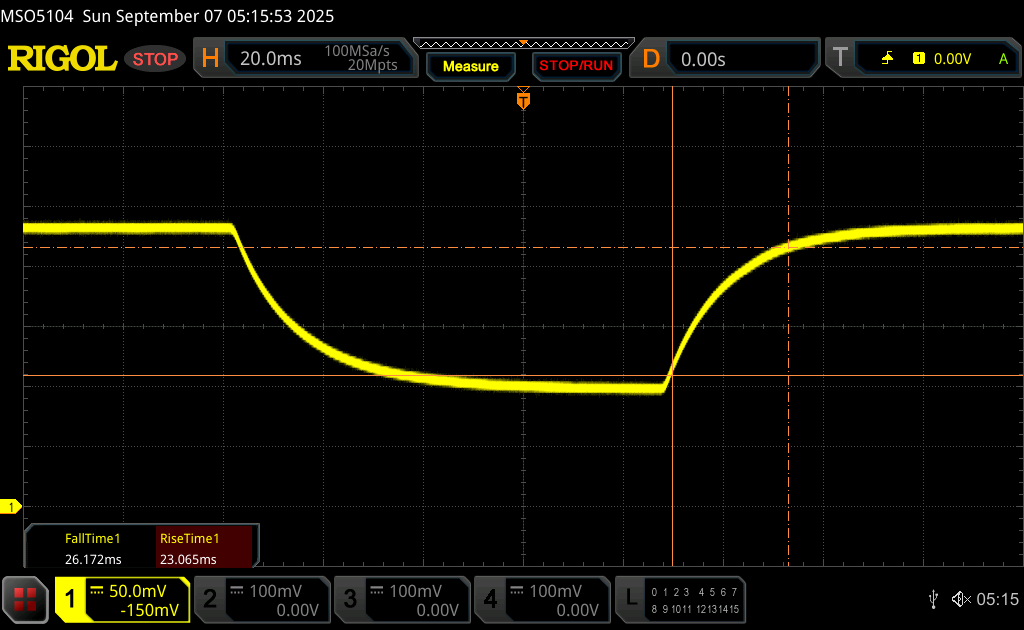 |
| ↘ 26.2 ms fall | ||
| The screen shows slow response rates in our tests and will be unsatisfactory for gamers. In comparison, all tested devices range from 0.165 (minimum) to 636 (maximum) ms. » 85 % of all devices are better. This means that the measured response time is worse than the average of all tested devices (31 ms). | ||
Screen Flickering / PWM (Pulse-Width Modulation)
| Screen flickering / PWM not detected | 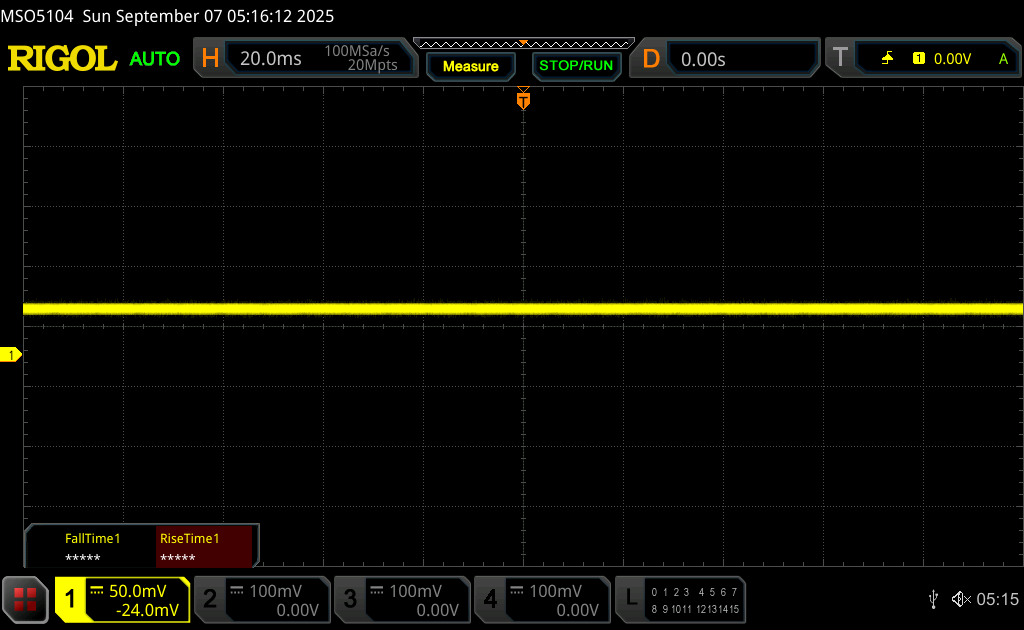 | ||
In comparison: 52 % of all tested devices do not use PWM to dim the display. If PWM was detected, an average of 7754 (minimum: 5 - maximum: 343500) Hz was measured. | |||

性能
测试条件
在运行以下基准测试之前,我们将 MyHP 设置为性能模式。
处理器
我们的 酷睿至尊 7 265U比其他大多数 13 英寸可折叠机都要快。一个明显的例外是 微星 Summit E13 AI Evo它是为数不多的配备酷睿 H 系列处理器的 13 英寸可折叠笔记本电脑之一,其多线程性能可提高 10% 至 25%。
如下图所示,在循环运行 CineBench R15 xT 时,多线程性能将下降 25%,这与我们的压力测试时钟频率观察结果一致。这种情况在许多采用 U 系列处理器的子笔记本上很常见。
从酷睿 Ultra 7 265U 配置降级到 Core Ultra 5 235U根据我们对戴尔 Pro 14 Plus 的测试结果,预计性能会受到 10% 到 15% 的影响。
Cinebench R15 多回路运行
Cinebench R23: Multi Core | Single Core
Cinebench R20: CPU (Multi Core) | CPU (Single Core)
Cinebench R15: CPU Multi 64Bit | CPU Single 64Bit
Blender: v2.79 BMW27 CPU
7-Zip 18.03: 7z b 4 | 7z b 4 -mmt1
Geekbench 6.7: Multi-Core | Single-Core
Geekbench 5.5: Multi-Core | Single-Core
HWBOT x265 Benchmark v2.2: 4k Preset
LibreOffice : 20 Documents To PDF
R Benchmark 2.5: Overall mean
| CPU Performance rating | |
| MSI Summit E13 AI Evo A1MTG | |
| HP EliteBook 8 Flip G1i 13 | |
| Average Intel Core Ultra 7 265U | |
| Lenovo ThinkPad L13 2in1 G5 21LNS4AM00 | |
| HP Spectre x360 13.5 14t-ef000 -2! | |
| Lenovo ThinkPad L13 Yoga G4 i7-1355U | |
| HP ProBook x360 435 G8 R7-5800U -2! | |
| Dell Latitude 7350 Detachable | |
| HP EliteBook x360 830 G10 7L7U1ET | |
| Dell Latitude 9330 -2! | |
| Lenovo ThinkPad L13 Yoga G4 21FSS00100 -2! | |
| Asus ProArt PZ13 HT5306 -2! | |
| Acer Spin 3 SP313-51N-56YV -2! | |
| Lenovo ThinkPad X1 Titanium Yoga G1 20QA001RGE -2! | |
| Geekbench 6.7 / Multi-Core | |
| MSI Summit E13 AI Evo A1MTG | |
| Asus ProArt PZ13 HT5306 | |
| HP EliteBook 8 Flip G1i 13 | |
| Average Intel Core Ultra 7 265U (n=1) | |
| Lenovo ThinkPad L13 2in1 G5 21LNS4AM00 | |
| Lenovo ThinkPad L13 Yoga G4 i7-1355U | |
| HP EliteBook x360 830 G10 7L7U1ET | |
| Dell Latitude 7350 Detachable | |
| Geekbench 6.7 / Single-Core | |
| Lenovo ThinkPad L13 Yoga G4 i7-1355U | |
| HP EliteBook 8 Flip G1i 13 | |
| Average Intel Core Ultra 7 265U (n=1) | |
| Asus ProArt PZ13 HT5306 | |
| MSI Summit E13 AI Evo A1MTG | |
| HP EliteBook x360 830 G10 7L7U1ET | |
| Lenovo ThinkPad L13 2in1 G5 21LNS4AM00 | |
| Dell Latitude 7350 Detachable | |
| HWBOT x265 Benchmark v2.2 / 4k Preset | |
| MSI Summit E13 AI Evo A1MTG | |
| Lenovo ThinkPad L13 2in1 G5 21LNS4AM00 | |
| HP EliteBook 8 Flip G1i 13 | |
| Average Intel Core Ultra 7 265U (n=1) | |
| HP ProBook x360 435 G8 R7-5800U | |
| HP Spectre x360 13.5 14t-ef000 | |
| Lenovo ThinkPad L13 Yoga G4 i7-1355U | |
| Dell Latitude 7350 Detachable | |
| Dell Latitude 9330 | |
| Lenovo ThinkPad L13 Yoga G4 21FSS00100 | |
| HP EliteBook x360 830 G10 7L7U1ET | |
| Acer Spin 3 SP313-51N-56YV | |
| Asus ProArt PZ13 HT5306 | |
| Lenovo ThinkPad X1 Titanium Yoga G1 20QA001RGE | |
Cinebench R23: Multi Core | Single Core
Cinebench R20: CPU (Multi Core) | CPU (Single Core)
Cinebench R15: CPU Multi 64Bit | CPU Single 64Bit
Blender: v2.79 BMW27 CPU
7-Zip 18.03: 7z b 4 | 7z b 4 -mmt1
Geekbench 6.7: Multi-Core | Single-Core
Geekbench 5.5: Multi-Core | Single-Core
HWBOT x265 Benchmark v2.2: 4k Preset
LibreOffice : 20 Documents To PDF
R Benchmark 2.5: Overall mean
* ... smaller is better
压力测试
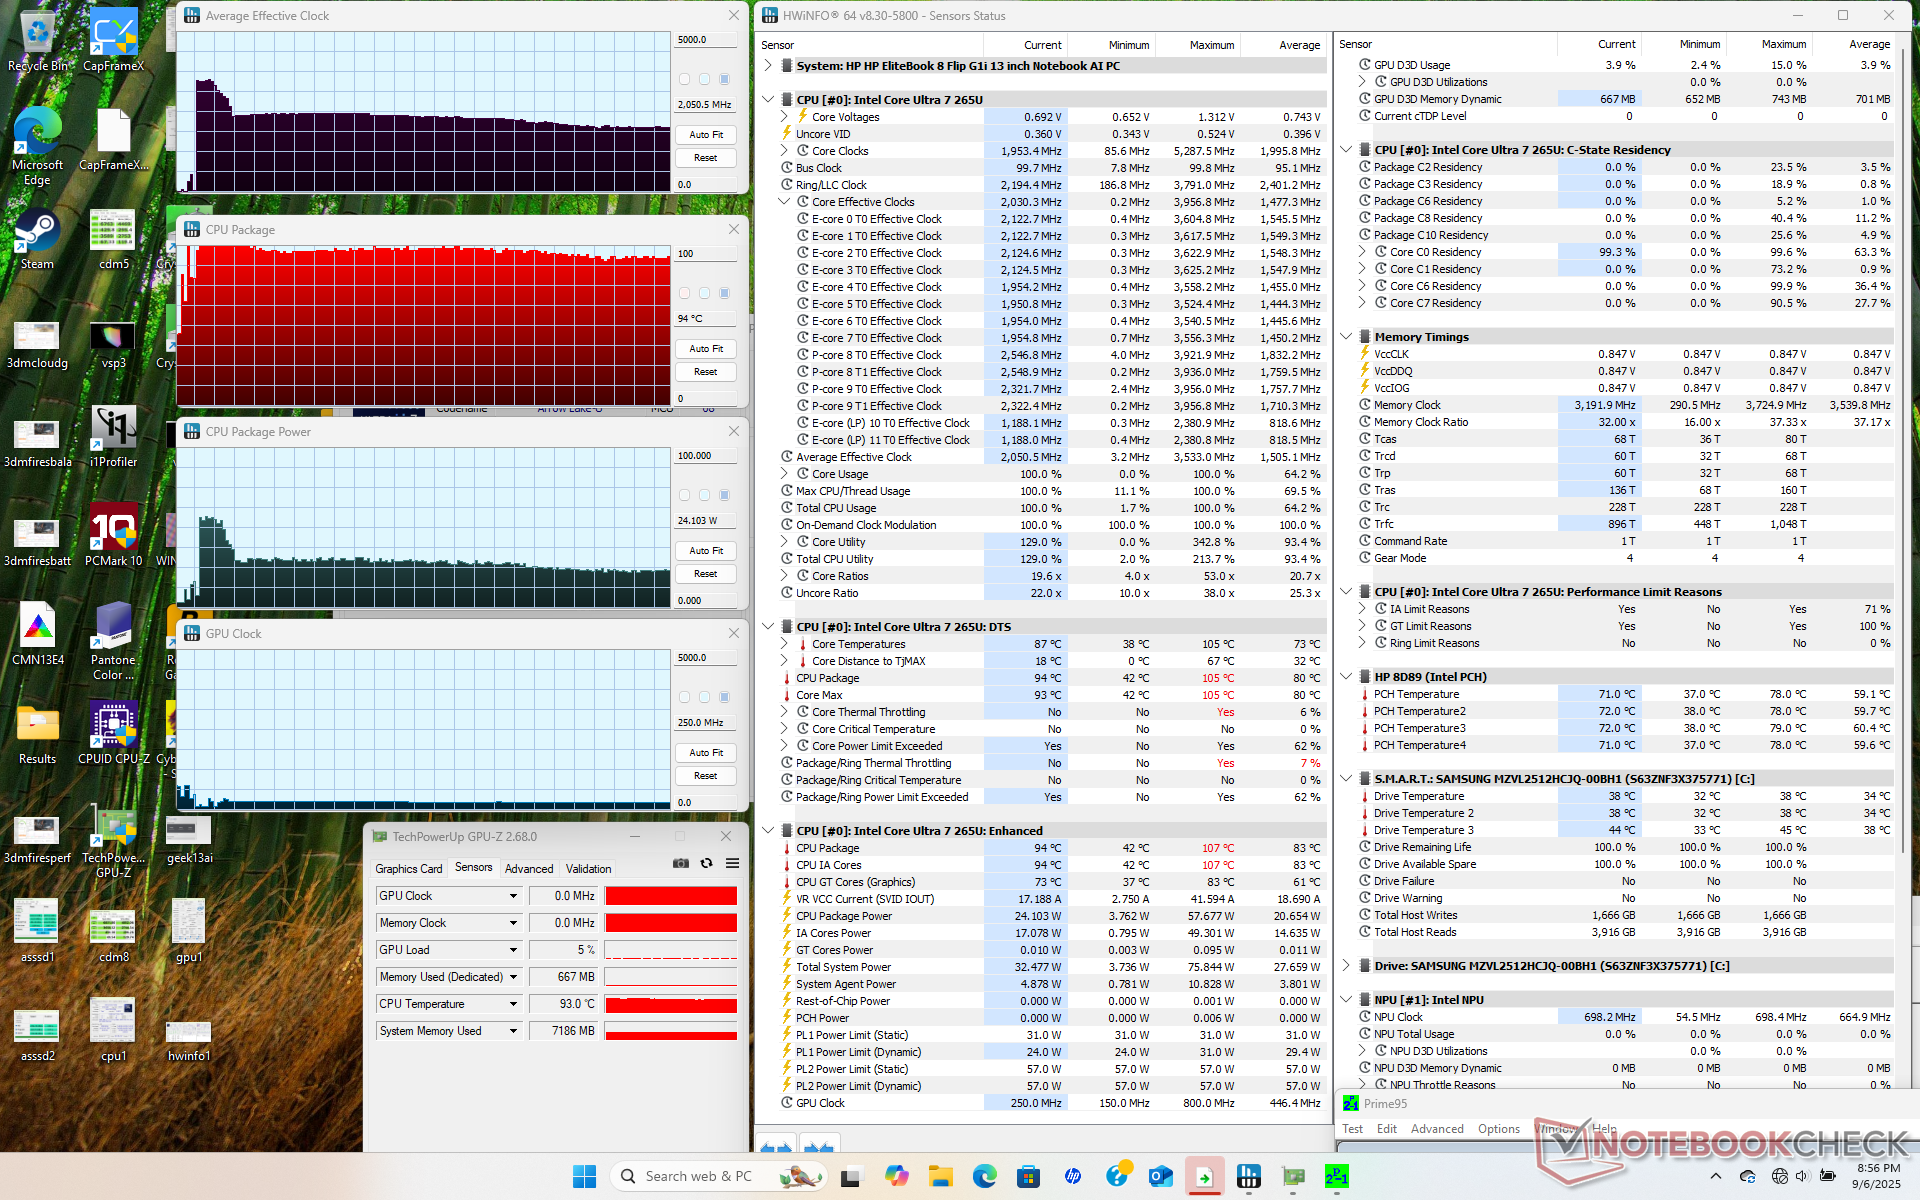
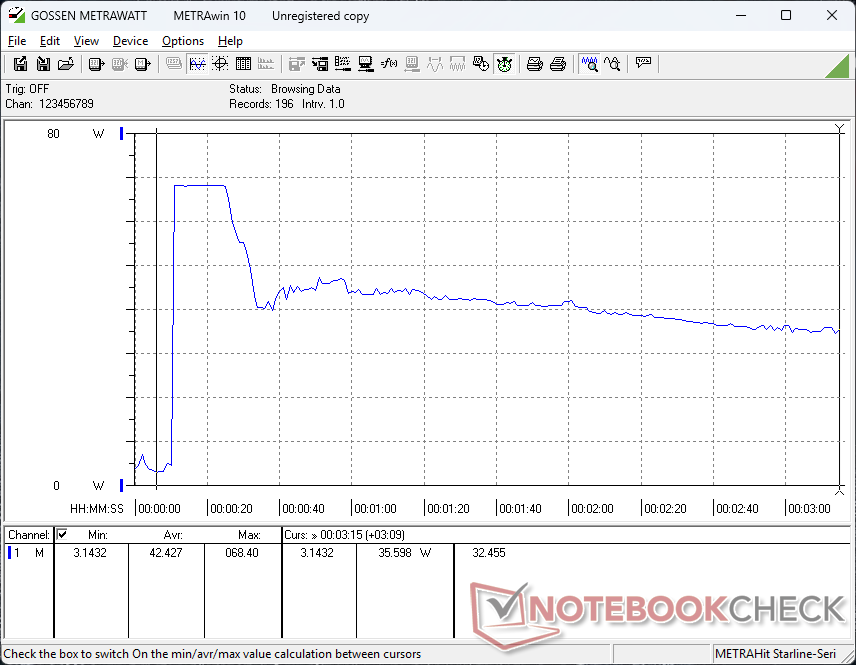
在启动 Prime95 压力测试时,CPU 会提升至 3.5 GHz、57 W 和 100 C,然后在 15 秒后降至 2.1 GHz、24 W 和 94 C,这表明 Turbo Boost 持续性有限。核心温度非常高,尤其是对于 U 系列 CPU 而言。
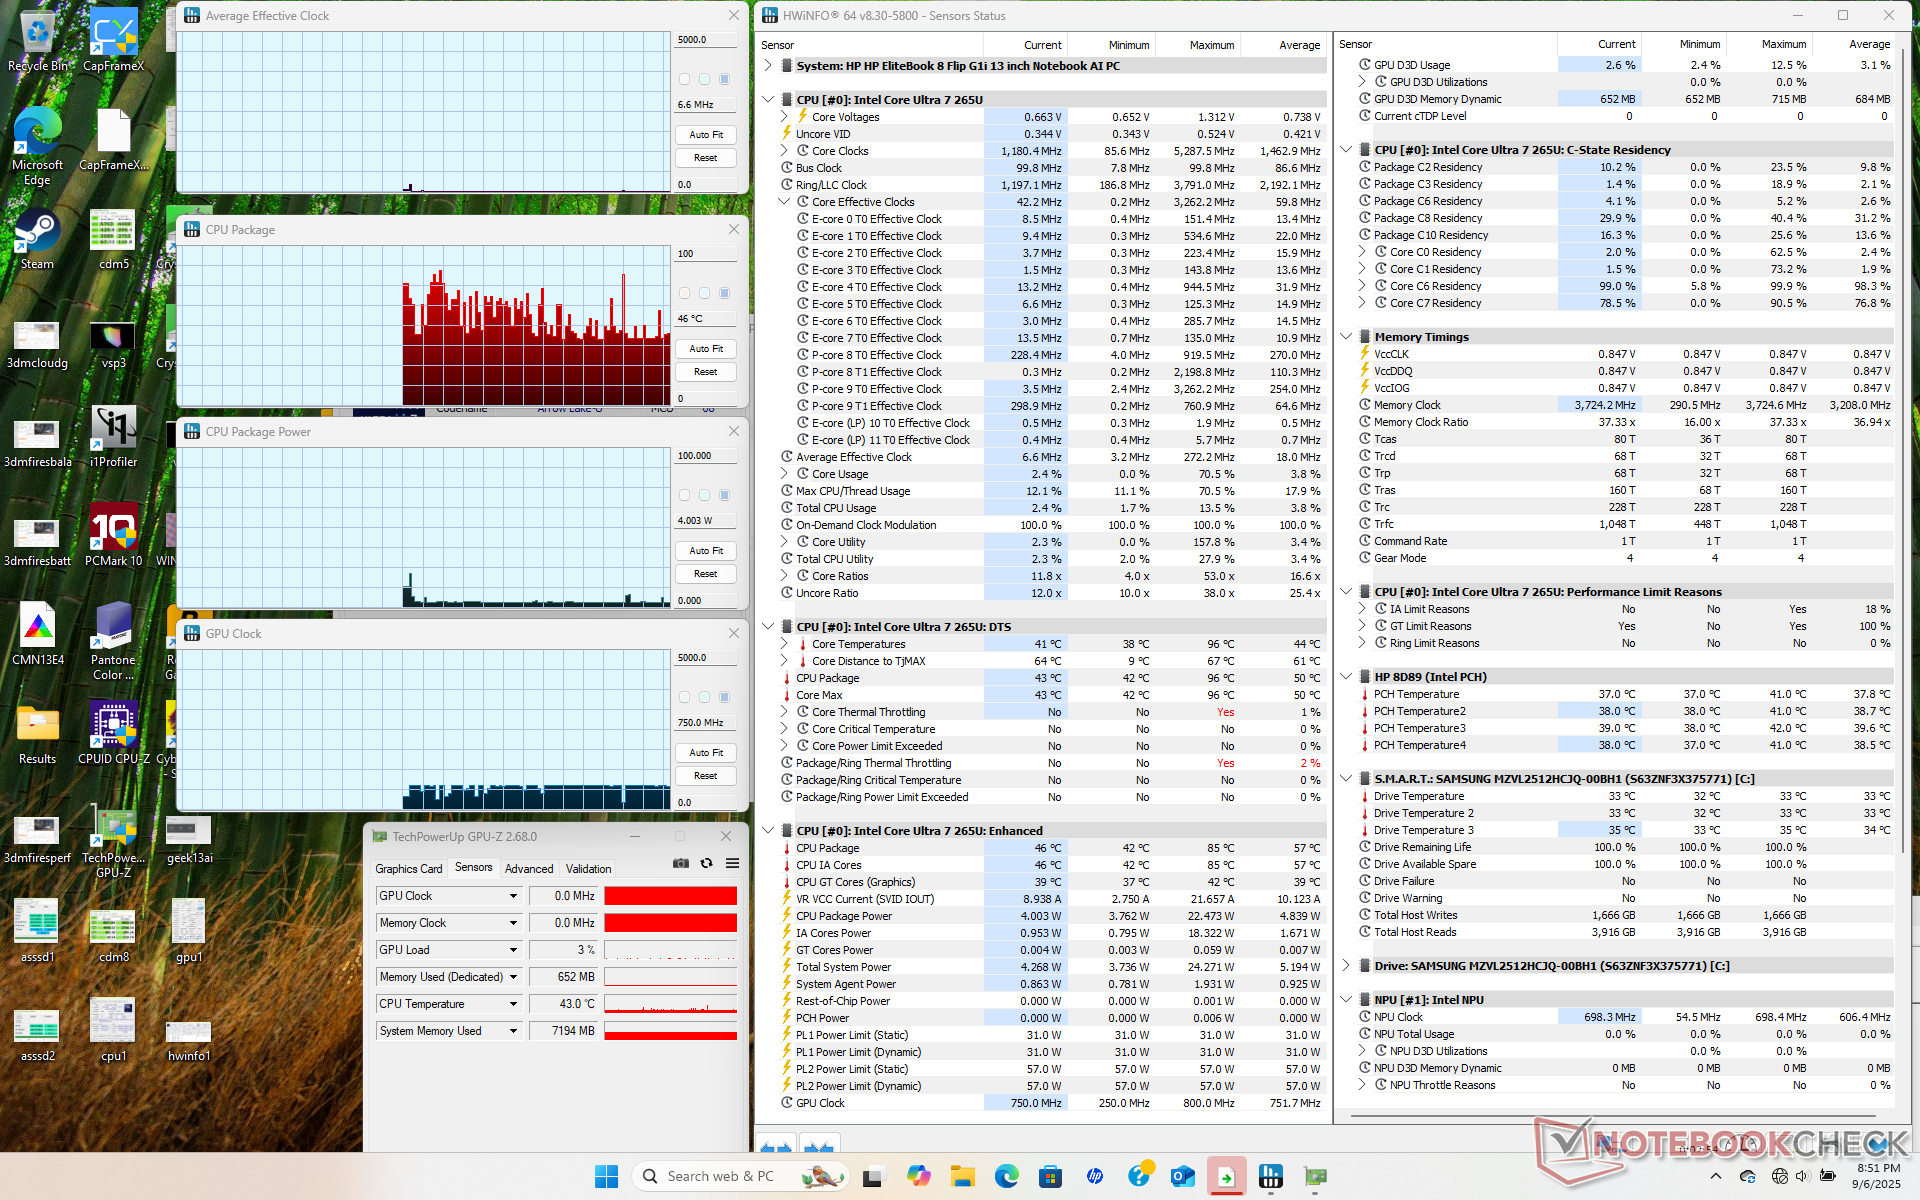
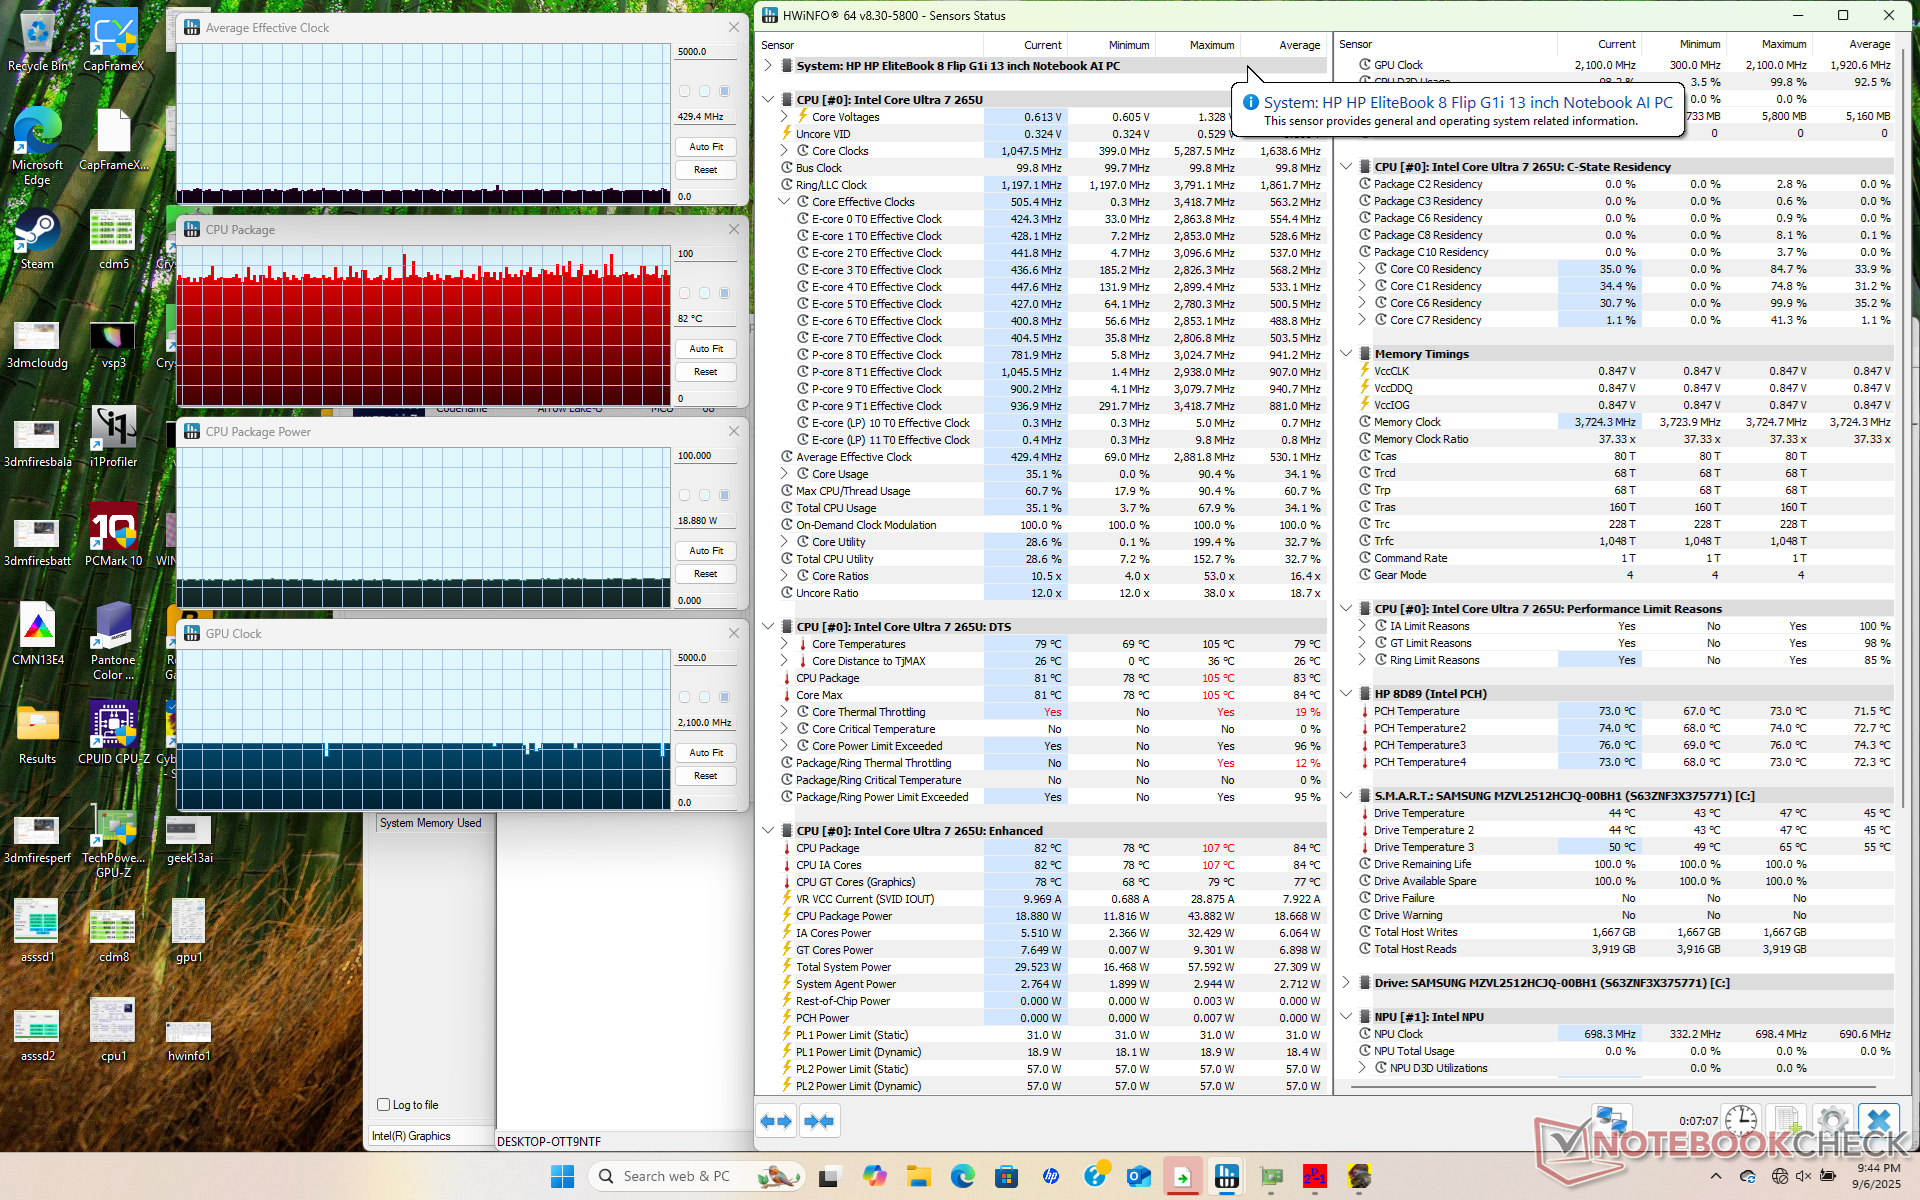
| CPU 平均时钟 (GHz) | GPU 时钟 (MHz) | CPU 平均温度 (°C) | |
| 系统闲置 | -- | -- | 46 |
| Prime95 压力 | 2.1 | -- | 94 |
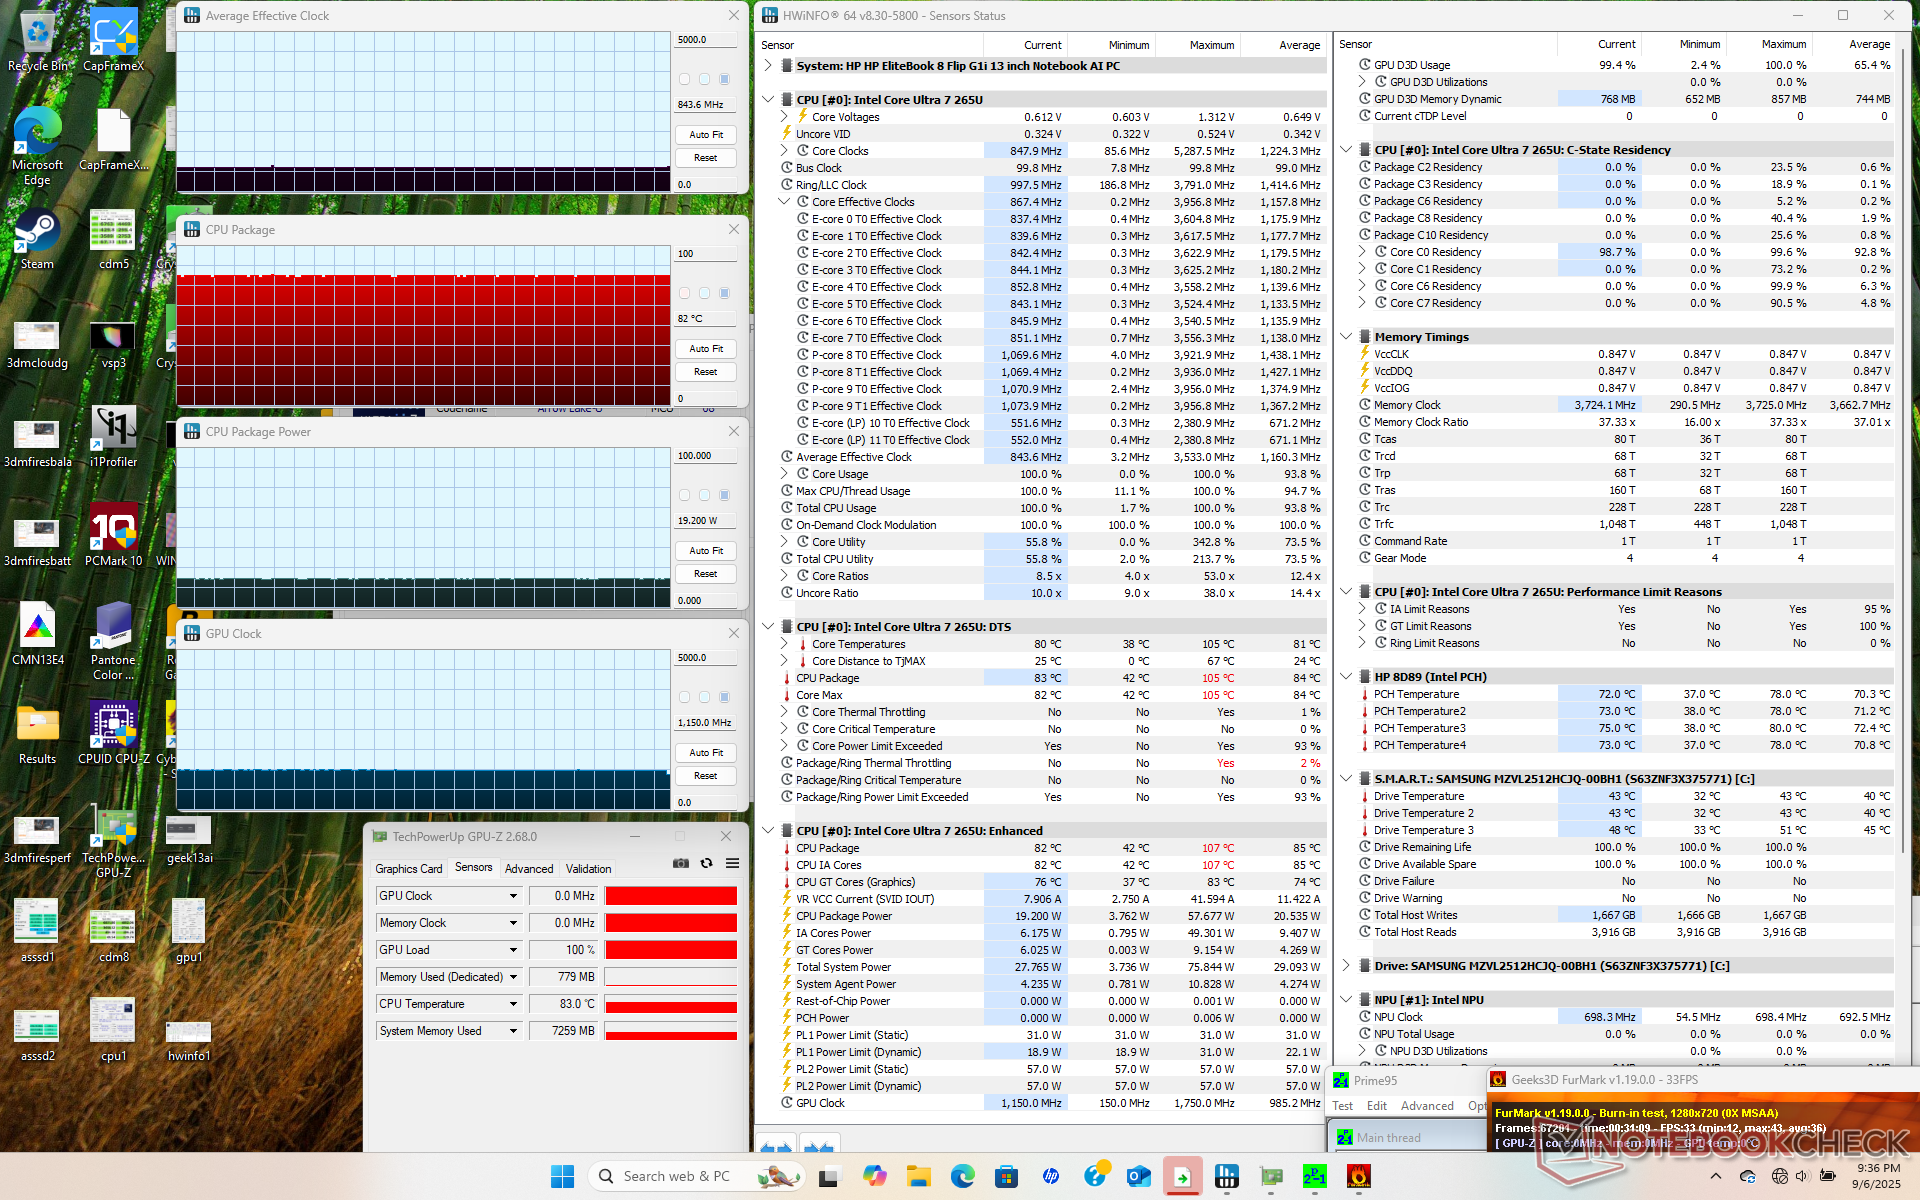
| Prime95 + FurMark Stress | 0.8 | 1150 | 82 |
| 赛博朋克 2077》压力 | 0.4 | 2100 | 82 |
系统性能
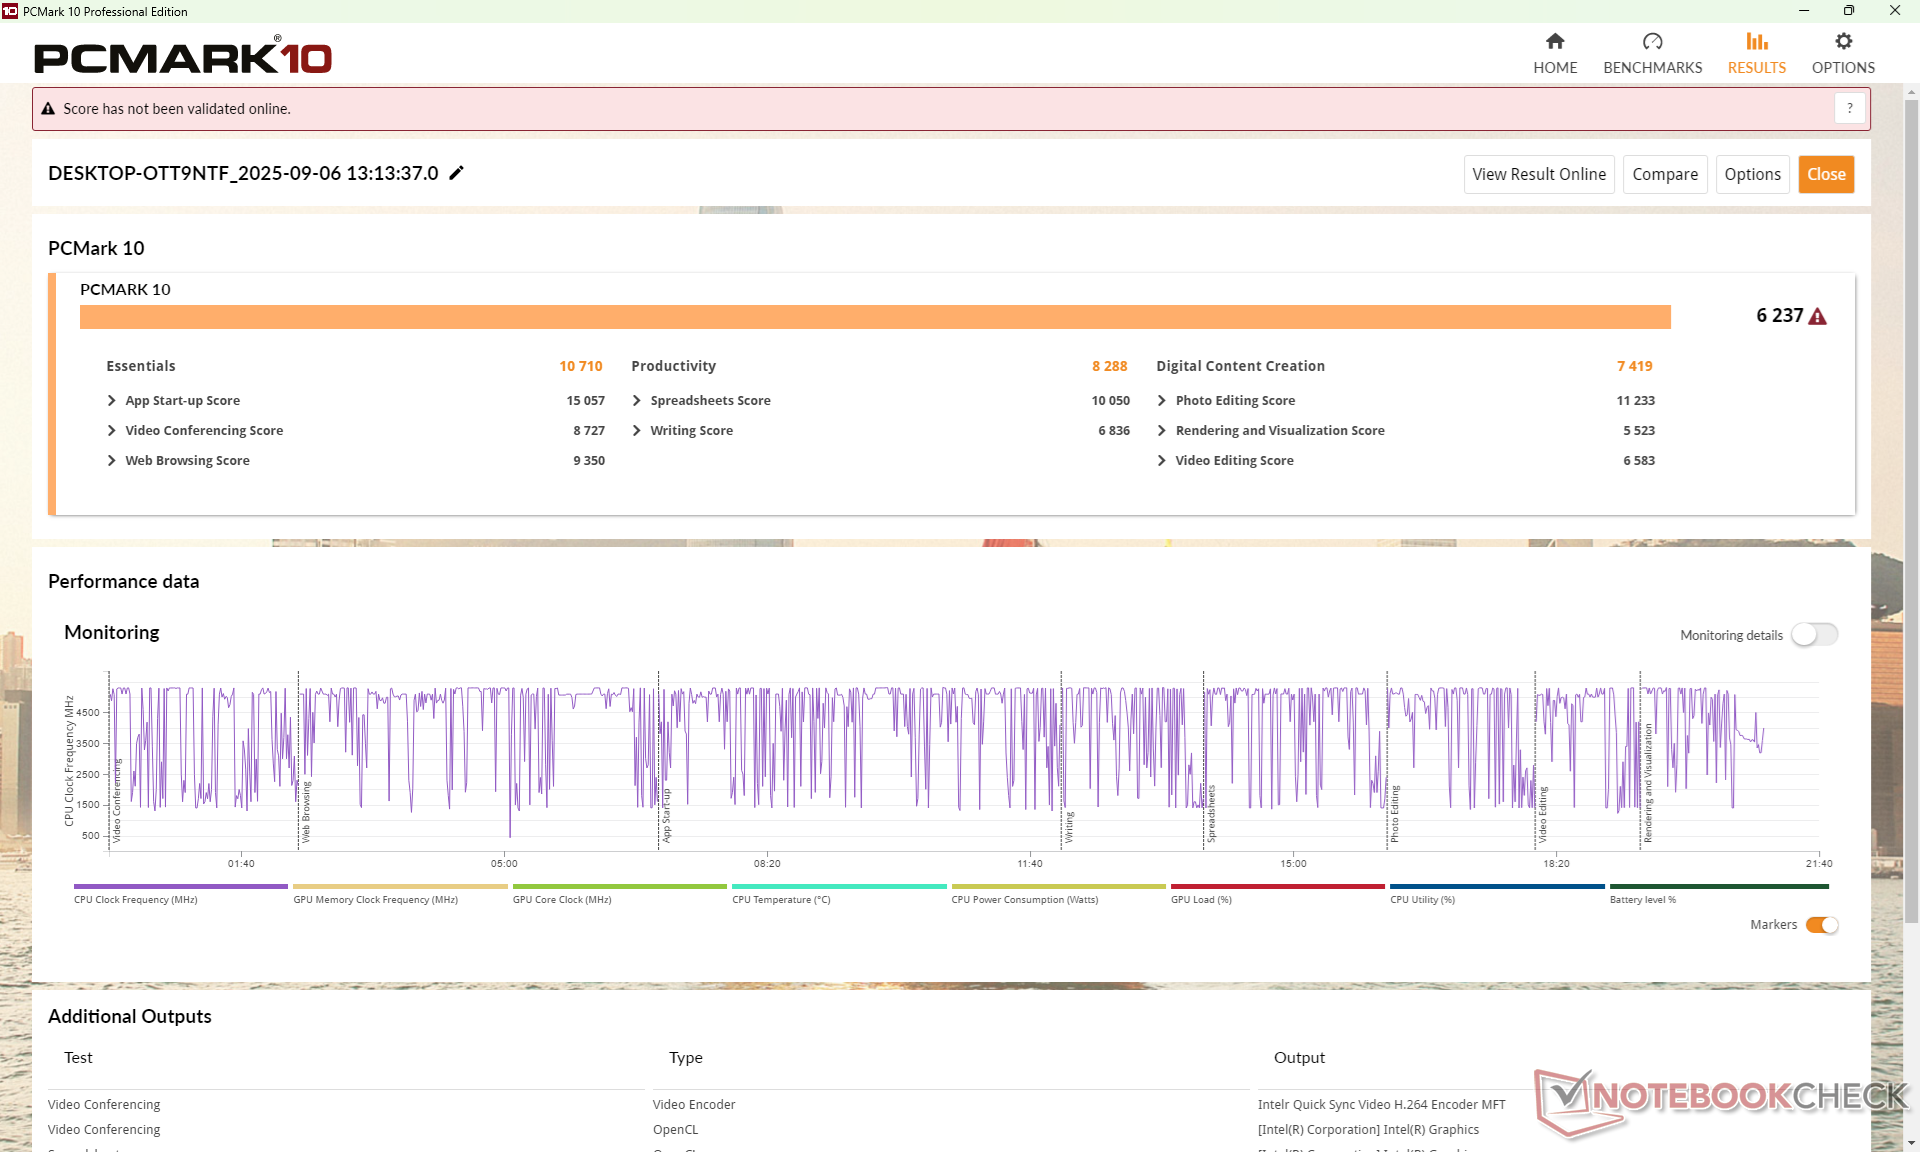
由于采用了更高效的 Arrow Lake-U CPU,PCMark 分数在许多子类别中都高于大多数 13 英寸可转换机型,甚至包括采用酷睿 H 系列的微星 Summit E13 AI Evo。
PCMark 10: Score | Essentials | Productivity | Digital Content Creation
CrossMark: Overall | Productivity | Creativity | Responsiveness
WebXPRT 3: Overall
WebXPRT 4: Overall
Mozilla Kraken 1.1: Total
| Performance rating | |
| HP EliteBook 8 Flip G1i 13 -1! | |
| Average Intel Core Ultra 7 265U, Intel Graphics 4-Core iGPU (Meteor / Arrow Lake) -1! | |
| MSI Summit E13 AI Evo A1MTG | |
| Asus ProArt PZ13 HT5306 -4! | |
| Lenovo ThinkPad L13 Yoga G4 21FSS00100 | |
| HP EliteBook x360 830 G10 7L7U1ET -1! | |
| Dell Latitude 9330 -4! | |
| PCMark 10 / Score | |
| HP EliteBook 8 Flip G1i 13 | |
| Average Intel Core Ultra 7 265U, Intel Graphics 4-Core iGPU (Meteor / Arrow Lake) (n=1) | |
| Lenovo ThinkPad L13 Yoga G4 21FSS00100 | |
| Dell Latitude 9330 | |
| HP EliteBook x360 830 G10 7L7U1ET | |
| MSI Summit E13 AI Evo A1MTG | |
| PCMark 10 / Essentials | |
| Lenovo ThinkPad L13 Yoga G4 21FSS00100 | |
| HP EliteBook 8 Flip G1i 13 | |
| Average Intel Core Ultra 7 265U, Intel Graphics 4-Core iGPU (Meteor / Arrow Lake) (n=1) | |
| Dell Latitude 9330 | |
| HP EliteBook x360 830 G10 7L7U1ET | |
| MSI Summit E13 AI Evo A1MTG | |
| PCMark 10 / Productivity | |
| Lenovo ThinkPad L13 Yoga G4 21FSS00100 | |
| HP EliteBook 8 Flip G1i 13 | |
| Average Intel Core Ultra 7 265U, Intel Graphics 4-Core iGPU (Meteor / Arrow Lake) (n=1) | |
| Dell Latitude 9330 | |
| HP EliteBook x360 830 G10 7L7U1ET | |
| MSI Summit E13 AI Evo A1MTG | |
| PCMark 10 / Digital Content Creation | |
| HP EliteBook 8 Flip G1i 13 | |
| Average Intel Core Ultra 7 265U, Intel Graphics 4-Core iGPU (Meteor / Arrow Lake) (n=1) | |
| MSI Summit E13 AI Evo A1MTG | |
| HP EliteBook x360 830 G10 7L7U1ET | |
| Dell Latitude 9330 | |
| Lenovo ThinkPad L13 Yoga G4 21FSS00100 | |
| CrossMark / Overall | |
| MSI Summit E13 AI Evo A1MTG | |
| HP EliteBook 8 Flip G1i 13 | |
| Average Intel Core Ultra 7 265U, Intel Graphics 4-Core iGPU (Meteor / Arrow Lake) (n=1) | |
| HP EliteBook x360 830 G10 7L7U1ET | |
| Lenovo ThinkPad L13 Yoga G4 21FSS00100 | |
| Asus ProArt PZ13 HT5306 | |
| CrossMark / Productivity | |
| MSI Summit E13 AI Evo A1MTG | |
| HP EliteBook 8 Flip G1i 13 | |
| Average Intel Core Ultra 7 265U, Intel Graphics 4-Core iGPU (Meteor / Arrow Lake) (n=1) | |
| HP EliteBook x360 830 G10 7L7U1ET | |
| Lenovo ThinkPad L13 Yoga G4 21FSS00100 | |
| Asus ProArt PZ13 HT5306 | |
| CrossMark / Creativity | |
| MSI Summit E13 AI Evo A1MTG | |
| HP EliteBook 8 Flip G1i 13 | |
| Average Intel Core Ultra 7 265U, Intel Graphics 4-Core iGPU (Meteor / Arrow Lake) (n=1) | |
| HP EliteBook x360 830 G10 7L7U1ET | |
| Asus ProArt PZ13 HT5306 | |
| Lenovo ThinkPad L13 Yoga G4 21FSS00100 | |
| CrossMark / Responsiveness | |
| MSI Summit E13 AI Evo A1MTG | |
| HP EliteBook 8 Flip G1i 13 | |
| Average Intel Core Ultra 7 265U, Intel Graphics 4-Core iGPU (Meteor / Arrow Lake) (n=1) | |
| Asus ProArt PZ13 HT5306 | |
| HP EliteBook x360 830 G10 7L7U1ET | |
| Lenovo ThinkPad L13 Yoga G4 21FSS00100 | |
| WebXPRT 3 / Overall | |
| Asus ProArt PZ13 HT5306 | |
| MSI Summit E13 AI Evo A1MTG | |
| HP EliteBook x360 830 G10 7L7U1ET | |
| Lenovo ThinkPad L13 Yoga G4 21FSS00100 | |
| Dell Latitude 9330 | |
| WebXPRT 4 / Overall | |
| Asus ProArt PZ13 HT5306 | |
| HP EliteBook 8 Flip G1i 13 | |
| Average Intel Core Ultra 7 265U, Intel Graphics 4-Core iGPU (Meteor / Arrow Lake) (n=1) | |
| Dell Latitude 9330 | |
| Lenovo ThinkPad L13 Yoga G4 21FSS00100 | |
| MSI Summit E13 AI Evo A1MTG | |
| Mozilla Kraken 1.1 / Total | |
| Lenovo ThinkPad L13 Yoga G4 21FSS00100 | |
| HP EliteBook 8 Flip G1i 13 | |
| Average Intel Core Ultra 7 265U, Intel Graphics 4-Core iGPU (Meteor / Arrow Lake) (n=1) | |
| Dell Latitude 9330 | |
| HP EliteBook x360 830 G10 7L7U1ET | |
| MSI Summit E13 AI Evo A1MTG | |
| Asus ProArt PZ13 HT5306 | |
* ... smaller is better
| PCMark 10 Score | 6237 points | |
Help | ||
DPC 延迟
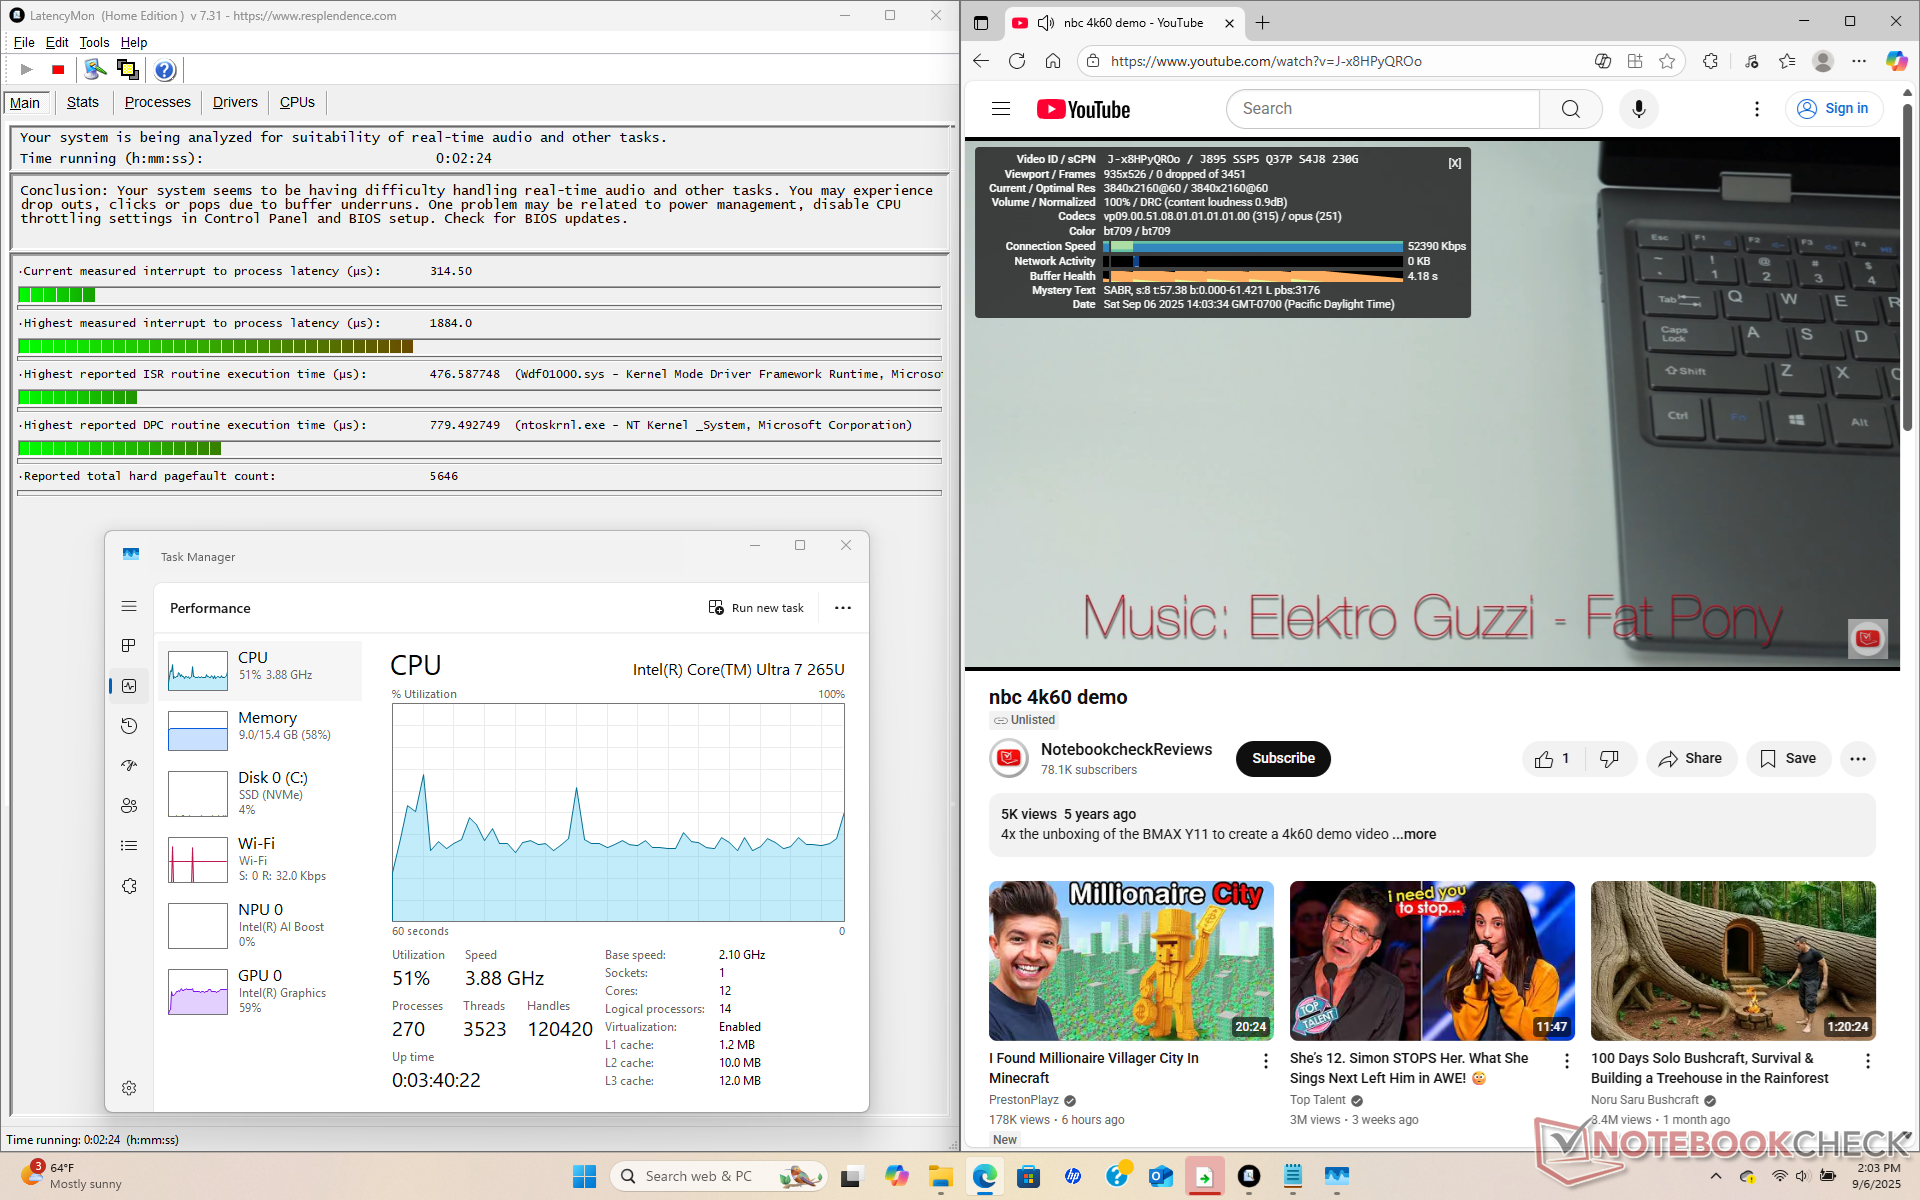
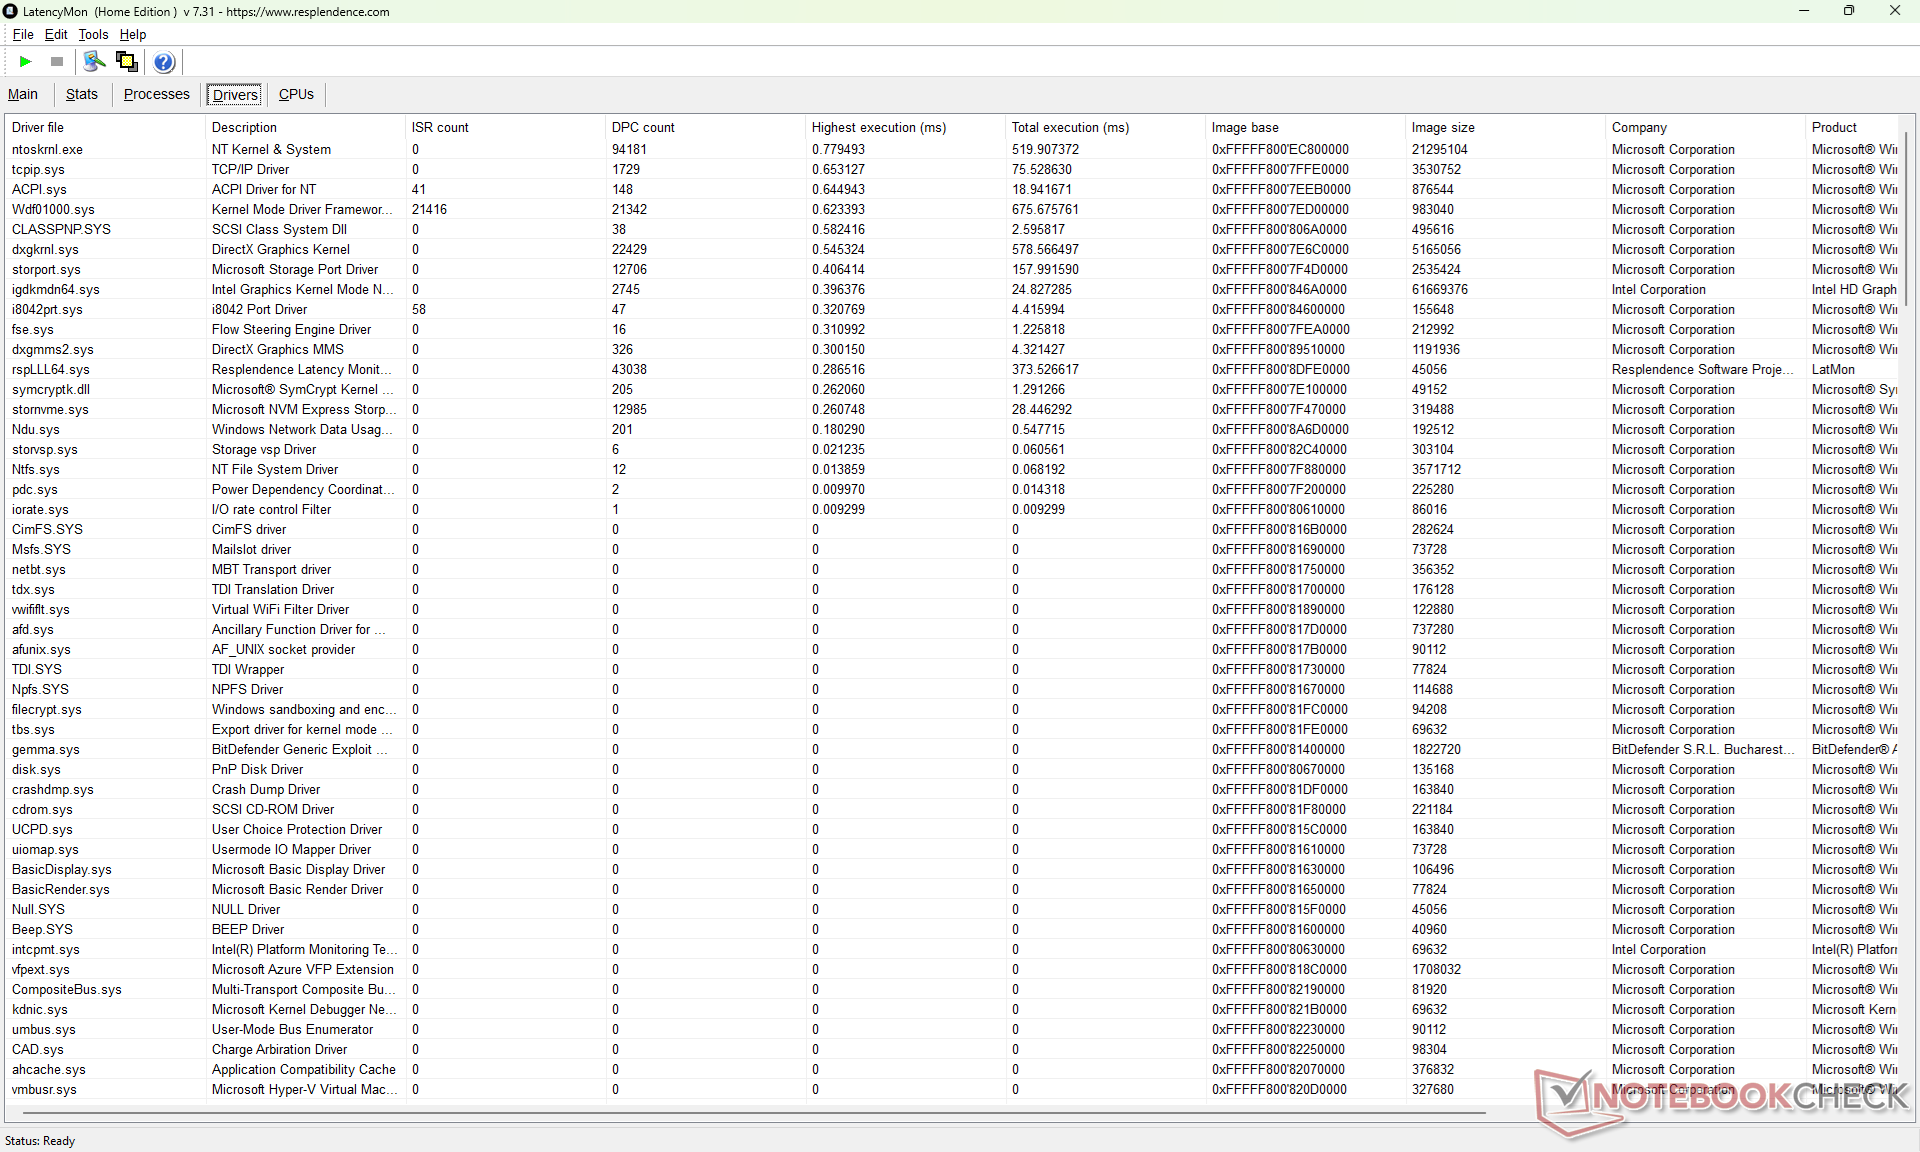
| DPC Latencies / LatencyMon - interrupt to process latency (max), Web, Youtube, Prime95 | |
| Dell Latitude 9330 | |
| MSI Summit E13 AI Evo A1MTG | |
| HP EliteBook 8 Flip G1i 13 | |
| HP EliteBook x360 830 G10 7L7U1ET | |
| Lenovo ThinkPad L13 Yoga G4 21FSS00100 | |
* ... smaller is better
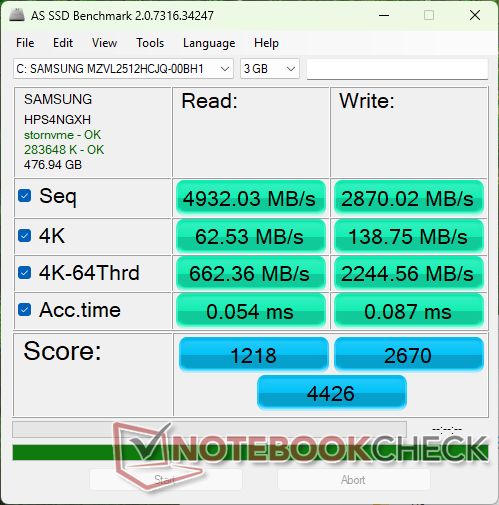
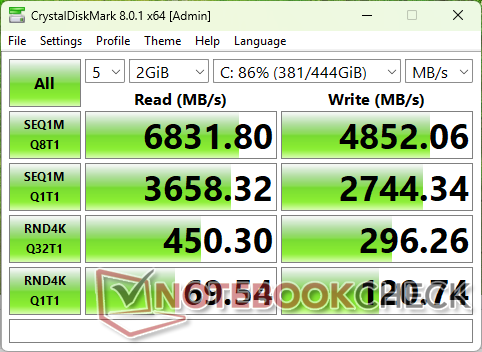
存储设备
我们的 三星固态硬盘在我们的 DiskSpd 循环测试中,三星固态硬盘在几分钟后就会出现节流问题,而 EliteBook 865 G10 中的 SK Hynix 硬盘则不会,如下图所示。考虑到 U 系列 CPU 和目标用户,这并不是一个大问题,但还是有点令人失望。

* ... smaller is better
磁盘节流DiskSpd 读取循环,队列深度 8
图形处理器性能
综合 Arc 4与较早的 Iris Xe 96 EUs.遗憾的是,由于惠普机型没有配备酷睿 H 系列 CPU,因此没有 Arc 8 选项。
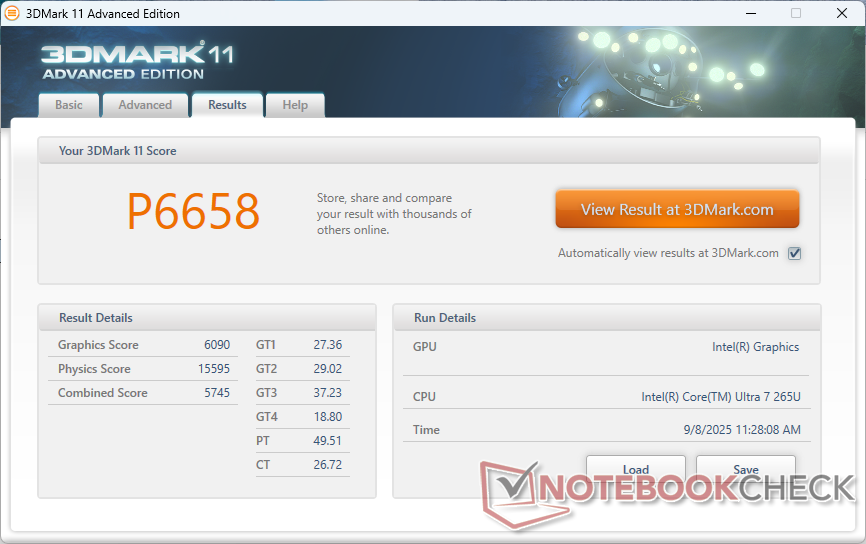
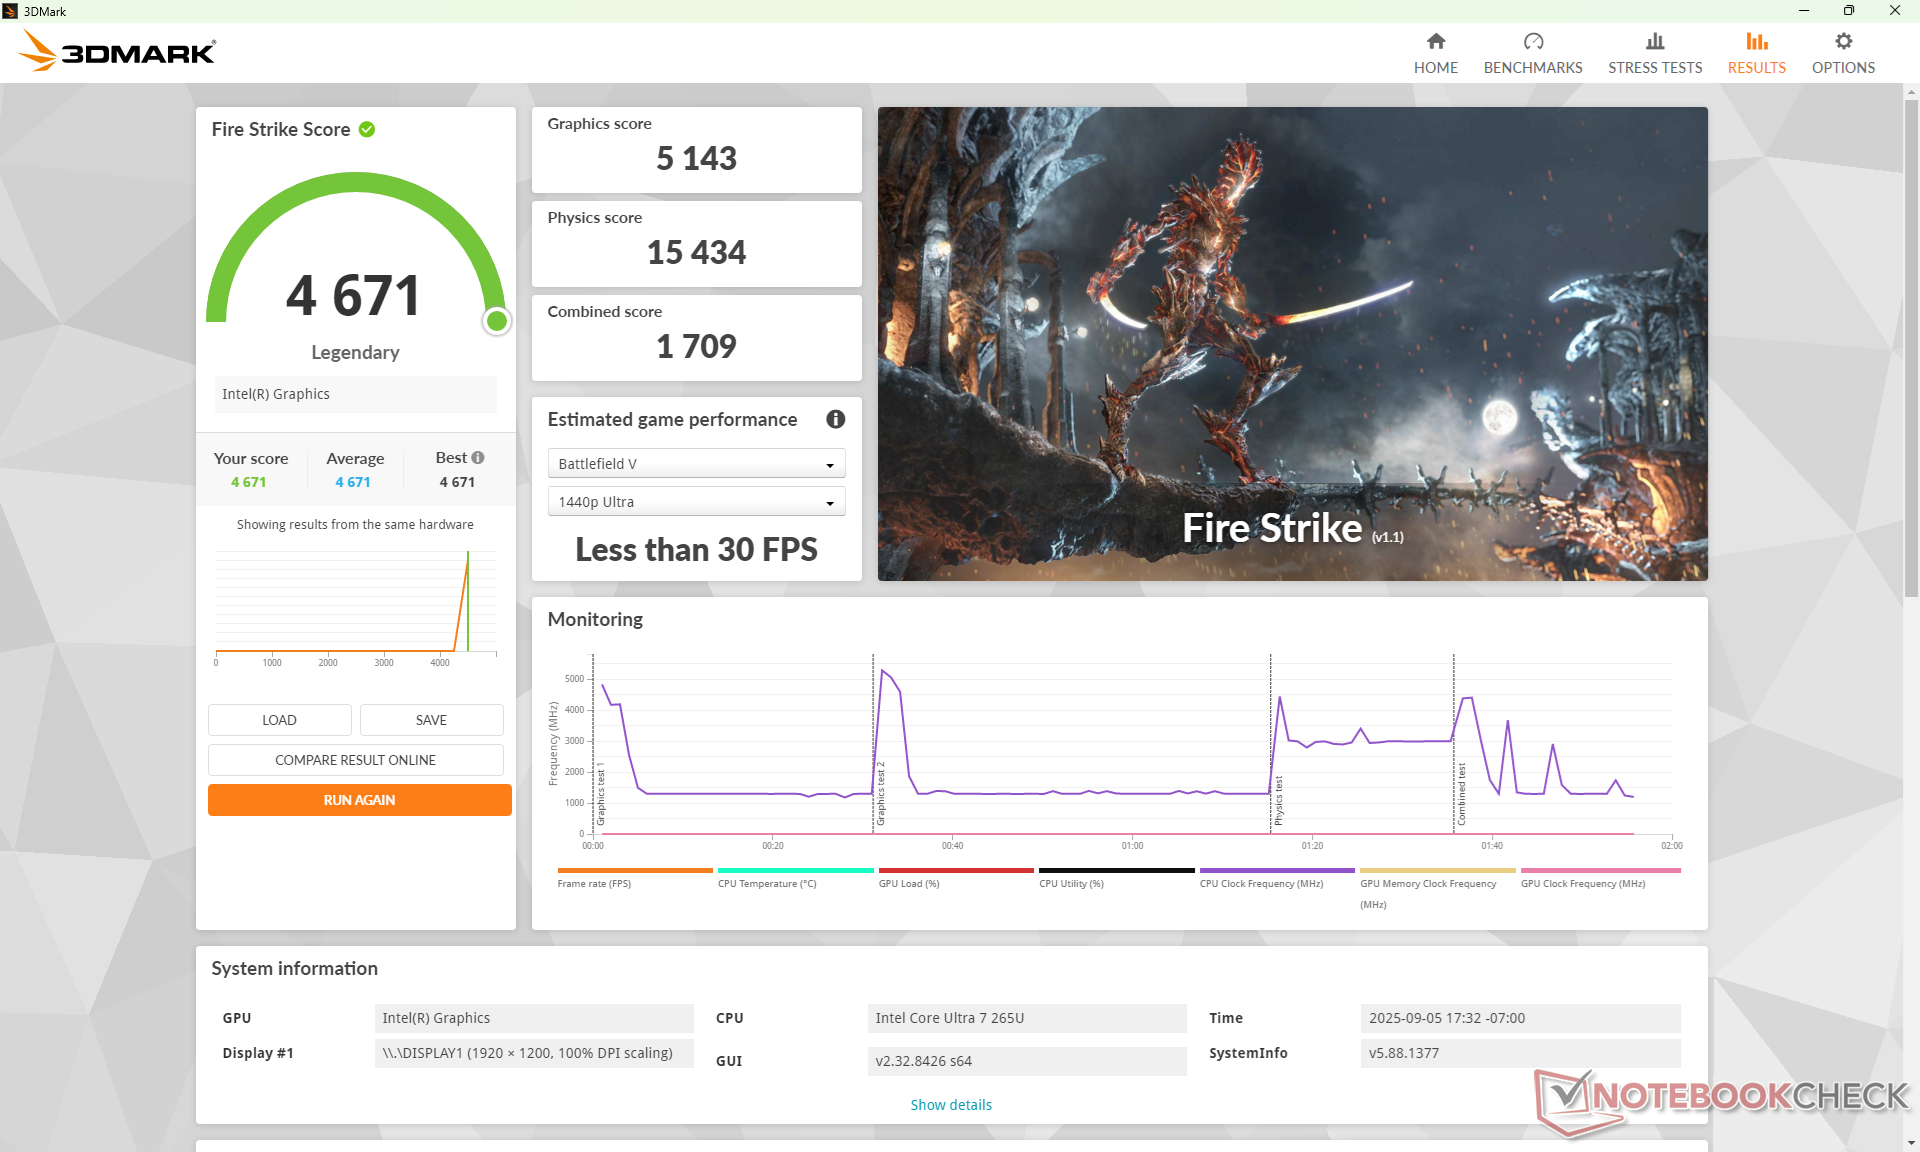
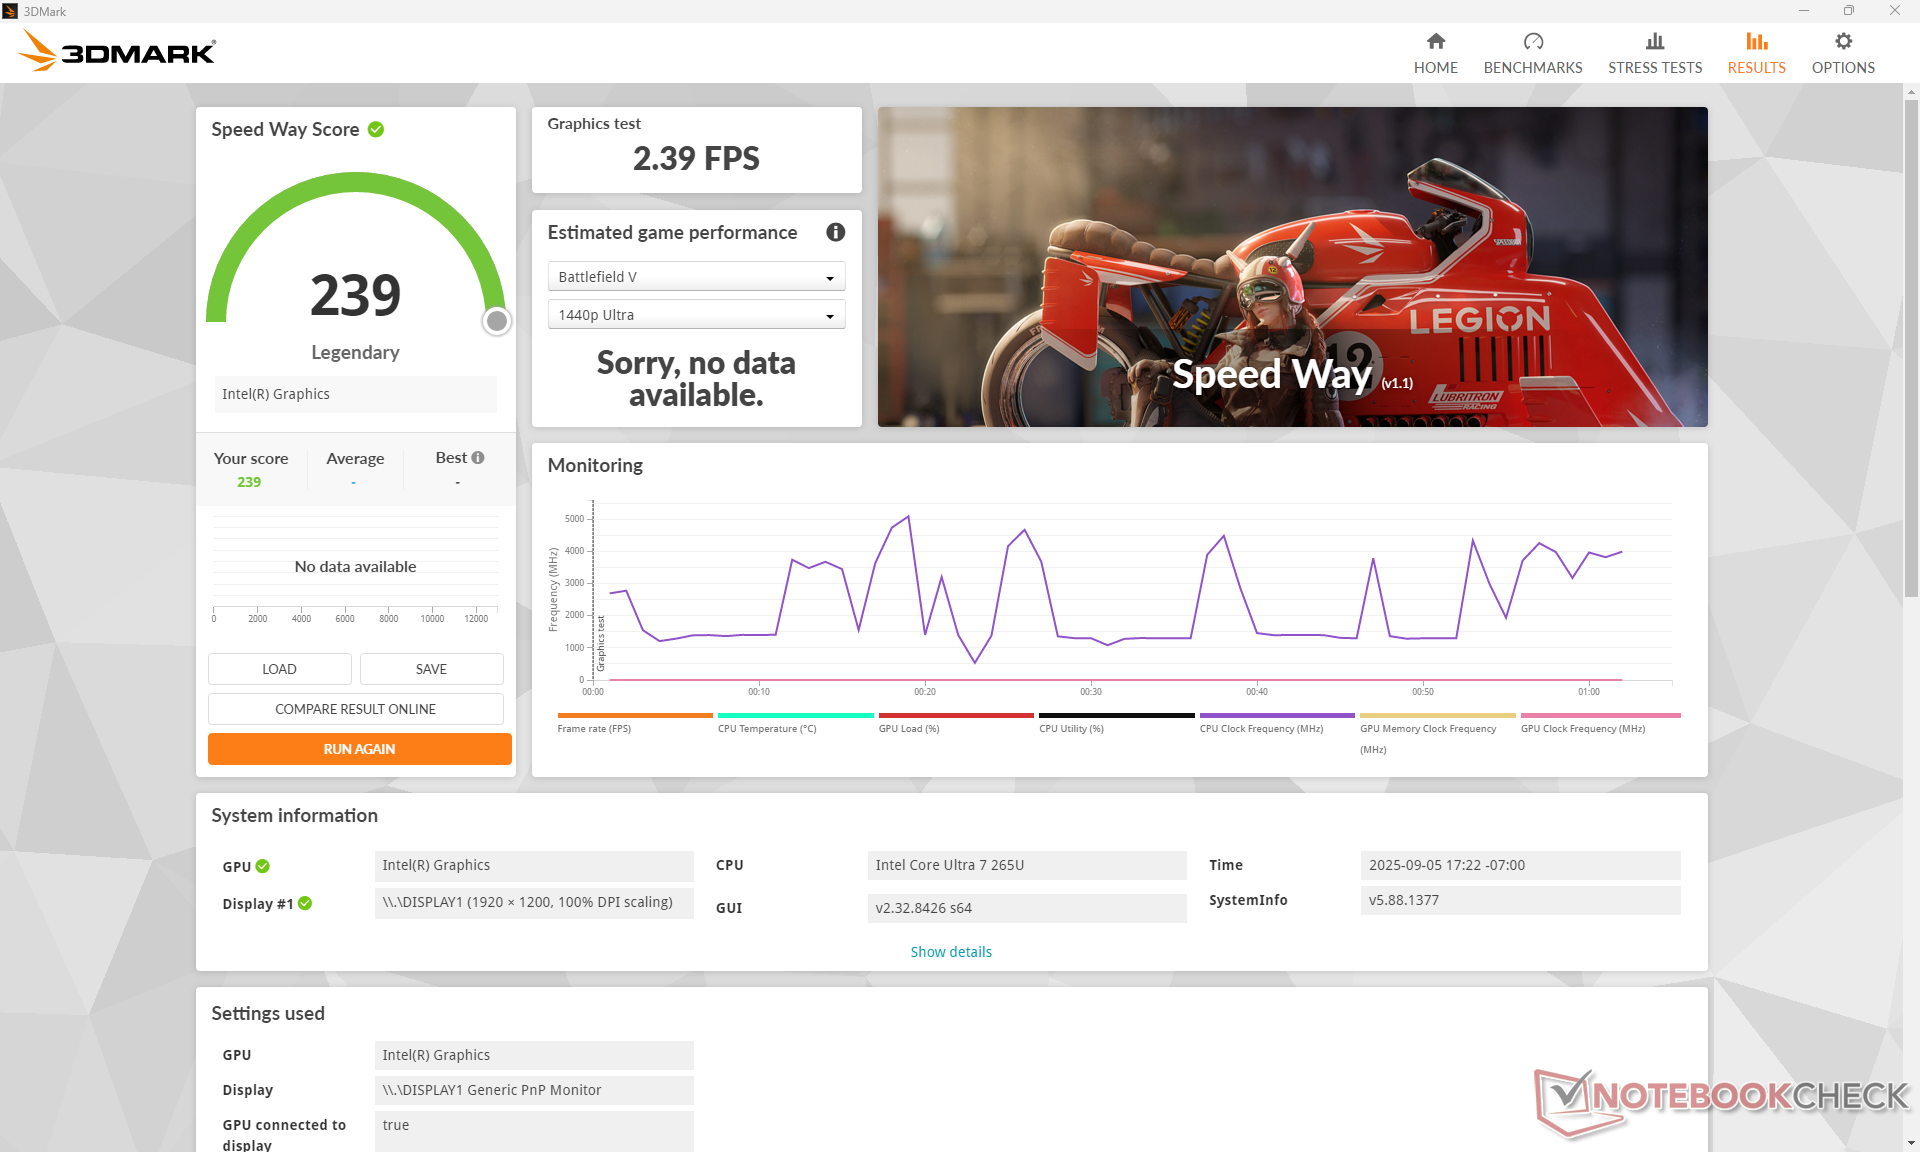
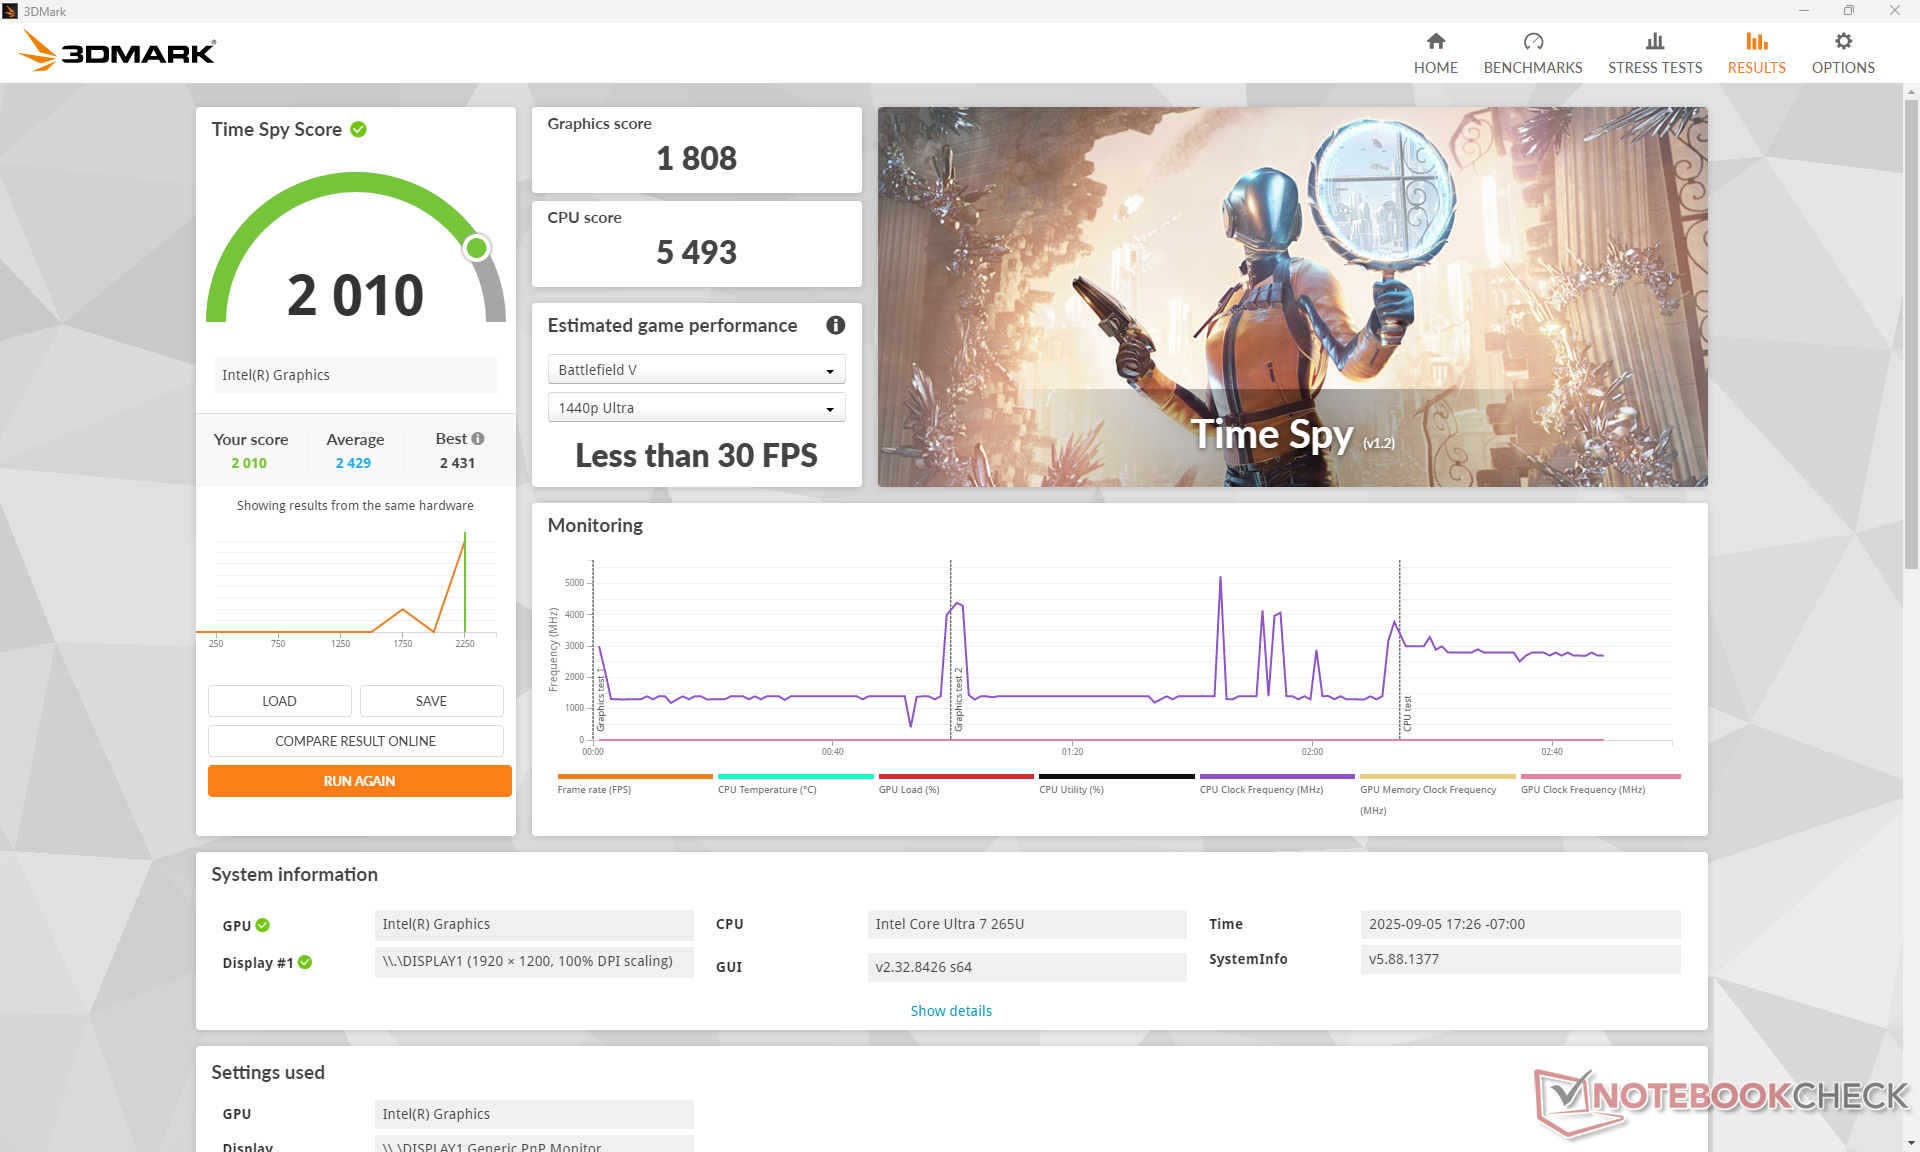
| 3DMark 11 Performance | 6658 points | |
| 3DMark Cloud Gate Standard Score | 24927 points | |
| 3DMark Fire Strike Score | 4671 points | |
| 3DMark Time Spy Score | 2010 points | |
Help | ||
* ... smaller is better
| Performance rating - Percent | |
| MSI Summit E13 AI Evo A1MTG -1! | |
| HP EliteBook 8 Flip G1i 13 | |
| Dell Latitude 9330 -2! | |
| HP EliteBook x360 830 G10 7L7U1ET -3! | |
| Asus ProArt PZ13 HT5306 -3! | |
| Lenovo ThinkPad L13 Yoga G4 21FSS00100 -2! | |
| Cyberpunk 2077 - 1920x1080 Ultra Preset (FSR off) | |
| HP EliteBook 8 Flip G1i 13 | |
| Asus ProArt PZ13 HT5306 | |
| Baldur's Gate 3 - 1920x1080 Ultra Preset AA:T | |
| MSI Summit E13 AI Evo A1MTG | |
| HP EliteBook 8 Flip G1i 13 | |
| GTA V - 1920x1080 Highest AA:4xMSAA + FX AF:16x | |
| Asus ProArt PZ13 HT5306 | |
| MSI Summit E13 AI Evo A1MTG | |
| Lenovo ThinkPad L13 Yoga G4 21FSS00100 | |
| HP EliteBook 8 Flip G1i 13 | |
| Dell Latitude 9330 | |
| HP EliteBook x360 830 G10 7L7U1ET | |
| Final Fantasy XV Benchmark - 1920x1080 High Quality | |
| MSI Summit E13 AI Evo A1MTG | |
| HP EliteBook 8 Flip G1i 13 | |
| HP EliteBook x360 830 G10 7L7U1ET | |
| Dell Latitude 9330 | |
| Lenovo ThinkPad L13 Yoga G4 21FSS00100 | |
| Asus ProArt PZ13 HT5306 | |
| Strange Brigade - 1920x1080 ultra AA:ultra AF:16 | |
| MSI Summit E13 AI Evo A1MTG | |
| HP EliteBook 8 Flip G1i 13 | |
| Dell Latitude 9330 | |
| Lenovo ThinkPad L13 Yoga G4 21FSS00100 | |
| Dota 2 Reborn - 1920x1080 ultra (3/3) best looking | |
| MSI Summit E13 AI Evo A1MTG | |
| Dell Latitude 9330 | |
| HP EliteBook 8 Flip G1i 13 | |
| Asus ProArt PZ13 HT5306 | |
| HP EliteBook x360 830 G10 7L7U1ET | |
| Lenovo ThinkPad L13 Yoga G4 21FSS00100 | |
| X-Plane 11.11 - 1920x1080 high (fps_test=3) | |
| MSI Summit E13 AI Evo A1MTG | |
| Dell Latitude 9330 | |
| HP EliteBook x360 830 G10 7L7U1ET | |
| Lenovo ThinkPad L13 Yoga G4 21FSS00100 | |
| HP EliteBook 8 Flip G1i 13 | |
| F1 24 | |
| 1920x1080 Low Preset AA:T AF:16x | |
| Average Intel Graphics 4-Core iGPU (Meteor / Arrow Lake) (27.4 - 44.7, n=14) | |
| HP EliteBook 8 Flip G1i 13 | |
| 1920x1080 Medium Preset AA:T AF:16x | |
| Average Intel Graphics 4-Core iGPU (Meteor / Arrow Lake) (25 - 40.1, n=14) | |
| HP EliteBook 8 Flip G1i 13 | |
| 1920x1080 High Preset AA:T AF:16x | |
| Average Intel Graphics 4-Core iGPU (Meteor / Arrow Lake) (18.3 - 30, n=12) | |
| HP EliteBook 8 Flip G1i 13 | |
| 1920x1080 Ultra High Preset AA:T AF:16x | |
| Average Intel Graphics 4-Core iGPU (Meteor / Arrow Lake) (6.91 - 8.51, n=7) | |
| HP EliteBook 8 Flip G1i 13 | |
赛博朋克 2077》超 FPS 图表
| low | med. | high | ultra | |
|---|---|---|---|---|
| GTA V (2015) | 127.4 | 105.5 | 24.4 | 9.99 |
| Dota 2 Reborn (2015) | 75.4 | 54.9 | 44.6 | 52.4 |
| Final Fantasy XV Benchmark (2018) | 42.6 | 24.9 | 18.2 | |
| X-Plane 11.11 (2018) | 35.3 | 28.1 | 23.7 | |
| Strange Brigade (2018) | 93.9 | 41.7 | 32.4 | 27.1 |
| Baldur's Gate 3 (2023) | 18.1 | 14.9 | 12.8 | 12.7 |
| Cyberpunk 2077 (2023) | 21.1 | 17.1 | 14.6 | 12 |
| F1 24 (2024) | 35.1 | 32.7 | 23.8 | 7.21 |
排放量
系统噪音
风扇噪音和性能与我们在戴尔 9530 上体验到的非常接近。 戴尔Latitude 9330.在浏览网页或进行流媒体播放时,风扇的声音基本听不到,但当负载要求较高时,转速会迅速增加。
在台式机上空转时,我们可以从测试设备上听到一些轻微的线圈啸叫或电子噪音。
Noise level
| Idle |
| 24.8 / 24.8 / 24.9 dB(A) |
| Load |
| 37.1 / 37.4 dB(A) |
 | ||
30 dB silent 40 dB(A) audible 50 dB(A) loud |
||
min: | ||
| HP EliteBook 8 Flip G1i 13 Graphics 4-Core iGPU (Arrow Lake), Ultra 7 265U, Samsung PM9A1 MZVL2512HCJQ | HP EliteBook x360 830 G10 7L7U1ET Iris Xe G7 80EUs, i5-1335U, Samsung PM991 MZVLQ512HBLU | Lenovo ThinkPad L13 Yoga G4 21FSS00100 Vega 7, R5 7530U, Kioxia BG5 KBG5AZNT512G | MSI Summit E13 AI Evo A1MTG Arc 8-Core, Ultra 7 155H, Micron 2400 MTFDKBA1T0QFM | Asus ProArt PZ13 HT5306 Adreno X1-45 1.7 TFLOPS, SD X Plus X1P-42-100, WD PC SN740 SDDPTQD-1T00 | Dell Latitude 9330 Iris Xe G7 96EUs, i7-1260U | |
|---|---|---|---|---|---|---|
| Noise | 5% | 12% | -8% | 6% | 3% | |
| off / environment * (dB) | 23.7 | 23.2 2% | 23.4 1% | 24 -1% | 23.7 -0% | 23 3% |
| Idle Minimum * (dB) | 24.8 | 23.2 6% | 23.4 6% | 24.1 3% | 23.7 4% | 23 7% |
| Idle Average * (dB) | 24.8 | 23.2 6% | 23.4 6% | 24.8 -0% | 23.7 4% | 23.1 7% |
| Idle Maximum * (dB) | 24.9 | 23.2 7% | 23.4 6% | 26.5 -6% | 23.7 5% | 23.1 7% |
| Load Average * (dB) | 37.1 | 29.4 21% | 24 35% | 39.3 -6% | 26.7 28% | 37.1 -0% |
| Cyberpunk 2077 ultra * (dB) | 39.5 | 45 -14% | 35.1 11% | |||
| Load Maximum * (dB) | 37.4 | 42.5 -14% | 30.1 20% | 49.1 -31% | 40 -7% | 40.5 -8% |
| Witcher 3 ultra * (dB) | 42.3 | 30.8 | 40.6 |
* ... smaller is better
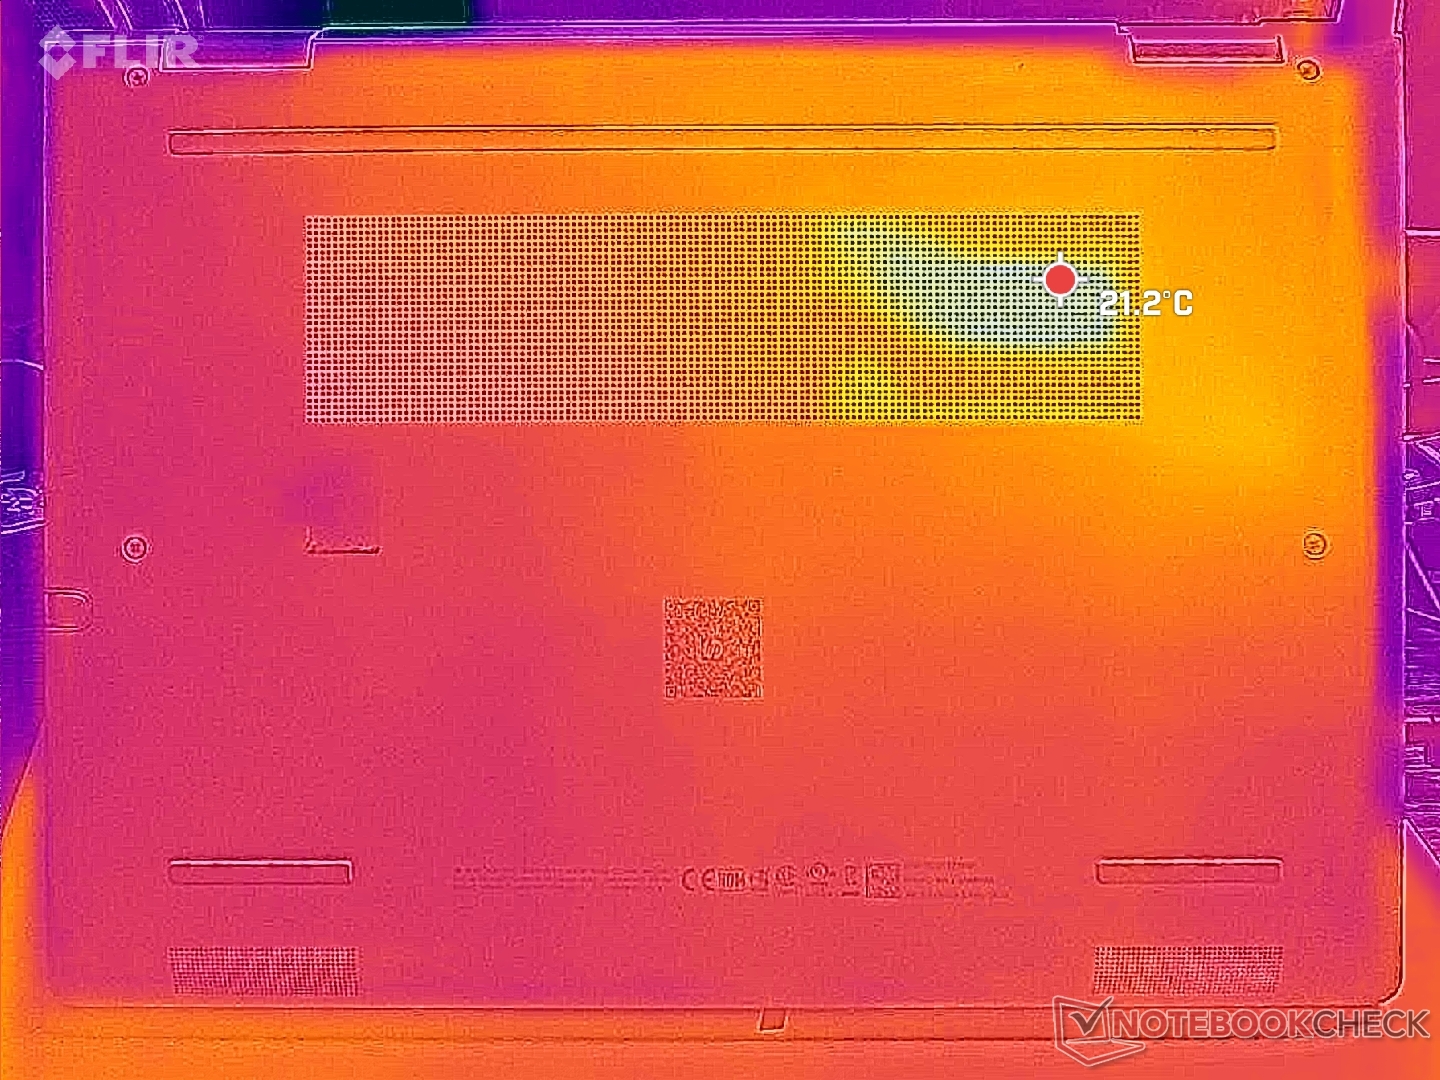
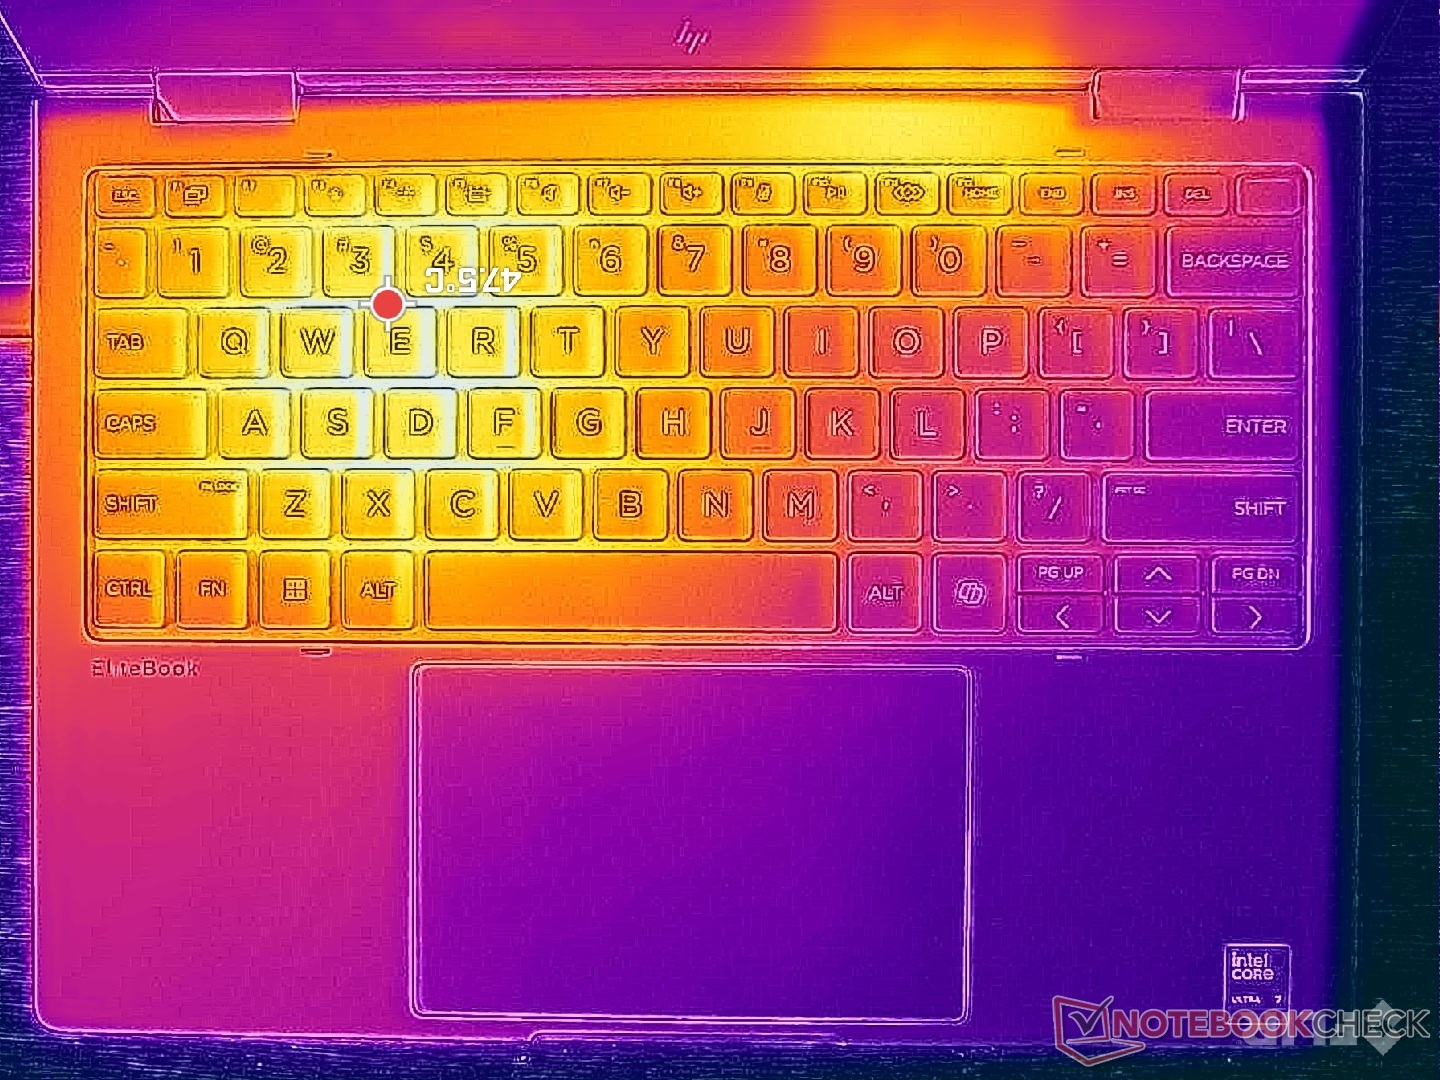
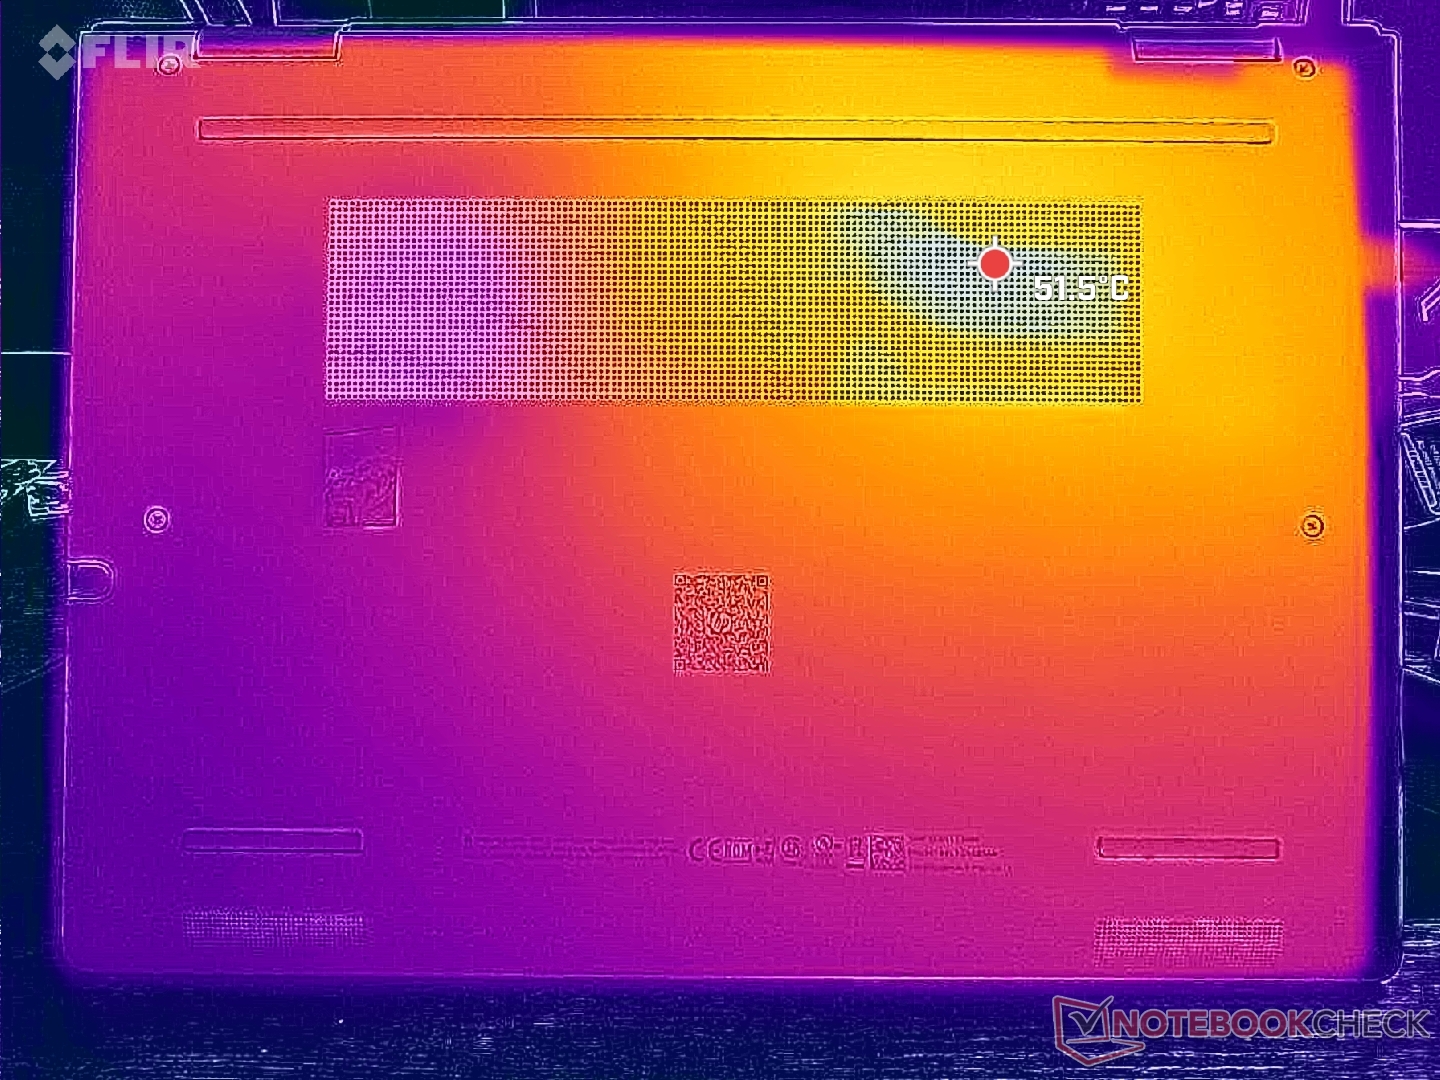
温度
在运行要求较高的负载时,键盘底座和底盖的表面温度可能会变得非常高,分别高达 47 C 和 51 C,而在运行要求较低的负载时,键盘底座和底盖的表面温度可能会变得非常高,分别高达 45 C 和 51 C。 联想 ThinkPad L13 Yoga G4.
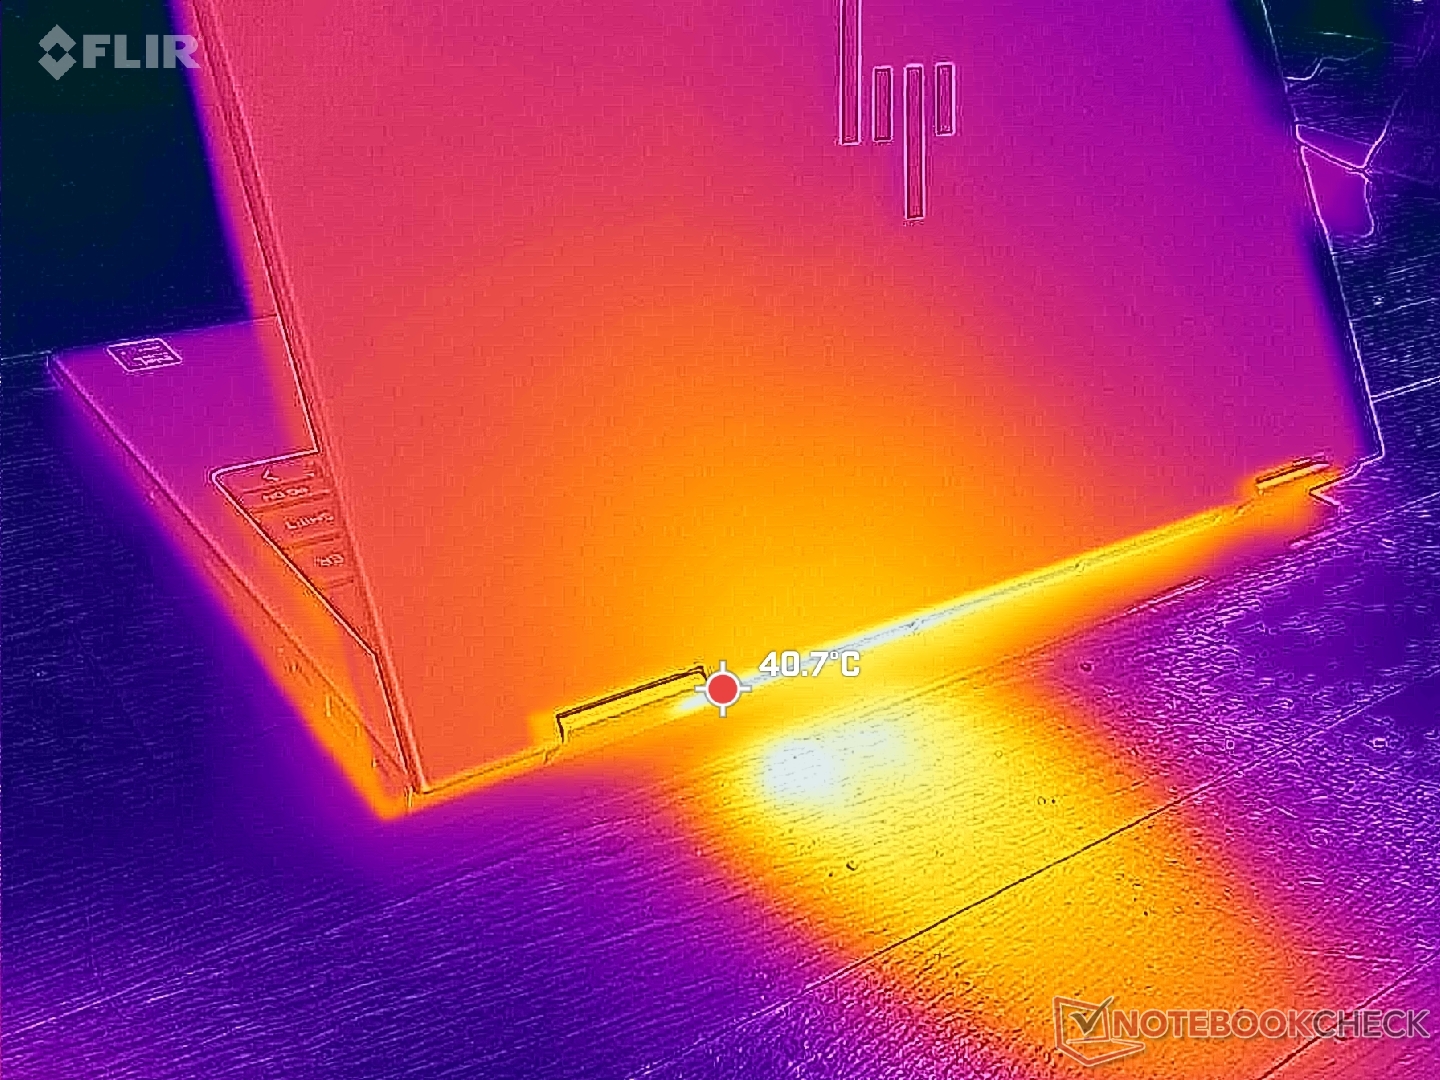
(-) The maximum temperature on the upper side is 46.2 °C / 115 F, compared to the average of 35.4 °C / 96 F, ranging from 19.6 to 60 °C for the class Convertible.
(-) The bottom heats up to a maximum of 51 °C / 124 F, compared to the average of 36.9 °C / 98 F
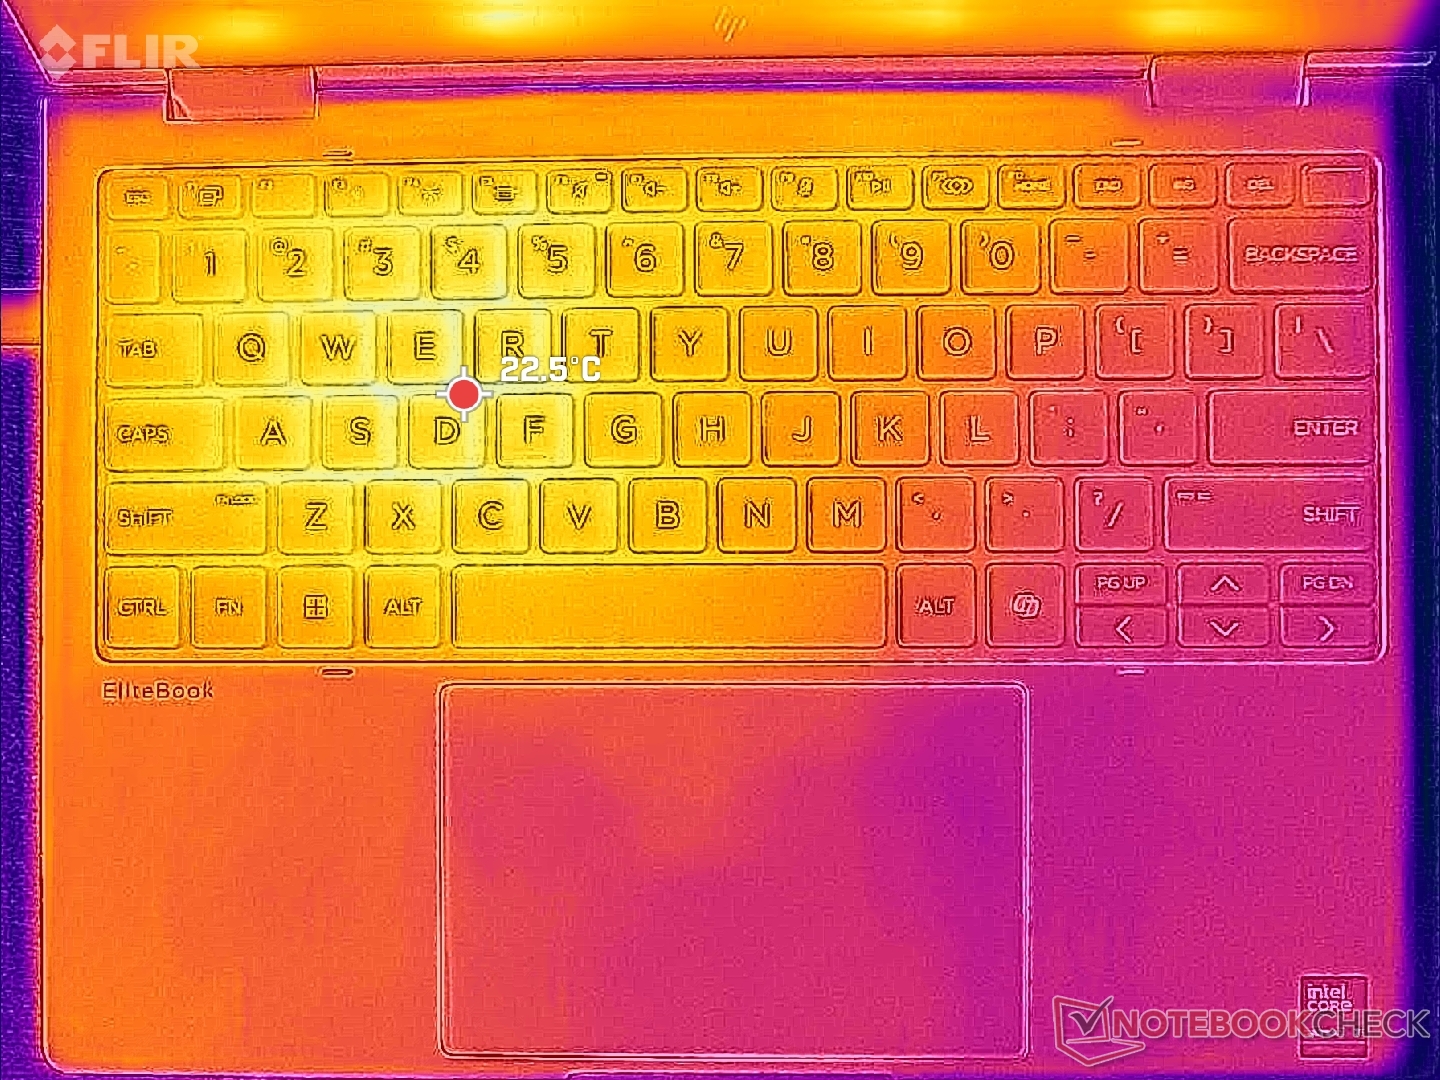
(+) In idle usage, the average temperature for the upper side is 25.5 °C / 78 F, compared to the device average of 30.3 °C / 87 F.
(+) The palmrests and touchpad are reaching skin temperature as a maximum (33.6 °C / 92.5 F) and are therefore not hot.
(-) The average temperature of the palmrest area of similar devices was 28 °C / 82.4 F (-5.6 °C / -10.1 F).
| HP EliteBook 8 Flip G1i 13 Intel Core Ultra 7 265U, Intel Graphics 4-Core iGPU (Meteor / Arrow Lake) | HP EliteBook x360 830 G10 7L7U1ET Intel Core i5-1335U, Intel Iris Xe Graphics G7 80EUs | Lenovo ThinkPad L13 Yoga G4 21FSS00100 AMD Ryzen 5 7530U, AMD Radeon RX Vega 7 | MSI Summit E13 AI Evo A1MTG Intel Core Ultra 7 155H, Intel Arc 8-Core iGPU | Asus ProArt PZ13 HT5306 Qualcomm Snapdragon X Plus X1P-42-100, Qualcomm SD X Adreno X1-45 1.7 TFLOPS | Dell Latitude 9330 Intel Core i7-1260U, Intel Iris Xe Graphics G7 96EUs | |
|---|---|---|---|---|---|---|
| Heat | -1% | -7% | -13% | -1% | 4% | |
| Maximum Upper Side * (°C) | 46.2 | 40.2 13% | 43.3 6% | 45.2 2% | 43.7 5% | 40.6 12% |
| Maximum Bottom * (°C) | 51 | 42.4 17% | 46.5 9% | 44.8 12% | 43.9 14% | 50.2 2% |
| Idle Upper Side * (°C) | 26.8 | 30 -12% | 31.9 -19% | 34.8 -30% | 31.9 -19% | 25 7% |
| Idle Bottom * (°C) | 26.4 | 31.8 -20% | 33.1 -25% | 35.8 -36% | 27.6 -5% | 27.6 -5% |
* ... smaller is better
发言人
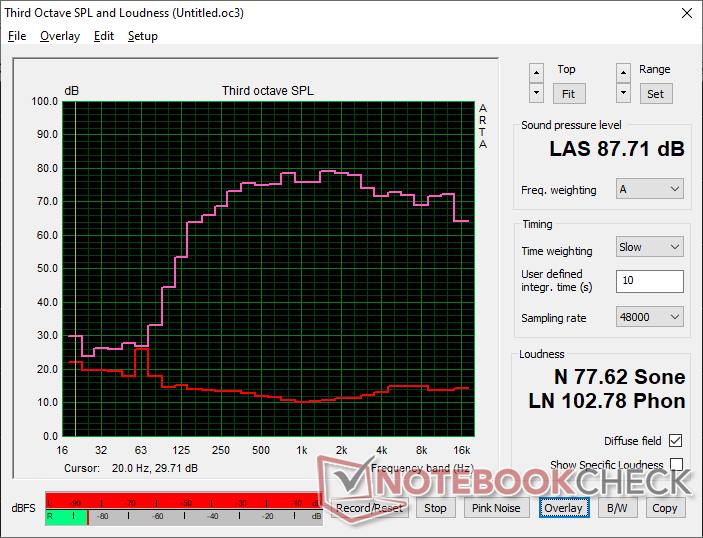
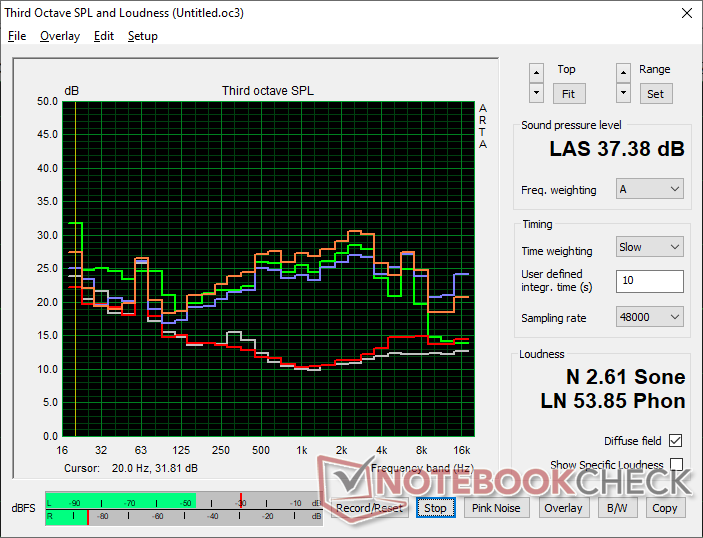
HP EliteBook 8 Flip G1i 13 audio analysis
(+) | speakers can play relatively loud (87.7 dB)
Bass 100 - 315 Hz
(±) | reduced bass - on average 11.7% lower than median
(±) | linearity of bass is average (11.1% delta to prev. frequency)
Mids 400 - 2000 Hz
(+) | balanced mids - only 3.4% away from median
(+) | mids are linear (2.7% delta to prev. frequency)
Highs 2 - 16 kHz
(+) | balanced highs - only 2.1% away from median
(+) | highs are linear (3.6% delta to prev. frequency)
Overall 100 - 16.000 Hz
(+) | overall sound is linear (9.4% difference to median)
Compared to same class
» 5% of all tested devices in this class were better, 1% similar, 94% worse
» The best had a delta of 6%, average was 20%, worst was 57%
Compared to all devices tested
» 3% of all tested devices were better, 1% similar, 96% worse
» The best had a delta of 4%, average was 23%, worst was 134%
Apple MacBook Pro 16 2021 M1 Pro audio analysis
(+) | speakers can play relatively loud (84.7 dB)
Bass 100 - 315 Hz
(+) | good bass - only 3.8% away from median
(+) | bass is linear (5.2% delta to prev. frequency)
Mids 400 - 2000 Hz
(+) | balanced mids - only 1.3% away from median
(+) | mids are linear (2.1% delta to prev. frequency)
Highs 2 - 16 kHz
(+) | balanced highs - only 1.9% away from median
(+) | highs are linear (2.7% delta to prev. frequency)
Overall 100 - 16.000 Hz
(+) | overall sound is linear (4.6% difference to median)
Compared to same class
» 0% of all tested devices in this class were better, 0% similar, 100% worse
» The best had a delta of 5%, average was 17%, worst was 45%
Compared to all devices tested
» 0% of all tested devices were better, 0% similar, 100% worse
» The best had a delta of 4%, average was 23%, worst was 134%
能源管理
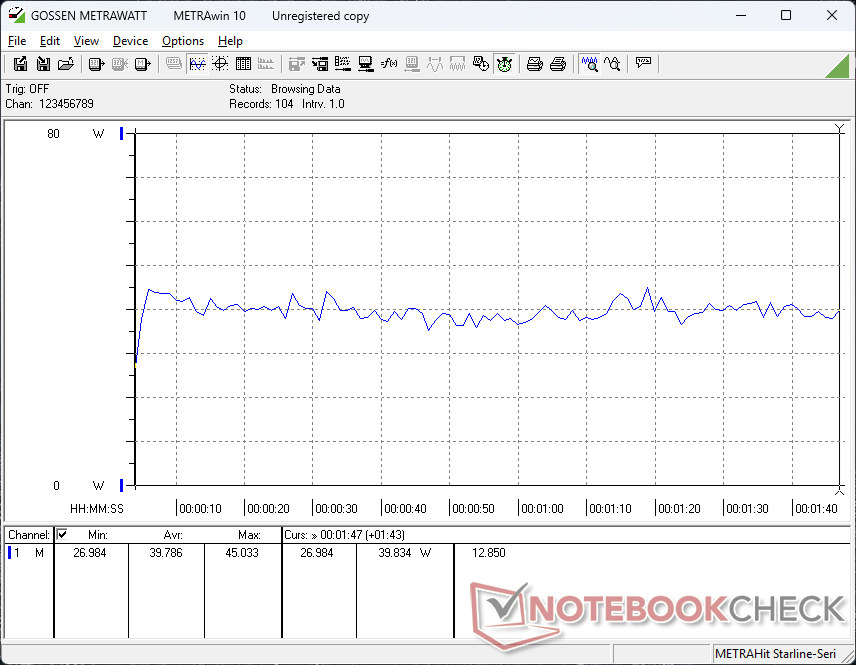
耗电量
整体功耗接近去年 EliteBook x360 830 G10 的记录,CPU 性能提高了 50%,GPU 性能提高了 15% 至 40%,从而提高了每瓦性能。
| Off / Standby | |
| Idle | |
| Load |
|
Key:
min: | |
| HP EliteBook 8 Flip G1i 13 Ultra 7 265U, Graphics 4-Core iGPU (Arrow Lake), Samsung PM9A1 MZVL2512HCJQ, IPS, 1920x1200, 13.3" | HP EliteBook x360 830 G10 7L7U1ET i5-1335U, Iris Xe G7 80EUs, Samsung PM991 MZVLQ512HBLU, IPS LED, 1920x1200, 13.3" | Lenovo ThinkPad L13 Yoga G4 21FSS00100 R5 7530U, Vega 7, Kioxia BG5 KBG5AZNT512G, IPS LED, 1920x1200, 13.3" | MSI Summit E13 AI Evo A1MTG Ultra 7 155H, Arc 8-Core, Micron 2400 MTFDKBA1T0QFM, IPS, 1920x1200, 13.3" | Asus ProArt PZ13 HT5306 SD X Plus X1P-42-100, Adreno X1-45 1.7 TFLOPS, WD PC SN740 SDDPTQD-1T00, OLED, 2880x1800, 13.3" | Dell Latitude 9330 i7-1260U, Iris Xe G7 96EUs, , IPS, 2560x1600, 13.3" | |
|---|---|---|---|---|---|---|
| Power Consumption | -16% | -13% | -1% | 17% | -28% | |
| Idle Minimum * (Watt) | 2.8 | 4.5 -61% | 4.4 -57% | 2.3 18% | 3.5 -25% | 4.7 -68% |
| Idle Average * (Watt) | 5.3 | 6 -13% | 7.2 -36% | 4.8 9% | 5.3 -0% | 8.2 -55% |
| Idle Maximum * (Watt) | 5.6 | 6.5 -16% | 8.3 -48% | 5 11% | 6.1 -9% | 8.4 -50% |
| Load Average * (Watt) | 39.8 | 36.7 8% | 21.6 46% | 46.2 -16% | 14.9 63% | 36.8 8% |
| Cyberpunk 2077 ultra * (Watt) | 40.2 | 44.8 -11% | 23.1 43% | |||
| Cyberpunk 2077 ultra external monitor * (Watt) | 34.7 | 41.9 -21% | 23.5 32% | |||
| Load Maximum * (Watt) | 68.4 | 66.3 3% | 49.3 28% | 65 5% | 59.9 12% | 49.9 27% |
| Witcher 3 ultra * (Watt) | 40.2 | 32.1 | 30.4 |
* ... smaller is better
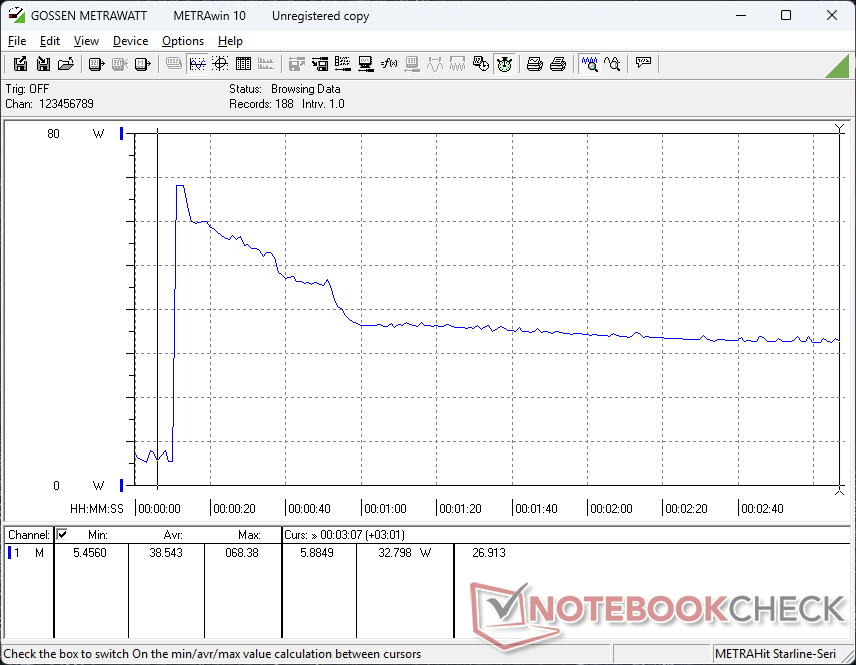
功耗 赛博朋克/压力测试
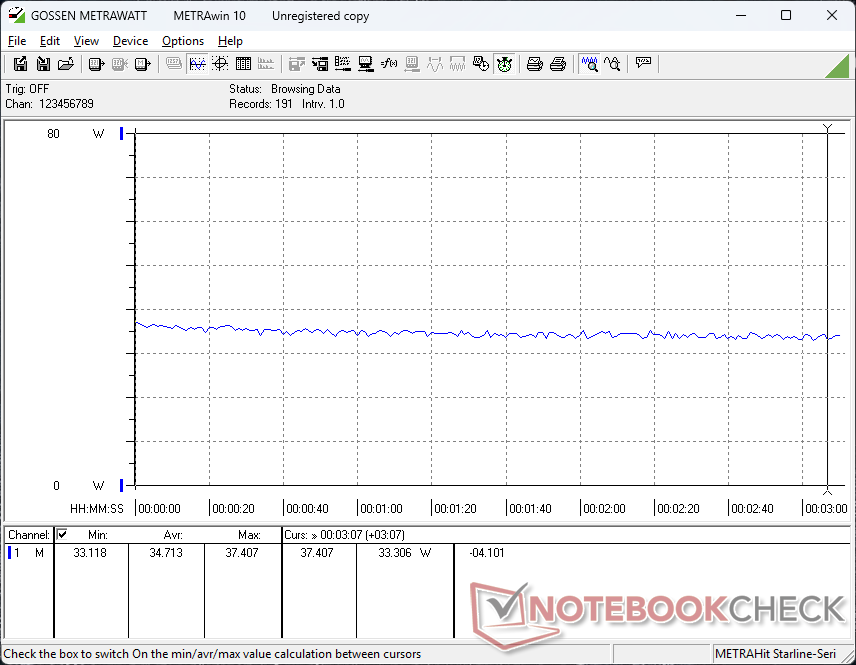
外部显示器功耗
电池寿命
在我们的测试中,电池容量从去年的 51 瓦增至 62 瓦,运行时间延长了几个小时。
| HP EliteBook 8 Flip G1i 13 Ultra 7 265U, Graphics 4-Core iGPU (Arrow Lake), 62 Wh | HP EliteBook x360 830 G10 7L7U1ET i5-1335U, Iris Xe G7 80EUs, 51.3 Wh | Lenovo ThinkPad L13 Yoga G4 21FSS00100 R5 7530U, Vega 7, 46 Wh | MSI Summit E13 AI Evo A1MTG Ultra 7 155H, Arc 8-Core, 70 Wh | Asus ProArt PZ13 HT5306 SD X Plus X1P-42-100, Adreno X1-45 1.7 TFLOPS, 70 Wh | Dell Latitude 9330 i7-1260U, Iris Xe G7 96EUs, 50 Wh | |
|---|---|---|---|---|---|---|
| Battery runtime | -33% | -44% | -31% | 4% | -31% | |
| WiFi v1.3 (h) | 13.7 | 9.2 -33% | 7.7 -44% | 9.5 -31% | 14.2 4% | 9.4 -31% |
| Load (h) | 1.9 | 1.5 | 2.5 | 2.3 | ||
| H.264 (h) | 18.4 | |||||
| Reader / Idle (h) | 15.4 |
笔记本检查评级
EliteBook 8 Flip G1i 13 在不影响功能和耐用性的前提下,大大提高了效率和人体工学设计。
HP EliteBook 8 Flip G1i 13
- 09/11/2025 v8
Allen Ngo
 Total Sustainability Score:
 潜在竞争对手比较
Image | Model / Review | Price | Weight | Height | Display |
|---|---|---|---|---|---|
1. 87.7% 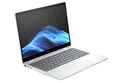 | HP EliteBook 8 Flip G1i 13 Intel Core Ultra 7 265U ⎘ Intel Graphics 4-Core iGPU (Meteor / Arrow Lake) ⎘ 16 GB Memory, 512 GB SSD | Amazon: List Price: 3600 USD | 1.4 kg | 15.5 mm | 13.30" 1920x1200 170 PPI IPS |
2. 89.4% v7 (old)  | HP EliteBook x360 830 G10 7L7U1ET Intel Core i5-1335U ⎘ Intel Iris Xe Graphics G7 80EUs ⎘ 16 GB Memory, 512 GB SSD | Amazon: List Price: 1300 Euro | 1.3 kg | 19.2 mm | 13.30" 1920x1200 170 PPI IPS LED |
3. 88.7% v7 (old) 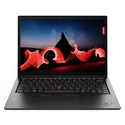 | Lenovo ThinkPad L13 Yoga G4 21FSS00100 AMD Ryzen 5 7530U ⎘ AMD Radeon RX Vega 7 ⎘ 16 GB Memory, 512 GB SSD | Amazon: List Price: 840 Euro | 1.4 kg | 17.1 mm | 13.30" 1920x1200 170 PPI IPS LED |
4. 78.6% 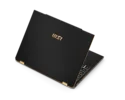 | MSI Summit E13 AI Evo A1MTG Intel Core Ultra 7 155H ⎘ Intel Arc 8-Core iGPU ⎘ 16 GB Memory, 1024 GB SSD | Amazon: List Price: 1100 USD | 1.3 kg | 16.2 mm | 13.30" 1920x1200 170 PPI IPS |
5. 85.3% 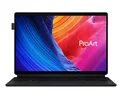 | Asus ProArt PZ13 HT5306 Qualcomm Snapdragon X Plus X1P-42-100 ⎘ Qualcomm SD X Adreno X1-45 1.7 TFLOPS ⎘ 16 GB Memory, 1024 GB SSD | Amazon: 1. $1,209.99 ASUS ProArt PZ13 AI Powered ... 2. $2,159.99 ASUS ProArt PX13 (Replace P1... 3. $1,209.99 ASUS ProArt PZ13 2-in-1 AI L... List Price: 1599€ | 874 g | 9 mm | 13.30" 2880x1800 255 PPI OLED |
6. 89% v7 (old) 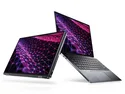 | Dell Latitude 9330 Intel Core i7-1260U ⎘ Intel Iris Xe Graphics G7 96EUs ⎘ 16 GB Memory | Amazon: 1. $999.99 Dell Latitude 9330 2-in-1 La... 2. $499.00 Dell Latitude 7430 14" Lapto... 3. $326.00 Dell Latitude 5430 (Latest M... | 1.2 kg | 14.1 mm | 13.30" 2560x1600 227 PPI IPS |
Transparency
The selection of devices to be reviewed is made by our editorial team. The test sample was provided to the author as a loan by the manufacturer or retailer for the purpose of this review. The lender had no influence on this review, nor did the manufacturer receive a copy of this review before publication. There was no obligation to publish this review. As an independent media company, Notebookcheck is not subjected to the authority of manufacturers, retailers or publishers.
This is how Notebookcheck is testing
Every year, Notebookcheck independently reviews hundreds of laptops and smartphones using standardized procedures to ensure that all results are comparable. We have continuously developed our test methods for around 20 years and set industry standards in the process. In our test labs, high-quality measuring equipment is utilized by experienced technicians and editors. These tests involve a multi-stage validation process. Our complex rating system is based on hundreds of well-founded measurements and benchmarks, which maintains objectivity. Further information on our test methods can be found here.

