戴尔Latitude 7310 Core i7笔记本电脑评测:外观更好,性能更强
Rating | Date | Model | Weight | Height | Size | Resolution | Price |
|---|---|---|---|---|---|---|---|
| 89.4 % v7 (old) | 09 / 2020 | Dell Latitude 7310 i7-10610U, UHD Graphics 620 | 1.2 kg | 18.3 mm | 13.30" | 1920x1080 | |
| 88.8 % v7 (old) | 02 / 2020 | Lenovo ThinkPad X395 R3 PRO 3300U, Vega 6 | 1.3 kg | 16.9 mm | 13.30" | 1920x1080 | |
| 86 % v7 (old) | HP EliteBook 735 G6 7KN29EA R5 PRO 3500U, Vega 8 | 1.5 kg | 17.7 mm | 13.30" | 1920x1080 | ||
| 92.1 % v7 (old) | 07 / 2020 | Apple MacBook Pro 13 2020 2GHz i5 10th-Gen i5-1038NG7, Iris Plus Graphics G7 (Ice Lake 64 EU) | 1.4 kg | 15.6 mm | 13.30" | 2560x1600 | |
| 82.6 % v7 (old) | 09 / 2020 | HP ProBook 455 G7-175W8EA R7 4700U, Vega 7 | 1.8 kg | 19 mm | 15.60" | 1920x1080 |
| SD Card Reader | |
| average JPG Copy Test (av. of 3 runs) | |
| Dell Latitude 7300-P99G (Toshiba Exceria Pro M501 microSDXC 64GB) | |
| Dell Latitude 7310 (Toshiba Exceria Pro M501 64 GB UHS-II) | |
| Lenovo ThinkPad X395 | |
| Asus ZenBook S13 UX392FN (Toshiba Exceria Pro M501 64 GB UHS-II) | |
| maximum AS SSD Seq Read Test (1GB) | |
| Dell Latitude 7310 (Toshiba Exceria Pro M501 64 GB UHS-II) | |
| Dell Latitude 7300-P99G (Toshiba Exceria Pro M501 microSDXC 64GB) | |
| Lenovo ThinkPad X395 | |
| Asus ZenBook S13 UX392FN (Toshiba Exceria Pro M501 64 GB UHS-II) | |
| Networking | |
| iperf3 transmit AX12 | |
| Asus Zephyrus G14 GA401IV | |
| Dell Latitude 7310 | |
| Dell XPS 13 9300 4K UHD | |
| Dell Latitude 7410 | |
| iperf3 receive AX12 | |
| Dell XPS 13 9300 4K UHD | |
| Asus Zephyrus G14 GA401IV | |
| Dell Latitude 7410 | |
| Dell Latitude 7310 | |


| |||||||||||||||||||||||||
Brightness Distribution: 89 %
Center on Battery: 332.7 cd/m²
Contrast: 1331:1 (Black: 0.25 cd/m²)
ΔE ColorChecker Calman: 2.15 | ∀{0.5-29.43 Ø4.73}
calibrated: 1.09
ΔE Greyscale Calman: 2.5 | ∀{0.09-98 Ø4.97}
99.4% sRGB (Argyll 1.6.3 3D)
64.1% AdobeRGB 1998 (Argyll 1.6.3 3D)
72.4% AdobeRGB 1998 (Argyll 3D)
99.3% sRGB (Argyll 3D)
71.8% Display P3 (Argyll 3D)
Gamma: 2.3
CCT: 6347 K
| Dell Latitude 7310 AU Optronics B133HAN, IPS, 13.3", 1920x1080 | Dell Latitude 7300-P99G B133HAK, IPS LED, 13.3", 1920x1080 | Asus ZenBook S13 UX392FN Tianma XM, IPS, 13.9", 1920x1080 | Lenovo ThinkPad X395 LP133WF7-SPB1, IPS, 13.3", 1920x1080 | HP EliteBook 735 G6 7KN29EA CMN139E, IPS LED, 13.3", 1920x1080 | Apple MacBook Pro 13 2020 2GHz i5 10th-Gen APPA03D, IPS, 13.3", 2560x1600 | |
|---|---|---|---|---|---|---|
| Display | -9% | -5% | -8% | -40% | 19% | |
| Display P3 Coverage (%) | 71.8 | 64.6 -10% | 67.5 -6% | 64.1 -11% | 41.53 -42% | 98.8 38% |
| sRGB Coverage (%) | 99.3 | 91.5 -8% | 95.8 -4% | 95.2 -4% | 61.7 -38% | 99.9 1% |
| AdobeRGB 1998 Coverage (%) | 72.4 | 65.5 -10% | 69 -5% | 65.8 -9% | 43 -41% | 86.4 19% |
| Response Times | 5% | -1% | -23% | 8% | -13% | |
| Response Time Grey 50% / Grey 80% * (ms) | 40.8 ? | 39 ? 4% | 47.2 ? -16% | 55 ? -35% | 38 ? 7% | 46 ? -13% |
| Response Time Black / White * (ms) | 28.8 ? | 27 ? 6% | 24.8 ? 14% | 32 ? -11% | 26.4 ? 8% | 32.4 ? -13% |
| PWM Frequency (Hz) | 26040 | 113600 ? | ||||
| Screen | -66% | -0% | -9% | -114% | 17% | |
| Brightness middle (cd/m²) | 332.7 | 341 2% | 466 40% | 356 7% | 294 -12% | 512 54% |
| Brightness (cd/m²) | 329 | 306 -7% | 462 40% | 336 2% | 277 -16% | 491 49% |
| Brightness Distribution (%) | 89 | 79 -11% | 90 1% | 88 -1% | 87 -2% | 91 2% |
| Black Level * (cd/m²) | 0.25 | 0.31 -24% | 0.33 -32% | 0.16 36% | 0.18 28% | 0.32 -28% |
| Contrast (:1) | 1331 | 1100 -17% | 1412 6% | 2225 67% | 1633 23% | 1600 20% |
| Colorchecker dE 2000 * | 2.15 | 6.43 -199% | 1.93 10% | 3.6 -67% | 6.8 -216% | 1.7 21% |
| Colorchecker dE 2000 max. * | 3.89 | 10.33 -166% | 4.26 -10% | 5.5 -41% | 23.8 -512% | 3.4 13% |
| Colorchecker dE 2000 calibrated * | 1.09 | 2.36 -117% | 1.99 -83% | 1.11 -2% | 4.8 -340% | 1 8% |
| Greyscale dE 2000 * | 2.5 | 6.9 -176% | 1.7 32% | 4.7 -88% | 5.9 -136% | 1.9 24% |
| Gamma | 2.3 96% | 2.23 99% | 2.15 102% | 2.92 75% | 1.96 112% | 2.19 100% |
| CCT | 6347 102% | 8338 78% | 6382 102% | 6222 104% | 6979 93% | 6817 95% |
| Color Space (Percent of AdobeRGB 1998) (%) | 64.1 | 59 -8% | 62.2 -3% | 61 -5% | 39.6 -38% | 77.4 21% |
| Color Space (Percent of sRGB) (%) | 99.4 | 91 -8% | 95.7 -4% | 96 -3% | 61.5 -38% | 99.9 1% |
| Total Average (Program / Settings) | -23% /
-47% | -2% /
-1% | -13% /
-10% | -49% /
-85% | 8% /
14% |
* ... smaller is better
Display Response Times
| ↔ Response Time Black to White | ||
|---|---|---|
| 28.8 ms ... rise ↗ and fall ↘ combined | ↗ 14.8 ms rise | 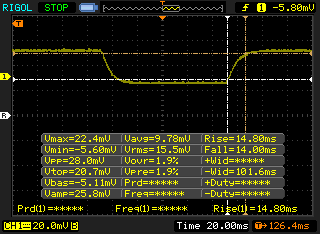 |
| ↘ 14 ms fall | ||
| The screen shows relatively slow response rates in our tests and may be too slow for gamers. In comparison, all tested devices range from 0.1 (minimum) to 240 (maximum) ms. » 76 % of all devices are better. This means that the measured response time is worse than the average of all tested devices (19.9 ms). | ||
| ↔ Response Time 50% Grey to 80% Grey | ||
| 40.8 ms ... rise ↗ and fall ↘ combined | ↗ 22.4 ms rise | 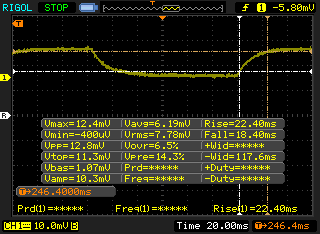 |
| ↘ 18.4 ms fall | ||
| The screen shows slow response rates in our tests and will be unsatisfactory for gamers. In comparison, all tested devices range from 0.165 (minimum) to 636 (maximum) ms. » 64 % of all devices are better. This means that the measured response time is worse than the average of all tested devices (31.1 ms). | ||
Screen Flickering / PWM (Pulse-Width Modulation)
| Screen flickering / PWM not detected | 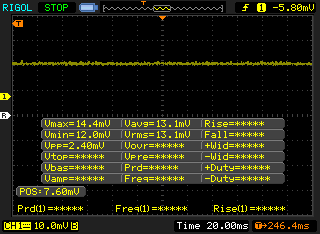 | ||
In comparison: 52 % of all tested devices do not use PWM to dim the display. If PWM was detected, an average of 7798 (minimum: 5 - maximum: 343500) Hz was measured. | |||
Cinebench R15: CPU Multi 64Bit | CPU Single 64Bit
Blender: v2.79 BMW27 CPU
7-Zip 18.03: 7z b 4 -mmt1 | 7z b 4
Geekbench 5.5: Single-Core | Multi-Core
HWBOT x265 Benchmark v2.2: 4k Preset
LibreOffice : 20 Documents To PDF
R Benchmark 2.5: Overall mean
| Cinebench R15 / CPU Multi 64Bit | |
| Dell XPS 13 7390 Core i7-10710U | |
| HP ProBook 455 G7-175W8EA | |
| HP Envy x360 13-ay0010nr | |
| Dell XPS 13 9300 4K UHD | |
| Lenovo ThinkPad X1 Carbon 2020-20UAS04T00 | |
| Dell Latitude 7300-P99G | |
| Dell XPS 13 9300 i5 FHD | |
| Dell XPS 13 9300 i5 FHD | |
| Average Intel Core i7-10610U (548 - 738, n=6) | |
| Acer Swift 3 SF314-42-R27B | |
| Dell Latitude 7310 | |
| HP EliteBook x360 830 G6 | |
| Lenovo ThinkPad L13 Yoga 20R6S00800 | |
| Dell XPS 13 7390 2-in-1 Core i3 | |
| Lenovo ThinkPad 13 20J1005TPB | |
| Cinebench R15 / CPU Single 64Bit | |
| Dell Latitude 7300-P99G | |
| Lenovo ThinkPad X1 Carbon 2020-20UAS04T00 | |
| Dell XPS 13 9300 4K UHD | |
| HP ProBook 455 G7-175W8EA | |
| Dell XPS 13 7390 Core i7-10710U | |
| Dell Latitude 7310 | |
| Average Intel Core i7-10610U (133 - 200, n=6) | |
| HP Envy x360 13-ay0010nr | |
| Dell XPS 13 9300 i5 FHD | |
| Acer Swift 3 SF314-42-R27B | |
| Lenovo ThinkPad L13 Yoga 20R6S00800 | |
| HP EliteBook x360 830 G6 | |
| Dell XPS 13 7390 2-in-1 Core i3 | |
| Lenovo ThinkPad 13 20J1005TPB | |
| Geekbench 5.5 / Single-Core | |
| Dell XPS 13 9300 4K UHD | |
| Dell Latitude 7310 | |
| Dell XPS 13 9300 i5 FHD | |
| Average Intel Core i7-10610U (1155 - 1261, n=6) | |
| Lenovo ThinkPad X1 Carbon 2020-20UAS04T00 | |
| HP ProBook 455 G7-175W8EA | |
| Lenovo ThinkPad L13 Yoga 20R6S00800 | |
| HP Envy x360 13-ay0010nr | |
| Acer Swift 3 SF314-42-R27B | |
| Geekbench 5.5 / Multi-Core | |
| Dell XPS 13 9300 4K UHD | |
| HP ProBook 455 G7-175W8EA | |
| HP Envy x360 13-ay0010nr | |
| Dell XPS 13 9300 i5 FHD | |
| Lenovo ThinkPad L13 Yoga 20R6S00800 | |
| Average Intel Core i7-10610U (3731 - 4622, n=6) | |
| Lenovo ThinkPad X1 Carbon 2020-20UAS04T00 | |
| Dell Latitude 7310 | |
| Acer Swift 3 SF314-42-R27B | |
| LibreOffice / 20 Documents To PDF | |
| HP ProBook 455 G7-175W8EA | |
| Dell XPS 13 9300 4K UHD | |
| Average Intel Core i7-10610U (56.1 - 106, n=6) | |
| Acer Swift 3 SF314-42-R27B | |
| HP Envy x360 13-ay0010nr | |
| Dell Latitude 7310 | |
| Lenovo ThinkPad X1 Carbon 2020-20UAS04T00 | |
| R Benchmark 2.5 / Overall mean | |
| Dell XPS 13 9300 i5 FHD | |
| Average Intel Core i7-10610U (0.637 - 0.855, n=6) | |
| Lenovo ThinkPad L13 Yoga 20R6S00800 | |
| Acer Swift 3 SF314-42-R27B | |
| Dell XPS 13 9300 4K UHD | |
| Lenovo ThinkPad X1 Carbon 2020-20UAS04T00 | |
| Dell Latitude 7310 | |
| HP ProBook 455 G7-175W8EA | |
| HP Envy x360 13-ay0010nr | |
Cinebench R15: CPU Multi 64Bit | CPU Single 64Bit
Blender: v2.79 BMW27 CPU
7-Zip 18.03: 7z b 4 -mmt1 | 7z b 4
Geekbench 5.5: Single-Core | Multi-Core
HWBOT x265 Benchmark v2.2: 4k Preset
LibreOffice : 20 Documents To PDF
R Benchmark 2.5: Overall mean
* ... smaller is better
| PCMark 10 | |
| Score | |
| Dell Latitude 7310 | |
| Average Intel Core i7-10610U, Intel UHD Graphics 620 (4120 - 4437, n=4) | |
| Dell Latitude 7300-P99G | |
| Lenovo ThinkPad X395 | |
| HP EliteBook 735 G6 7KN29EA | |
| Apple MacBook Pro 13 2020 2GHz i5 10th-Gen | |
| Essentials | |
| Dell Latitude 7310 | |
| Dell Latitude 7300-P99G | |
| Average Intel Core i7-10610U, Intel UHD Graphics 620 (8541 - 9667, n=4) | |
| Apple MacBook Pro 13 2020 2GHz i5 10th-Gen | |
| Lenovo ThinkPad X395 | |
| HP EliteBook 735 G6 7KN29EA | |
| Productivity | |
| Dell Latitude 7310 | |
| Average Intel Core i7-10610U, Intel UHD Graphics 620 (6710 - 7607, n=4) | |
| Dell Latitude 7300-P99G | |
| Lenovo ThinkPad X395 | |
| HP EliteBook 735 G6 7KN29EA | |
| Apple MacBook Pro 13 2020 2GHz i5 10th-Gen | |
| Digital Content Creation | |
| Average Intel Core i7-10610U, Intel UHD Graphics 620 (3156 - 3344, n=4) | |
| Apple MacBook Pro 13 2020 2GHz i5 10th-Gen | |
| Dell Latitude 7310 | |
| Lenovo ThinkPad X395 | |
| HP EliteBook 735 G6 7KN29EA | |
| Dell Latitude 7300-P99G | |
| PCMark 8 | |
| Home Score Accelerated v2 | |
| Dell Latitude 7300-P99G | |
| Apple MacBook Pro 13 2020 2GHz i5 10th-Gen | |
| Dell Latitude 7310 | |
| Average Intel Core i7-10610U, Intel UHD Graphics 620 (3334 - 3783, n=4) | |
| HP EliteBook 735 G6 7KN29EA | |
| Lenovo ThinkPad X395 | |
| Work Score Accelerated v2 | |
| Dell Latitude 7310 | |
| Dell Latitude 7300-P99G | |
| Average Intel Core i7-10610U, Intel UHD Graphics 620 (4528 - 5232, n=4) | |
| HP EliteBook 735 G6 7KN29EA | |
| Lenovo ThinkPad X395 | |
| Apple MacBook Pro 13 2020 2GHz i5 10th-Gen | |
| PCMark 8 Home Score Accelerated v2 | 3783 points | |
| PCMark 8 Work Score Accelerated v2 | 5232 points | |
| PCMark 10 Score | 4437 points | |
Help | ||
| DPC Latencies / LatencyMon - interrupt to process latency (max), Web, Youtube, Prime95 | |
| Dell XPS 13 9300 4K UHD | |
| HP EliteBook 735 G6 7KN29EA | |
| Dell XPS 13 9300 i5 FHD | |
| HP Envy x360 13-ay0010nr | |
| HP ProBook 455 G7-175W8EA | |
| Acer Swift 3 SF314-42-R27B | |
| Dell Latitude 7410 | |
| Dell Latitude 7310 | |
* ... smaller is better
| Dell Latitude 7310 Samsung SSD PM981a MZVLB512HBJQ | Dell Latitude 7300-P99G Samsung SSD PM981 MZVLB512HAJQ | Asus ZenBook S13 UX392FN WDC PC SN520 SDAPNUW-512G | HP EliteBook 735 G6 7KN29EA WDC PC SN520 SDAPNUW-256G | Apple MacBook Pro 13 2020 2GHz i5 10th-Gen Apple SSD SM0512F | |
|---|---|---|---|---|---|
| AS SSD | 21% | -4% | -53% | -70% | |
| Seq Read (MB/s) | 2054 | 2749 34% | 1224 -40% | 1499 -27% | 1300 -37% |
| Seq Write (MB/s) | 1575 | 1367 -13% | 907 -42% | 1172 -26% | 1518 -4% |
| 4K Read (MB/s) | 52.1 | 49.94 -4% | 41.46 -20% | 35.42 -32% | 14.09 -73% |
| 4K Write (MB/s) | 137.3 | 137.6 0% | 126.2 -8% | 77.2 -44% | 24.25 -82% |
| 4K-64 Read (MB/s) | 618 | 987 60% | 1021 65% | 463.6 -25% | 725 17% |
| 4K-64 Write (MB/s) | 1317 | 1465 11% | 1251 -5% | 413.3 -69% | 169.6 -87% |
| Access Time Read * (ms) | 0.044 | 0.042 5% | 0.053 -20% | 0.133 -202% | 0.172 -291% |
| Access Time Write * (ms) | 0.083 | 0.029 65% | 0.027 67% | 0.049 41% | 0.155 -87% |
| Score Read (Points) | 876 | 1312 50% | 1185 35% | 649 -26% | 869 -1% |
| Score Write (Points) | 1611 | 1739 8% | 1468 -9% | 608 -62% | 346 -79% |
| Score Total (Points) | 2927 | 3662 25% | 3250 11% | 1582 -46% | 1667 -43% |
| Copy ISO MB/s (MB/s) | 2297 | 2761 20% | 1404 -39% | 1249 -46% | |
| Copy Program MB/s (MB/s) | 540 | 622 15% | 402.4 -25% | 53.5 -90% | |
| Copy Game MB/s (MB/s) | 1288 | 1584 23% | 902 -30% | 201.3 -84% | |
| CrystalDiskMark 5.2 / 6 | 2% | -14% | -41% | -38% | |
| Write 4K (MB/s) | 135.2 | 141.1 4% | 149.2 10% | 116 -14% | 28.16 -79% |
| Read 4K (MB/s) | 50.7 | 46.37 -9% | 47.18 -7% | 39.81 -21% | 17.5 -65% |
| Write Seq (MB/s) | 2155 | 1994 -7% | 750 -65% | 1300 -40% | 1195 -45% |
| Read Seq (MB/s) | 2504 | 2275 -9% | 1137 -55% | 803 -68% | 1470 -41% |
| Write 4K Q32T1 (MB/s) | 395.6 | 493.3 25% | 749 89% | 187.6 -53% | 205 -48% |
| Read 4K Q32T1 (MB/s) | 394.5 | 429 9% | 478.7 21% | 305.9 -22% | 692 75% |
| Write Seq Q32T1 (MB/s) | 2987 | 2992 0% | 1453 -51% | 1299 -57% | 1475 -51% |
| Read Seq Q32T1 (MB/s) | 3564 | 3562 0% | 1713 -52% | 1741 -51% | 1920 -46% |
| Write 4K Q8T8 (MB/s) | 409.1 | ||||
| Read 4K Q8T8 (MB/s) | 1137 | ||||
| Total Average (Program / Settings) | 12% /
14% | -9% /
-8% | -47% /
-48% | -54% /
-56% |
* ... smaller is better

Disk Throttling: DiskSpd Read Loop, Queue Depth 8
| 3DMark 11 Performance | 2197 points | |
| 3DMark Cloud Gate Standard Score | 8989 points | |
| 3DMark Fire Strike Score | 1209 points | |
| 3DMark Time Spy Score | 476 points | |
Help | ||
| low | med. | high | ultra | |
|---|---|---|---|---|
| The Witcher 3 (2015) | 20.7 | 10.9 | ||
| Dota 2 Reborn (2015) | 84.5 | 49.3 | 22.8 | 20.3 |
| X-Plane 11.11 (2018) | 13.2 | 10.7 | 11.2 |
| Dell Latitude 7310 UHD Graphics 620, i7-10610U, Samsung SSD PM981a MZVLB512HBJQ | Dell Latitude 7300-P99G UHD Graphics 620, i7-8665U, Samsung SSD PM981 MZVLB512HAJQ | Asus ZenBook S13 UX392FN GeForce MX150, i7-8565U, WDC PC SN520 SDAPNUW-512G | Lenovo ThinkPad X395 Vega 6, R3 PRO 3300U, Samsung SSD PM981a MZVLB256HBHQ | HP EliteBook 735 G6 7KN29EA Vega 8, R5 PRO 3500U, WDC PC SN520 SDAPNUW-256G | Apple MacBook Pro 13 2020 2GHz i5 10th-Gen Iris Plus Graphics G7 (Ice Lake 64 EU), i5-1038NG7, Apple SSD SM0512F | |
|---|---|---|---|---|---|---|
| Noise | -2% | -5% | -2% | -1% | -4% | |
| off / environment * (dB) | 29 | 30 -3% | 28.1 3% | 30.2 -4% | 29.6 -2% | 29.6 -2% |
| Idle Minimum * (dB) | 29 | 30 -3% | 28.1 3% | 30.2 -4% | 29.6 -2% | 29.6 -2% |
| Idle Average * (dB) | 29 | 30 -3% | 28.1 3% | 30.2 -4% | 29.6 -2% | 29.6 -2% |
| Idle Maximum * (dB) | 29 | 30 -3% | 29 -0% | 30.2 -4% | 30.9 -7% | 29.6 -2% |
| Load Average * (dB) | 30.1 | 35 -16% | 41.1 -37% | 34.3 -14% | 33.9 -13% | 34.4 -14% |
| Load Maximum * (dB) | 41.3 | 35 15% | 41.1 -0% | 34.3 17% | 33.9 18% | 42.1 -2% |
| Witcher 3 ultra * (dB) | 41.1 | 36.1 |
* ... smaller is better
Noise level
| Idle |
| 29 / 29 / 29 dB(A) |
| Load |
| 30.1 / 41.3 dB(A) |
 | ||
30 dB silent 40 dB(A) audible 50 dB(A) loud |
||
min: | ||
(-) The maximum temperature on the upper side is 45.2 °C / 113 F, compared to the average of 34.3 °C / 94 F, ranging from 21.2 to 62.5 °C for the class Office.
(-) The bottom heats up to a maximum of 52.8 °C / 127 F, compared to the average of 36.8 °C / 98 F
(+) In idle usage, the average temperature for the upper side is 26.3 °C / 79 F, compared to the device average of 29.5 °C / 85 F.
(+) The palmrests and touchpad are cooler than skin temperature with a maximum of 27.2 °C / 81 F and are therefore cool to the touch.
(±) The average temperature of the palmrest area of similar devices was 27.5 °C / 81.5 F (+0.3 °C / 0.5 F).
Dell Latitude 7310 audio analysis
(+) | speakers can play relatively loud (84 dB)
Bass 100 - 315 Hz
(-) | nearly no bass - on average 16.2% lower than median
(±) | linearity of bass is average (11.5% delta to prev. frequency)
Mids 400 - 2000 Hz
(+) | balanced mids - only 2.8% away from median
(+) | mids are linear (4.4% delta to prev. frequency)
Highs 2 - 16 kHz
(+) | balanced highs - only 2.5% away from median
(+) | highs are linear (4% delta to prev. frequency)
Overall 100 - 16.000 Hz
(+) | overall sound is linear (12.4% difference to median)
Compared to same class
» 5% of all tested devices in this class were better, 2% similar, 93% worse
» The best had a delta of 7%, average was 21%, worst was 53%
Compared to all devices tested
» 11% of all tested devices were better, 2% similar, 87% worse
» The best had a delta of 4%, average was 24%, worst was 134%
Apple MacBook 12 (Early 2016) 1.1 GHz audio analysis
(+) | speakers can play relatively loud (83.6 dB)
Bass 100 - 315 Hz
(±) | reduced bass - on average 11.3% lower than median
(±) | linearity of bass is average (14.2% delta to prev. frequency)
Mids 400 - 2000 Hz
(+) | balanced mids - only 2.4% away from median
(+) | mids are linear (5.5% delta to prev. frequency)
Highs 2 - 16 kHz
(+) | balanced highs - only 2% away from median
(+) | highs are linear (4.5% delta to prev. frequency)
Overall 100 - 16.000 Hz
(+) | overall sound is linear (10.2% difference to median)
Compared to same class
» 7% of all tested devices in this class were better, 2% similar, 91% worse
» The best had a delta of 5%, average was 18%, worst was 53%
Compared to all devices tested
» 5% of all tested devices were better, 1% similar, 94% worse
» The best had a delta of 4%, average was 24%, worst was 134%
| Off / Standby | |
| Idle | |
| Load |
|
Key:
min: | |
| Dell Latitude 7310 i7-10610U, UHD Graphics 620, Samsung SSD PM981a MZVLB512HBJQ, IPS, 1920x1080, 13.3" | Dell Latitude 7300-P99G i7-8665U, UHD Graphics 620, Samsung SSD PM981 MZVLB512HAJQ, IPS LED, 1920x1080, 13.3" | Asus ZenBook S13 UX392FN i7-8565U, GeForce MX150, WDC PC SN520 SDAPNUW-512G, IPS, 1920x1080, 13.9" | Lenovo ThinkPad X395 R3 PRO 3300U, Vega 6, Samsung SSD PM981a MZVLB256HBHQ, IPS, 1920x1080, 13.3" | HP EliteBook 735 G6 7KN29EA R5 PRO 3500U, Vega 8, WDC PC SN520 SDAPNUW-256G, IPS LED, 1920x1080, 13.3" | Apple MacBook Pro 13 2020 2GHz i5 10th-Gen i5-1038NG7, Iris Plus Graphics G7 (Ice Lake 64 EU), Apple SSD SM0512F, IPS, 2560x1600, 13.3" | |
|---|---|---|---|---|---|---|
| Power Consumption | -26% | -46% | -29% | -53% | -60% | |
| Idle Minimum * (Watt) | 2.7 | 2.5 7% | 3.4 -26% | 4 -48% | 5.6 -107% | 3.8 -41% |
| Idle Average * (Watt) | 4.4 | 6.6 -50% | 6.3 -43% | 6.3 -43% | 8.1 -84% | 8.6 -95% |
| Idle Maximum * (Watt) | 4.8 | 8.7 -81% | 10.4 -117% | 9.3 -94% | 9.6 -100% | 10.3 -115% |
| Load Average * (Watt) | 33.4 | 35.4 -6% | 51 -53% | 34 -2% | 34.3 -3% | 52.1 -56% |
| Load Maximum * (Watt) | 69.7 | 68.1 2% | 62.7 10% | 42 40% | 48.6 30% | 65.2 6% |
| Witcher 3 ultra * (Watt) | 39 | 48.2 |
* ... smaller is better
| Dell Latitude 7310 i7-10610U, UHD Graphics 620, 52 Wh | Dell Latitude 7300-P99G i7-8665U, UHD Graphics 620, 60 Wh | Asus ZenBook S13 UX392FN i7-8565U, GeForce MX150, 50 Wh | Lenovo ThinkPad X395 R3 PRO 3300U, Vega 6, 48 Wh | HP EliteBook 735 G6 7KN29EA R5 PRO 3500U, Vega 8, 50 Wh | Apple MacBook Pro 13 2020 2GHz i5 10th-Gen i5-1038NG7, Iris Plus Graphics G7 (Ice Lake 64 EU), 58 Wh | |
|---|---|---|---|---|---|---|
| Battery runtime | -4% | -21% | 16% | -35% | -4% | |
| Reader / Idle (h) | 37.4 | 28.5 -24% | 18.4 -51% | |||
| WiFi v1.3 (h) | 12.6 | 10.8 -14% | 8.4 -33% | 10.9 -13% | 8.2 -35% | 12.1 -4% |
| Load (h) | 1.8 | 1.9 6% | 1.7 -6% | 3.8 111% |
Pros
Cons
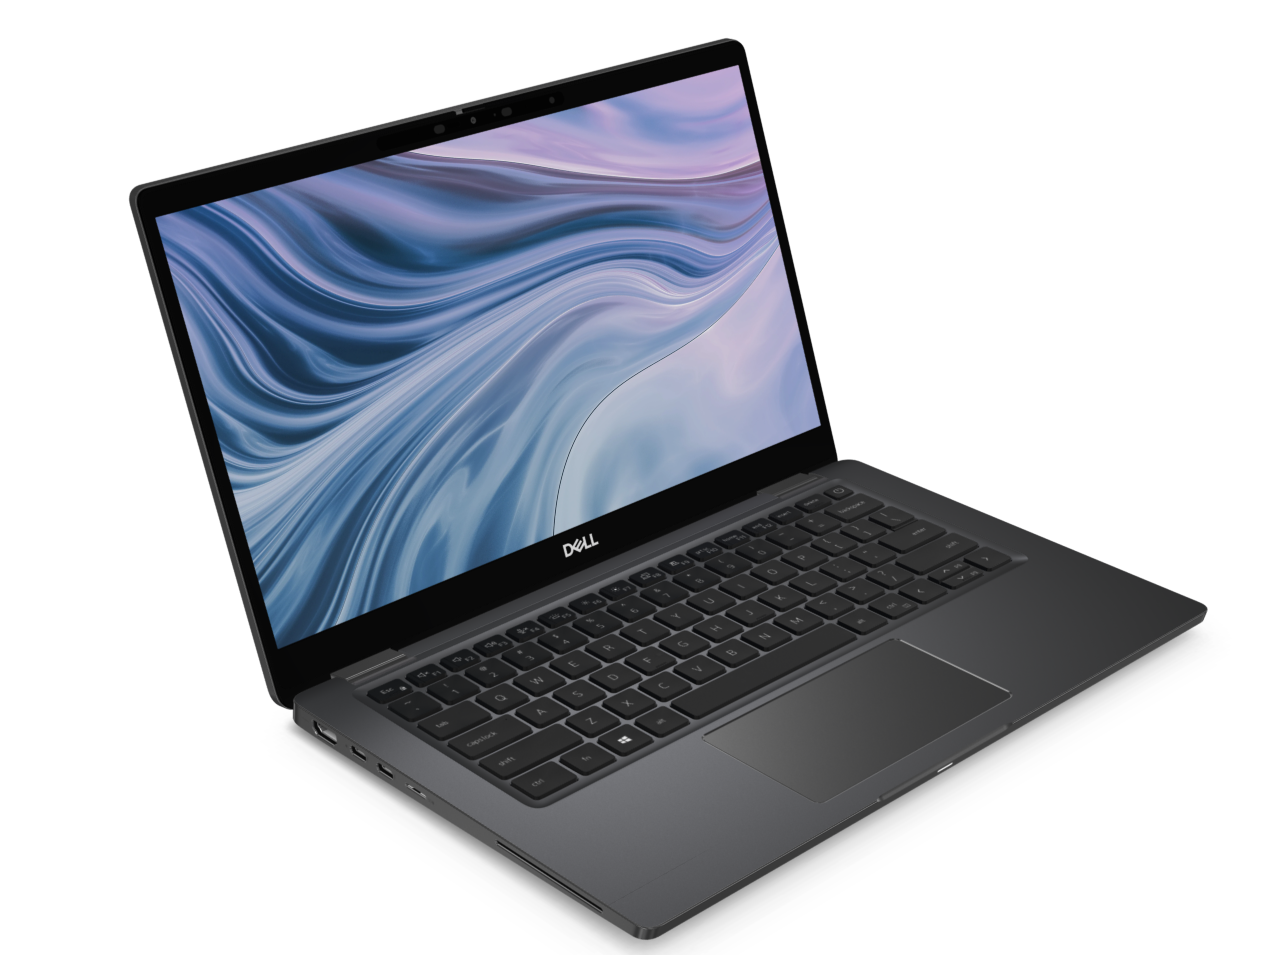
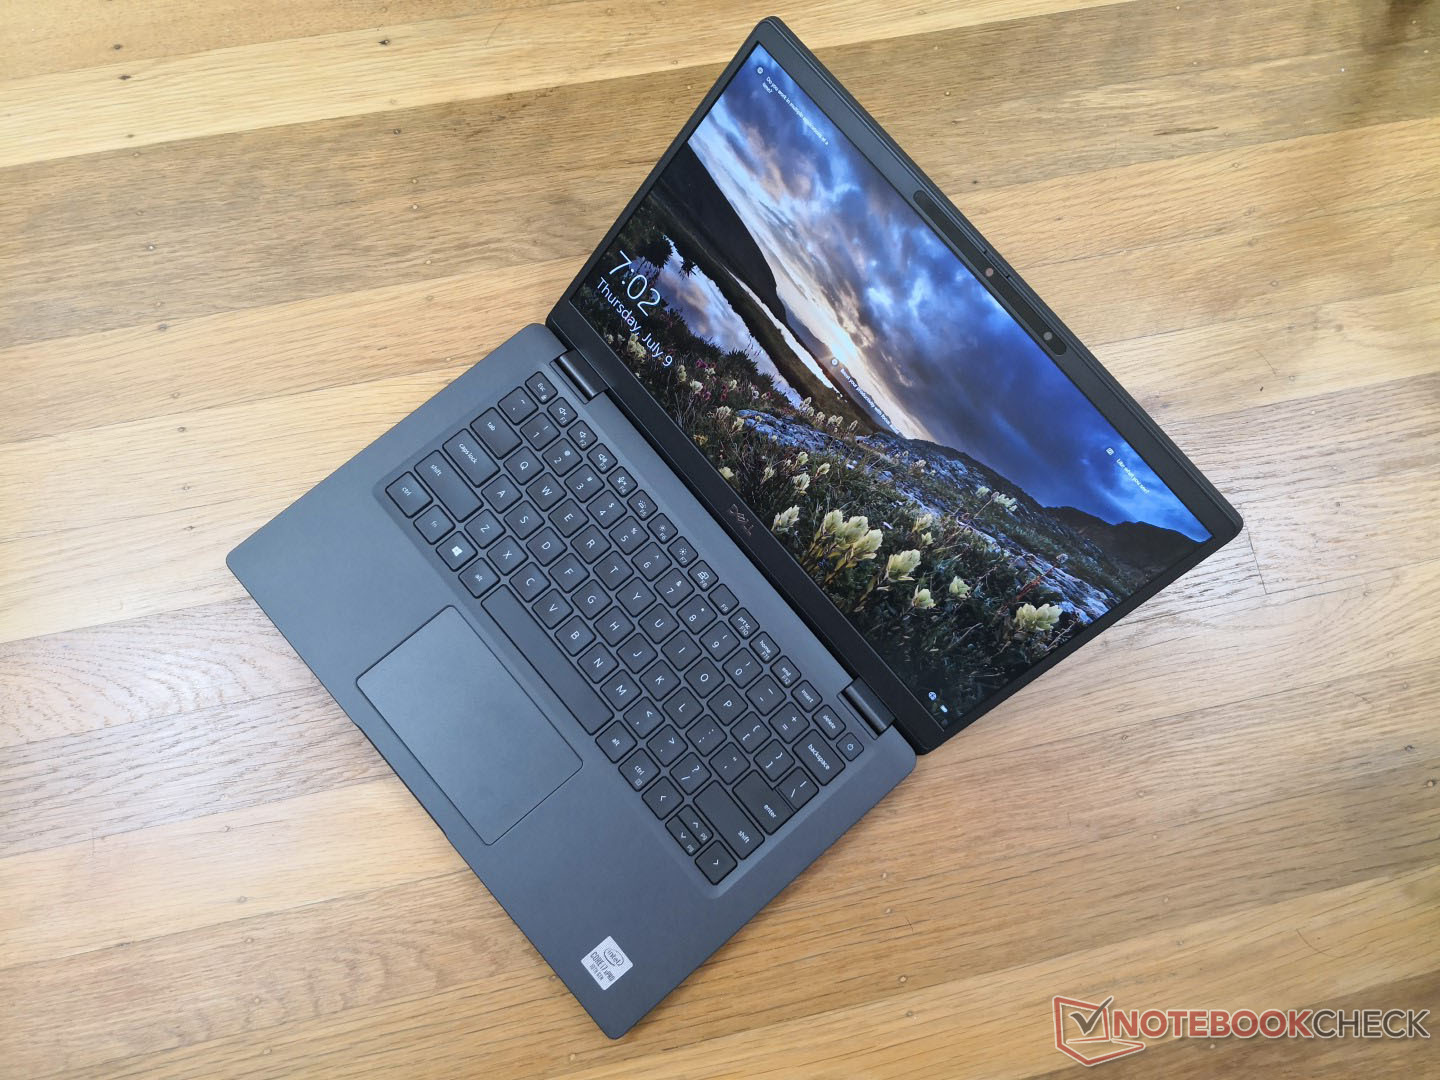
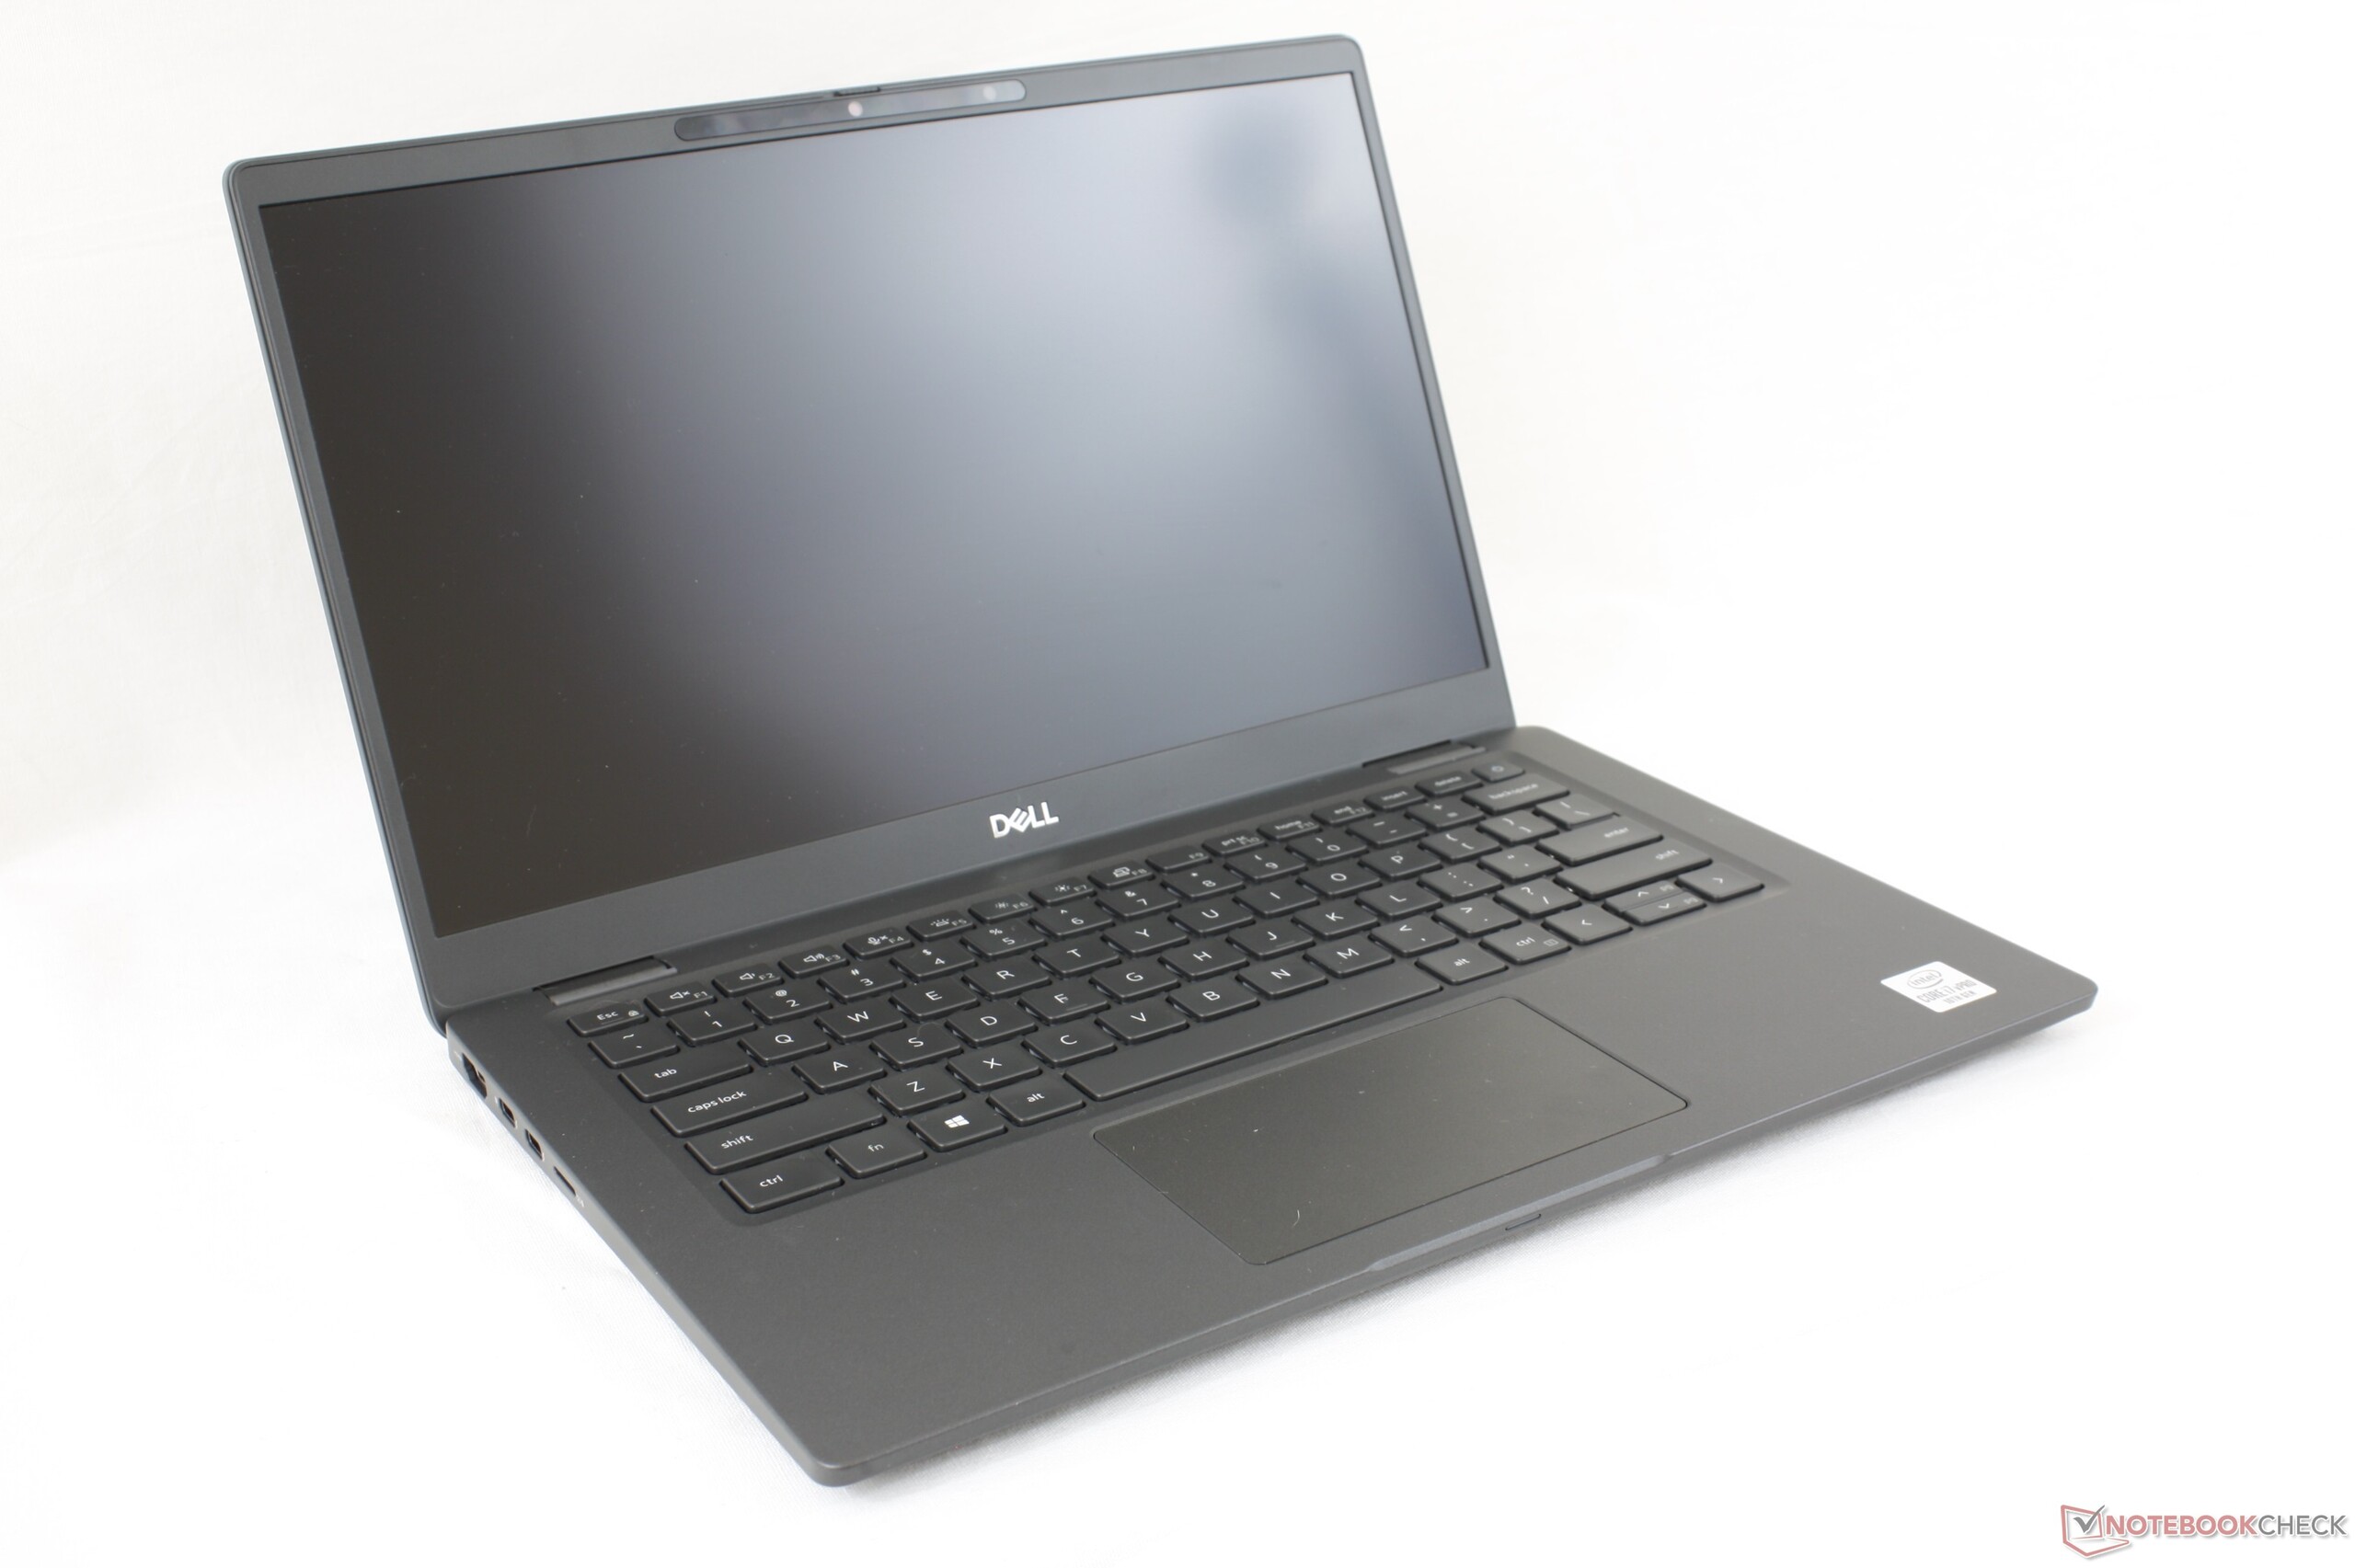
好像去年的Latitude 7300不够紧凑,Latitude 7310现在变得更小,更轻,更谨慎,几乎可以适应任何办公室或工作环境。除了较软的Clickpad之外,戴尔最新的高端超极本不容小觑。
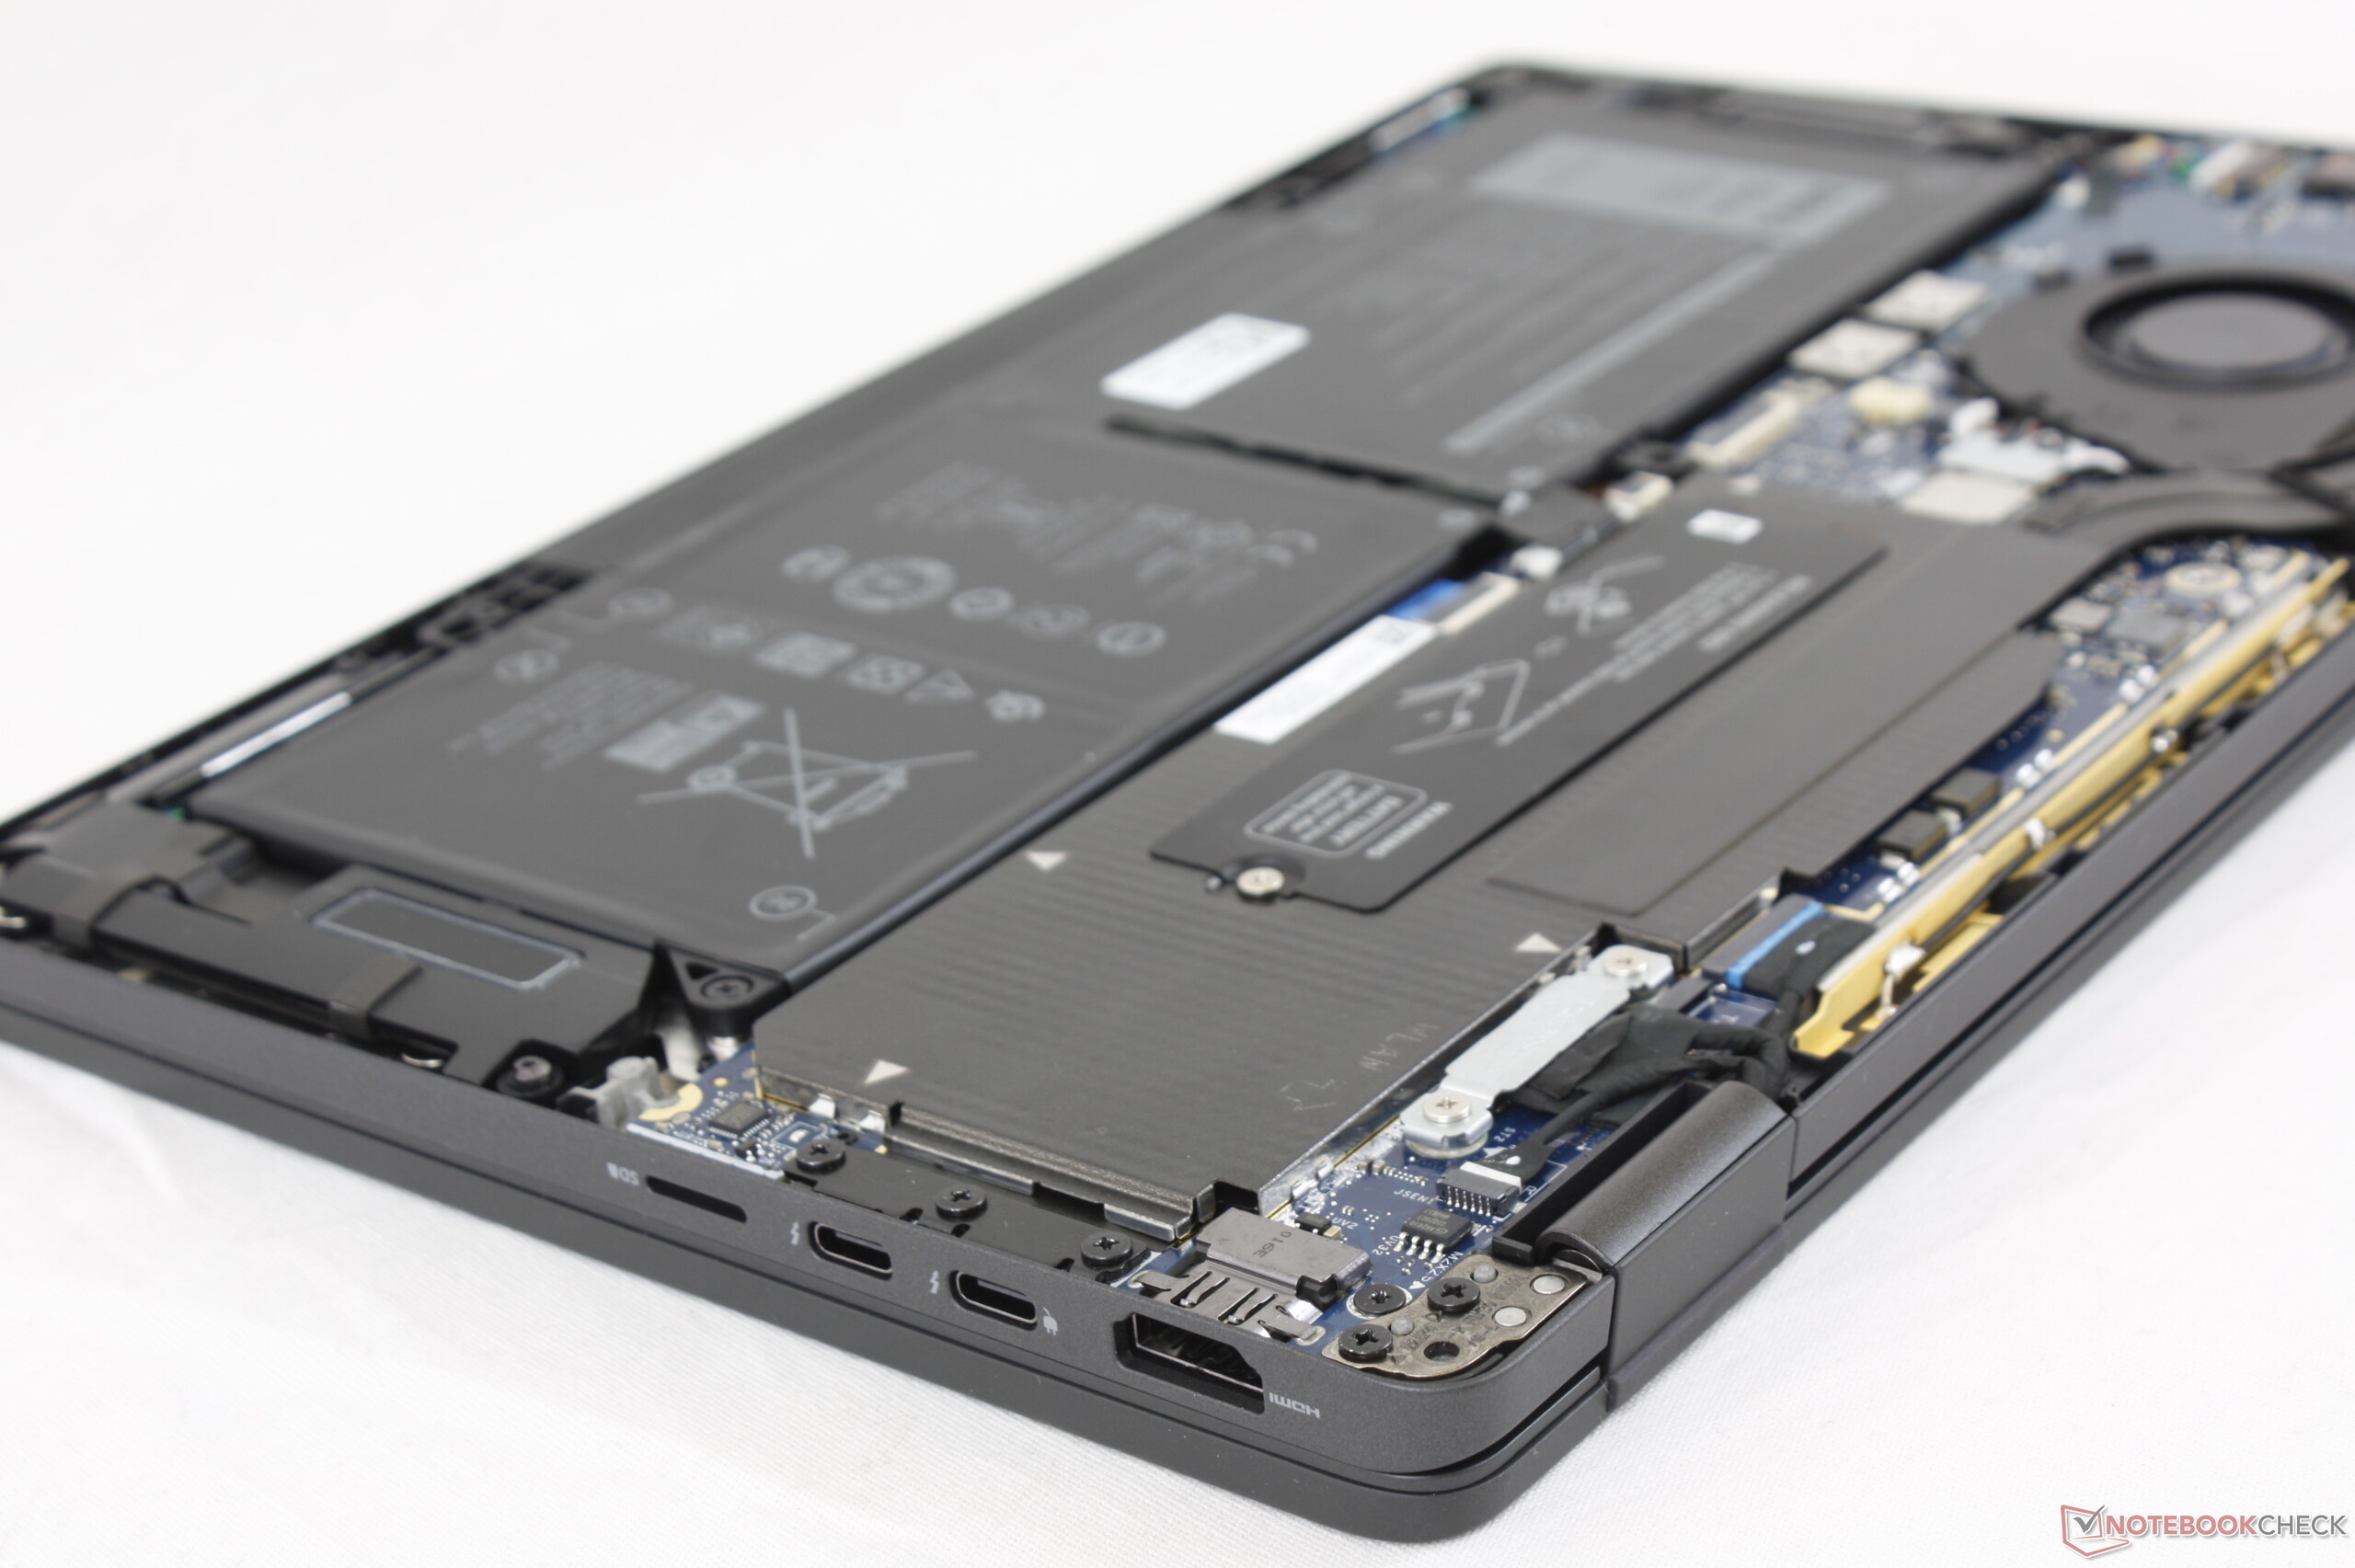
更困扰我们的是缺少某些功能。我想到了TrackPoint和专用的鼠标键,这绝对会使单击和光标控制变得更加容易和准确。仍希望使用触觉鼠标按键以及可升级的RAM和WLAN的用户仍然有充分的理由选择Latitude 7300而不是7310。此外,更明亮的500 nit或更大的显示选项将使笔记本电脑成为更好的户外或旅行伴侣。
四核Comet Lake-U之外缺少更好的处理器选项这一缺点也变得越来越明显。尽管笔记本电脑并非针对高性能用户,但竞争对手开始在相同或相似的功率范围内提供更快的AMD锐龙CPU,以实现更高的每瓦性能。 Latitude 7300的性能几乎与Latitude 7310相同,这一事实也无济于事。
Latitude 7310是Latitude 7300的改进版本。它放弃了几个功能,但是更时尚,更便携的设计可能对于不断在路上的旅行者或商务用户而言是值得的。
Dell Latitude 7310
- 07/13/2020 v7 (old)
Allen Ngo
Price comparison

