Latitude 5320的回顾。戴尔破坏了鼠标的更换

戴尔的Latitude 5000系列以中档商务笔记本电脑为代表。新的后代被称为Latitude 5320,它是5310的继任者。 Latitude 5310而且与前代产品相比,它在外观上几乎没有变化。戴尔主要用Tiger Lake 型号取代了Comet Lake处理器。然而,在连接方面也有重大变化,包括出现了Thunderbolt 4。然而,一些降级并不能让每个买家满意。关键词:点击板和工作存储器。
在800欧元到1000欧元之间的竞争者领域是很大的。联想的L系列的ThinkPads是Latitude ,其主要竞争对手是商务设备。ThinkBooks没有提供相当多的连接性,但由于价格较低,可以成为预算客户的一个选择。Latitude 5320能在这场激烈的竞争中保持自己的地位吗?我们的测试提供了答案。
潜在的竞争对手比较
Rating | Date | Model | Weight | Height | Size | Resolution | Price |
|---|---|---|---|---|---|---|---|
| 84.1 % v7 (old) | 03 / 2022 | Dell Latitude 5320-TM4V2 i5-1135G7, Iris Xe G7 80EUs | 1.3 kg | 17 mm | 13.30" | 1920x1080 | |
| 87.2 % v7 (old) | Dell Latitude 5310-23VP6 i5-10310U, UHD Graphics 620 | 1.3 kg | 19.7 mm | 13.30" | 1920x1080 | ||
| 87.8 % v7 (old) | 01 / 2022 | Lenovo ThinkBook 13s G3 20YA0005GE R7 5800U, Vega 8 | 1.3 kg | 14.9 mm | 13.30" | 1920x1200 | |
| 87.5 % v7 (old) | 03 / 2022 | Lenovo ThinkPad L13 Gen2-21AB000PGE R5 PRO 5650U, Vega 7 | 1.4 kg | 17.6 mm | 13.30" | 1920x1080 | |
| 85.6 % v7 (old) | 12 / 2021 | Lenovo ThinkPad L14 G2-20X1003WGE i5-1135G7, Iris Xe G7 80EUs | 1.7 kg | 19 mm | 14.00" | 1920x1080 | |
| 85.3 % v7 (old) | 01 / 2022 | Acer TravelMate P4 TMP414-51-59MR i5-1135G7, Iris Xe G7 80EUs | 1.4 kg | 17.9 mm | 14.00" | 1920x1080 | |
| 83.6 % v7 (old) | Lenovo ThinkBook 14 G2 ITL 20VDS02G00 i3-1115G4, UHD Graphics Xe G4 48EUs | 1.5 kg | 17.9 mm | 14.00" | 1920x1080 |
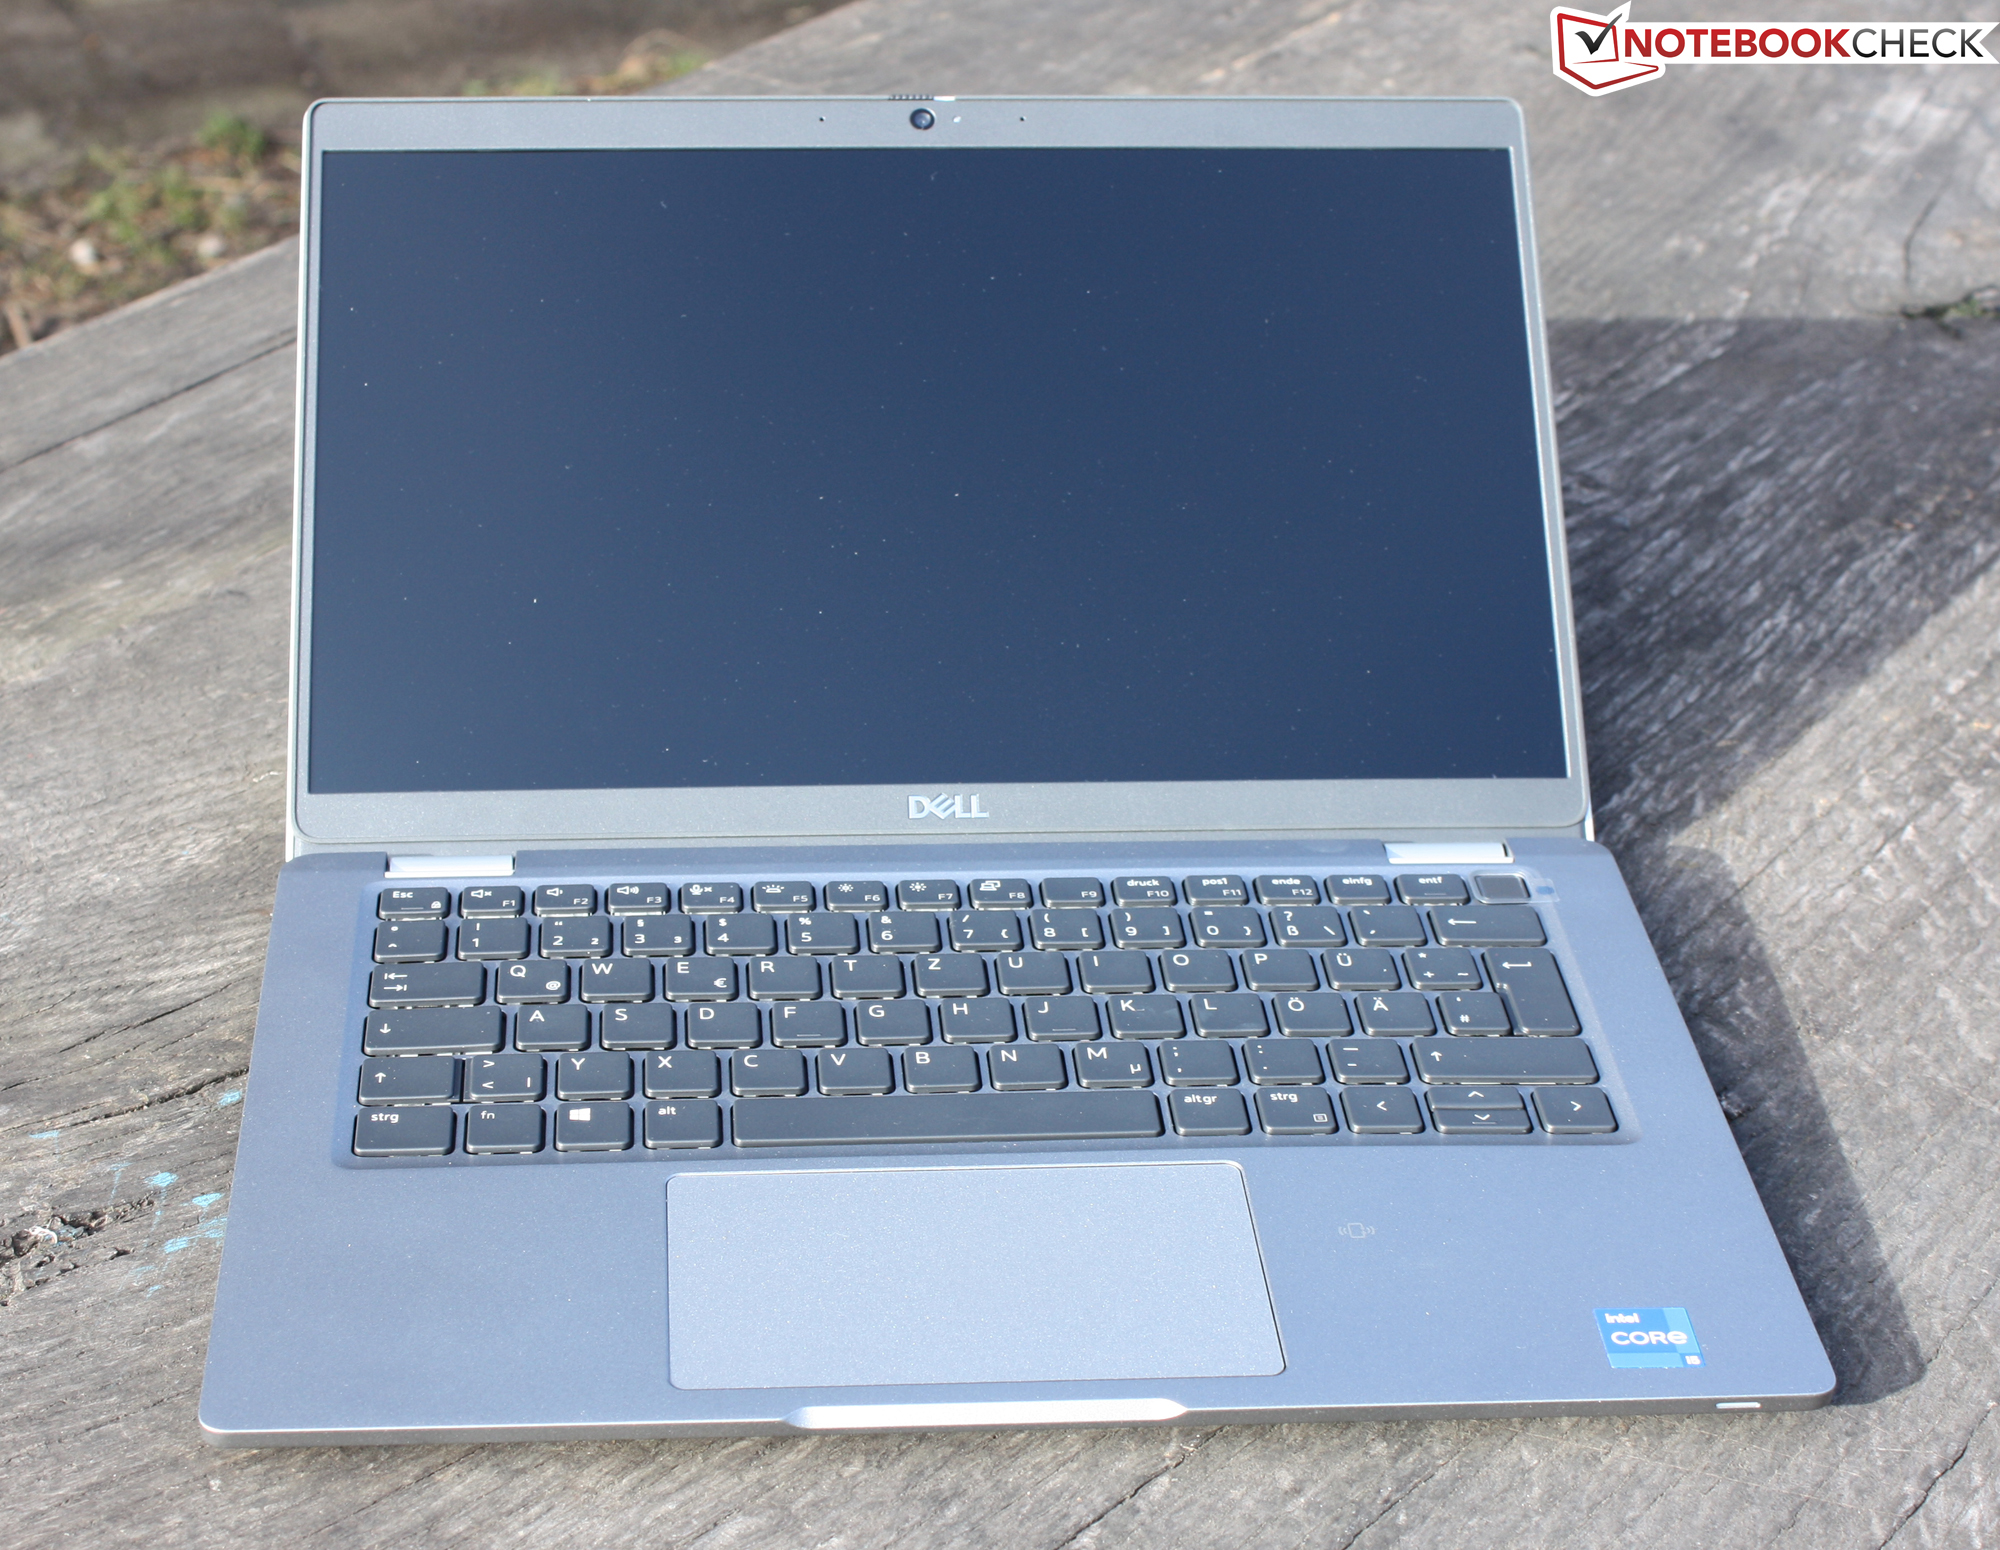
外壳 - 笔记本电脑外壳可以更稳定
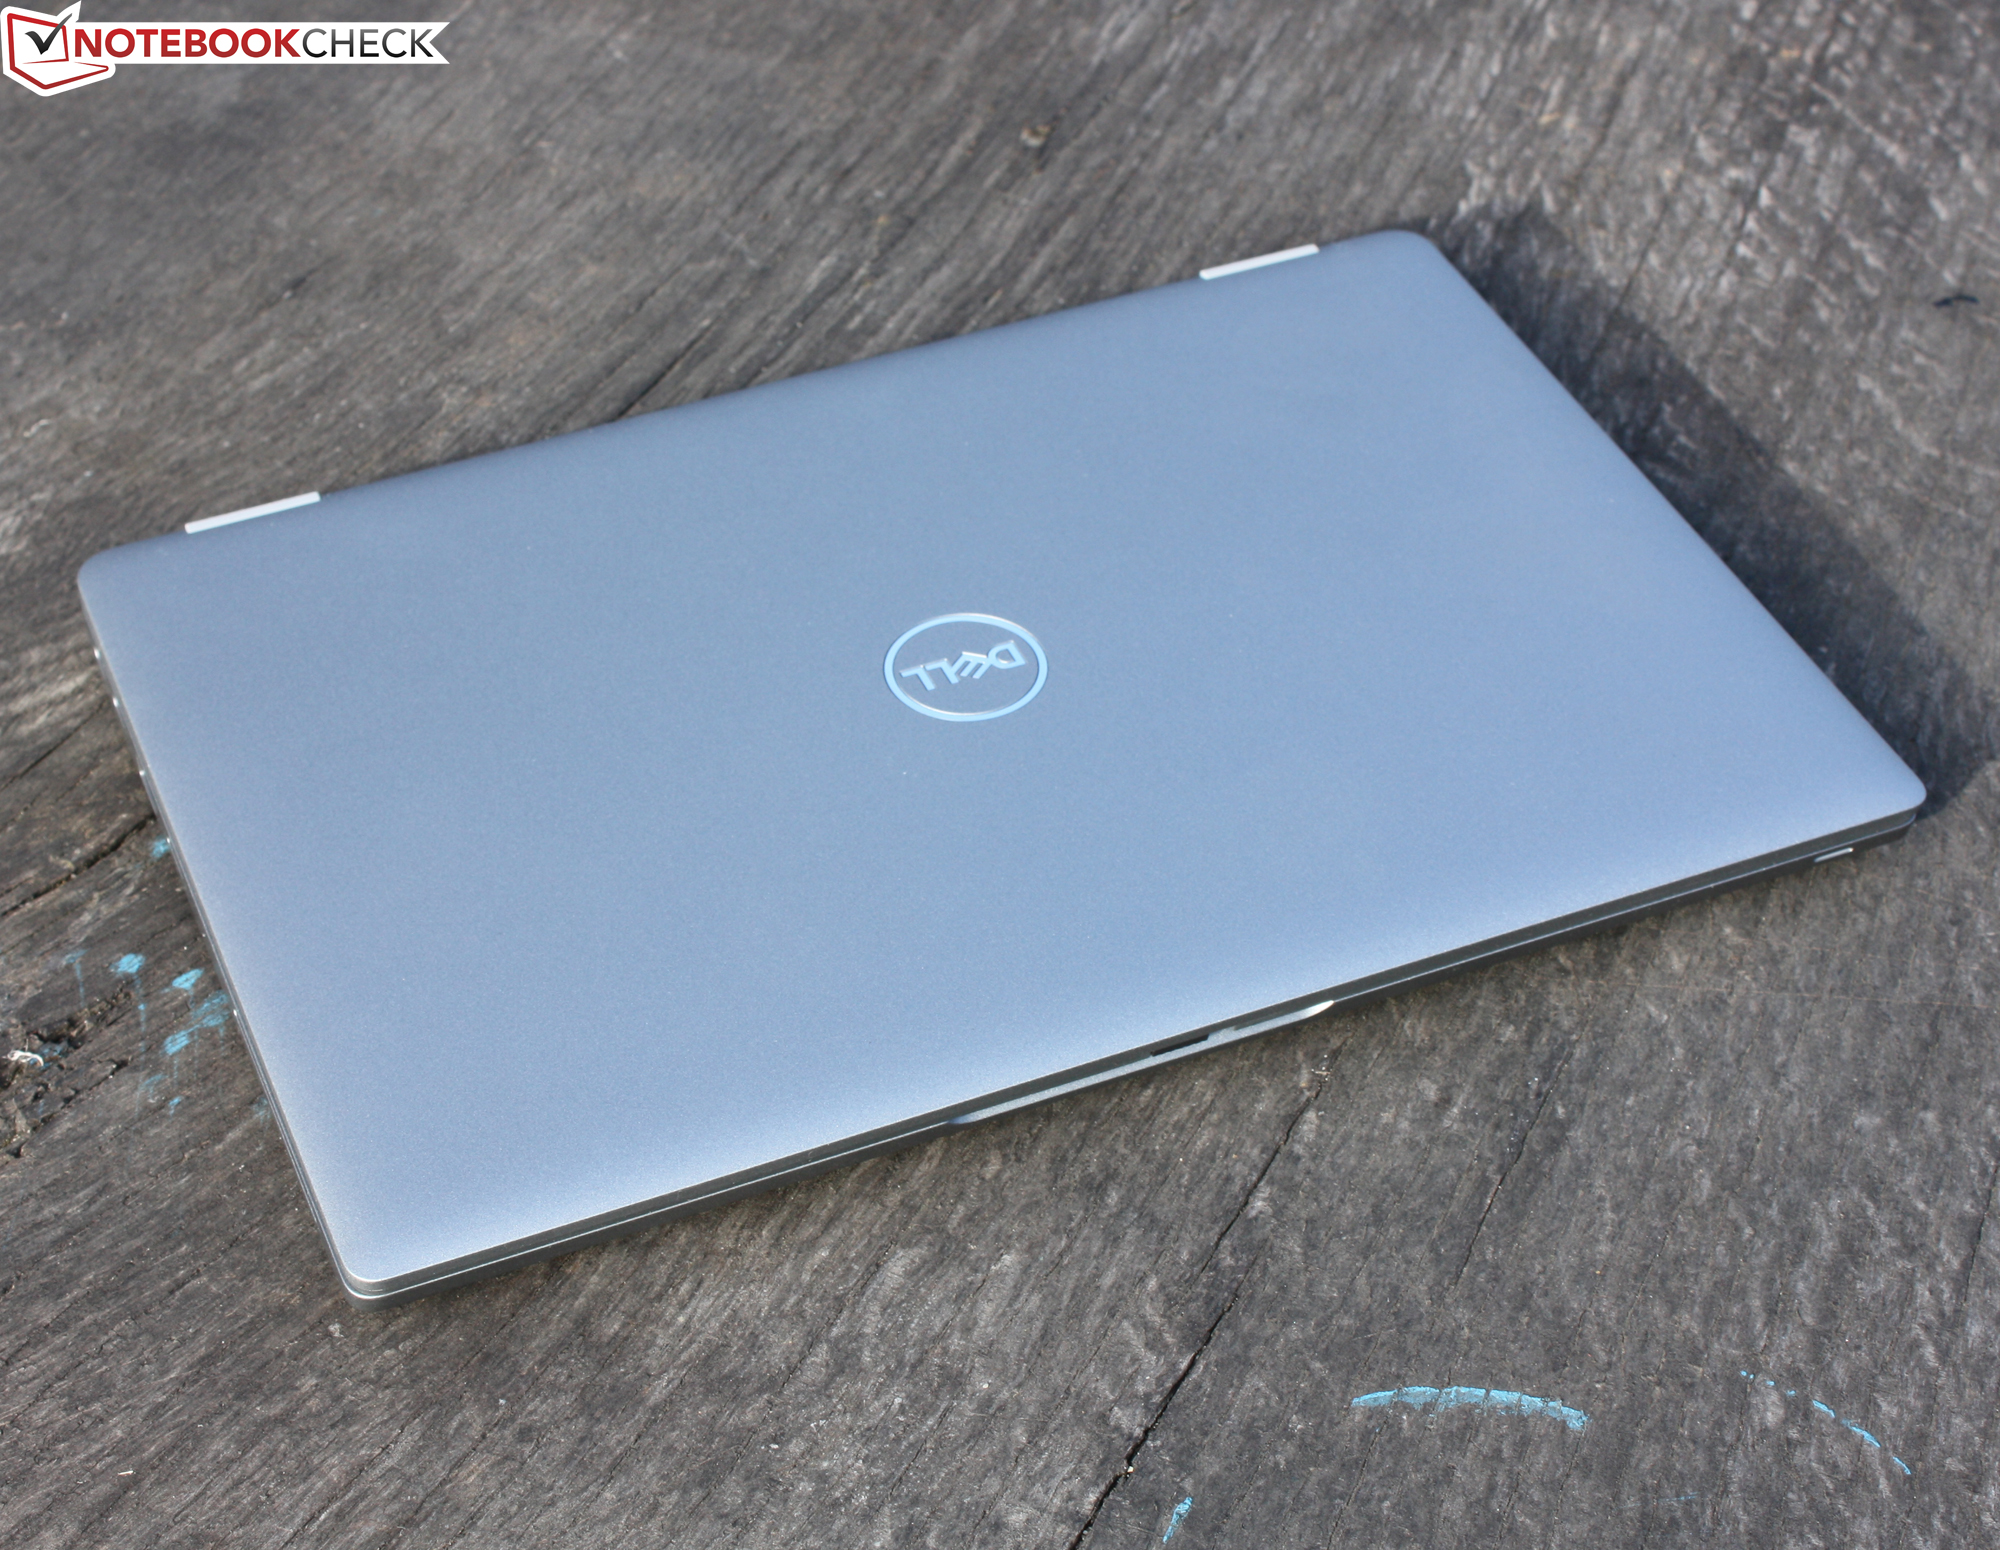
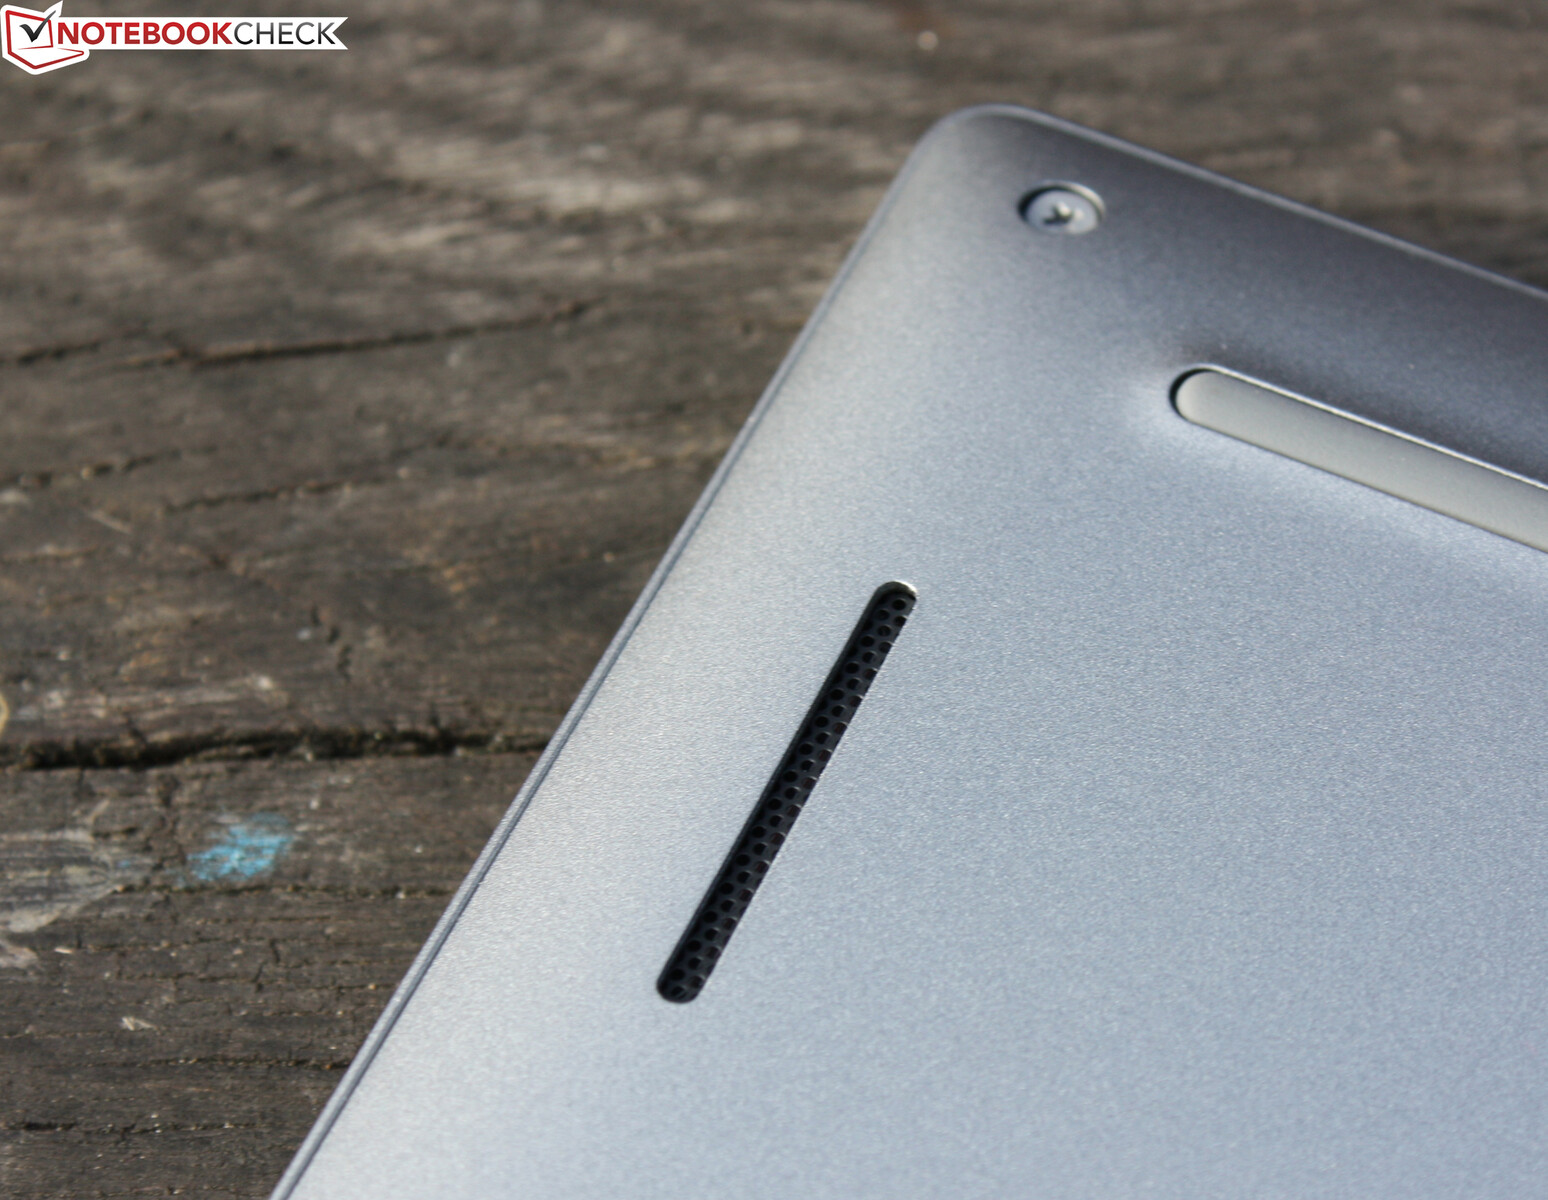
Latitude 5320的技术已被装入一个别致的金属外壳,没有任何修饰。银灰色的机箱及其设计语言与前代产品相同。然而,端口已被改变,底座上的独立电源按钮已被省略。黑色显示屏边框在网络摄像头所在的顶部相当宽,这是宽屏显示屏的结果。显示屏边框周围的环形硬橡胶唇,干净地躺在底座上,做得很好。这可以防止沙子或灰尘在运输过程中进入缝隙。
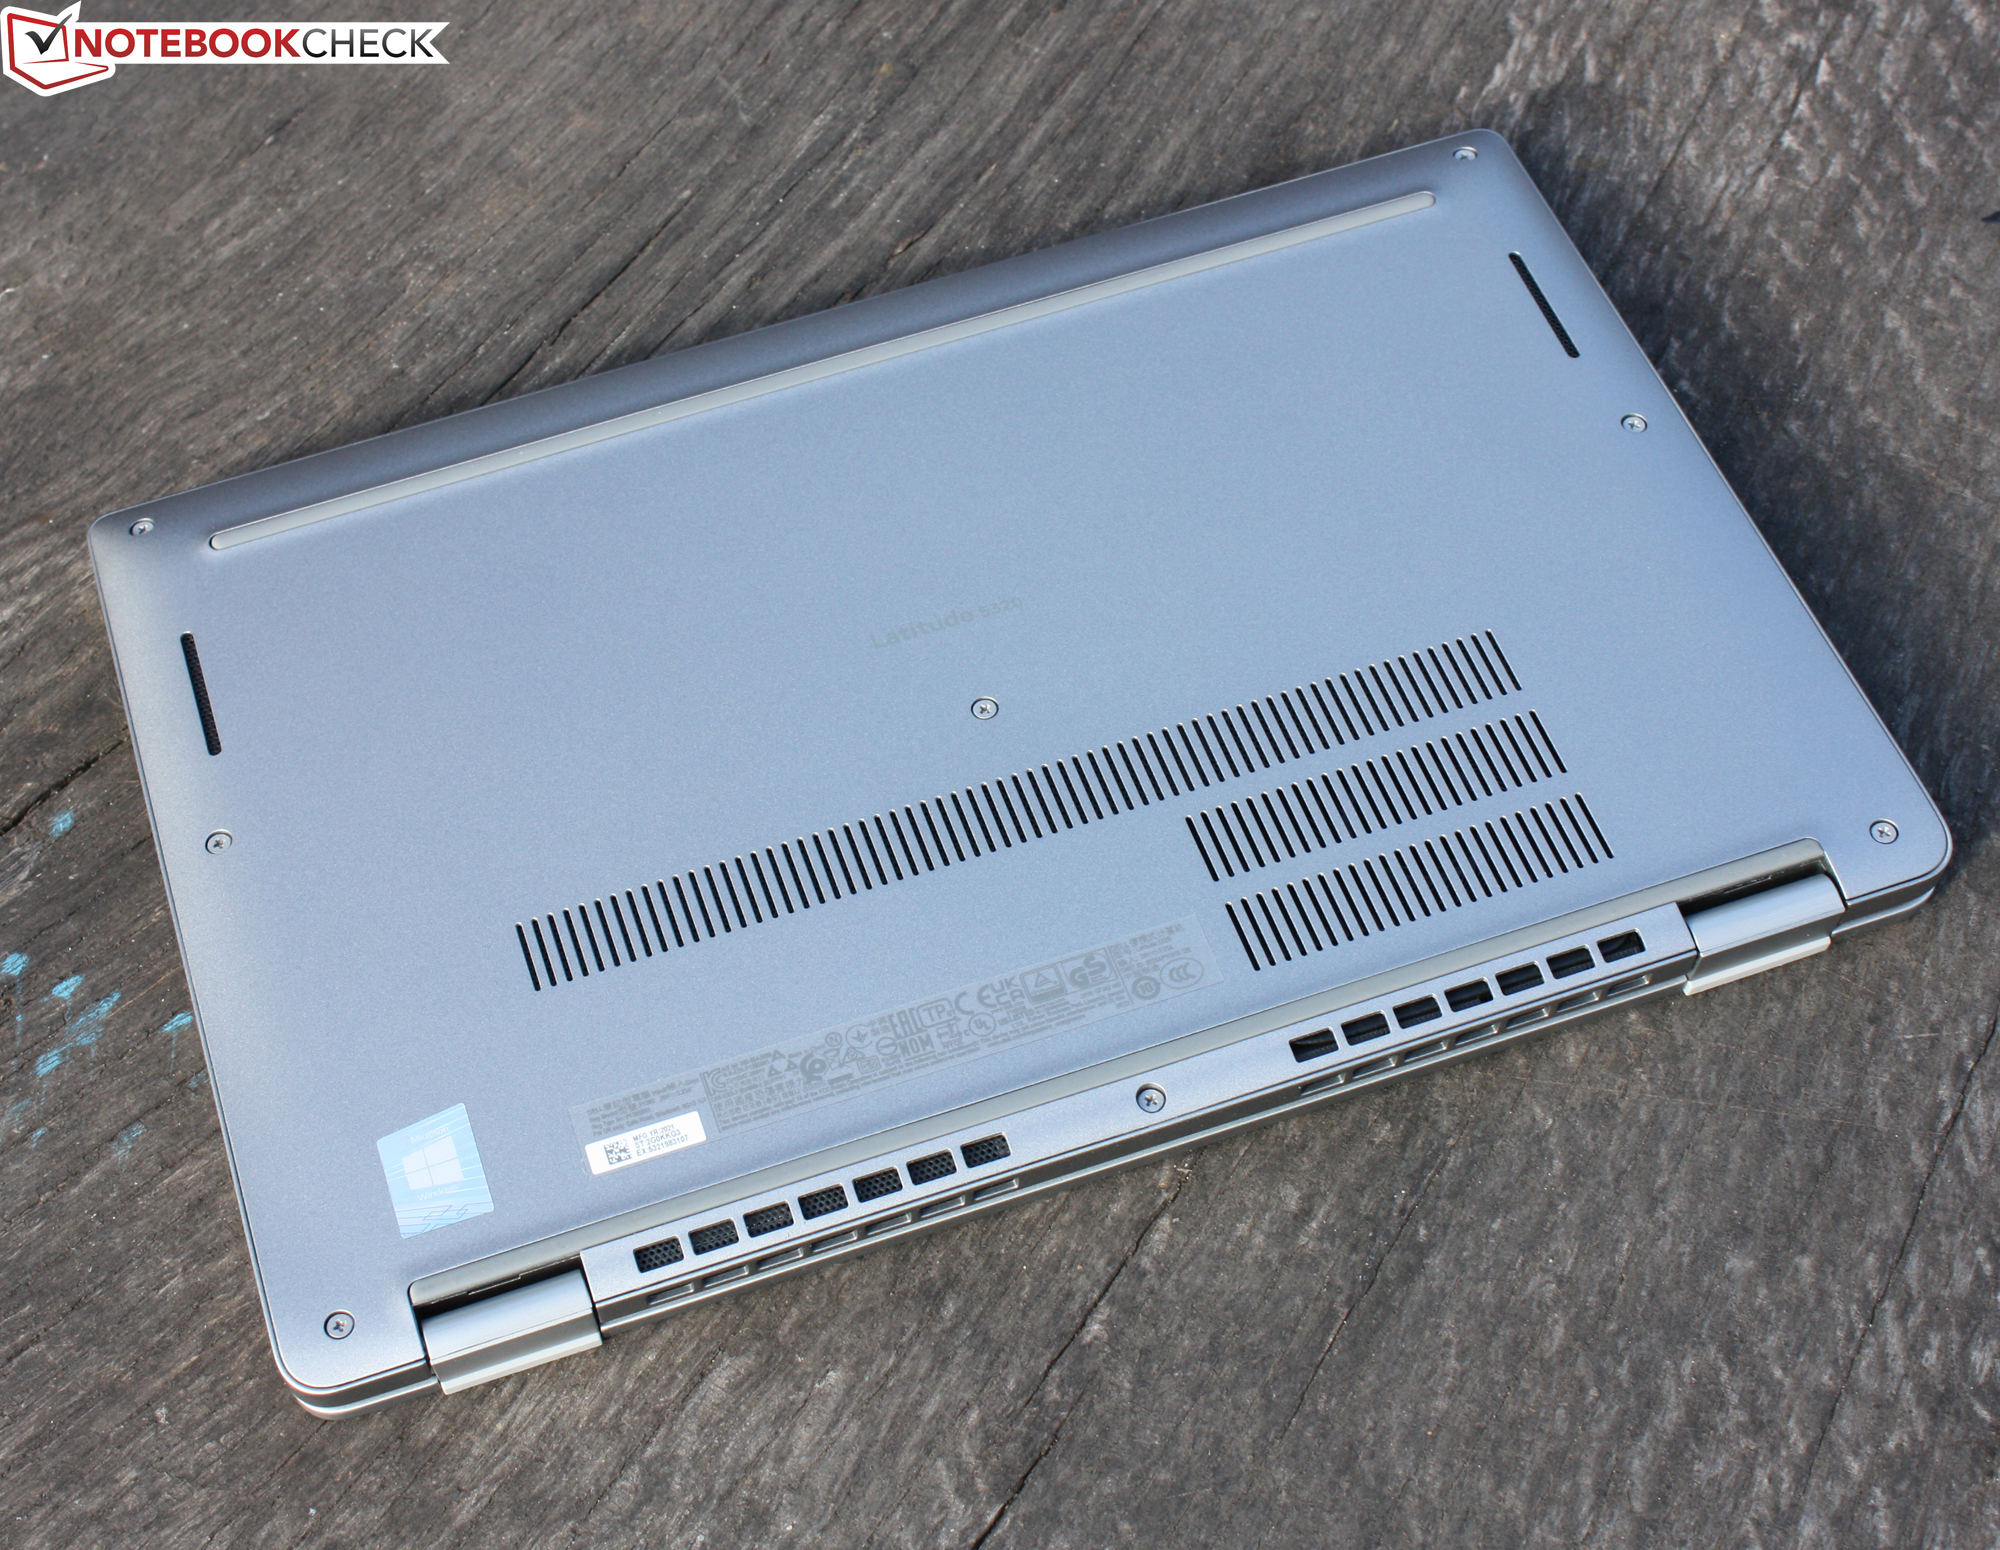
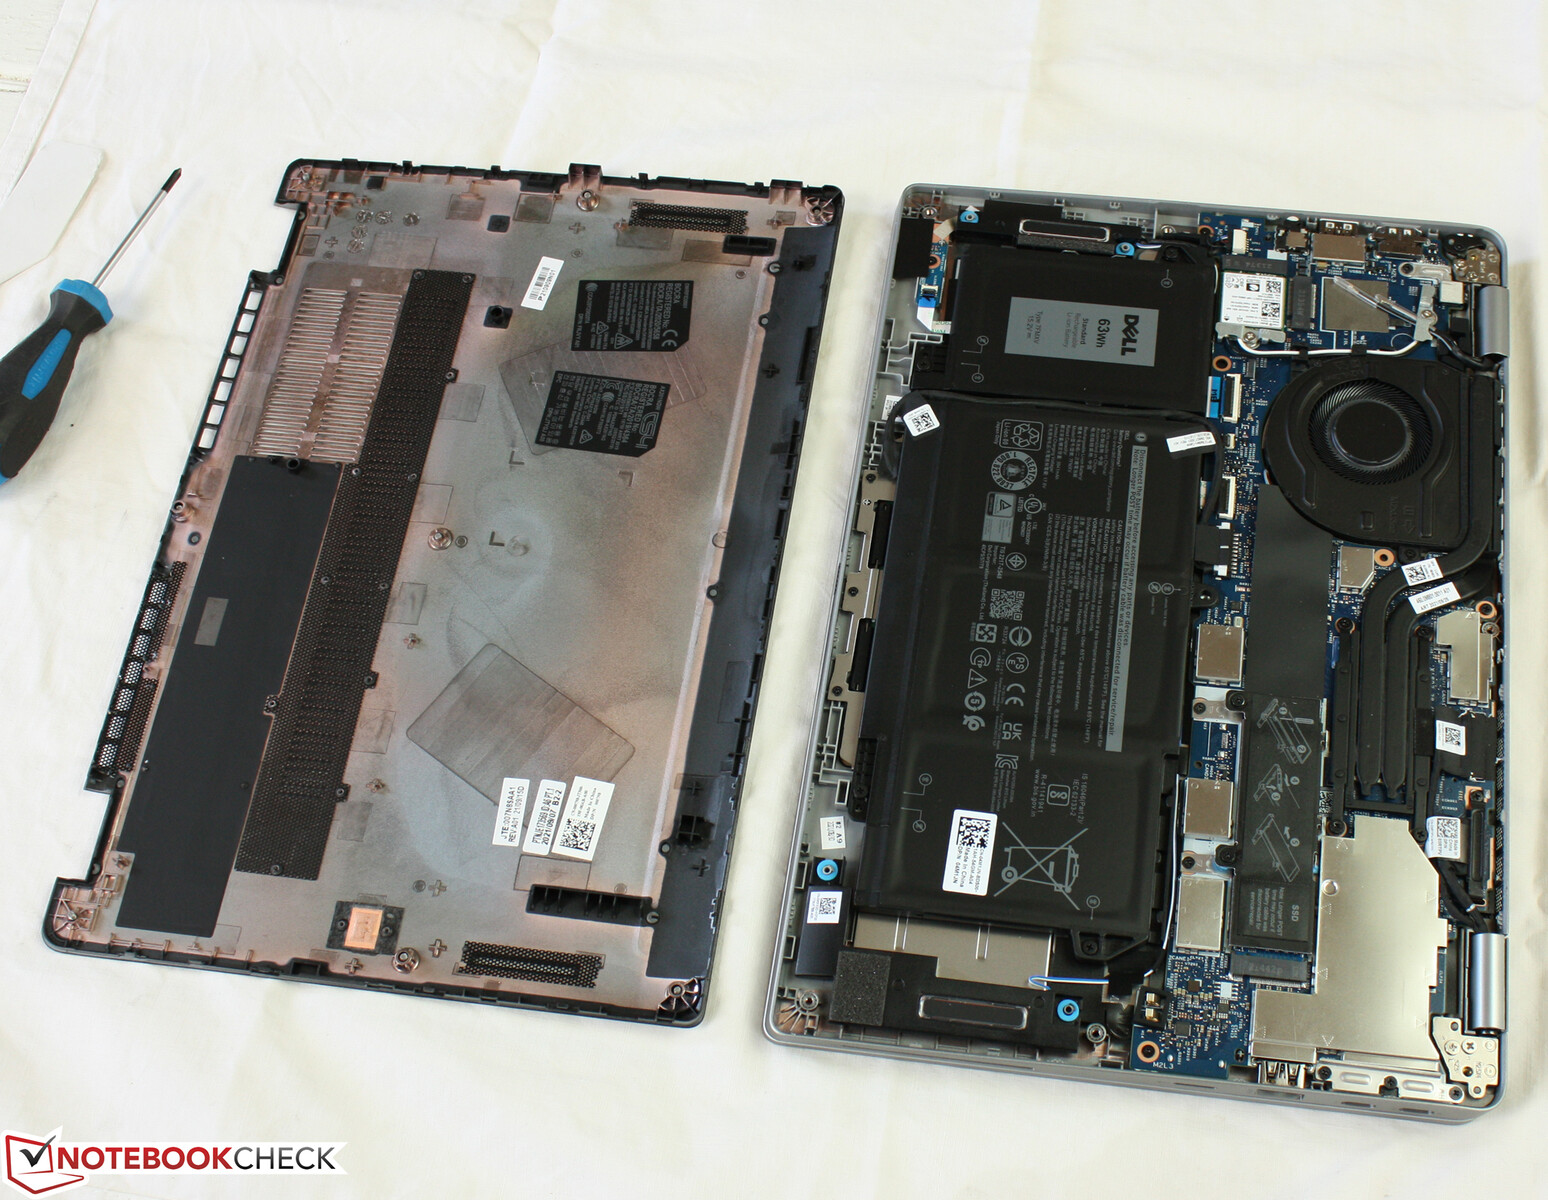
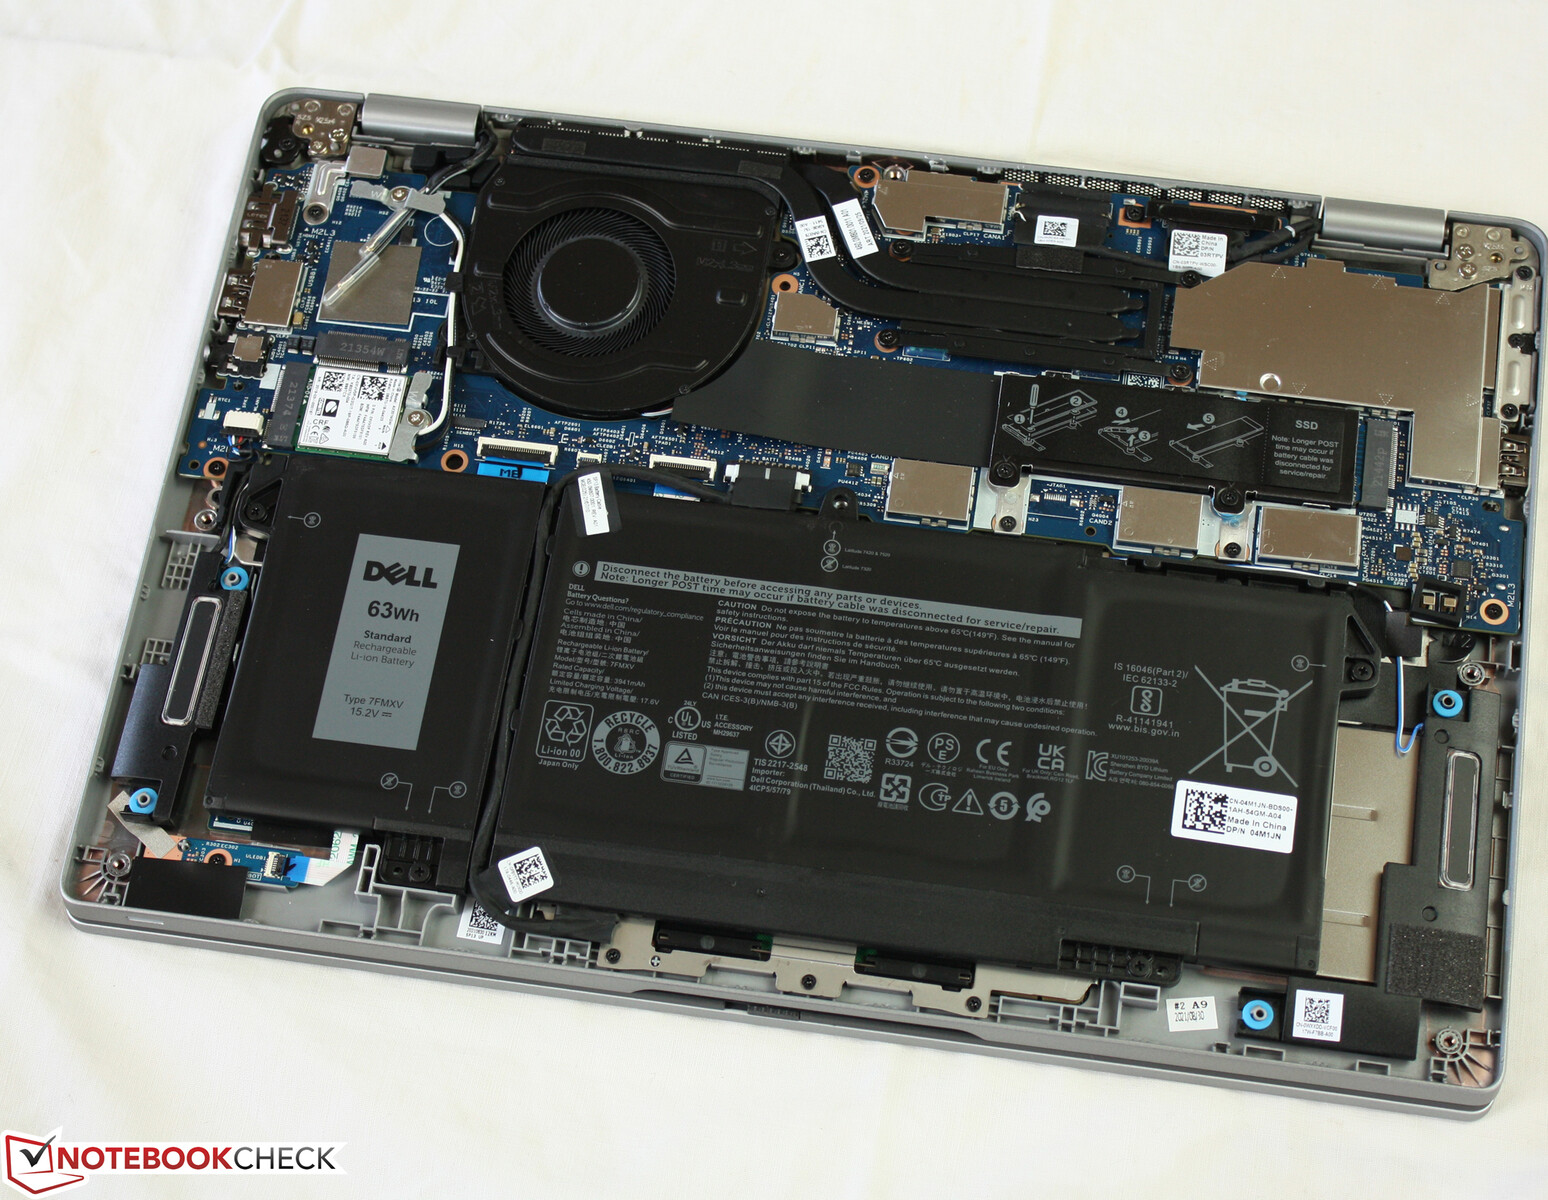
戴尔还在整个过程中依靠哑光的表面。没有维护舱口,电池是永久安装的,但可以更换。卸下底盖后,可以接触到内件--后面会有更多的介绍。
Latitude ,制造精良。缝隙是正确的,没有材料突起或尖锐的边缘。在稳定性方面还有待改进。底座单元很硬,但在一定程度上可以弯曲,这对保费索赔是不利的。我们认为盖子更稳定:它的厚边提供了高硬度。背面的压力不会在画面上引起任何波纹。
极为紧密的铰链使盖子牢牢地固定在位置上,但单手打开是不可能的。最大的打开角度是180度。打开时,盖子稍微抬起底座,在下面滑动。它不会被刮伤,因为橡胶脚附着在其底边。
在我们的比较范围内,Latitude 是最紧凑的设备之一。ThinkBook 13s和戴尔XPS 13 9305不相上下,但13s甚至更薄。就重量而言,它基本上与大多数对手持平。
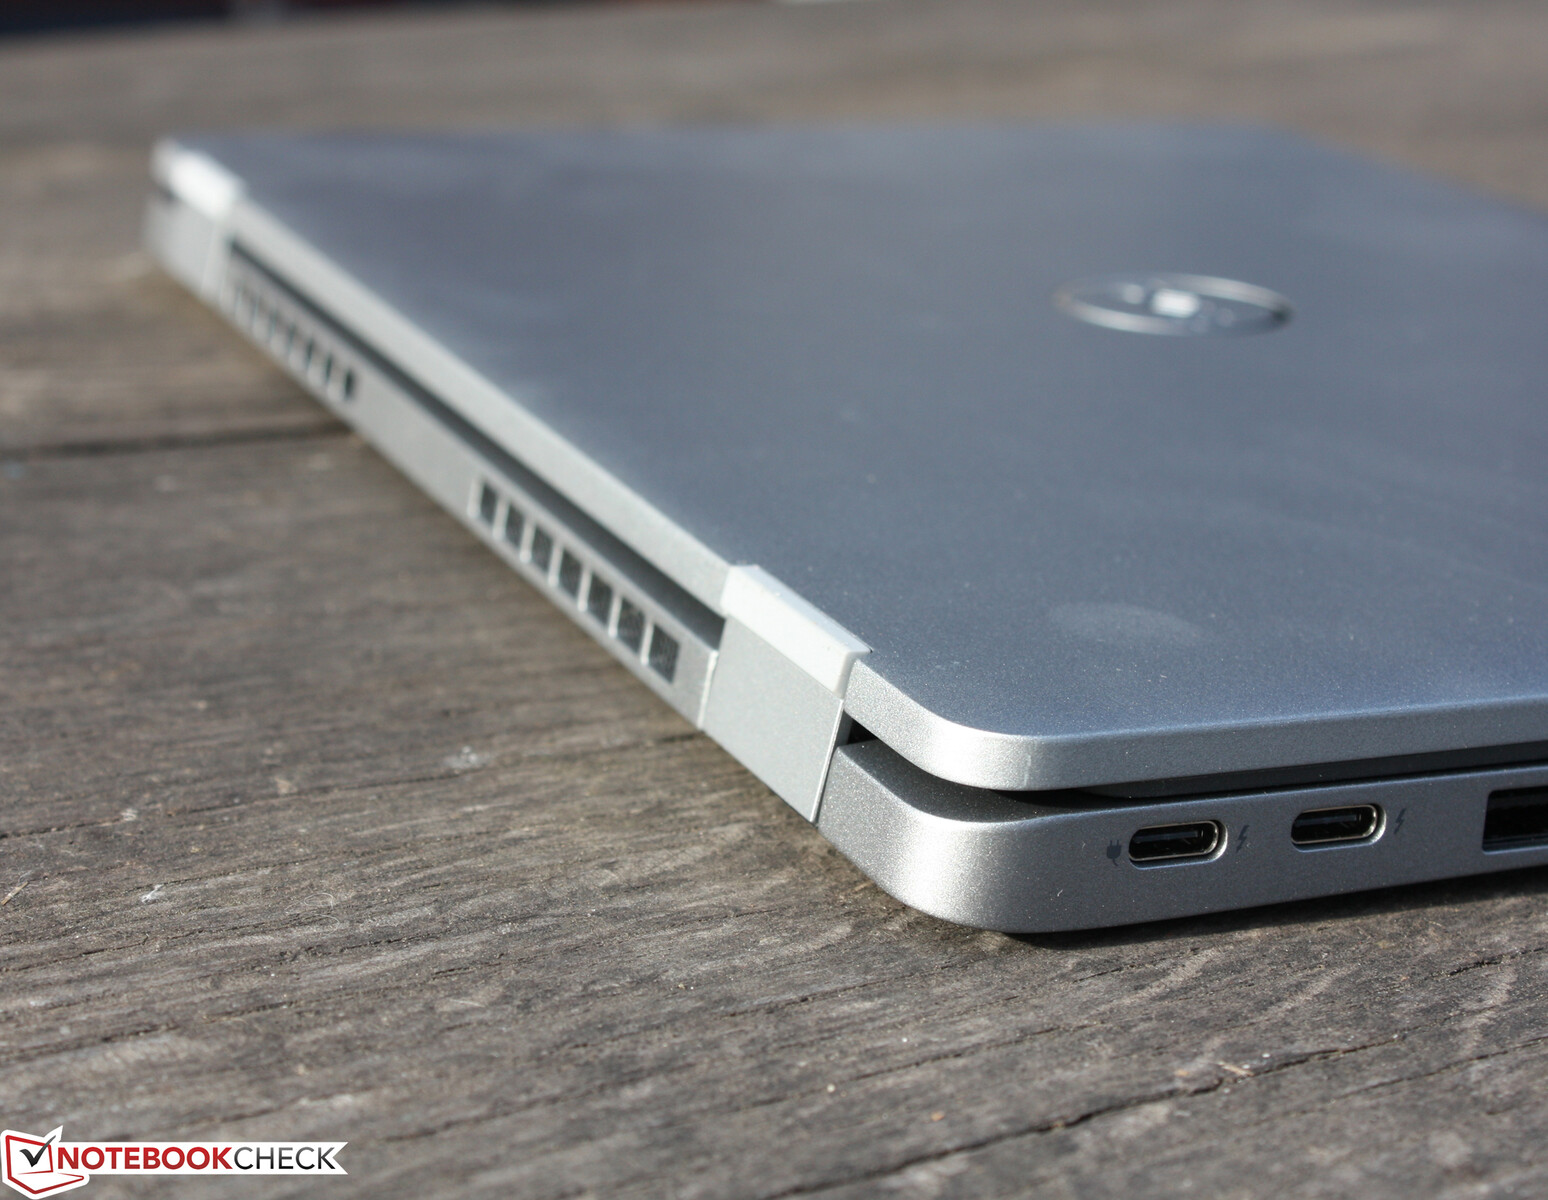
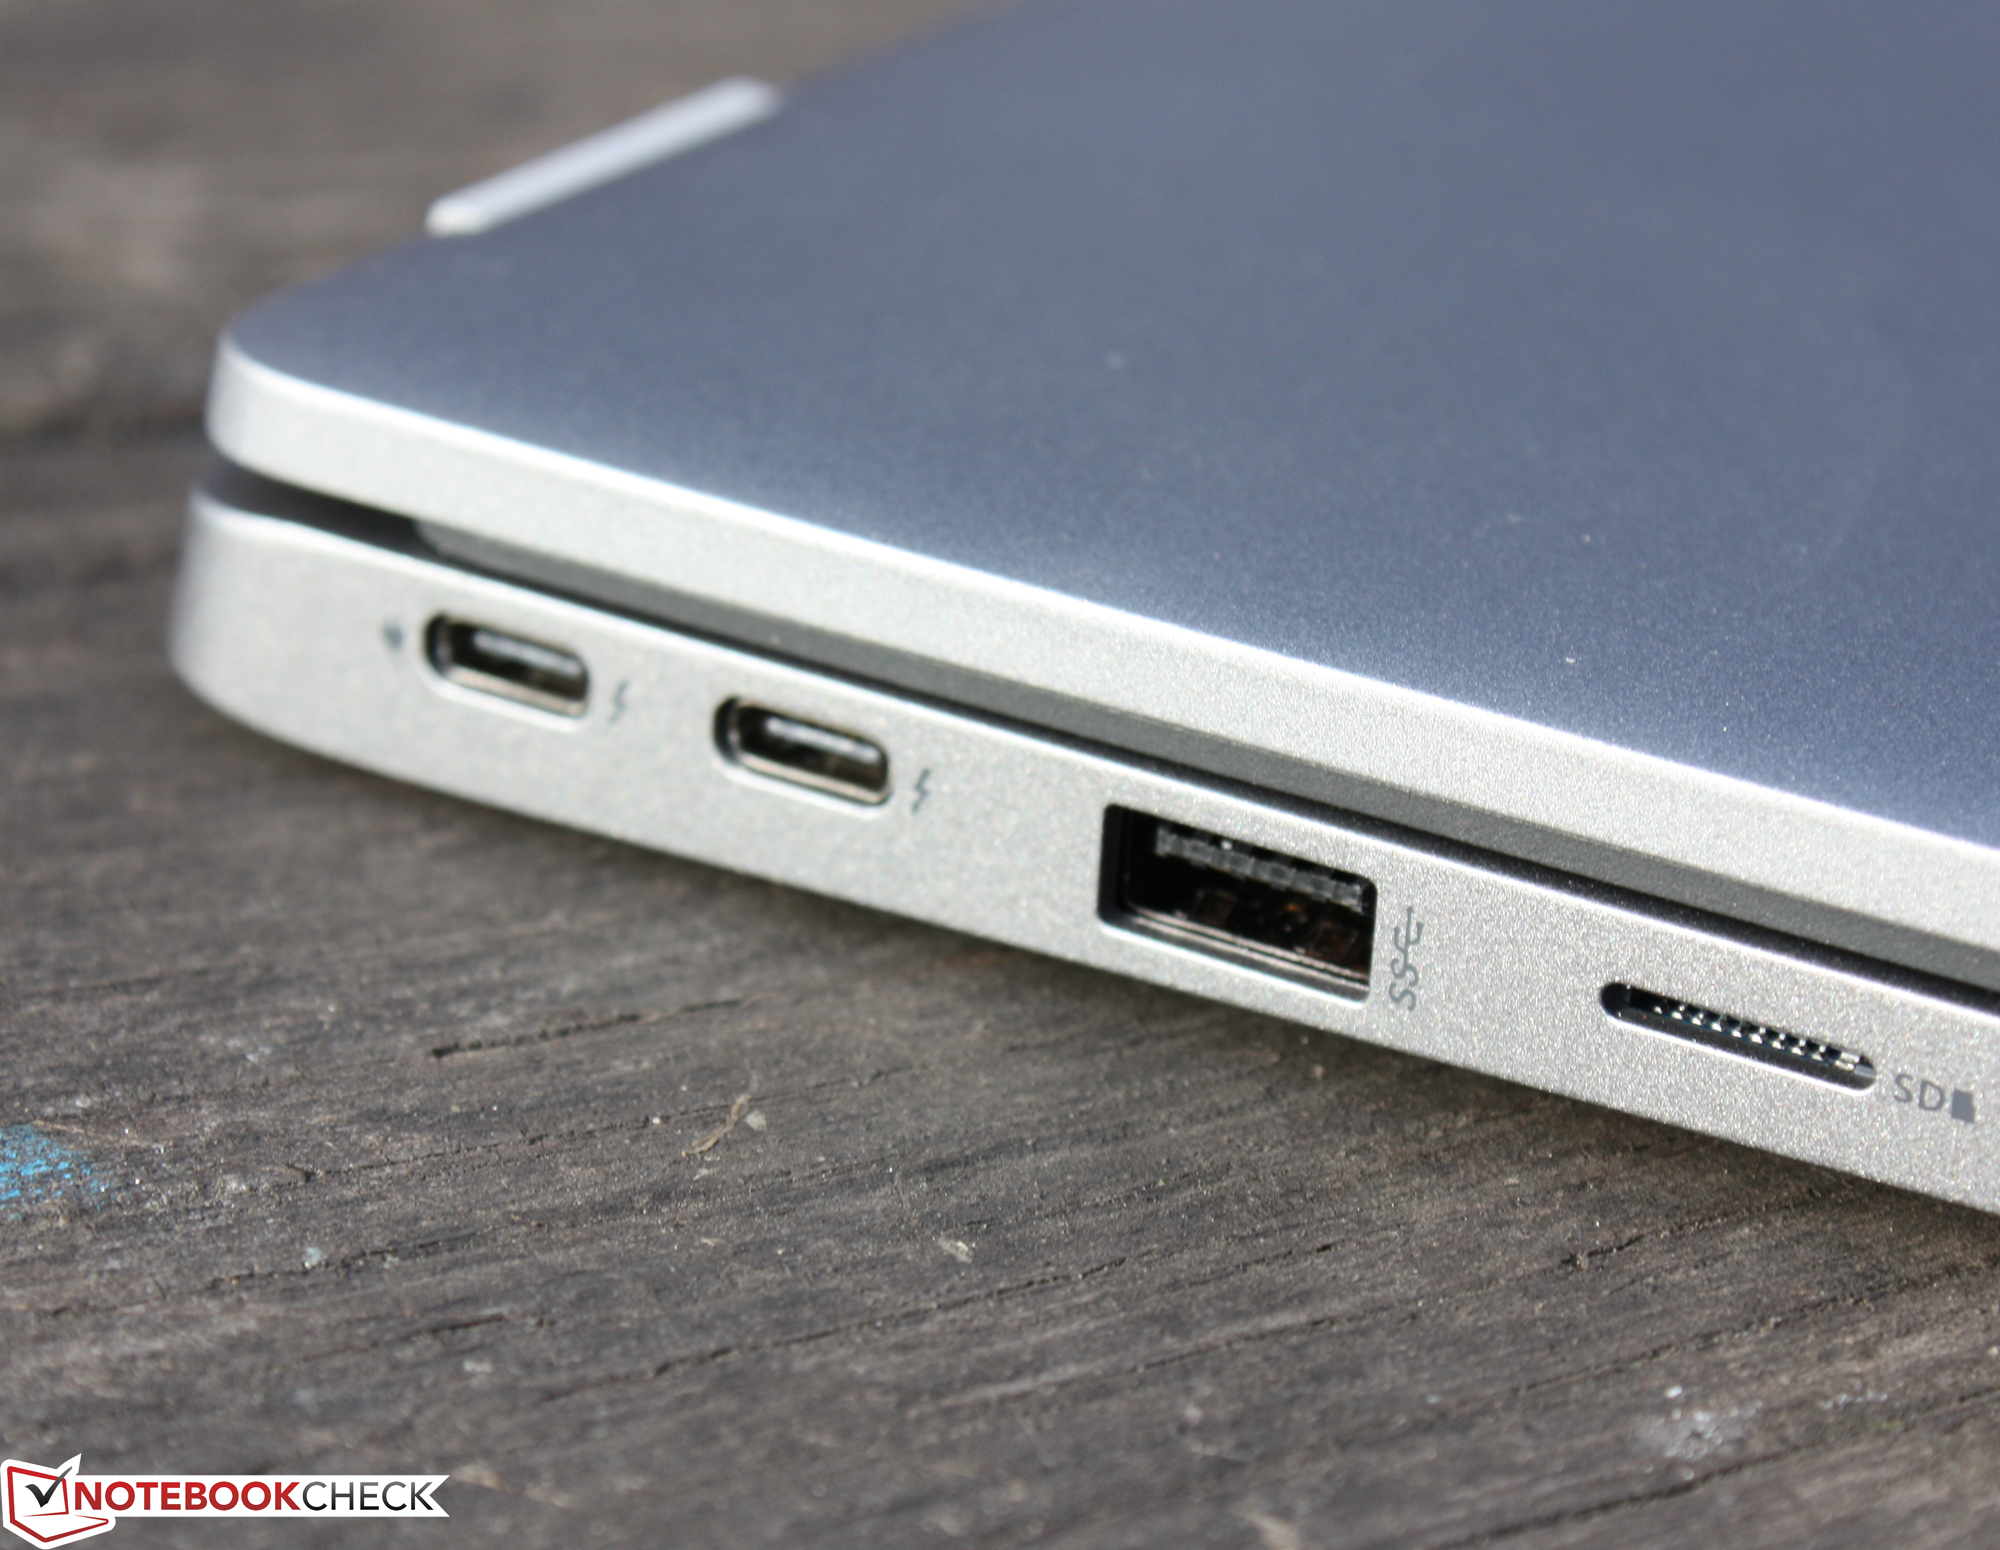
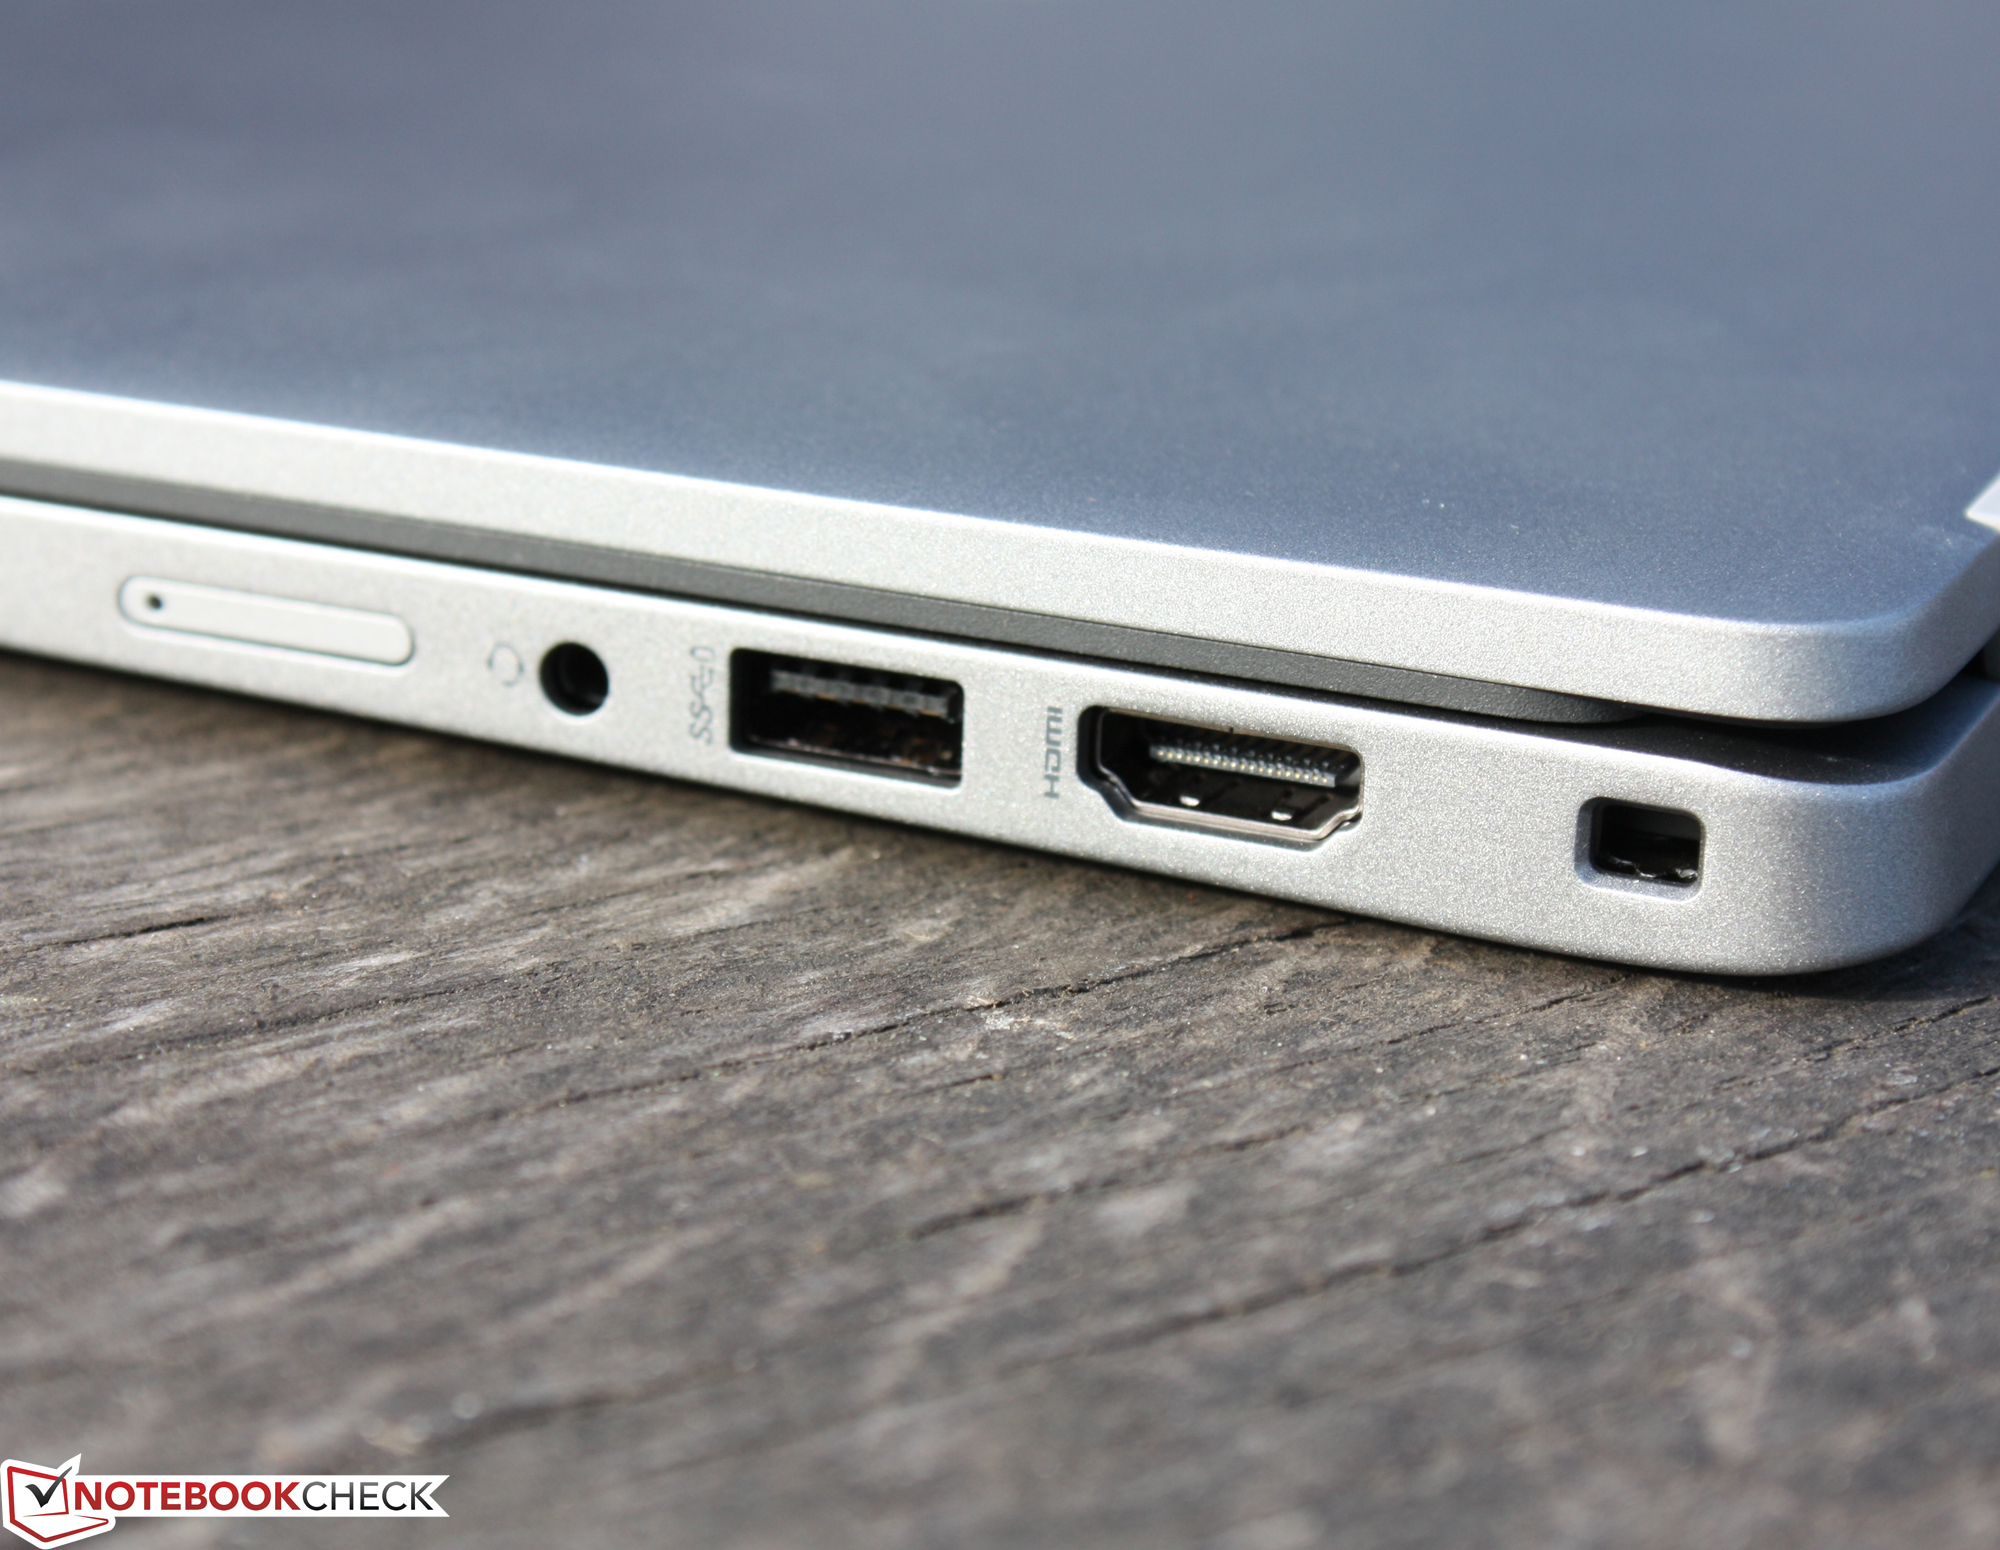
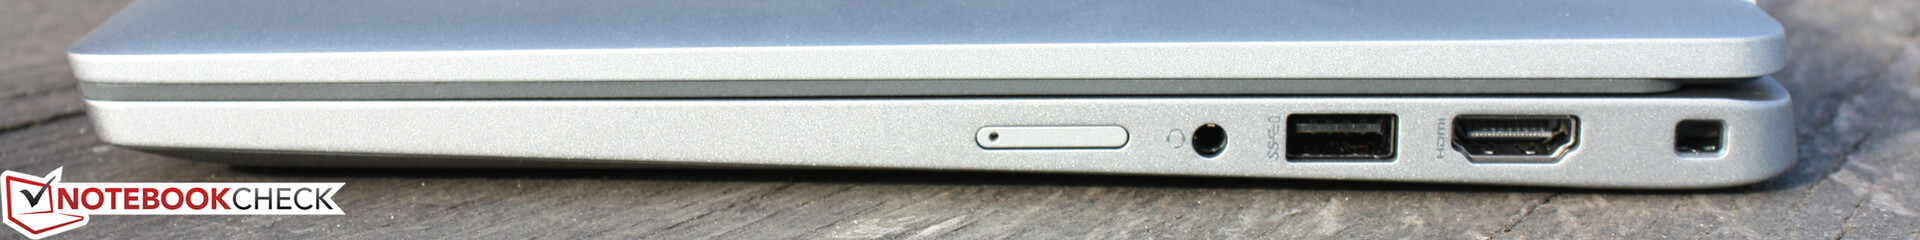
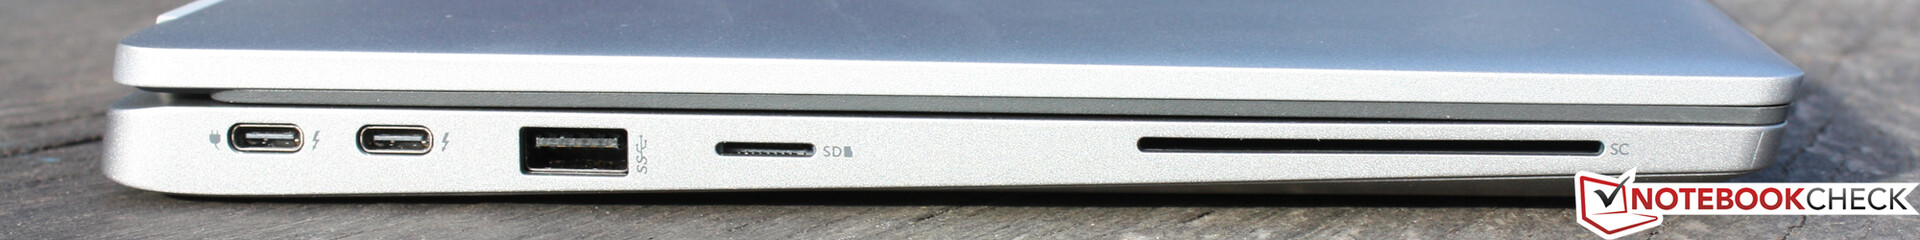
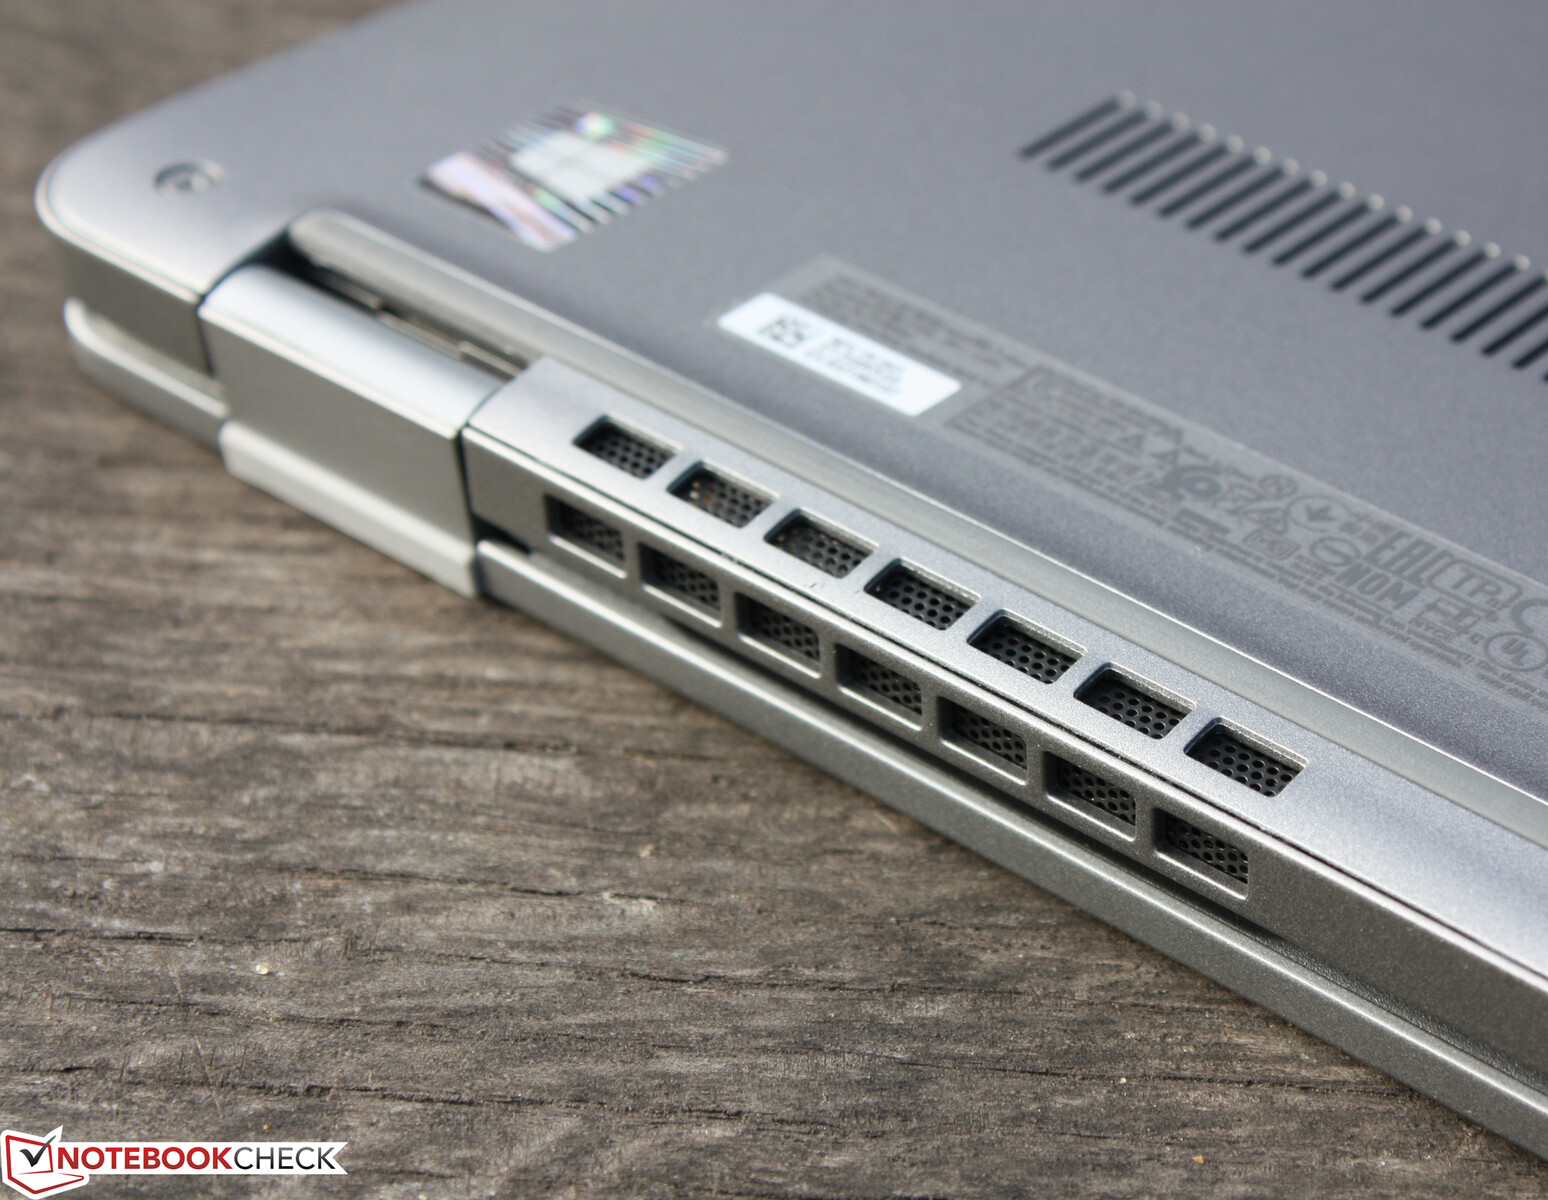
设备 - 2个雷电4作为标准配置
与2020年的上一代产品相比,有很大的变化,例如取消了空心插孔电源接口,而采用支持Power Delivery的USB Type-C。此外,专用的鼠标键和可更换的工作存储器被省略了。RJ45以太网也不再提供,但有两个带USB 4.0和DisplayPort的Thunderbolt端口。以前有一个Thunderbolt 3端口是可选的,但现在TB4是标准配置。
SD卡读卡器
内置的microSD读卡器是同类产品中速度最快的之一,其传输速率为191 MB/s(复制大数据块)和205 MB/s(传输250个jpg图像文件,每个约5 MB)。我们使用参考卡(Angelbird AV PRO V60 microSD 128 GB)来确定数据速率。
| SD Card Reader | |
| average JPG Copy Test (av. of 3 runs) | |
| Dell Latitude 5320-TM4V2 (AV Pro SD microSD 128 GB V60) | |
| Dell XPS 13 9305 Core i5 FHD | |
| Average of class Subnotebook (23.7 - 188, n=9, last 2 years) | |
| Lenovo ThinkPad L13 Gen2-21AB000PGE | |
| Lenovo ThinkPad L14 G2-20X1003WGE (AV Pro V60) | |
| Lenovo ThinkBook 14 G2 ITL 20VDS02G00 (AV Pro V60) | |
| Acer TravelMate P4 TMP414-51-59MR (AV Pro SD microSD 128 GB V60) | |
| maximum AS SSD Seq Read Test (1GB) | |
| Dell Latitude 5320-TM4V2 (AV Pro SD microSD 128 GB V60) | |
| Dell XPS 13 9305 Core i5 FHD | |
| Average of class Subnotebook (24.9 - 195, n=8, last 2 years) | |
| Lenovo ThinkBook 14 G2 ITL 20VDS02G00 (AV Pro V60) | |
| Lenovo ThinkPad L13 Gen2-21AB000PGE | |
| Lenovo ThinkPad L14 G2-20X1003WGE (AV Pro V60) | |
| Acer TravelMate P4 TMP414-51-59MR (AV Pro SD microSD 128 GB V60) | |
沟通
WLAN芯片(Intel AX201)支持WLAN标准802.11a/b/g/n/ac/ax。在最佳条件下确定的传输速度(附近没有其他WLAN设备,笔记本和服务器PC之间的距离很短)是正常或优秀的。在所有的控制测量中,都发生了指示的下降。有线网络连接首次不再可能,前代产品仍有一个弹出式RJ45。
戴尔为Latitude ,提供一个可选的LTE调制解调器--我们的测试设备没有调制解调器。不过,可以加装,LTE天线和SIM卡插槽(eSim)都可以使用。
| Networking | |
| iperf3 transmit AX12 | |
| Lenovo ThinkBook 13s G3 20YA0005GE | |
| Average Intel Wi-Fi 6 AX201 (49.8 - 1775, n=324) | |
| Dell XPS 13 9305 Core i5 FHD | |
| Lenovo ThinkPad L14 G2-20X1003WGE | |
| Acer TravelMate P4 TMP414-51-59MR | |
| Lenovo ThinkPad L13 Gen2-21AB000PGE | |
| Dell Latitude 5320-TM4V2 | |
| Lenovo ThinkBook 14 G2 ITL 20VDS02G00 | |
| Lenovo ThinkBook 14 G2 ITL 20VDS02G00 | |
| iperf3 receive AX12 | |
| Dell XPS 13 9305 Core i5 FHD | |
| Dell Latitude 5320-TM4V2 | |
| Average Intel Wi-Fi 6 AX201 (136 - 1743, n=324) | |
| Lenovo ThinkBook 13s G3 20YA0005GE | |
| Acer TravelMate P4 TMP414-51-59MR | |
| Lenovo ThinkPad L13 Gen2-21AB000PGE | |
| Lenovo ThinkBook 14 G2 ITL 20VDS02G00 | |
| Lenovo ThinkBook 14 G2 ITL 20VDS02G00 | |
| Lenovo ThinkPad L14 G2-20X1003WGE | |
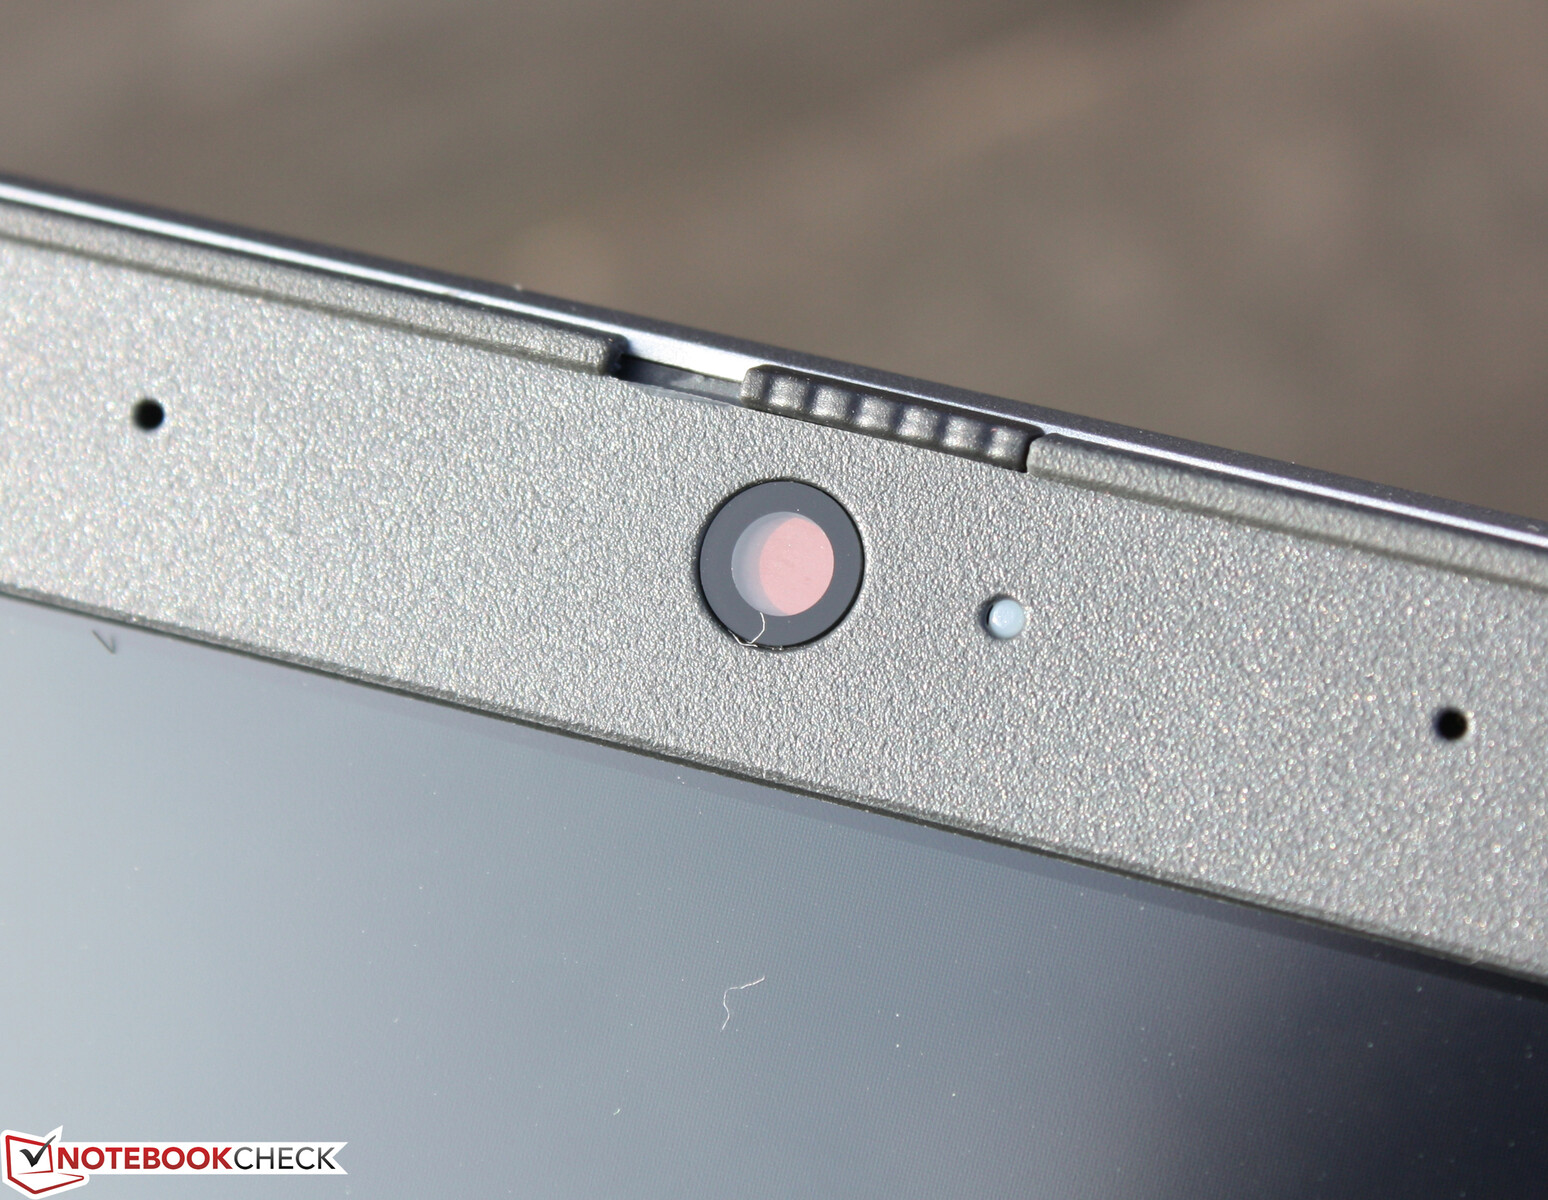
网络摄像头
网络摄像头(0.9MP;最大1280 x 720)不能产生令人信服的照片--就像竞争对手的摄像头一样。此外,色彩精确度也不够。偏差几乎达到32,显然没有达到目标(DeltaE小于3)。


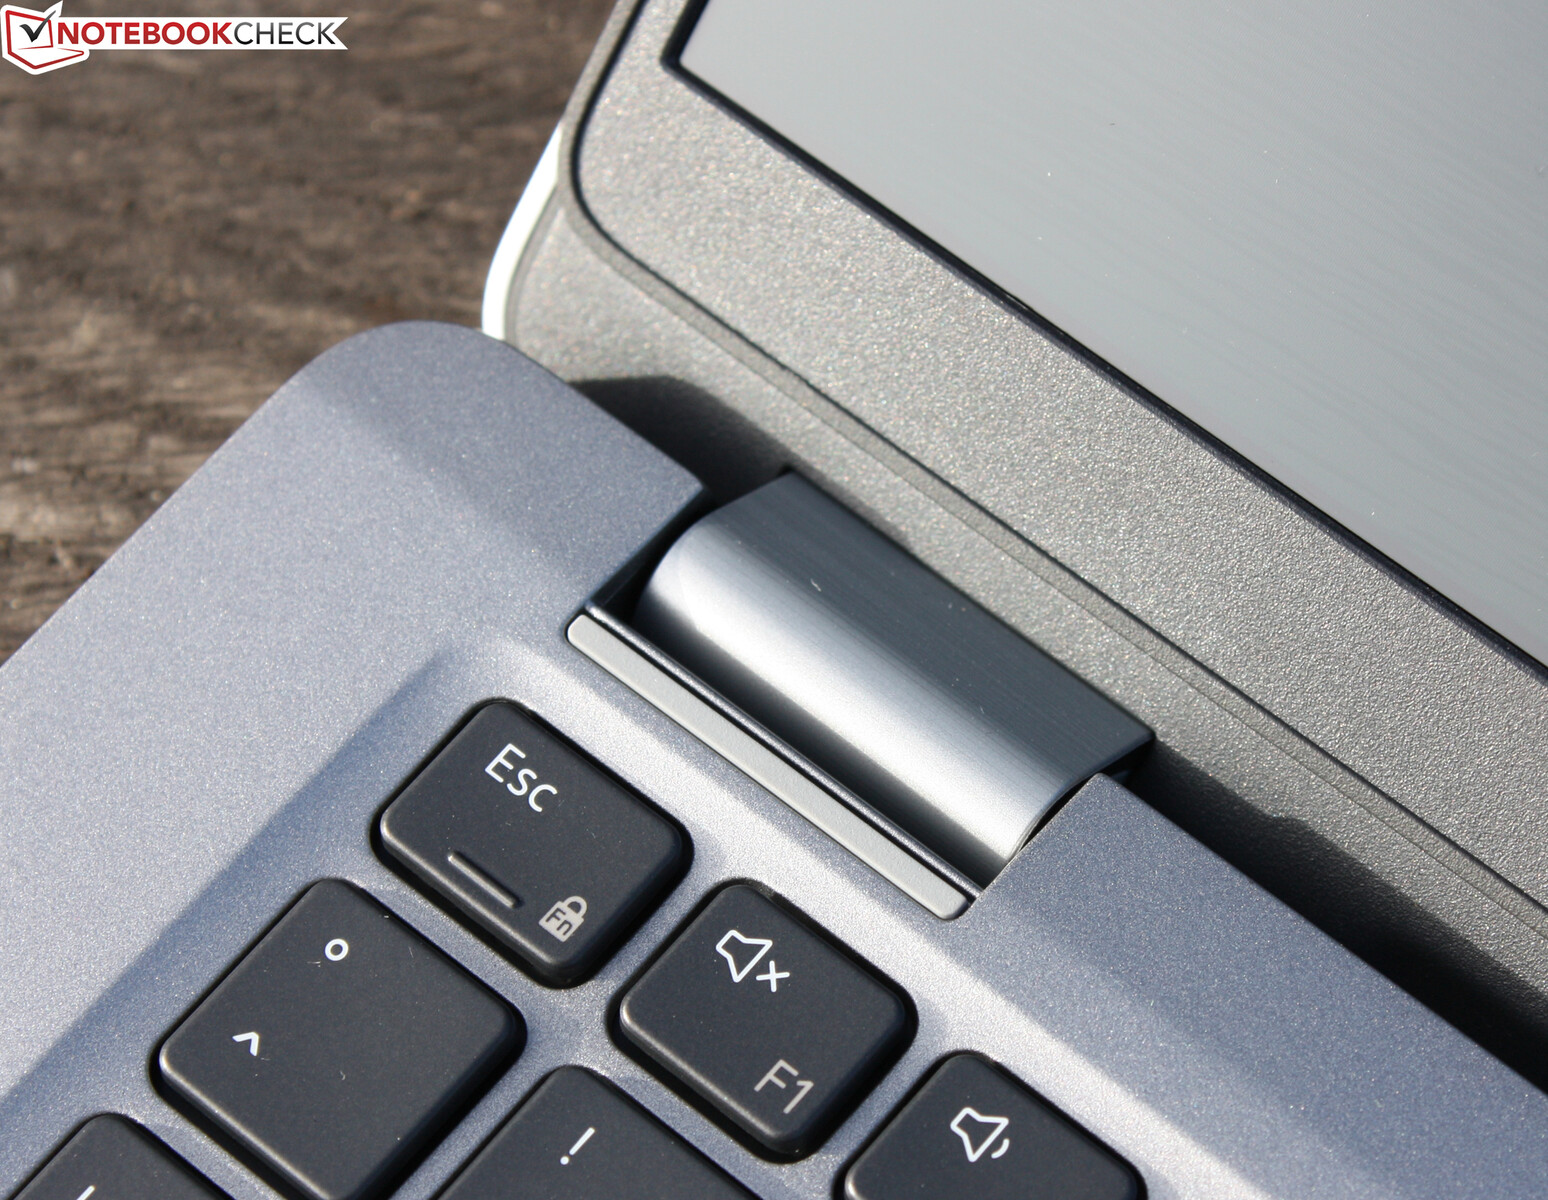
安全问题
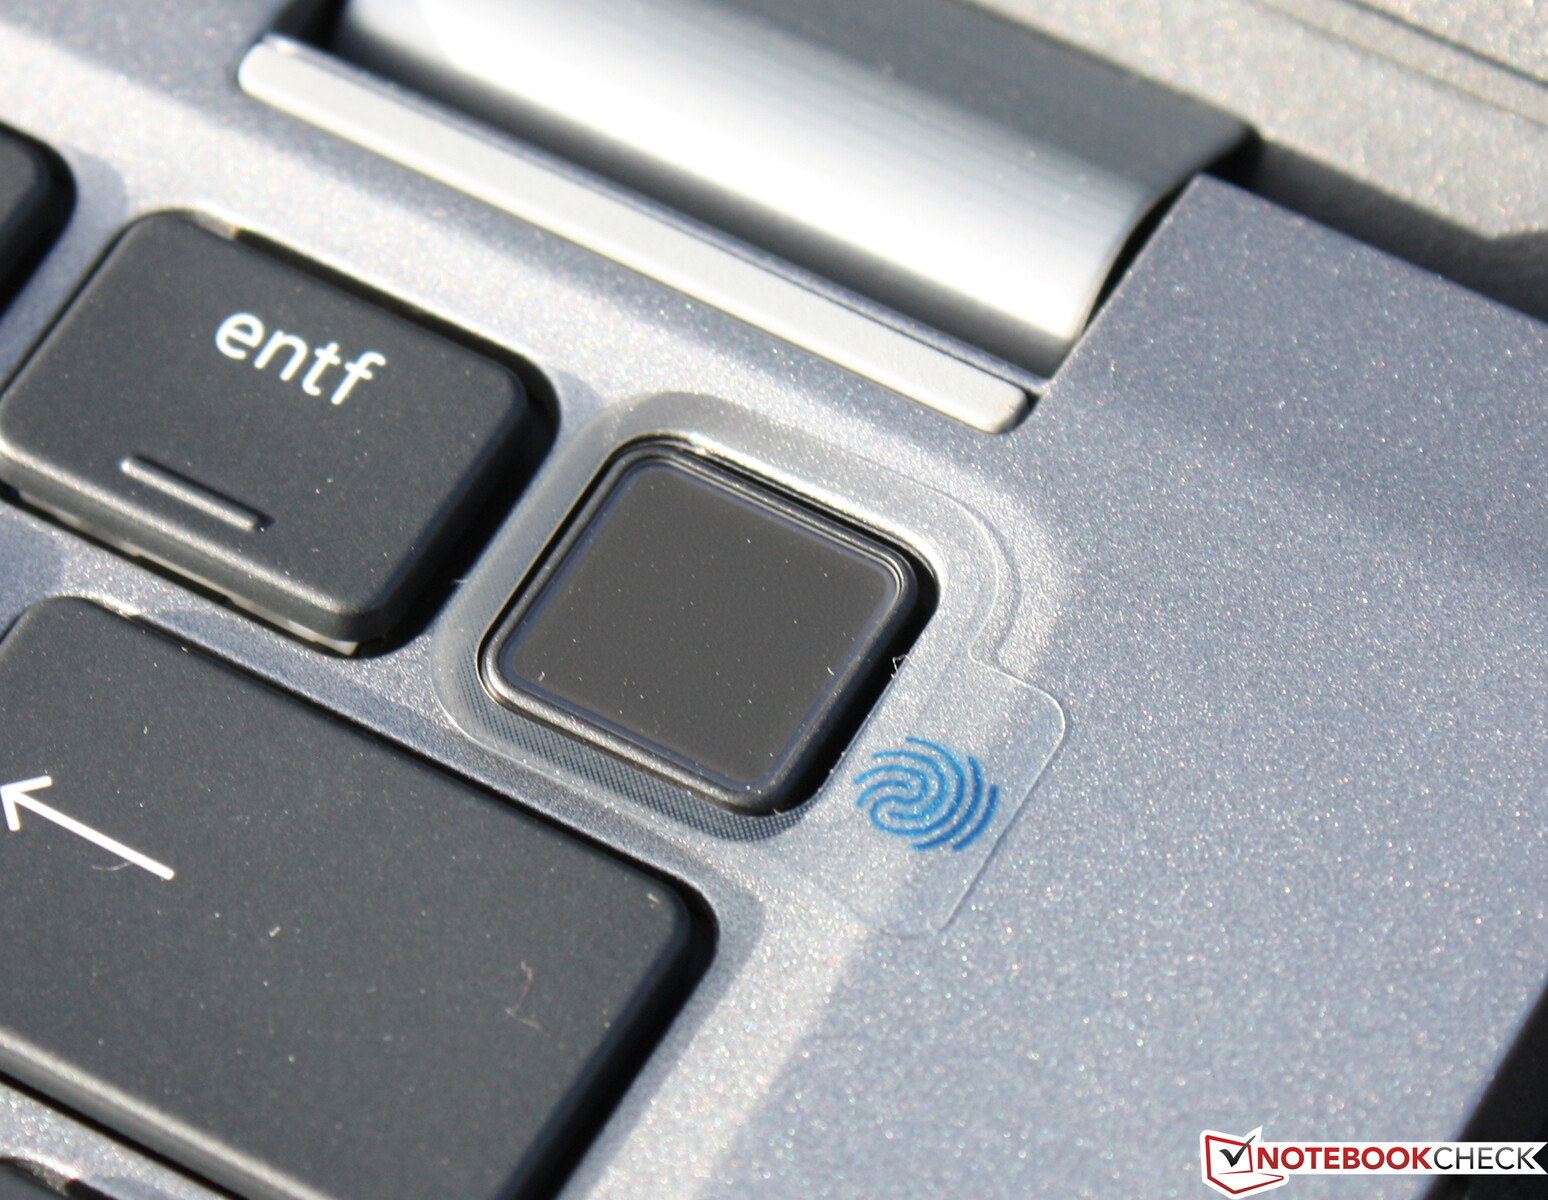
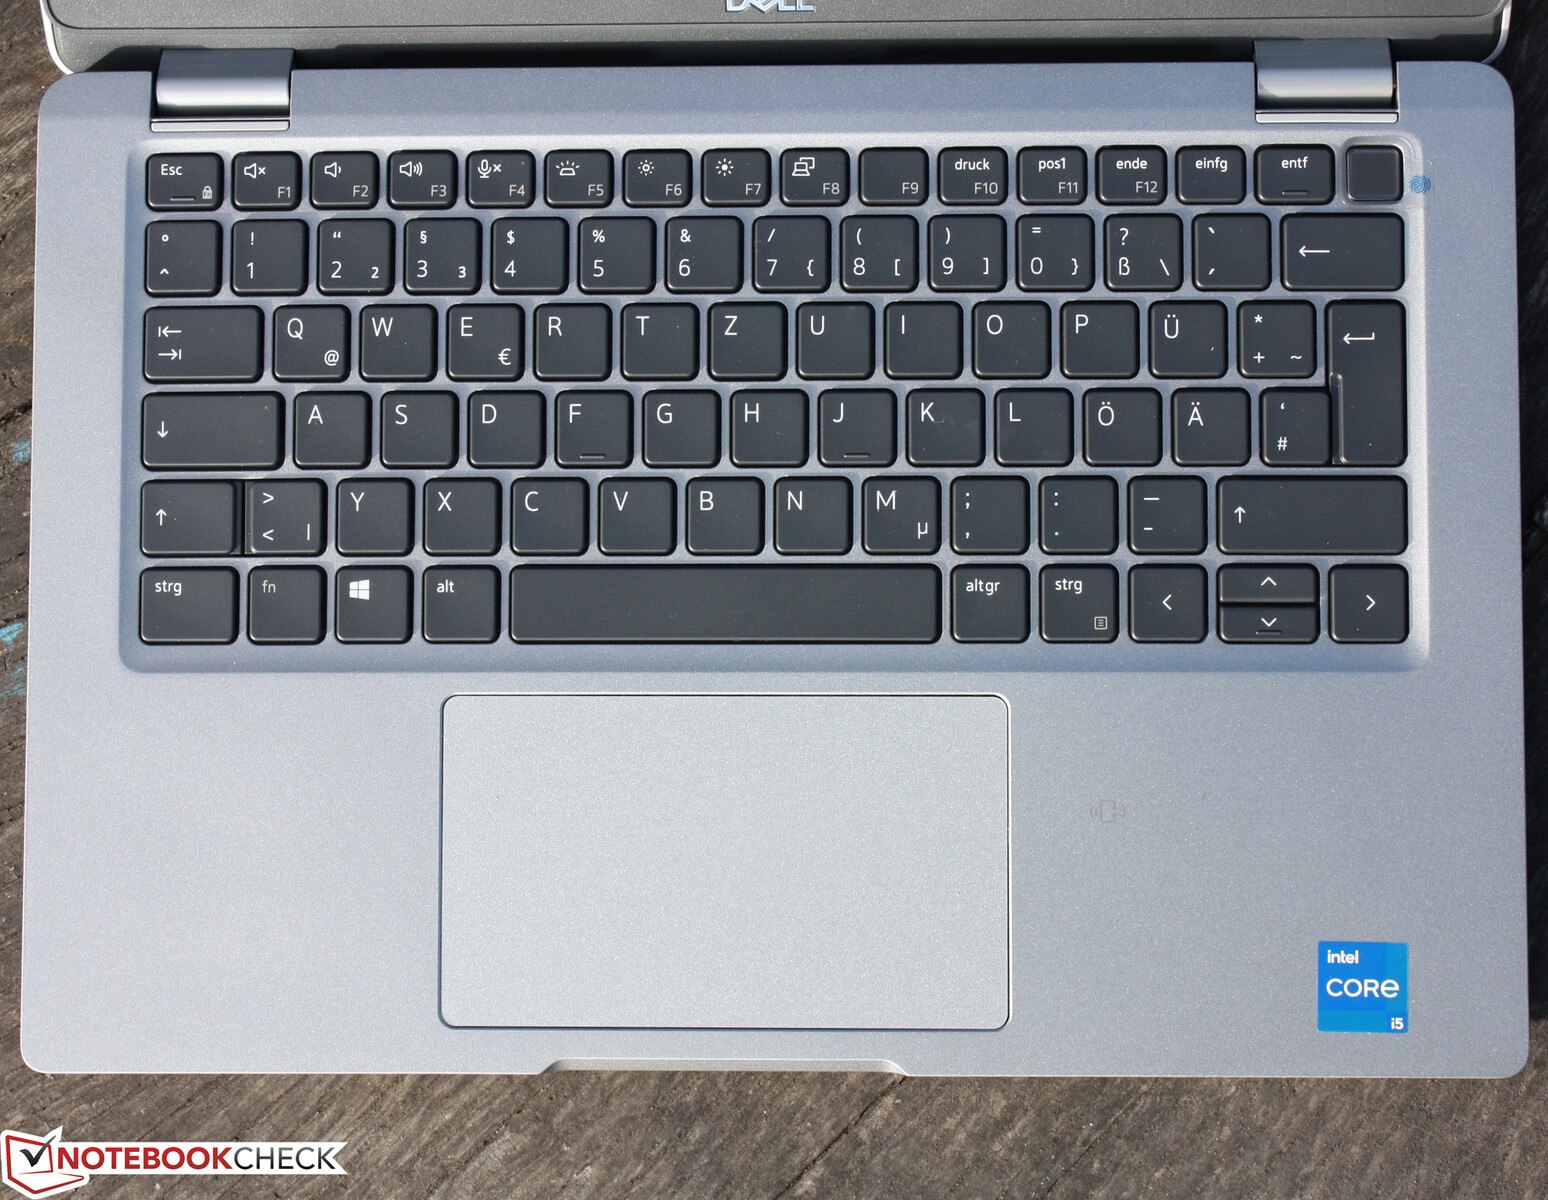
我们的配置变体配备了智能卡以及用于生物识别访问安全的指纹阅读器。指纹识别器被嵌入到电源按钮中,该按钮首次位于键盘的区块中。从理论上讲,与删除键的接近会带来无意关机的风险。然而,这在实践中从未发生过,因为开机需要一个更强的压力点。
辅料
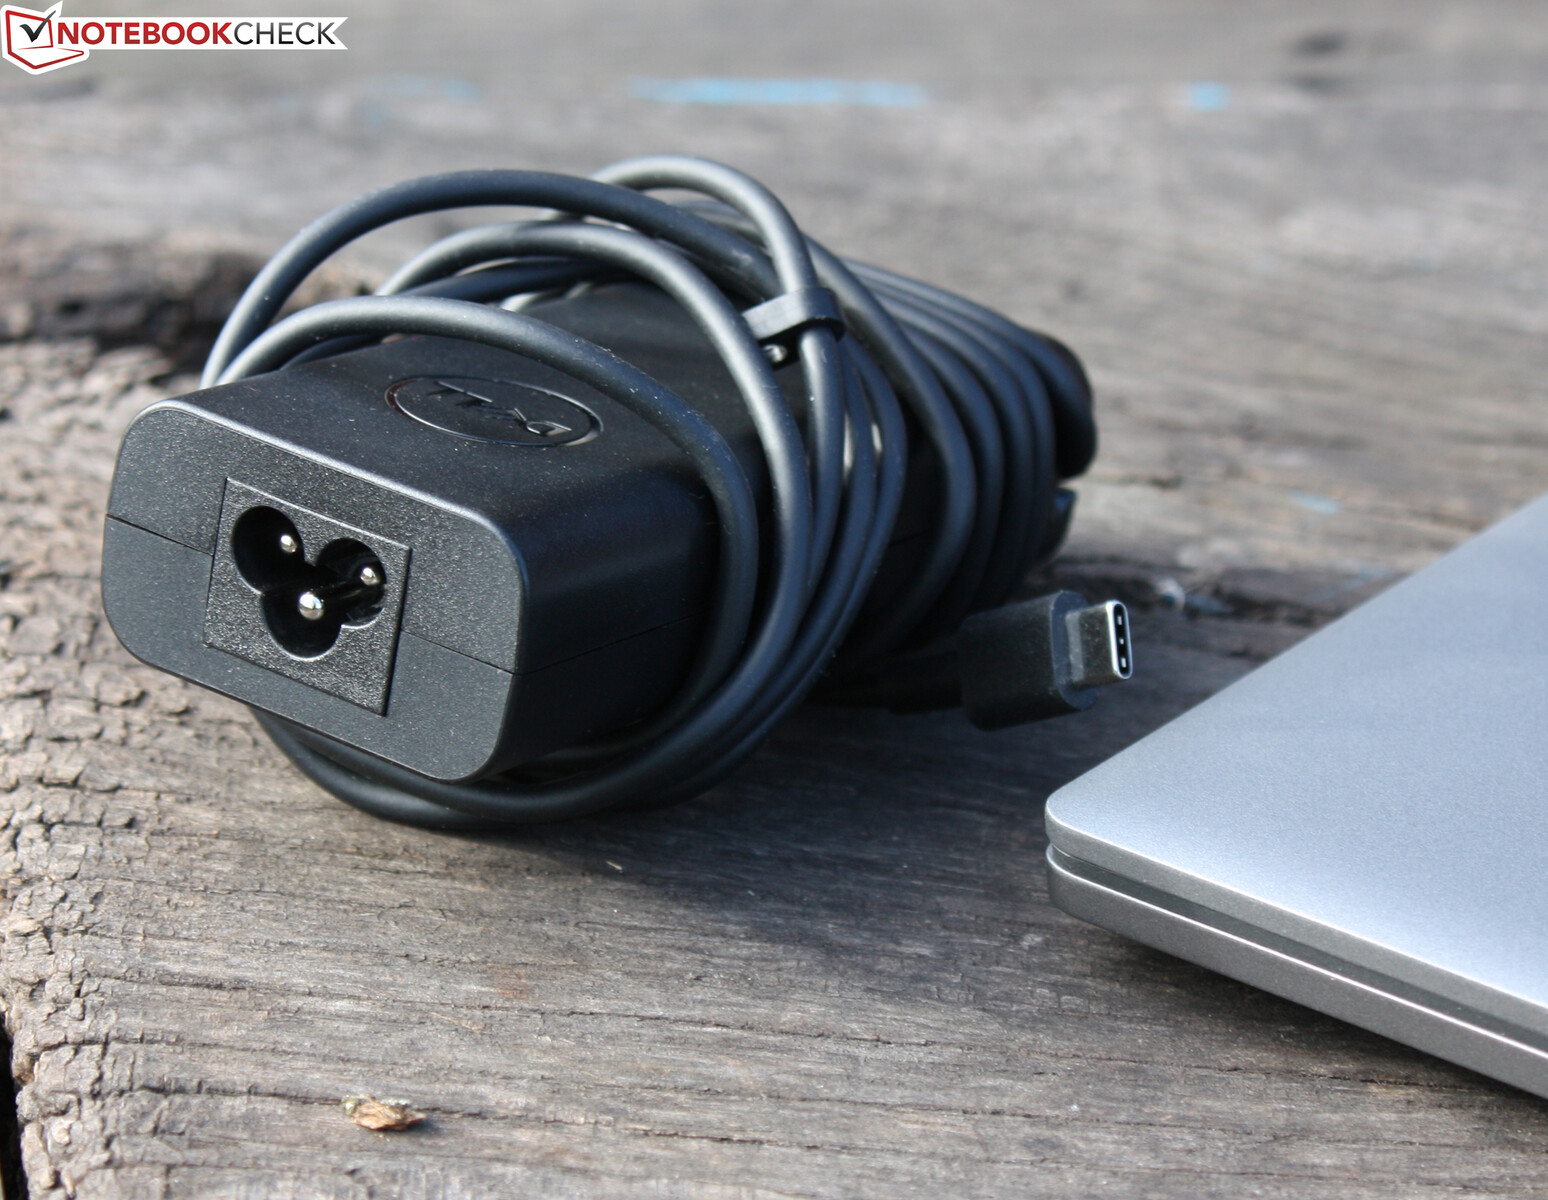
这款笔记本配有常规文件:快速入门指南和保修信息。此外,还有一个65瓦的Type-C电源适配器。戴尔准备了有趣的配件。Thunderbolt底座WD19TBS或TB16在家里的桌子上有很多端口,用一根电缆连接到笔记本电脑上。然后,笔记本电脑也通过这条电缆充电。
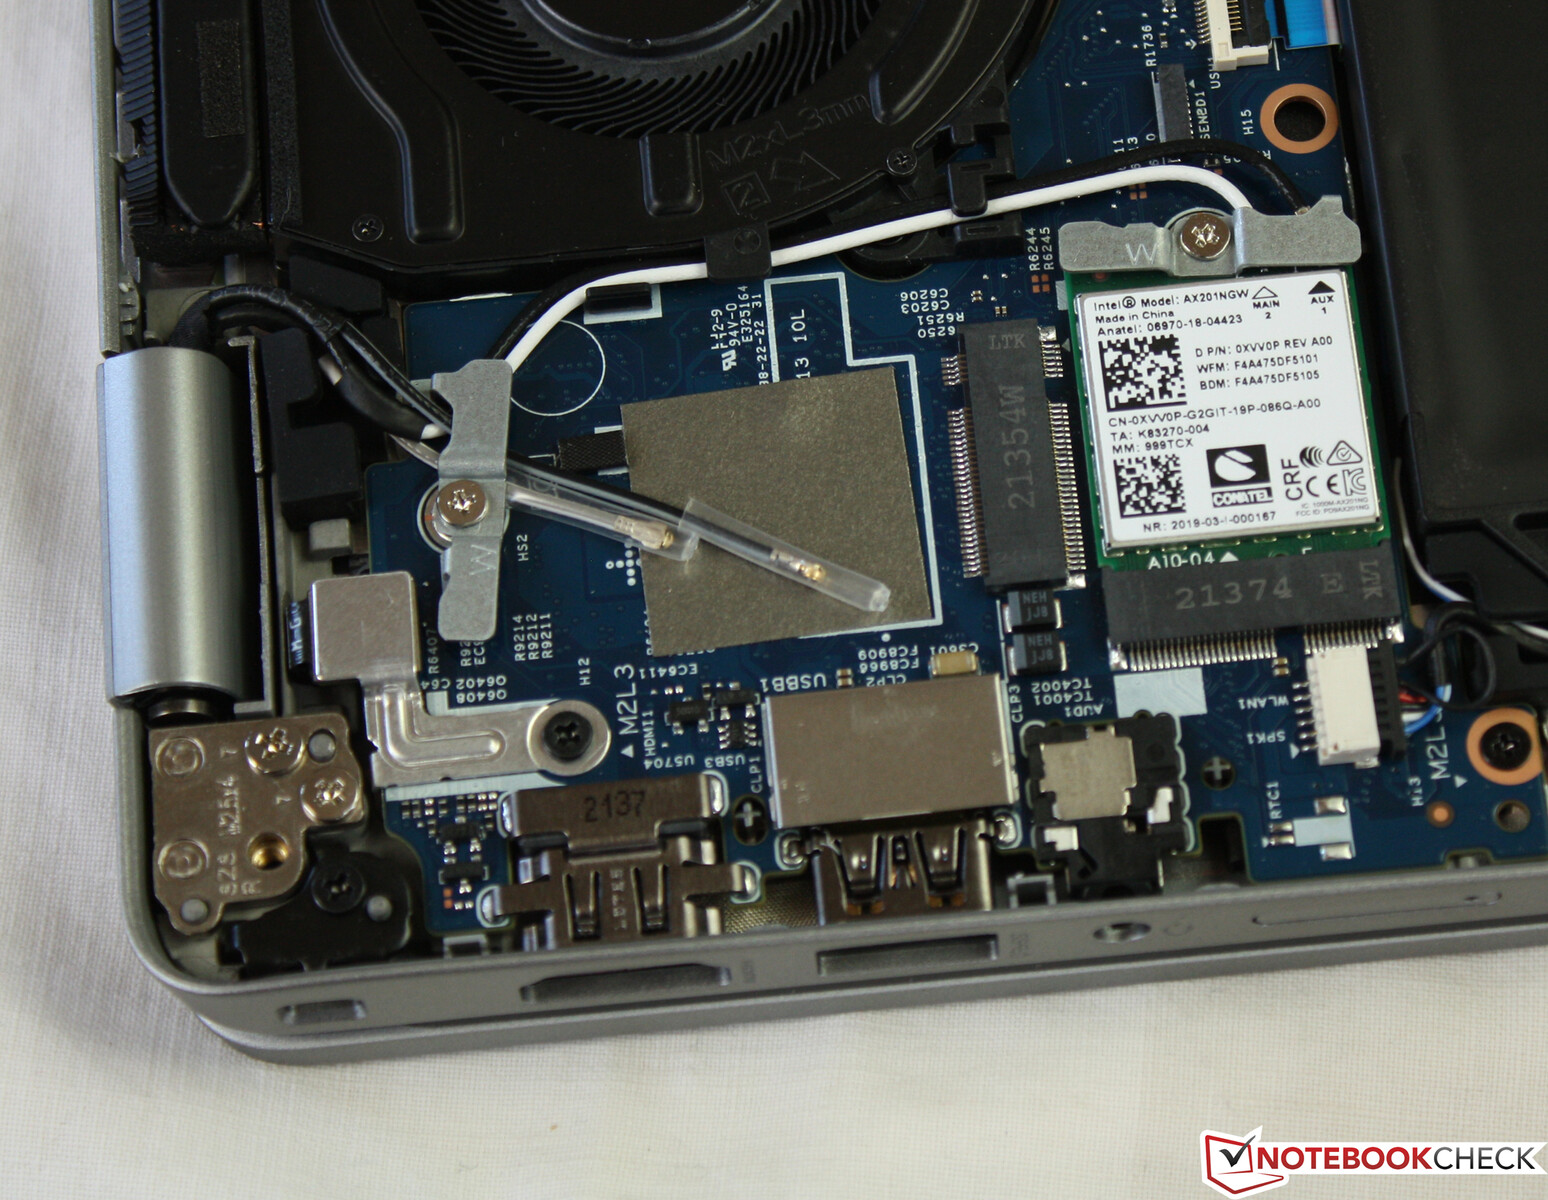
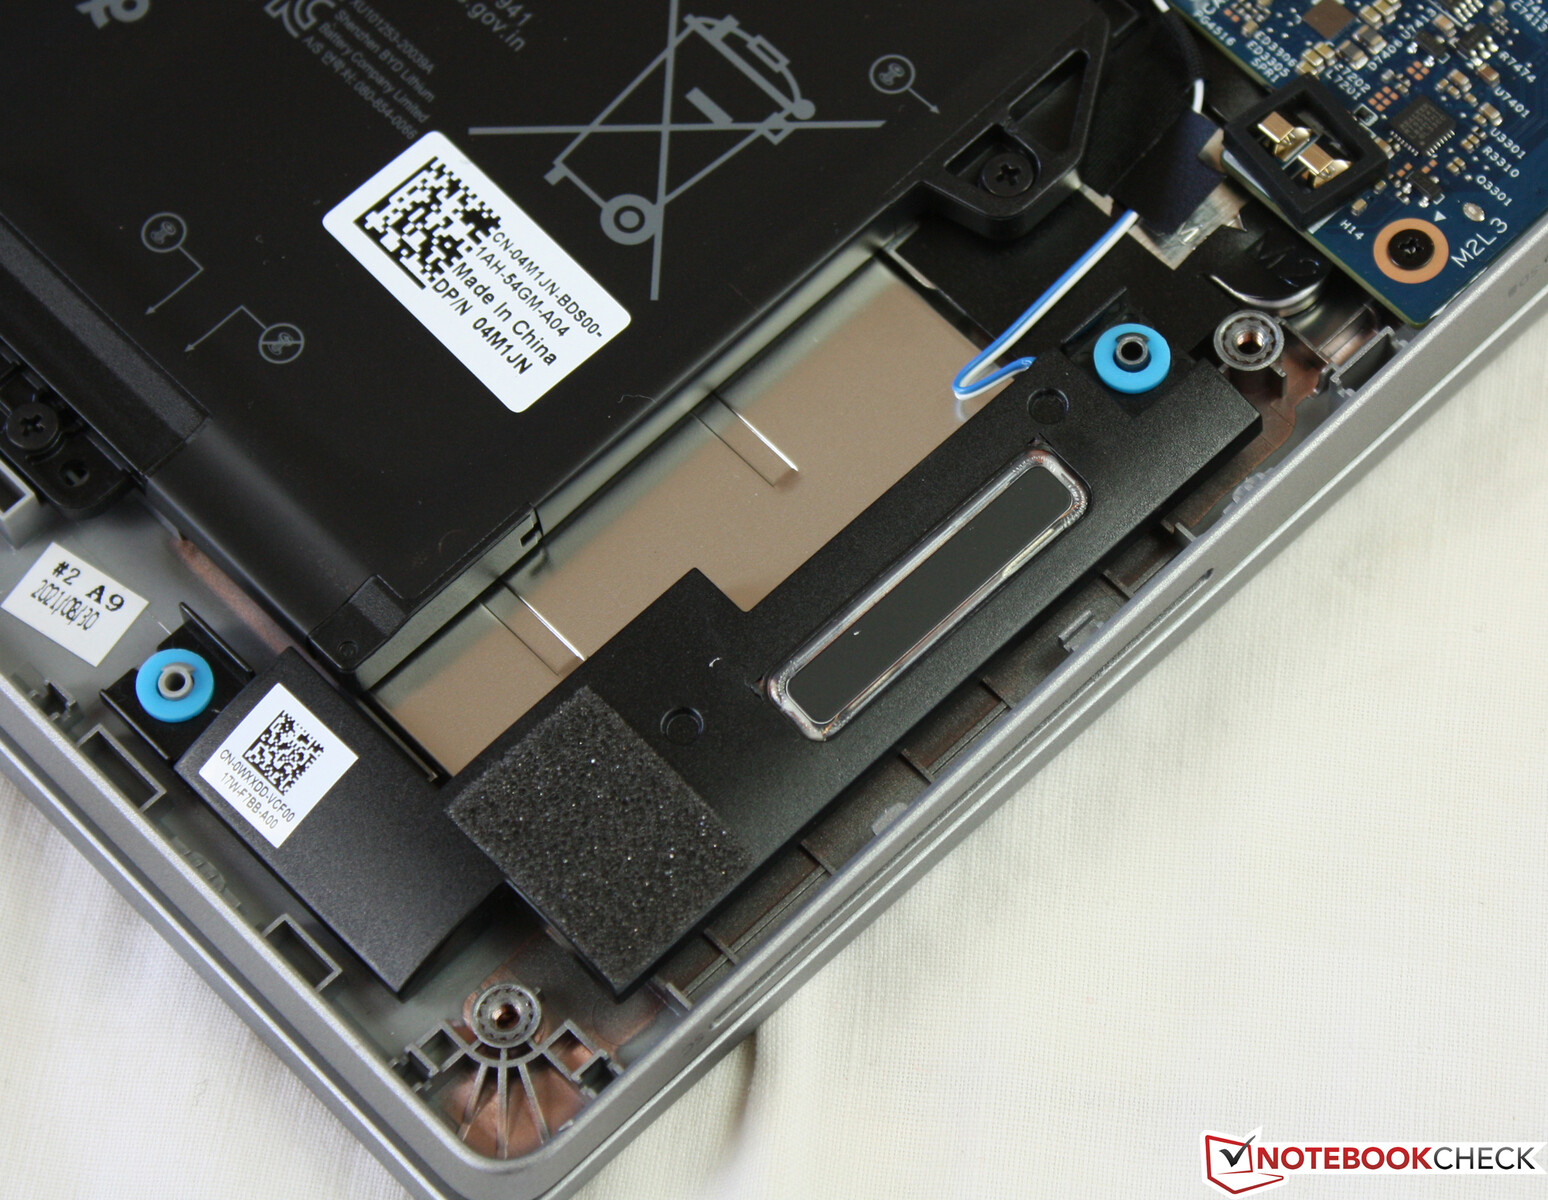
维护
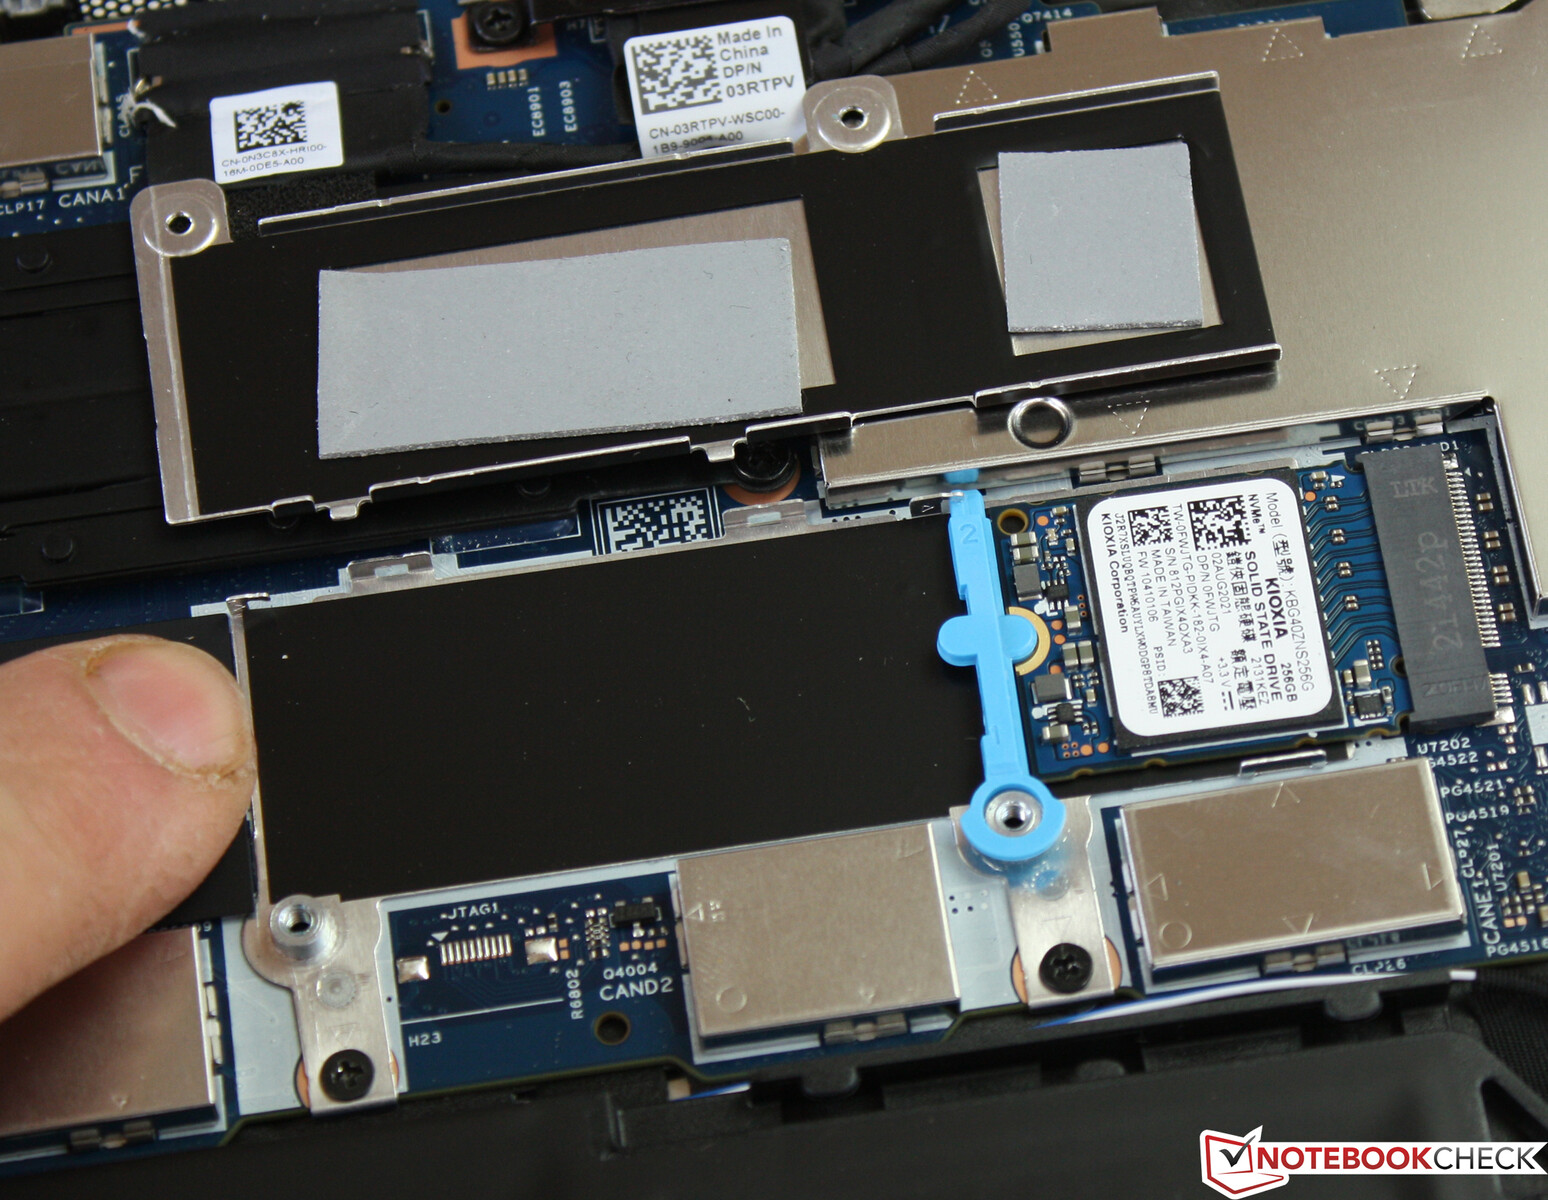
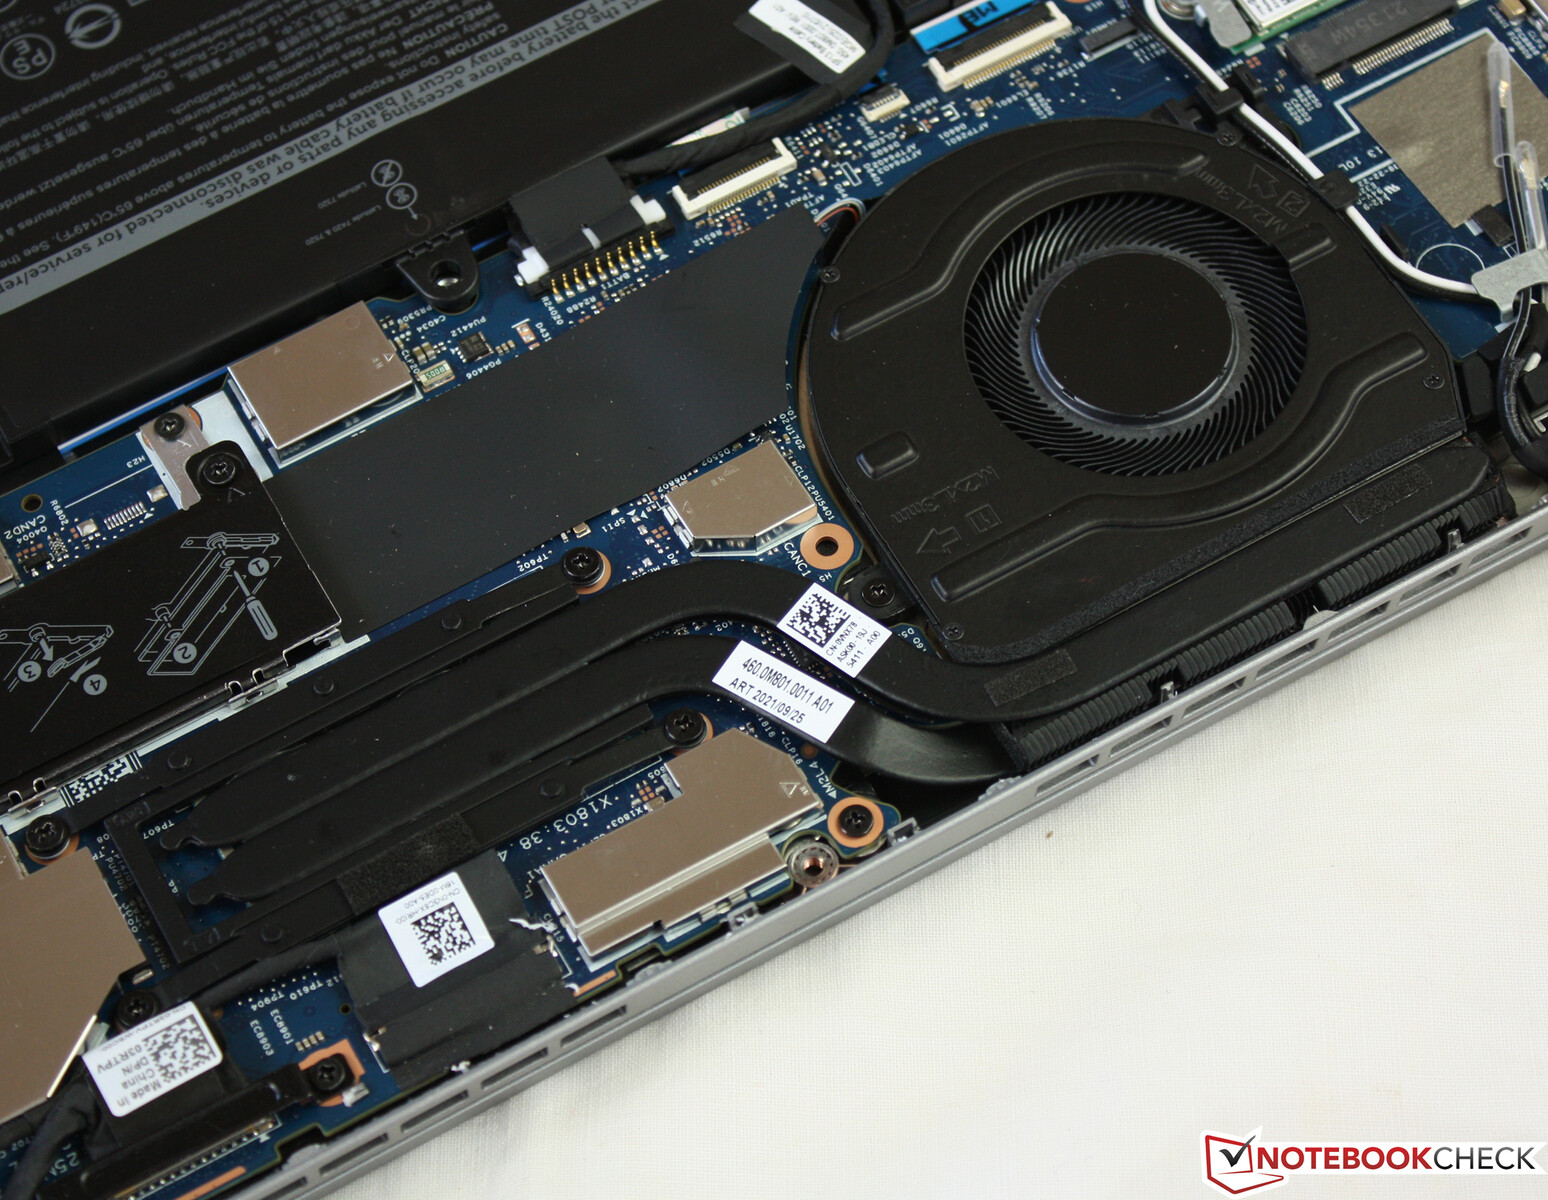
拆除底层外壳后,可以接触到硬件。设备底部的所有螺丝都被松开了。掀开面板时,你应该从铰链区域开始。然后你就可以接触到固态硬盘、电池、WLAN模块、LTE调制解调器(可选,准备有天线)和风扇。没有内存插槽,内存是板载的。
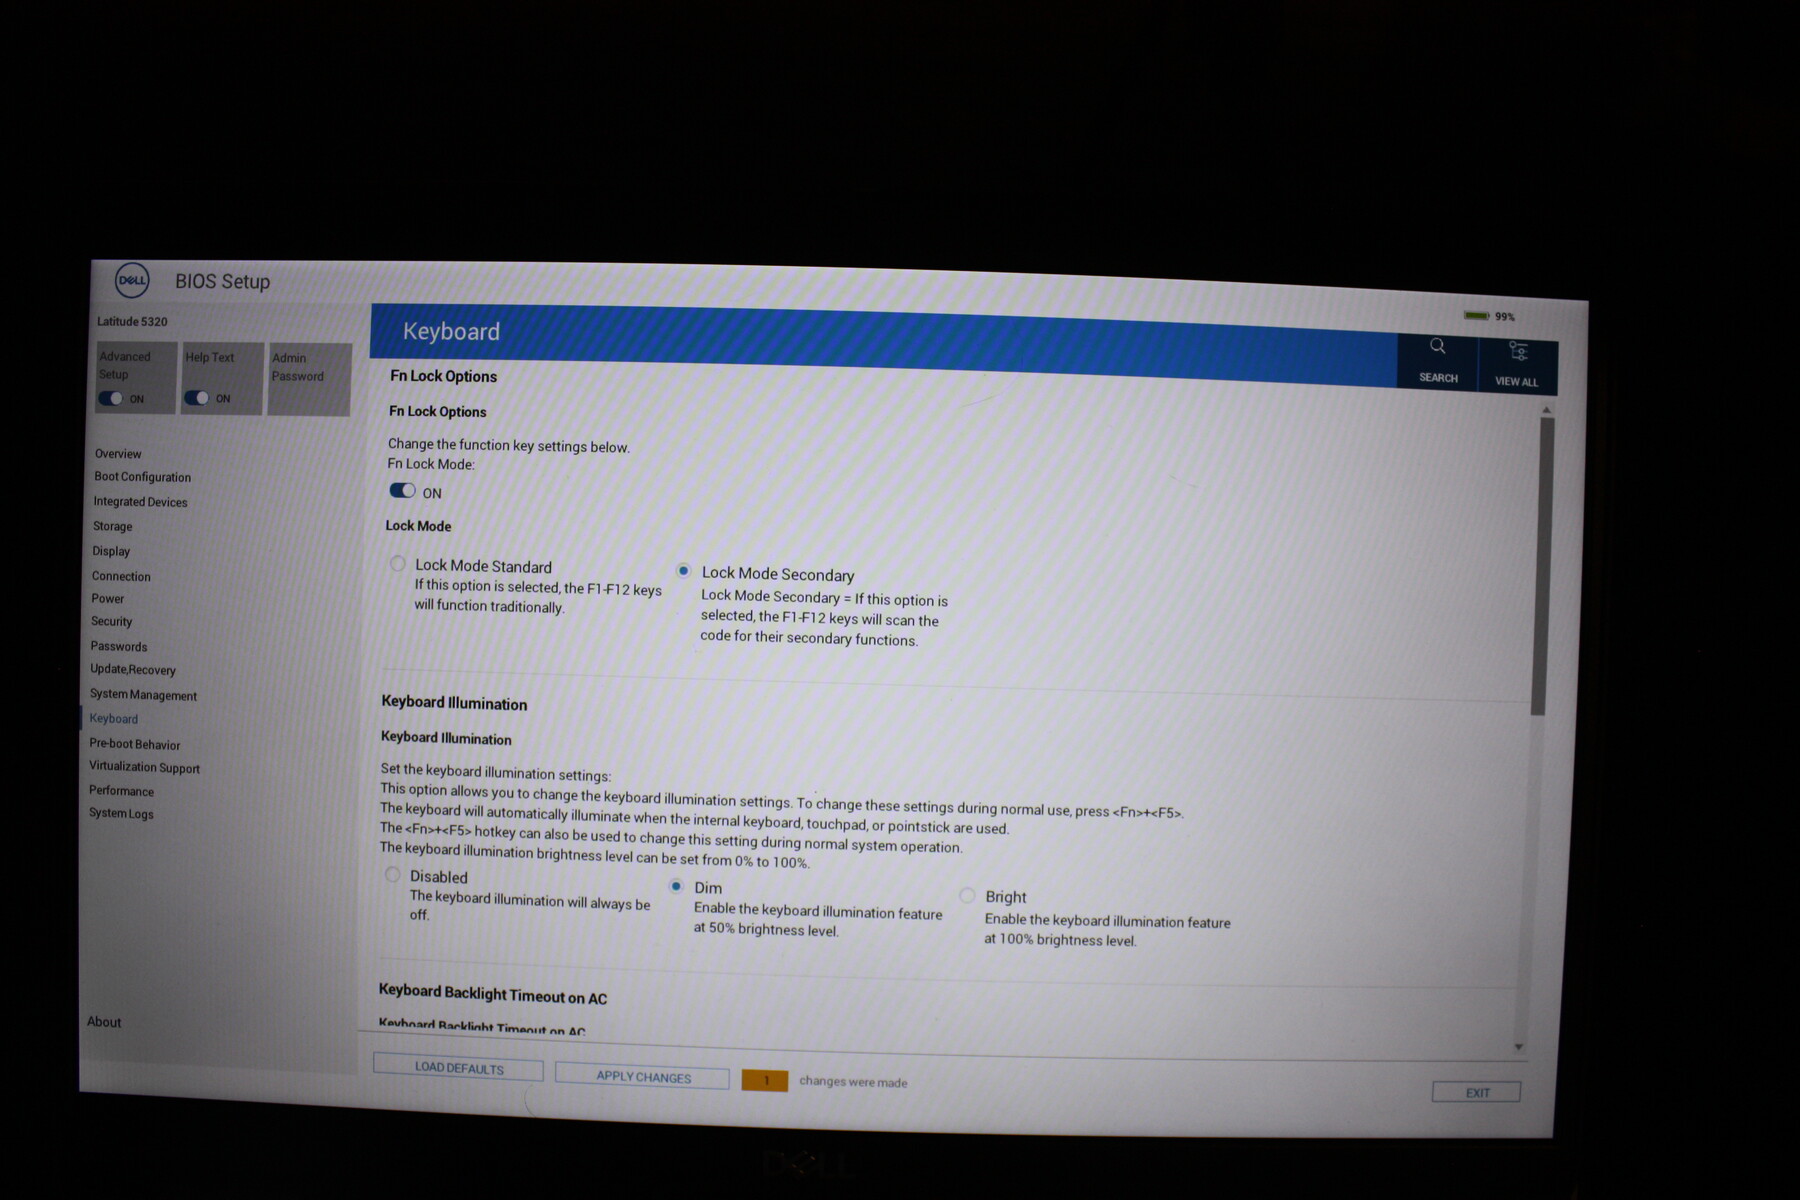
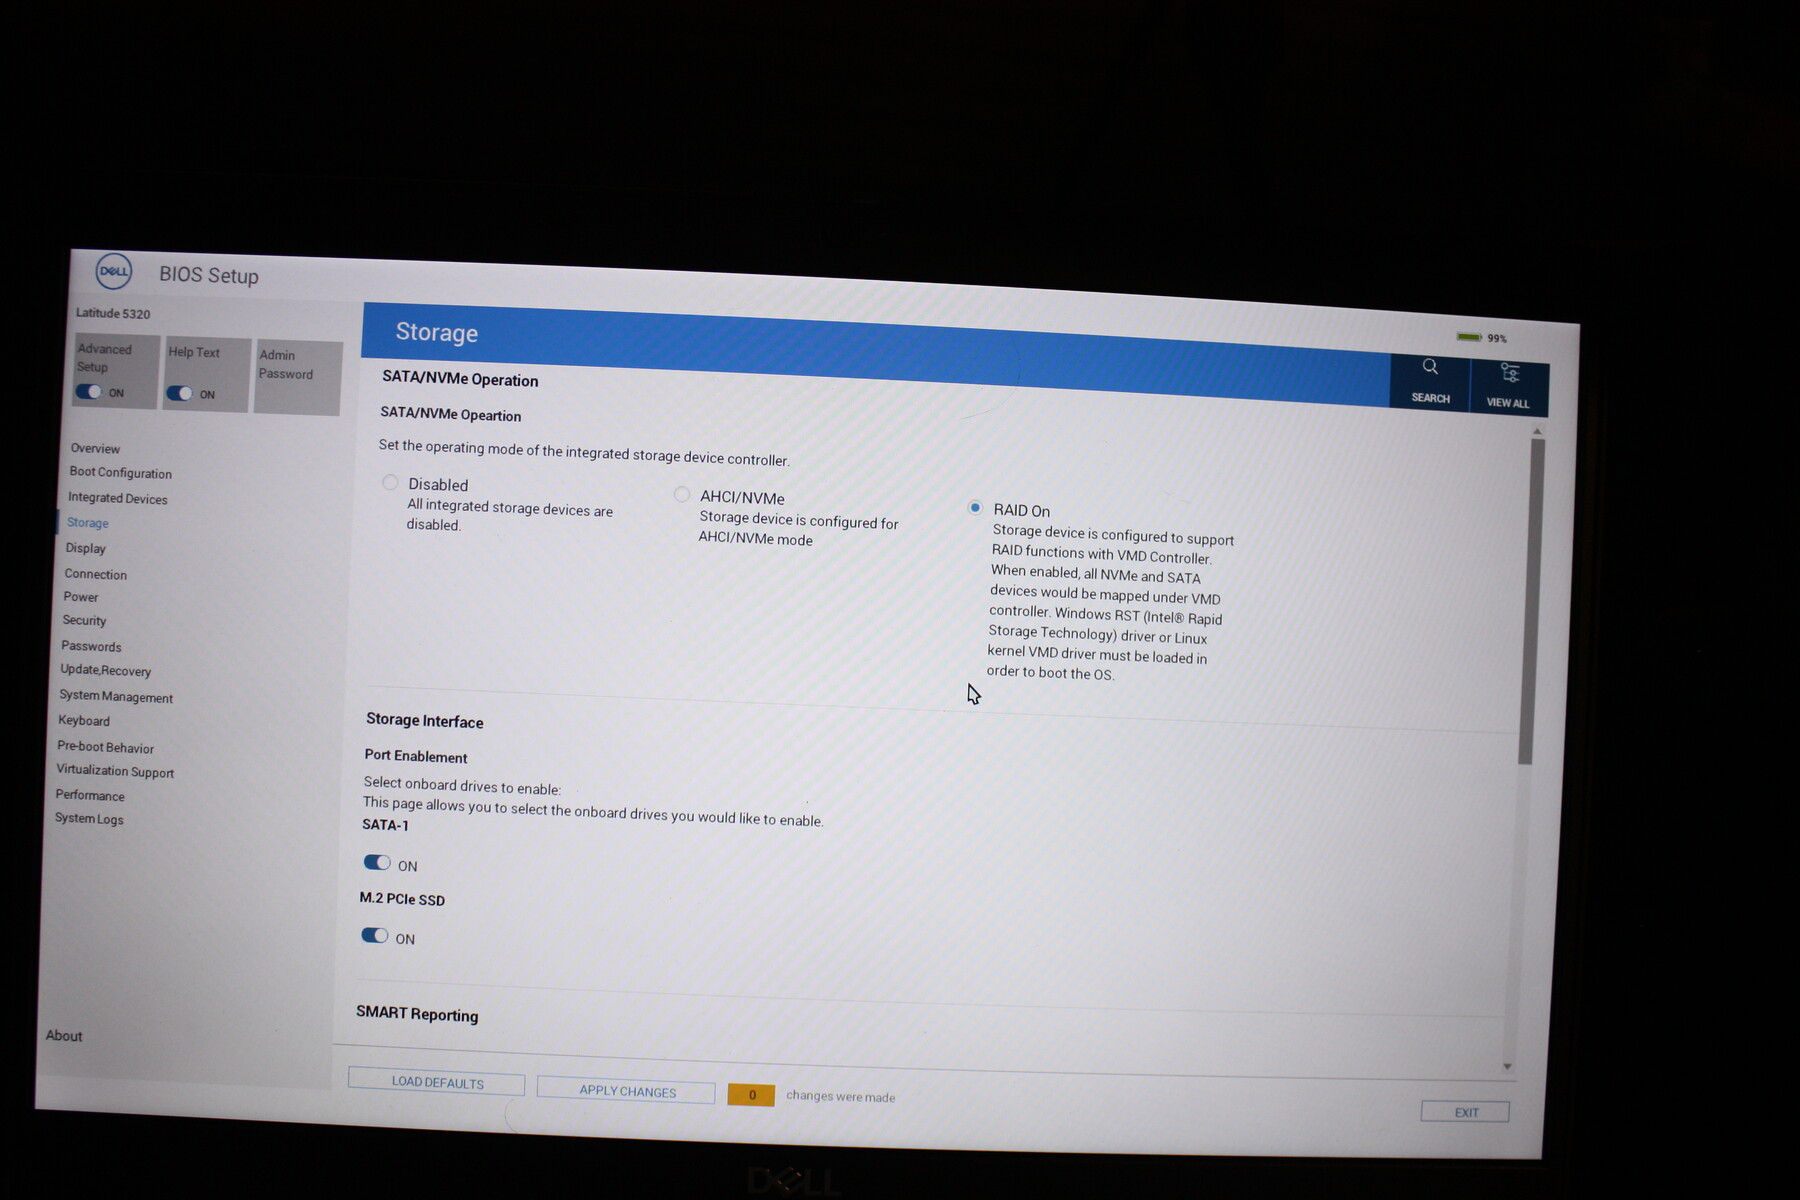
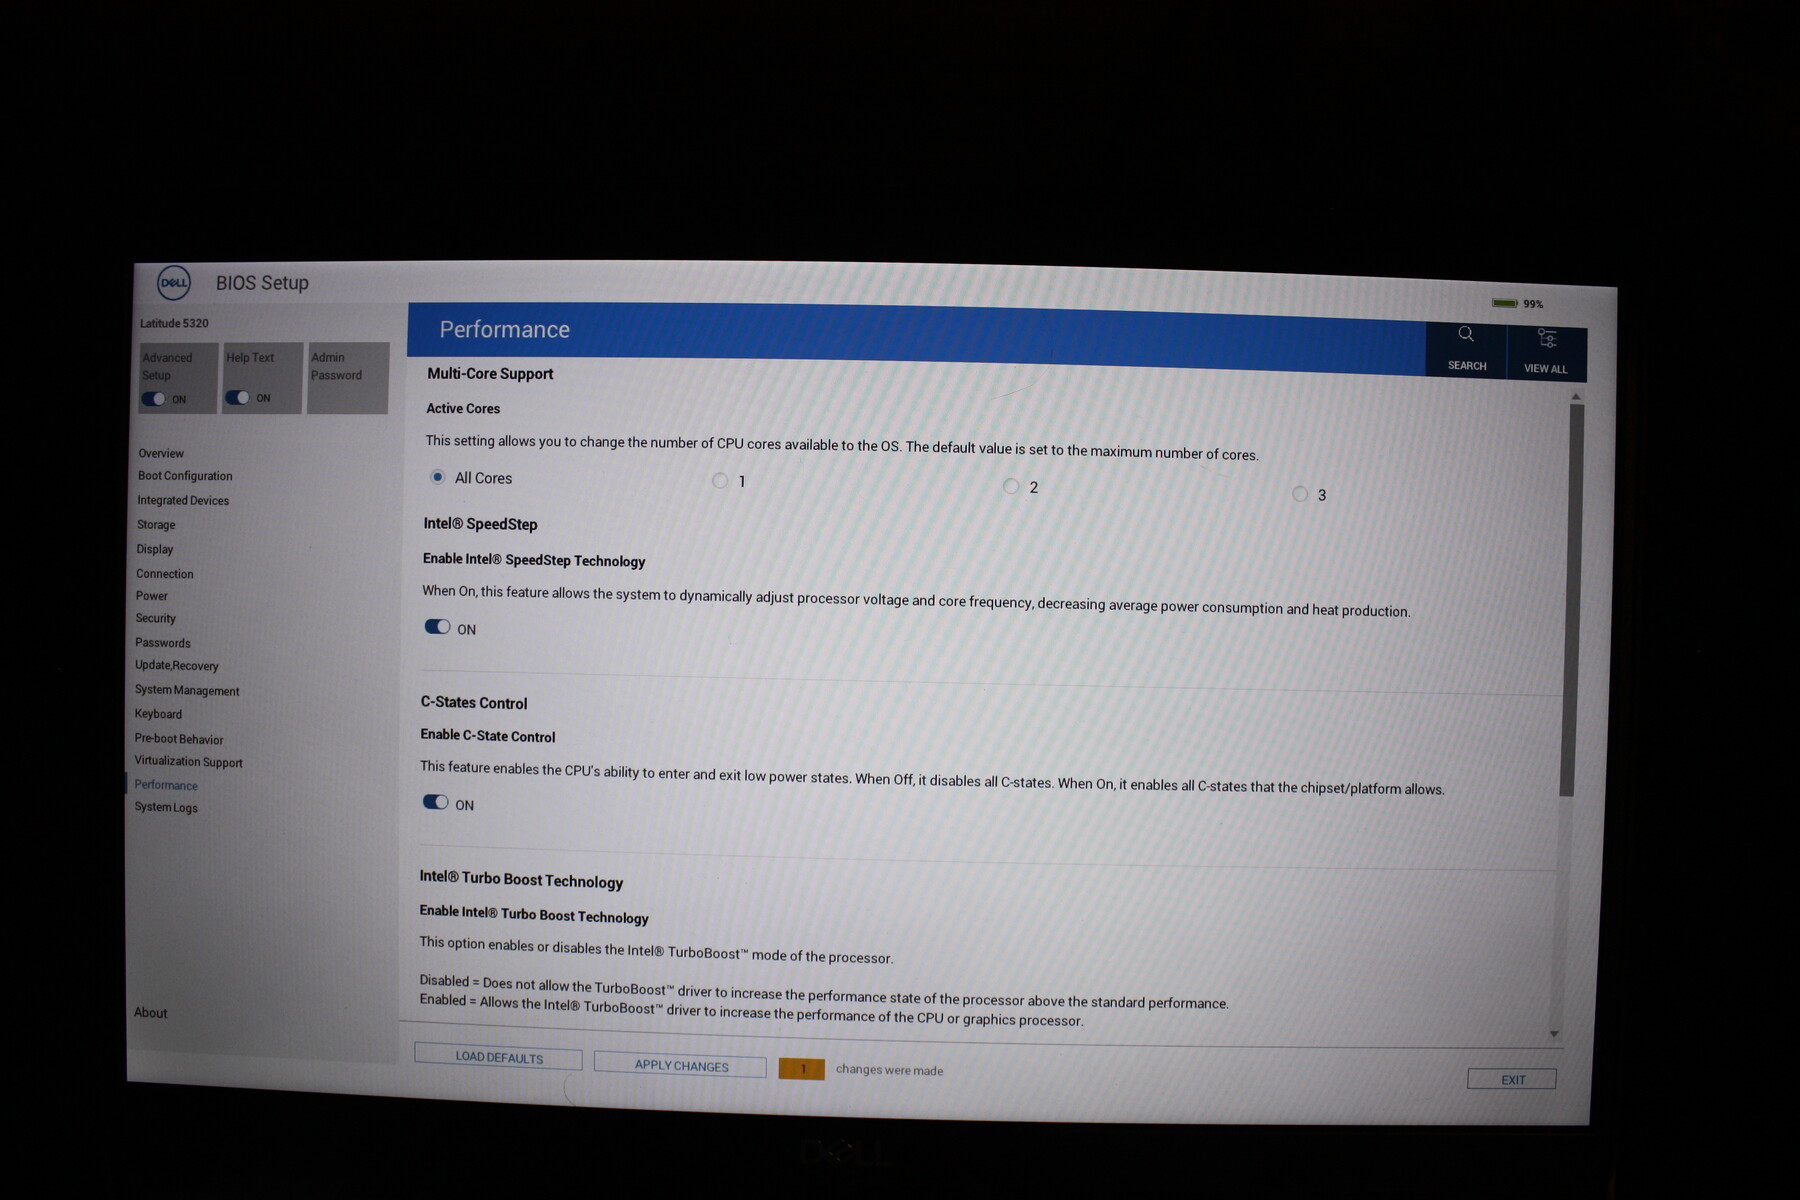
BIOS
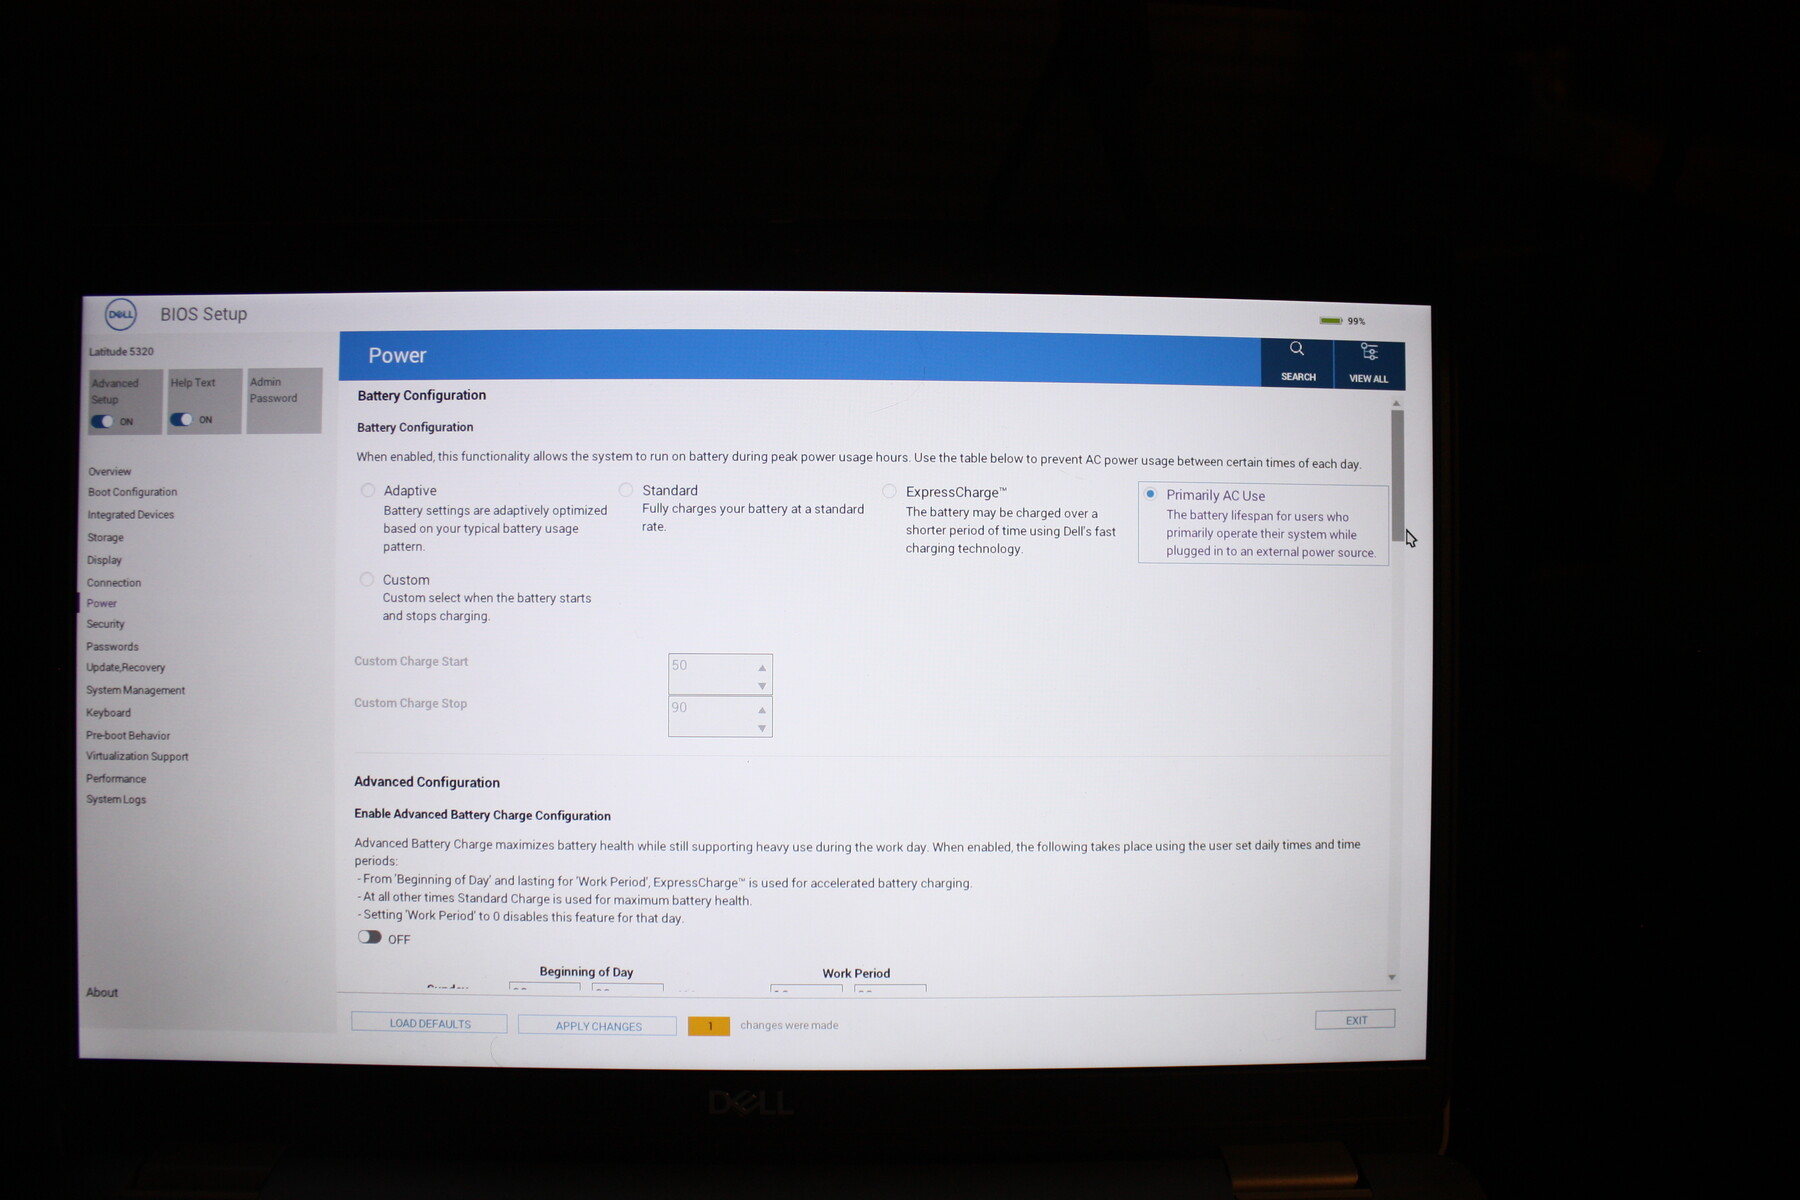
计算机的BIOS提供了有关安全、管理、硬件和能源的广泛配置选项。可以设置活跃的CPU核心数量等细节。还可以设置主电源和电池操作的最大显示亮度。这样广泛的功能在笔记本电脑中是很少见的。
担保
Latitude ,提供一年的现场保修。戴尔提供广泛的扩展选项。例如,四年的专业支持,下一个工作日的现场服务,价格约为370欧元。
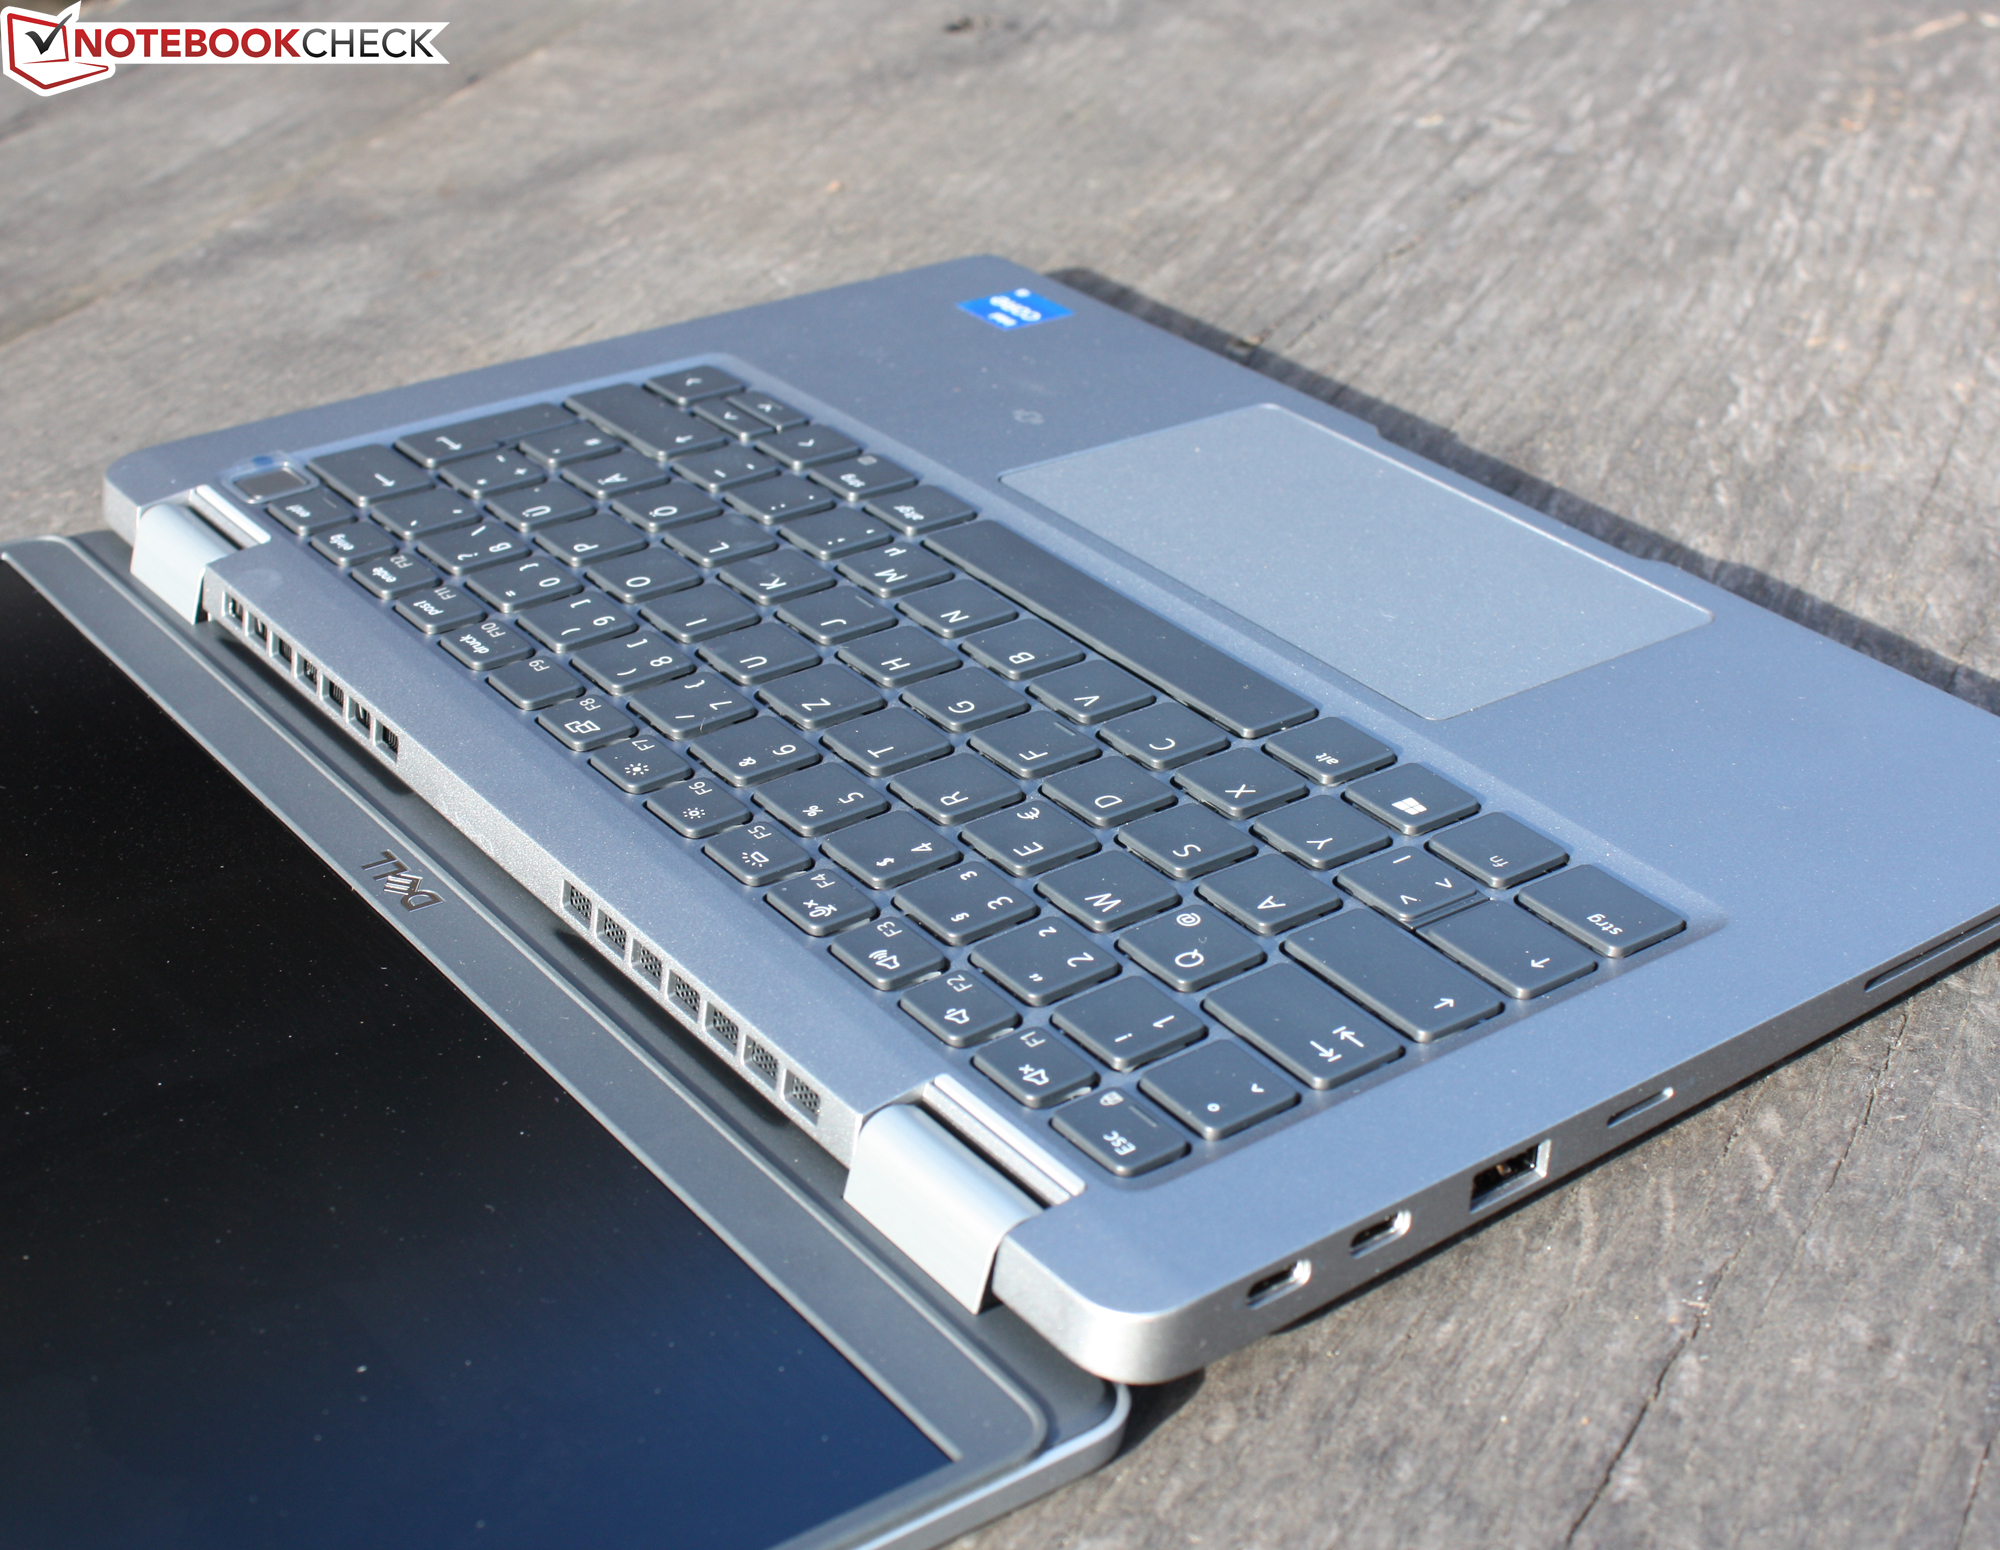
输入设备 - 戴尔的笔记本不再有触摸板按键
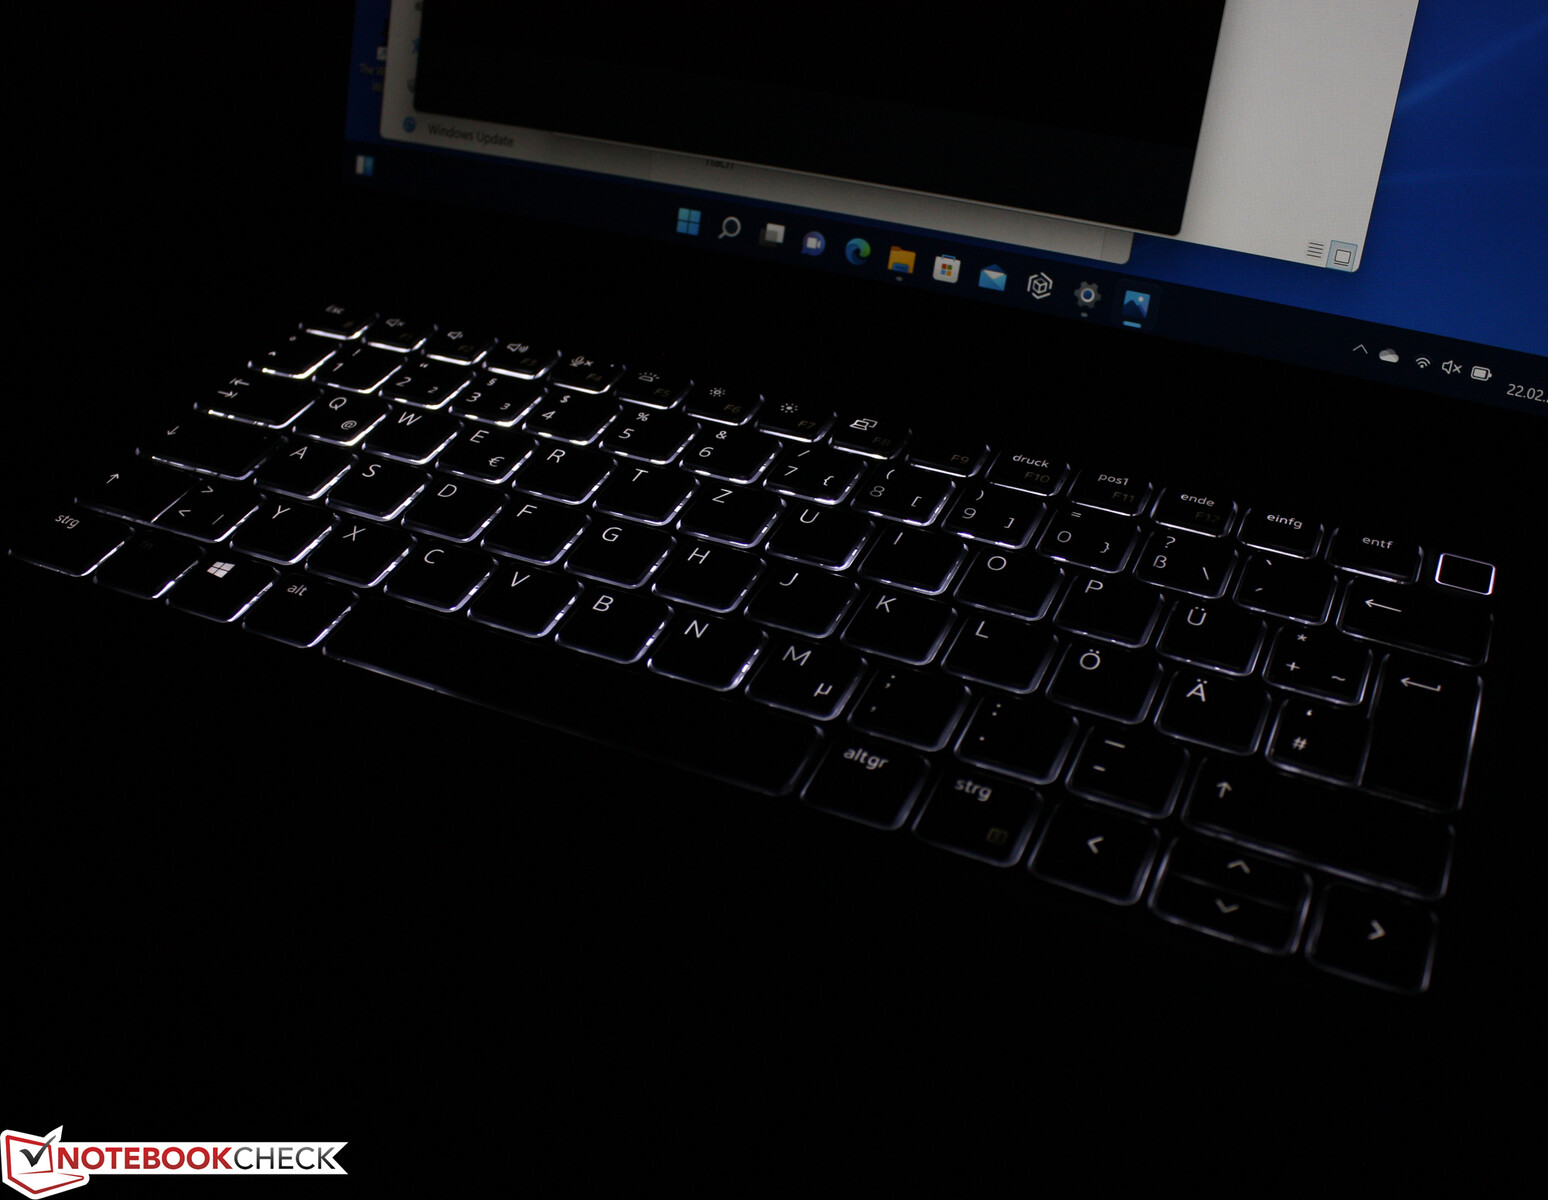
戴尔为Latitude ,配备了一个照明键盘。扁平的钝化键提供了清晰的行程和独特的压力点。这伴随着令人愉快的按键阻力。键程是海绵状和适度坚硬的混合体--这是该键盘的最大缺点。
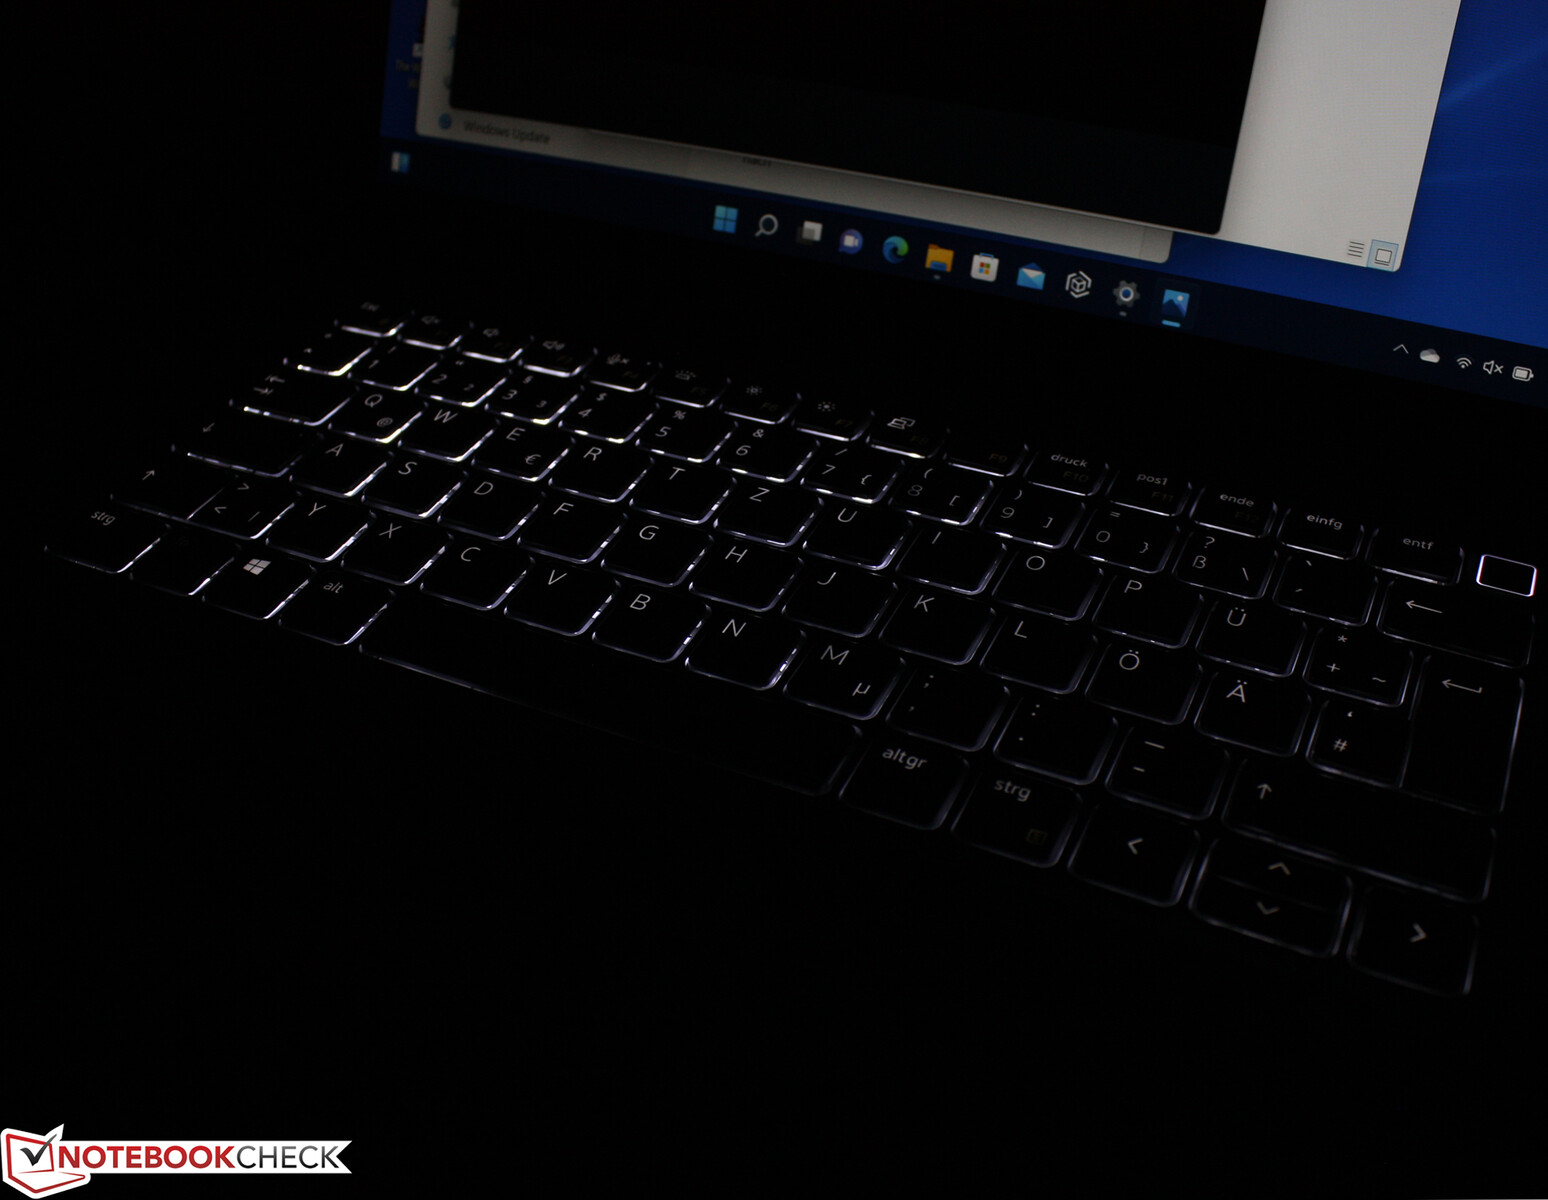
键盘
在打字过程中,键盘在中间和右边会有轻微的倾斜。键盘照明提供了两个亮度级别,可以通过一个功能按钮进行选择。总而言之,这款键盘给人留下了良好的印象,特别是由于良好的反馈,这是由丰富的行程和压力点所保证的。
触摸板
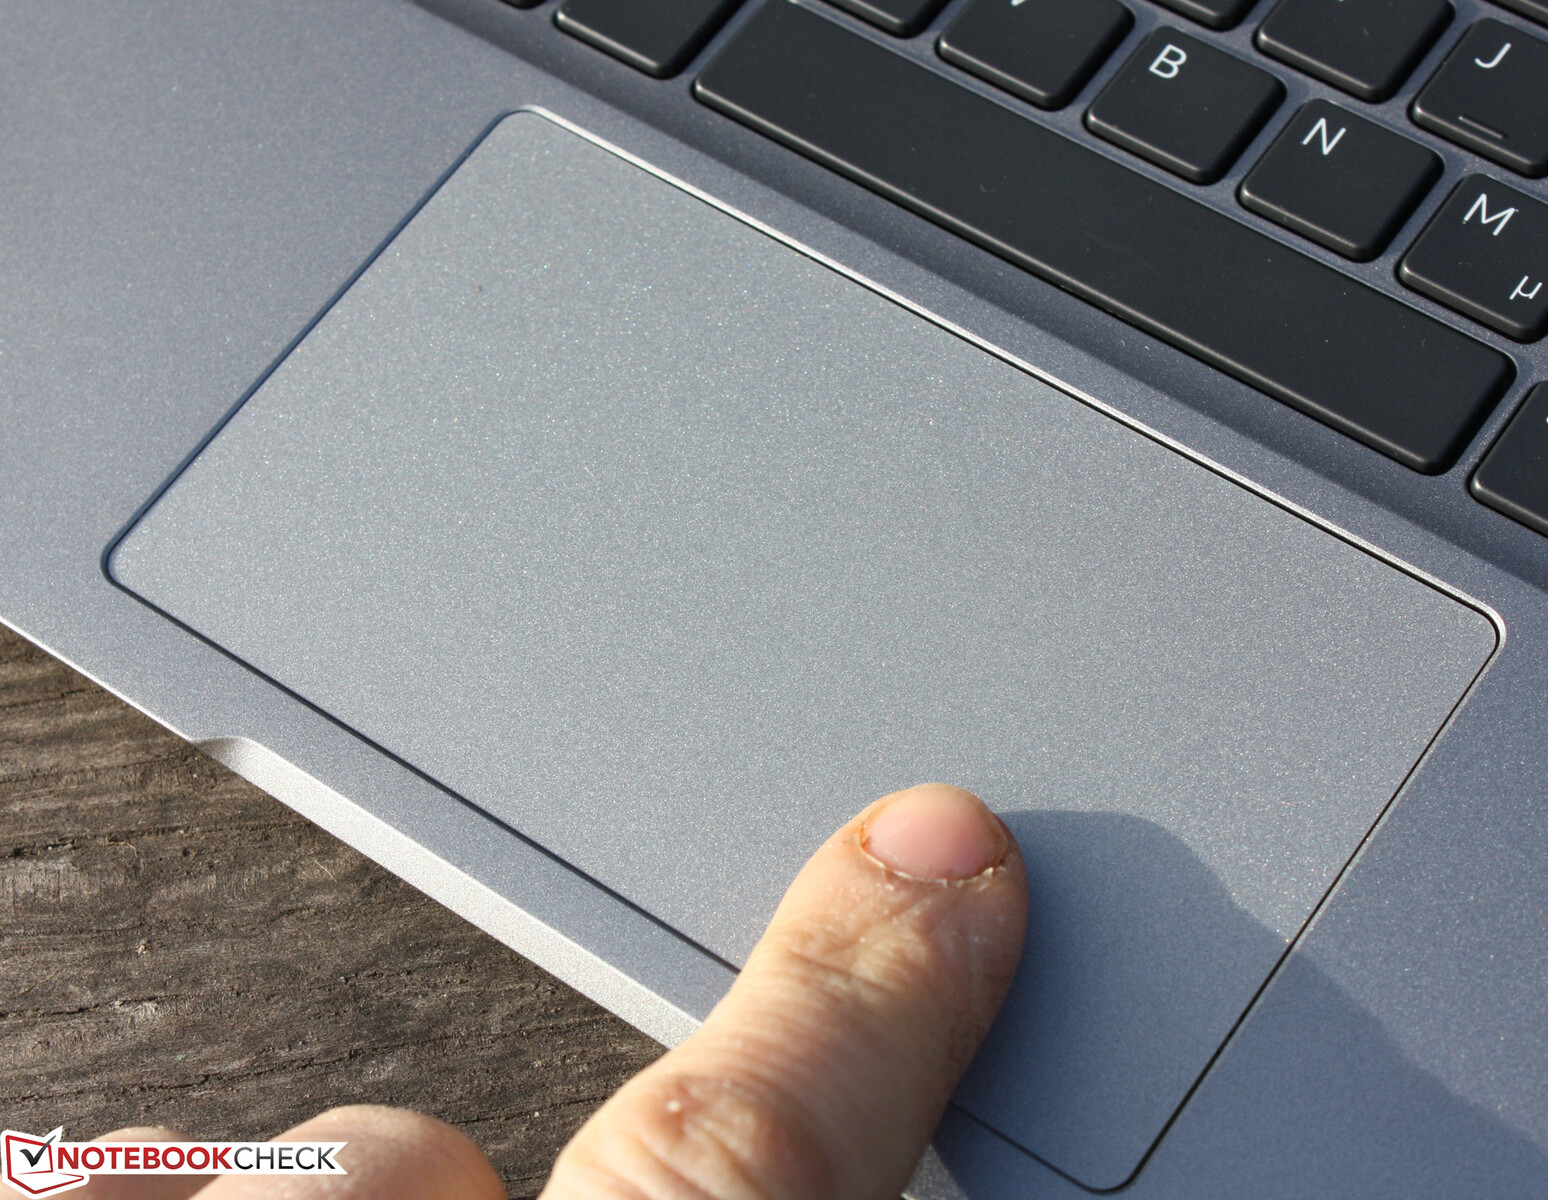
一个具有多点触摸功能的点击板作为鼠标的替代品,占地约11.7 x 6.7厘米。5110的按键触摸板更小。因此,有很多空间可用于使用手势控制。触摸板对角落里的输入也有反应。表面很暗淡,手指总是有明显的摩擦。
不幸的是,垫子上几乎没有行程,这导致了一个不令人满意的压力点。这可能是个人偏好,由于反馈不佳,测试者根本不喜欢这个点击板,操作起来几乎令人不快。不管怎么说,戴尔省略了物理按键并没有给自己带来任何好处。
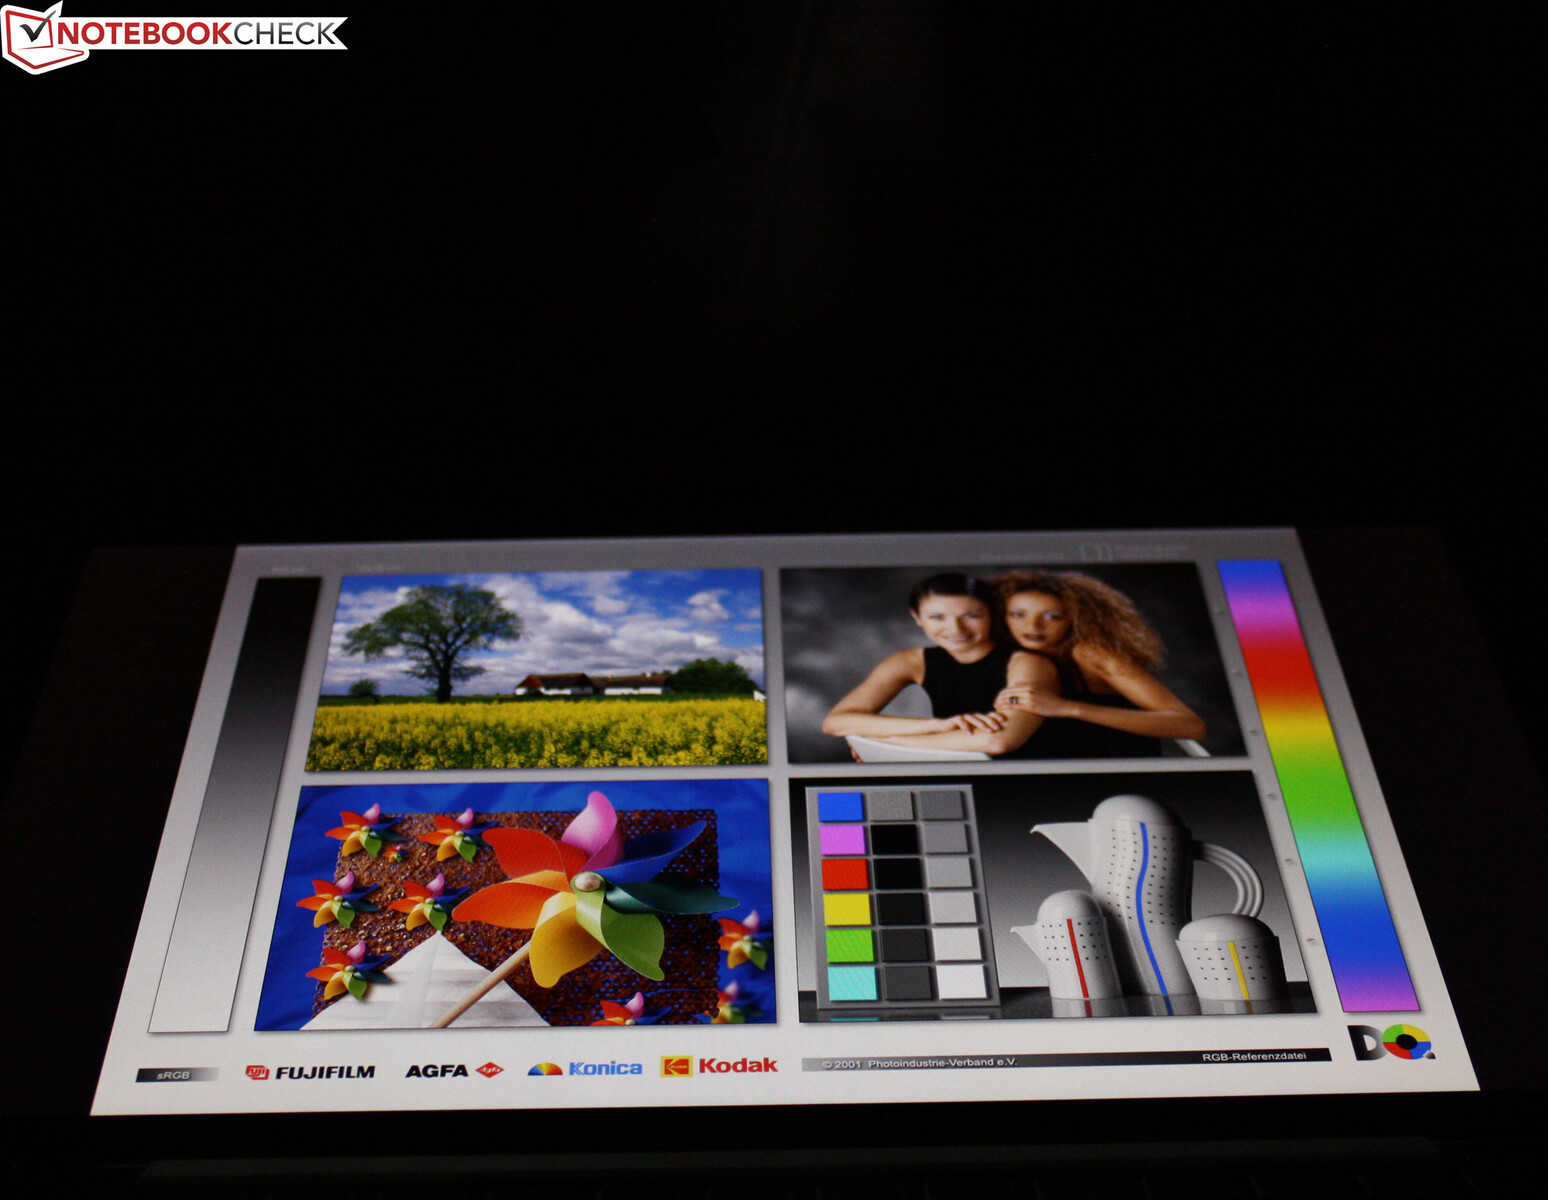
显示器 - 对显示器业务的定位较弱
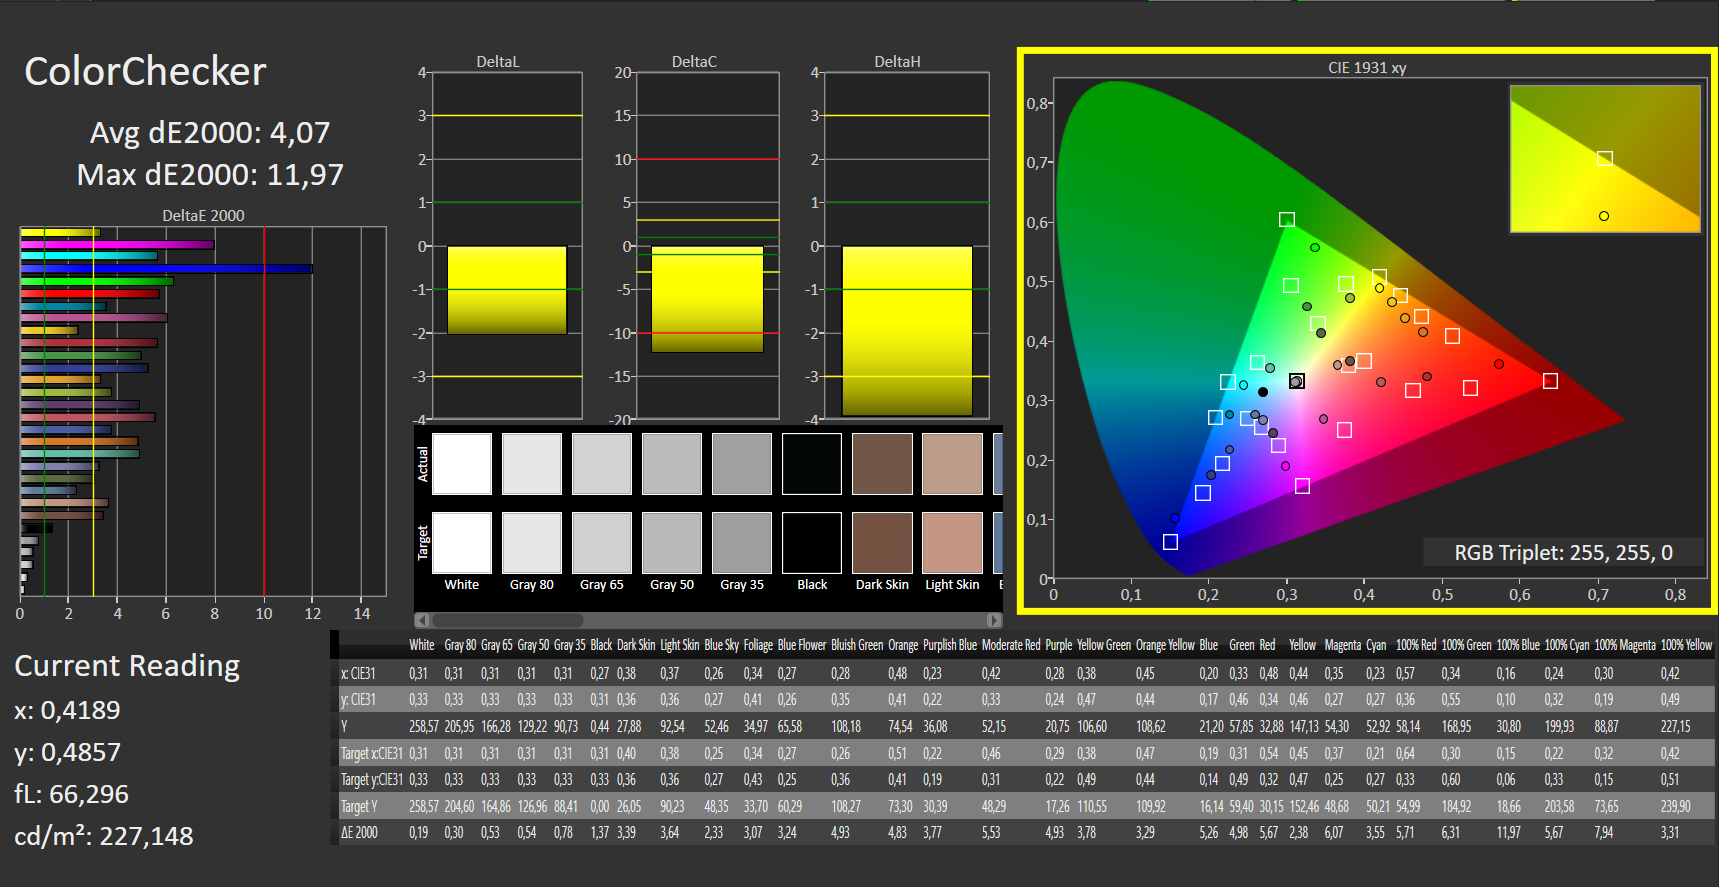
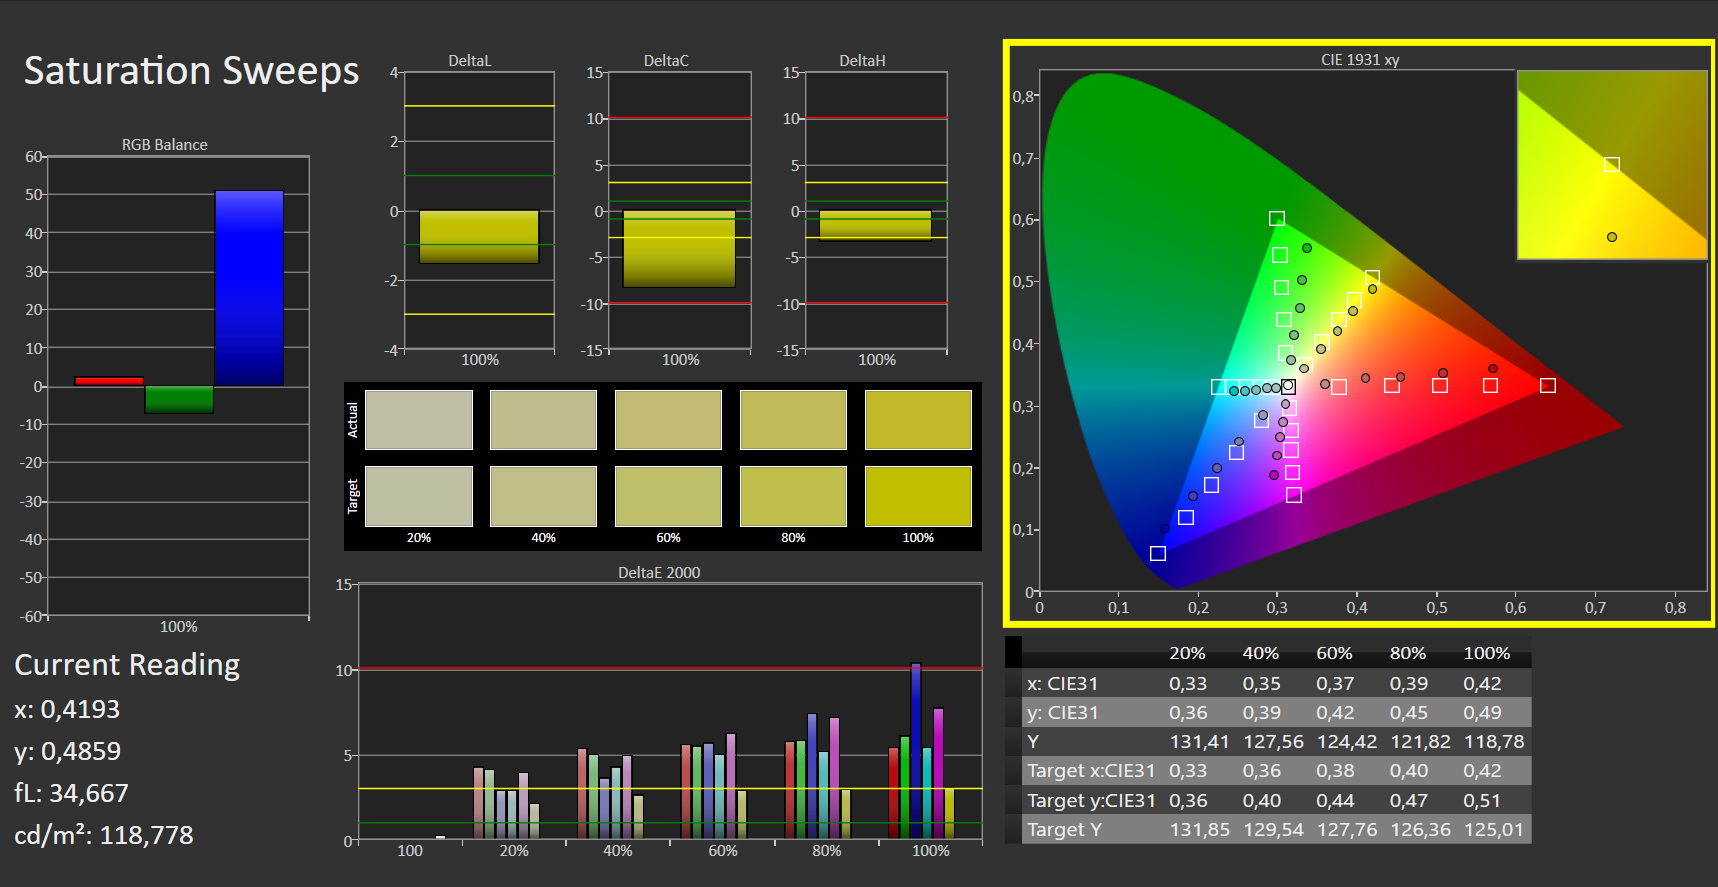
Latitude 的哑光13.3英寸屏幕以1920 x 1080像素的原始分辨率工作。该面板型号只能被理解为戴尔的产品。亮度(248 cd/m²)和对比度(1,083:1)太低--考虑到笔记本的价格水平。我们认为超过300cd/m²和1,000:1的数值是好的。竞争对手有更亮的屏幕,而且通常还有更高的对比度。戴尔提供了一个多点触控/无眩光的变体屏幕,那么它应该有300而不是250 cd/m²的亮度水平。积极的一面。该显示器在任何亮度设置下都不会出现PWM闪烁。
| |||||||||||||||||||||||||
Brightness Distribution: 97 %
Center on Battery: 270 cd/m²
Contrast: 1083:1 (Black: 0.23 cd/m²)
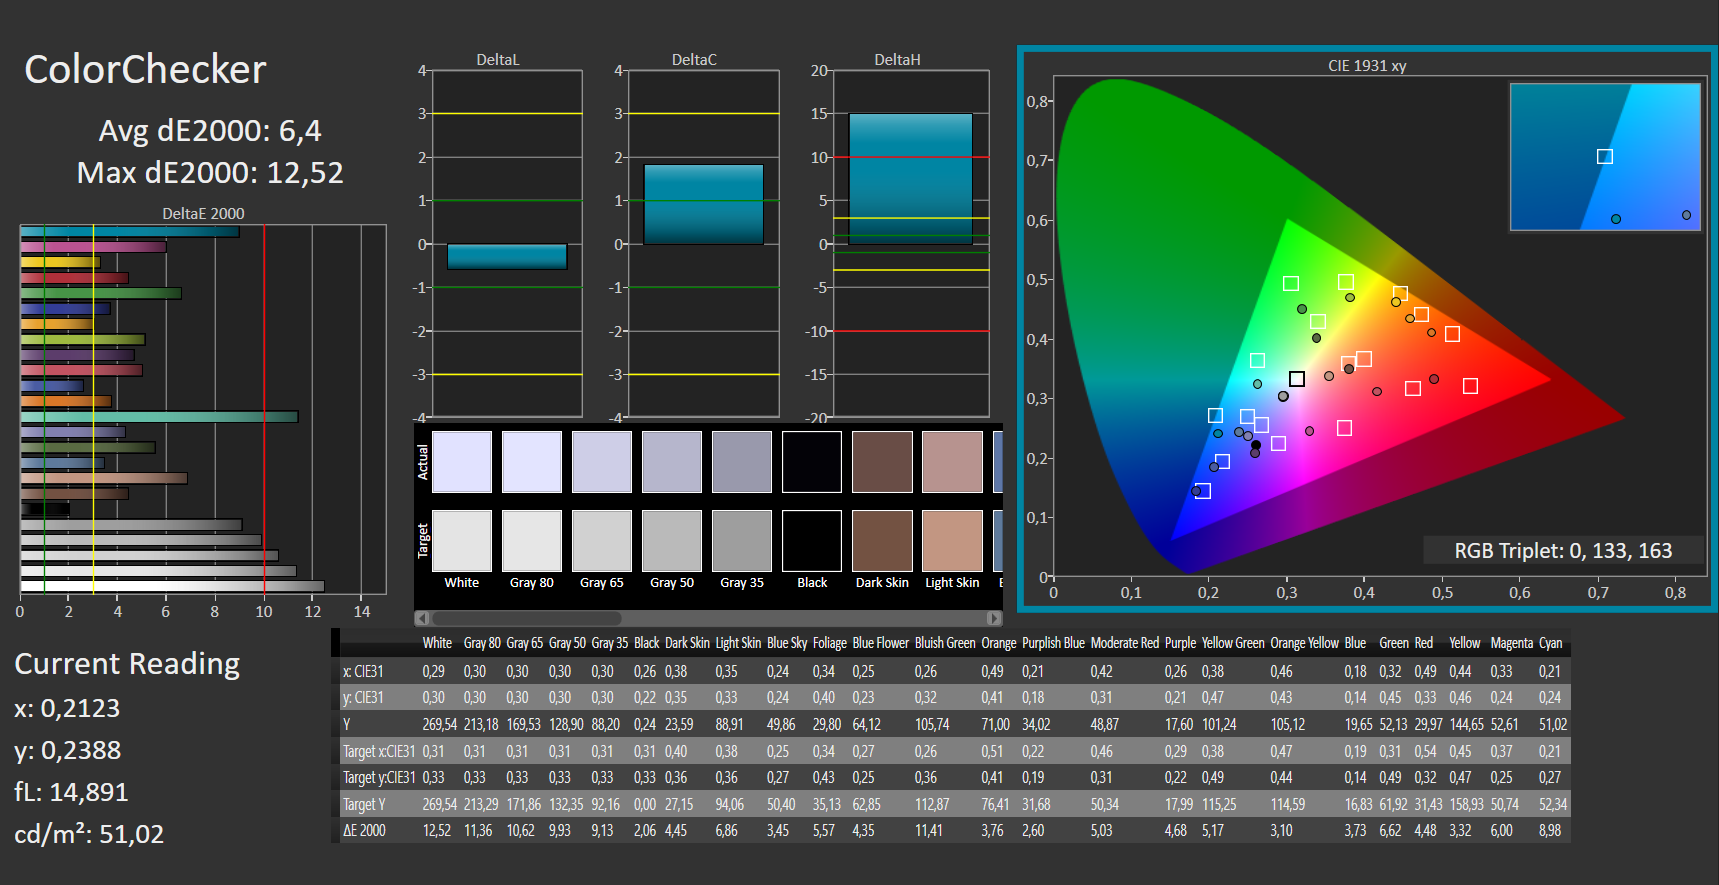
ΔE ColorChecker Calman: 6.4 | ∀{0.5-29.43 Ø4.71}
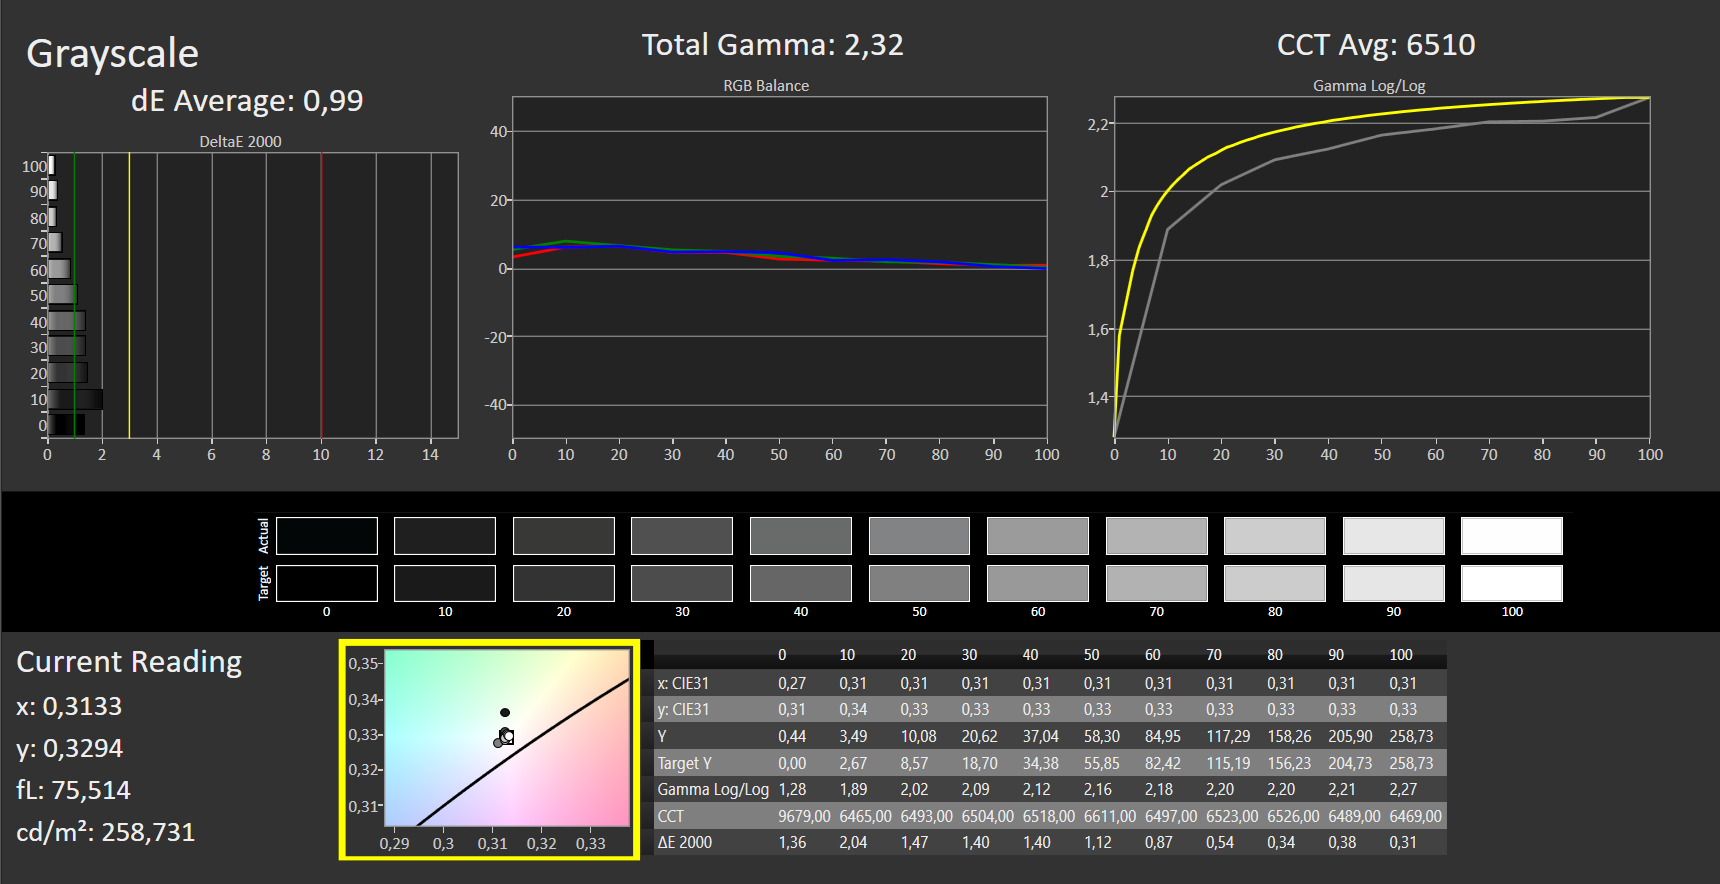
calibrated: 4.07
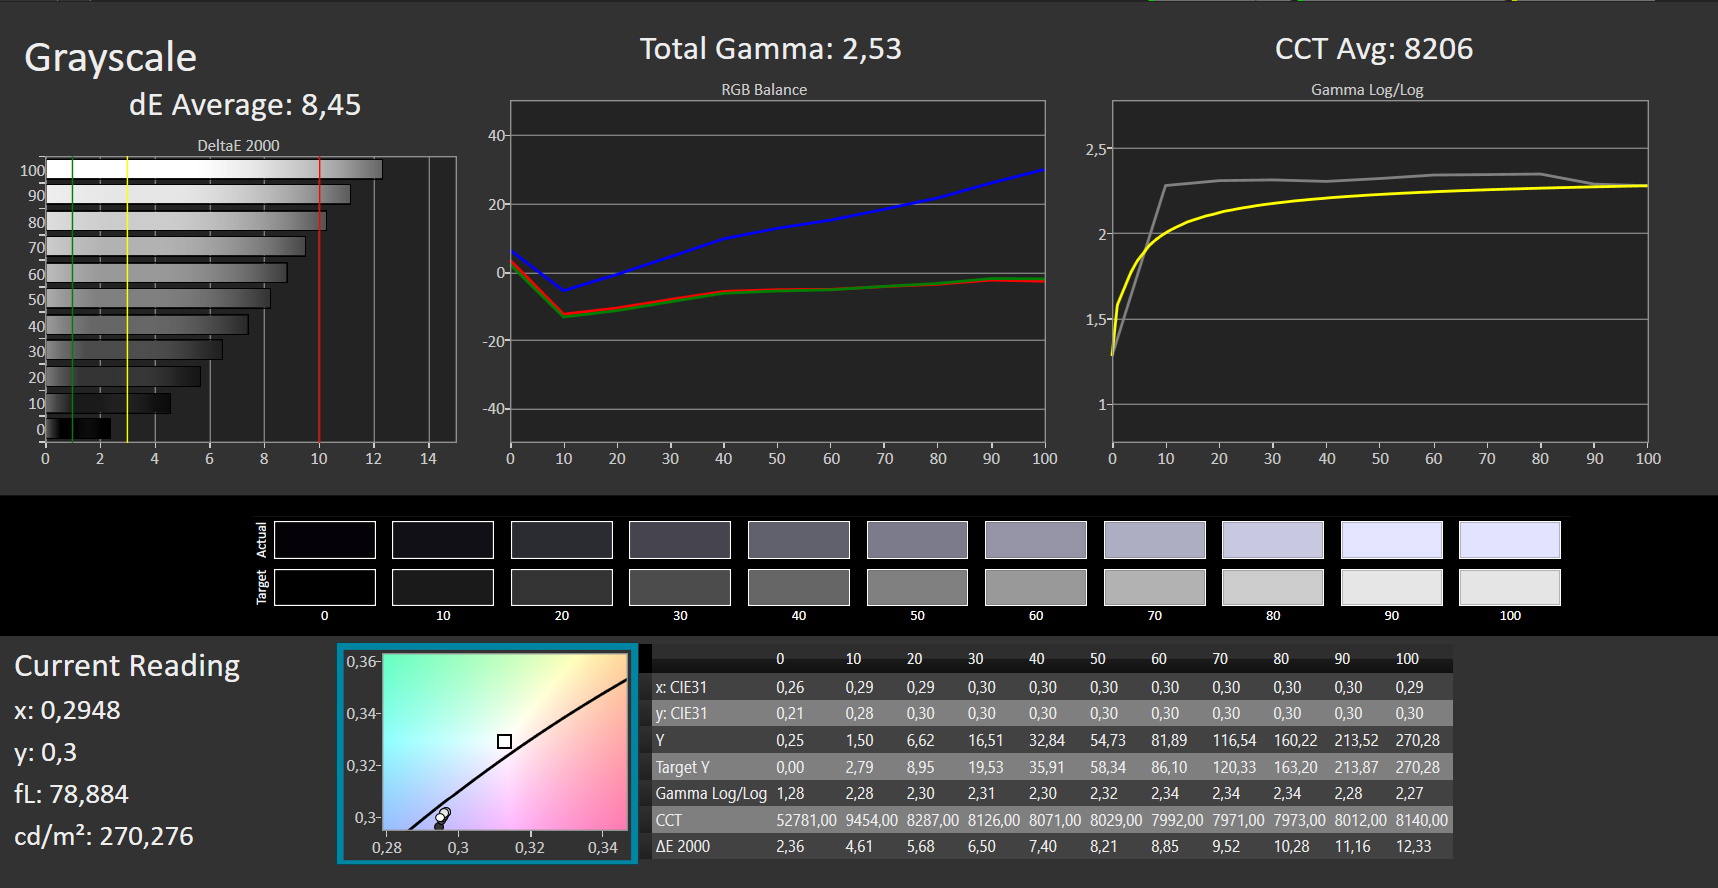
ΔE Greyscale Calman: 8.45 | ∀{0.09-98 Ø4.96}
40.6% AdobeRGB 1998 (Argyll 3D)
59.2% sRGB (Argyll 3D)
39.3% Display P3 (Argyll 3D)
Gamma: 2.53
CCT: 8206 K
| Dell Latitude 5320-TM4V2 Dell 1337L02, IPS, 1920x1080, 13.3" | Dell Latitude 5310-23VP6 Chi Mei CMN1382, IPS, 1920x1080, 13.3" | Lenovo ThinkBook 13s G3 20YA0005GE M133NW4JR0, IPS, 1920x1200, 13.3" | Dell XPS 13 9305 Core i5 FHD Sharp SHP14AE, IPS, 1920x1080, 13.3" | Lenovo ThinkPad L13 Gen2-21AB000PGE IVO M133NWF4 RA, IPS, 1920x1080, 13.3" | Lenovo ThinkBook 14 G2 ITL 20VDS02G00 AU Optronics B140HAN04.E, a-Si IPS LED, 1920x1080, 14" | |
|---|---|---|---|---|---|---|
| Display | 70% | 68% | 66% | -5% | -5% | |
| Display P3 Coverage (%) | 39.3 | 67.5 72% | 67.5 72% | 66.3 69% | 37.47 -5% | 37.2 -5% |
| sRGB Coverage (%) | 59.2 | 99 67% | 97.1 64% | 97.1 64% | 56.3 -5% | 55.5 -6% |
| AdobeRGB 1998 Coverage (%) | 40.6 | 69.2 70% | 68.8 69% | 67.1 65% | 38.7 -5% | 38.4 -5% |
| Response Times | 9% | -31% | -23% | -25% | -14% | |
| Response Time Grey 50% / Grey 80% * (ms) | 36 ? | 36 ? -0% | 53.2 ? -48% | 55 ? -53% | 49.2 ? -37% | 45.9 ? -27% |
| Response Time Black / White * (ms) | 29 ? | 24 ? 17% | 32.8 ? -13% | 27 ? 7% | 32.8 ? -13% | 29 ? -0% |
| PWM Frequency (Hz) | 2500 ? | 996 ? | ||||
| Screen | 37% | 49% | 40% | 20% | 8% | |
| Brightness middle (cd/m²) | 249 | 383 54% | 379 52% | 486 95% | 294 18% | 386 55% |
| Brightness (cd/m²) | 248 | 364 47% | 356 44% | 446 80% | 273 10% | 348 40% |
| Brightness Distribution (%) | 97 | 84 -13% | 88 -9% | 77 -21% | 87 -10% | 83 -14% |
| Black Level * (cd/m²) | 0.23 | 0.34 -48% | 0.23 -0% | 0.4 -74% | 0.275 -20% | 0.29 -26% |
| Contrast (:1) | 1083 | 1126 4% | 1648 52% | 1215 12% | 1069 -1% | 1331 23% |
| Colorchecker dE 2000 * | 6.4 | 2.24 65% | 1.6 75% | 2.54 60% | 3.81 40% | 6.3 2% |
| Colorchecker dE 2000 max. * | 12.52 | 3.32 73% | 2.7 78% | 4.34 65% | 6.22 50% | 18.3 -46% |
| Colorchecker dE 2000 calibrated * | 4.07 | 0.72 82% | 1 75% | 1.04 74% | 3.29 19% | 4.1 -1% |
| Greyscale dE 2000 * | 8.45 | 2.42 71% | 2 76% | 2.34 72% | 2.28 73% | 5.4 36% |
| Gamma | 2.53 87% | 2.65 83% | 2.25 98% | 2.28 96% | 2.48 89% | 2.55 86% |
| CCT | 8206 79% | 6776 96% | 6835 95% | 6864 95% | 6820 95% | 5894 110% |
| Color Space (Percent of AdobeRGB 1998) (%) | 56 | 62 | ||||
| Color Space (Percent of sRGB) (%) | 99 | 97 | ||||
| Total Average (Program / Settings) | 39% /
40% | 29% /
42% | 28% /
37% | -3% /
8% | -4% /
2% |
* ... smaller is better
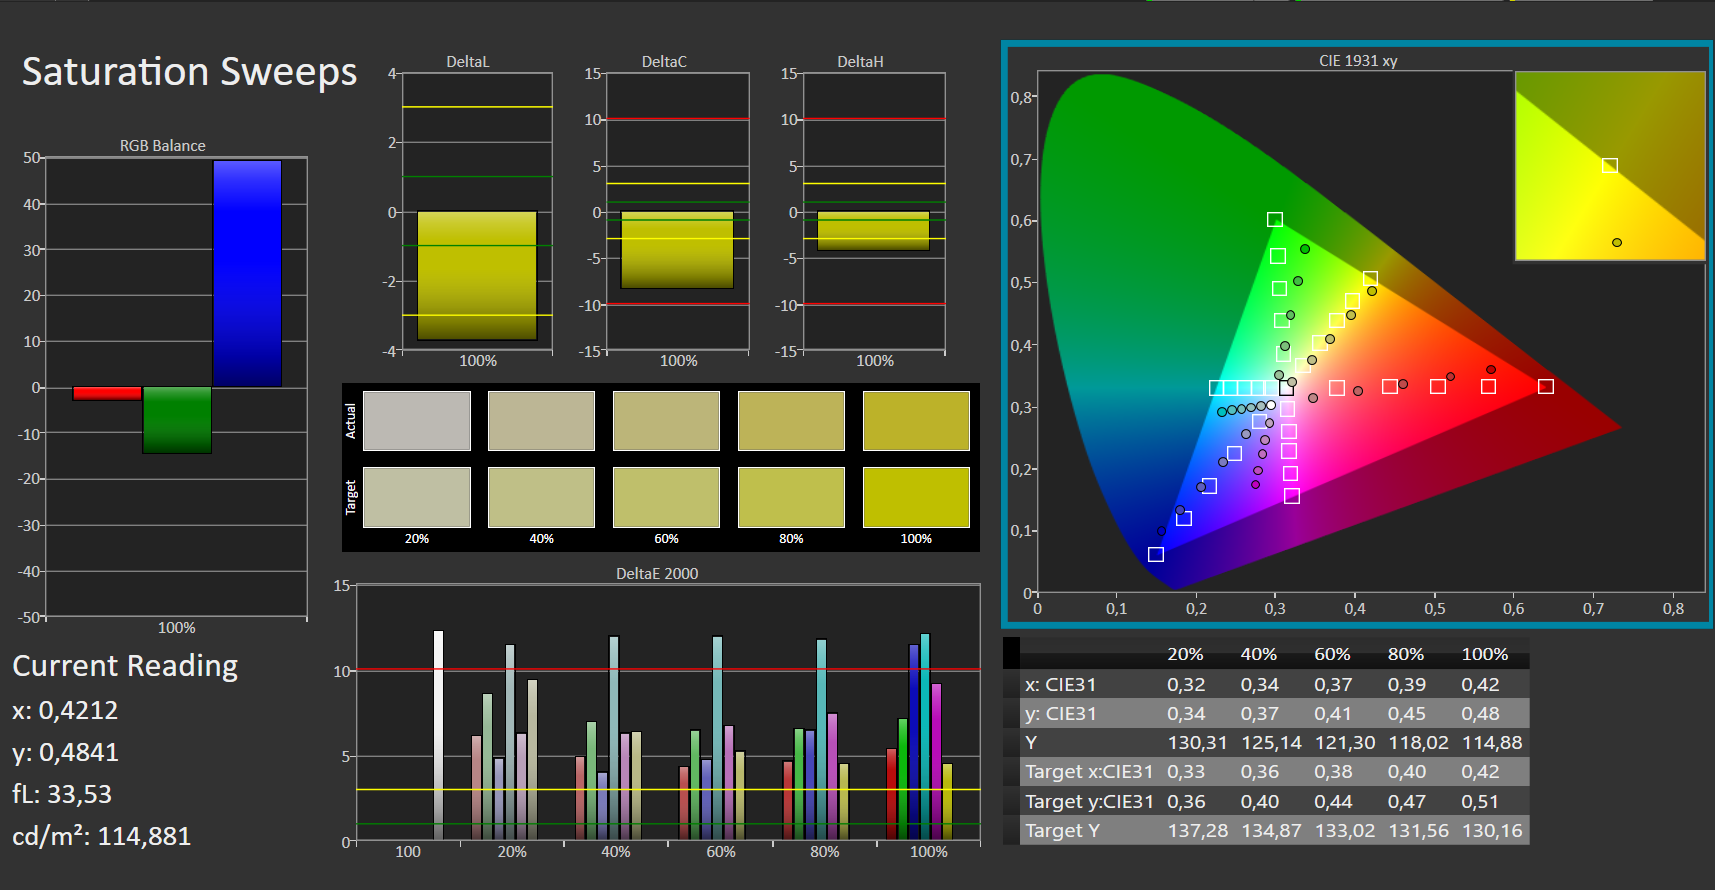
屏幕在交付状态下显示出糟糕的色彩再现。在DeltaE-2000色彩偏差为8的情况下,目标(DeltaE小于3)被错过。至少可以通过校准消除不良的DeltaE,在这个过程中,灰度值从8降低到1。作为5320的拥有者,你可以试试我们在上面方框中链接的颜色配置文件,这样即使没有光谱仪,你也会得到更准确的颜色。对于颜色,DeltaE只从6提高到4。
该显示器没有偏蓝的问题,这在IPS面板上已不再常见。AdobeRGB(40%)和sRGB(59%)色彩空间没有得到完全再现。采用奇美面板的前辈在这里有更好的速率,而且亮度也明显更高。这也是所有其他竞争者的情况,即使他们部分具有类似的不良色彩空间(ThinkPad L13 Gen2, ThinkBook 14 G2 ITL).
Display Response Times
| ↔ Response Time Black to White | ||
|---|---|---|
| 29 ms ... rise ↗ and fall ↘ combined | ↗ 13 ms rise |  |
| ↘ 16 ms fall | ||
| The screen shows relatively slow response rates in our tests and may be too slow for gamers. In comparison, all tested devices range from 0.1 (minimum) to 240 (maximum) ms. » 77 % of all devices are better. This means that the measured response time is worse than the average of all tested devices (19.8 ms). | ||
| ↔ Response Time 50% Grey to 80% Grey | ||
| 36 ms ... rise ↗ and fall ↘ combined | ↗ 19 ms rise |  |
| ↘ 17 ms fall | ||
| The screen shows slow response rates in our tests and will be unsatisfactory for gamers. In comparison, all tested devices range from 0.165 (minimum) to 636 (maximum) ms. » 51 % of all devices are better. This means that the measured response time is worse than the average of all tested devices (31 ms). | ||
Screen Flickering / PWM (Pulse-Width Modulation)
| Screen flickering / PWM not detected |  | ||
In comparison: 52 % of all tested devices do not use PWM to dim the display. If PWM was detected, an average of 7757 (minimum: 5 - maximum: 343500) Hz was measured. | |||
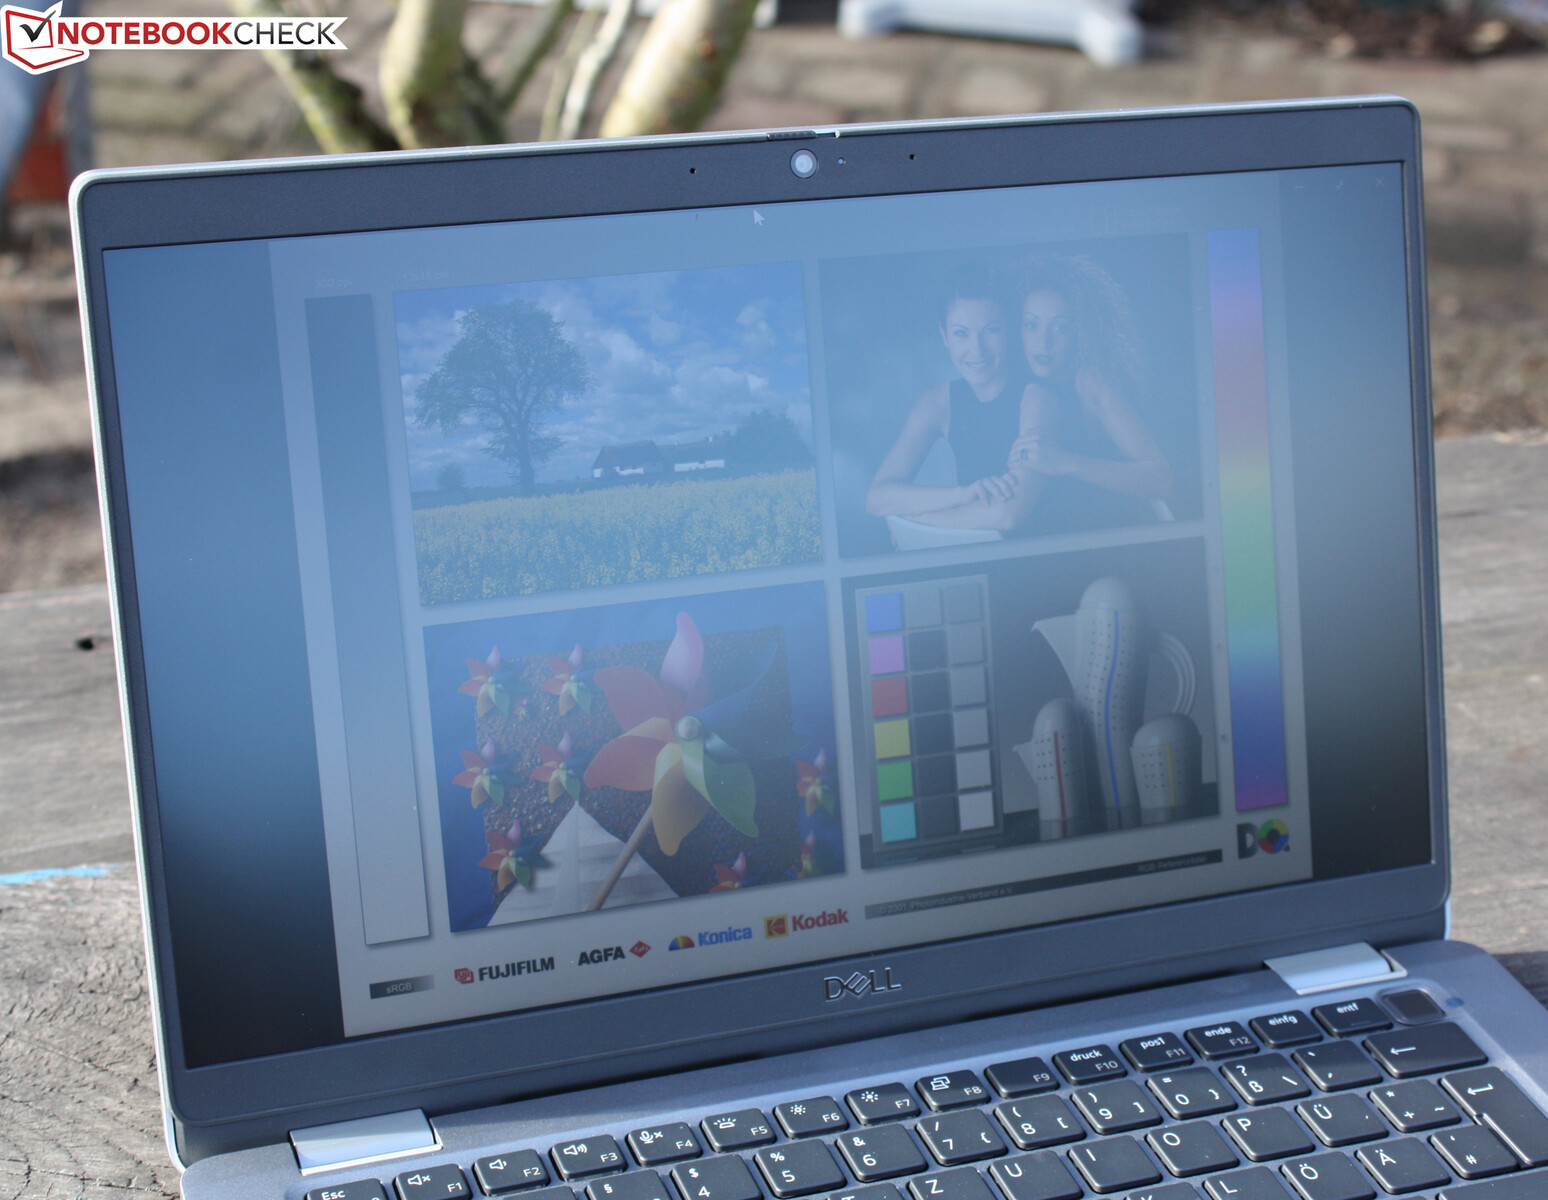
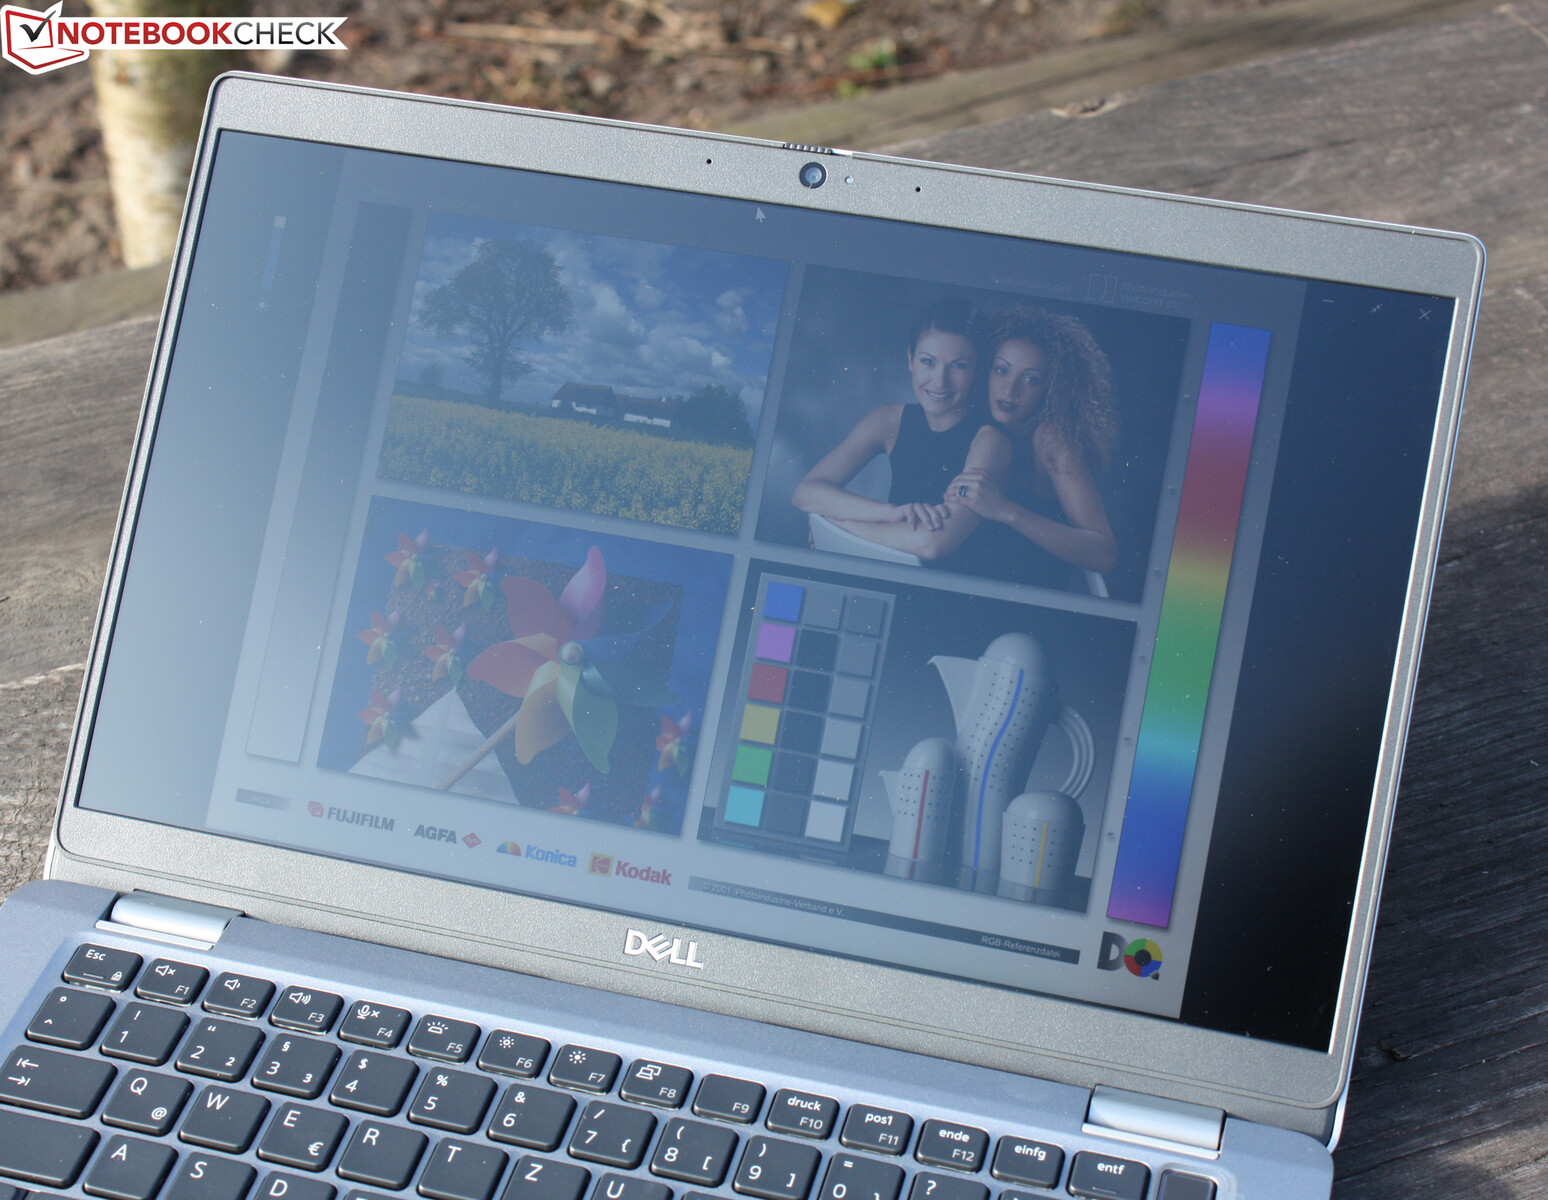
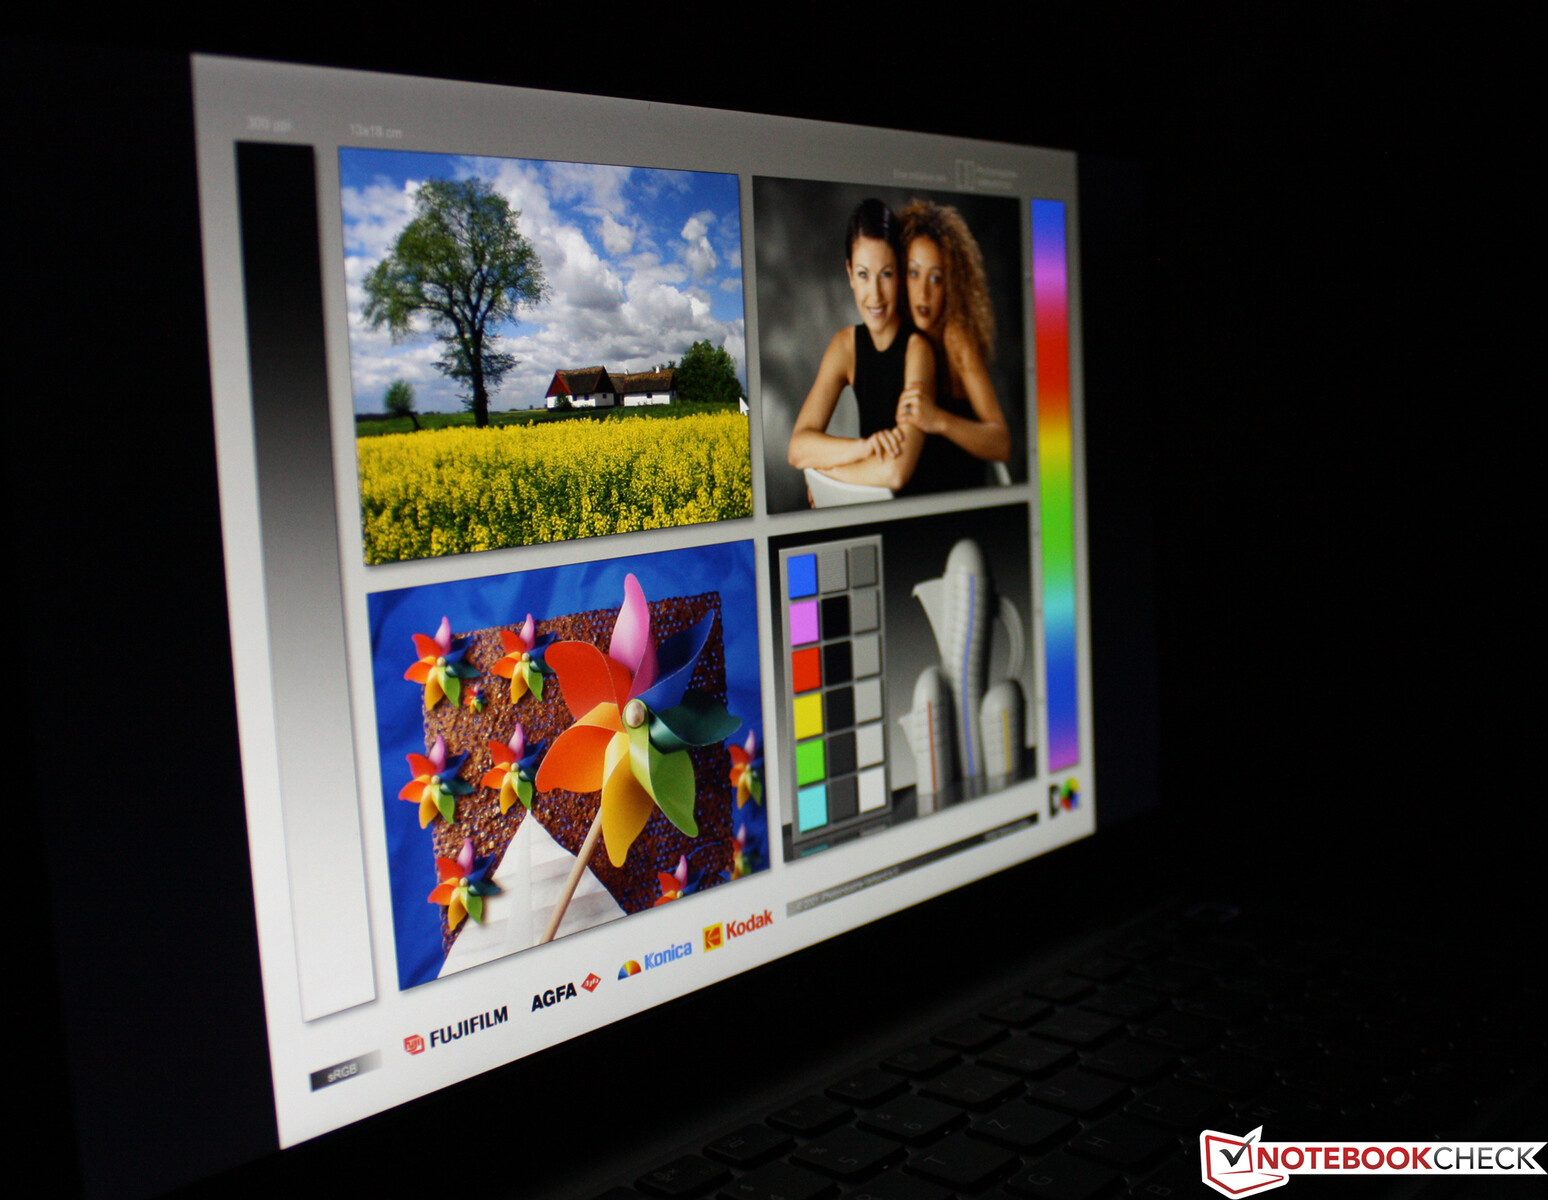
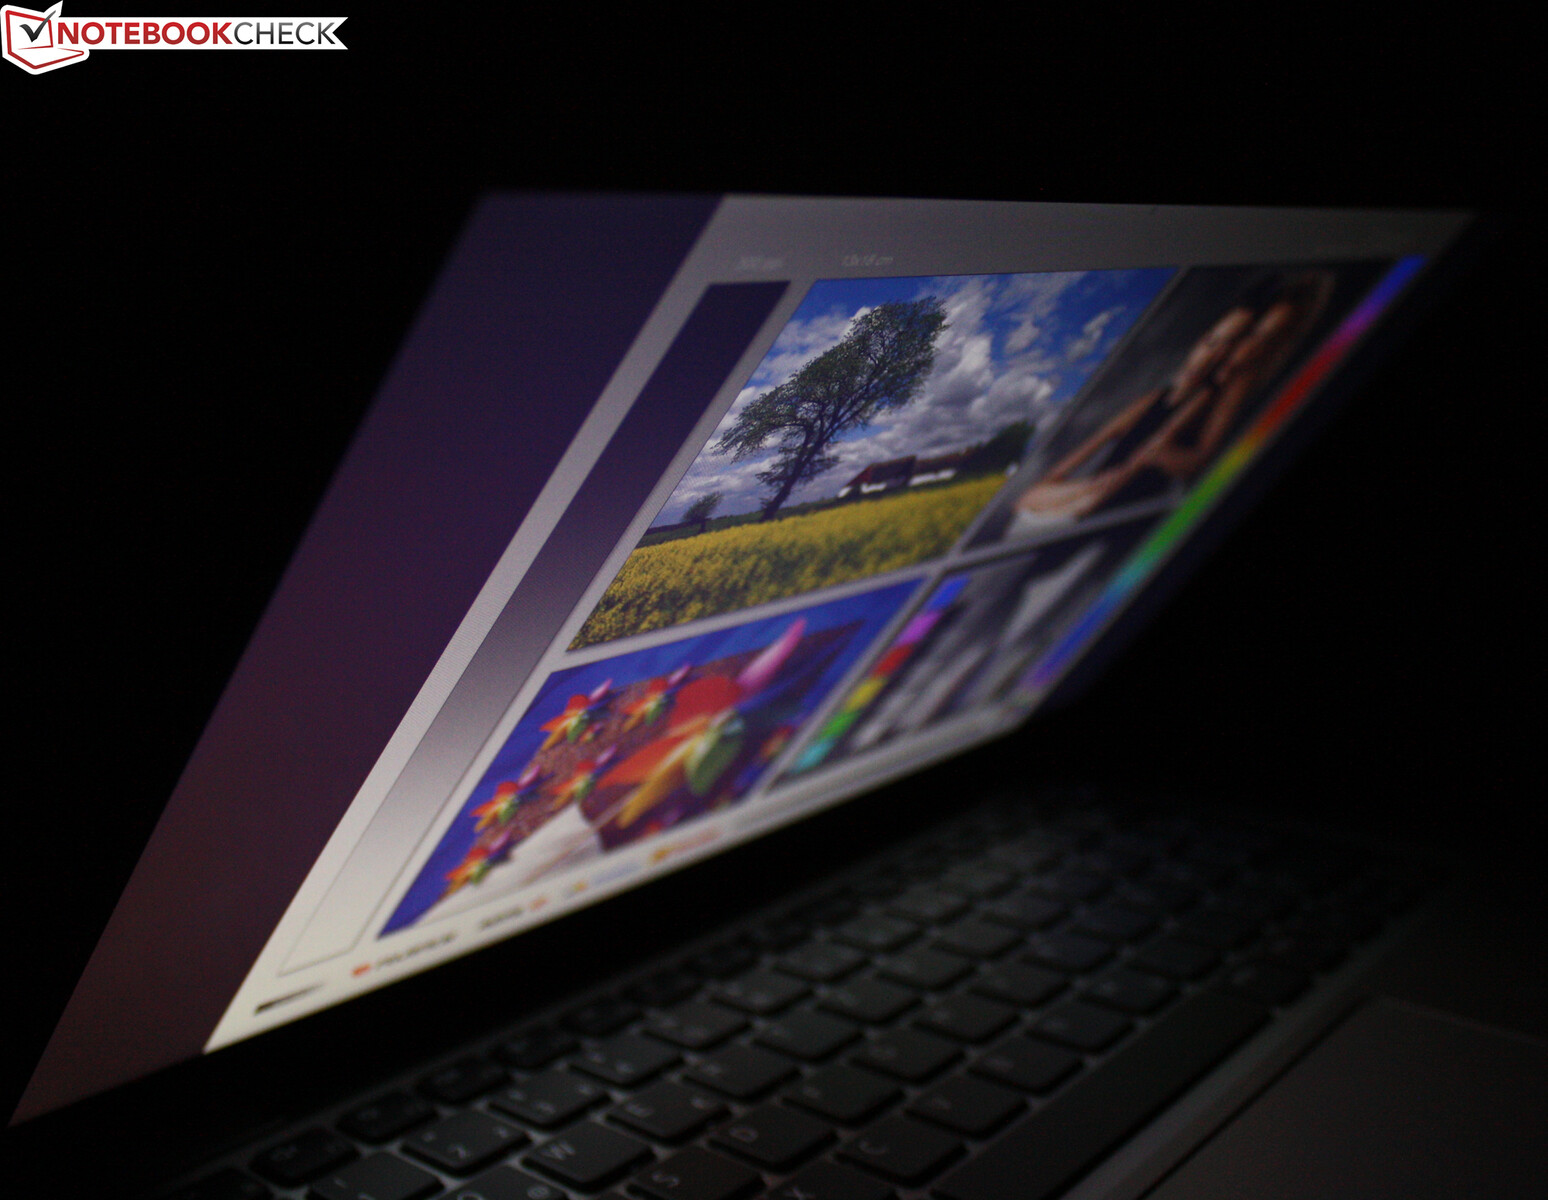
戴尔为5320配备了具有稳定可视角度的IPS面板。因此,可以从任何位置读取屏幕。在户外,由于亮度较低,至少在阳光照射下,阅读显示屏是个问题。抗反射涂层有帮助,但屏幕中心的最大亮度为249cd/m²,对于良好的可读性来说实在太低。
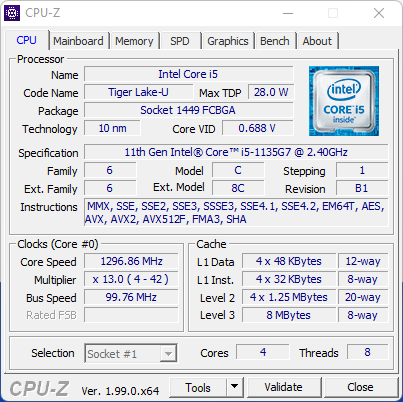
性能 - 比预期的酷睿i5更慢
戴尔的Latitude 5320是中档商务笔记本之一。安装的低电压处理器为办公和互联网应用提供了足够的计算能力。我们的测试设备有不同的配置,价格为900至1250欧元。我们的机型配有酷睿i5,小型256GB固态硬盘,非触摸屏,是最小的配置。令人震惊的是。戴尔在商店里没有提供酷睿i7版本,但在内部商店里有(i7-1185G7).
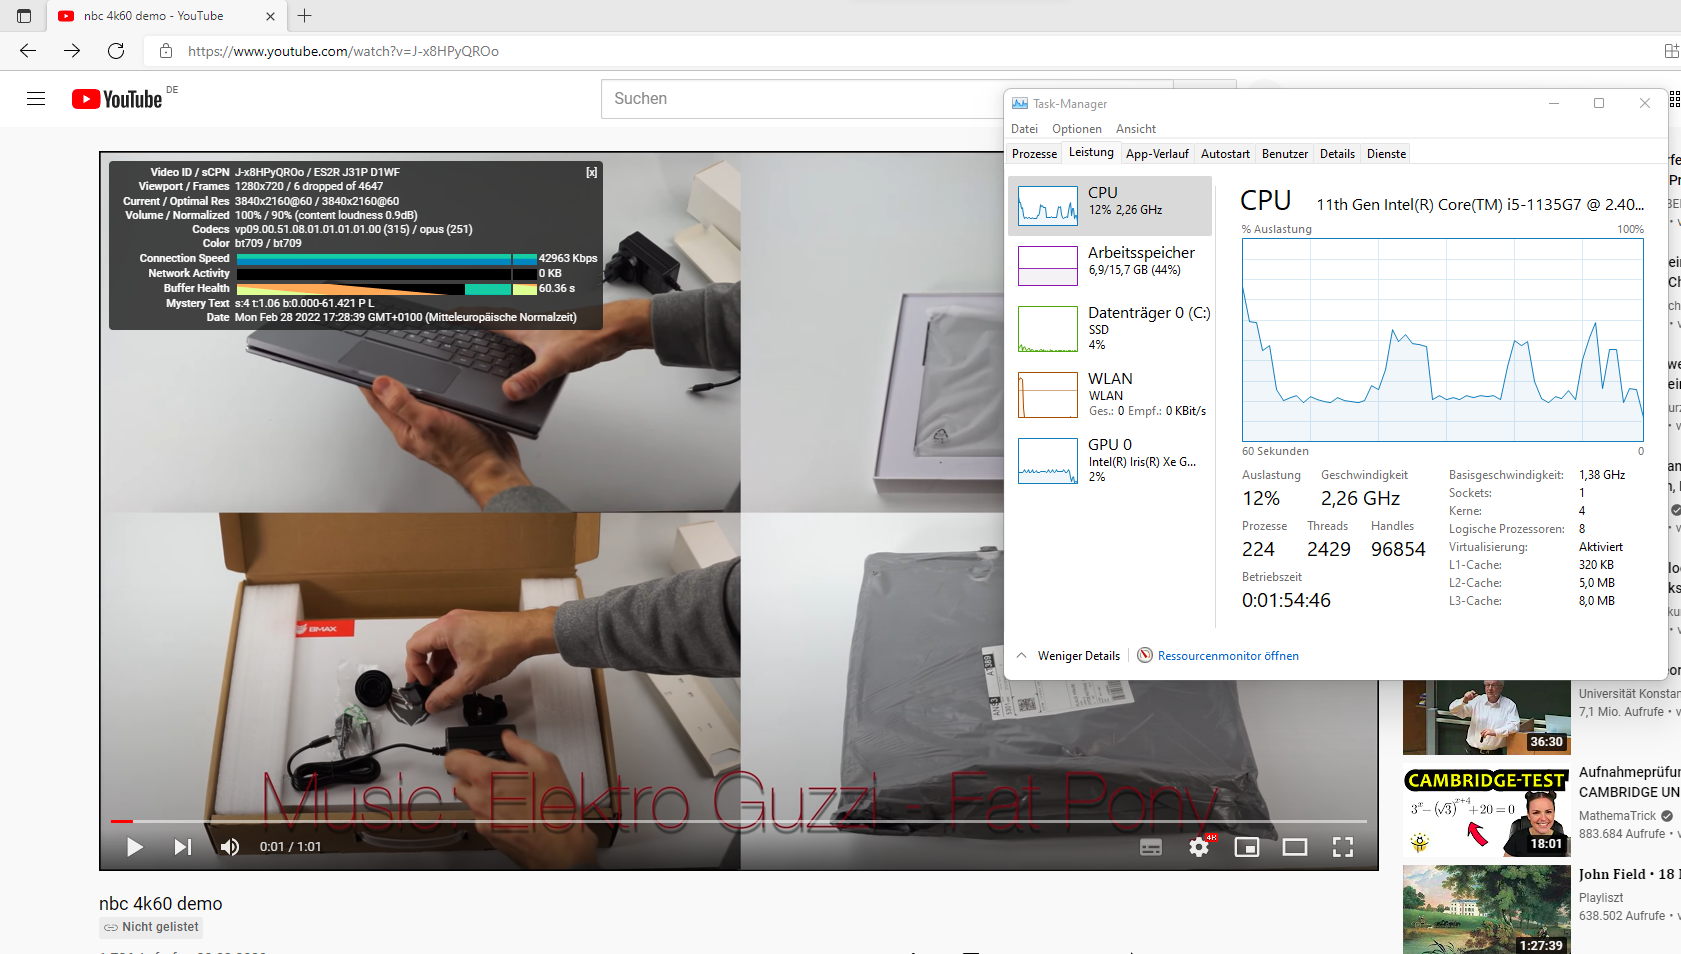
测试条件
我们在超性能模式(戴尔电源管理器/温度管理)下运行所有的基准测试。我们使用优化模式进行电池运行时间以及闲置时的温度测量。
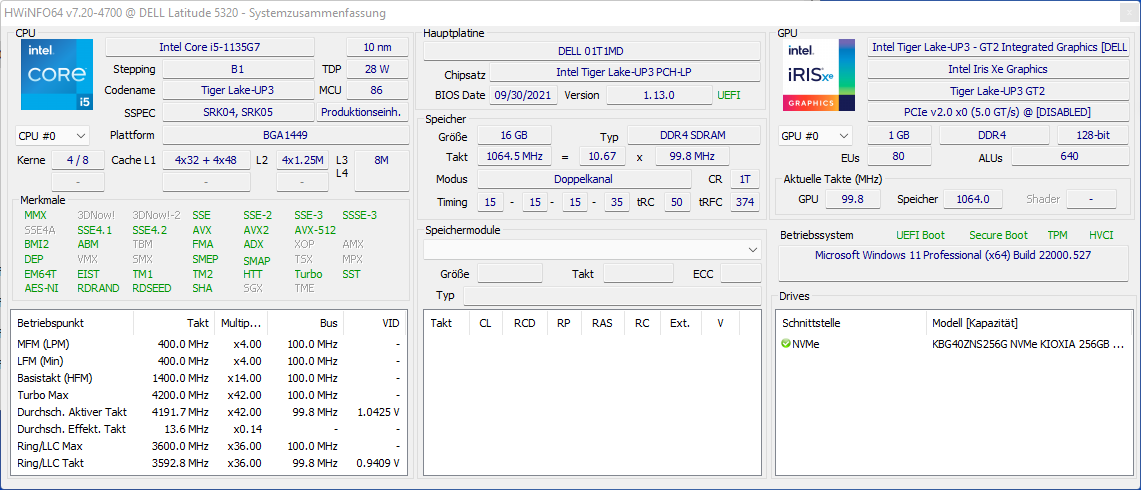
处理器
安装的 英特尔酷睿i5-1135G7是英特尔Tiger Lake 代的四核处理器,基本时钟为2.4 GHz,Turbo时钟最高为4.2 GHz。正如所有CPU基准测试显示的那样,其性能比平均水平低5-10%。
事实上,酷睿i5-1135G7可以做得更多,这一点从联想的 ThinkPad L14 G2877分,而不是第一次运行时的660分,而且这一差距并没有随着时间的推移而明显减少。
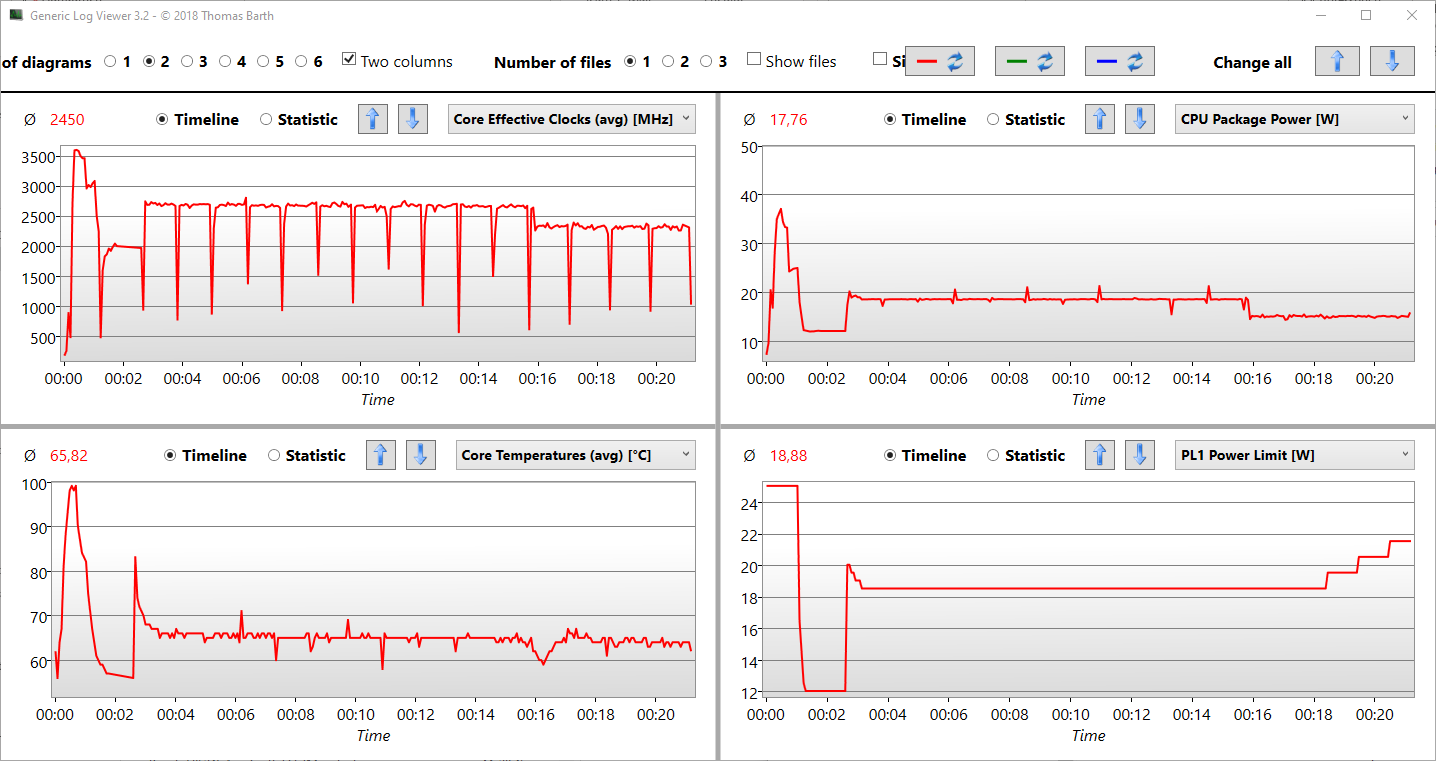
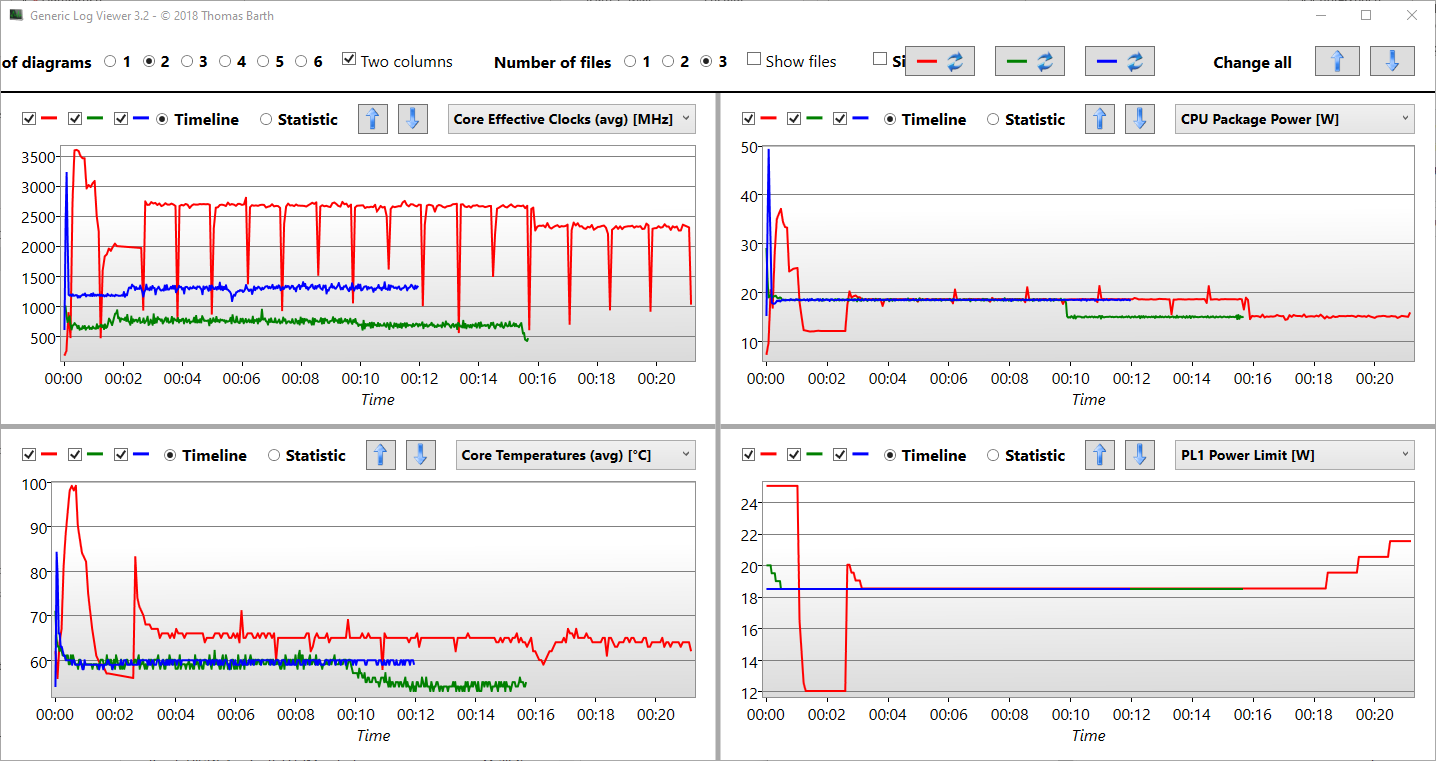
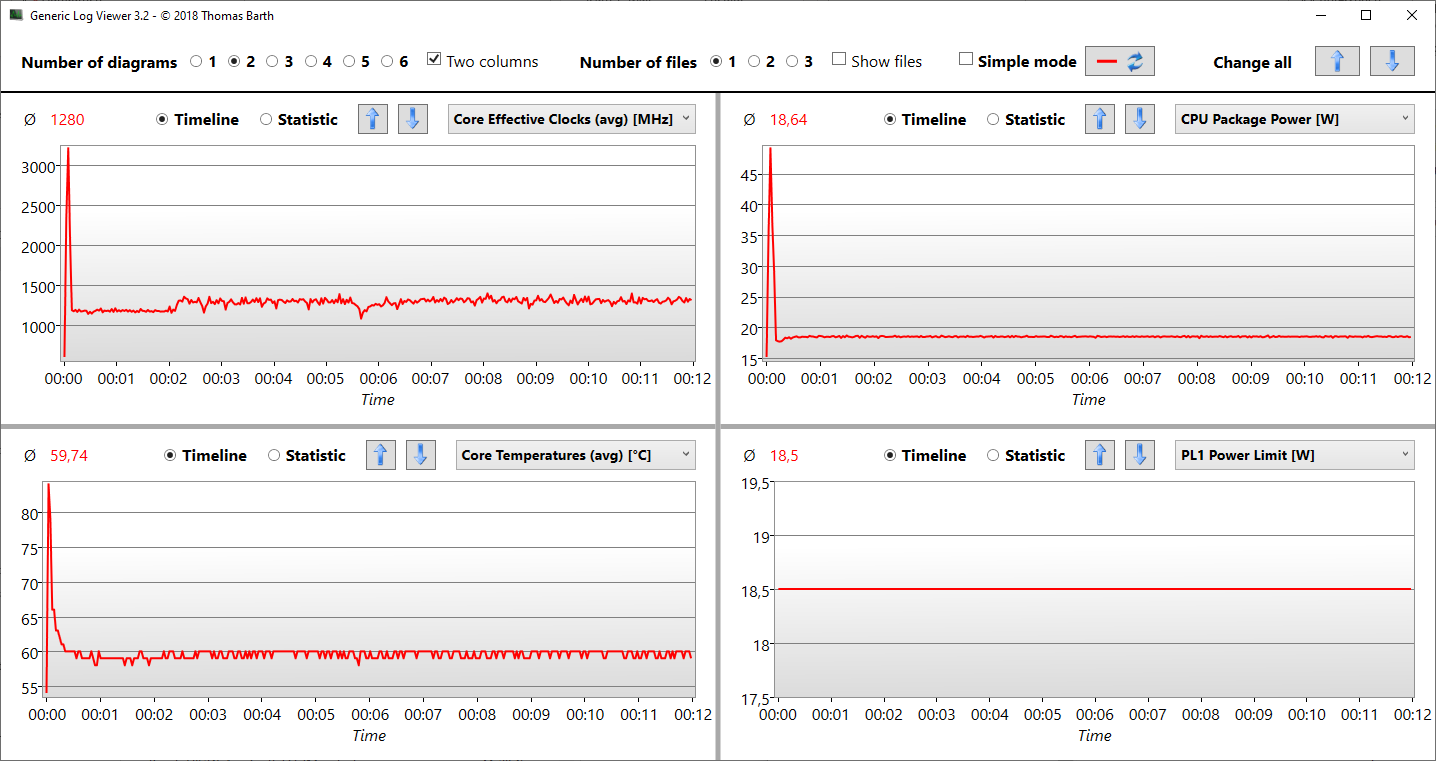
循环中的恒定性能是引人注目的。尽管如此,SoC允许自己在第一次运行的几秒钟内达到3.6 GHz和几乎100摄氏度。之后,时钟减慢到2.0GHz,温度明显下降,并在其余的运行中保持在65摄氏度左右。随着时间的推移,该循环继续以恒定的2.6GHz的速度运行。
PL1和PL2在所有内核的Cinebench负载下的表现如何?虽然CPU包在开始时允许自己在很短的时间内(几秒钟)使用37瓦特,但在测试过程中(PL1持续时间),它是连续的18瓦特。
我们在15分钟后拔掉插头:封装功率下降到16瓦,时钟速率下降到2.3GHz。因此,该处理器的全部性能不能在电池模式下使用。
其他笔记本的性能是否能跟上这里,可以在我们的 CPU基准测试列表.
Cinebench R15 multi endurance test
Cinebench R23: Multi Core | Single Core
Cinebench R20: CPU (Multi Core) | CPU (Single Core)
Cinebench R15: CPU Multi 64Bit | CPU Single 64Bit
Blender: v2.79 BMW27 CPU
7-Zip 18.03: 7z b 4 | 7z b 4 -mmt1
Geekbench 5.5: Multi-Core | Single-Core
HWBOT x265 Benchmark v2.2: 4k Preset
LibreOffice : 20 Documents To PDF
R Benchmark 2.5: Overall mean
| CPU Performance rating | |
| Average of class Subnotebook | |
| Lenovo ThinkBook 13s G3 20YA0005GE | |
| Lenovo ThinkPad L13 Gen2-21AB000PGE | |
| Lenovo ThinkPad L14 G2-20X1003WGE | |
| Average Intel Core i5-1135G7 | |
| Acer TravelMate P4 TMP414-51-59MR | |
| Dell XPS 13 9305 Core i5 FHD -2! | |
| Dell Latitude 5320-TM4V2 -1! | |
| Lenovo ThinkBook 14 G2 ITL 20VDS02G00 | |
| Dell Latitude 5310-23VP6 -2! | |
| Cinebench R23 / Multi Core | |
| Average of class Subnotebook (1555 - 21812, n=60, last 2 years) | |
| Lenovo ThinkBook 13s G3 20YA0005GE | |
| Lenovo ThinkPad L13 Gen2-21AB000PGE | |
| Dell XPS 13 9305 Core i5 FHD | |
| Lenovo ThinkPad L14 G2-20X1003WGE | |
| Acer TravelMate P4 TMP414-51-59MR | |
| Average Intel Core i5-1135G7 (2786 - 6136, n=55) | |
| Dell Latitude 5320-TM4V2 | |
| Lenovo ThinkBook 14 G2 ITL 20VDS02G00 | |
| Cinebench R23 / Single Core | |
| Average of class Subnotebook (358 - 2213, n=61, last 2 years) | |
| Lenovo ThinkBook 13s G3 20YA0005GE | |
| Acer TravelMate P4 TMP414-51-59MR | |
| Lenovo ThinkPad L13 Gen2-21AB000PGE | |
| Lenovo ThinkPad L14 G2-20X1003WGE | |
| Average Intel Core i5-1135G7 (1062 - 1373, n=53) | |
| Lenovo ThinkBook 14 G2 ITL 20VDS02G00 | |
| Dell XPS 13 9305 Core i5 FHD | |
| Dell Latitude 5320-TM4V2 | |
| Cinebench R20 / CPU (Multi Core) | |
| Average of class Subnotebook (579 - 8541, n=57, last 2 years) | |
| Lenovo ThinkBook 13s G3 20YA0005GE | |
| Lenovo ThinkPad L13 Gen2-21AB000PGE | |
| Lenovo ThinkPad L14 G2-20X1003WGE | |
| Dell XPS 13 9305 Core i5 FHD | |
| Average Intel Core i5-1135G7 (979 - 2382, n=62) | |
| Acer TravelMate P4 TMP414-51-59MR | |
| Dell Latitude 5320-TM4V2 | |
| Lenovo ThinkBook 14 G2 ITL 20VDS02G00 | |
| Dell Latitude 5310-23VP6 | |
| Cinebench R20 / CPU (Single Core) | |
| Average of class Subnotebook (128 - 832, n=57, last 2 years) | |
| Lenovo ThinkBook 13s G3 20YA0005GE | |
| Acer TravelMate P4 TMP414-51-59MR | |
| Lenovo ThinkPad L13 Gen2-21AB000PGE | |
| Lenovo ThinkPad L14 G2-20X1003WGE | |
| Lenovo ThinkBook 14 G2 ITL 20VDS02G00 | |
| Average Intel Core i5-1135G7 (375 - 527, n=62) | |
| Dell XPS 13 9305 Core i5 FHD | |
| Dell Latitude 5320-TM4V2 | |
| Dell Latitude 5310-23VP6 | |
| Cinebench R15 / CPU Multi 64Bit | |
| Average of class Subnotebook (327 - 3345, n=57, last 2 years) | |
| Lenovo ThinkBook 13s G3 20YA0005GE | |
| Lenovo ThinkBook 13s G3 20YA0005GE | |
| Lenovo ThinkPad L13 Gen2-21AB000PGE | |
| Lenovo ThinkPad L14 G2-20X1003WGE | |
| Acer TravelMate P4 TMP414-51-59MR | |
| Average Intel Core i5-1135G7 (431 - 941, n=65) | |
| Dell XPS 13 9305 Core i5 FHD | |
| Dell Latitude 5320-TM4V2 | |
| Dell Latitude 5310-23VP6 | |
| Lenovo ThinkBook 14 G2 ITL 20VDS02G00 | |
| Cinebench R15 / CPU Single 64Bit | |
| Average of class Subnotebook (72.4 - 322, n=57, last 2 years) | |
| Lenovo ThinkBook 13s G3 20YA0005GE | |
| Lenovo ThinkPad L13 Gen2-21AB000PGE | |
| Lenovo ThinkPad L14 G2-20X1003WGE | |
| Average Intel Core i5-1135G7 (141.4 - 205, n=61) | |
| Dell Latitude 5320-TM4V2 | |
| Lenovo ThinkBook 14 G2 ITL 20VDS02G00 | |
| Dell Latitude 5310-23VP6 | |
| Acer TravelMate P4 TMP414-51-59MR | |
| Blender / v2.79 BMW27 CPU | |
| Lenovo ThinkBook 14 G2 ITL 20VDS02G00 | |
| Dell Latitude 5310-23VP6 | |
| Average Intel Core i5-1135G7 (499 - 1044, n=60) | |
| Acer TravelMate P4 TMP414-51-59MR | |
| Dell XPS 13 9305 Core i5 FHD | |
| Dell Latitude 5320-TM4V2 | |
| Lenovo ThinkPad L14 G2-20X1003WGE | |
| Lenovo ThinkPad L13 Gen2-21AB000PGE | |
| Lenovo ThinkBook 13s G3 20YA0005GE | |
| Average of class Subnotebook (159 - 2271, n=58, last 2 years) | |
| 7-Zip 18.03 / 7z b 4 | |
| Average of class Subnotebook (11668 - 77867, n=57, last 2 years) | |
| Lenovo ThinkBook 13s G3 20YA0005GE | |
| Lenovo ThinkPad L13 Gen2-21AB000PGE | |
| Dell XPS 13 9305 Core i5 FHD | |
| Lenovo ThinkPad L14 G2-20X1003WGE | |
| Dell Latitude 5320-TM4V2 | |
| Acer TravelMate P4 TMP414-51-59MR | |
| Average Intel Core i5-1135G7 (14745 - 24873, n=62) | |
| Dell Latitude 5310-23VP6 | |
| Lenovo ThinkBook 14 G2 ITL 20VDS02G00 | |
| 7-Zip 18.03 / 7z b 4 -mmt1 | |
| Average of class Subnotebook (2643 - 6699, n=59, last 2 years) | |
| Lenovo ThinkBook 13s G3 20YA0005GE | |
| Lenovo ThinkPad L13 Gen2-21AB000PGE | |
| Acer TravelMate P4 TMP414-51-59MR | |
| Average Intel Core i5-1135G7 (3924 - 4921, n=62) | |
| Lenovo ThinkPad L14 G2-20X1003WGE | |
| Lenovo ThinkBook 14 G2 ITL 20VDS02G00 | |
| Dell XPS 13 9305 Core i5 FHD | |
| Dell Latitude 5320-TM4V2 | |
| Dell Latitude 5310-23VP6 | |
| Geekbench 5.5 / Multi-Core | |
| Average of class Subnotebook (2557 - 17218, n=48, last 2 years) | |
| Lenovo ThinkBook 13s G3 20YA0005GE | |
| Lenovo ThinkPad L13 Gen2-21AB000PGE | |
| Dell XPS 13 9305 Core i5 FHD | |
| Average Intel Core i5-1135G7 (3475 - 5472, n=58) | |
| Dell Latitude 5320-TM4V2 | |
| Acer TravelMate P4 TMP414-51-59MR | |
| Lenovo ThinkPad L14 G2-20X1003WGE | |
| Dell Latitude 5310-23VP6 | |
| Lenovo ThinkBook 14 G2 ITL 20VDS02G00 | |
| Geekbench 5.5 / Single-Core | |
| Average of class Subnotebook (726 - 2224, n=48, last 2 years) | |
| Lenovo ThinkBook 13s G3 20YA0005GE | |
| Average Intel Core i5-1135G7 (1147 - 1428, n=58) | |
| Dell XPS 13 9305 Core i5 FHD | |
| Acer TravelMate P4 TMP414-51-59MR | |
| Lenovo ThinkPad L13 Gen2-21AB000PGE | |
| Dell Latitude 5320-TM4V2 | |
| Lenovo ThinkPad L14 G2-20X1003WGE | |
| Lenovo ThinkBook 14 G2 ITL 20VDS02G00 | |
| Dell Latitude 5310-23VP6 | |
| HWBOT x265 Benchmark v2.2 / 4k Preset | |
| Average of class Subnotebook (0.97 - 25.1, n=57, last 2 years) | |
| Lenovo ThinkBook 13s G3 20YA0005GE | |
| Lenovo ThinkPad L13 Gen2-21AB000PGE | |
| Lenovo ThinkPad L14 G2-20X1003WGE | |
| Average Intel Core i5-1135G7 (3.57 - 7.6, n=57) | |
| Acer TravelMate P4 TMP414-51-59MR | |
| Dell Latitude 5310-23VP6 | |
| Lenovo ThinkBook 14 G2 ITL 20VDS02G00 | |
| LibreOffice / 20 Documents To PDF | |
| Dell Latitude 5310-23VP6 | |
| Dell XPS 13 9305 Core i5 FHD | |
| Dell Latitude 5320-TM4V2 | |
| Lenovo ThinkPad L13 Gen2-21AB000PGE | |
| Average of class Subnotebook (39.9 - 220, n=56, last 2 years) | |
| Average Intel Core i5-1135G7 (44.2 - 62.9, n=60) | |
| Acer TravelMate P4 TMP414-51-59MR | |
| Lenovo ThinkPad L14 G2-20X1003WGE | |
| Lenovo ThinkBook 13s G3 20YA0005GE | |
| Lenovo ThinkBook 14 G2 ITL 20VDS02G00 | |
| R Benchmark 2.5 / Overall mean | |
| Dell Latitude 5310-23VP6 | |
| Lenovo ThinkBook 14 G2 ITL 20VDS02G00 | |
| Dell Latitude 5320-TM4V2 | |
| Dell XPS 13 9305 Core i5 FHD | |
| Lenovo ThinkPad L14 G2-20X1003WGE | |
| Average Intel Core i5-1135G7 (0.619 - 0.727, n=59) | |
| Acer TravelMate P4 TMP414-51-59MR | |
| Lenovo ThinkPad L13 Gen2-21AB000PGE | |
| Lenovo ThinkBook 13s G3 20YA0005GE | |
| Average of class Subnotebook (0.4024 - 1.456, n=58, last 2 years) | |
* ... smaller is better
AIDA64: FP32 Ray-Trace | FPU Julia | CPU SHA3 | CPU Queen | FPU SinJulia | FPU Mandel | CPU AES | CPU ZLib | FP64 Ray-Trace | CPU PhotoWorxx
| Performance rating | |
| Lenovo ThinkBook 13s G3 20YA0005GE | |
| Average of class Subnotebook | |
| Lenovo ThinkPad L13 Gen2-21AB000PGE | |
| Average Intel Core i5-1135G7 | |
| Lenovo ThinkPad L14 G2-20X1003WGE | |
| Acer TravelMate P4 TMP414-51-59MR | |
| Dell Latitude 5320-TM4V2 | |
| Dell Latitude 5310-23VP6 | |
| Lenovo ThinkBook 14 G2 ITL 20VDS02G00 | |
| AIDA64 / FP32 Ray-Trace | |
| Average of class Subnotebook (1135 - 32888, n=58, last 2 years) | |
| Lenovo ThinkBook 13s G3 20YA0005GE | |
| Lenovo ThinkPad L13 Gen2-21AB000PGE | |
| Average Intel Core i5-1135G7 (4313 - 7952, n=45) | |
| Acer TravelMate P4 TMP414-51-59MR | |
| Lenovo ThinkPad L14 G2-20X1003WGE | |
| Dell Latitude 5320-TM4V2 | |
| Dell Latitude 5310-23VP6 | |
| Lenovo ThinkBook 14 G2 ITL 20VDS02G00 | |
| AIDA64 / FPU Julia | |
| Lenovo ThinkBook 13s G3 20YA0005GE | |
| Average of class Subnotebook (5218 - 123315, n=58, last 2 years) | |
| Lenovo ThinkPad L13 Gen2-21AB000PGE | |
| Average Intel Core i5-1135G7 (19402 - 32283, n=45) | |
| Lenovo ThinkPad L14 G2-20X1003WGE | |
| Dell Latitude 5310-23VP6 | |
| Acer TravelMate P4 TMP414-51-59MR | |
| Dell Latitude 5320-TM4V2 | |
| Lenovo ThinkBook 14 G2 ITL 20VDS02G00 | |
| AIDA64 / CPU SHA3 | |
| Average of class Subnotebook (444 - 5287, n=58, last 2 years) | |
| Lenovo ThinkBook 13s G3 20YA0005GE | |
| Average Intel Core i5-1135G7 (1316 - 2172, n=45) | |
| Lenovo ThinkPad L14 G2-20X1003WGE | |
| Acer TravelMate P4 TMP414-51-59MR | |
| Dell Latitude 5320-TM4V2 | |
| Lenovo ThinkPad L13 Gen2-21AB000PGE | |
| Dell Latitude 5310-23VP6 | |
| Lenovo ThinkBook 14 G2 ITL 20VDS02G00 | |
| AIDA64 / CPU Queen | |
| Lenovo ThinkBook 13s G3 20YA0005GE | |
| Lenovo ThinkPad L13 Gen2-21AB000PGE | |
| Average of class Subnotebook (10579 - 95002, n=49, last 2 years) | |
| Dell Latitude 5310-23VP6 | |
| Acer TravelMate P4 TMP414-51-59MR | |
| Lenovo ThinkPad L14 G2-20X1003WGE | |
| Average Intel Core i5-1135G7 (39000 - 46951, n=45) | |
| Dell Latitude 5320-TM4V2 | |
| Lenovo ThinkBook 14 G2 ITL 20VDS02G00 | |
| AIDA64 / FPU SinJulia | |
| Lenovo ThinkBook 13s G3 20YA0005GE | |
| Lenovo ThinkPad L13 Gen2-21AB000PGE | |
| Average of class Subnotebook (744 - 18418, n=58, last 2 years) | |
| Dell Latitude 5310-23VP6 | |
| Acer TravelMate P4 TMP414-51-59MR | |
| Average Intel Core i5-1135G7 (3497 - 4445, n=45) | |
| Lenovo ThinkPad L14 G2-20X1003WGE | |
| Dell Latitude 5320-TM4V2 | |
| Lenovo ThinkBook 14 G2 ITL 20VDS02G00 | |
| AIDA64 / FPU Mandel | |
| Lenovo ThinkBook 13s G3 20YA0005GE | |
| Average of class Subnotebook (3341 - 65433, n=58, last 2 years) | |
| Lenovo ThinkPad L13 Gen2-21AB000PGE | |
| Average Intel Core i5-1135G7 (12569 - 19635, n=45) | |
| Acer TravelMate P4 TMP414-51-59MR | |
| Lenovo ThinkPad L14 G2-20X1003WGE | |
| Dell Latitude 5320-TM4V2 | |
| Dell Latitude 5310-23VP6 | |
| Lenovo ThinkBook 14 G2 ITL 20VDS02G00 | |
| AIDA64 / CPU AES | |
| Lenovo ThinkBook 13s G3 20YA0005GE | |
| Lenovo ThinkPad L14 G2-20X1003WGE | |
| Acer TravelMate P4 TMP414-51-59MR | |
| Average Intel Core i5-1135G7 (28988 - 67977, n=45) | |
| Average of class Subnotebook (638 - 96917, n=58, last 2 years) | |
| Lenovo ThinkBook 14 G2 ITL 20VDS02G00 | |
| Dell Latitude 5320-TM4V2 | |
| Lenovo ThinkPad L13 Gen2-21AB000PGE | |
| Dell Latitude 5310-23VP6 | |
| AIDA64 / CPU ZLib | |
| Average of class Subnotebook (164.9 - 1379, n=58, last 2 years) | |
| Lenovo ThinkBook 13s G3 20YA0005GE | |
| Lenovo ThinkPad L13 Gen2-21AB000PGE | |
| Lenovo ThinkPad L14 G2-20X1003WGE | |
| Acer TravelMate P4 TMP414-51-59MR | |
| Dell Latitude 5310-23VP6 | |
| Average Intel Core i5-1135G7 (265 - 373, n=51) | |
| Dell Latitude 5320-TM4V2 | |
| Lenovo ThinkBook 14 G2 ITL 20VDS02G00 | |
| AIDA64 / FP64 Ray-Trace | |
| Average of class Subnotebook (610 - 17495, n=58, last 2 years) | |
| Lenovo ThinkBook 13s G3 20YA0005GE | |
| Lenovo ThinkPad L13 Gen2-21AB000PGE | |
| Average Intel Core i5-1135G7 (2226 - 4291, n=45) | |
| Acer TravelMate P4 TMP414-51-59MR | |
| Lenovo ThinkPad L14 G2-20X1003WGE | |
| Dell Latitude 5320-TM4V2 | |
| Dell Latitude 5310-23VP6 | |
| Lenovo ThinkBook 14 G2 ITL 20VDS02G00 | |
| AIDA64 / CPU PhotoWorxx | |
| Average of class Subnotebook (6569 - 85600, n=58, last 2 years) | |
| Average Intel Core i5-1135G7 (9004 - 45366, n=45) | |
| Dell Latitude 5320-TM4V2 | |
| Lenovo ThinkBook 13s G3 20YA0005GE | |
| Lenovo ThinkPad L13 Gen2-21AB000PGE | |
| Dell Latitude 5310-23VP6 | |
| Acer TravelMate P4 TMP414-51-59MR | |
| Lenovo ThinkBook 14 G2 ITL 20VDS02G00 | |
| Lenovo ThinkPad L14 G2-20X1003WGE | |
系统性能
系统性能处于低于平均水平。大多数竞争对手在这里更快,特别是那些使用AMD的产品(+40%!)。审查样本与联想ThinkBook 14 G2 ITL相当,后者有一个Tiger Lake Core i3。尤其是生产力领域,Latitude 5320,低于平均水平。
在实际使用中,所有的日常任务几乎都可以毫无延迟地完成,没有任何显眼的地方。因此,这是一个可衡量的,但不是一个有形的性能不足。
CrossMark: Overall | Productivity | Creativity | Responsiveness
| PCMark 10 / Score | |
| Average of class Subnotebook (4920 - 9939, n=45, last 2 years) | |
| Lenovo ThinkBook 13s G3 20YA0005GE | |
| Lenovo ThinkPad L13 Gen2-21AB000PGE | |
| Dell XPS 13 9305 Core i5 FHD | |
| Acer TravelMate P4 TMP414-51-59MR | |
| Average Intel Core i5-1135G7, Intel Iris Xe Graphics G7 80EUs (4026 - 4952, n=53) | |
| Lenovo ThinkPad L14 G2-20X1003WGE | |
| Dell Latitude 5320-TM4V2 | |
| Lenovo ThinkBook 14 G2 ITL 20VDS02G00 | |
| Dell Latitude 5310-23VP6 | |
| PCMark 10 / Essentials | |
| Average of class Subnotebook (8552 - 11646, n=45, last 2 years) | |
| Lenovo ThinkBook 13s G3 20YA0005GE | |
| Lenovo ThinkPad L13 Gen2-21AB000PGE | |
| Dell XPS 13 9305 Core i5 FHD | |
| Average Intel Core i5-1135G7, Intel Iris Xe Graphics G7 80EUs (8149 - 9917, n=53) | |
| Dell Latitude 5320-TM4V2 | |
| Acer TravelMate P4 TMP414-51-59MR | |
| Lenovo ThinkBook 14 G2 ITL 20VDS02G00 | |
| Lenovo ThinkPad L14 G2-20X1003WGE | |
| Dell Latitude 5310-23VP6 | |
| PCMark 10 / Productivity | |
| Average of class Subnotebook (5435 - 16606, n=45, last 2 years) | |
| Lenovo ThinkBook 13s G3 20YA0005GE | |
| Lenovo ThinkPad L13 Gen2-21AB000PGE | |
| Dell Latitude 5310-23VP6 | |
| Lenovo ThinkBook 14 G2 ITL 20VDS02G00 | |
| Acer TravelMate P4 TMP414-51-59MR | |
| Dell XPS 13 9305 Core i5 FHD | |
| Lenovo ThinkPad L14 G2-20X1003WGE | |
| Average Intel Core i5-1135G7, Intel Iris Xe Graphics G7 80EUs (5040 - 6619, n=53) | |
| Dell Latitude 5320-TM4V2 | |
| PCMark 10 / Digital Content Creation | |
| Average of class Subnotebook (5722 - 13779, n=45, last 2 years) | |
| Lenovo ThinkBook 13s G3 20YA0005GE | |
| Lenovo ThinkPad L13 Gen2-21AB000PGE | |
| Acer TravelMate P4 TMP414-51-59MR | |
| Dell XPS 13 9305 Core i5 FHD | |
| Lenovo ThinkPad L14 G2-20X1003WGE | |
| Dell Latitude 5320-TM4V2 | |
| Average Intel Core i5-1135G7, Intel Iris Xe Graphics G7 80EUs (3548 - 5255, n=53) | |
| Lenovo ThinkBook 14 G2 ITL 20VDS02G00 | |
| Dell Latitude 5310-23VP6 | |
| CrossMark / Overall | |
| Average of class Subnotebook (365 - 2356, n=60, last 2 years) | |
| Lenovo ThinkBook 13s G3 20YA0005GE | |
| Average Intel Core i5-1135G7, Intel Iris Xe Graphics G7 80EUs (1058 - 1293, n=11) | |
| Acer TravelMate P4 TMP414-51-59MR | |
| Dell Latitude 5320-TM4V2 | |
| Lenovo ThinkBook 14 G2 ITL 20VDS02G00 | |
| CrossMark / Productivity | |
| Average of class Subnotebook (364 - 2277, n=60, last 2 years) | |
| Lenovo ThinkBook 13s G3 20YA0005GE | |
| Average Intel Core i5-1135G7, Intel Iris Xe Graphics G7 80EUs (1148 - 1332, n=11) | |
| Acer TravelMate P4 TMP414-51-59MR | |
| Lenovo ThinkBook 14 G2 ITL 20VDS02G00 | |
| Dell Latitude 5320-TM4V2 | |
| CrossMark / Creativity | |
| Average of class Subnotebook (372 - 2743, n=60, last 2 years) | |
| Lenovo ThinkBook 13s G3 20YA0005GE | |
| Average Intel Core i5-1135G7, Intel Iris Xe Graphics G7 80EUs (895 - 1263, n=11) | |
| Dell Latitude 5320-TM4V2 | |
| Acer TravelMate P4 TMP414-51-59MR | |
| Lenovo ThinkBook 14 G2 ITL 20VDS02G00 | |
| CrossMark / Responsiveness | |
| Average of class Subnotebook (312 - 1854, n=60, last 2 years) | |
| Average Intel Core i5-1135G7, Intel Iris Xe Graphics G7 80EUs (923 - 1320, n=11) | |
| Lenovo ThinkBook 13s G3 20YA0005GE | |
| Lenovo ThinkBook 14 G2 ITL 20VDS02G00 | |
| Acer TravelMate P4 TMP414-51-59MR | |
| Dell Latitude 5320-TM4V2 | |
| PCMark 10 Score | 4325 points | |
Help | ||
| AIDA64 / Memory Copy | |
| Average of class Subnotebook (14554 - 131023, n=58, last 2 years) | |
| Average Intel Core i5-1135G7 (17443 - 63889, n=45) | |
| Lenovo ThinkBook 13s G3 20YA0005GE | |
| Lenovo ThinkPad L13 Gen2-21AB000PGE | |
| Dell Latitude 5320-TM4V2 | |
| Dell Latitude 5310-23VP6 | |
| Lenovo ThinkPad L14 G2-20X1003WGE | |
| Acer TravelMate P4 TMP414-51-59MR | |
| Lenovo ThinkBook 14 G2 ITL 20VDS02G00 | |
| AIDA64 / Memory Read | |
| Average of class Subnotebook (15948 - 127174, n=58, last 2 years) | |
| Average Intel Core i5-1135G7 (19716 - 63705, n=45) | |
| Dell Latitude 5320-TM4V2 | |
| Lenovo ThinkPad L13 Gen2-21AB000PGE | |
| Lenovo ThinkBook 13s G3 20YA0005GE | |
| Acer TravelMate P4 TMP414-51-59MR | |
| Lenovo ThinkPad L14 G2-20X1003WGE | |
| Lenovo ThinkBook 14 G2 ITL 20VDS02G00 | |
| Dell Latitude 5310-23VP6 | |
| AIDA64 / Memory Write | |
| Average of class Subnotebook (15709 - 135141, n=58, last 2 years) | |
| Average Intel Core i5-1135G7 (18722 - 66778, n=45) | |
| Dell Latitude 5320-TM4V2 | |
| Lenovo ThinkBook 13s G3 20YA0005GE | |
| Lenovo ThinkPad L13 Gen2-21AB000PGE | |
| Acer TravelMate P4 TMP414-51-59MR | |
| Lenovo ThinkPad L14 G2-20X1003WGE | |
| Dell Latitude 5310-23VP6 | |
| Lenovo ThinkBook 14 G2 ITL 20VDS02G00 | |
| AIDA64 / Memory Latency | |
| Lenovo ThinkPad L13 Gen2-21AB000PGE | |
| Lenovo ThinkBook 13s G3 20YA0005GE | |
| Dell Latitude 5310-23VP6 | |
| Average of class Subnotebook (6.1 - 159.9, n=56, last 2 years) | |
| Lenovo ThinkBook 14 G2 ITL 20VDS02G00 | |
| Lenovo ThinkPad L14 G2-20X1003WGE | |
| Acer TravelMate P4 TMP414-51-59MR | |
| Dell Latitude 5320-TM4V2 | |
| Average Intel Core i5-1135G7 (68.3 - 107, n=51) | |
* ... smaller is better
DPC延迟
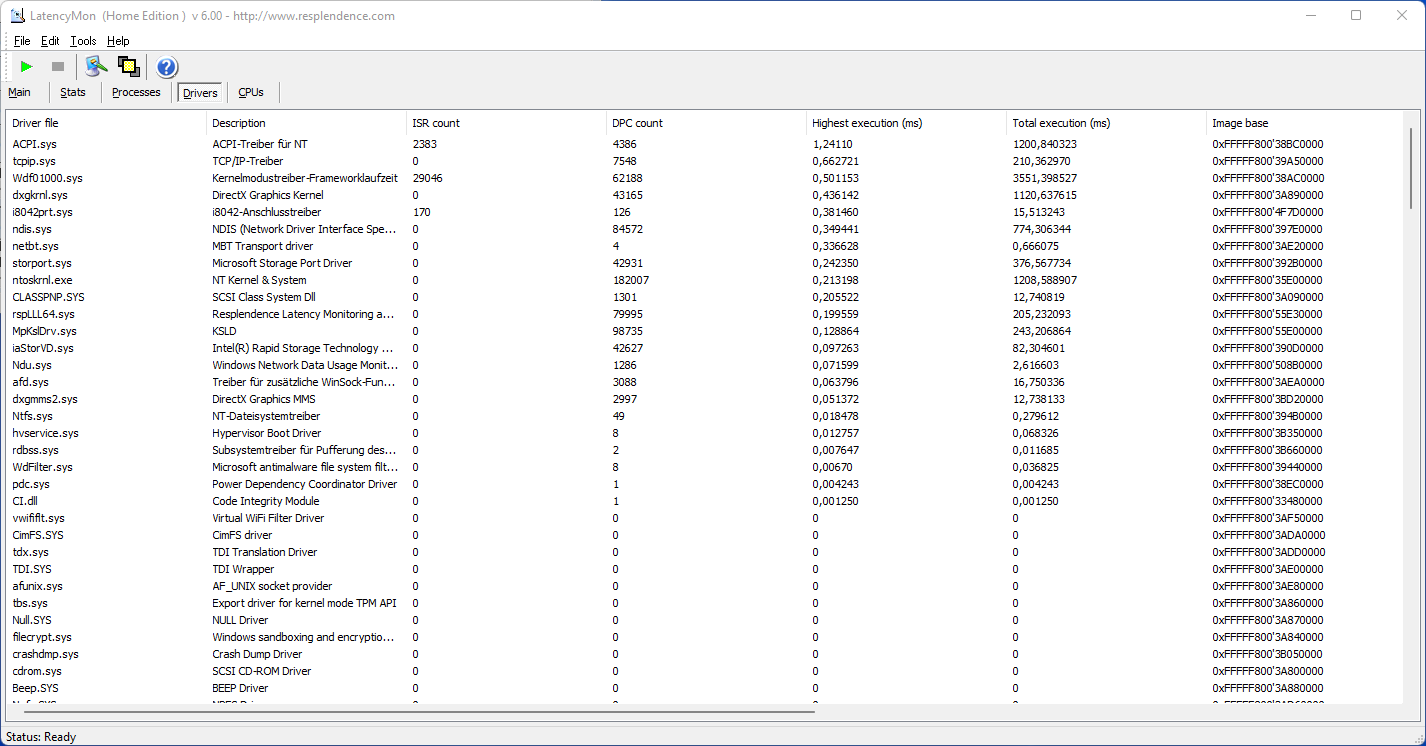
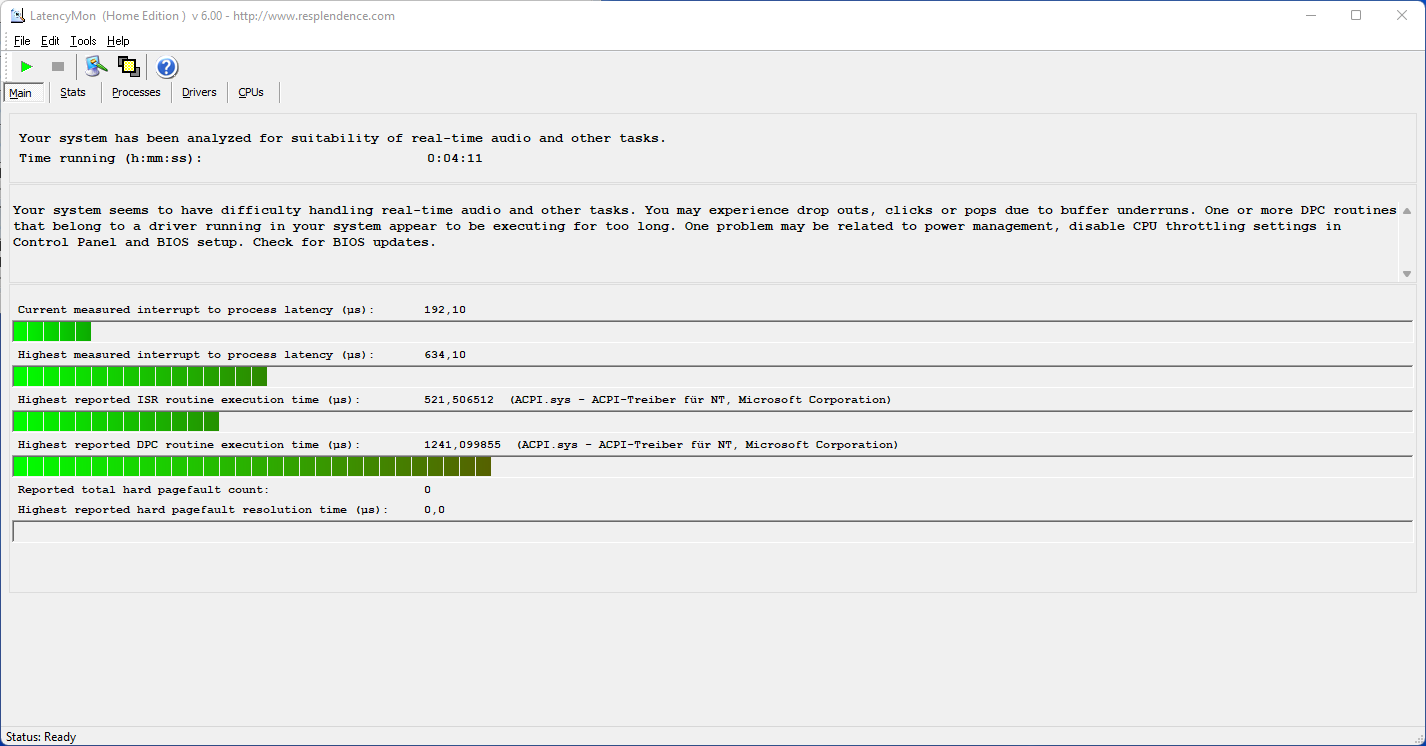
在LatencyMon DPC测试中,我们只能用我们的Latitude 5320确定低中断。我们设备的ACPI驱动程序是造成这种情况的原因。DPC测试说明了目前的驱动程序配置。
| DPC Latencies / LatencyMon - interrupt to process latency (max), Web, Youtube, Prime95 | |
| Acer TravelMate P4 TMP414-51-59MR | |
| Lenovo ThinkBook 14 G2 ITL 20VDS02G00 | |
| Lenovo ThinkPad L14 G2-20X1003WGE | |
| Dell Latitude 5320-TM4V2 | |
| Lenovo ThinkPad L13 Gen2-21AB000PGE | |
| Lenovo ThinkBook 13s G3 20YA0005GE | |
| Dell XPS 13 9305 Core i5 FHD | |
* ... smaller is better
储存
我们评测装置中的系统驱动器是来自Kioxia(原东芝SSD部门)的256GB SSD,它通过M.2 PCIe 3接口连接。该固态硬盘的性能几乎比竞争对手低40%。这可能是PCMark 10中评级较低的原因。
更多关于这款固态硬盘和其他固态硬盘的基准测试可在我们的 技术部分.

| Drive Performance rating - Percent | |
| Average of class Subnotebook | |
| Lenovo ThinkPad L14 G2-20X1003WGE | |
| Dell XPS 13 9305 Core i5 FHD | |
| Lenovo ThinkPad L13 Gen2-21AB000PGE | |
| Lenovo ThinkBook 13s G3 20YA0005GE | |
| Lenovo ThinkBook 14 G2 ITL 20VDS02G00 | |
| Acer TravelMate P4 TMP414-51-59MR | |
| Average Toshiba KBG40ZNS256G NVMe | |
| Dell Latitude 5320-TM4V2 | |
* ... smaller is better
Continuous load read: DiskSpd Read Loop, Queue Depth 8
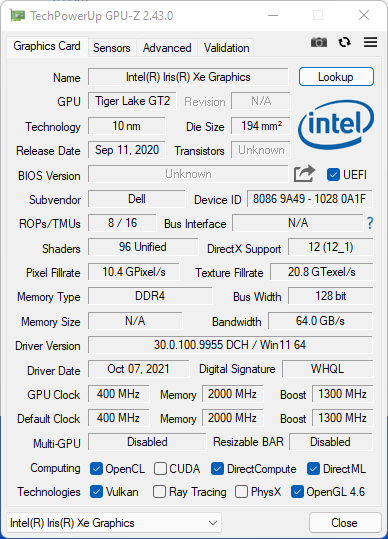
图形卡
戴尔依靠iGPU提供的图形解决方案 英特尔Iris Xe G7 iGPU有80个EUs。它的性能取决于安装的工作内存配置和冷却解决方案的有效性。在3DMark测试中,其性能是平均的或差不多平均的。
| 3DMark Performance rating - Percent | |
| Average of class Subnotebook | |
| Dell XPS 13 9305 Core i5 FHD | |
| Lenovo ThinkBook 13s G3 20YA0005GE | |
| Average Intel Iris Xe Graphics G7 80EUs | |
| Dell Latitude 5320-TM4V2 | |
| Lenovo ThinkPad L13 Gen2-21AB000PGE | |
| Acer TravelMate P4 TMP414-51-59MR | |
| Lenovo ThinkPad L14 G2-20X1003WGE | |
| Lenovo ThinkBook 14 G2 ITL 20VDS02G00 | |
| Dell Latitude 5310-23VP6 -2! | |
| 3DMark 11 - 1280x720 Performance GPU | |
| Average of class Subnotebook (995 - 18489, n=55, last 2 years) | |
| Lenovo ThinkBook 13s G3 20YA0005GE | |
| Dell XPS 13 9305 Core i5 FHD | |
| Average Intel Iris Xe Graphics G7 80EUs (2246 - 6579, n=112) | |
| Dell Latitude 5320-TM4V2 | |
| Lenovo ThinkPad L13 Gen2-21AB000PGE | |
| Acer TravelMate P4 TMP414-51-59MR | |
| Lenovo ThinkPad L14 G2-20X1003WGE | |
| Lenovo ThinkBook 14 G2 ITL 20VDS02G00 | |
| 3DMark | |
| 1920x1080 Fire Strike Graphics | |
| Average of class Subnotebook (832 - 16347, n=56, last 2 years) | |
| Dell XPS 13 9305 Core i5 FHD | |
| Average Intel Iris Xe Graphics G7 80EUs (1560 - 5398, n=114) | |
| Lenovo ThinkBook 13s G3 20YA0005GE | |
| Dell Latitude 5320-TM4V2 | |
| Lenovo ThinkPad L13 Gen2-21AB000PGE | |
| Acer TravelMate P4 TMP414-51-59MR | |
| Lenovo ThinkPad L14 G2-20X1003WGE | |
| Lenovo ThinkBook 14 G2 ITL 20VDS02G00 | |
| Dell Latitude 5310-23VP6 | |
| 2560x1440 Time Spy Graphics | |
| Average of class Subnotebook (804 - 6288, n=55, last 2 years) | |
| Dell XPS 13 9305 Core i5 FHD | |
| Average Intel Iris Xe Graphics G7 80EUs (561 - 1576, n=111) | |
| Dell Latitude 5320-TM4V2 | |
| Lenovo ThinkBook 13s G3 20YA0005GE | |
| Lenovo ThinkPad L13 Gen2-21AB000PGE | |
| Acer TravelMate P4 TMP414-51-59MR | |
| Lenovo ThinkPad L14 G2-20X1003WGE | |
| Lenovo ThinkBook 14 G2 ITL 20VDS02G00 | |
| 3DMark 11 Performance | 5287 points | |
| 3DMark Fire Strike Score | 3013 points | |
| 3DMark Time Spy Score | 1274 points | |
Help | ||
游戏性能
Latitude 不是一个游戏笔记本。玩目前的AAA级游戏基本上是不可能的。如果你仍然想在该设备上玩游戏,你可以通过两个Thunderbolt 4端口连接一个外部显示器和一个eGPU。然而,这种设置的好处是值得怀疑的,因为内置显卡的全部性能根本无法使用。瓶颈不会是Thunderbolt 4,而是低电压的处理器。
在游戏中,iGPU的性能非常低,但在其构建中处于平均水平。如果你想从它身上得到更多--不使用dGPU--你应该看看带有 Radeon RX Vega 8的设备,例如 联想ThinkBook 13s G3.
我们测试的其他显卡的性能可以在我们的GPU基准列表中进行比较。.
| The Witcher 3 - 1366x768 Medium Graphics & Postprocessing | |
| Average of class Subnotebook (71 - 115, n=8, last 2 years) | |
| Dell XPS 13 9305 Core i5 FHD | |
| Average Intel Iris Xe Graphics G7 80EUs (21.8 - 56.9, n=103) | |
| Dell Latitude 5320-TM4V2 | |
| Lenovo ThinkPad L13 Gen2-21AB000PGE | |
| Acer TravelMate P4 TMP414-51-59MR | |
| Lenovo ThinkPad L14 G2-20X1003WGE | |
| Dell Latitude 5310-23VP6 | |
| Final Fantasy XV Benchmark - 1280x720 Lite Quality | |
| Average of class Subnotebook (21.4 - 129.8, n=55, last 2 years) | |
| Lenovo ThinkBook 13s G3 20YA0005GE | |
| Dell XPS 13 9305 Core i5 FHD | |
| Average Intel Iris Xe Graphics G7 80EUs (8.32 - 45.6, n=107) | |
| Dell Latitude 5320-TM4V2 | |
| Acer TravelMate P4 TMP414-51-59MR | |
| Lenovo ThinkPad L14 G2-20X1003WGE | |
| Lenovo ThinkBook 14 G2 ITL 20VDS02G00 | |
| Far Cry 5 - 1280x720 Low Preset AA:T | |
| Average of class Subnotebook (36 - 104, n=24, last 2 years) | |
| Average Intel Iris Xe Graphics G7 80EUs (14 - 63, n=50) | |
| Lenovo ThinkPad L13 Gen2-21AB000PGE | |
| Dell Latitude 5320-TM4V2 | |
| God of War - 1920x1080 Low Preset | |
| Average Intel Iris Xe Graphics G7 80EUs (14 - 21.1, n=5) | |
| Dell Latitude 5320-TM4V2 | |
| Strange Brigade - 1920x1080 medium AA:medium AF:4 | |
| Average of class Subnotebook (29.8 - 137.5, n=50, last 2 years) | |
| Dell XPS 13 9305 Core i5 FHD | |
| Average Intel Iris Xe Graphics G7 80EUs (6 - 48.8, n=86) | |
| Lenovo ThinkPad L13 Gen2-21AB000PGE | |
| Dell Latitude 5320-TM4V2 | |
| Acer TravelMate P4 TMP414-51-59MR | |
| Lenovo ThinkBook 14 G2 ITL 20VDS02G00 | |
| Dell Latitude 5310-23VP6 | |
| low | med. | high | ultra | |
|---|---|---|---|---|
| The Witcher 3 (2015) | 54.7 | 36.5 | 13.6 | |
| Final Fantasy XV Benchmark (2018) | 29.2 | 18 | 11.9 | |
| Far Cry 5 (2018) | 30 | 18 | 17 | |
| Strange Brigade (2018) | 62.6 | 25.1 | 20.8 | 17.4 |
| God of War (2022) | 15.7 | 14.6 |
排放--戴尔的移动PC大部分是静音的
噪声排放
在空闲和低负荷时,风扇通常是无声的。然而,在负载情况下,它的音量变大了,我们在压力测试开始时测得了令人印象深刻的51分贝(A)。戴尔的超性能模式在这里发挥了作用--如果没有这个模式,散热就不会那么响。另一方面,在相同的温度模式下,简单的负载是合理的,为38 dB(A)。
Noise level
| Idle |
| 26 / 26 / 27.5 dB(A) |
| Load |
| 38 / 51 dB(A) |
 | ||
30 dB silent 40 dB(A) audible 50 dB(A) loud |
||
min: | ||
| Dell Latitude 5320-TM4V2 Iris Xe G7 80EUs, i5-1135G7, Toshiba KBG40ZNS256G NVMe | Lenovo ThinkBook 13s G3 20YA0005GE Vega 8, R7 5800U, WDC PC SN530 SDBPNPZ-512G | Dell XPS 13 9305 Core i5 FHD Iris Xe G7 80EUs, i5-1135G7, Samsung PM9A1 MZVL2512HCJQ | Lenovo ThinkPad L13 Gen2-21AB000PGE Vega 7, R5 PRO 5650U, SK Hynix HFS512 GDE9X081N | Lenovo ThinkBook 14 G2 ITL 20VDS02G00 UHD Graphics Xe G4 48EUs, i3-1115G4, Samsung PM991A MZALQ256HBJD | |
|---|---|---|---|---|---|
| Noise | 1% | 9% | 1% | 5% | |
| off / environment * (dB) | 26 | 24.7 5% | 26 -0% | 25 4% | 24.6 5% |
| Idle Minimum * (dB) | 26 | 24.7 5% | 26 -0% | 25 4% | 24.6 5% |
| Idle Average * (dB) | 26 | 27 -4% | 26 -0% | 25 4% | 24.6 5% |
| Idle Maximum * (dB) | 27.5 | 29.8 -8% | 26 5% | 27.8 -1% | 26.7 3% |
| Load Average * (dB) | 38 | 42.4 -12% | 33.5 12% | 44.1 -16% | 38.9 -2% |
| Load Maximum * (dB) | 51 | 42.4 17% | 33.5 34% | 44.3 13% | 42.8 16% |
| Witcher 3 ultra * (dB) | 42.4 | 33.5 |
* ... smaller is better
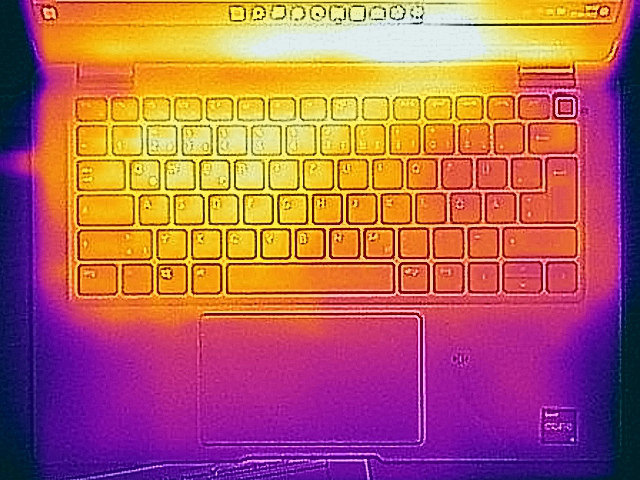
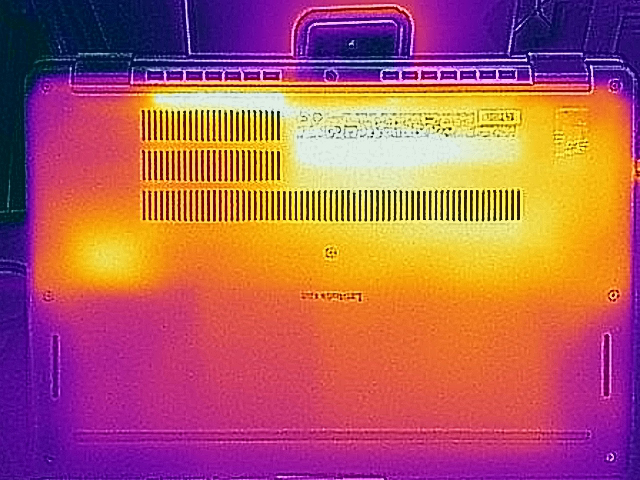
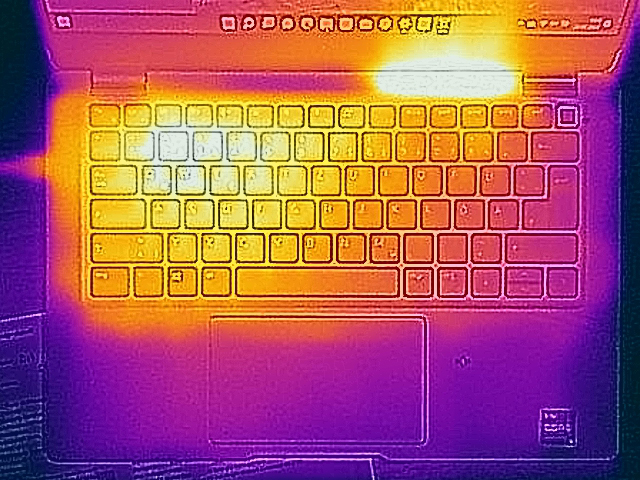
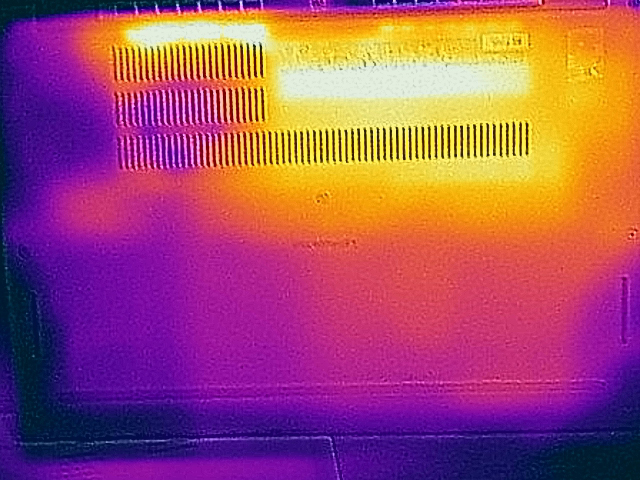
温度
Latitude ,即使在压力测试中也不会过度发热。同时,我们在一些测量点上记录了43摄氏度的温度,但只是选择性的。在日常使用中,该比率始终在绿色区域内,在某些点上仅达到35度。
(+) The maximum temperature on the upper side is 38.6 °C / 101 F, compared to the average of 35.9 °C / 97 F, ranging from 21.4 to 59 °C for the class Subnotebook.
(±) The bottom heats up to a maximum of 42.9 °C / 109 F, compared to the average of 39.2 °C / 103 F
(+) In idle usage, the average temperature for the upper side is 28.5 °C / 83 F, compared to the device average of 30.8 °C / 87 F.
(+) The palmrests and touchpad are cooler than skin temperature with a maximum of 25.1 °C / 77.2 F and are therefore cool to the touch.
(+) The average temperature of the palmrest area of similar devices was 28.2 °C / 82.8 F (+3.1 °C / 5.6 F).
| Dell Latitude 5320-TM4V2 Intel Core i5-1135G7, Intel Iris Xe Graphics G7 80EUs | Lenovo ThinkBook 13s G3 20YA0005GE AMD Ryzen 7 5800U, AMD Radeon RX Vega 8 (Ryzen 4000/5000) | Dell XPS 13 9305 Core i5 FHD Intel Core i5-1135G7, Intel Iris Xe Graphics G7 80EUs | Lenovo ThinkPad L13 Gen2-21AB000PGE AMD Ryzen 5 PRO 5650U, AMD Radeon RX Vega 7 | Lenovo ThinkBook 14 G2 ITL 20VDS02G00 Intel Core i3-1115G4, Intel UHD Graphics Xe G4 48EUs | |
|---|---|---|---|---|---|
| Heat | 18% | 8% | -1% | 14% | |
| Maximum Upper Side * (°C) | 38.6 | 36.5 5% | 43.5 -13% | 42.7 -11% | 35 9% |
| Maximum Bottom * (°C) | 42.9 | 39.6 8% | 44.8 -4% | 44.9 -5% | 38 11% |
| Idle Upper Side * (°C) | 35.3 | 24.5 31% | 26.2 26% | 32.6 8% | 28 21% |
| Idle Bottom * (°C) | 34.9 | 25 28% | 26.4 24% | 33.9 3% | 30 14% |
* ... smaller is better
压力测试
我们的压力测试(Prime95和Furmark至少运行一个小时)以3.1GHz的速度处理CPU几秒钟。然后速度下降到1.2GHz(CPU)并保持在这个水平。在这个测试中,软件包的功率短时间内从47瓦下降到18瓦。压力测试是一种极端情况,在日常使用中不会发生。我们用这个测试来检查系统是否在满负荷情况下也能稳定运行。
扬声器
立体声扬声器在设备底部的前面区域找到了自己的位置。它们产生的声音很好,但不是很响亮。扬声器的高音和中音很重,而低音则被忽略了。网络摄像头旁边的双阵列麦克风可以提供非常好的录音,无论说话者是在设备前面半米还是两米处说话。耳机可以通过3.5毫米插孔组合端口连接。
Dell Latitude 5320-TM4V2 audio analysis
(±) | speaker loudness is average but good (81 dB)
Bass 100 - 315 Hz
(-) | nearly no bass - on average 21.7% lower than median
(±) | linearity of bass is average (14.2% delta to prev. frequency)
Mids 400 - 2000 Hz
(+) | balanced mids - only 3.2% away from median
(+) | mids are linear (5.1% delta to prev. frequency)
Highs 2 - 16 kHz
(±) | higher highs - on average 5.2% higher than median
(+) | highs are linear (5.6% delta to prev. frequency)
Overall 100 - 16.000 Hz
(±) | linearity of overall sound is average (15.6% difference to median)
Compared to same class
» 36% of all tested devices in this class were better, 5% similar, 58% worse
» The best had a delta of 5%, average was 18%, worst was 53%
Compared to all devices tested
» 23% of all tested devices were better, 5% similar, 72% worse
» The best had a delta of 4%, average was 23%, worst was 134%
Lenovo ThinkPad L13 Gen2-21AB000PGE audio analysis
(+) | speakers can play relatively loud (82.4 dB)
Bass 100 - 315 Hz
(-) | nearly no bass - on average 25.6% lower than median
(±) | linearity of bass is average (13.8% delta to prev. frequency)
Mids 400 - 2000 Hz
(+) | balanced mids - only 3.3% away from median
(+) | mids are linear (4.6% delta to prev. frequency)
Highs 2 - 16 kHz
(+) | balanced highs - only 4.1% away from median
(+) | highs are linear (6.5% delta to prev. frequency)
Overall 100 - 16.000 Hz
(±) | linearity of overall sound is average (19% difference to median)
Compared to same class
» 58% of all tested devices in this class were better, 6% similar, 36% worse
» The best had a delta of 5%, average was 18%, worst was 53%
Compared to all devices tested
» 45% of all tested devices were better, 7% similar, 47% worse
» The best had a delta of 4%, average was 23%, worst was 134%
电源管理--商用笔记本电脑的运行时间为10小时
能源消耗
在能源消耗方面没有任何显眼的地方。我们测量了空闲时的最大功耗为7.8瓦,低于测试领域的任何其他型号。在压力测试(Prime95和Furmark)期间,该值在几秒钟内增加到67瓦。附带的USB Type-C电源的额定功率为65瓦。
| Off / Standby | |
| Idle | |
| Load |
|
Key:
min: | |
| Dell Latitude 5320-TM4V2 i5-1135G7, Iris Xe G7 80EUs, Toshiba KBG40ZNS256G NVMe, IPS, 1920x1080, 13.3" | Lenovo ThinkBook 13s G3 20YA0005GE R7 5800U, Vega 8, WDC PC SN530 SDBPNPZ-512G, IPS, 1920x1200, 13.3" | Lenovo ThinkPad L13 Gen2-21AB000PGE R5 PRO 5650U, Vega 7, SK Hynix HFS512 GDE9X081N, IPS, 1920x1080, 13.3" | Lenovo ThinkBook 14 G2 ITL 20VDS02G00 i3-1115G4, UHD Graphics Xe G4 48EUs, Samsung PM991A MZALQ256HBJD, a-Si IPS LED, 1920x1080, 14" | Average Intel Iris Xe Graphics G7 80EUs | Average of class Subnotebook | |
|---|---|---|---|---|---|---|
| Power Consumption | -17% | 2% | -30% | -11% | -4% | |
| Idle Minimum * (Watt) | 3.4 | 5 -47% | 4.4 -29% | 6.3 -85% | 4.49 ? -32% | 3.76 ? -11% |
| Idle Average * (Watt) | 6 | 8.2 -37% | 7.6 -27% | 9.5 -58% | 7.4 ? -23% | 6.54 ? -9% |
| Idle Maximum * (Watt) | 7.8 | 9 -15% | 9.5 -22% | 10.4 -33% | 9.26 ? -19% | 7.89 ? -1% |
| Load Average * (Watt) | 41 | 45 -10% | 33 20% | 32.7 20% | 36.6 ? 11% | 42 ? -2% |
| Witcher 3 ultra * (Watt) | 37.9 | 45.1 -19% | 33.4 12% 33.3 12% | |||
| Load Maximum * (Watt) | 67 | 51.2 24% | 32.5 51% | 63.3 6% | 61.7 ? 8% | 64.8 ? 3% |
* ... smaller is better
Power consumption Witcher 3 / Stresstest
Power consumption with external monitor
电池寿命
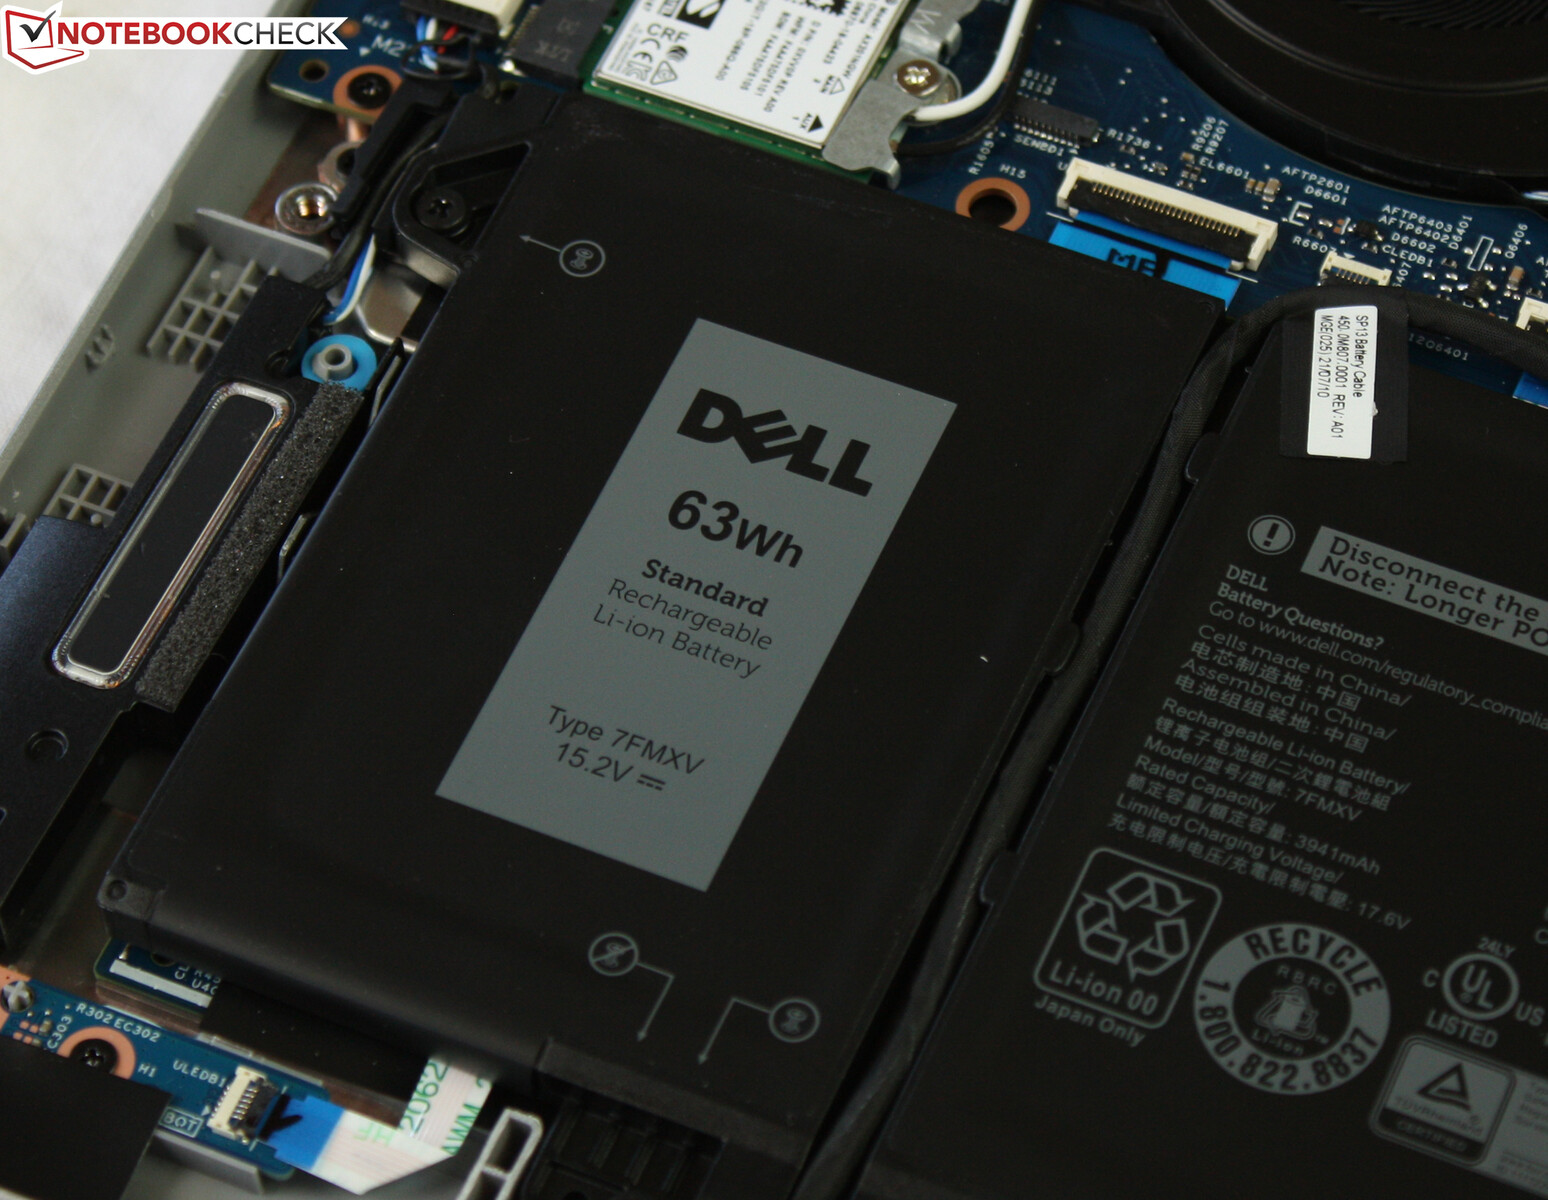
63Wh的电池运行时间是不错的。这台13.3英寸的笔记本在10小时后完成了我们的WLAN测试(通过脚本打开网站)。这对现代笔记本来说并不罕见,因为比赛中显示有两个例外。有趣的是:前辈 Latitude 5310持续时间长了一个小时。然而,在电池寿命方面的真正竞争者是 联想ThinkPad L13 Gen2它有11个小时,而AMD的13英寸机只用46瓦时的电池就能做到。
确定的最大运行时间刚刚超过21小时。这没有实际用途,因为亮度降到了最低,无线模块被禁用(空闲,无负载)。
| Dell Latitude 5320-TM4V2 i5-1135G7, Iris Xe G7 80EUs, 63 Wh | Dell Latitude 5310-23VP6 i5-10310U, UHD Graphics 620, 60 Wh | Lenovo ThinkBook 13s G3 20YA0005GE R7 5800U, Vega 8, 56 Wh | Lenovo ThinkPad L13 Gen2-21AB000PGE R5 PRO 5650U, Vega 7, 46 Wh | Lenovo ThinkPad L14 G2-20X1003WGE i5-1135G7, Iris Xe G7 80EUs, 45 Wh | Lenovo ThinkBook 14 G2 ITL 20VDS02G00 i3-1115G4, UHD Graphics Xe G4 48EUs, 58 Wh | Average of class Subnotebook | |
|---|---|---|---|---|---|---|---|
| Battery runtime | 10% | 9% | -11% | -32% | -24% | 21% | |
| Reader / Idle (h) | 21.3 | 17.2 -19% | 13.2 -38% | 28.6 ? 34% | |||
| WiFi v1.3 (h) | 10.1 | 11.1 10% | 11 9% | 11 9% | 6.9 -32% | 7.6 -25% | 14 ? 39% |
| Load (h) | 2.2 | 1.7 -23% | 2 -9% | 1.969 ? -10% | |||
| H.264 (h) | 15.6 | 8.8 | 15.4 ? |
Pros
Cons
结论 -- 戴尔笔记本电脑的表现令人失望

戴尔的Latitude 5320在评级中得分为84%。这是一个很好的结果,但它不能跟上联想的竞争对手的分数(86-88%)。这怎么可能呢,因为运行时间很强,有Thunderbolt 4,而且排放不能再低了?
Latitude 5320有一些不应该存在的弱点,这些弱点使该设备总共失去了重要的分数。
这些是评级下调的原因。首先,我们对没有物理按键的ClickPad感到恼火。几乎没有触觉反馈,这导致了几乎感觉不到的压力点。我们并不喜欢使用这个触摸板。
其他弱点是显示屏--与前代产品和竞争对手相比--几乎在所有方面都很弱:色彩空间、亮度和色彩再现--一切都需要改进。最后,内存也是板载的,与前代产品相比是个退步 Latitude 5310.
此外,Tiger-Lake处理器的性能低于平均水平,热能只允许它的性能有限。因此,与AMD笔记本电脑相比,英特尔的机器甚至进一步落后。
如果你抓住前辈5310,你会得到更多的显示屏和更好的输入设备,目前在商店里还可以找到。彗星湖的处理器性能只是略低,运行时间甚至长了一个小时。
使用ThinkPad L13 Gen2,你可以获得更多的运行时间和更多的性能。 ThinkPad L13 Gen2 - 但这里的显示效果并没有好多少。如果性能和显示效果都要好,那么 ThinkBook 13s G3可能是一个选择:AMD Ryzen带来的性能明显更高。
价格和可用性
评测单位Latitude 5320-TM4V2,目前在数码港以1,190欧元的价格出售。.Latitude 5320-TM4V2在notebooksbilliger上架,售价1000欧元。.
Dell Latitude 5320-TM4V2
- 03/11/2022 v7 (old)
Sebastian Jentsch
Price comparison
