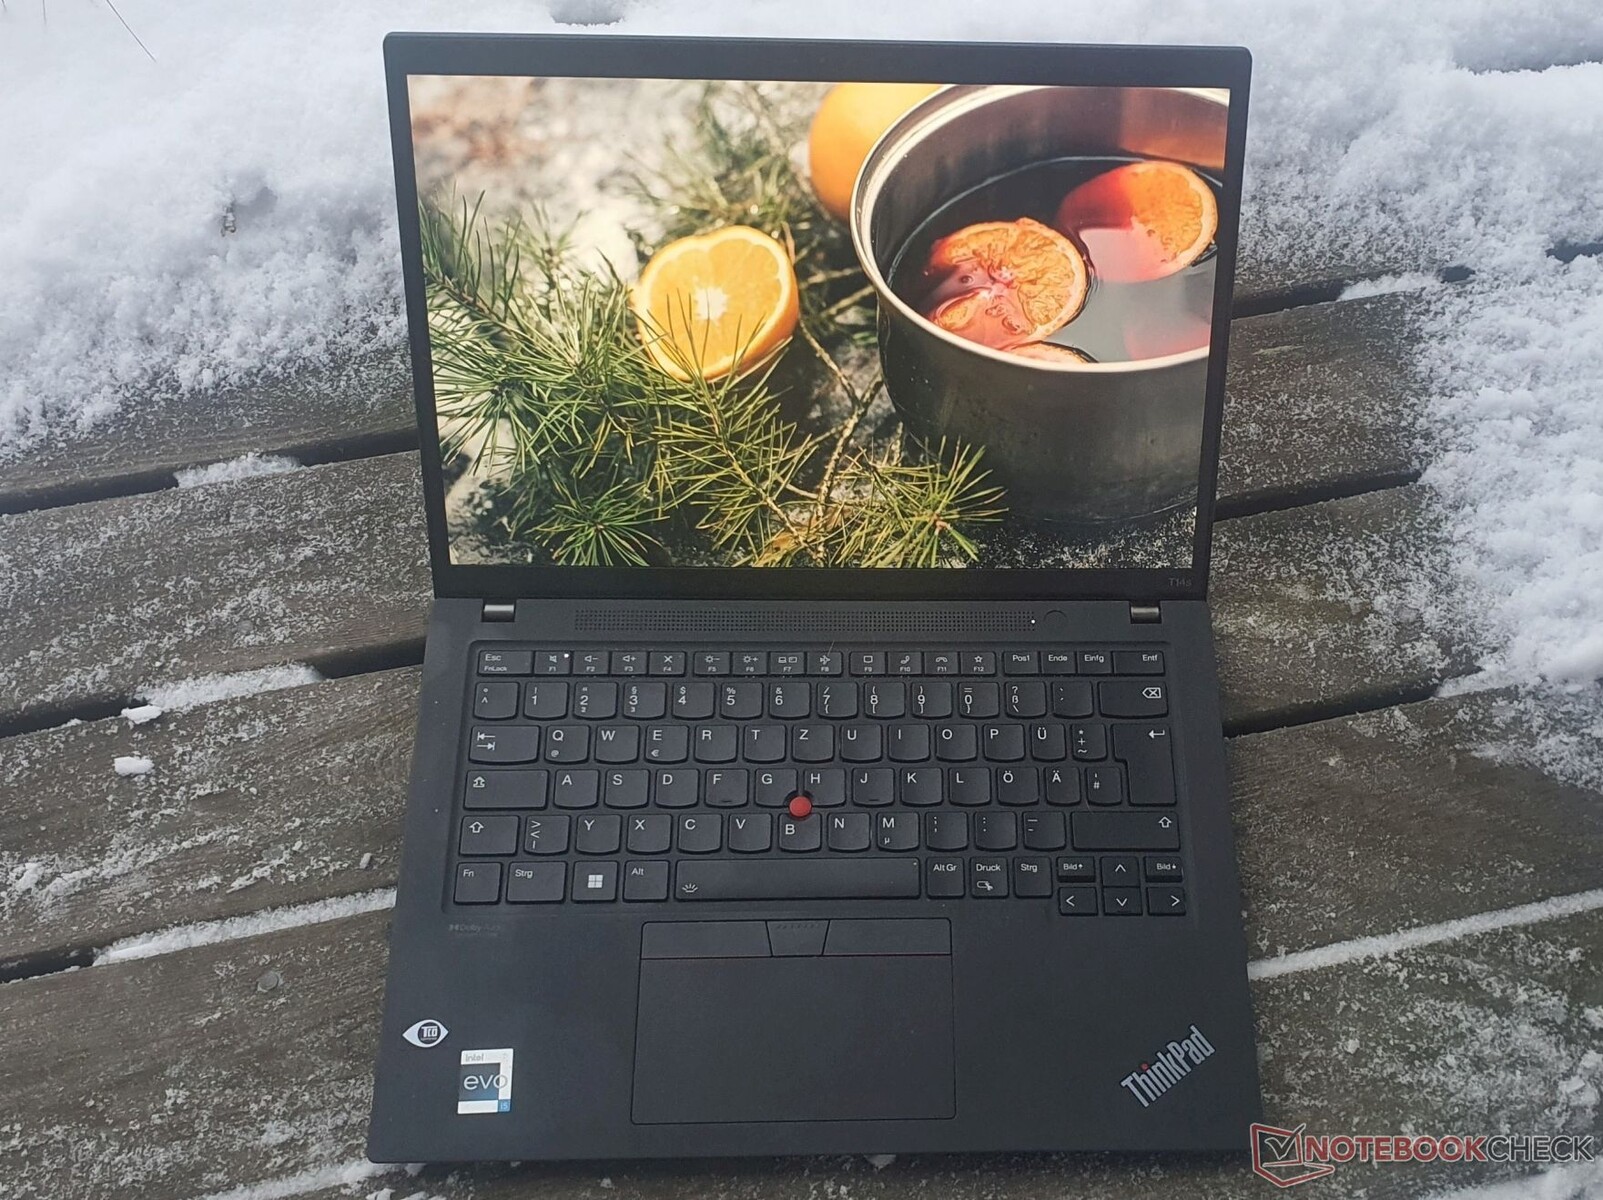
联想ThinkPad T14s G3英特尔笔记本电脑评测:安静、高效、快速

作为联想重新设计的一部分,最新的ThinkPad T14s G3终于获得了16:10显示屏,甚至是备受期待的3K OLED选项。更重要的是,它现在配备了英特尔CPU,TDP为28W(而不是15W)。所有这些功能都被装在一个紧凑、坚固的机箱里,而且重量很轻(重量随配置而变化)。总而言之,T14s G3已经变得更像 ThinkPad X1 Carbon,而修订后的 ThinkPad T14也同样紧凑。
我们的评测单元采用了高效的 酷睿i5-1235U16GB的快速LPDDR5内存,512GB的PCIe 4.0固态硬盘,以及一个低功耗的FHD+显示屏。这个配置在联想的学生折扣后售价为1,699欧元(1,800美元)。在这篇评论中,我们将讨论这些组件是否能将T14s G3变成一个与基于AMD的笔记本电脑一样的高效系统。
不包括联想的其他设备,高端ThinkPad的竞争对象是笔记本电脑,如 惠普EliteBook 845 G9, 戴尔Latitude 7420和 斯堪的纳维亚的Vision 14.在审查过程中,你会发现它们是否是可行的ThinkPad替代品。
潜在的竞争对手比较
Rating | Date | Model | Weight | Height | Size | Resolution | Price |
|---|---|---|---|---|---|---|---|
| 89.1 % v7 (old) | 12 / 2022 | Lenovo ThinkPad T14s G3 21BR00CDGE i5-1235U, Iris Xe G7 80EUs | 1.3 kg | 16.9 mm | 14.00" | 1920x1200 | |
| 89.4 % v7 (old) | 08 / 2021 | Lenovo ThinkPad T14s G2 20WM003TGE i7-1165G7, Iris Xe G7 96EUs | 1.3 kg | 16.14 mm | 14.00" | 1920x1080 | |
| 88.8 % v7 (old) | 09 / 2022 | Lenovo ThinkPad T14 G3-21CF004NGE R7 PRO 6850U, Radeon 680M | 1.4 kg | 17.9 mm | 14.00" | 1920x1200 | |
| 90.2 % v7 (old) | 06 / 2022 | Lenovo ThinkPad X1 Carbon G10 21CC001RGE i5-1250P, Iris Xe G7 80EUs | 1.2 kg | 15.36 mm | 14.00" | 1920x1200 | |
| 89.4 % v7 (old) | 11 / 2022 | Lenovo ThinkPad X13 G3 21BN0046GE i5-1235U, Iris Xe G7 80EUs | 1.3 kg | 18.9 mm | 13.30" | 1920x1200 | |
| 88.6 % v7 (old) | 11 / 2022 | HP EliteBook 845 G9 6F6H9EA R5 PRO 6650U, Radeon 660M | 1.4 kg | 19 mm | 14.00" | 1920x1200 | |
| 90.1 % v7 (old) | 04 / 2022 | Dell Latitude 7420 JW6MH i5-1145G7, Iris Xe G7 80EUs | 1.3 kg | 17.3 mm | 14.00" | 1920x1080 | |
| 88.8 % v7 (old) | 10 / 2022 | Schenker Vision 14 2022 RTX 3050 Ti i7-12700H, GeForce RTX 3050 Ti Laptop GPU | 1.3 kg | 16.6 mm | 14.00" | 2880x1800 |
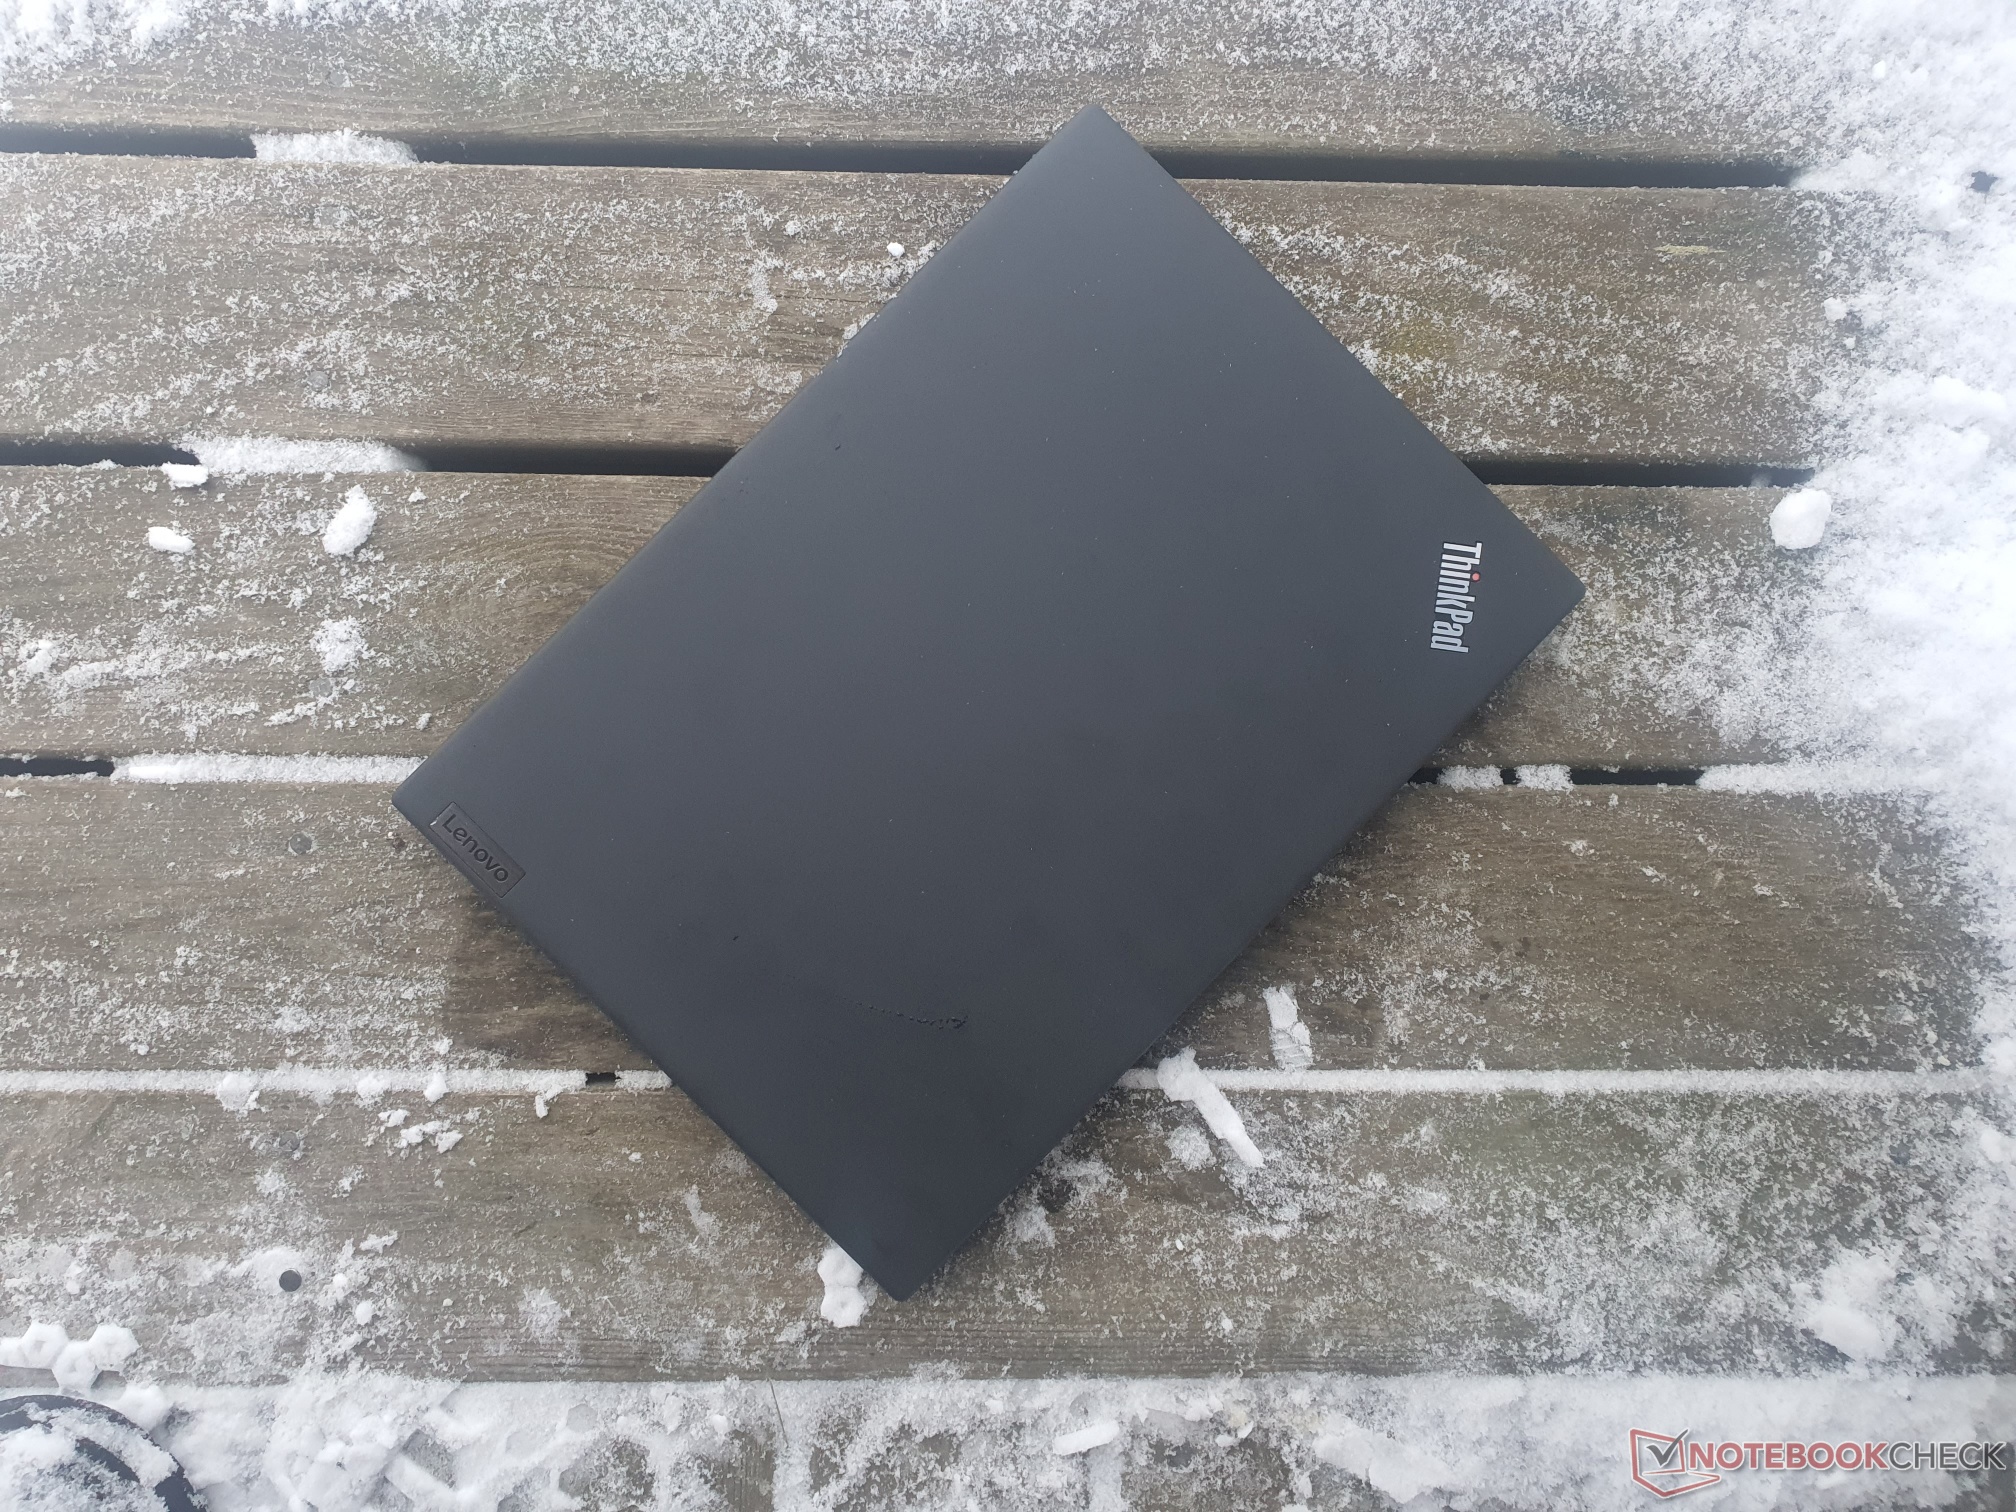
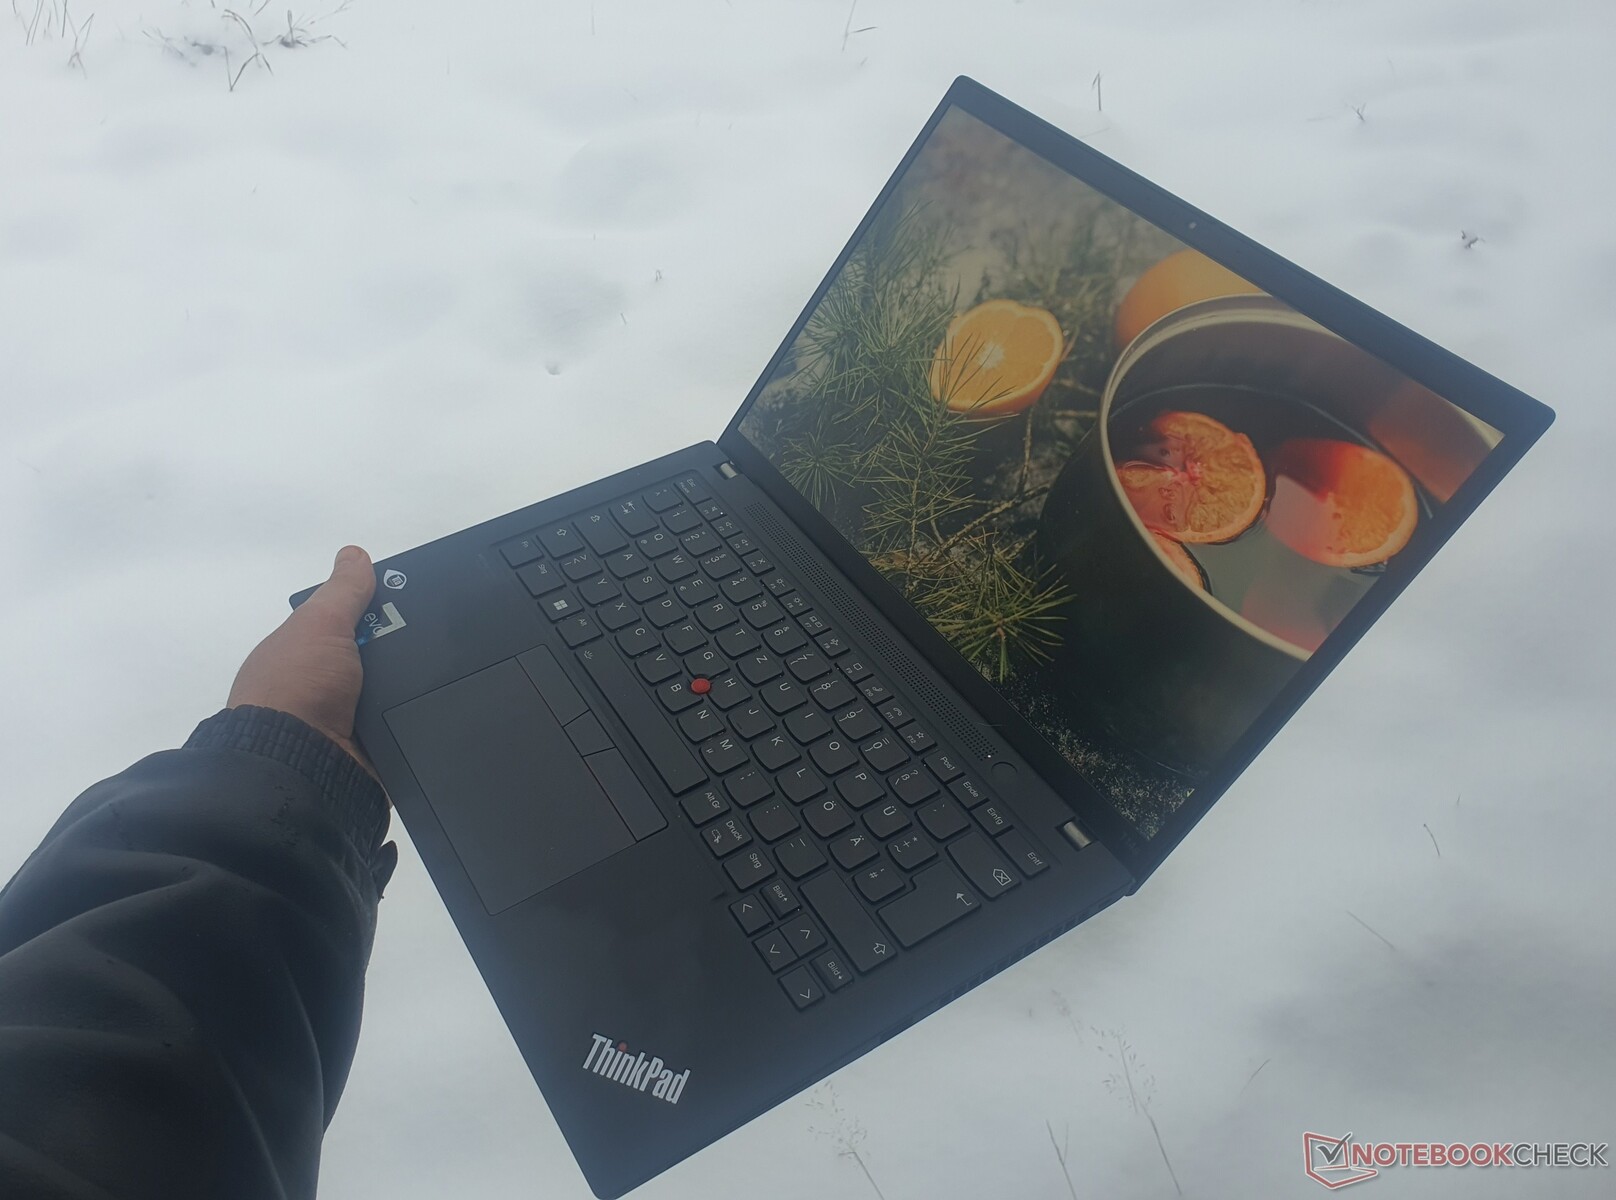
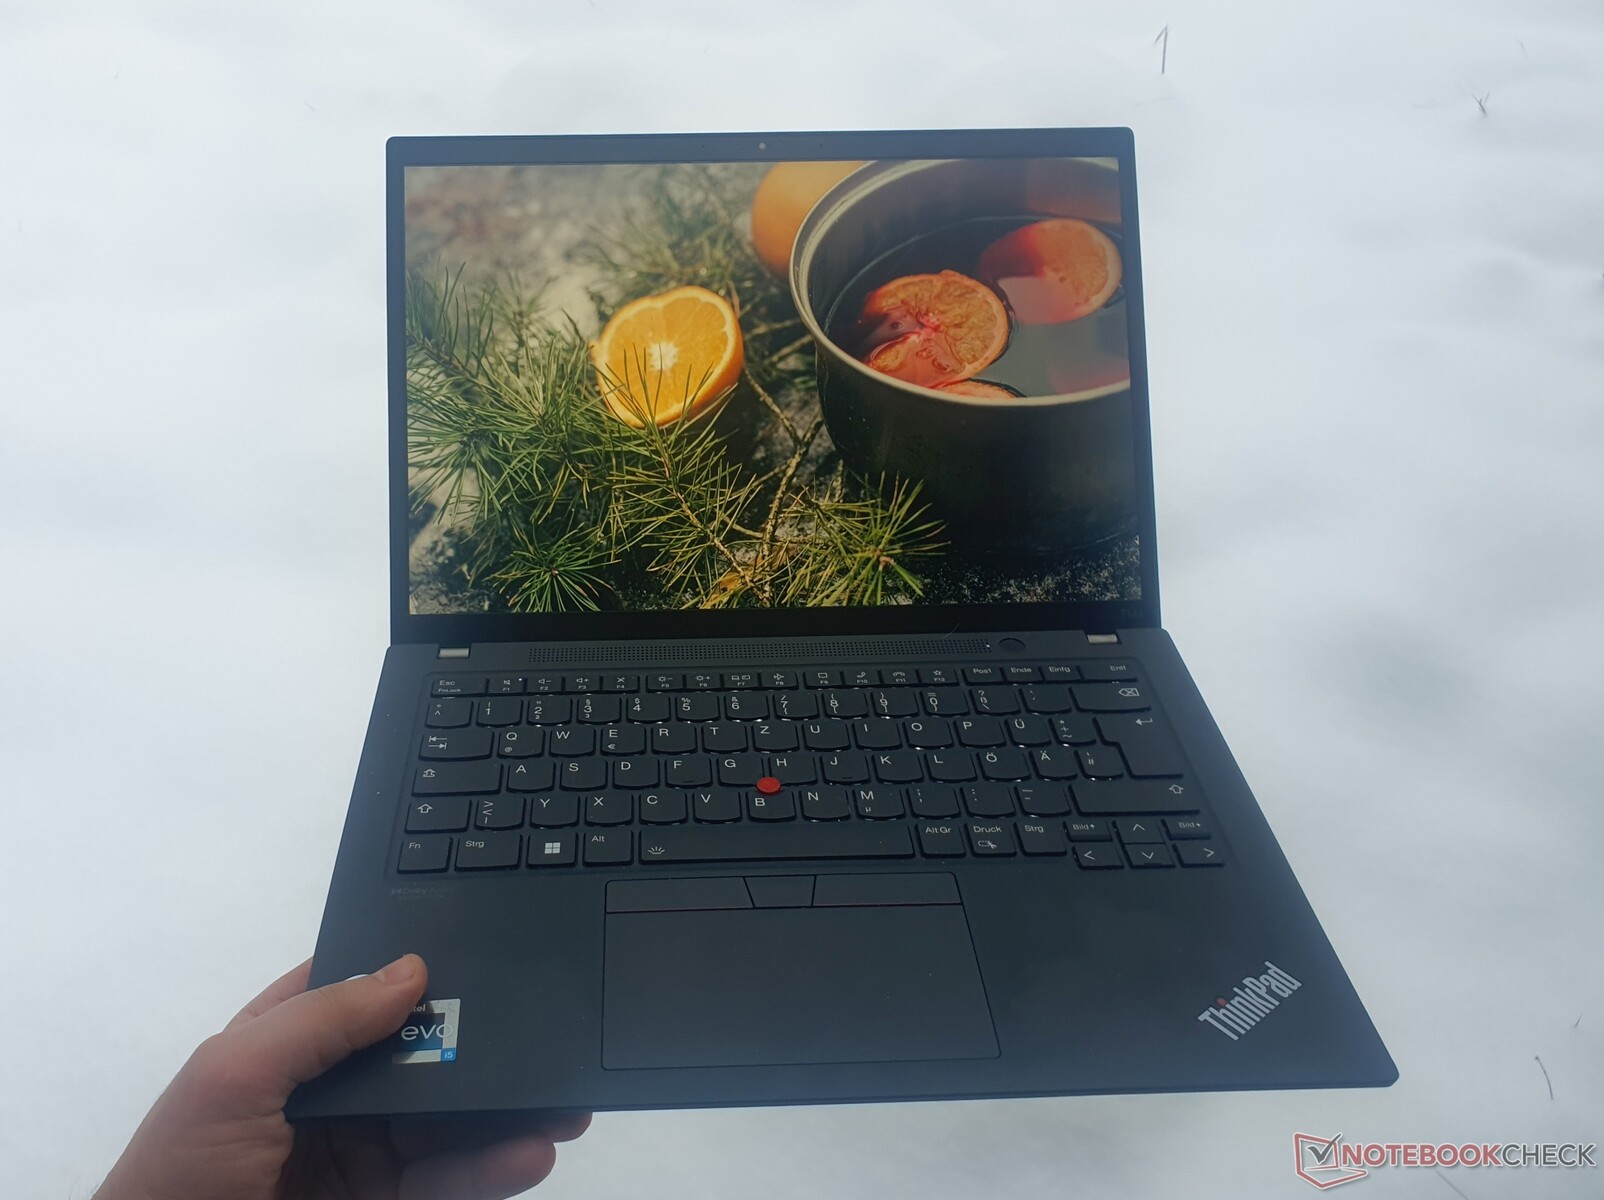
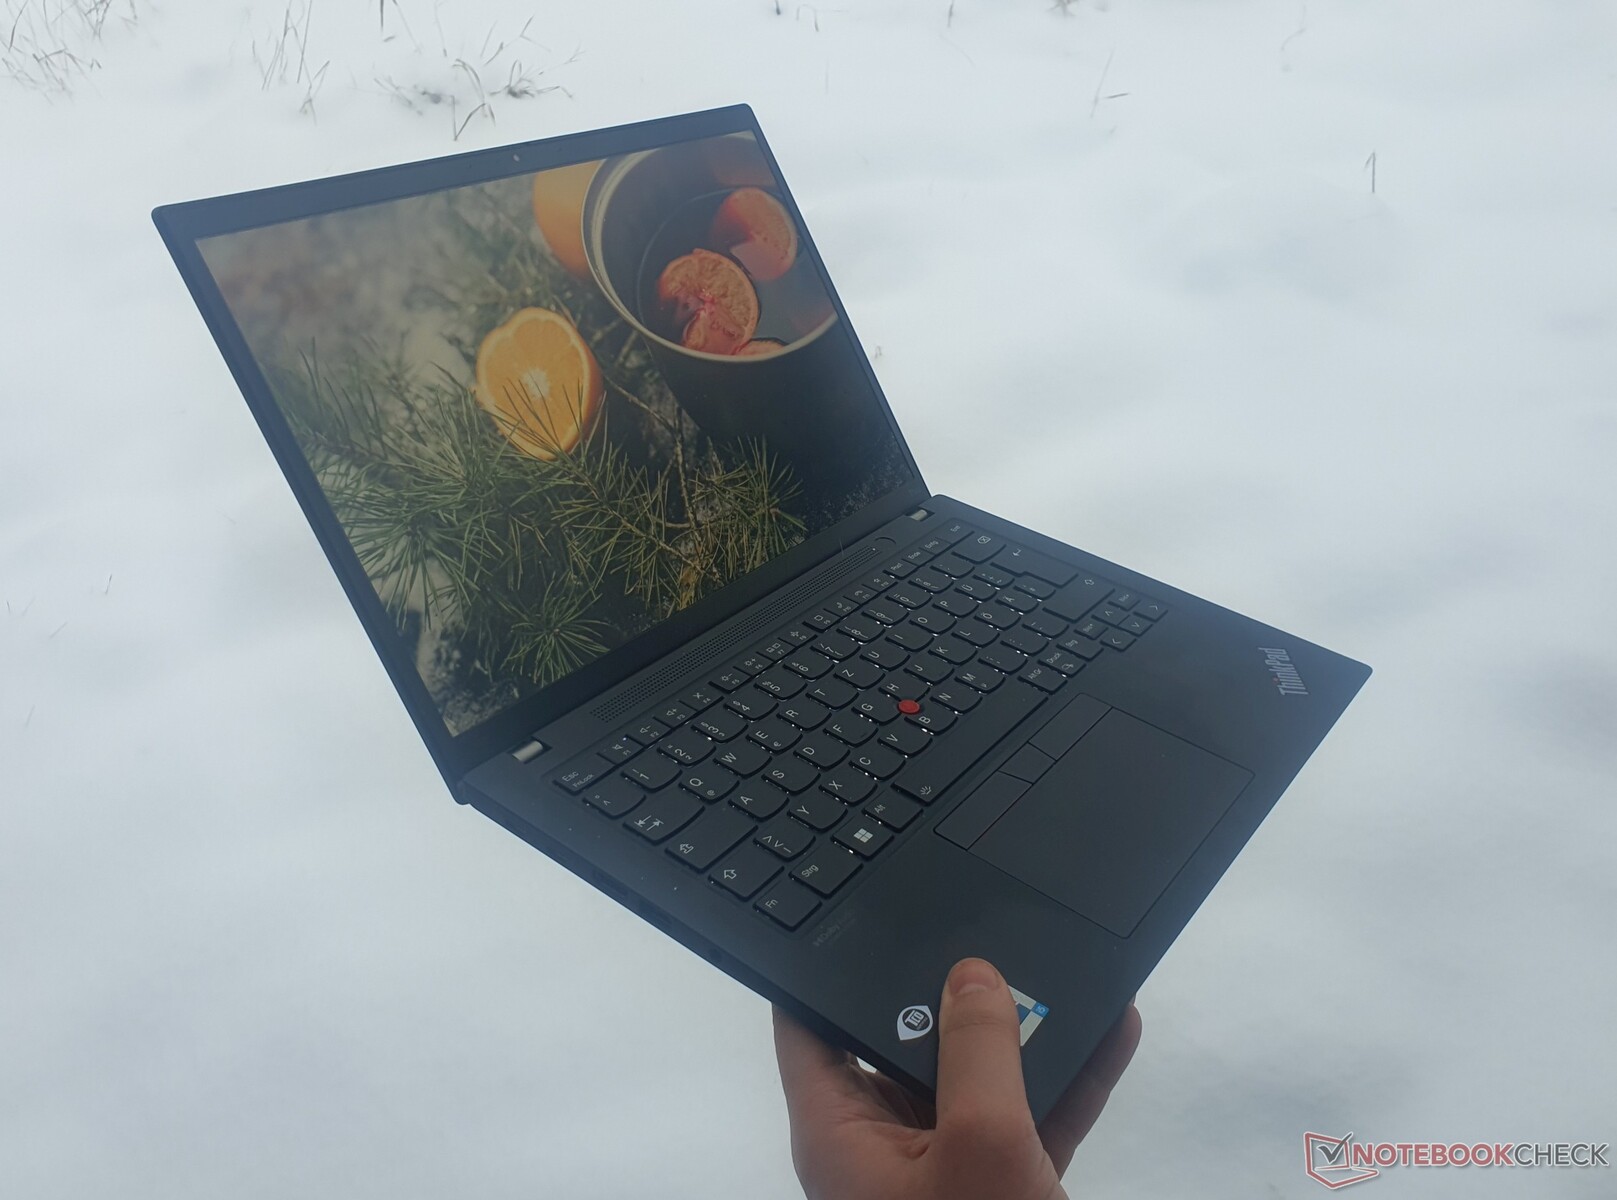
外壳。由于采用了碳纤维和金属设计,结构紧凑而坚固
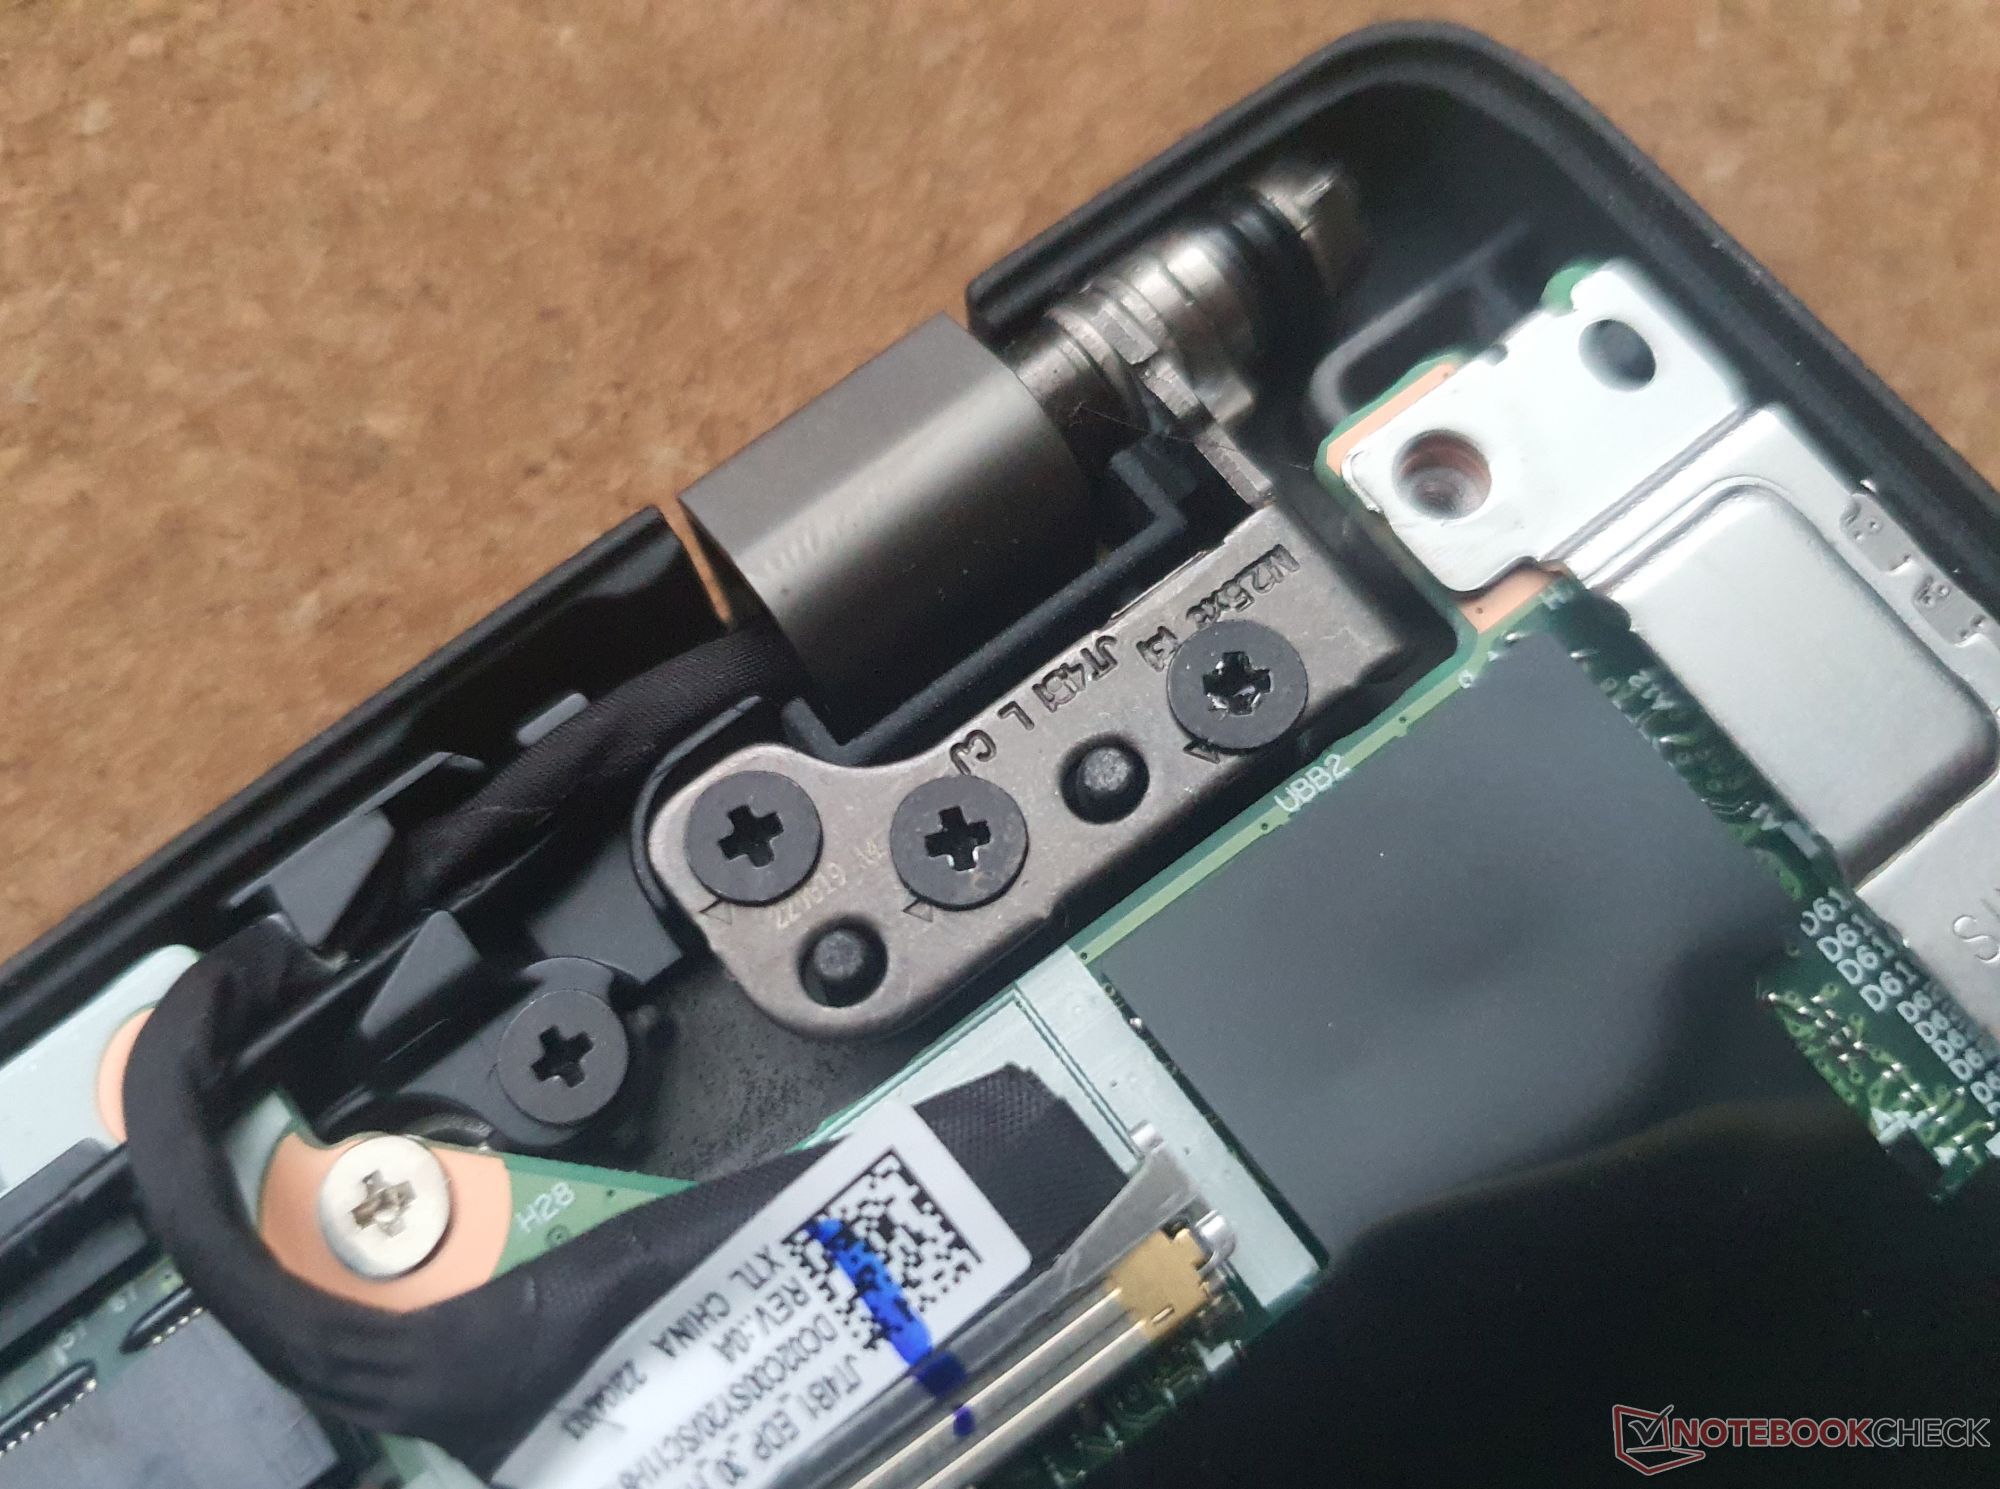
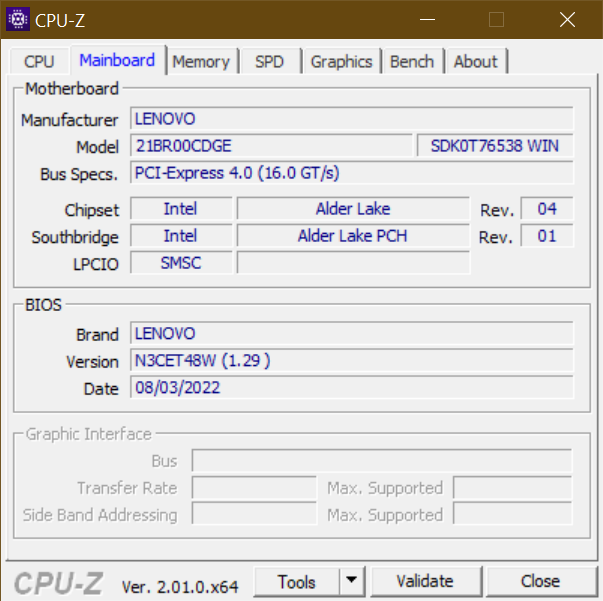
由于使用了碳、镁和铝,深灰色的ThinkPad T14s G3非常结实。无论我们在哪里试图扭转ThinkPad或对它施加其他物理力量,它都没有任何变形。机箱的外形尺寸较小(得益于其16:10的长宽比),边框也比上一代产品更薄。 前代产品.
铰链允许显示屏向后折叠达180度,并经过微调,将屏幕牢牢固定在位置上。然而,笔记本电脑不能用一只手打开。合身性和表面处理无可挑剔,略微粗糙的表面令人愉快,不滑,不会吸引太多的指纹。
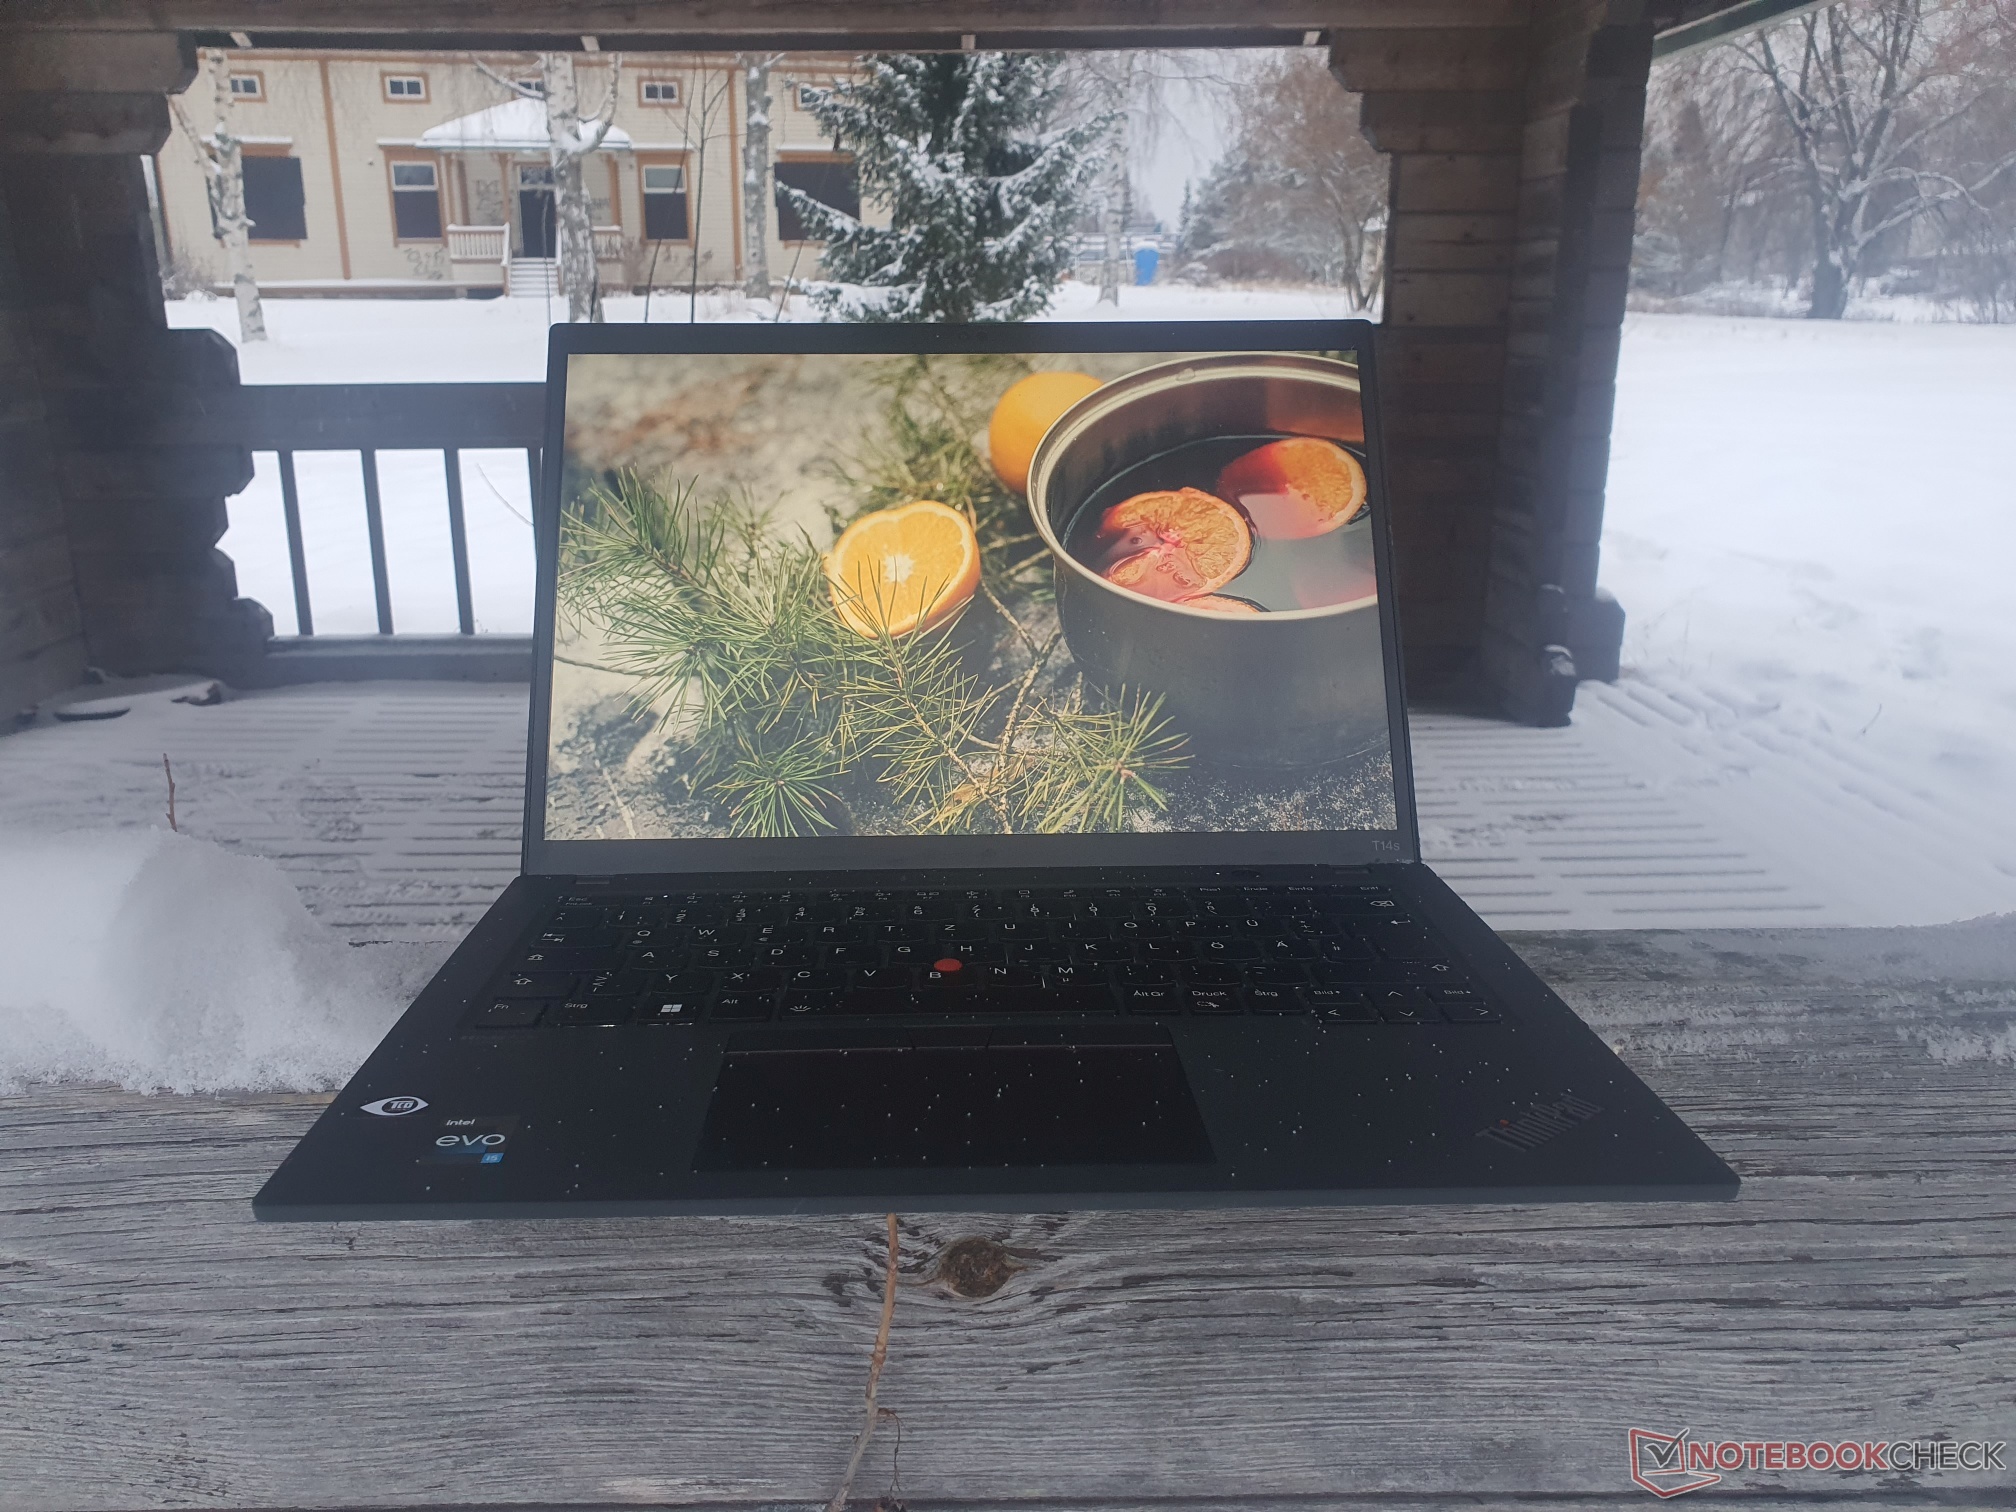
ThinkPad T14s G3的宽度为317.5毫米(12.5英寸),比上一代产品窄了10毫米(0.393英寸),深了3毫米(0.12英寸)。尽管T14s G3的起始重量为1.21公斤(2.67磅),但我们的评测单元的重量为1.33公斤(2.95磅),使其比 ThinkPad T14s G2更重。这款笔记本电脑的占地面积几乎与 X1 Carbon G10.像 ThinkPad X13和 MacBook Air一样,这款 申克视界14尽管拥有更强大的硬件,但比T14s G3更紧凑。
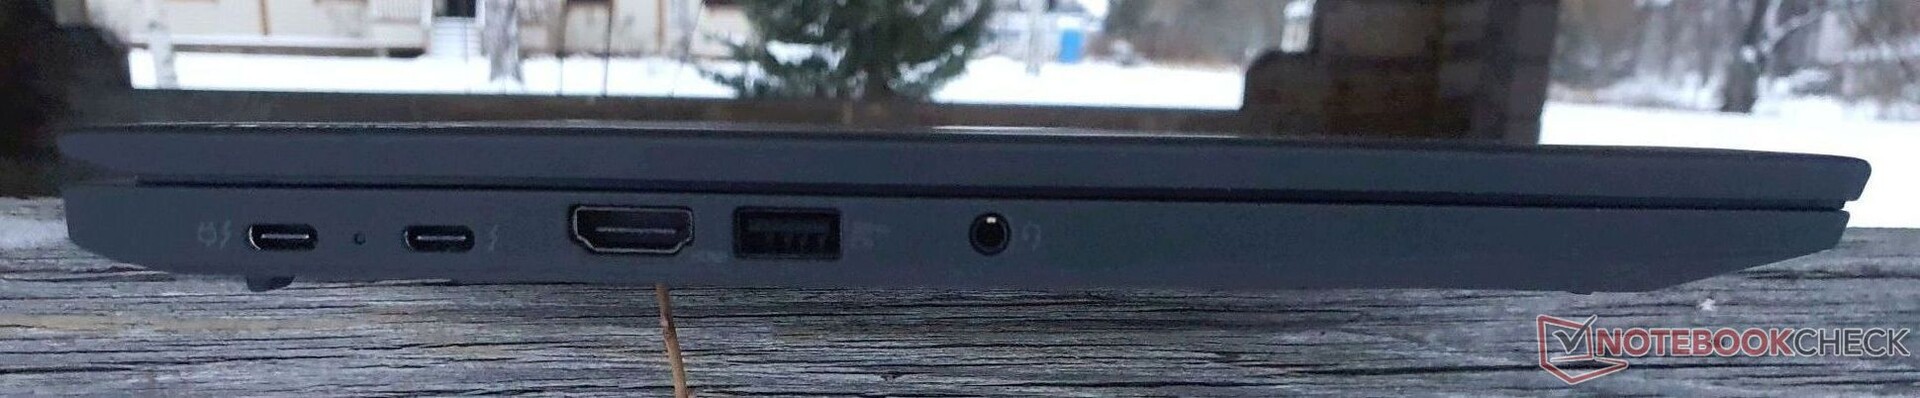
规格。Thunderbolt和1080p网络摄像头,许多焊接的组件
在ThinkPad T14s G3 Intel的左侧,你会发现两个雷电4端口,一个HDMI 2.0b端口(能够达到4K 60Hz)和一个音频插孔。在设备的每一侧还有一个USB-A 3.2 Gen 1。右侧有一个可选的智能卡读卡器和一个Kensington插槽。该设备的背面有一个纳米SIM卡插槽。笔记本电脑上缺少一个SD读卡器,而以太网端口只在(非S)ThinkPad T14上有。

连接性
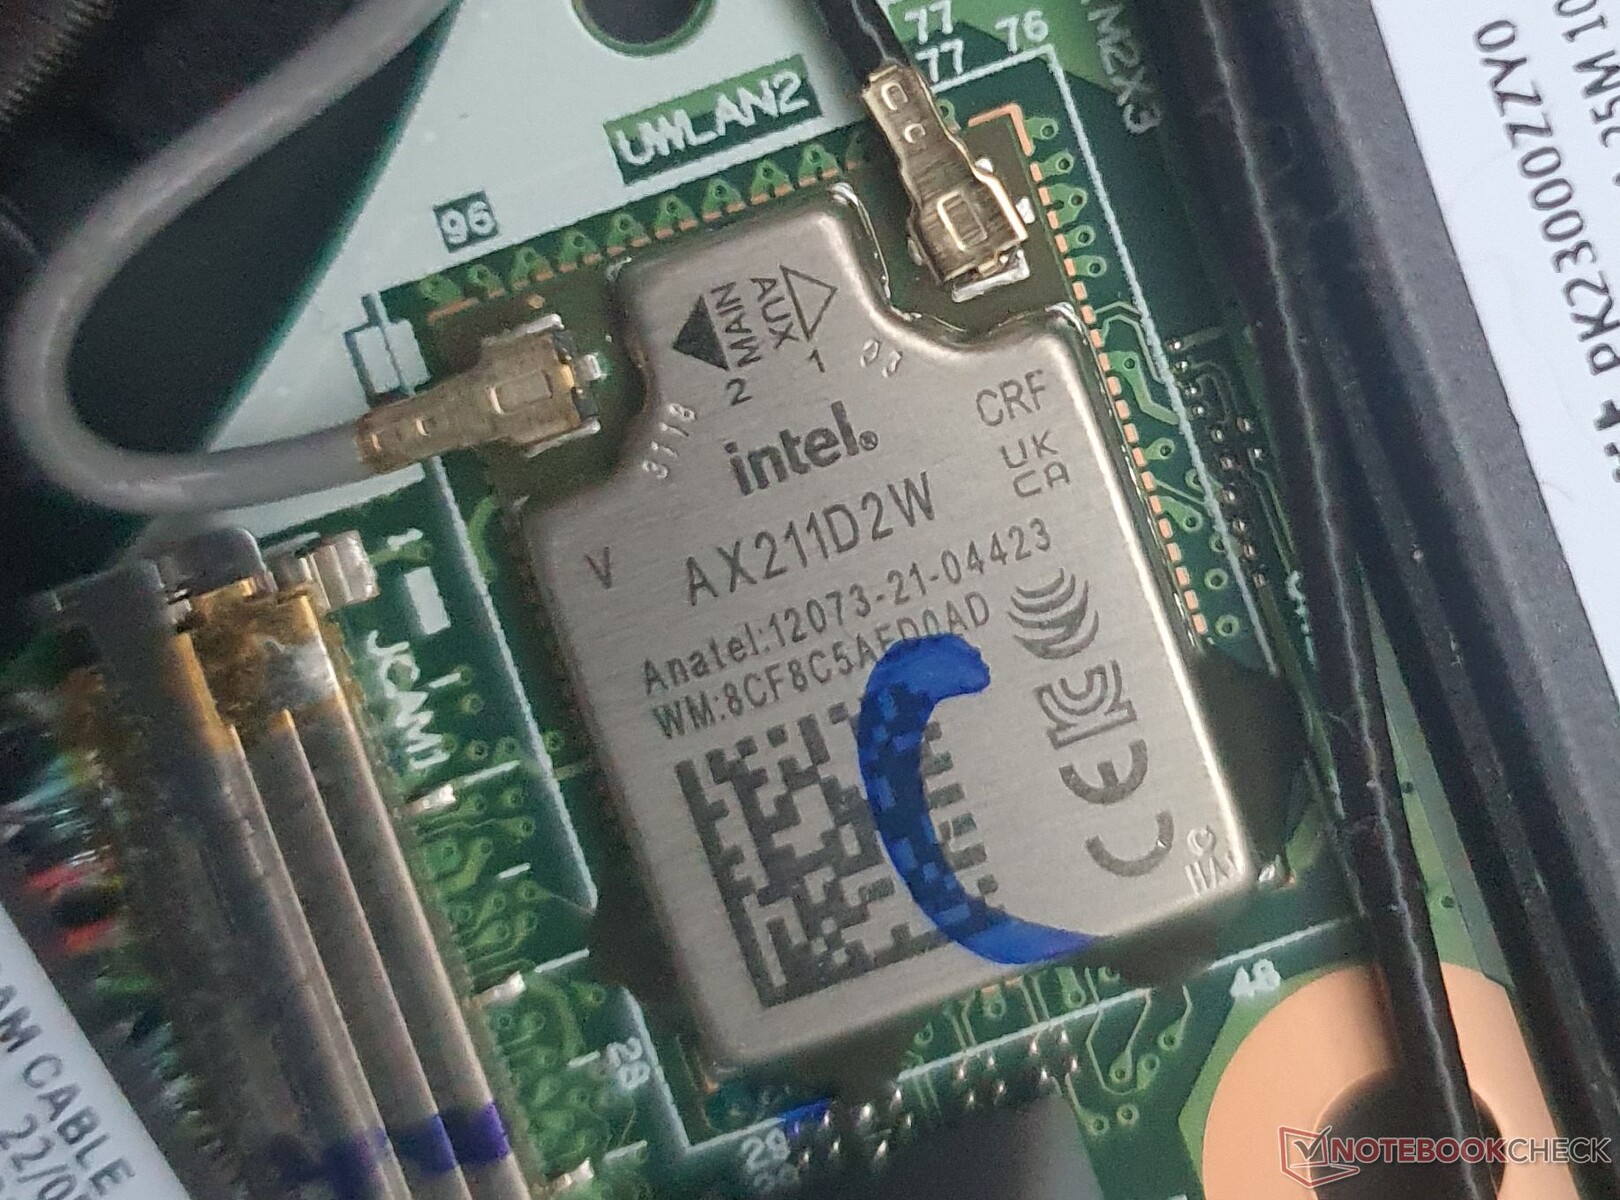
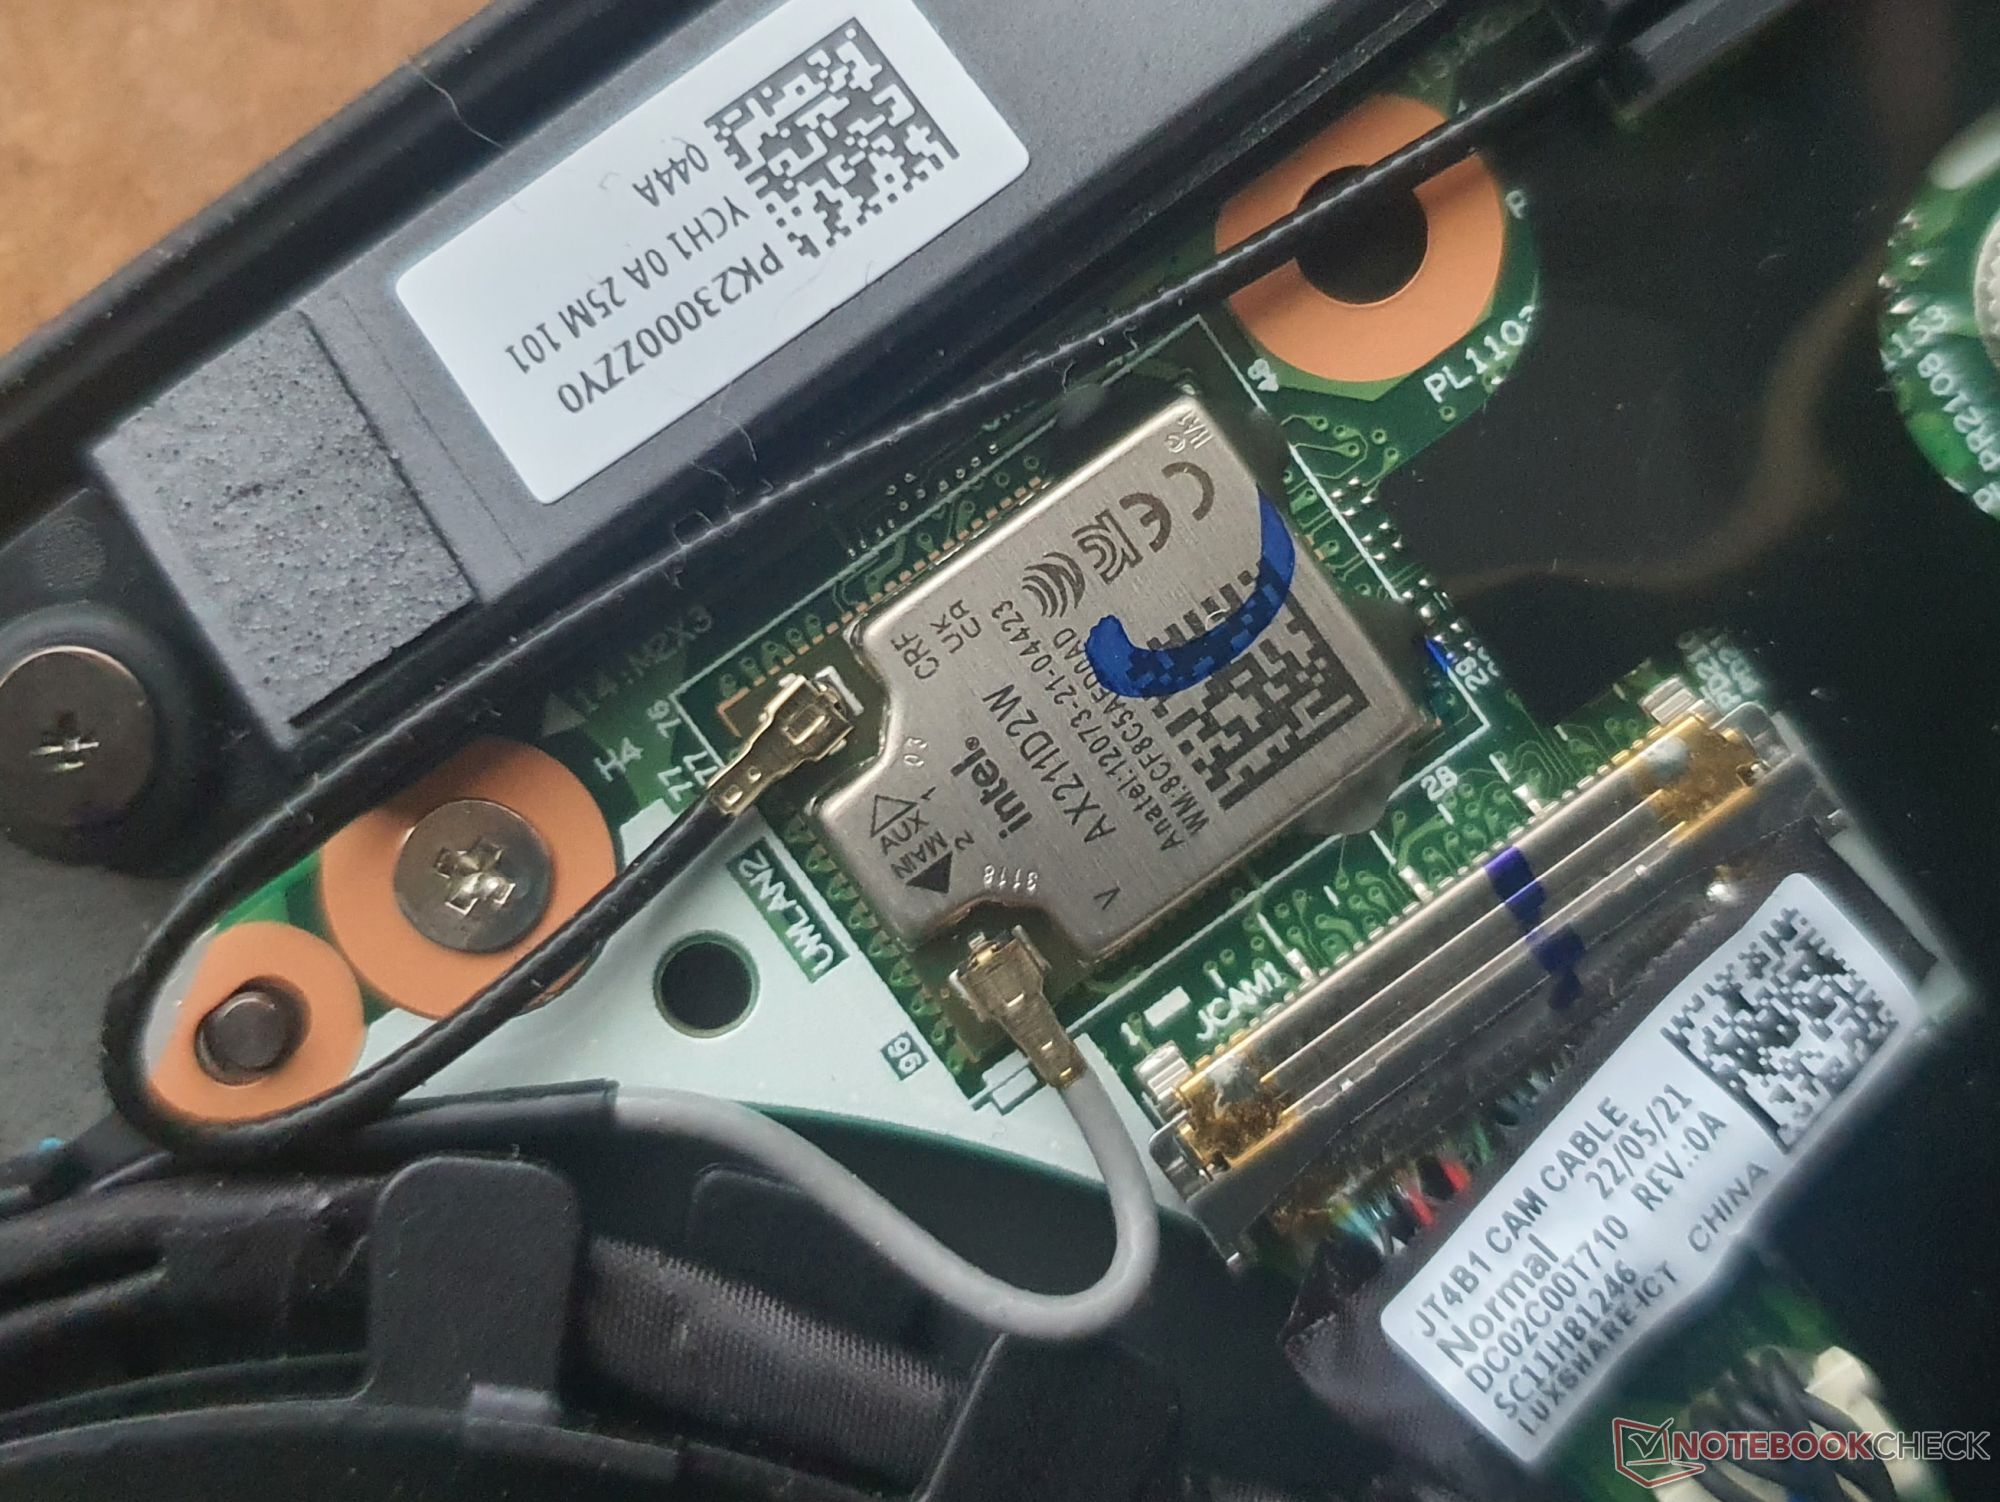
联想已将W-Fi 6E模块焊接到ThinkPad T14s的主板上。英特尔AX211能够提供约1.6至1.7 Gbit/s的高数据传输速度,这与前代产品相当。 前者相当。.相比之下,高通Wi-Fi模块在 的AMD版本的ThinkPad T14的高通Wi-Fi模块甚至比英特尔的卡运行得更快。T14s G3支持蓝牙5.2,而带有4G/5G的WWAN和NFC是可选的。
| Networking | |
| Lenovo ThinkPad T14s G3 21BR00CDGE | |
| iperf3 receive AXE11000 | |
| iperf3 transmit AXE11000 | |
| Lenovo ThinkPad T14s G2 20WM003TGE | |
| iperf3 transmit AX12 | |
| iperf3 receive AX12 | |
| Lenovo ThinkPad T14 G3-21CF004NGE | |
| iperf3 receive AXE11000 6GHz | |
| iperf3 transmit AXE11000 6GHz | |
| Lenovo ThinkPad X13 G3 21BN0046GE | |
| iperf3 receive AXE11000 | |
| iperf3 transmit AXE11000 | |
| Lenovo ThinkPad X1 Carbon G10 21CC001RGE | |
| iperf3 receive AXE11000 6GHz | |
| iperf3 transmit AXE11000 6GHz | |
| HP EliteBook 845 G9 6F6H9EA | |
| iperf3 receive AXE11000 | |
| Dell Latitude 7420 JW6MH | |
| iperf3 transmit AX12 | |
| iperf3 receive AX12 | |
| Schenker Vision 14 2022 RTX 3050 Ti | |
| iperf3 receive AXE11000 | |
| iperf3 transmit AXE11000 | |
网络摄像头
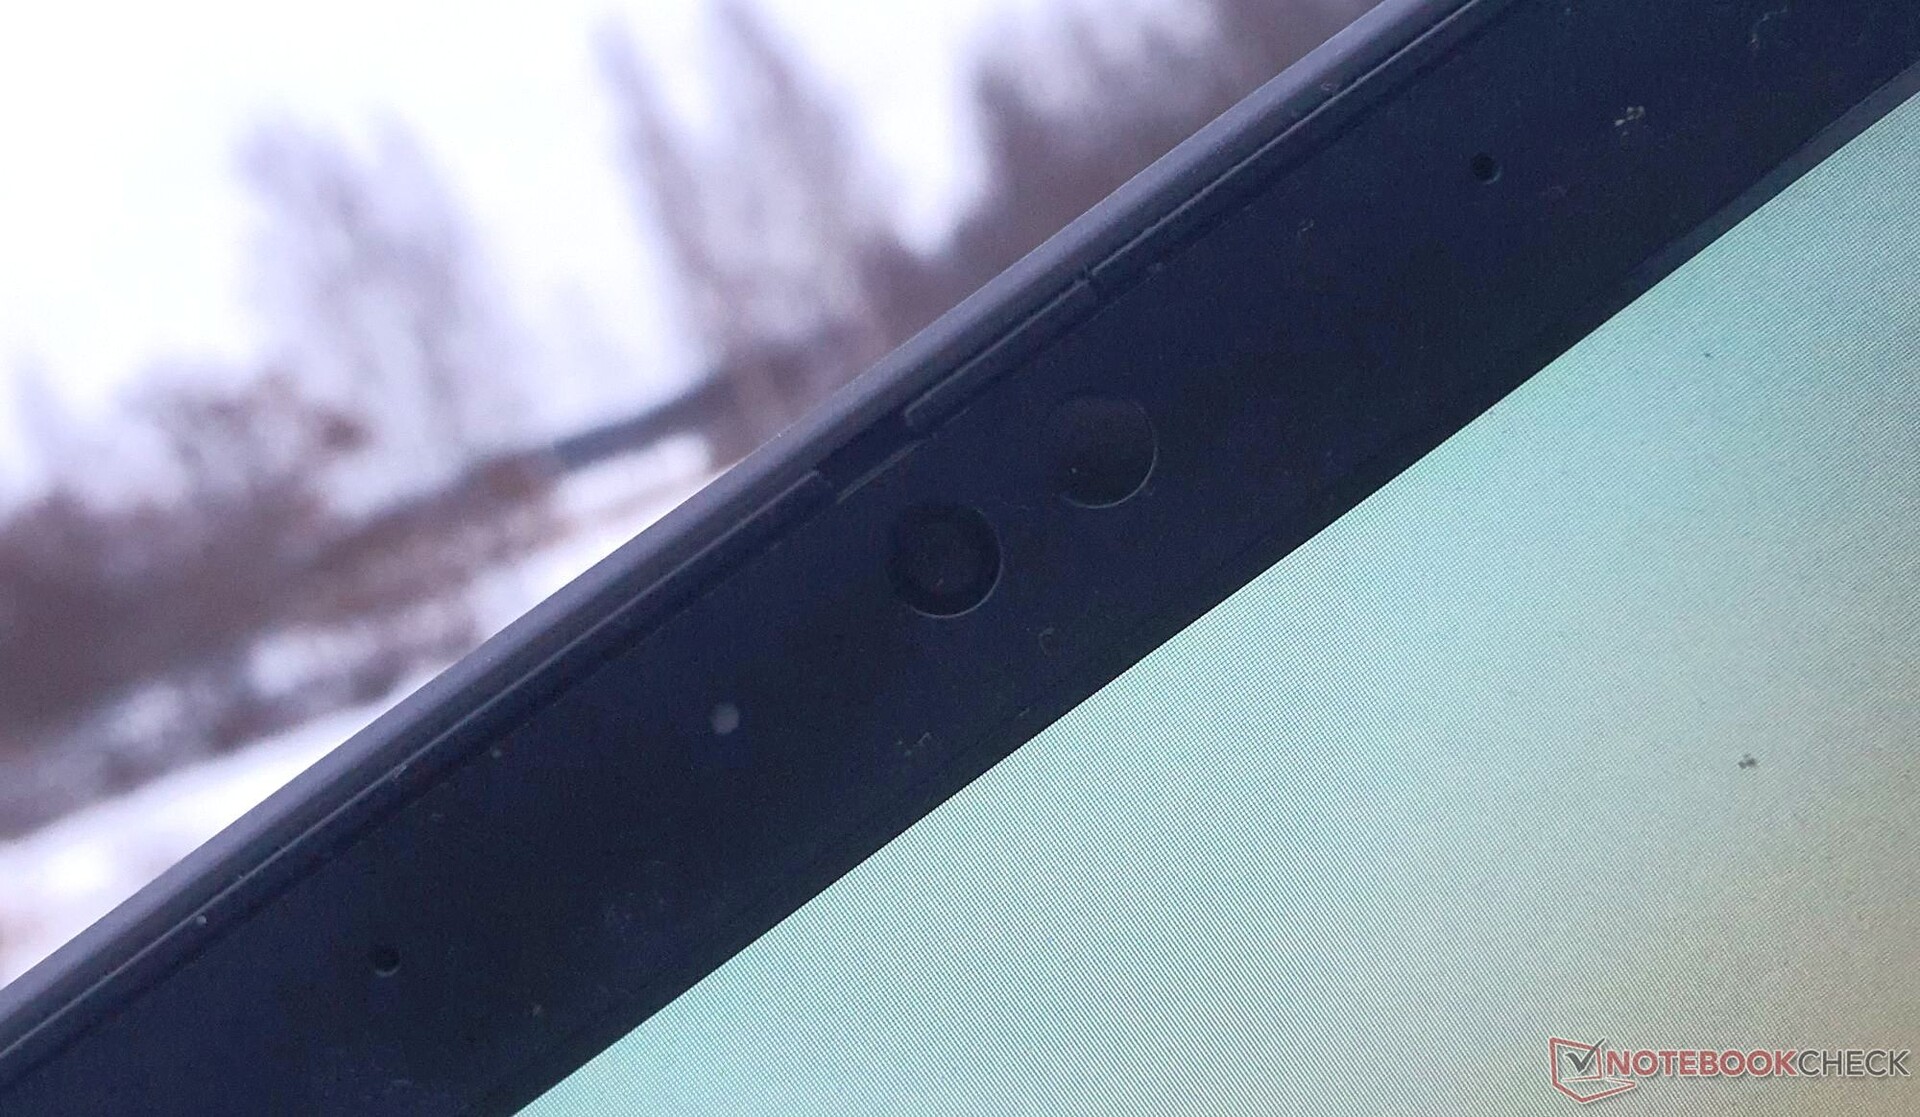
尽管带有双阵列麦克风的1080p网络摄像头并不那么出色,但它产生的图像看起来比前代产品的噪音和冲刷程度要低得多。


安全问题
ThinkPad T14s第三代提供了一个可选的智能卡读卡器、用于人脸识别的红外线和一个物理相机快门。其他安全功能包括一个肯辛顿插槽和一个可选的指纹传感器。在软件方面,该笔记本电脑还支持人的存在检测和Mirametrix Glance.
辅料
今年,T系列的对接端口也被取消了。相反,你可以使用联想或第三方公司生产的Thunderbolt或USB-C底座。这款笔记本电脑配备了一个65W的USB-C充电器,其90%的包装材料是回收的,或来自可持续发展的林业。
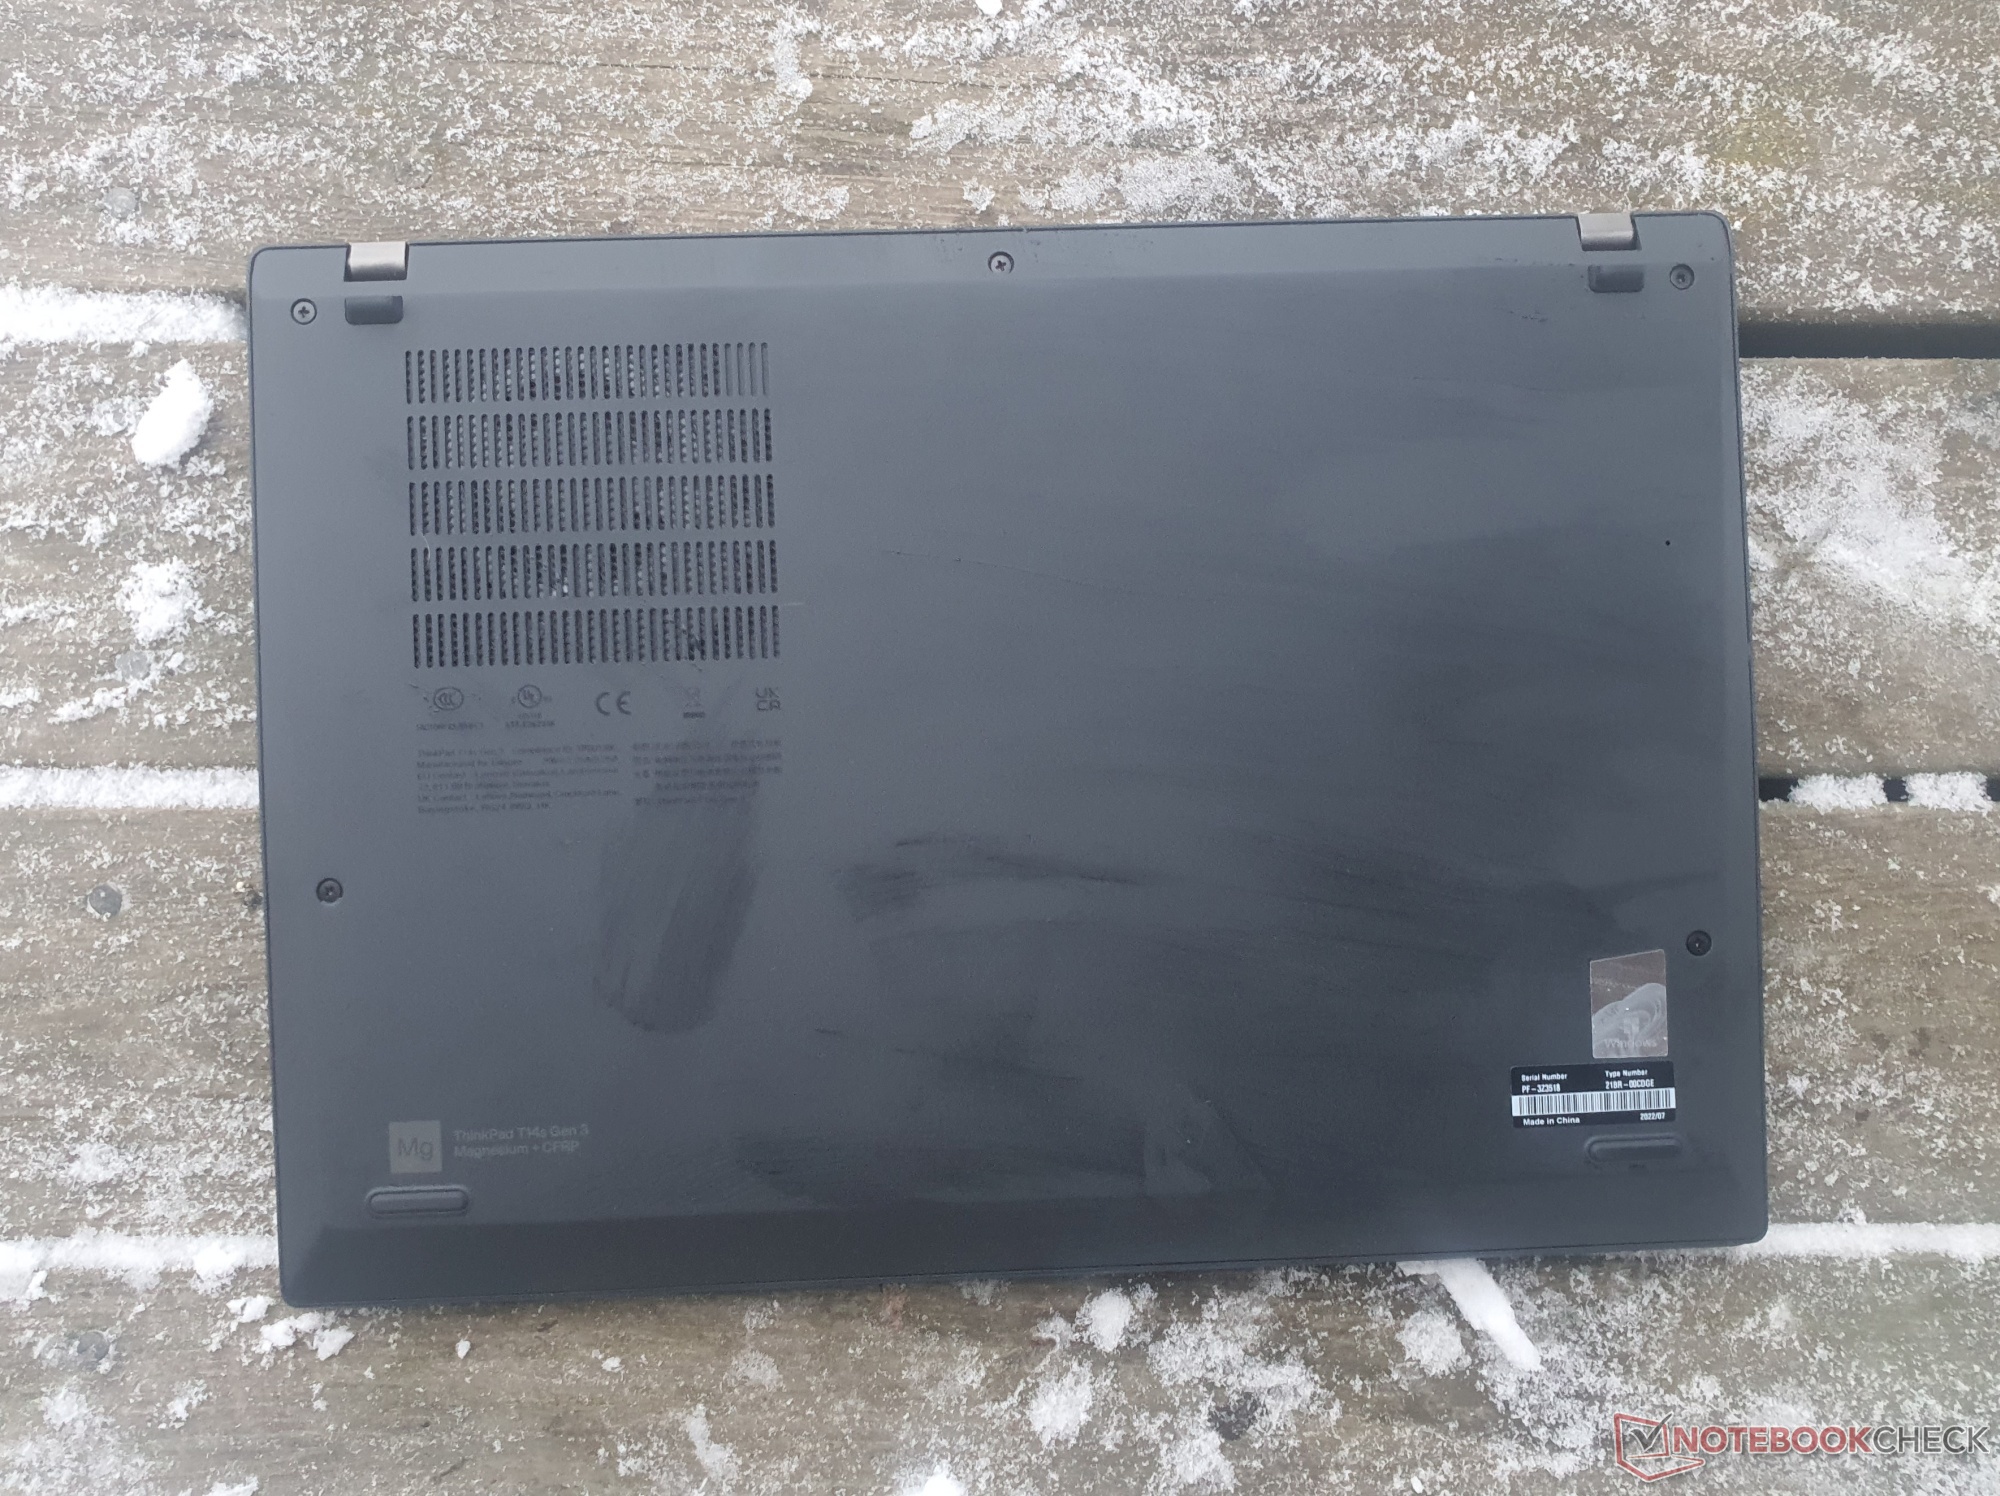
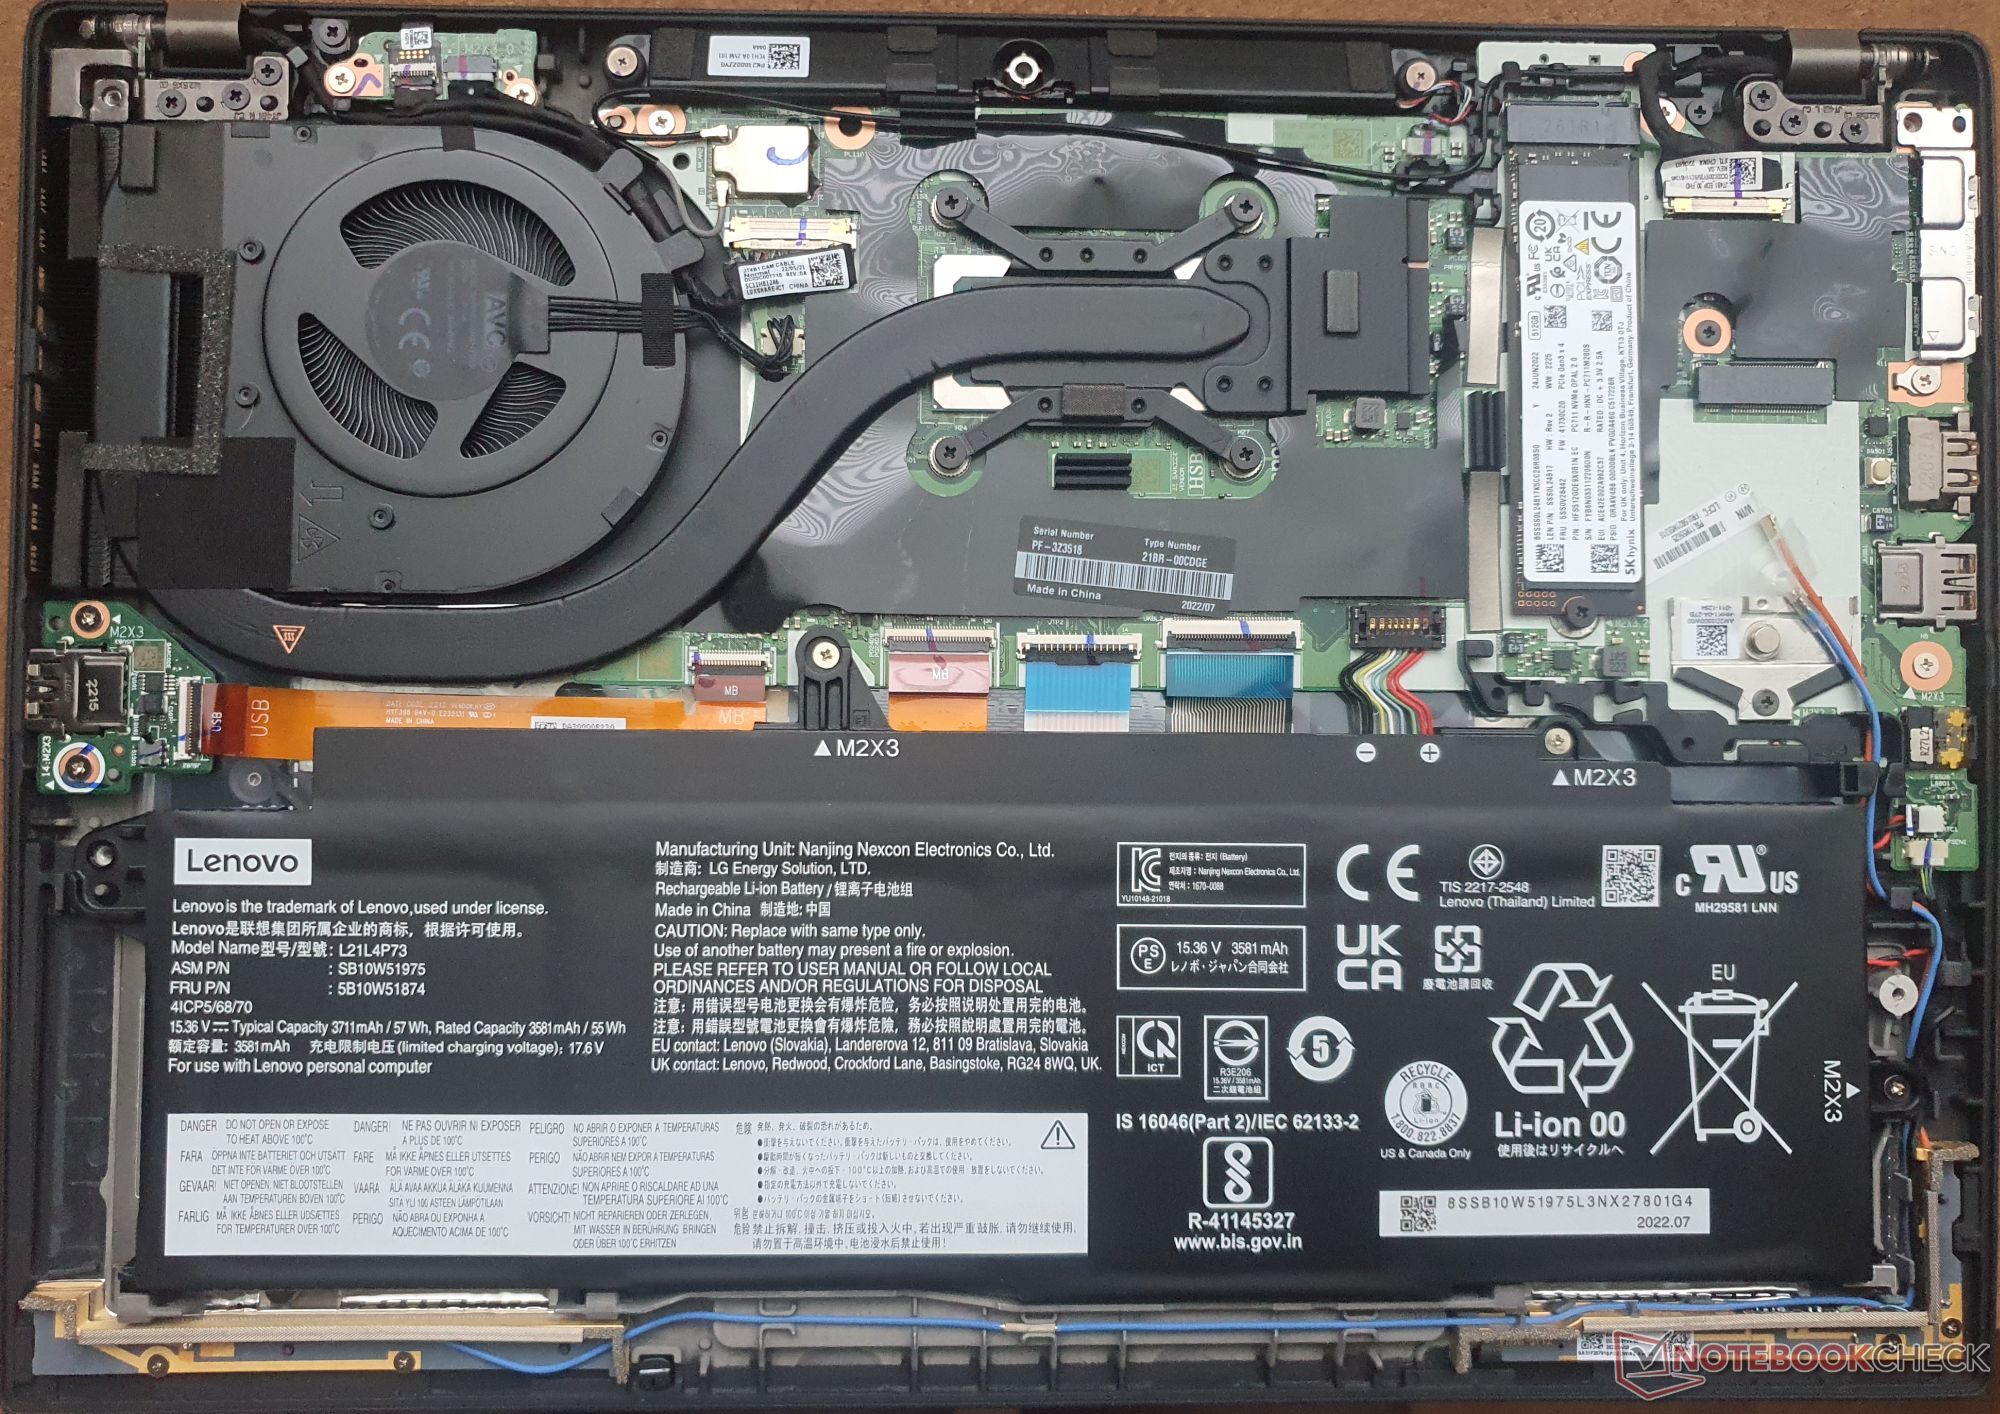
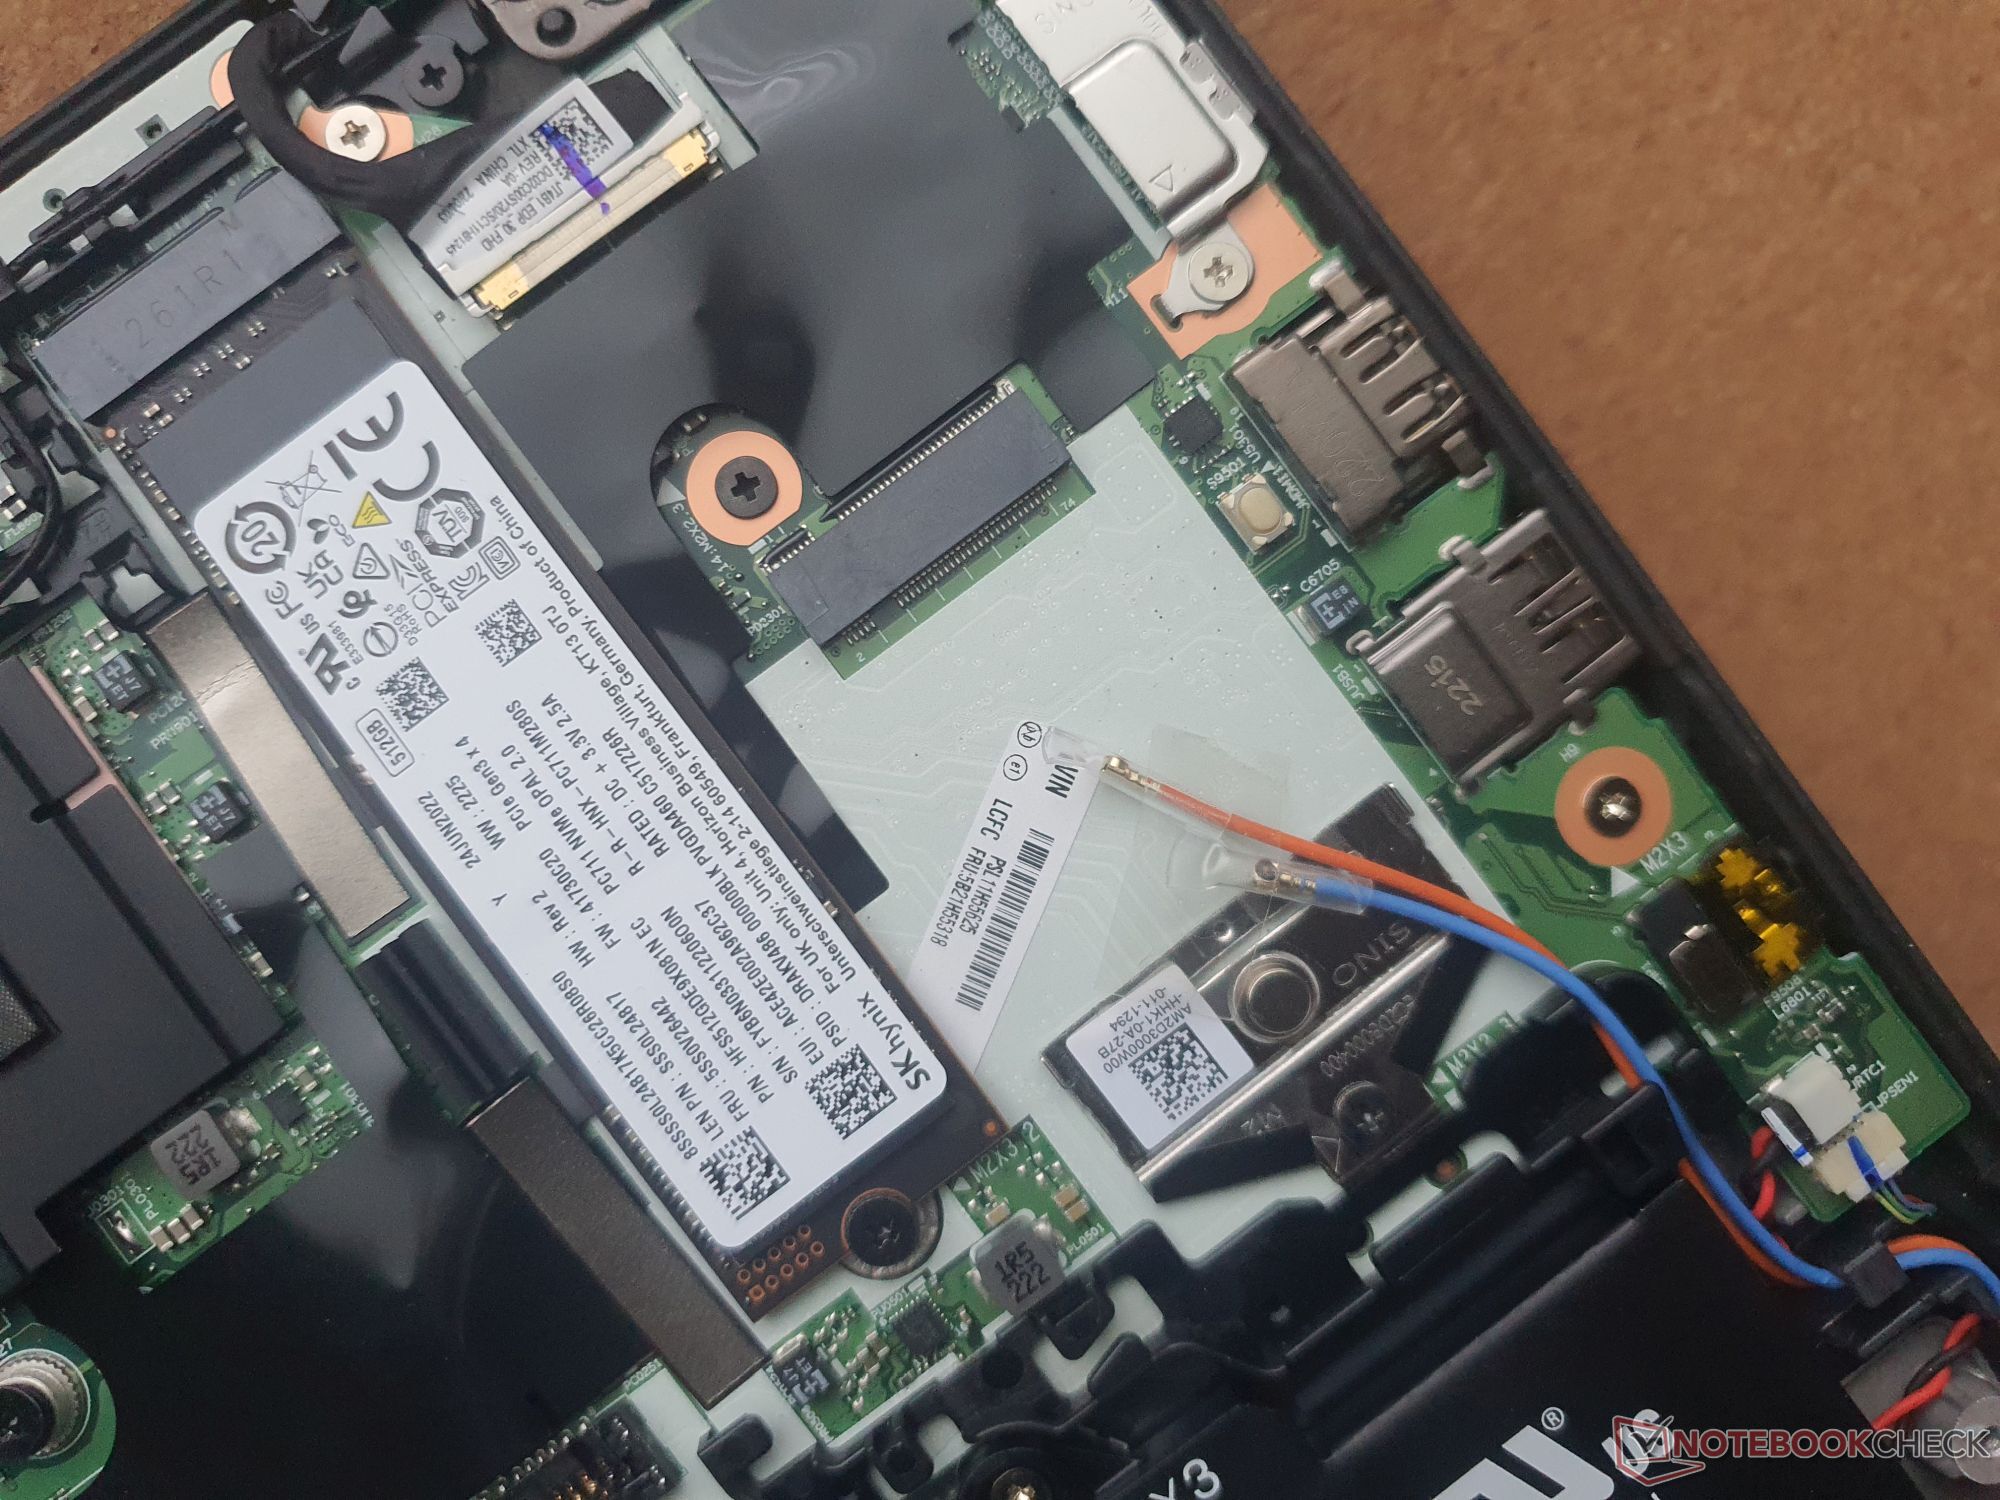
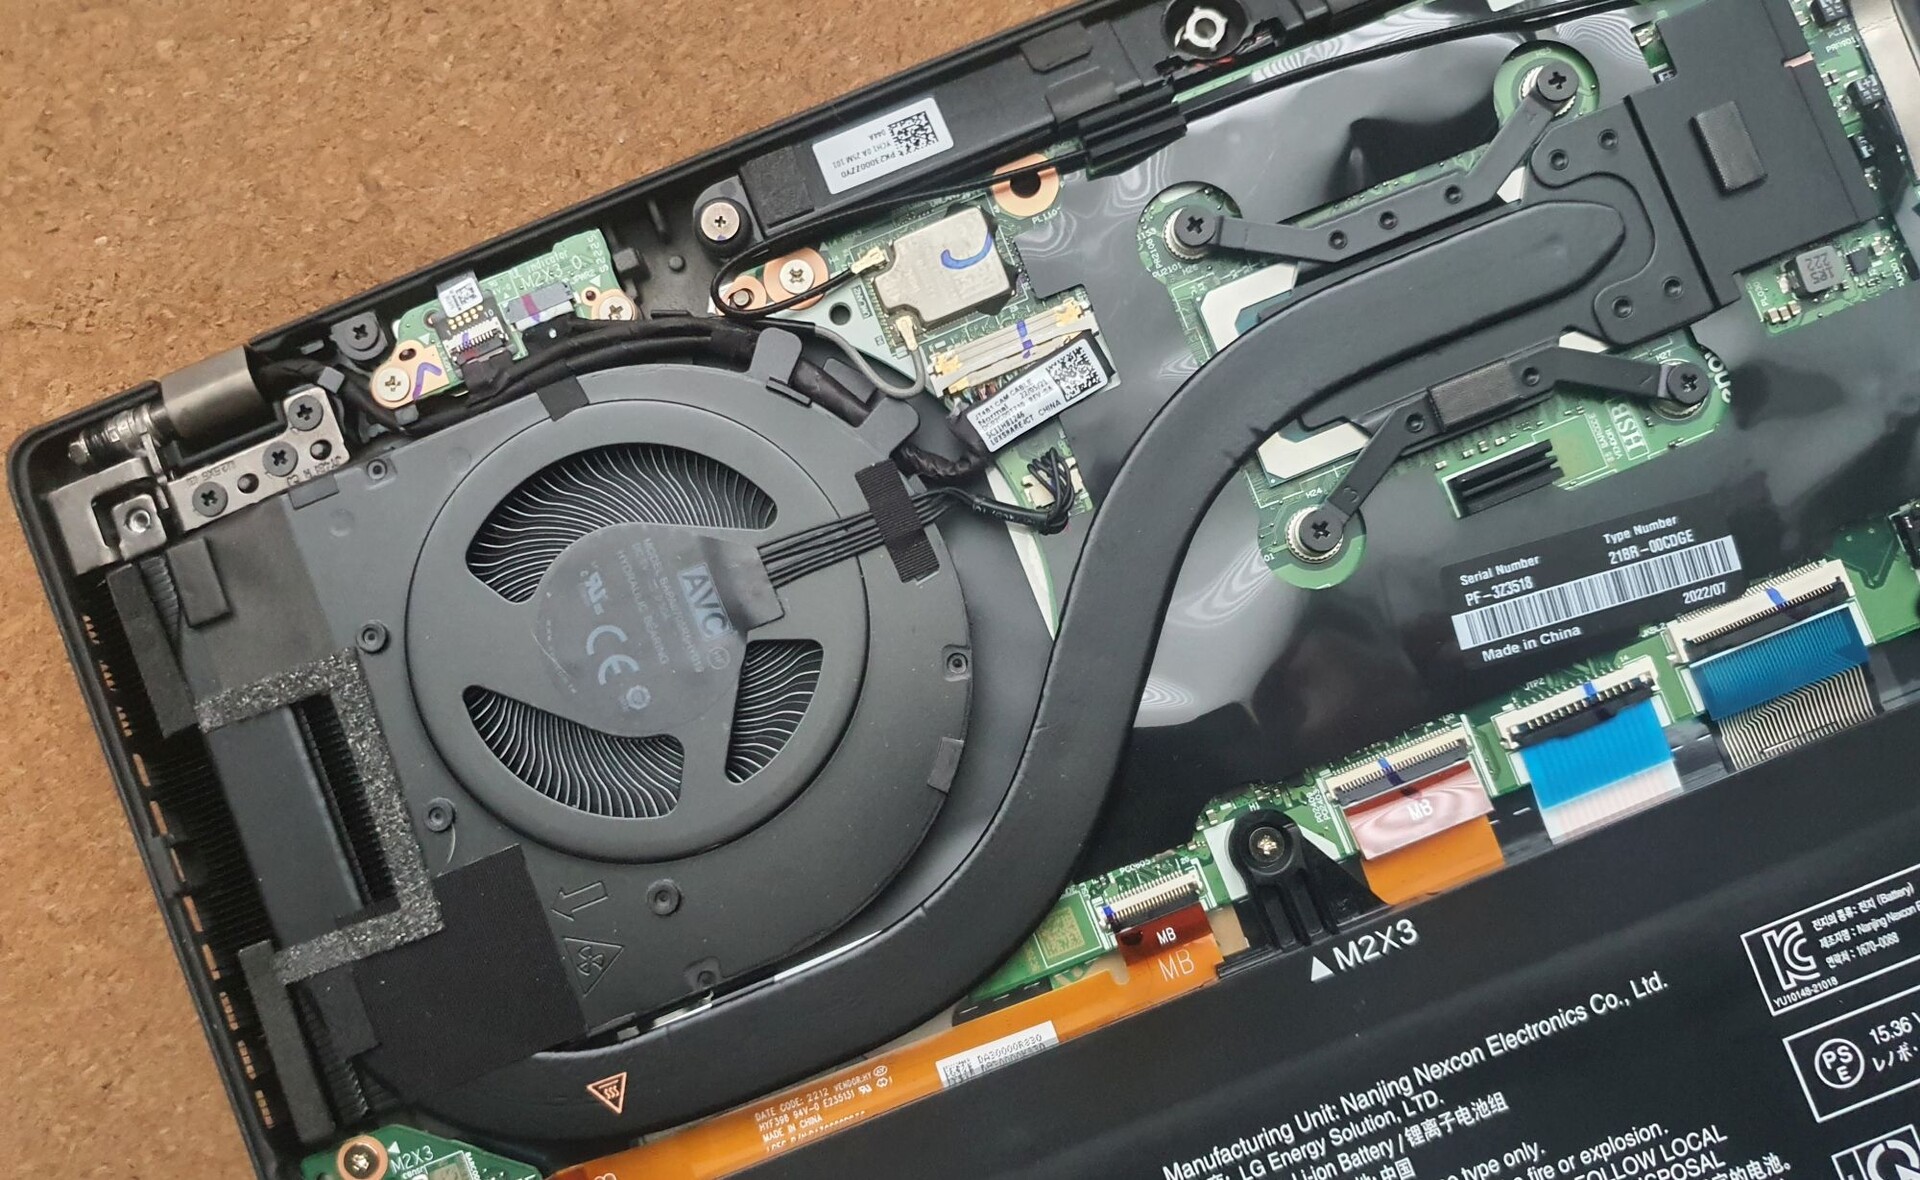
维护
在打开ThinkPad之前,你应该先进入BIOS,停用内部电池。要拆下底盖,你只需解开五颗十字螺丝,用塑料铲子或塑料卡释放几个夹子。
一旦这样做了,你就可以接触到M.2 2280固态硬盘、一个免费的WWAN插槽、拧上的57Wh电池和冷却系统(你可以清洗)。太糟糕了,Wi-Fi模块和内存被焊接在主板上。
担保
在德国,联想为设备提供了三年的保修,为电池提供了一年的保修。我们的学生机型配有12个月的高级支持,其中包括现场服务。然而,默认情况下,你只能得到快递或随身携带的服务。升级到36个月的高级支持服务需要80欧元(4年270欧元,5年382欧元)。保修的条款和条件可能因国家而异。例如,美国的客户将只得到一年的标准保修。升级到三年的高级现场支持的费用约为151美元(四年为239美元,五年为367美元)。
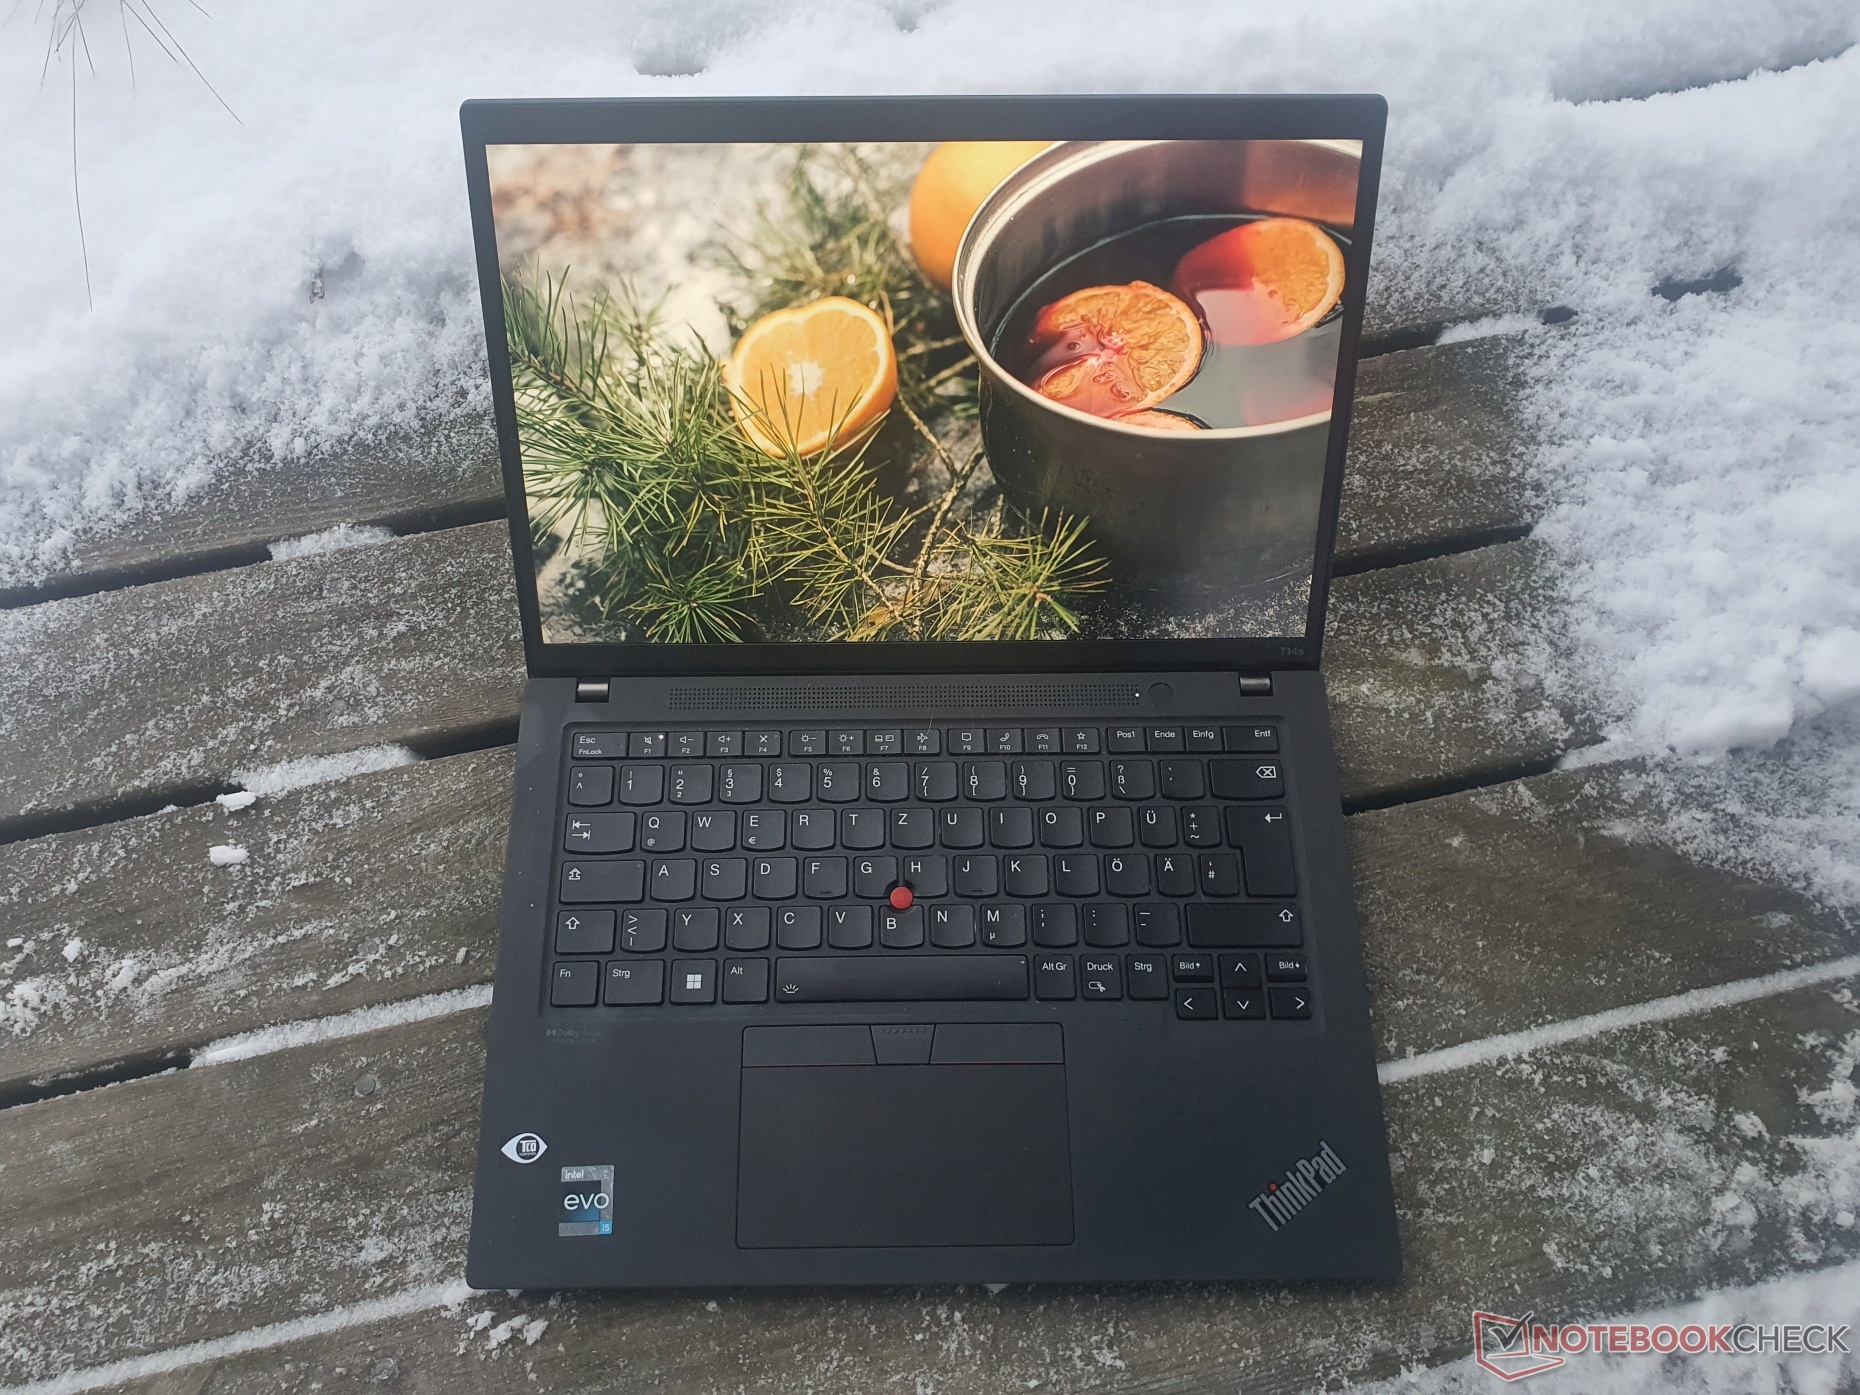
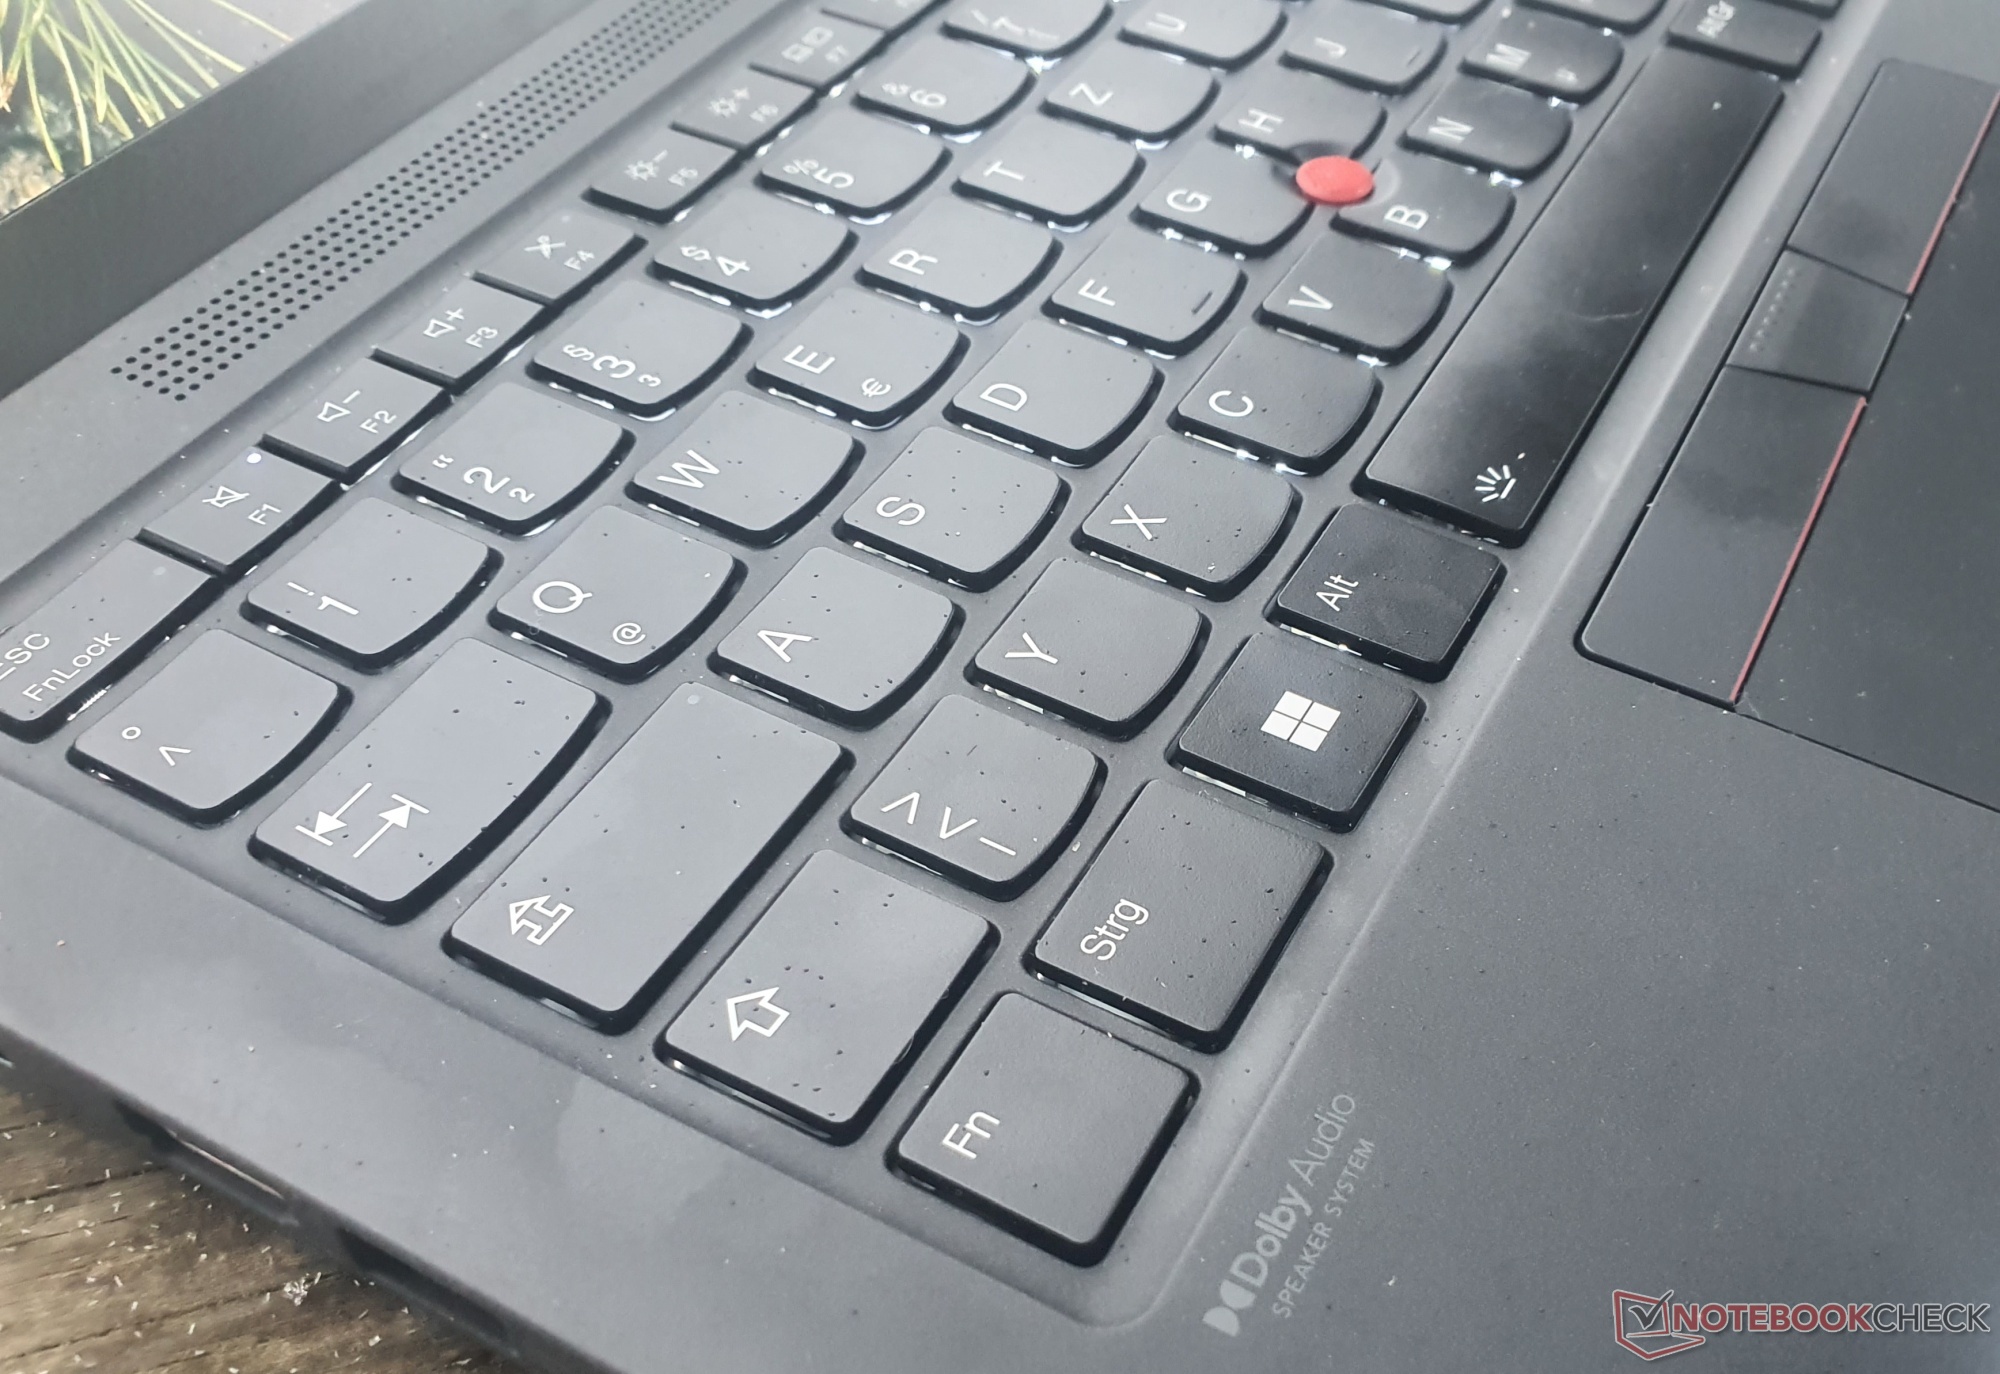
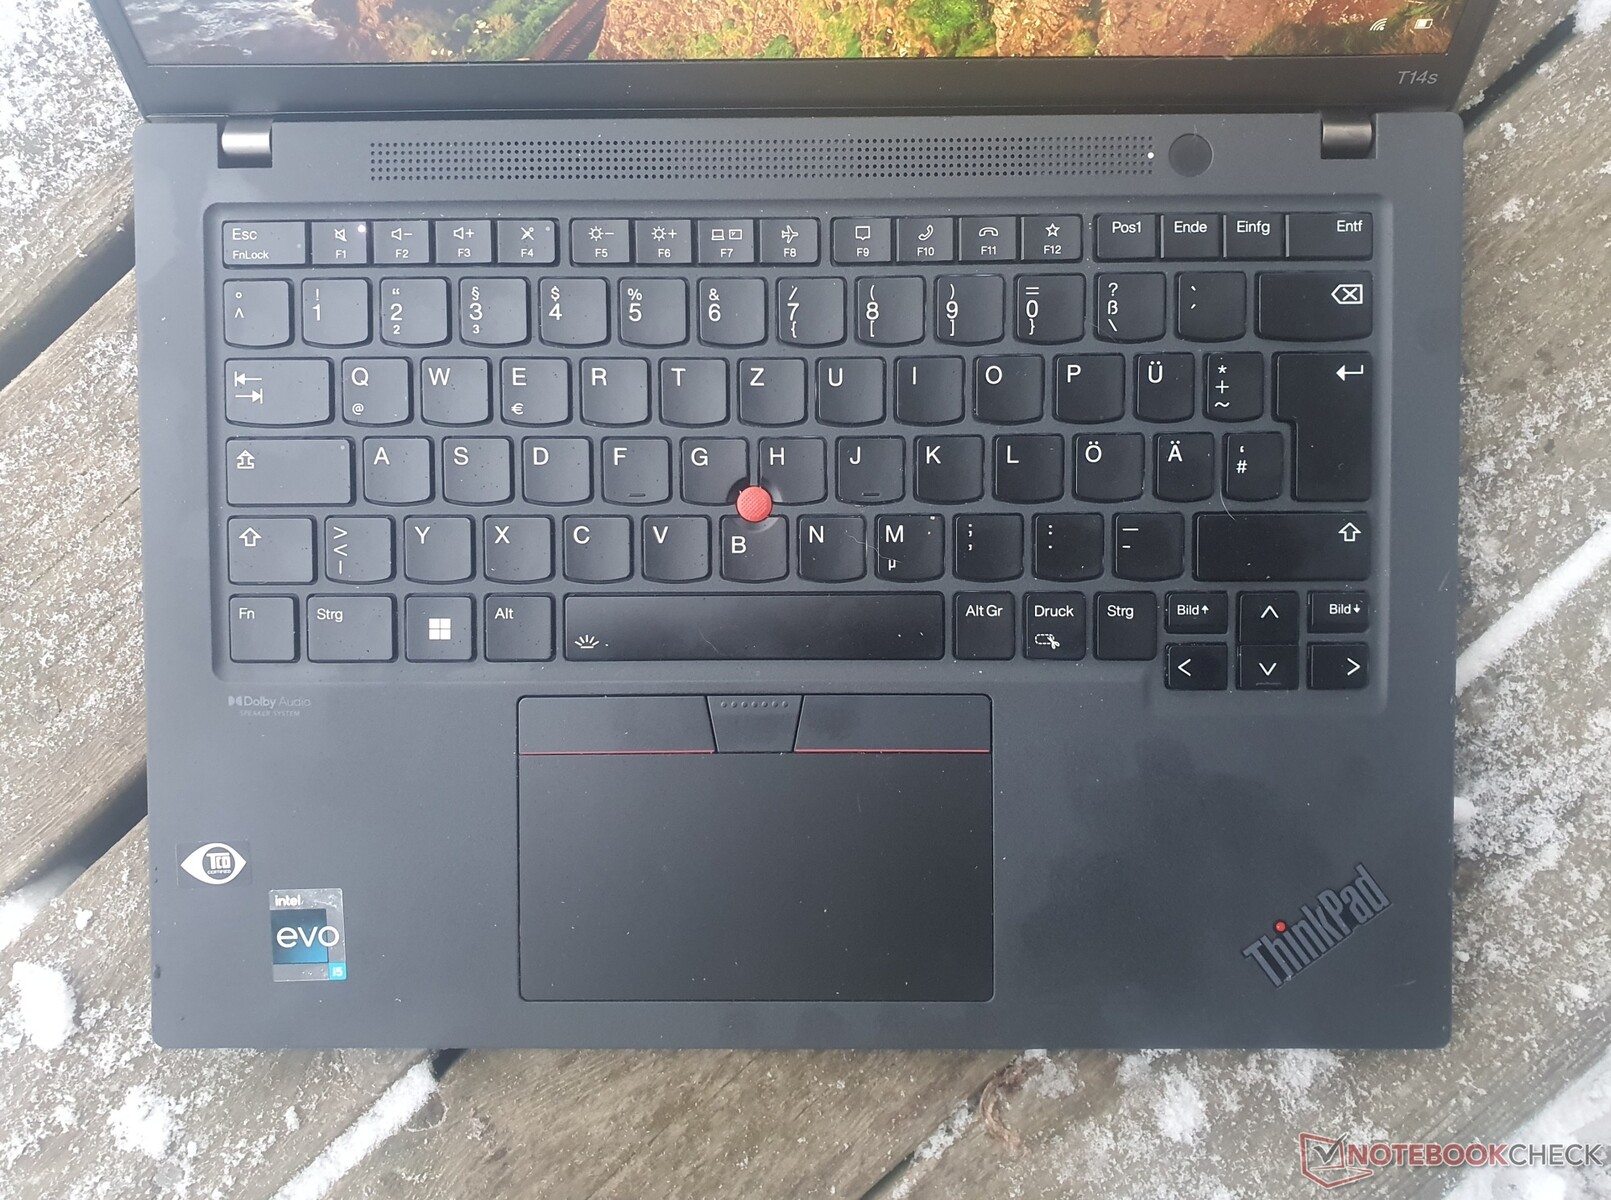
输入设备。良好的全尺寸ThinkPad键盘
键盘
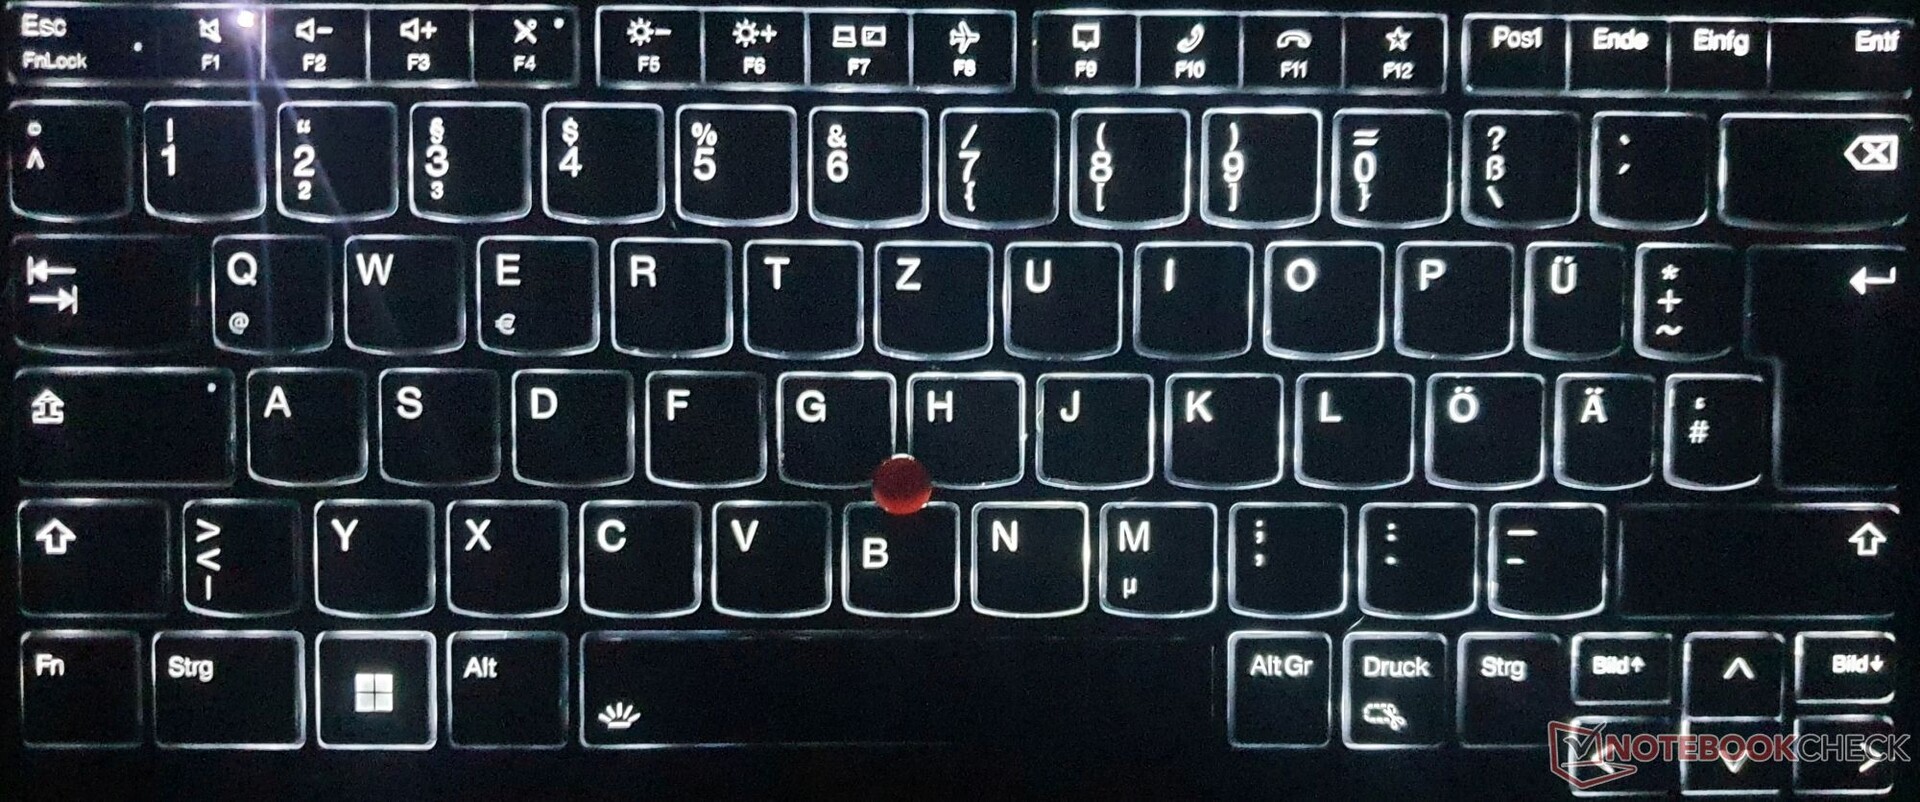
这个六排的防溢出键盘有16 x 16毫米(0.63 x 0.63")的按键。除了 umlaut 键(仅在德语 QWERTZ 布局中),其他都是全尺寸的。方向键略小,所有重要的按钮都有,不需要两用键。
自去年以来,ThinkPad T14s的键程已被缩短至 缩短到了1.5毫米(0.06英寸)。.由于其非常明显的启动点和触觉阻力,该键盘使用户能够比其他大多数键盘更快、更准确地打字。键盘甲板也感觉很结实,当你故意在上面施加压力时也不会弯曲。
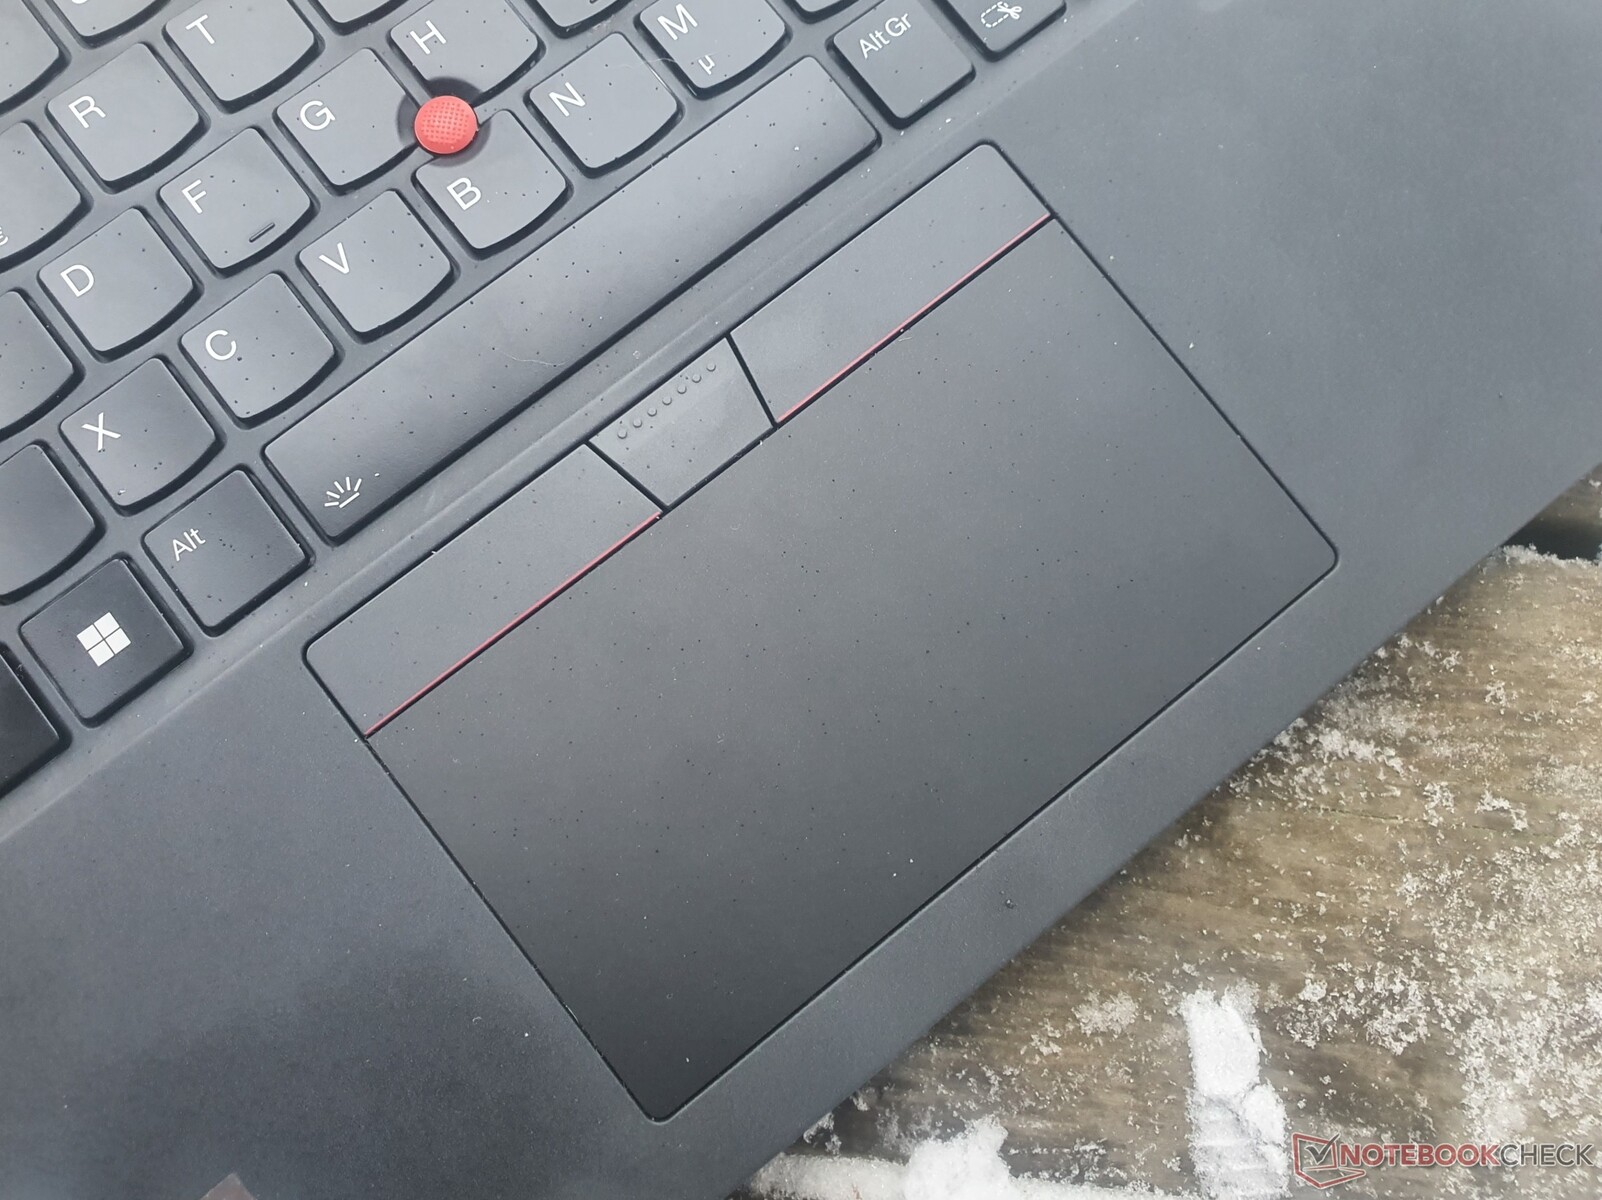
触摸板和TrackPoint
ThinkPad T14s G3的触摸板尺寸为11.5 x 6.1厘米(4.5 x 2.4英寸),与上一代机型一样。它具有改进的Mylar表面,感觉像玻璃,但使用起来更顺畅。触控板在识别捏合变焦和拖放手势方面没有问题。集成的点击按钮具有适度的移动距离,并提供明显的反馈。然而,触摸板的左下方和右下方感觉有点松散。
TrackPoint可以让你快速准确地在屏幕上移动鼠标指针,同时将你的手放在键盘上。TrackPoint的三个按钮是完全平坦的,有很短的行程,可以进行精确的操作。
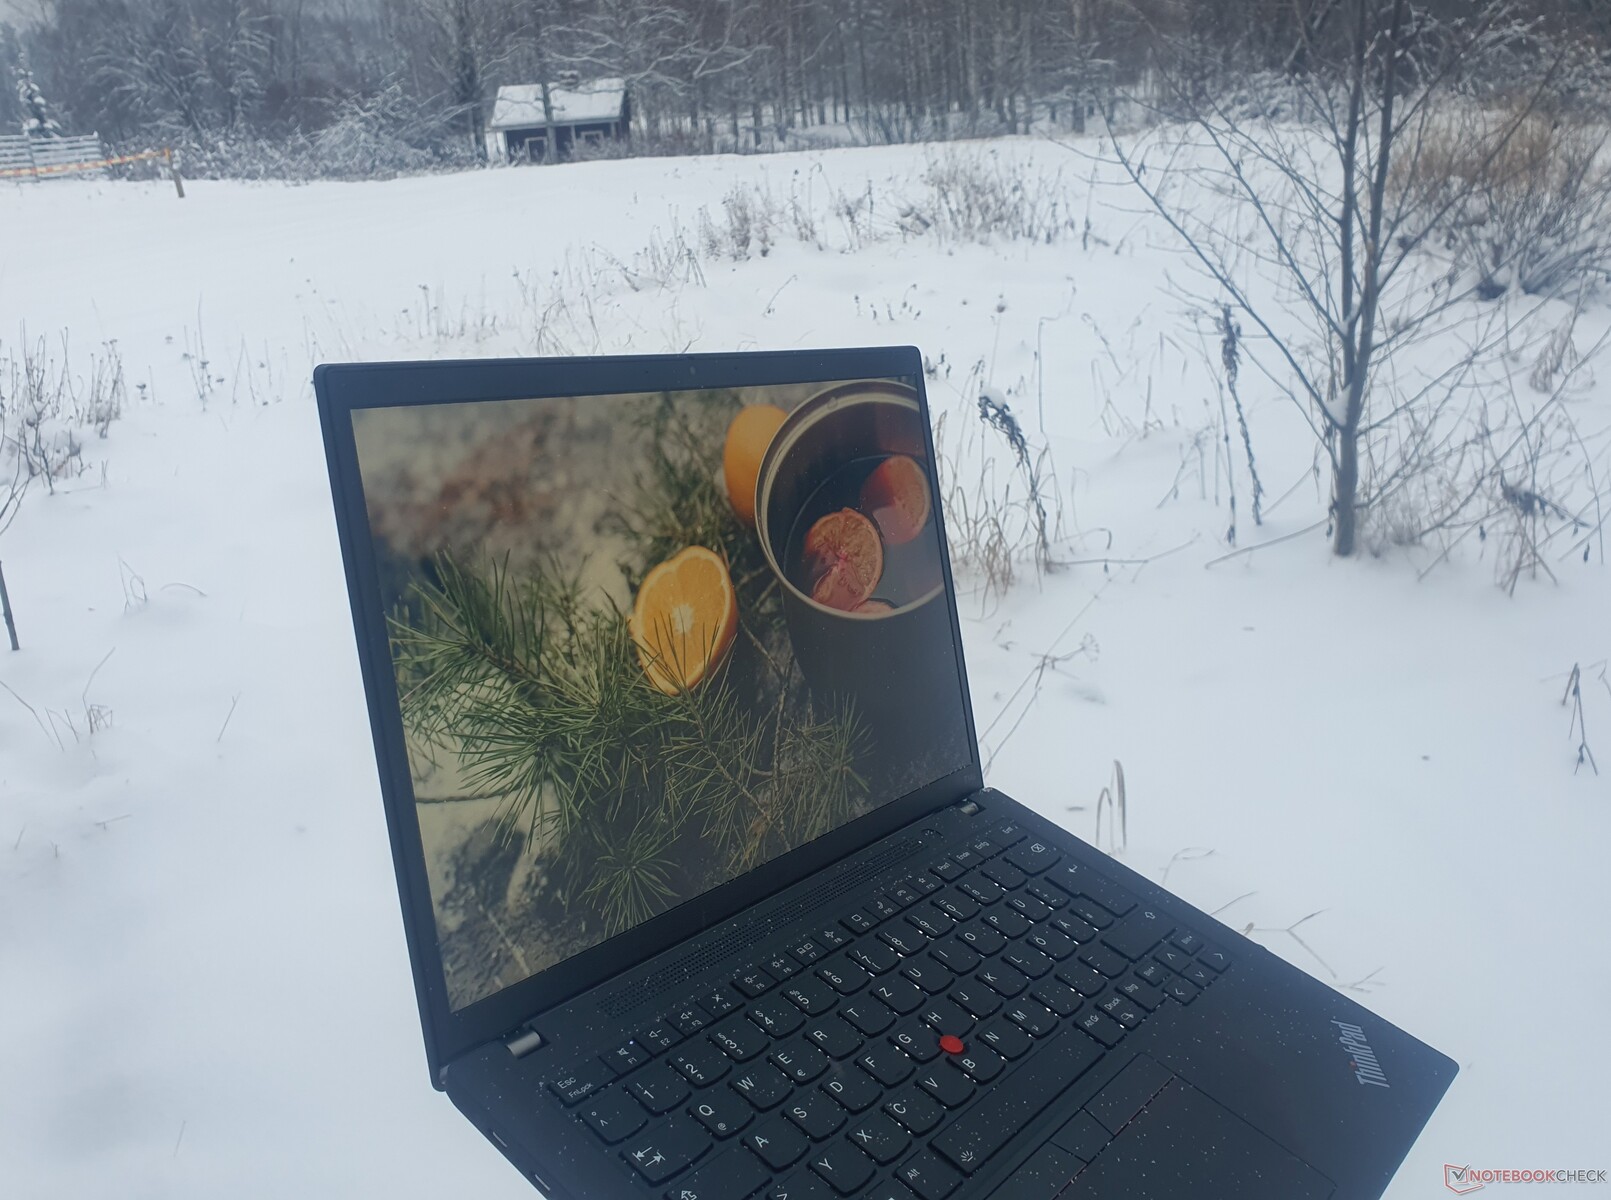
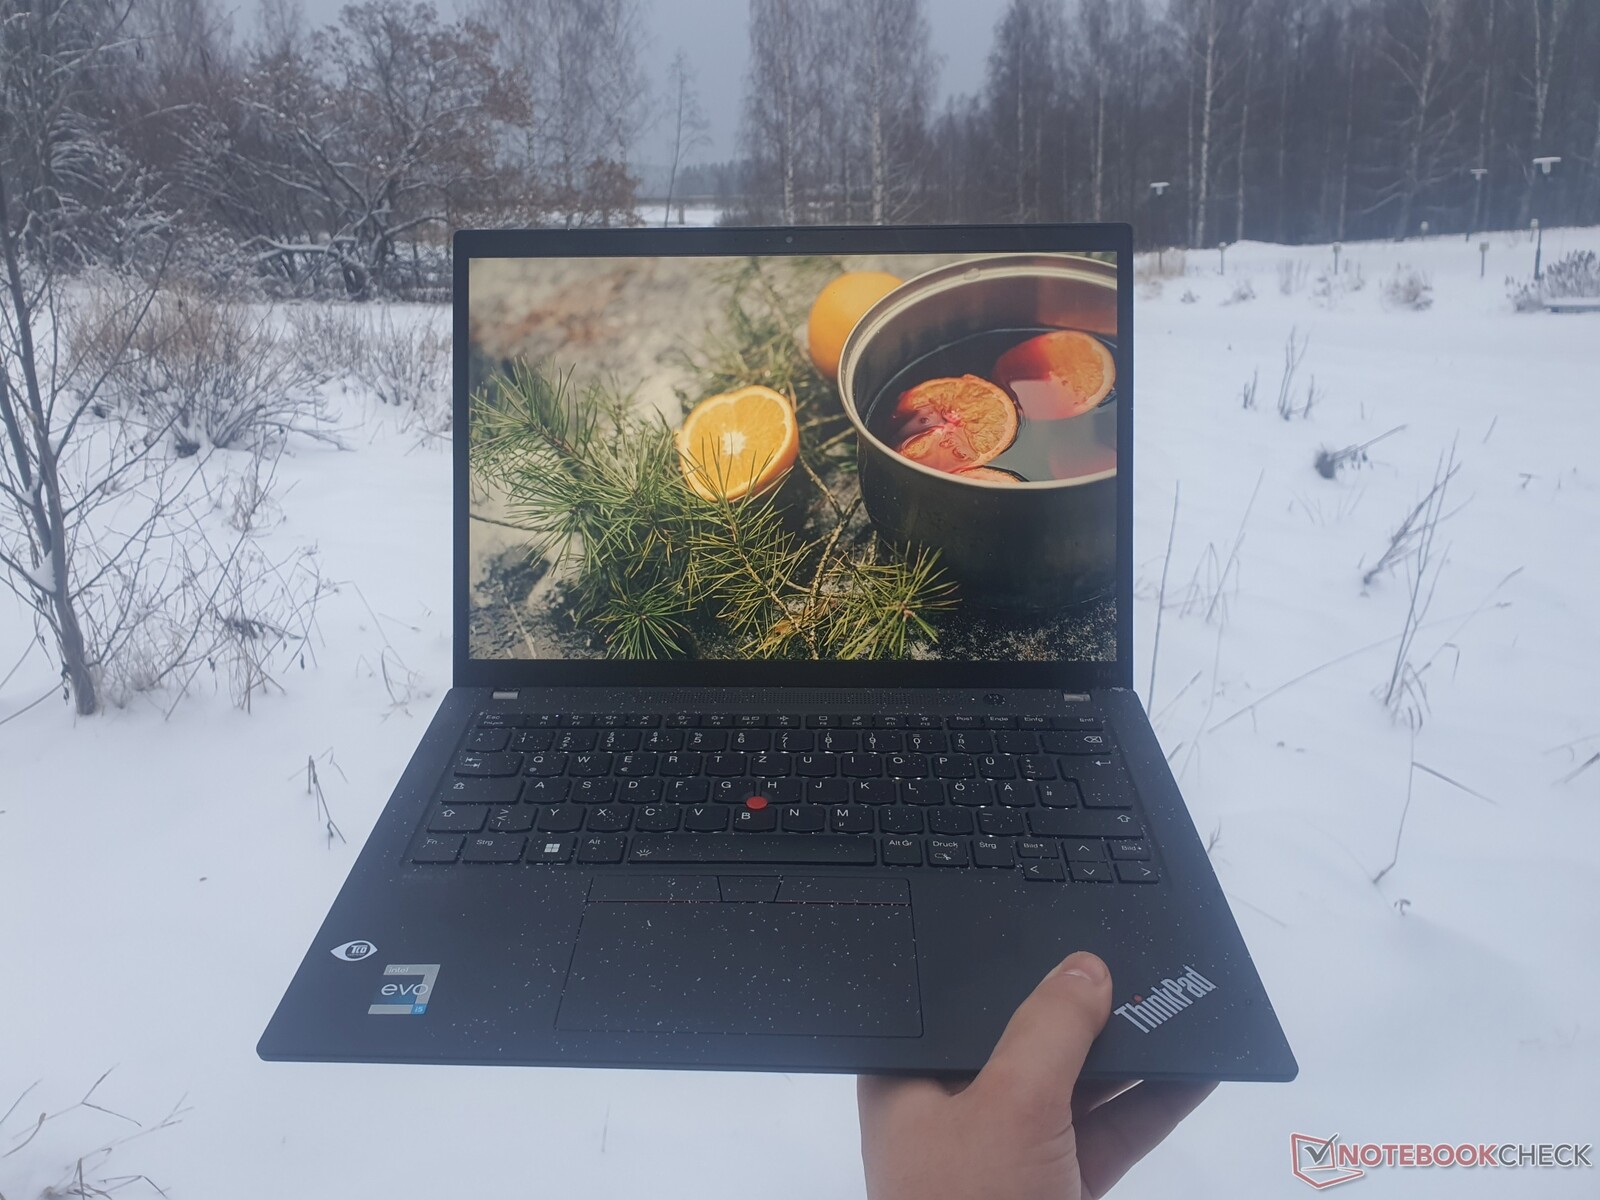
低功耗显示屏不够亮
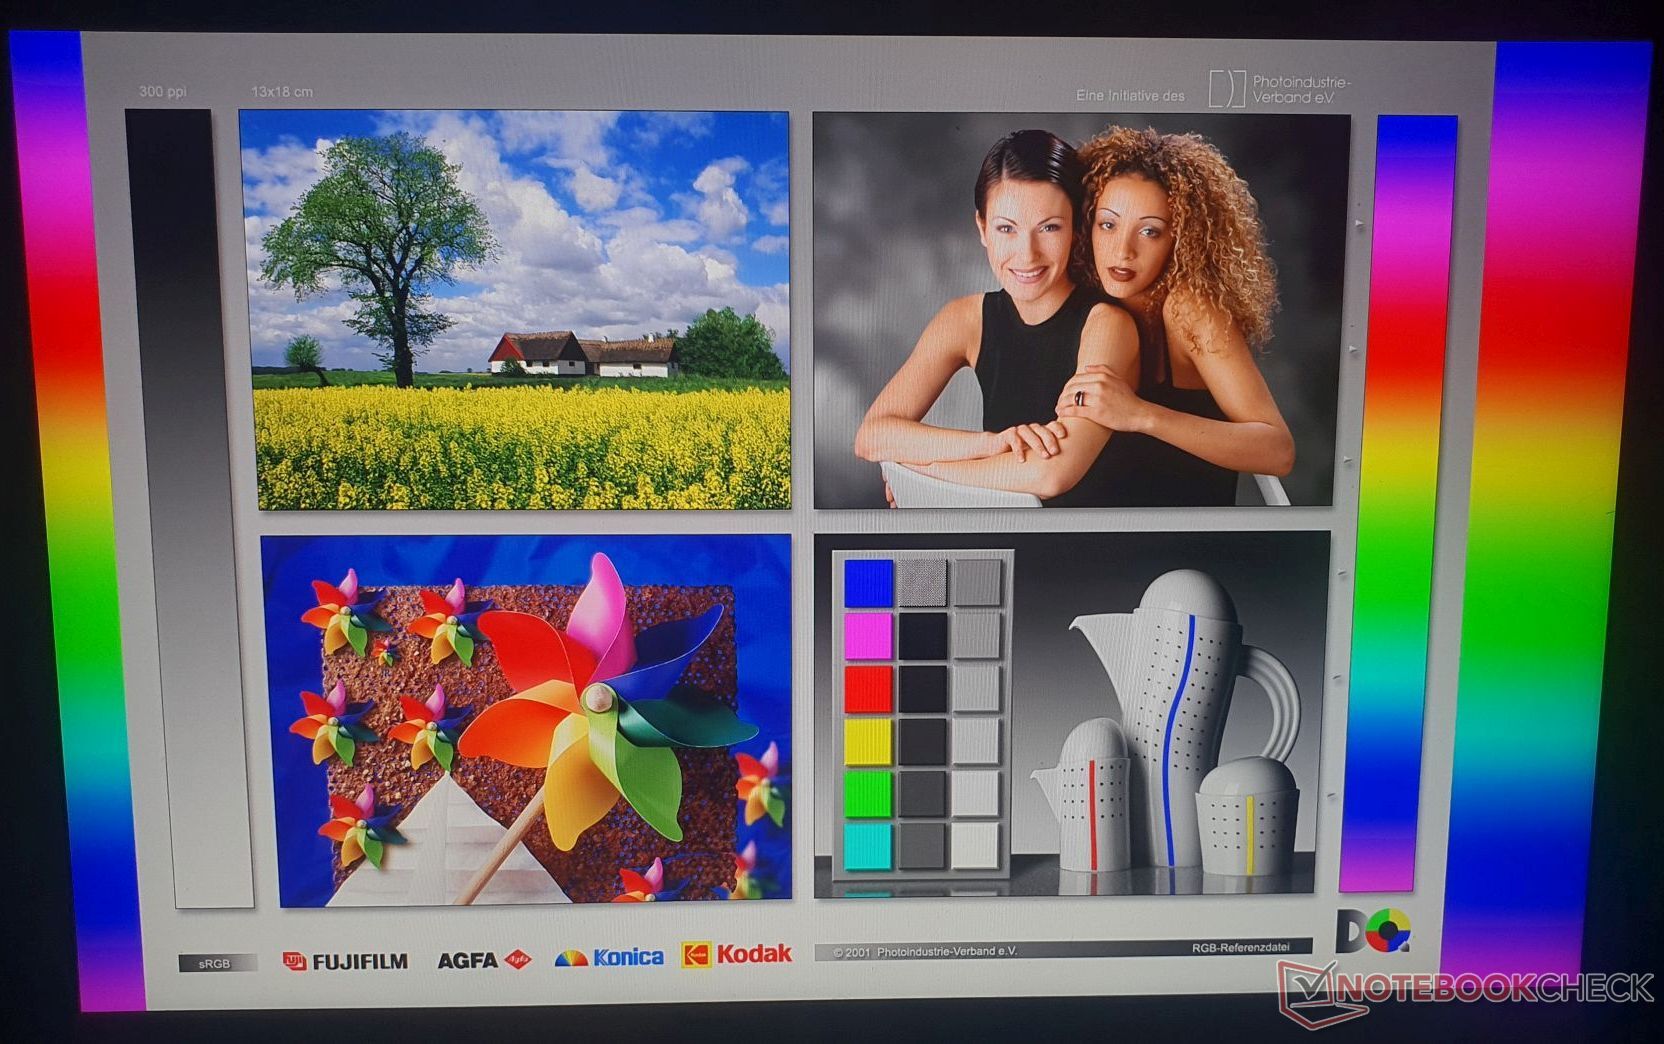
我们评测单位的低功耗显示屏的分辨率为1,920 x 1,200(WUXGA/FHD+),为其14英寸的尺寸提供足够的清晰度。16:10的长宽比终于进入了T系列;相比之下,X13在去年就已经有了它 。
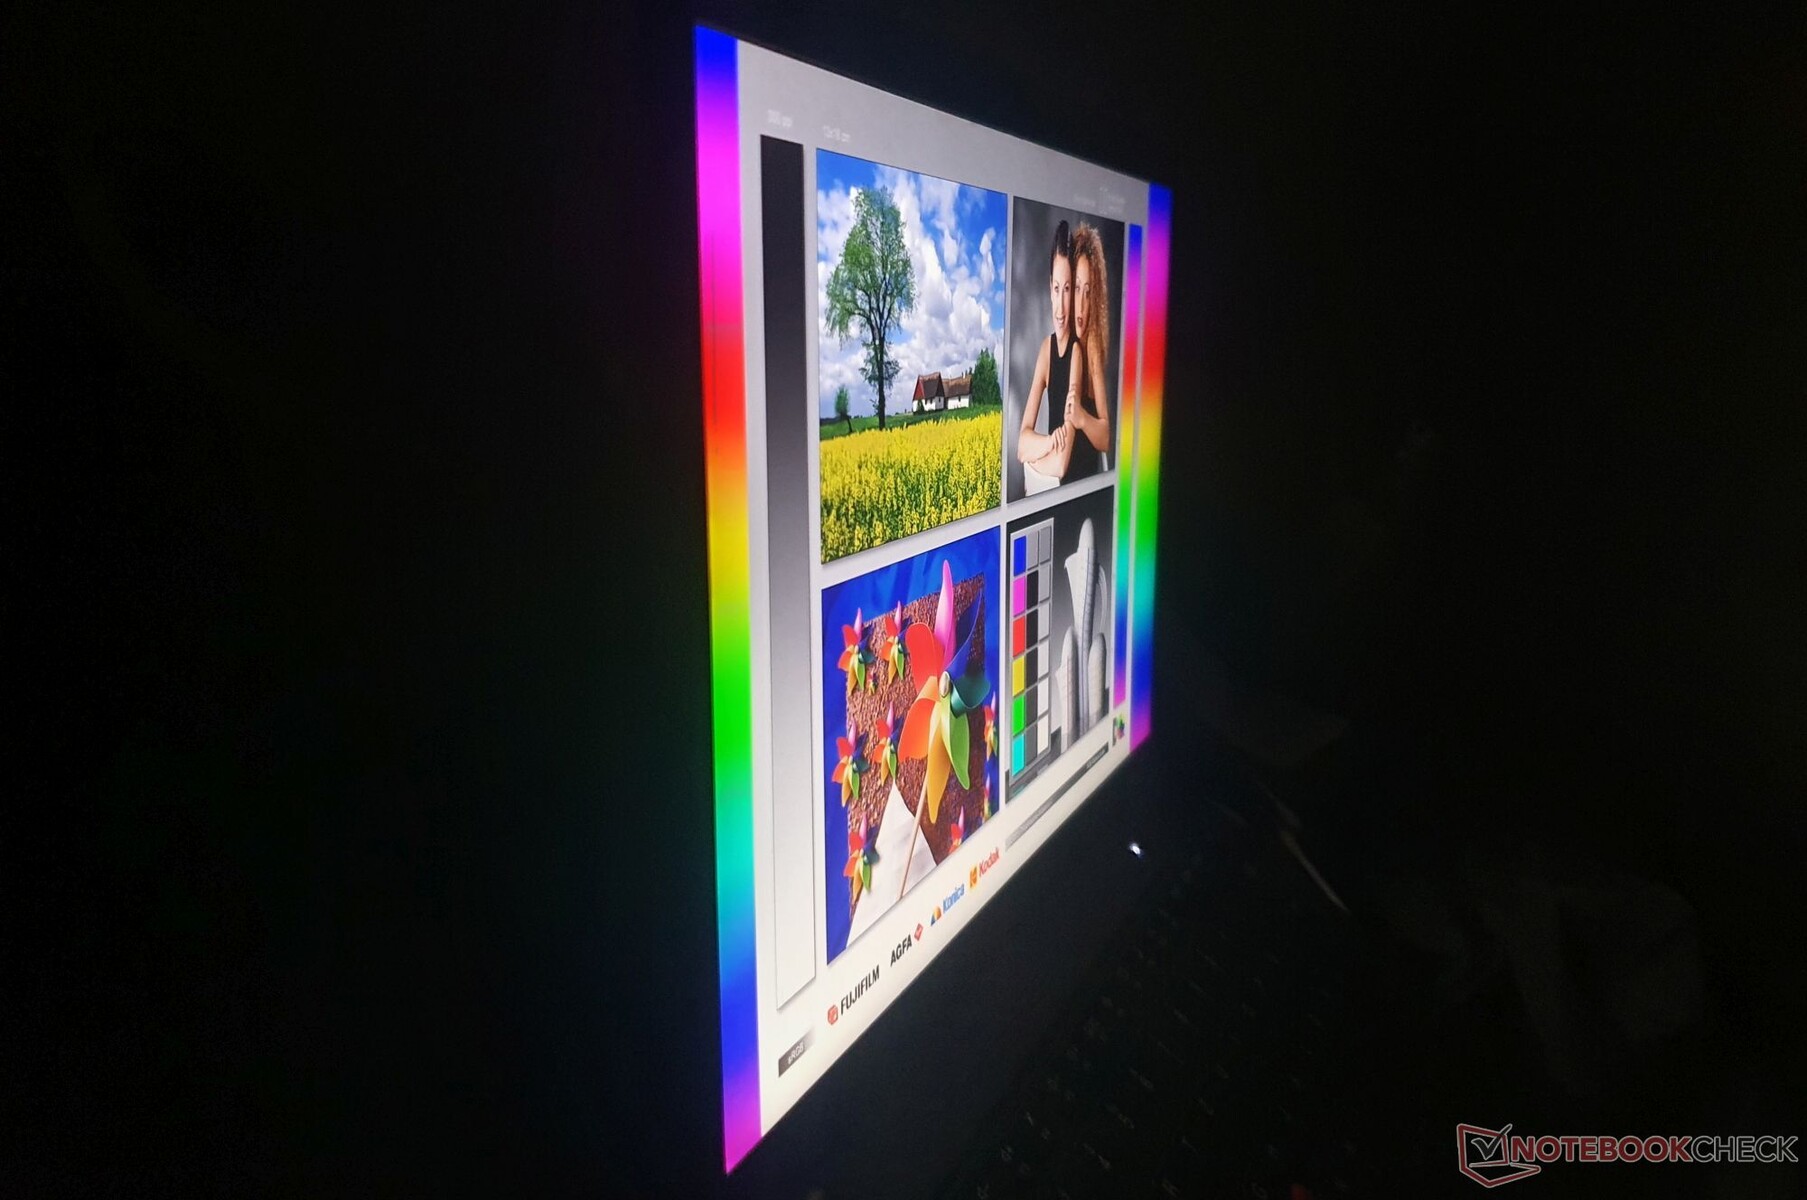
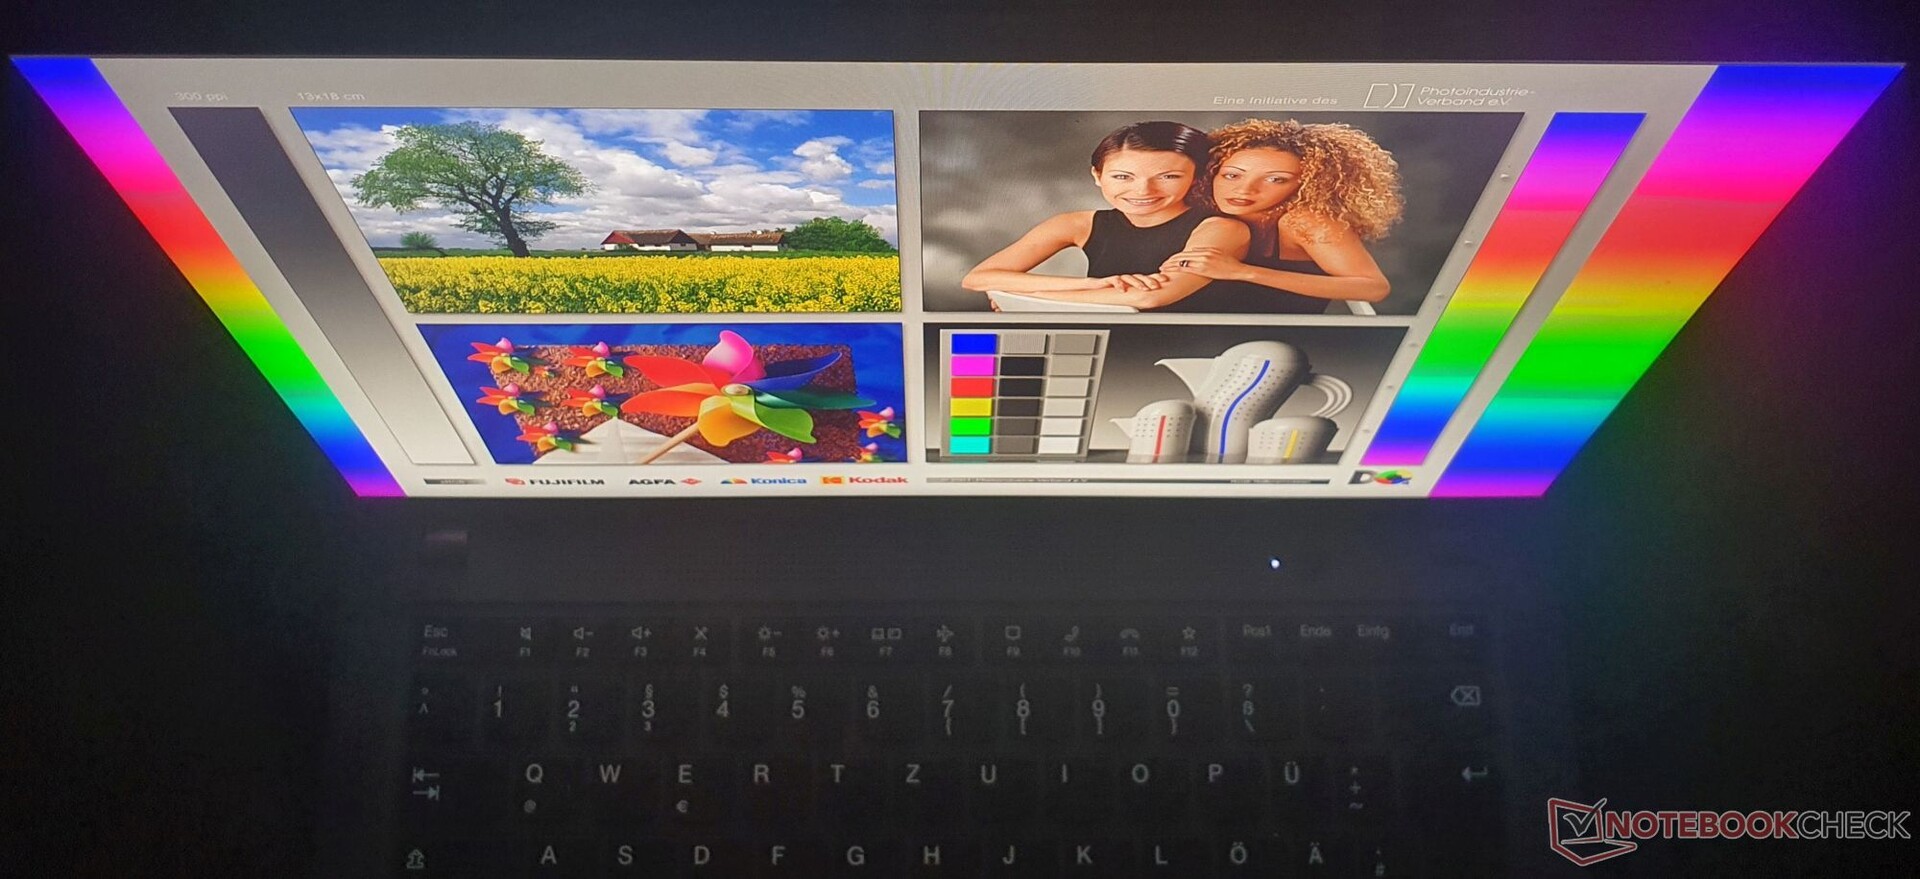
在我们的测试中,哑光显示屏只能达到300 cd/m²的亮度,而不是联想声称的400 cd/m²。当你在户外使用笔记本电脑时,这可能构成一个问题。我们在审查X1 Yoga G7 时已经测试了相同的面板,发现它也未能达到360 cd/m²的规格。作为比较,ThinkPad T14 G3 上的低功耗显示屏在435 cd/m²时得到了明显的亮度。这再一次说明了联想使用不同的零件供应商所造成的显示屏抽奖。
联想为T14s提供了六种显示屏选择。然而,2.2K显示屏没有进入欧洲市场。
- FHD+, 300 cd/m², 45% NTSC
- FHD+, 400 cd/m², 800:1, 低功耗, 100% sRGB
- FHD+, 300 cd/m², 触摸屏, 45% NTSC制式
- FHD+,500 cd/m²,隐私保护+触摸屏,100% sRGB。
- 2.2K,300 cd/m²,低蓝光,100% sRGB
- 2.8K, 400 cd/m², OLED, 防眩光, 100% DCI-P3, HDR 500, Eyesafe
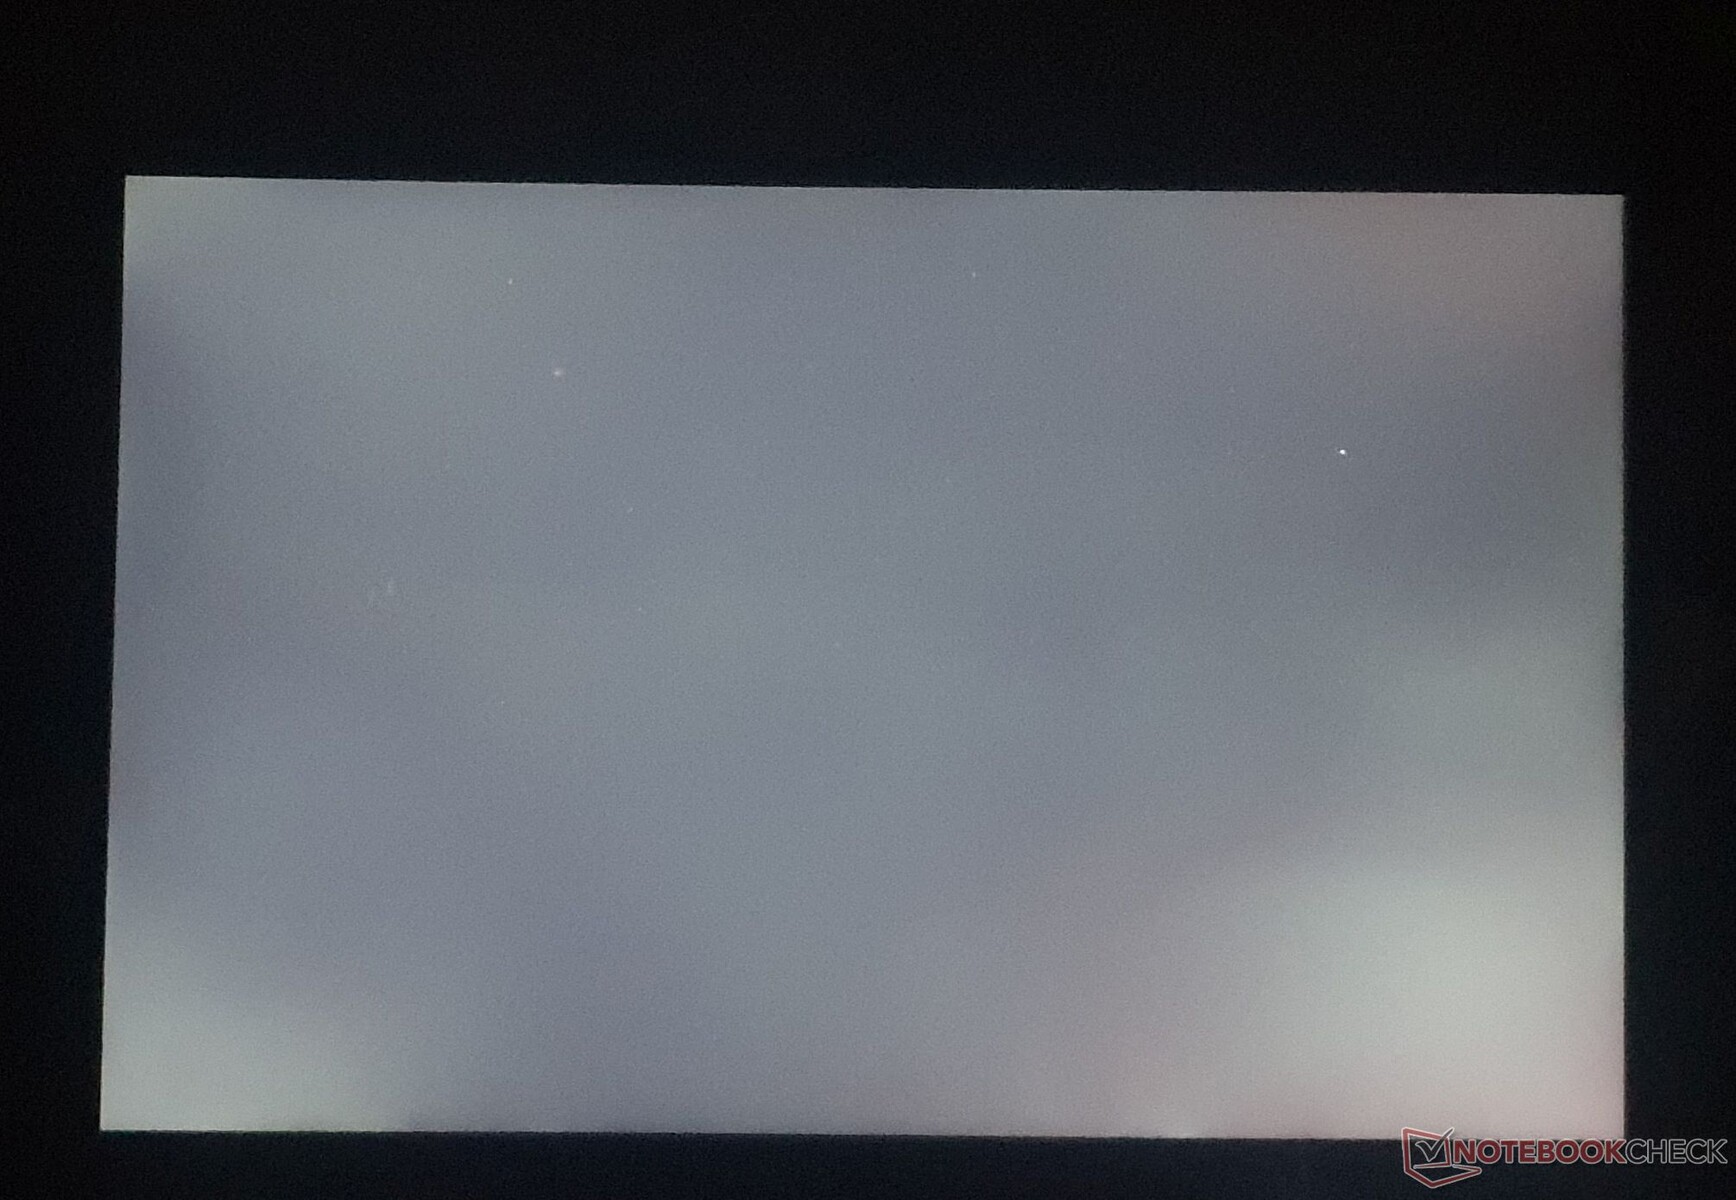
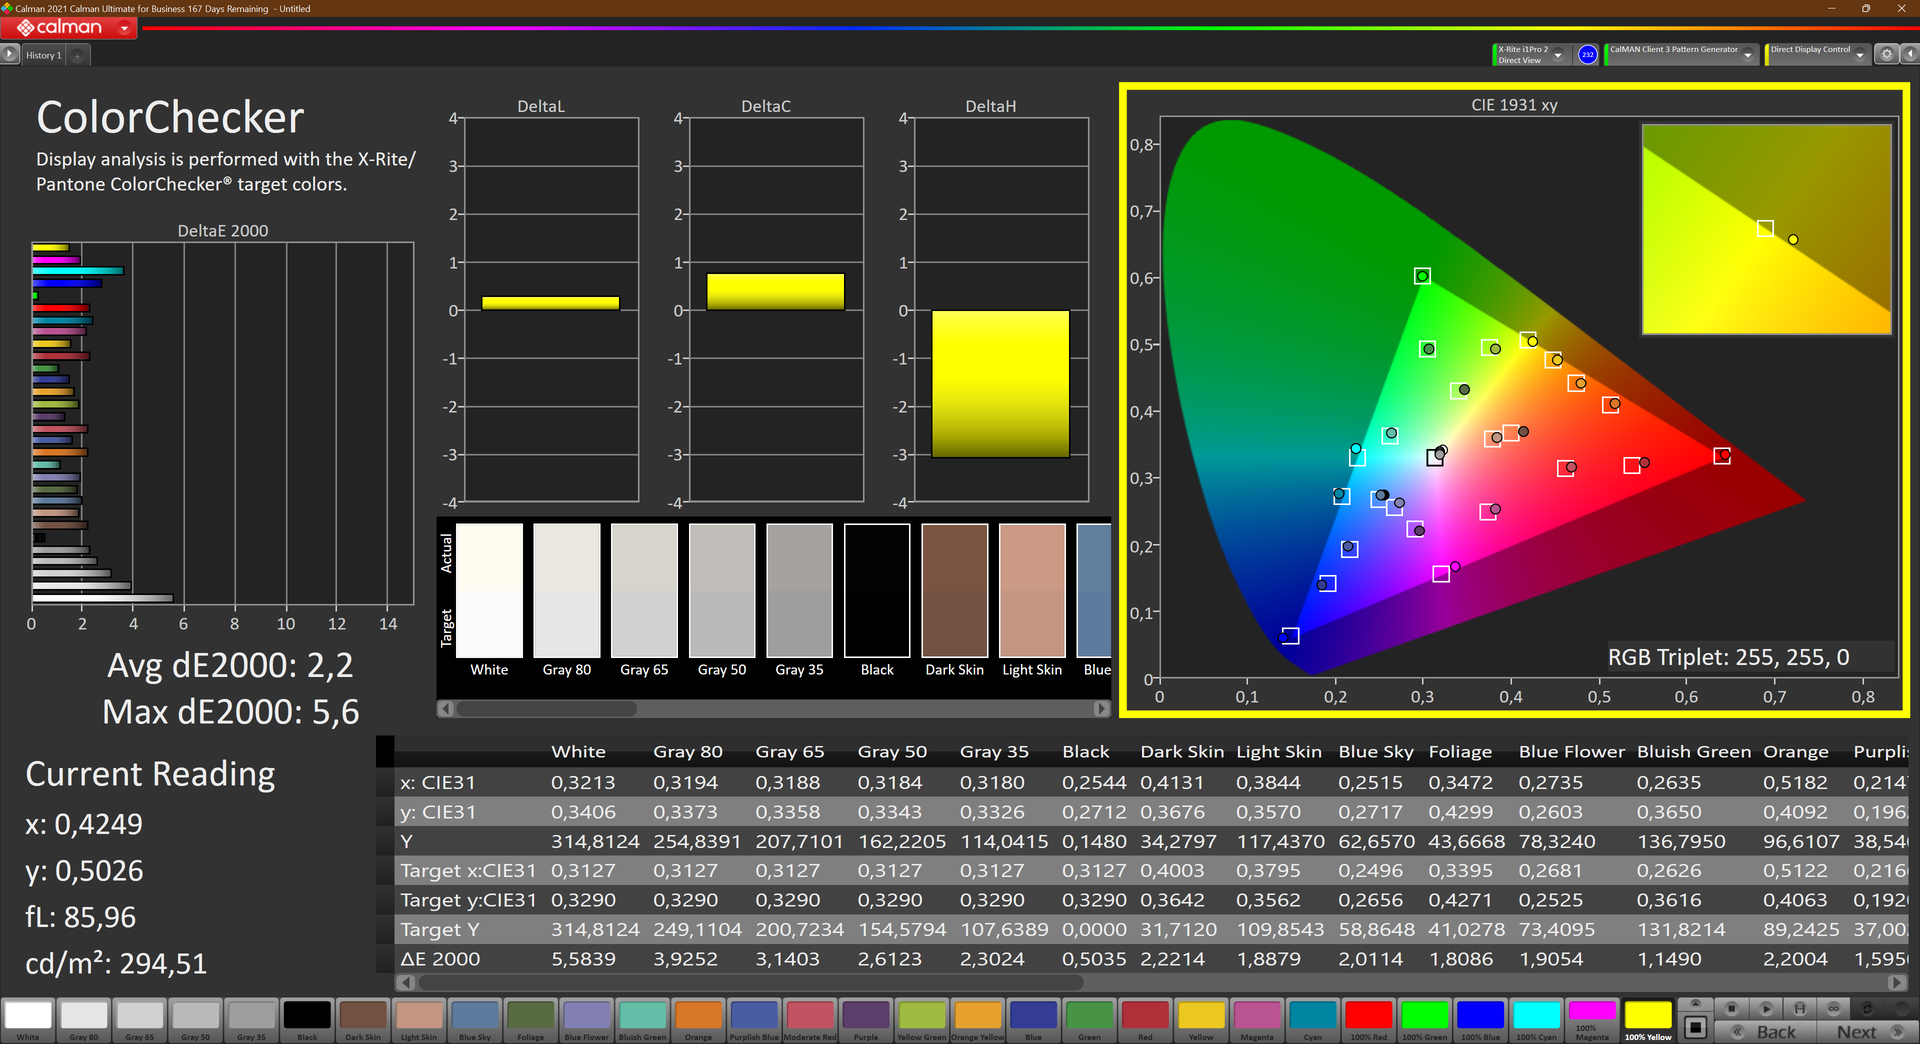
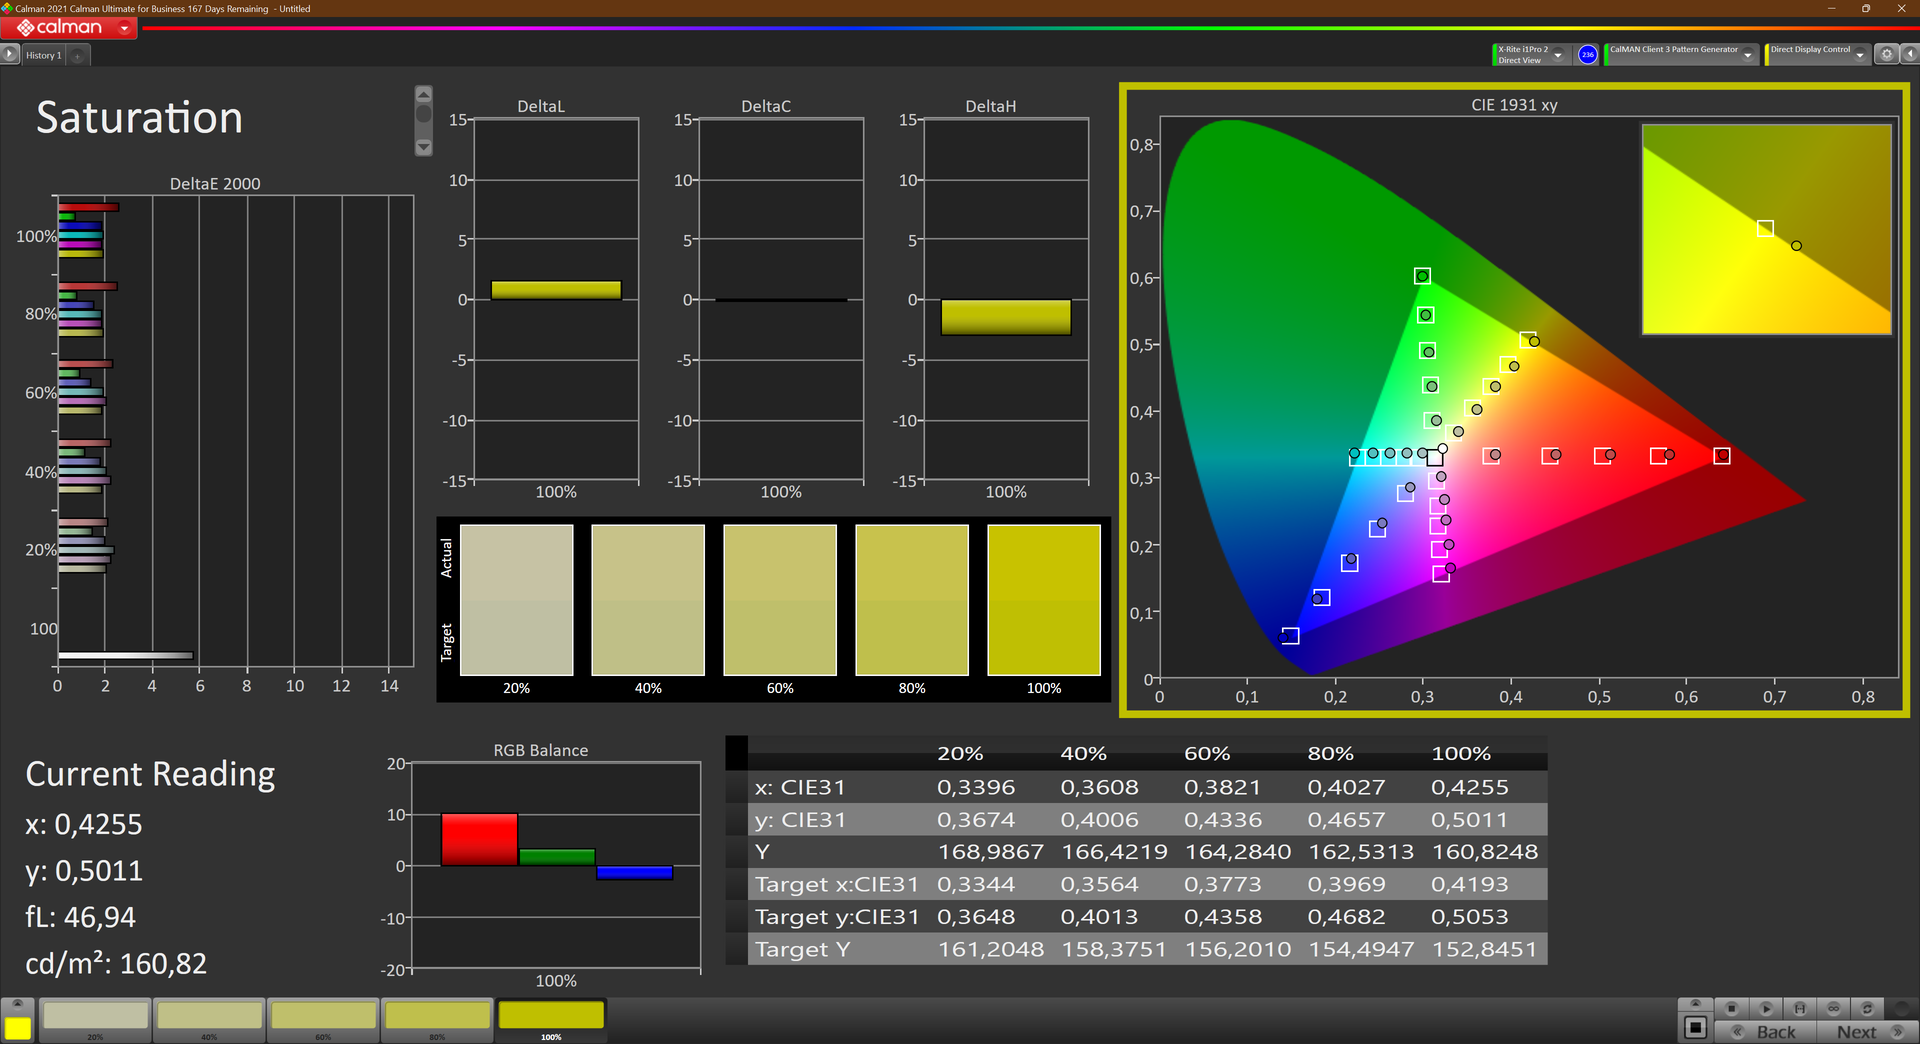
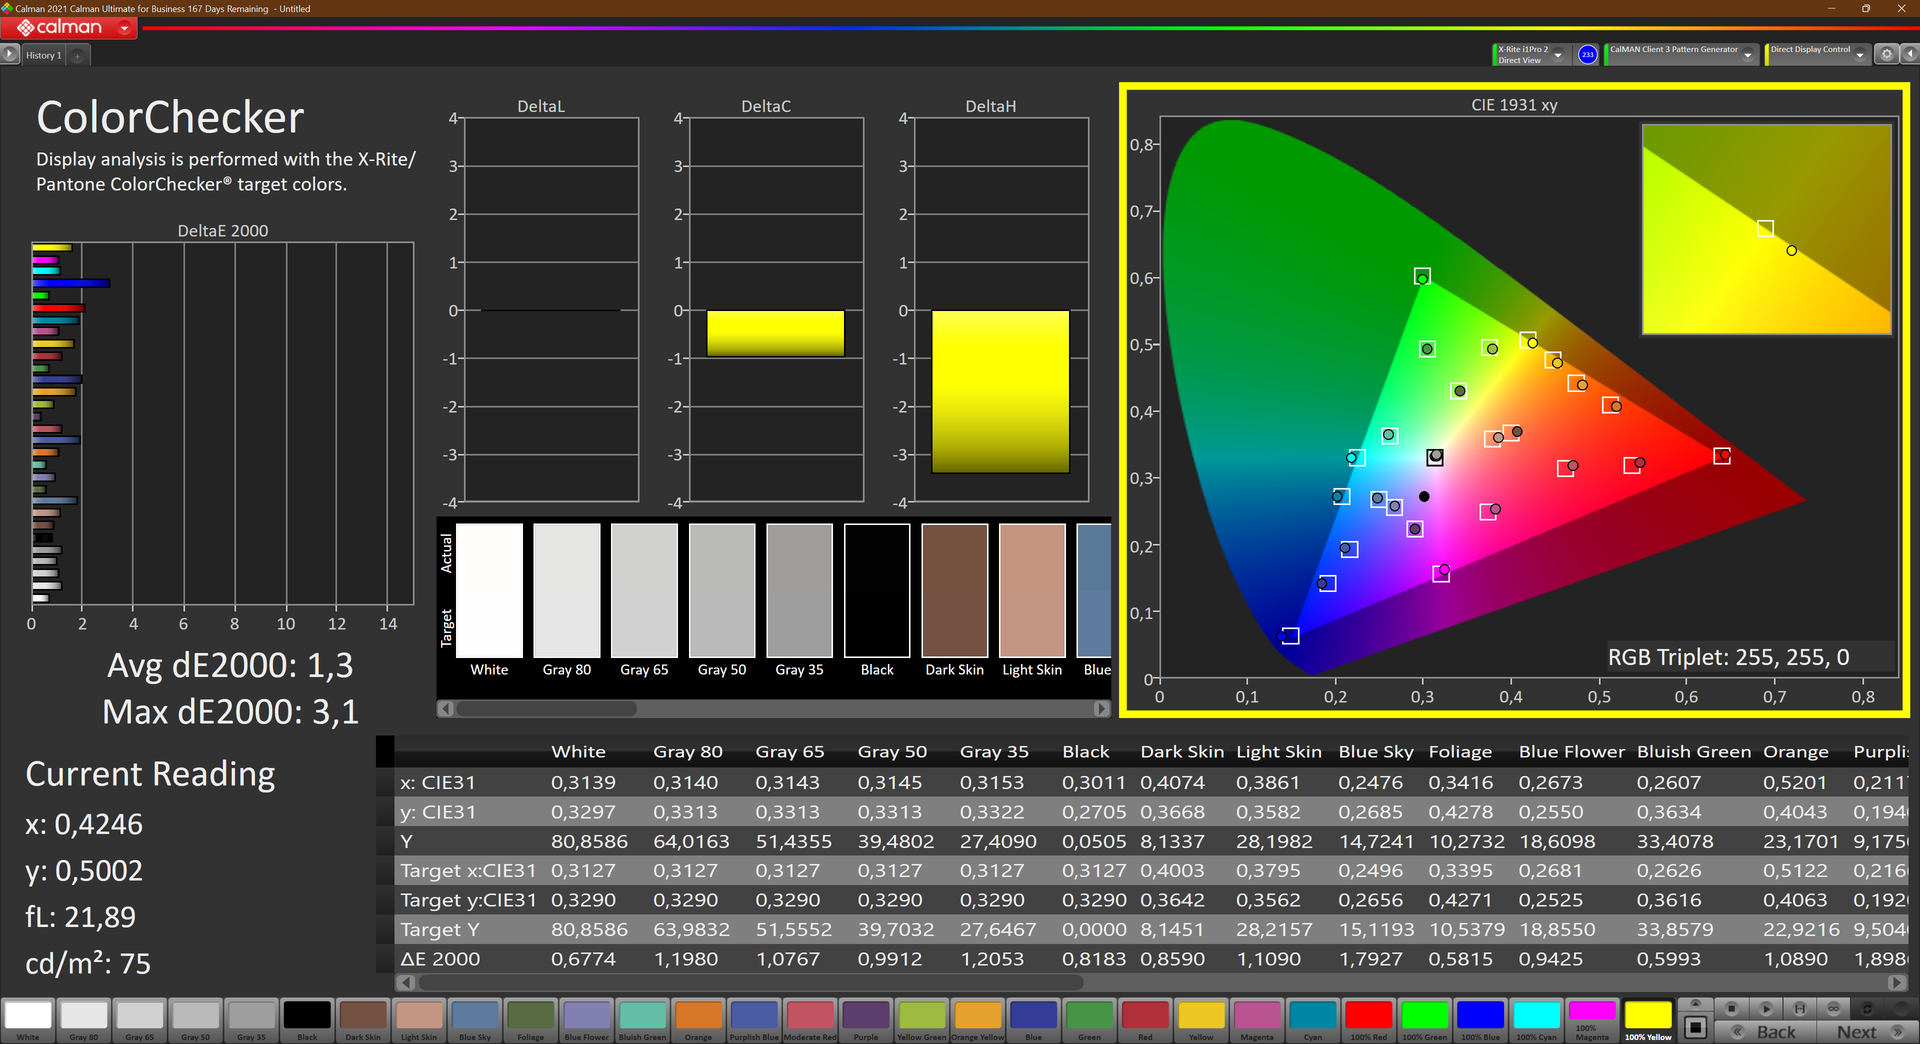
新的OLED显示屏取代了T14s上的4K/UHD选项。1,950:1的对比度和0.16 cd/m²的黑度对于IPS面板来说是非常好的,从而产生了丰富而深沉的黑色。在6,196K,显示器的白点与最佳水平(6,500K)有一点差距。该屏幕的一个缺点是,它表现出严重的混浊,你可以很容易地在黑暗的背景上看出这一点。在我们的评测单元上,我们也发现了一个有缺陷的像素,但没有发现任何PWM闪烁。正如我们在低功耗显示器中经常看到的那样,这个面板有一些严重的重影。
| |||||||||||||||||||||||||
Brightness Distribution: 93 %
Center on Battery: 312 cd/m²
Contrast: 1950:1 (Black: 0.16 cd/m²)
ΔE ColorChecker Calman: 2.2 | ∀{0.5-29.43 Ø4.71}
calibrated: 1.3
ΔE Greyscale Calman: 2.7 | ∀{0.09-98 Ø4.96}
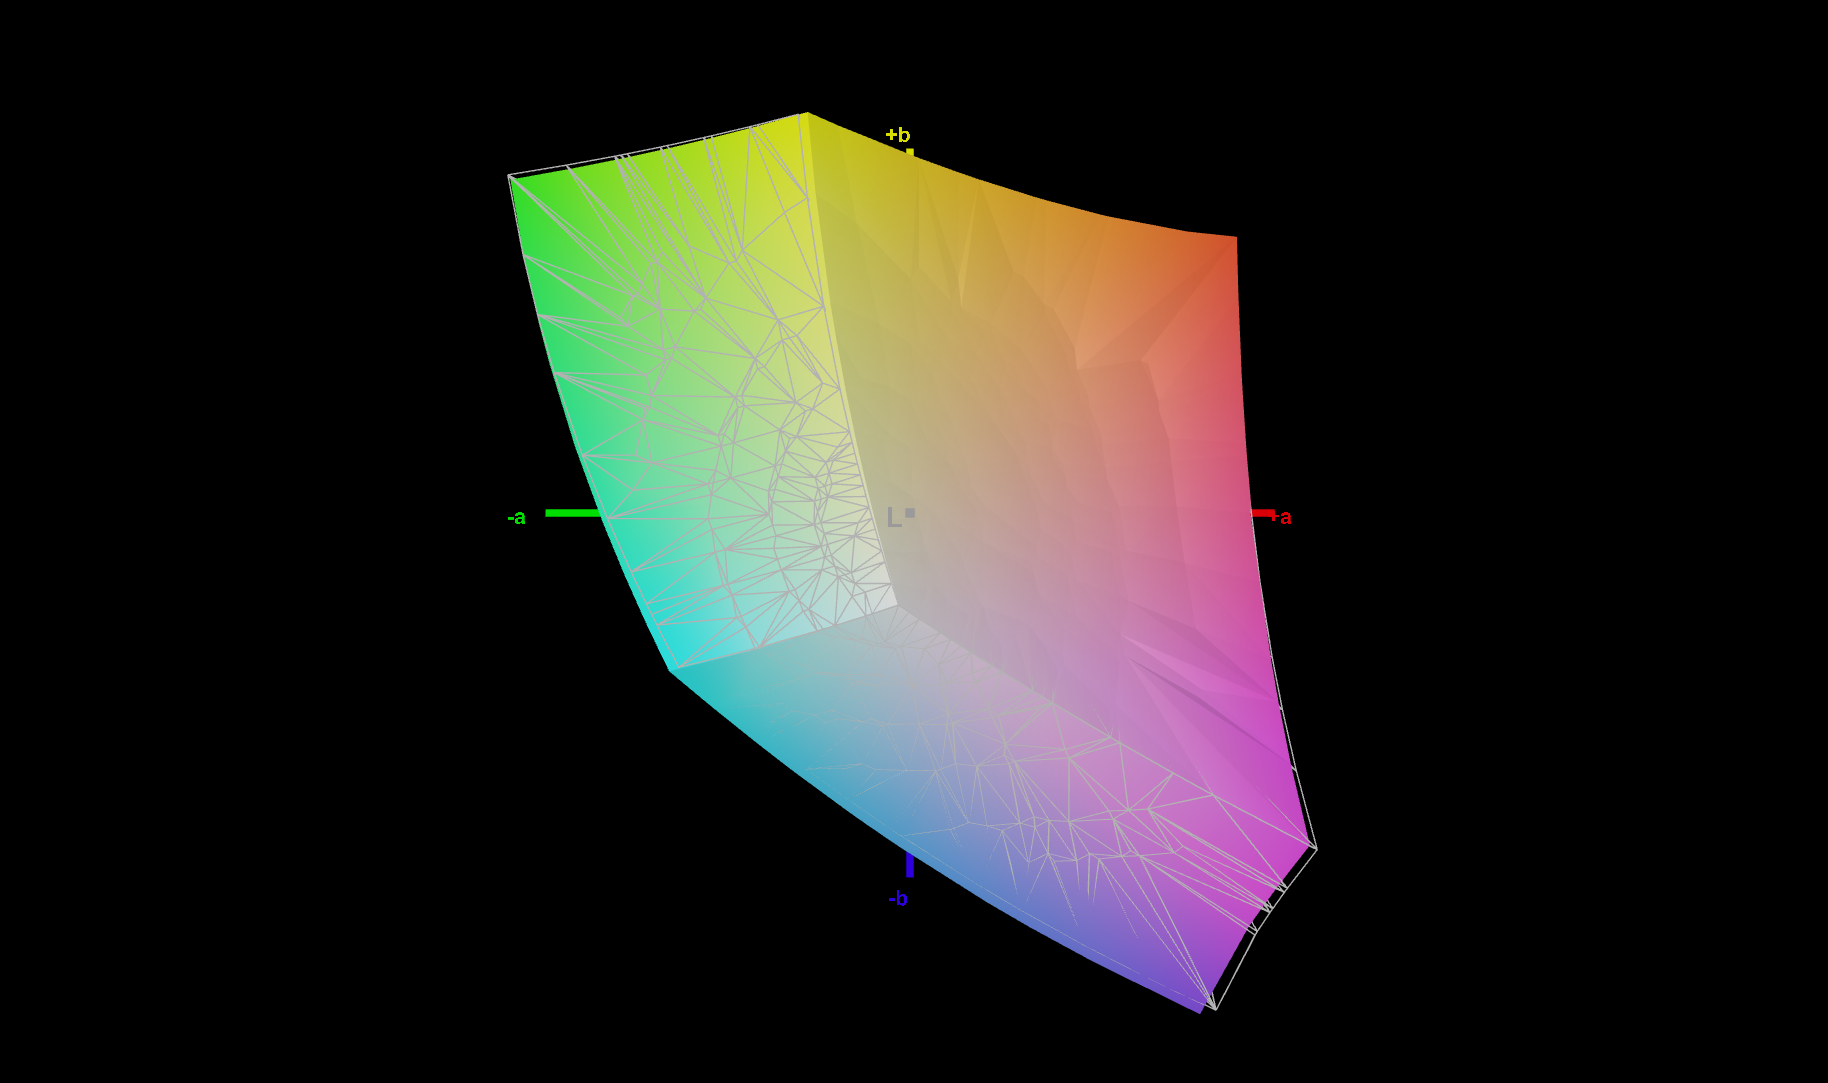
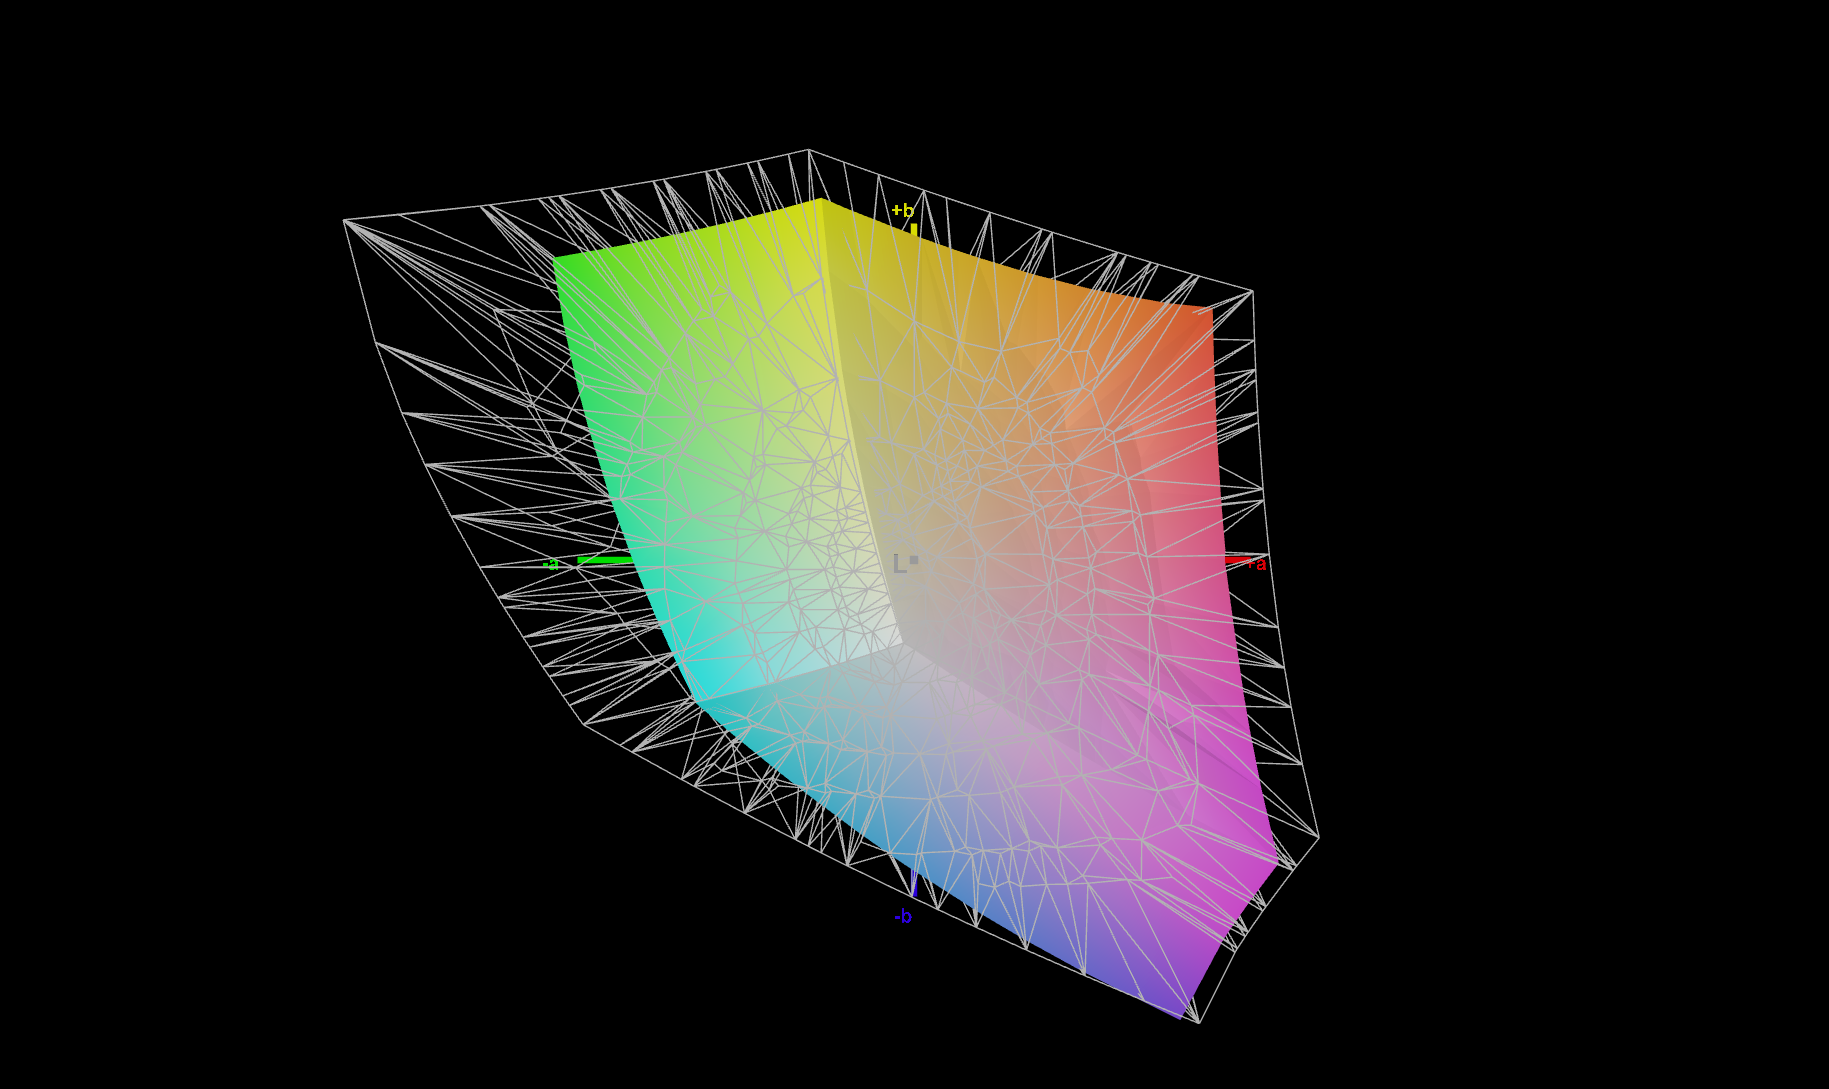
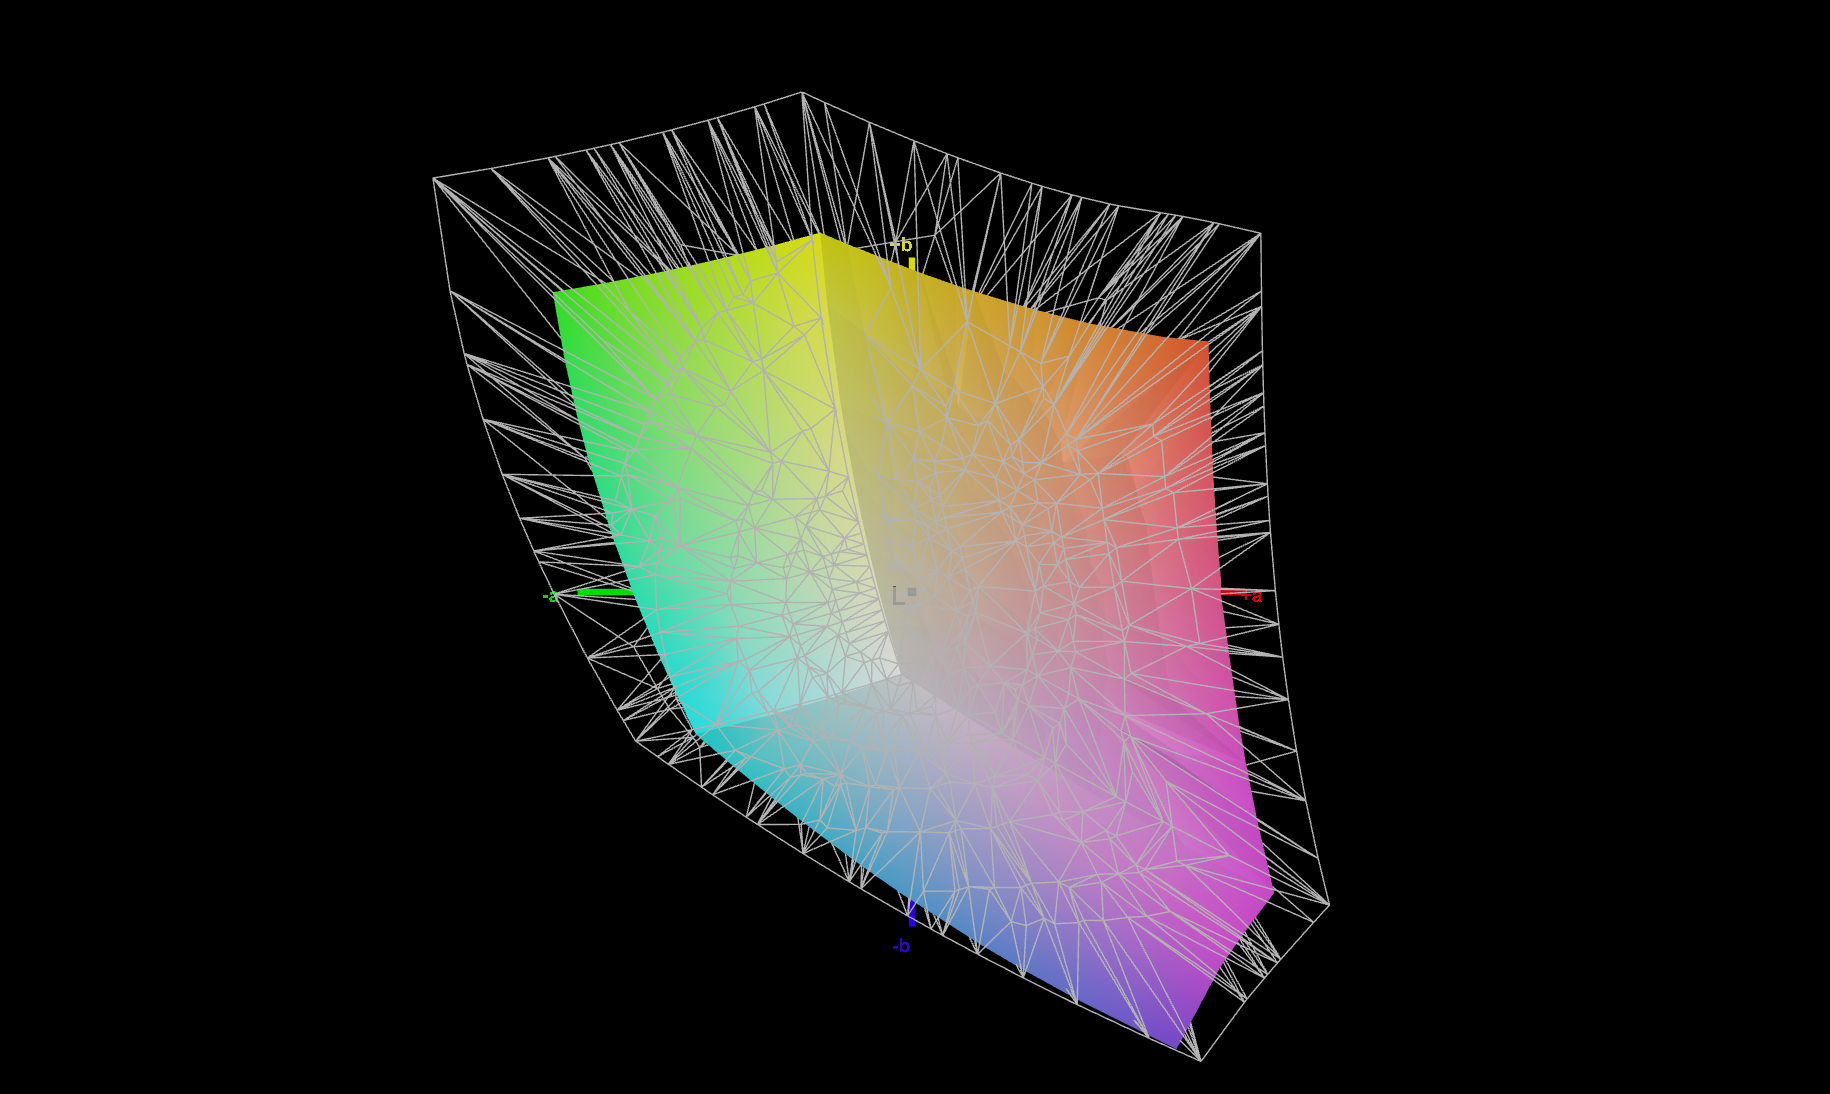
70.1% AdobeRGB 1998 (Argyll 3D)
98.6% sRGB (Argyll 3D)
67.8% Display P3 (Argyll 3D)
Gamma: 2.11
CCT: 6196 K
| Lenovo ThinkPad T14s G3 21BR00CDGE MNE007JA1-1, IPS LED, 1920x1200, 14" | Lenovo ThinkPad T14s G2 20WM003TGE NE140FHM-N61, IPS LED, 1920x1080, 14" | Lenovo ThinkPad T14 G3-21CF004NGE LP140WU1-SPB2, IPS, 1920x1200, 14" | Lenovo ThinkPad X1 Yoga G7 21CE002HGE MNE007JA1-1, IPS, 1920x1200, 14" | Lenovo ThinkPad X1 Carbon G10 21CC001RGE B140UAN02.1, IPS LED, 1920x1200, 14" | HP EliteBook 845 G9 6F6H9EA AUOA49A, IPS, 1920x1200, 14" | Dell Latitude 7420 JW6MH Chi Mei CMN1416 CHF07 140HCG, IPS, 1920x1080, 14" | Schenker Vision 14 2022 RTX 3050 Ti MNE007ZA1-1, IPS, 2880x1800, 14" | |
|---|---|---|---|---|---|---|---|---|
| Display | -4% | 1% | 2% | 6% | 7% | 0% | 5% | |
| Display P3 Coverage (%) | 67.8 | 68.1 0% | 69.2 2% | 69.3 2% | 74.6 10% | 75.4 11% | 68 0% | 74.1 9% |
| sRGB Coverage (%) | 98.6 | 91.7 -7% | 97.4 -1% | 99.7 1% | 98.6 0% | 100 1% | 99 0% | 97.4 -1% |
| AdobeRGB 1998 Coverage (%) | 70.1 | 67.1 -4% | 71.5 2% | 71.3 2% | 76.5 9% | 76.6 9% | 70 0% | 75.3 7% |
| Response Times | -45% | 15% | 9% | 1% | -20% | -15% | 36% | |
| Response Time Grey 50% / Grey 80% * (ms) | 41.4 ? | 68 ? -64% | 41.4 ? -0% | 42 ? -1% | 45.5 ? -10% | 58.8 ? -42% | 55 ? -33% | 31.5 ? 24% |
| Response Time Black / White * (ms) | 27.2 ? | 34 ? -25% | 19.2 ? 29% | 22.4 ? 18% | 24 ? 12% | 26.7 ? 2% | 26 ? 4% | 14.5 ? 47% |
| PWM Frequency (Hz) | 22730 ? | 53050 ? | ||||||
| Screen | -46% | 7% | 17% | -15% | 4% | 15% | -21% | |
| Brightness middle (cd/m²) | 312 | 422.9 36% | 451 45% | 371 19% | 372 19% | 408 31% | 408 31% | 421 35% |
| Brightness (cd/m²) | 301 | 397 32% | 435 45% | 363 21% | 362 20% | 402 34% | 378 26% | 416 38% |
| Brightness Distribution (%) | 93 | 91 -2% | 94 1% | 92 -1% | 94 1% | 92 -1% | 86 -8% | 89 -4% |
| Black Level * (cd/m²) | 0.16 | 0.32 -100% | 0.21 -31% | 0.21 -31% | 0.18 -13% | 0.24 -50% | 0.22 -38% | 0.28 -75% |
| Contrast (:1) | 1950 | 1322 -32% | 2148 10% | 1767 -9% | 2067 6% | 1700 -13% | 1855 -5% | 1504 -23% |
| Colorchecker dE 2000 * | 2.2 | 4.8 -118% | 2.4 -9% | 1.3 41% | 3.4 -55% | 2.09 5% | 1.54 30% | 3.2 -45% |
| Colorchecker dE 2000 max. * | 5.6 | 8.7 -55% | 4.1 27% | 2.6 54% | 6.7 -20% | 5.09 9% | 2.72 51% | 5.5 2% |
| Colorchecker dE 2000 calibrated * | 1.3 | 1.9 -46% | 1.3 -0% | 0.8 38% | 1.8 -38% | 1.56 -20% | 1.08 17% | 2 -54% |
| Greyscale dE 2000 * | 2.7 | 6.1 -126% | 3.3 -22% | 2.1 22% | 4.3 -59% | 1.7 37% | 1.95 28% | 4.4 -63% |
| Gamma | 2.11 104% | 2.23 99% | 2.13 103% | 2.15 102% | 2.13 103% | 2.138 103% | 2.33 94% | 2.22 99% |
| CCT | 6196 105% | 7635 85% | 6848 95% | 6759 96% | 6158 106% | 6628 98% | 6806 96% | 6384 102% |
| Total Average (Program / Settings) | -32% /
-37% | 8% /
7% | 9% /
13% | -3% /
-8% | -3% /
1% | 0% /
7% | 7% /
-7% |
* ... smaller is better
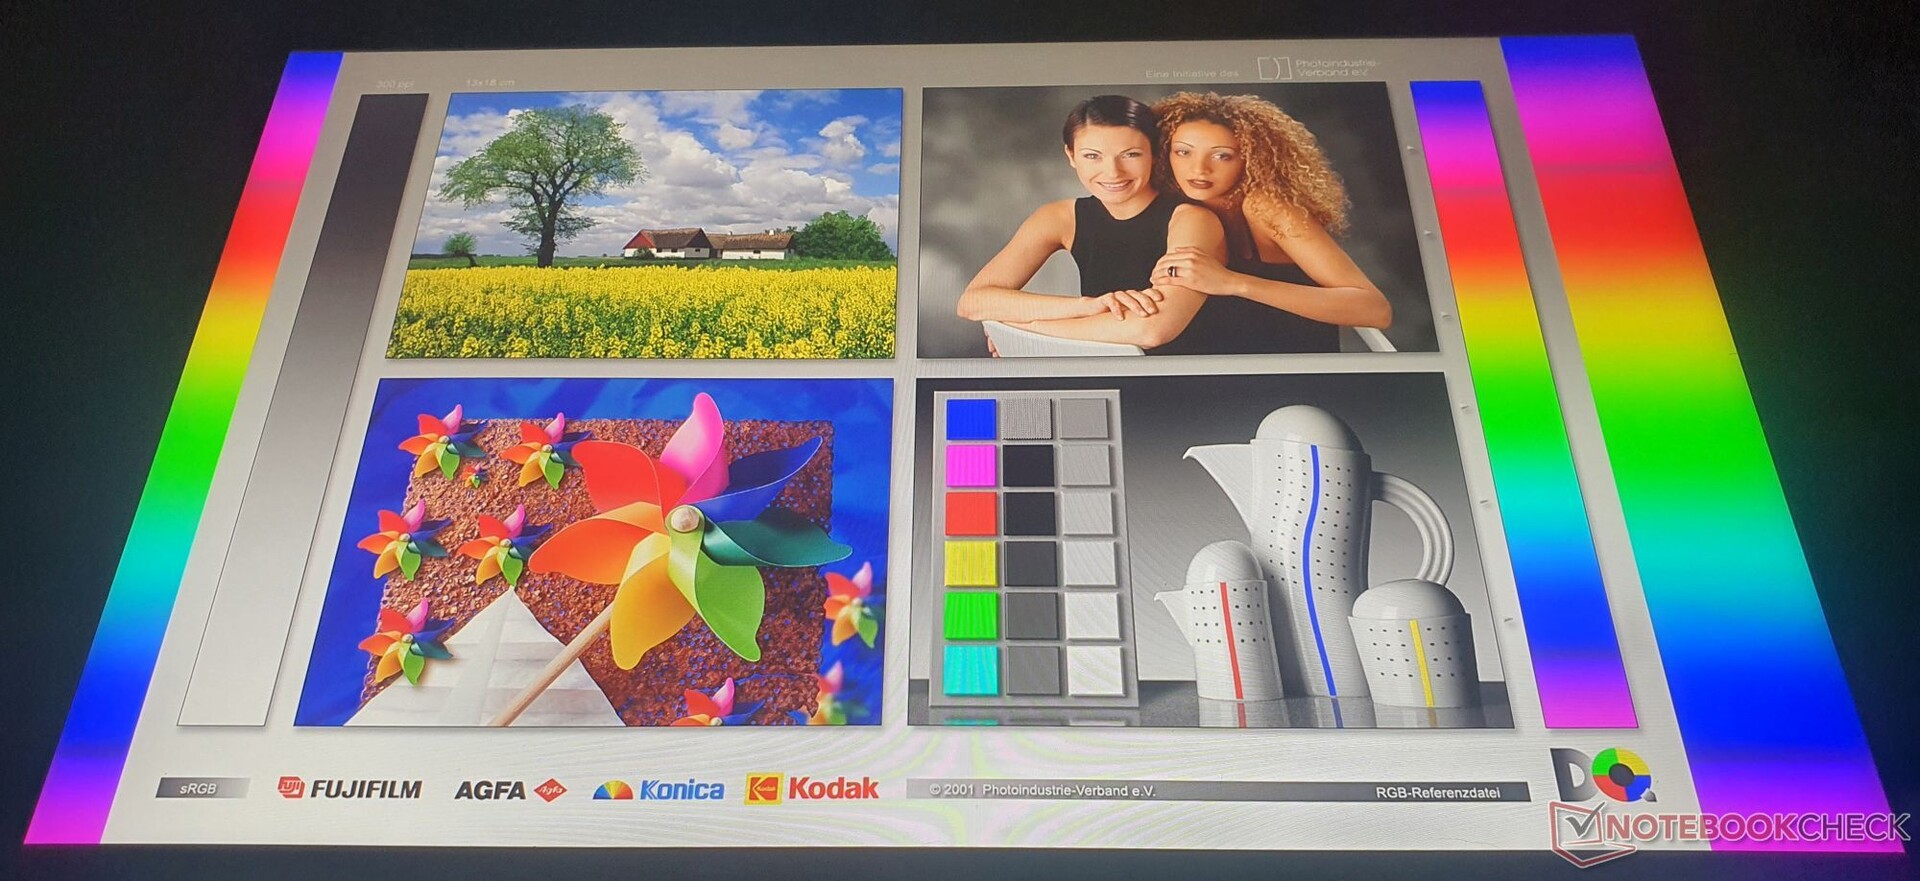
该显示器具有99%的sRGB覆盖率,这意味着它适用于专业照片编辑。你可以点击这里来下载我们的色彩配置文件。
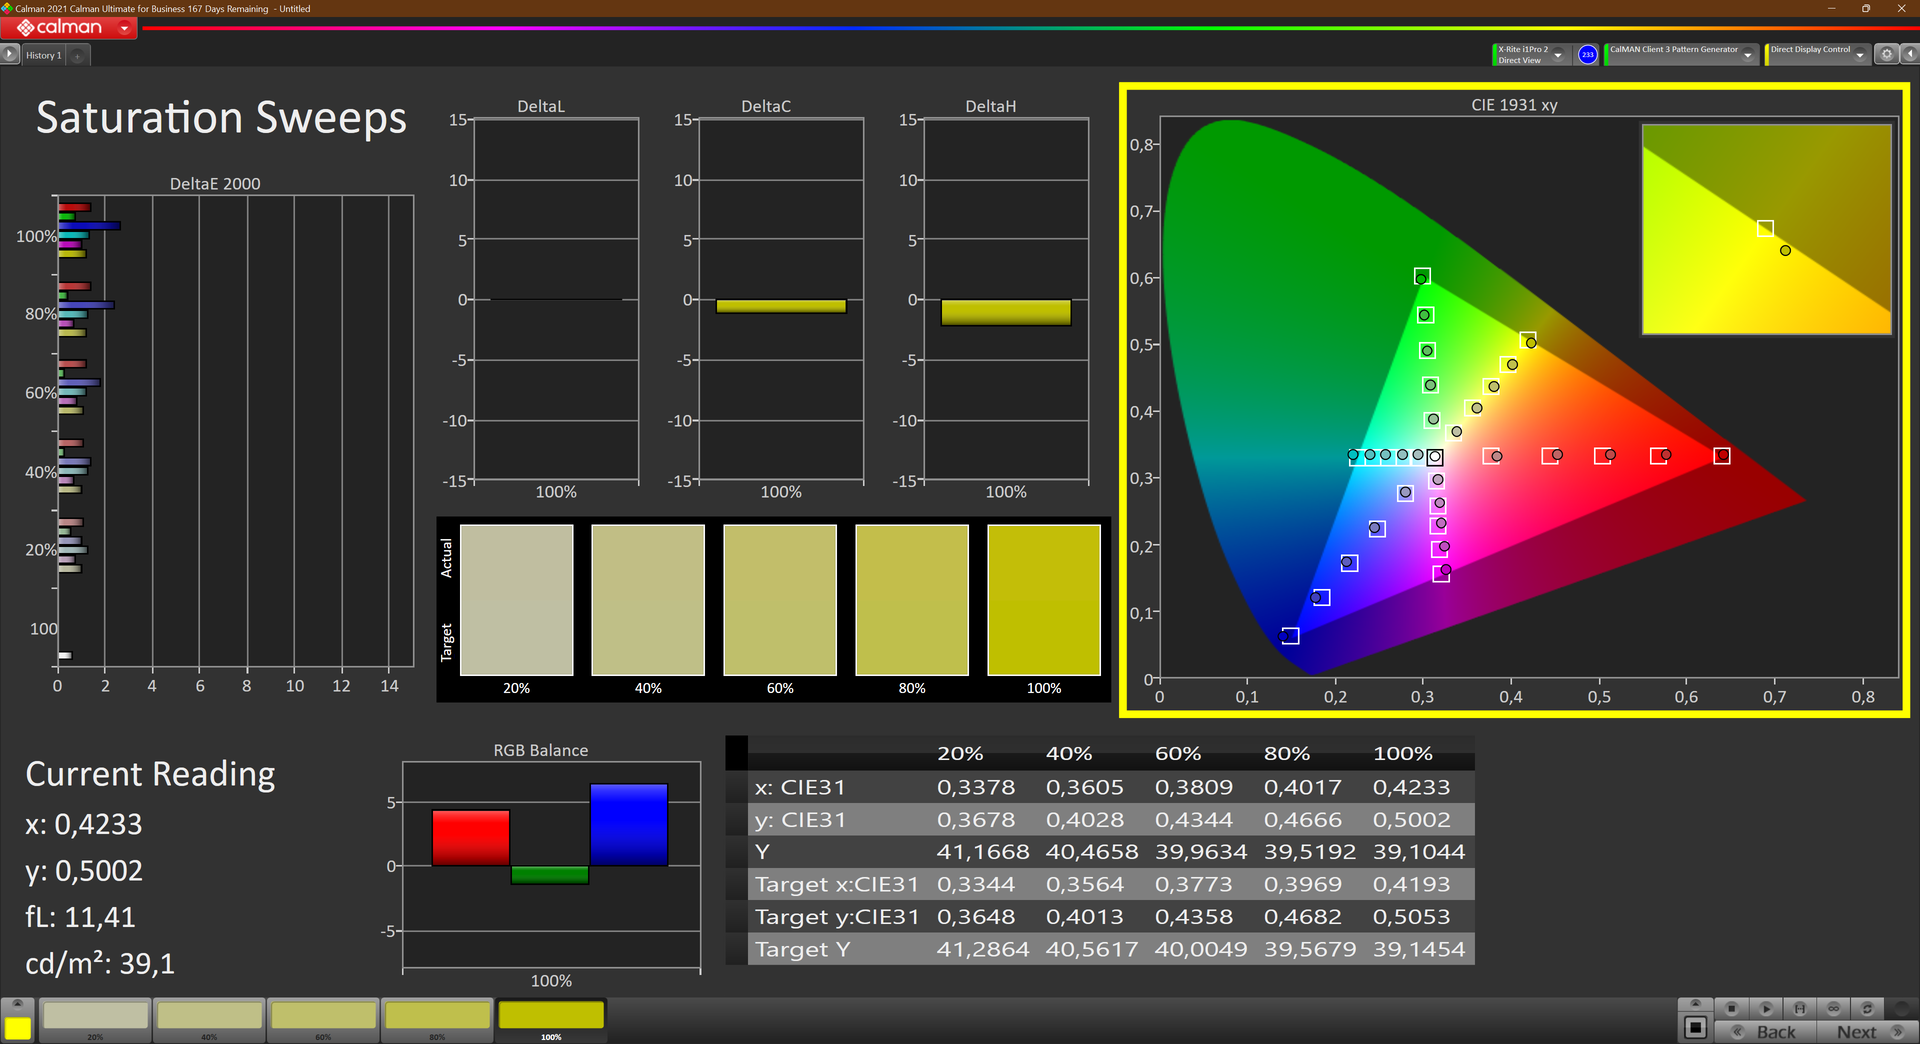
开箱后,该面板有轻微的红色色调,在我们校准屏幕后,这种色调消失了。Delta E水平大多保持在2.5的可注意阈值以下。青色是唯一的例外,但这也被我们的校准过程所弥补。反过来,蓝色的色差增加到3.1。灰色的色调起初与参考色有很大的偏差,但我们同样能够通过校准将delta E降低到小于1.5的优秀值。
Display Response Times
| ↔ Response Time Black to White | ||
|---|---|---|
| 27.2 ms ... rise ↗ and fall ↘ combined | ↗ 14 ms rise | 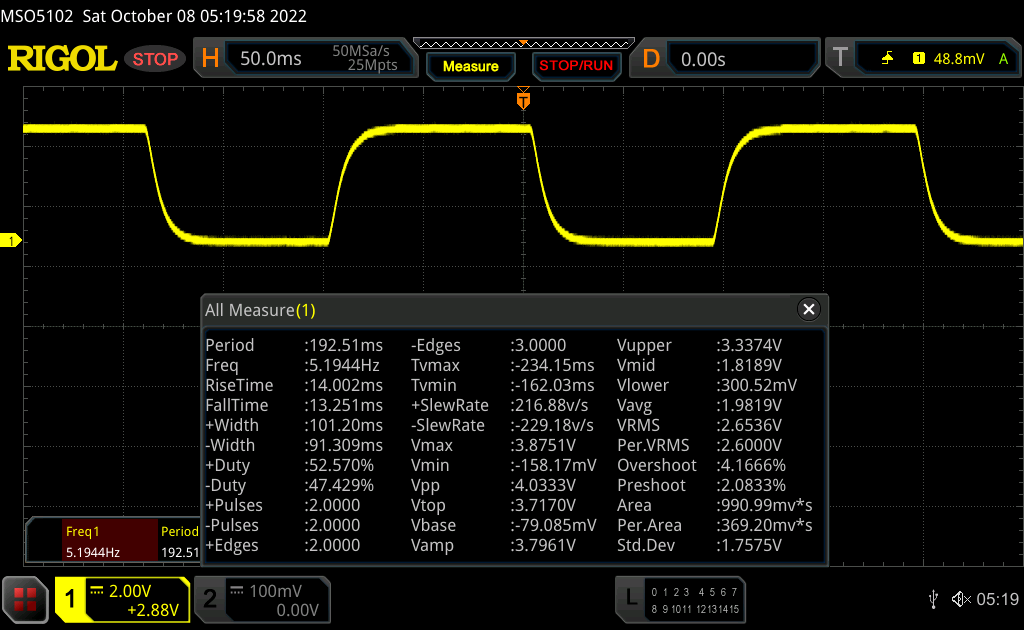 |
| ↘ 13.2 ms fall | ||
| The screen shows relatively slow response rates in our tests and may be too slow for gamers. In comparison, all tested devices range from 0.1 (minimum) to 240 (maximum) ms. » 69 % of all devices are better. This means that the measured response time is worse than the average of all tested devices (19.8 ms). | ||
| ↔ Response Time 50% Grey to 80% Grey | ||
| 41.4 ms ... rise ↗ and fall ↘ combined | ↗ 18.8 ms rise | 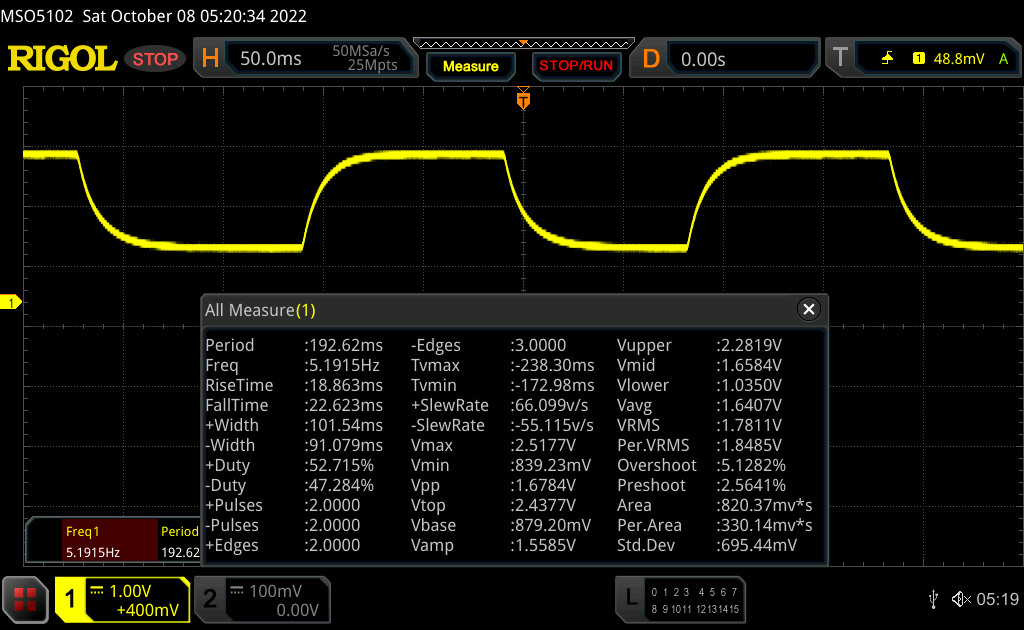 |
| ↘ 22.6 ms fall | ||
| The screen shows slow response rates in our tests and will be unsatisfactory for gamers. In comparison, all tested devices range from 0.165 (minimum) to 636 (maximum) ms. » 67 % of all devices are better. This means that the measured response time is worse than the average of all tested devices (30.9 ms). | ||
Screen Flickering / PWM (Pulse-Width Modulation)
| Screen flickering / PWM not detected |  | ||
In comparison: 52 % of all tested devices do not use PWM to dim the display. If PWM was detected, an average of 7744 (minimum: 5 - maximum: 343500) Hz was measured. | |||
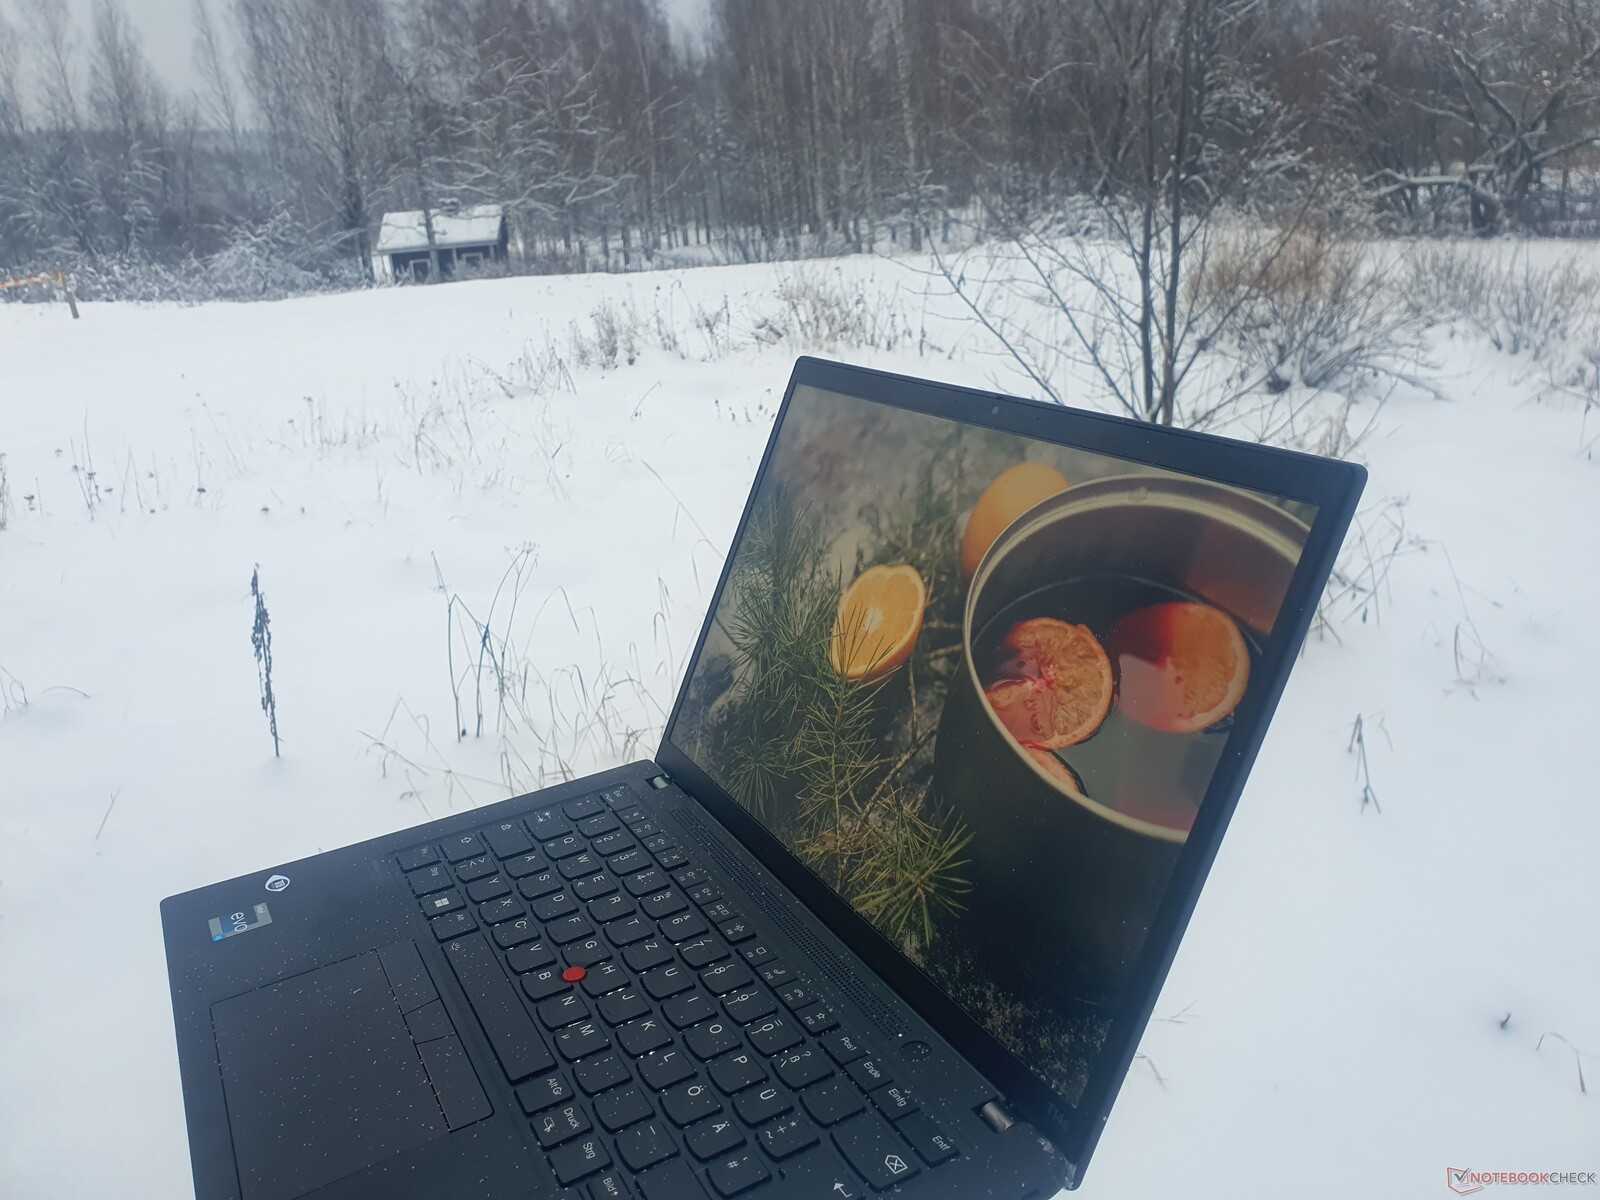
因为显示屏是哑光的,并且有足够的亮度(300cd/m²),所以你在户外仍然能够阅读屏幕上的内容--只要外面是阴天或者你找到一个阴凉的地方。但是你应该避免在阳光直射下使用笔记本电脑。
性能。Alder Lake-U在ThinkPad T14s上发挥了潜力
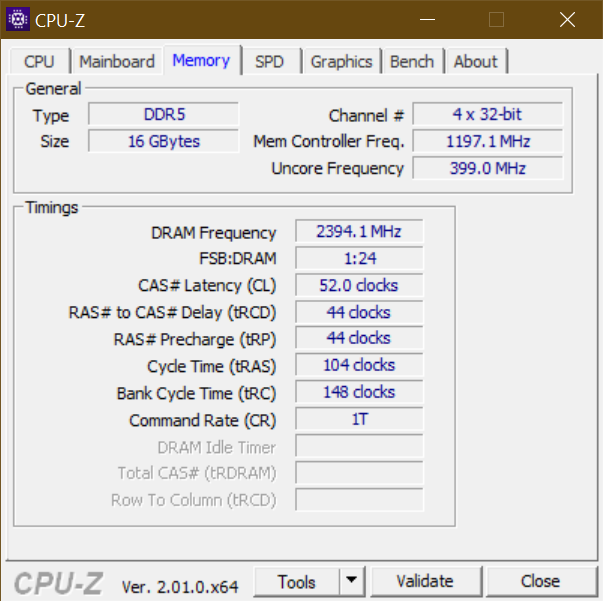
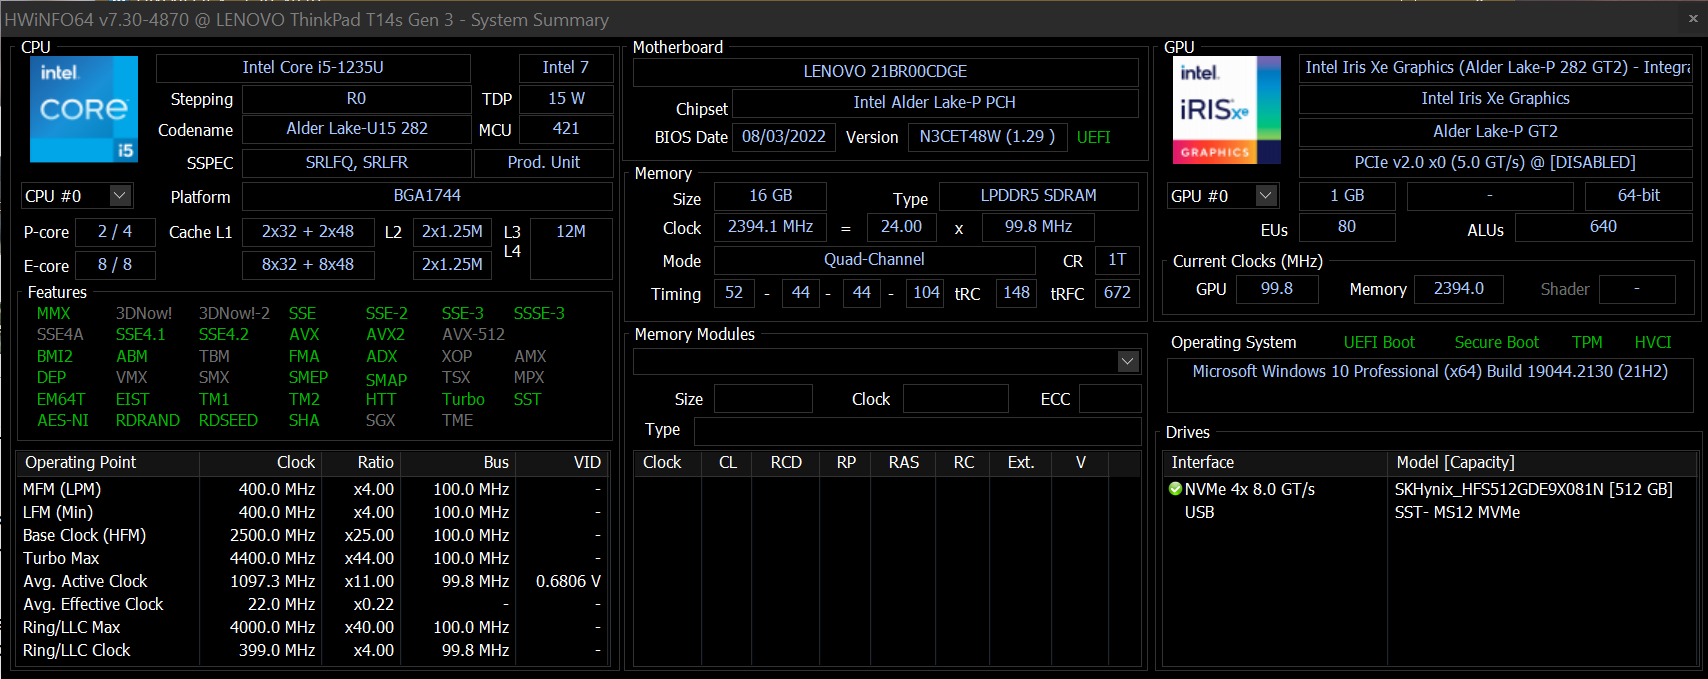
我们的ThinkPad T14s配备了16GB焊接的LPDDR5 4800内存(可配置到32GB)和一个容量为512GB的PCIe 4.0 SSD。它配备了一个 英特尔酷睿i5-1235U搭配Xe G7 iGPU。你可以为ThinkPad T14s G3配置最多一个强大的 酷睿i7-1280P.这款笔记本电脑主要用于办公和商业应用,而不是视频编辑和游戏。在最好的情况下,基于AMD的变体配备了 Ryzen 7 PRO 6850U和一个集成的 Radeon 680M只能为这种使用情况提供可接受的整体性能。
测试条件
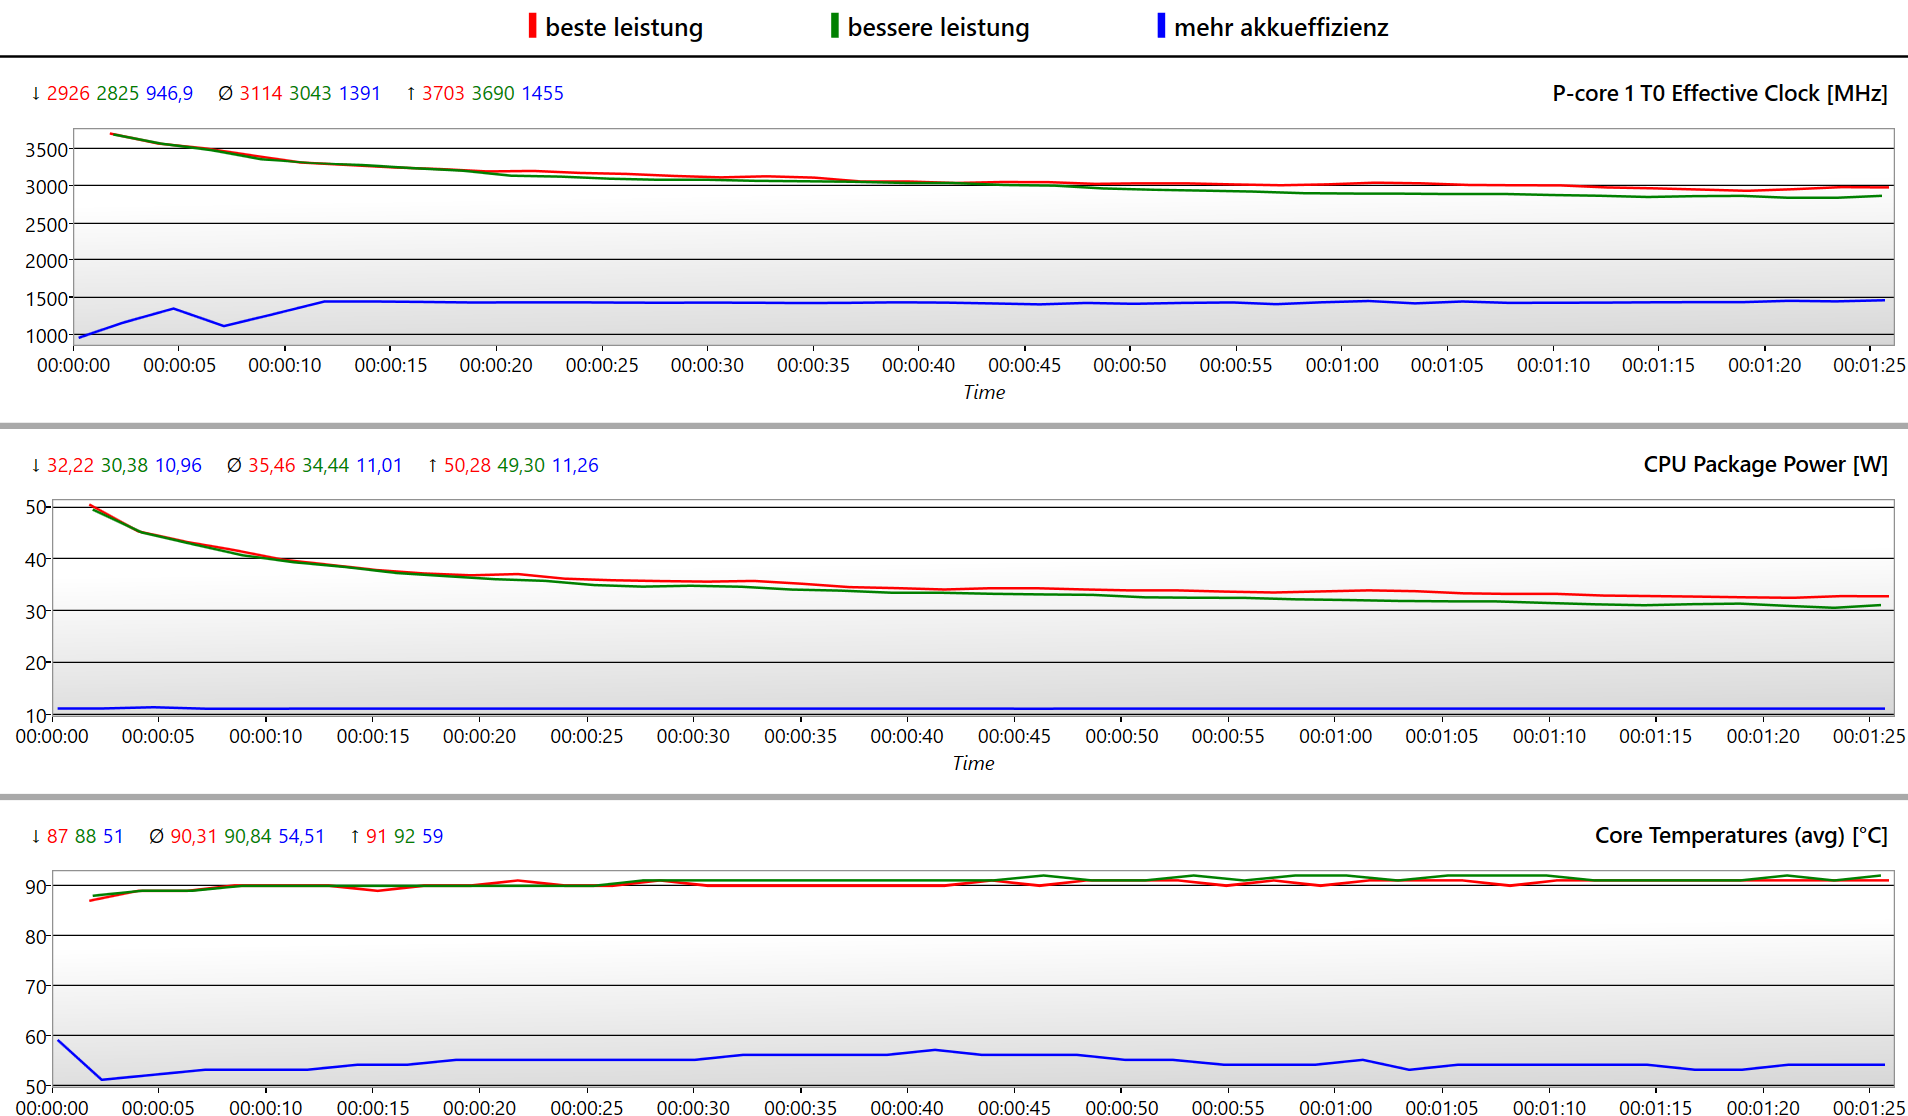
联想并没有在ThinkPads上放置自己的性能配置文件,而是将其整合到Window的电源设置中。在运行与性能有关的基准测试时,我们选择了 "最佳性能 "配置文件,并禁用了智能冷却的自动模式(按Fn+T)。
- 在这种模式下,我们测得的功率极限为52W(涡轮)和~33W(持续)。
- 在电池供电时,"更好的性能 "模式将PL1限制在27.5W。
- 在 "更高的功率效率 "模式下,功率使用减少了三分之二,为11W。
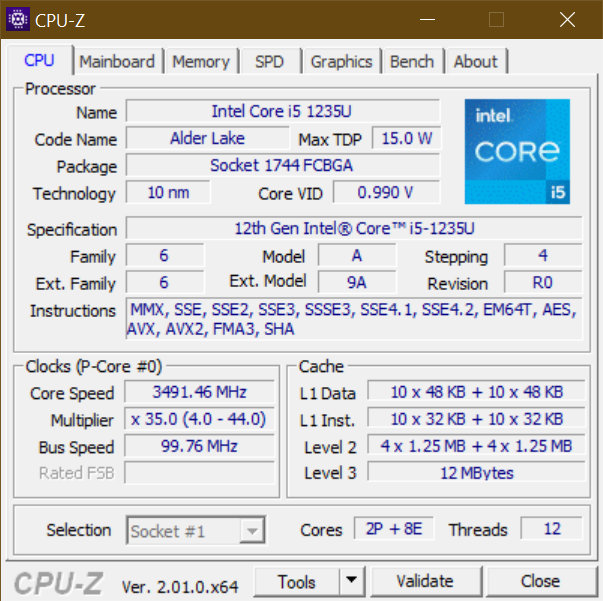
处理器
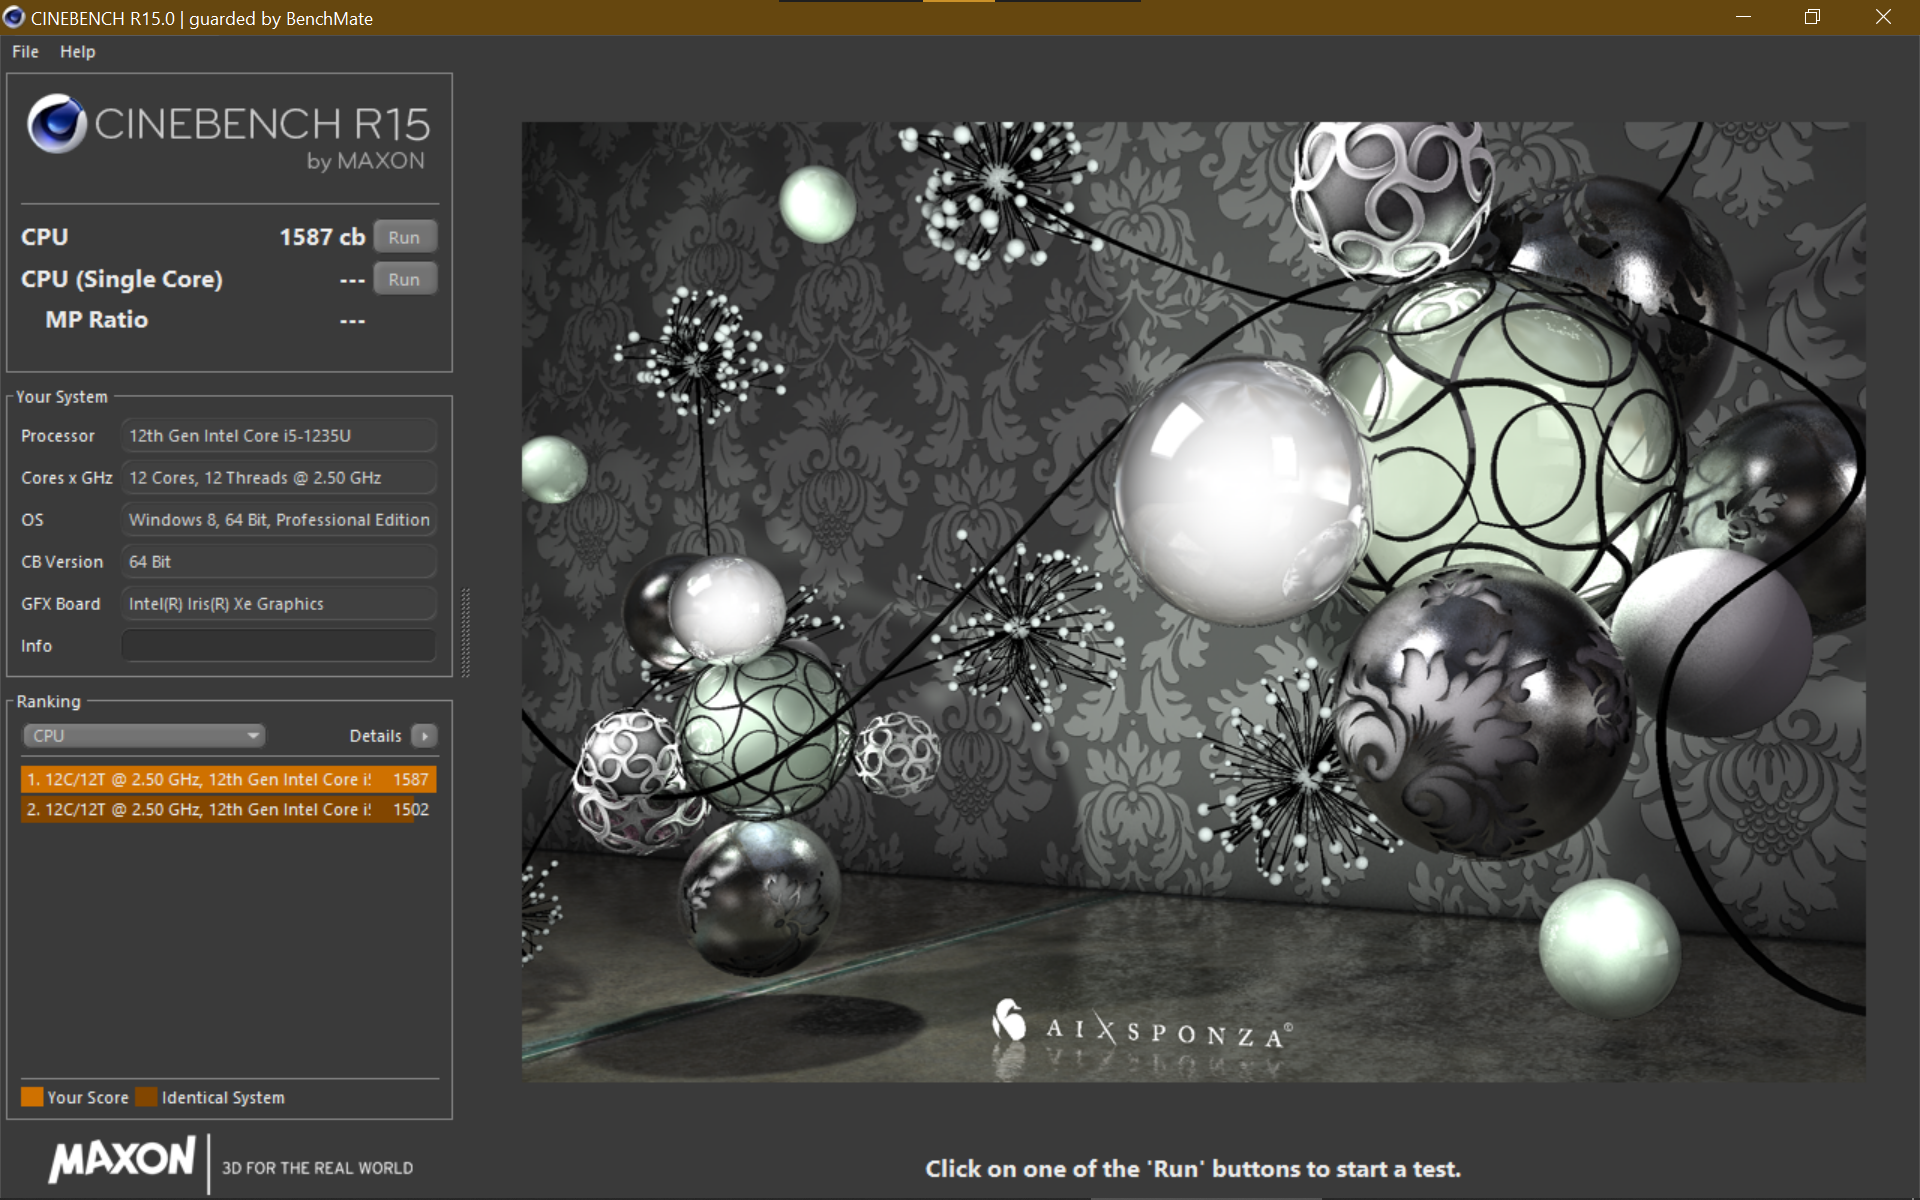
芯片 英特尔酷睿i5-1235U只有两个P核,TDP为15W,联想将其提高到30W以上。 循环运行Cinebench R15显示,该CPU的持续性能仅比 酷睿i7-1270P中的 ThinkPad X1 Yoga G7(PL1为28W)。它的表现甚至比CB R20/R23中的酷睿i7好10%左右。
尽管有两倍的P核数量,但 酷睿i5-1240P在 ThinkPad T16(PL1为20W)在CB R15中的表现差25%,在CB R23中差40%。即使它们有相同的功率耗散,AMD Ryzen 7 PRO 6850U中的 ThinkPad T14的处理器比T14s G3的处理器领先33%。而 Ryzen 5 PRO 6650U中的 EliteBook 845 G9和 笔记本Z13几乎拥有与我们评测单元中的Core i5相同的性能水平。
涡轮增压技术在U系列CPU中能够更好地发挥其潜力,而不是在 酷睿i5-1250P内的 ThinkPad X1 Carbon G10而 T14s G2配备的是Tiger Lake-U CPU的T14s G2则落后于T14s G3达50%之多--这是一代GPU的出色性能提升。这款 申克Vision 14配有 酷睿i7-12700H是这次比较的赢家。这款CPU结合了六个P核,PL1为40W,这意味着性能大约提高了60%。A 酷睿i7-1280P也同样快,你可以在联想Yoga Slim 9中看到(PL1为35W)。你也可以用这种CPU配置ThinkPad T14s,但它在欧洲、中东和非洲地区没有供应。
Cinebench R15 Multi Sustained Load
* ... smaller is better
AIDA64: FP32 Ray-Trace | FPU Julia | CPU SHA3 | CPU Queen | FPU SinJulia | FPU Mandel | CPU AES | CPU ZLib | FP64 Ray-Trace | CPU PhotoWorxx
系统性能
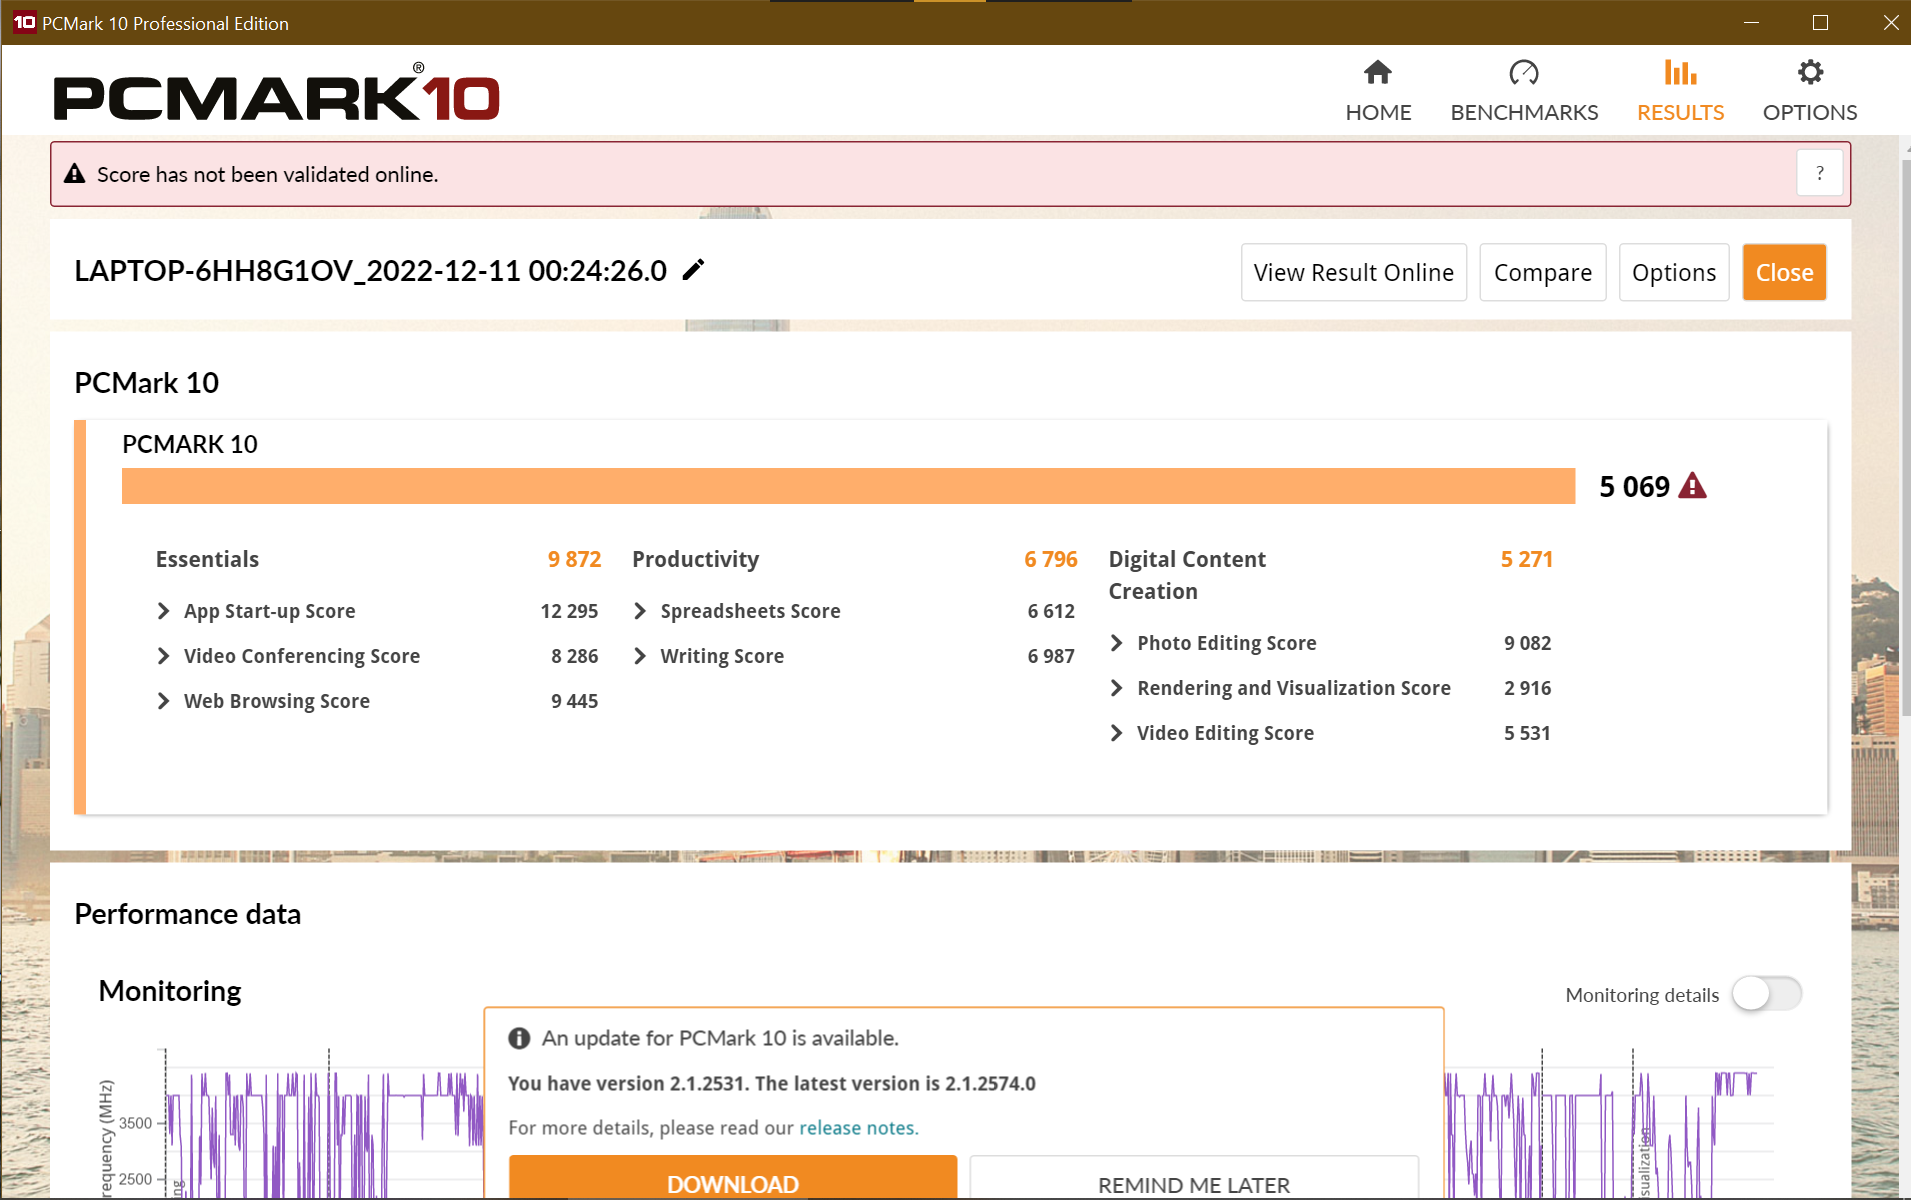
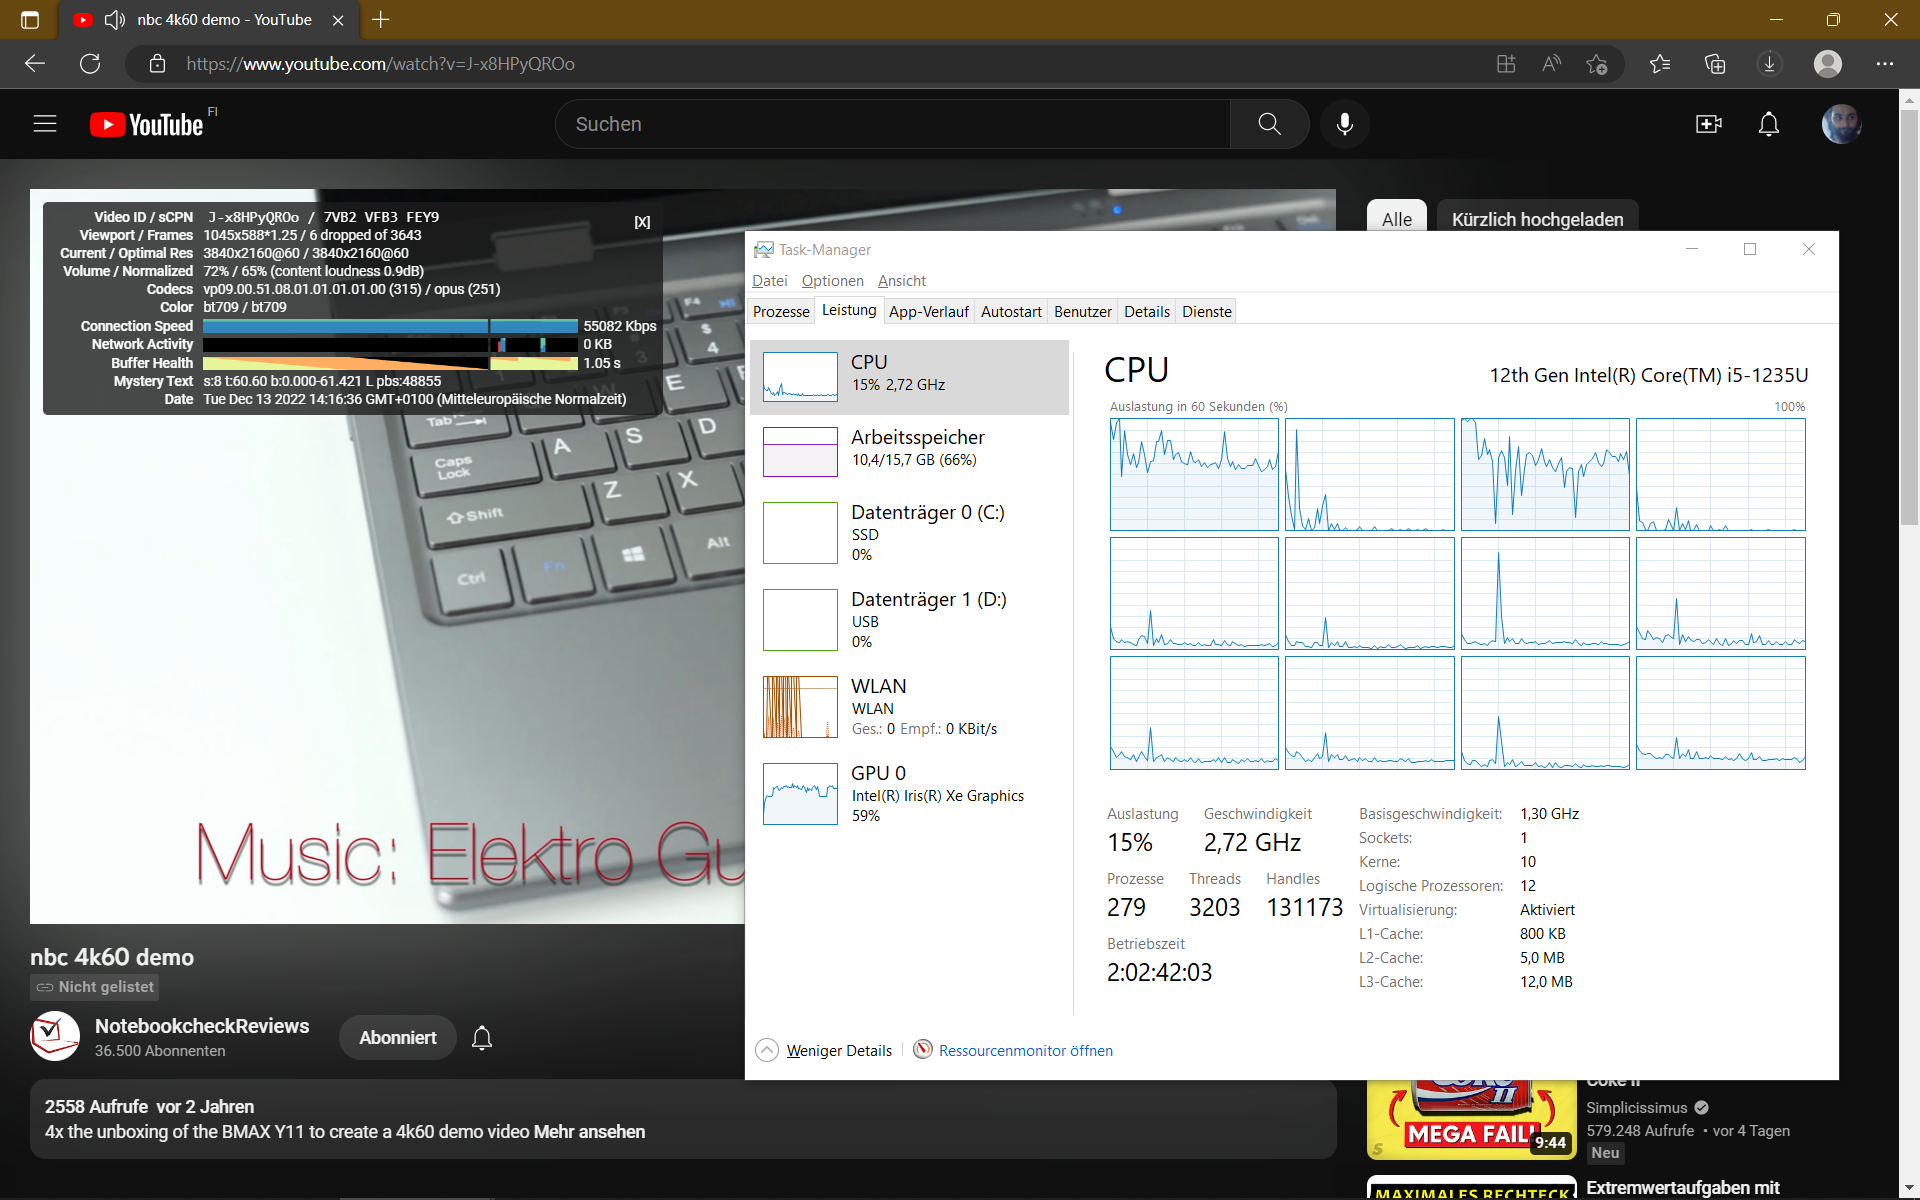
由于强大的涡轮增压和高单核性能,该系统感觉非常灵敏,特别是在网络浏览时。即使在同时播放4K YouTube视频时,它也不会变得不那么敏捷。在PCMark 10中, ThinkPad T14 G3 AMD领先于T14s 20%,而 斯肯克视觉14则以明显的优势领先。
CrossMark: Overall | Productivity | Creativity | Responsiveness
Sunspider: 1.0 Total Score
Mozilla Kraken 1.1: Total
Speedometer 2.0: Result 2.0
Octane V2: Total Score
Jetstream 2: 2.0 Total
WebXPRT 3: Overall
WebXPRT 4: Overall
| PCMark 10 / Score | |
| Average of class Office (2601 - 9298, n=68, last 2 years) | |
| Schenker Vision 14 2022 RTX 3050 Ti | |
| Lenovo ThinkPad T14 G3-21CF004NGE | |
| HP EliteBook 845 G9 6F6H9EA | |
| Lenovo ThinkPad T14s G2 20WM003TGE | |
| Lenovo ThinkPad T14s G3 21BR00CDGE | |
| Lenovo ThinkPad X1 Carbon G10 21CC001RGE | |
| Lenovo ThinkPad T16 G1 21BWS00200 | |
| Average Intel Core i5-1235U, Intel Iris Xe Graphics G7 80EUs (4528 - 5543, n=8) | |
| Dell Latitude 7420 JW6MH | |
| Lenovo ThinkPad X13 G3 21BN0046GE | |
| PCMark 10 / Essentials | |
| Schenker Vision 14 2022 RTX 3050 Ti | |
| Lenovo ThinkPad T14s G2 20WM003TGE | |
| Lenovo ThinkPad X1 Carbon G10 21CC001RGE | |
| Average of class Office (3245 - 11594, n=68, last 2 years) | |
| Average Intel Core i5-1235U, Intel Iris Xe Graphics G7 80EUs (9143 - 11273, n=8) | |
| Lenovo ThinkPad T14s G3 21BR00CDGE | |
| Dell Latitude 7420 JW6MH | |
| Lenovo ThinkPad T14 G3-21CF004NGE | |
| HP EliteBook 845 G9 6F6H9EA | |
| Lenovo ThinkPad T16 G1 21BWS00200 | |
| Lenovo ThinkPad X13 G3 21BN0046GE | |
| PCMark 10 / Productivity | |
| Average of class Office (5336 - 17243, n=68, last 2 years) | |
| HP EliteBook 845 G9 6F6H9EA | |
| Schenker Vision 14 2022 RTX 3050 Ti | |
| Lenovo ThinkPad T14 G3-21CF004NGE | |
| Lenovo ThinkPad T14s G2 20WM003TGE | |
| Lenovo ThinkPad T14s G3 21BR00CDGE | |
| Average Intel Core i5-1235U, Intel Iris Xe Graphics G7 80EUs (6440 - 7354, n=8) | |
| Lenovo ThinkPad X1 Carbon G10 21CC001RGE | |
| Dell Latitude 7420 JW6MH | |
| Lenovo ThinkPad X13 G3 21BN0046GE | |
| Lenovo ThinkPad T16 G1 21BWS00200 | |
| PCMark 10 / Digital Content Creation | |
| Schenker Vision 14 2022 RTX 3050 Ti | |
| Average of class Office (2049 - 13541, n=68, last 2 years) | |
| Lenovo ThinkPad T14 G3-21CF004NGE | |
| HP EliteBook 845 G9 6F6H9EA | |
| Lenovo ThinkPad T16 G1 21BWS00200 | |
| Lenovo ThinkPad T14s G2 20WM003TGE | |
| Lenovo ThinkPad T14s G3 21BR00CDGE | |
| Lenovo ThinkPad X1 Carbon G10 21CC001RGE | |
| Dell Latitude 7420 JW6MH | |
| Average Intel Core i5-1235U, Intel Iris Xe Graphics G7 80EUs (4220 - 5839, n=8) | |
| Lenovo ThinkPad X13 G3 21BN0046GE | |
| CrossMark / Overall | |
| Schenker Vision 14 2022 RTX 3050 Ti | |
| Lenovo ThinkPad X1 Carbon G10 21CC001RGE | |
| Lenovo ThinkPad T14s G3 21BR00CDGE | |
| Average of class Office (381 - 2010, n=75, last 2 years) | |
| Apple MacBook Air M2 Entry | |
| Apple MacBook Pro 14 2021 M1 Pro Entry | |
| Lenovo ThinkPad T14 G3-21CF004NGE | |
| Lenovo ThinkPad X13 G3 21BN0046GE | |
| Lenovo ThinkPad T16 G1 21BWS00200 | |
| Average Intel Core i5-1235U, Intel Iris Xe Graphics G7 80EUs (983 - 1644, n=8) | |
| Dell Latitude 7420 JW6MH | |
| CrossMark / Productivity | |
| Schenker Vision 14 2022 RTX 3050 Ti | |
| Lenovo ThinkPad X1 Carbon G10 21CC001RGE | |
| Lenovo ThinkPad T14s G3 21BR00CDGE | |
| Average of class Office (464 - 1880, n=75, last 2 years) | |
| Lenovo ThinkPad T16 G1 21BWS00200 | |
| Lenovo ThinkPad T14 G3-21CF004NGE | |
| Average Intel Core i5-1235U, Intel Iris Xe Graphics G7 80EUs (1026 - 1676, n=8) | |
| Apple MacBook Air M2 Entry | |
| Lenovo ThinkPad X13 G3 21BN0046GE | |
| Dell Latitude 7420 JW6MH | |
| Apple MacBook Pro 14 2021 M1 Pro Entry | |
| CrossMark / Creativity | |
| Apple MacBook Pro 14 2021 M1 Pro Entry | |
| Apple MacBook Air M2 Entry | |
| Schenker Vision 14 2022 RTX 3050 Ti | |
| Lenovo ThinkPad X1 Carbon G10 21CC001RGE | |
| Average of class Office (319 - 2361, n=75, last 2 years) | |
| Lenovo ThinkPad T14s G3 21BR00CDGE | |
| Lenovo ThinkPad T14 G3-21CF004NGE | |
| Lenovo ThinkPad X13 G3 21BN0046GE | |
| Average Intel Core i5-1235U, Intel Iris Xe Graphics G7 80EUs (1032 - 1618, n=8) | |
| Lenovo ThinkPad T16 G1 21BWS00200 | |
| Dell Latitude 7420 JW6MH | |
| CrossMark / Responsiveness | |
| Schenker Vision 14 2022 RTX 3050 Ti | |
| Lenovo ThinkPad X1 Carbon G10 21CC001RGE | |
| Lenovo ThinkPad T14s G3 21BR00CDGE | |
| Lenovo ThinkPad X13 G3 21BN0046GE | |
| Lenovo ThinkPad T16 G1 21BWS00200 | |
| Average of class Office (360 - 1820, n=75, last 2 years) | |
| Average Intel Core i5-1235U, Intel Iris Xe Graphics G7 80EUs (746 - 1867, n=8) | |
| Dell Latitude 7420 JW6MH | |
| Lenovo ThinkPad T14 G3-21CF004NGE | |
| Apple MacBook Air M2 Entry | |
| Apple MacBook Pro 14 2021 M1 Pro Entry | |
| Sunspider / 1.0 Total Score | |
| Lenovo ThinkPad T16 G1 21BWS00200 | |
| Lenovo ThinkPad T14s G3 21BR00CDGE | |
| Average Intel Core i5-1235U, Intel Iris Xe Graphics G7 80EUs (n=1) | |
| Average of class Office (87.2 - 111.8, n=2, last 2 years) | |
| Apple MacBook Pro 14 2021 M1 Pro Entry | |
| Mozilla Kraken 1.1 / Total | |
| Lenovo ThinkPad X1 Carbon G10 21CC001RGE | |
| Dell Latitude 7420 JW6MH | |
| Lenovo ThinkPad T14s G2 20WM003TGE | |
| Lenovo ThinkPad X13 G3 21BN0046GE | |
| Lenovo ThinkPad X13 G3 21BN0046GE | |
| HP EliteBook 845 G9 6F6H9EA | |
| Lenovo ThinkPad T14 G3-21CF004NGE | |
| Lenovo ThinkPad T16 G1 21BWS00200 | |
| Average Intel Core i5-1235U, Intel Iris Xe Graphics G7 80EUs (486 - 634, n=11) | |
| Average of class Office (391 - 1297, n=78, last 2 years) | |
| Schenker Vision 14 2022 RTX 3050 Ti | |
| Lenovo ThinkPad T14s G3 21BR00CDGE | |
| Apple MacBook Air M2 Entry | |
| Apple MacBook Pro 14 2021 M1 Pro Entry | |
| Speedometer 2.0 / Result 2.0 | |
| Average of class Office (173 - 640, n=18, last 2 years) | |
| Apple MacBook Air M2 Entry | |
| Schenker Vision 14 2022 RTX 3050 Ti | |
| Average Intel Core i5-1235U, Intel Iris Xe Graphics G7 80EUs (235 - 292, n=5) | |
| Apple MacBook Pro 14 2021 M1 Pro Entry | |
| Lenovo ThinkPad T14s G3 21BR00CDGE | |
| Lenovo ThinkPad T16 G1 21BWS00200 | |
| Lenovo ThinkPad T14 G3-21CF004NGE | |
| Octane V2 / Total Score | |
| Average of class Office (49011 - 126830, n=20, last 2 years) | |
| Schenker Vision 14 2022 RTX 3050 Ti | |
| Lenovo ThinkPad T14s G3 21BR00CDGE | |
| Lenovo ThinkPad T16 G1 21BWS00200 | |
| Average Intel Core i5-1235U, Intel Iris Xe Graphics G7 80EUs (78578 - 83104, n=5) | |
| Apple MacBook Air M2 Entry | |
| Lenovo ThinkPad T14 G3-21CF004NGE | |
| Apple MacBook Pro 14 2021 M1 Pro Entry | |
| Lenovo ThinkPad T14s G2 20WM003TGE | |
| Jetstream 2 / 2.0 Total | |
| Average of class Office (126.6 - 483, n=21, last 2 years) | |
| Schenker Vision 14 2022 RTX 3050 Ti | |
| Lenovo ThinkPad T16 G1 21BWS00200 | |
| Average Intel Core i5-1235U, Intel Iris Xe Graphics G7 80EUs (191.9 - 254, n=7) | |
| Lenovo ThinkPad T14s G3 21BR00CDGE | |
| Apple MacBook Air M2 Entry | |
| Lenovo ThinkPad T14 G3-21CF004NGE | |
| Apple MacBook Pro 14 2021 M1 Pro Entry | |
| Lenovo ThinkPad T14s G2 20WM003TGE | |
| WebXPRT 3 / Overall | |
| Apple MacBook Air M2 Entry | |
| Apple MacBook Pro 14 2021 M1 Pro Entry | |
| Schenker Vision 14 2022 RTX 3050 Ti | |
| Average of class Office (129.9 - 444, n=77, last 2 years) | |
| Average Intel Core i5-1235U, Intel Iris Xe Graphics G7 80EUs (233 - 305, n=11) | |
| Lenovo ThinkPad T14s G2 20WM003TGE | |
| Lenovo ThinkPad X1 Carbon G10 21CC001RGE | |
| Lenovo ThinkPad T16 G1 21BWS00200 | |
| Lenovo ThinkPad T14s G3 21BR00CDGE | |
| Dell Latitude 7420 JW6MH | |
| Lenovo ThinkPad T14 G3-21CF004NGE | |
| Lenovo ThinkPad X13 G3 21BN0046GE | |
| Lenovo ThinkPad X13 G3 21BN0046GE | |
| HP EliteBook 845 G9 6F6H9EA | |
| WebXPRT 4 / Overall | |
| Schenker Vision 14 2022 RTX 3050 Ti | |
| Average of class Office (104.2 - 313, n=77, last 2 years) | |
| Lenovo ThinkPad T16 G1 21BWS00200 | |
| Apple MacBook Air M2 Entry | |
| Average Intel Core i5-1235U, Intel Iris Xe Graphics G7 80EUs (206 - 236, n=10) | |
| Lenovo ThinkPad T14s G3 21BR00CDGE | |
| Lenovo ThinkPad X13 G3 21BN0046GE | |
| Lenovo ThinkPad X13 G3 21BN0046GE | |
| Lenovo ThinkPad T14 G3-21CF004NGE | |
| HP EliteBook 845 G9 6F6H9EA | |
* ... smaller is better
| PCMark 10 Score | 5069 points | |
Help | ||
| AIDA64 / Memory Copy | |
| Average of class Office (20075 - 110930, n=80, last 2 years) | |
| Lenovo ThinkPad X13 G3 21BN0046GE | |
| Lenovo ThinkPad T14s G3 21BR00CDGE | |
| Dell Latitude 7420 JW6MH | |
| Lenovo ThinkPad T14s G2 20WM003TGE | |
| Average Intel Core i5-1235U (24653 - 61921, n=8) | |
| Lenovo ThinkPad T14 G3-21CF004NGE | |
| Schenker Vision 14 2022 RTX 3050 Ti | |
| HP EliteBook 845 G9 6F6H9EA | |
| Lenovo ThinkPad T16 G1 21BWS00200 | |
| AIDA64 / Memory Read | |
| Average of class Office (10084 - 128030, n=81, last 2 years) | |
| Lenovo ThinkPad X13 G3 21BN0046GE | |
| Lenovo ThinkPad T14s G3 21BR00CDGE | |
| Dell Latitude 7420 JW6MH | |
| Lenovo ThinkPad T14s G2 20WM003TGE | |
| Average Intel Core i5-1235U (24441 - 66108, n=8) | |
| Lenovo ThinkPad T14 G3-21CF004NGE | |
| Schenker Vision 14 2022 RTX 3050 Ti | |
| HP EliteBook 845 G9 6F6H9EA | |
| Lenovo ThinkPad T16 G1 21BWS00200 | |
| AIDA64 / Memory Write | |
| Average of class Office (20073 - 119858, n=81, last 2 years) | |
| Lenovo ThinkPad T14s G2 20WM003TGE | |
| Lenovo ThinkPad X13 G3 21BN0046GE | |
| Lenovo ThinkPad T14s G3 21BR00CDGE | |
| Dell Latitude 7420 JW6MH | |
| Average Intel Core i5-1235U (25156 - 75808, n=8) | |
| Lenovo ThinkPad T14 G3-21CF004NGE | |
| Schenker Vision 14 2022 RTX 3050 Ti | |
| HP EliteBook 845 G9 6F6H9EA | |
| Lenovo ThinkPad T16 G1 21BWS00200 | |
| AIDA64 / Memory Latency | |
| Lenovo ThinkPad T14 G3-21CF004NGE | |
| Average of class Office (7.6 - 162.9, n=76, last 2 years) | |
| Dell Latitude 7420 JW6MH | |
| Schenker Vision 14 2022 RTX 3050 Ti | |
| Lenovo ThinkPad T16 G1 21BWS00200 | |
| HP EliteBook 845 G9 6F6H9EA | |
| Lenovo ThinkPad T14s G3 21BR00CDGE | |
| Lenovo ThinkPad T14s G2 20WM003TGE | |
| Lenovo ThinkPad X13 G3 21BN0046GE | |
| Average Intel Core i5-1235U (76.3 - 119, n=8) | |
* ... smaller is better
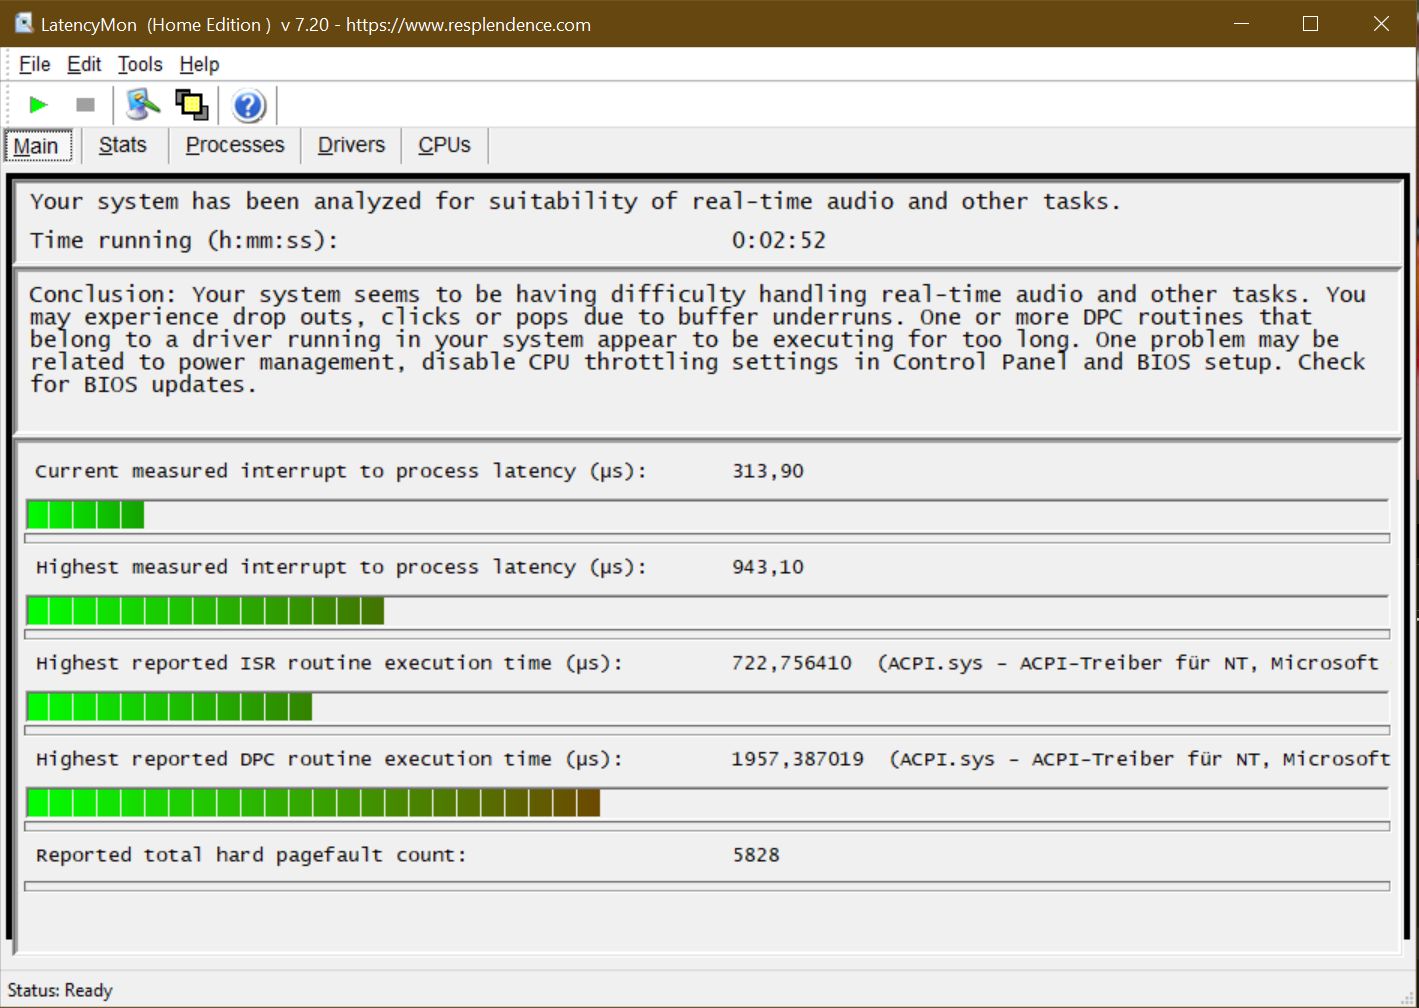
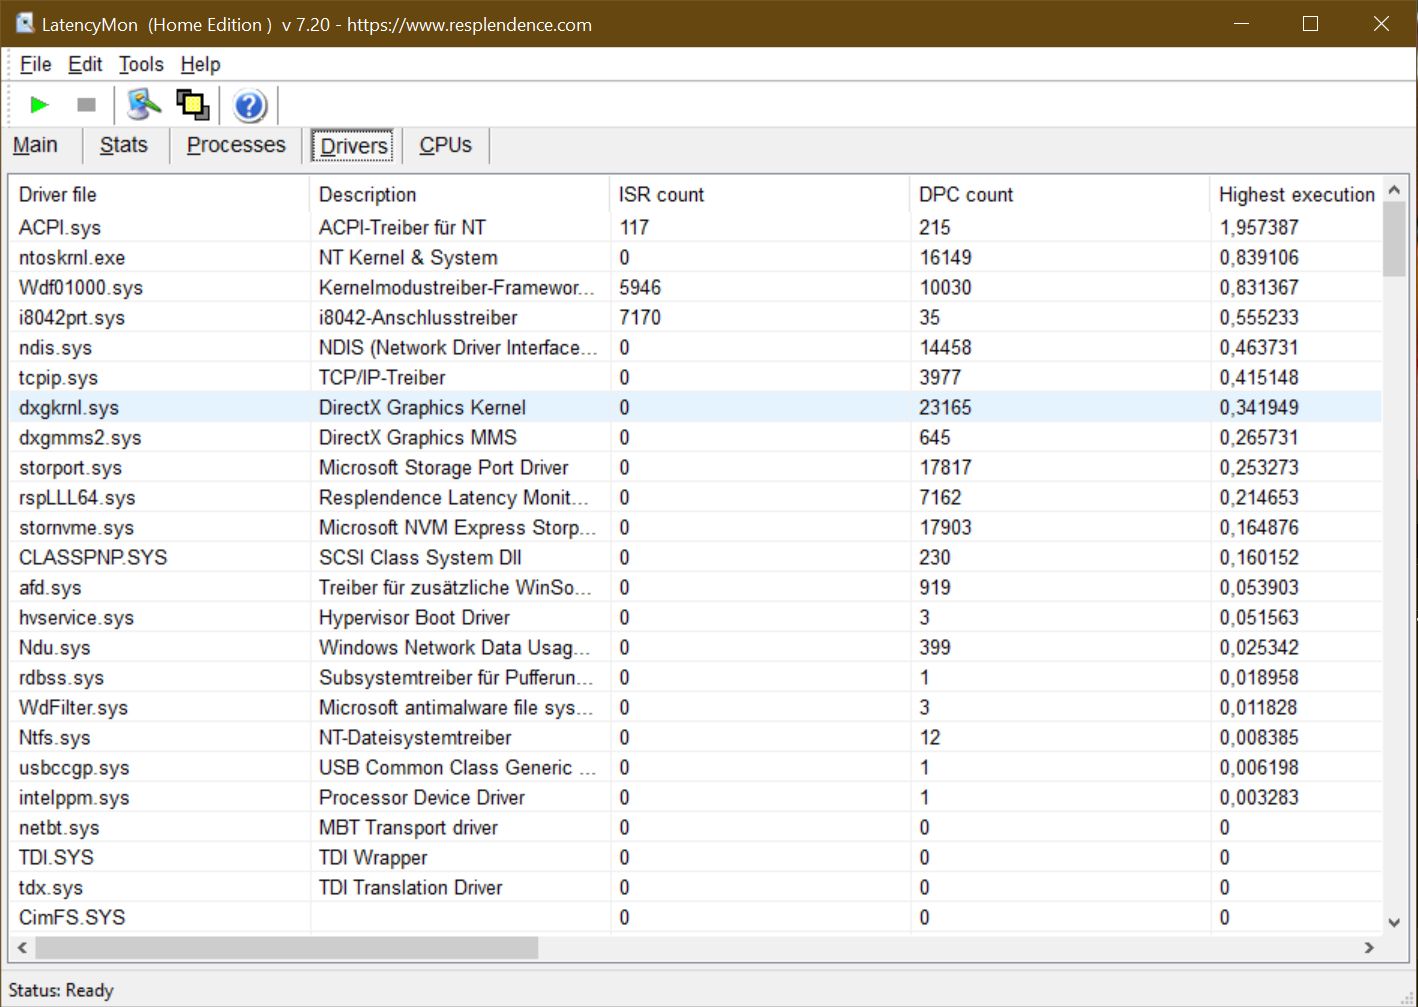
DPC延时
| DPC Latencies / LatencyMon - interrupt to process latency (max), Web, Youtube, Prime95 | |
| Lenovo ThinkPad T14s G2 20WM003TGE | |
| Lenovo ThinkPad X1 Carbon G10 21CC001RGE | |
| HP EliteBook 845 G9 6F6H9EA | |
| Dell Latitude 7420 JW6MH | |
| Lenovo ThinkPad T14s G3 21BR00CDGE | |
| Schenker Vision 14 2022 RTX 3050 Ti | |
* ... smaller is better
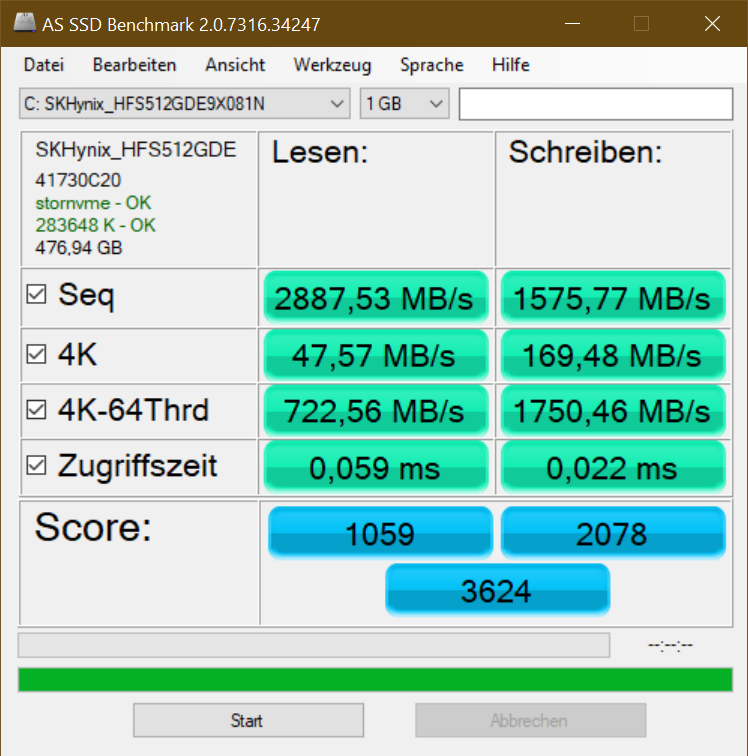
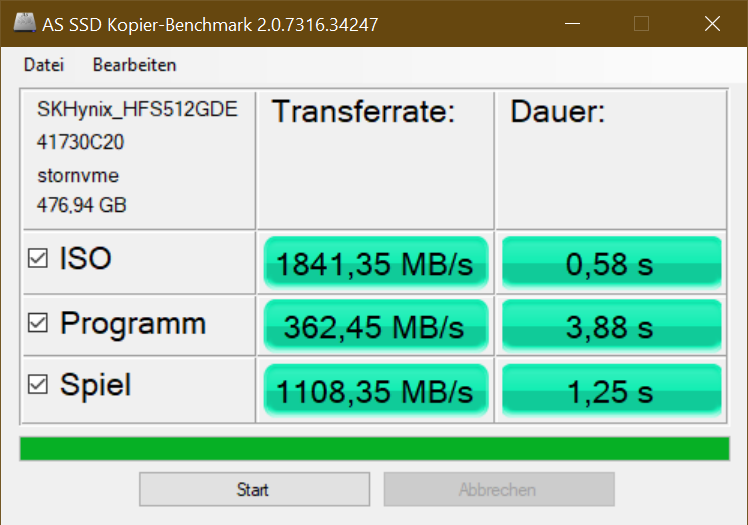
大容量存储
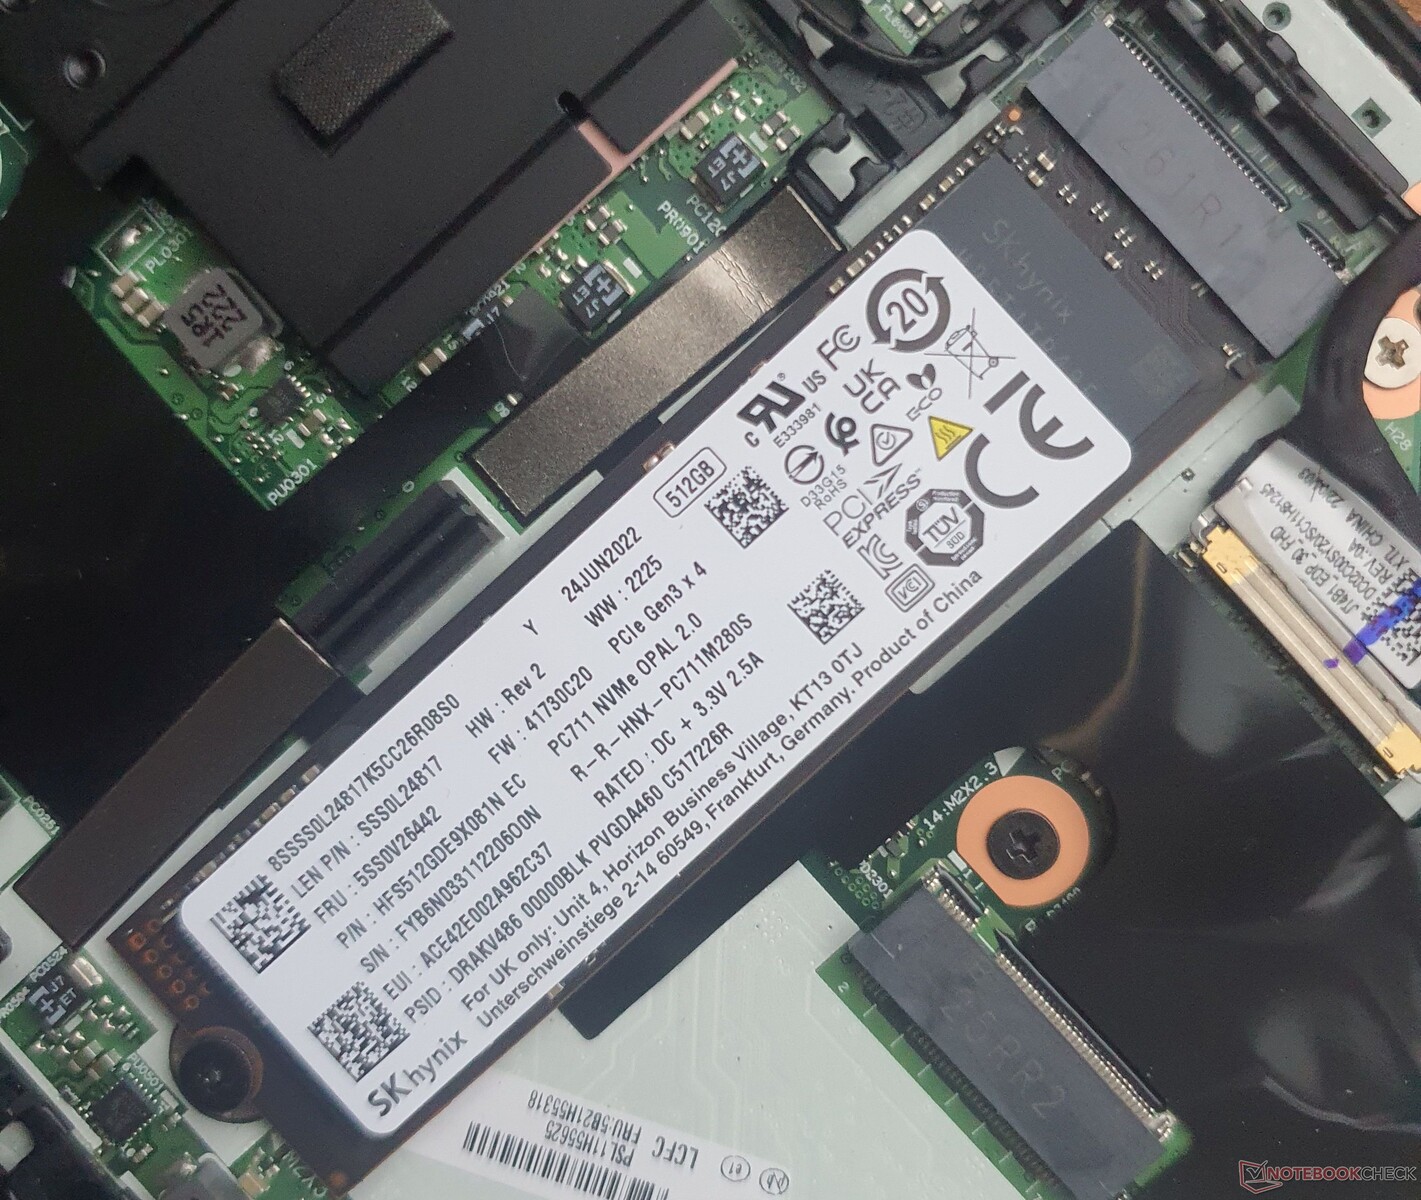
SK Hynix HFS512有大约412GB的自由空间,能够达到与PCIe 3.0固态硬盘相当的传输速度。该硬盘可以在持续负载下保持稳定的速度。但它在处理多达32个4K的读写过程中存在问题--例如,你可能会在服务器中发现这种情况。
三星980 Pro在 申科Vision 14运行速度约为两倍,而惠普EliteBook 845 G9中的PM991 HP EliteBook 845 G9则稍慢一些。
| Lenovo ThinkPad T14s G3 21BR00CDGE SK Hynix HFS512 GDE9X081N | Lenovo ThinkPad T14s G2 20WM003TGE Samsung PM981a MZVLB1T0HBLR | Lenovo ThinkPad T14 G3-21CF004NGE Kioxia BG5 KBG5AZNV512G | Lenovo ThinkPad X1 Carbon G10 21CC001RGE Samsung PM9A1 MZVL2512HCJQ | HP EliteBook 845 G9 6F6H9EA Samsung PM991 MZVLQ512HBLU | Dell Latitude 7420 JW6MH SK Hynix BC711 HFM512GD3HX015N | Schenker Vision 14 2022 RTX 3050 Ti Samsung SSD 980 Pro 1TB MZ-V8P1T0BW | |
|---|---|---|---|---|---|---|---|
| AS SSD | 15% | -28% | 17% | -28% | -12% | 100% | |
| Seq Read (MB/s) | 2888 | 2825 -2% | 2117 -27% | 3577.18 24% | 2472.02 -14% | 2674 -7% | 5315 84% |
| Seq Write (MB/s) | 1576 | 1288 -18% | 1059 -33% | 1503.79 -5% | 1309.38 -17% | 1311 -17% | 3766 139% |
| 4K Read (MB/s) | 48 | 61.2 28% | 51.29 7% | 52.64 10% | 44.98 -6% | 68.4 43% | 80.26 67% |
| 4K Write (MB/s) | 169 | 190.6 13% | 110.24 -35% | 182.62 8% | 118.54 -30% | 183.7 9% | 192.61 14% |
| 4K-64 Read (MB/s) | 723 | 1147 59% | 668.7 -8% | 1751.37 142% | 717.11 -1% | 924 28% | 2478.53 243% |
| 4K-64 Write (MB/s) | 1750 | 1827 4% | 332.54 -81% | 1492.76 -15% | 879.06 -50% | 809 -54% | 3195.52 83% |
| Access Time Read * (ms) | 0.059 | 0.055 7% | 0.067 -14% | 0.065 -10% | 0.093 -58% | 0.075 -27% | 0.022 63% |
| Access Time Write * (ms) | 0.022 | 0.019 14% | 0.035 -59% | 0.023 -5% | 0.033 -50% | 0.031 -41% | 0.022 -0% |
| Score Read (Points) | 1059 | 1491 41% | 932 -12% | 2162 104% | 1009 -5% | 1260 19% | 3090 192% |
| Score Write (Points) | 2078 | 2146 3% | 549 -74% | 1826 -12% | 1129 -46% | 1124 -46% | 3765 81% |
| Score Total (Points) | 3624 | 4336 20% | 1919 -47% | 4991 38% | 2607 -28% | 2980 -18% | 8363 131% |
| Copy ISO MB/s (MB/s) | 1841 | 1682.54 -9% | 1375.59 -25% | 1611 -12% | |||
| Copy Program MB/s (MB/s) | 362 | 402.12 11% | 336.59 -7% | 327 -10% | |||
| Copy Game MB/s (MB/s) | 1108 | 967.5 -13% | 940.22 -15% | 698 -37% | |||
| DiskSpd | 27% | 8% | 172% | -11% | 10% | 217% | |
| seq read (MB/s) | 1889 | 2479 31% | 2449 30% | 4277 126% | 1698 -10% | 2253 19% | 3878 105% |
| seq write (MB/s) | 1875 | 1896 1% | 2052 9% | 3968 112% | 1513 -19% | 1791 -4% | 4000 113% |
| seq q8 t1 read (MB/s) | 3567 | 3555 0% | 2836 -20% | 6588 85% | 2955 -17% | 3547 -1% | 6876 93% |
| seq q8 t1 write (MB/s) | 3150 | 2965 -6% | 2752 -13% | 4805 53% | 1632 -48% | 2519 -20% | 4970 58% |
| 4k q1 t1 read (MB/s) | 53.9 | 65.1 21% | 54.1 0% | 71.2 32% | 44.9 -17% | 64 19% | 88.6 64% |
| 4k q1 t1 write (MB/s) | 138.5 | 151 9% | 134.4 -3% | 213 54% | 117.4 -15% | 162 17% | 224 62% |
| 4k q32 t16 read (MB/s) | 667 | 1140 71% | 839 26% | 3241 386% | 784 18% | 648 -3% | 3484 422% |
| 4k q32 t16 write (MB/s) | 278 | 528 90% | 377 36% | 1750 529% | 337 21% | 425 53% | 2554 819% |
| Total Average (Program / Settings) | 21% /
20% | -10% /
-15% | 95% /
73% | -20% /
-21% | -1% /
-4% | 159% /
149% |
* ... smaller is better
* ... smaller is better
Sustained Performance Read: DiskSpd Read Loop, Queue Depth 8
图形卡
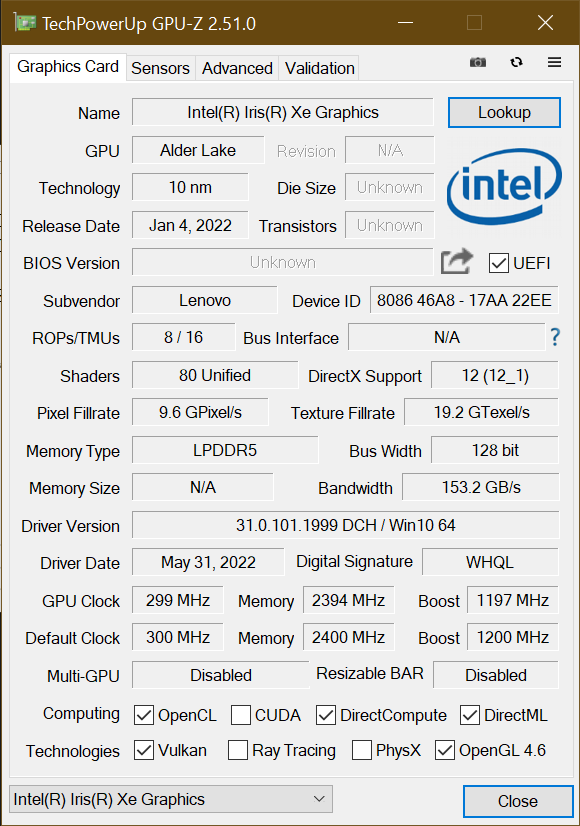
集成的 英特尔Xe G7 (80 EUs)可以访问双通道内存,因此比ThinkPad T16中相同的iGPU运行速度快58%。 笔记本T16的相同iGPU快58%,后者只有单通道内存可供支配。因此,T14s G3至少能够在中等设置下运行旧游戏。
由于ThinkPad T14s在设计时并没有考虑到游戏,所以较新的游戏只能在低设置下在系统上流畅运行,这一点没有问题。拔掉笔记本的插头并不会对图形性能产生负面影响。只有ThinkPad T14 Intel和P14s Intel才有专用显卡。
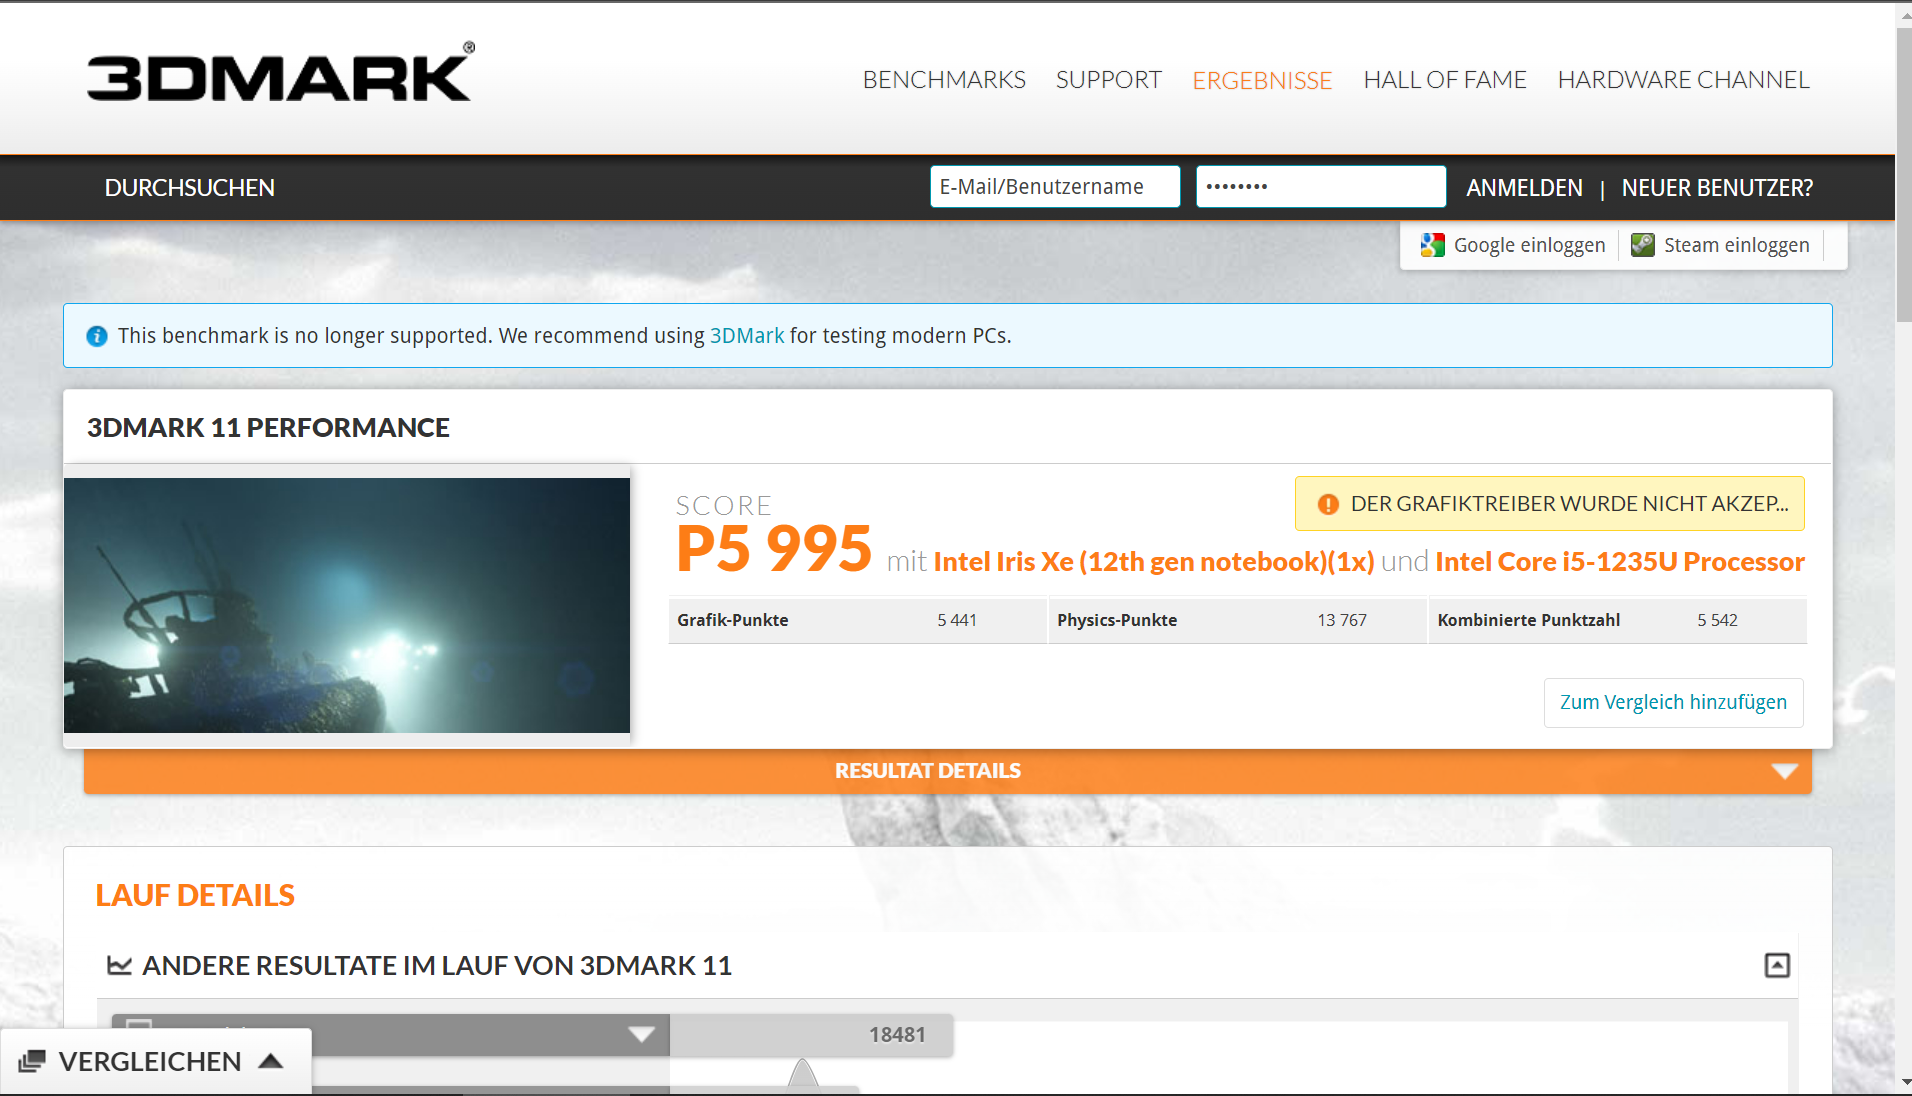
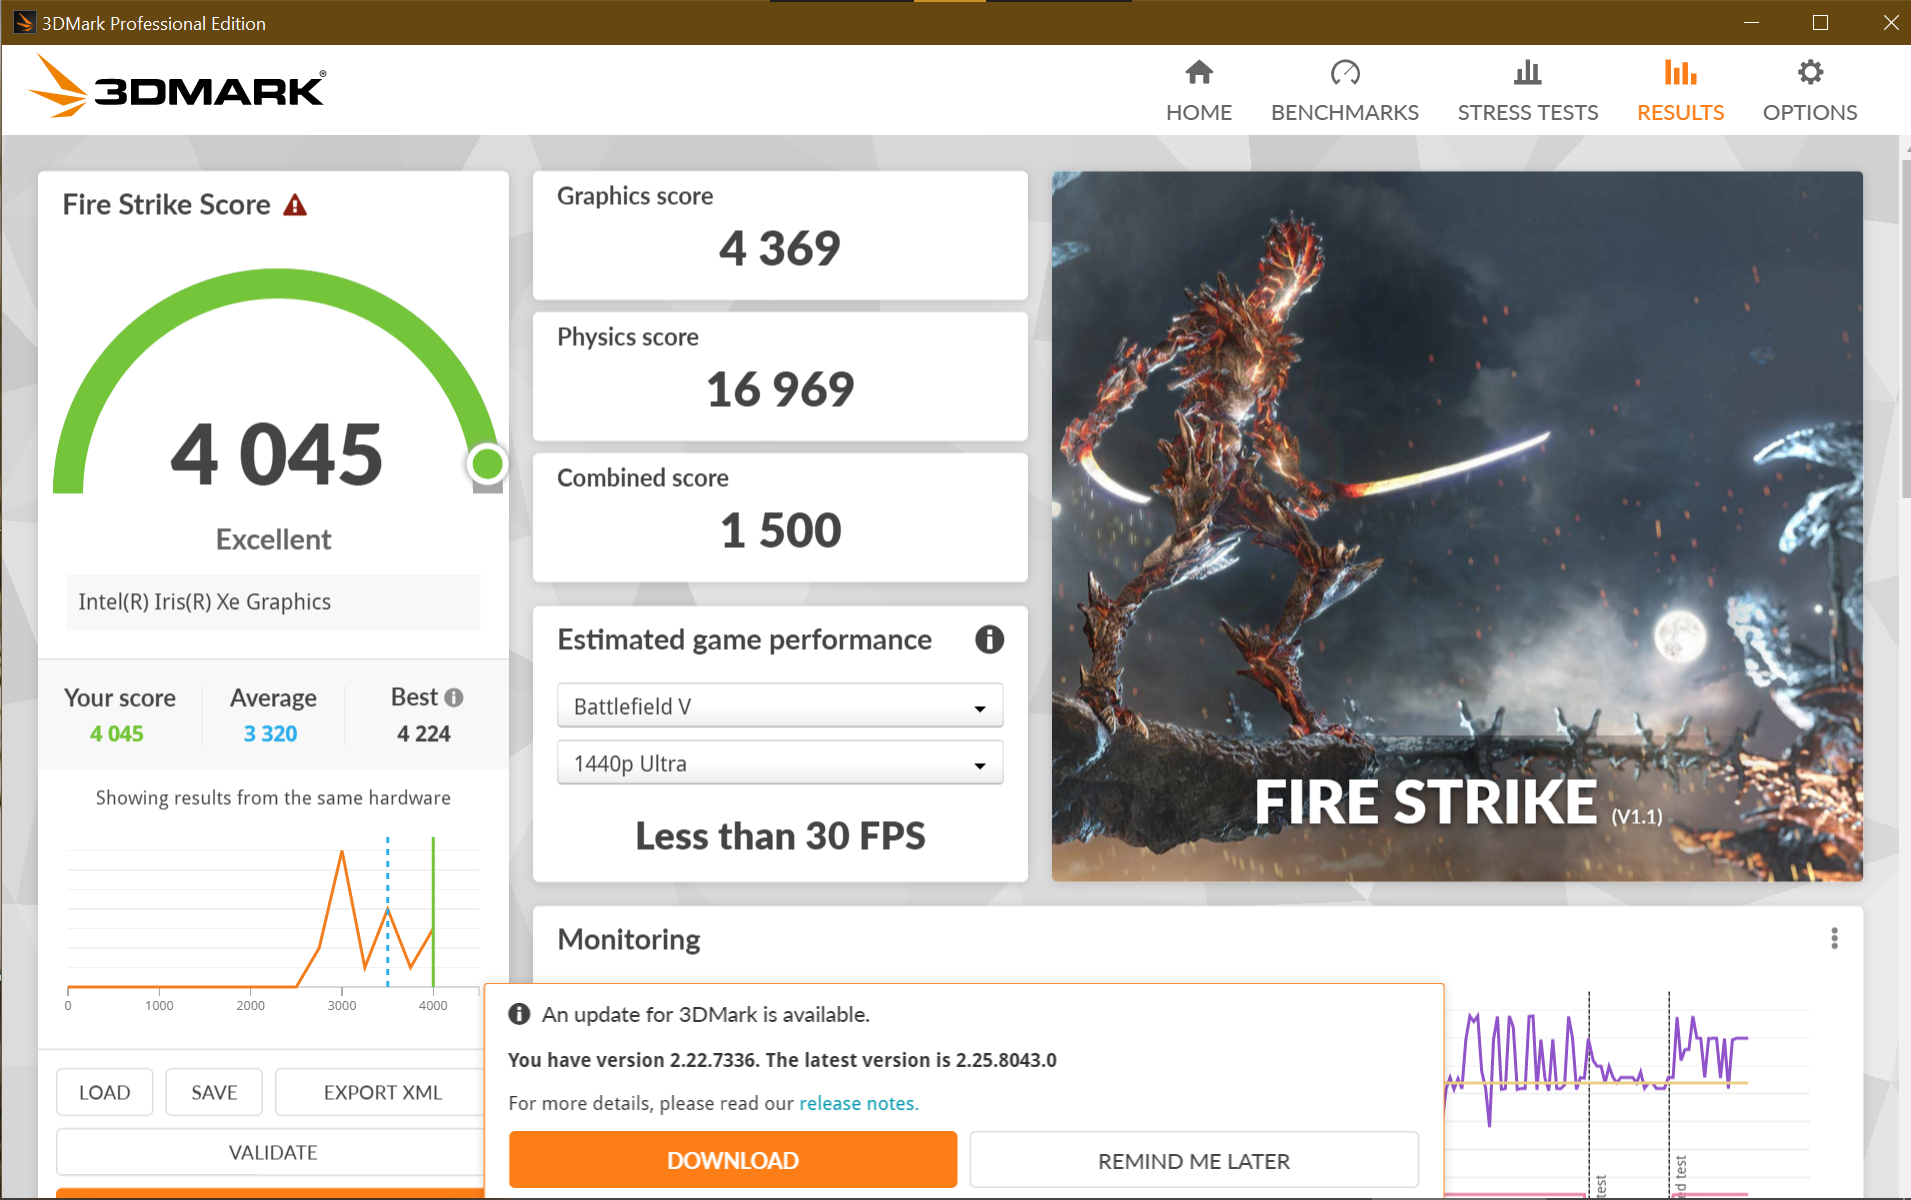
| 3DMark 11 Performance | 5995 points | |
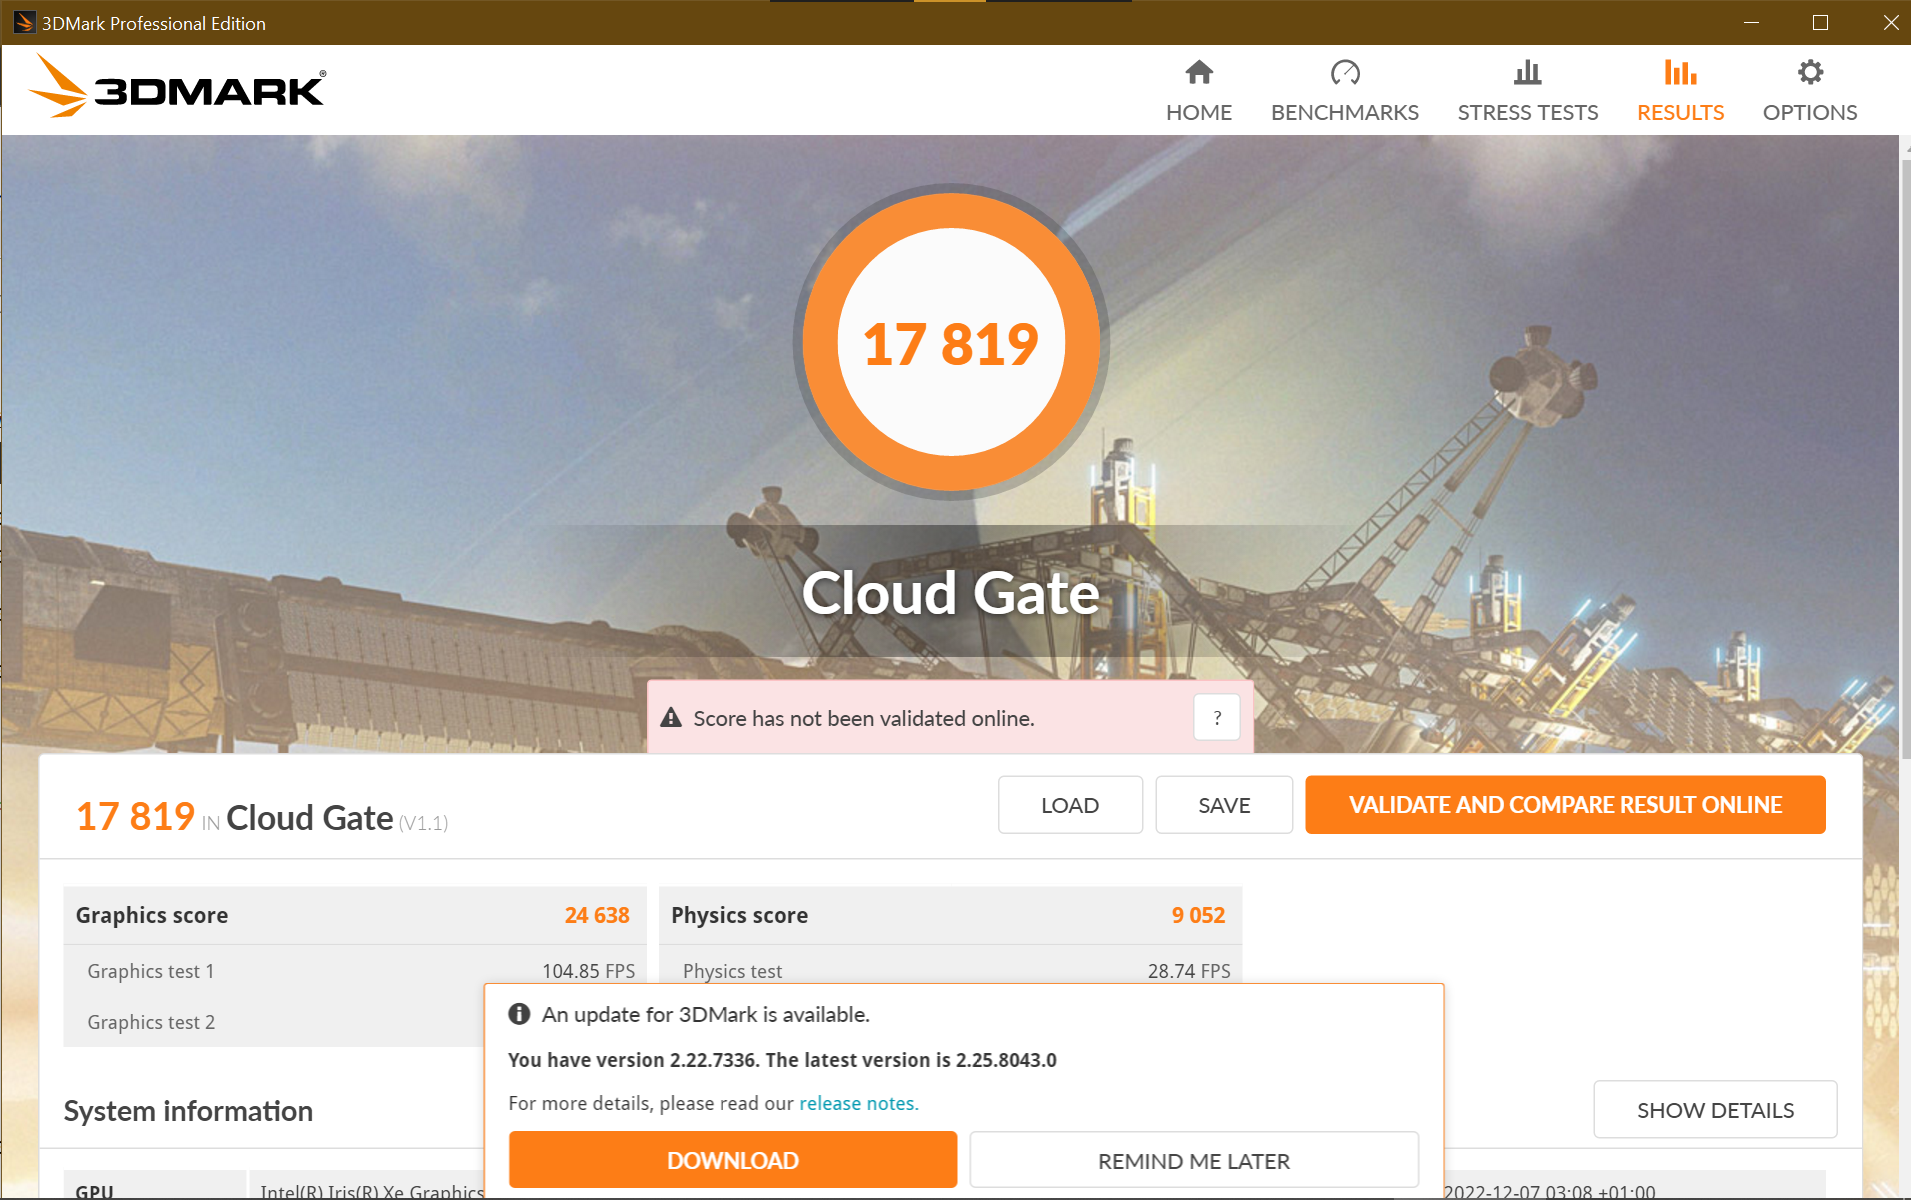
| 3DMark Cloud Gate Standard Score | 17819 points | |
| 3DMark Fire Strike Score | 4045 points | |
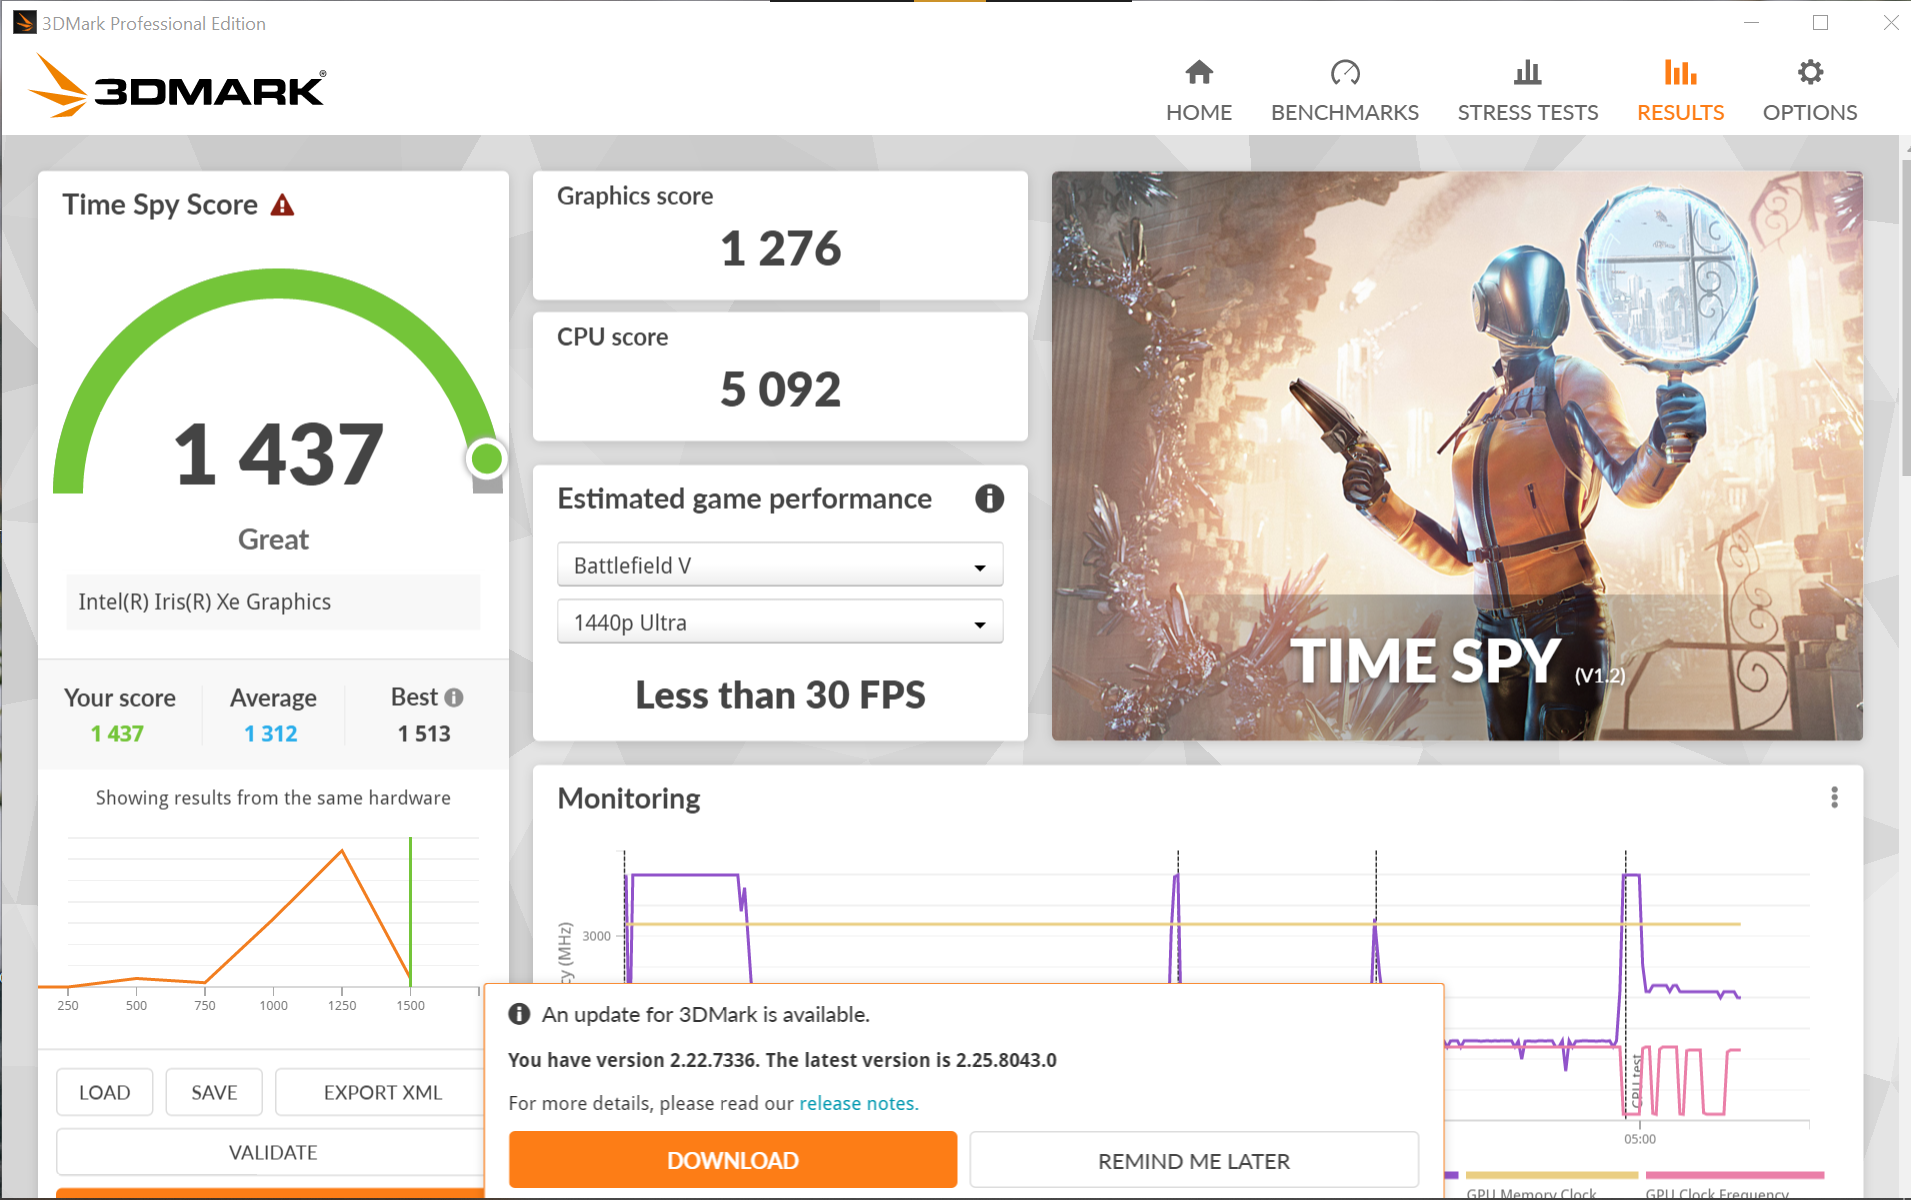
| 3DMark Time Spy Score | 1437 points | |
Help | ||
* ... smaller is better
Witcher 3 FPS chart
| low | med. | high | ultra | |
|---|---|---|---|---|
| GTA V (2015) | 111.8 | 97 | 19.9 | 8.85 |
| The Witcher 3 (2015) | 74.9 | 48.6 | 26.2 | 12.5 |
| Dota 2 Reborn (2015) | 111.8 | 87.2 | 46.9 | 43.3 |
| Final Fantasy XV Benchmark (2018) | 39.5 | 20.7 | 14.6 | |
| X-Plane 11.11 (2018) | 51.2 | 34.6 | 30.8 | |
| Far Cry 5 (2018) | 43 | 25 | 23 | 21 |
| Strange Brigade (2018) | 70.3 | 30.7 | 24.1 | 19.7 |
| Shadow of the Tomb Raider (2018) | 42 | 21 | 21 | 18 |
| GRID Legends (2022) | 45 | 35.6 | 25.7 | 20 |
ThinkPad T14s G3的低排放
噪声排放
联想笔记本电脑在空闲时是完全无声的。当你用几个打开的标签浏览网页以及在设备上进行多任务处理时,情况往往也是如此,尽管设备有时也会产生轻微的耳语(根据我们的测量,最高可达26 dB(A))。但一旦在Windows中启用 "更好的性能 "模式,你就听不到任何声音了。
即使在CPU高负荷的情况下,这款笔记本仍然出奇地安静。我们测得的最大噪音水平只有36 dB(A),这发生在笔记本处于综合负荷的情况下(如游戏)。这仍然是相当安静的,但风扇产生的较高频率是明显的,可能会有些烦人。我们的评测单位没有发出任何线圈的啸叫。
Noise level
| Idle |
| 24.6 / 24.6 / 24.6 dB(A) |
| Load |
| 26.1 / 36.3 dB(A) |
 | ||
30 dB silent 40 dB(A) audible 50 dB(A) loud |
||
min: | ||
| Lenovo ThinkPad T14s G3 21BR00CDGE Iris Xe G7 80EUs, i5-1235U, SK Hynix HFS512 GDE9X081N | Lenovo ThinkPad T14s G2 20WM003TGE Iris Xe G7 96EUs, i7-1165G7, Samsung PM981a MZVLB1T0HBLR | Lenovo ThinkPad T14 G3-21CF004NGE Radeon 680M, R7 PRO 6850U, Kioxia BG5 KBG5AZNV512G | Lenovo ThinkPad X13 G3 21BN0046GE Iris Xe G7 80EUs, i5-1235U, SK Hynix HFS512 GDE9X081N | Lenovo ThinkPad X1 Carbon G10 21CC001RGE Iris Xe G7 80EUs, i5-1250P, Samsung PM9A1 MZVL2512HCJQ | HP EliteBook 845 G9 6F6H9EA Radeon 660M, R5 PRO 6650U, Samsung PM991 MZVLQ512HBLU | Dell Latitude 7420 JW6MH Iris Xe G7 80EUs, i5-1145G7, SK Hynix BC711 HFM512GD3HX015N | Schenker Vision 14 2022 RTX 3050 Ti GeForce RTX 3050 Ti Laptop GPU, i7-12700H, Samsung SSD 980 Pro 1TB MZ-V8P1T0BW | |
|---|---|---|---|---|---|---|---|---|
| Noise | -6% | -3% | -2% | 1% | -6% | -18% | -21% | |
| off / environment * (dB) | 24.6 | 24.81 -1% | 24.2 2% | 24.6 -0% | 22.81 7% | 24 2% | 25.3 -3% | 24.4 1% |
| Idle Minimum * (dB) | 24.6 | 24.81 -1% | 24.2 2% | 24.6 -0% | 22.81 7% | 24 2% | 25.3 -3% | 24.4 1% |
| Idle Average * (dB) | 24.6 | 24.81 -1% | 24.2 2% | 24.6 -0% | 22.81 7% | 25 -2% | 25.3 -3% | 24.4 1% |
| Idle Maximum * (dB) | 24.6 | 24.81 -1% | 25.8 -5% | 25.9 -5% | 22.81 7% | 26 -6% | 25.3 -3% | 27.8 -13% |
| Load Average * (dB) | 26.1 | 35.14 -35% | 32.2 -23% | 30.7 -18% | 31.59 -21% | 34 -30% | 44.9 -72% | 43.3 -66% |
| Witcher 3 ultra * (dB) | 35.9 | 34.1 5% | 34.6 4% | 35.59 1% | 38 -6% | 48.2 -34% | ||
| Load Maximum * (dB) | 36.3 | 35.14 3% | 38.8 -7% | 34.6 5% | 35.47 2% | 38 -5% | 44.9 -24% | 48.8 -34% |
* ... smaller is better
温度
装备了ThinkPad T14s的 英特尔酷睿i5-1235U即使在满载的情况下也能保持非常凉爽。这台 ThinkPad X13 G3采用相同的主板,也同样取得了良好的效果。相比之下,更厚的 ThinkPad T14 G3尽管有第二根热管,但配备AMD Ryzen 7的ThinkPad T14 G3的温度要高10°C(50°F)左右,达到了52.5°C(126.5°F)。
(±) The maximum temperature on the upper side is 43.6 °C / 110 F, compared to the average of 34.3 °C / 94 F, ranging from 21.2 to 62.5 °C for the class Office.
(±) The bottom heats up to a maximum of 42 °C / 108 F, compared to the average of 36.8 °C / 98 F
(+) In idle usage, the average temperature for the upper side is 26.4 °C / 80 F, compared to the device average of 29.5 °C / 85 F.
(+) Playing The Witcher 3, the average temperature for the upper side is 28.9 °C / 84 F, compared to the device average of 29.5 °C / 85 F.
(+) The palmrests and touchpad are cooler than skin temperature with a maximum of 27.1 °C / 80.8 F and are therefore cool to the touch.
(±) The average temperature of the palmrest area of similar devices was 27.6 °C / 81.7 F (+0.5 °C / 0.9 F).
| Lenovo ThinkPad T14s G3 21BR00CDGE Intel Core i5-1235U, Intel Iris Xe Graphics G7 80EUs | Lenovo ThinkPad T14s G2 20WM003TGE Intel Core i7-1165G7, Intel Iris Xe Graphics G7 96EUs | Lenovo ThinkPad T14 G3-21CF004NGE AMD Ryzen 7 PRO 6850U, AMD Radeon 680M | Lenovo ThinkPad X13 G3 21BN0046GE Intel Core i5-1235U, Intel Iris Xe Graphics G7 80EUs | Lenovo ThinkPad T16 G1 21BWS00200 Intel Core i5-1240P, Intel Iris Xe Graphics G7 80EUs | Lenovo ThinkPad X1 Carbon G10 21CC001RGE Intel Core i5-1250P, Intel Iris Xe Graphics G7 80EUs | HP EliteBook 845 G9 6F6H9EA AMD Ryzen 5 PRO 6650U, AMD Radeon 660M | Dell Latitude 7420 JW6MH Intel Core i5-1145G7, Intel Iris Xe Graphics G7 80EUs | Schenker Vision 14 2022 RTX 3050 Ti Intel Core i7-12700H, NVIDIA GeForce RTX 3050 Ti Laptop GPU | |
|---|---|---|---|---|---|---|---|---|---|
| Heat | -3% | -2% | -7% | -10% | -9% | 1% | 7% | -12% | |
| Maximum Upper Side * (°C) | 43.6 | 47.5 -9% | 48.2 -11% | 45.3 -4% | 45 -3% | 45 -3% | 44 -1% | 37.1 15% | 48.4 -11% |
| Maximum Bottom * (°C) | 42 | 43.4 -3% | 52.8 -26% | 41.8 -0% | 42.8 -2% | 44 -5% | 45 -7% | 38.7 8% | 57.1 -36% |
| Idle Upper Side * (°C) | 28.1 | 28.4 -1% | 24.4 13% | 31.6 -12% | 33 -17% | 31.2 -11% | 27 4% | 27.3 3% | 28.1 -0% |
| Idle Bottom * (°C) | 28.9 | 28.3 2% | 24.5 15% | 32.6 -13% | 33.6 -16% | 33.2 -15% | 27 7% | 28.1 3% | 29 -0% |
* ... smaller is better
压力测试
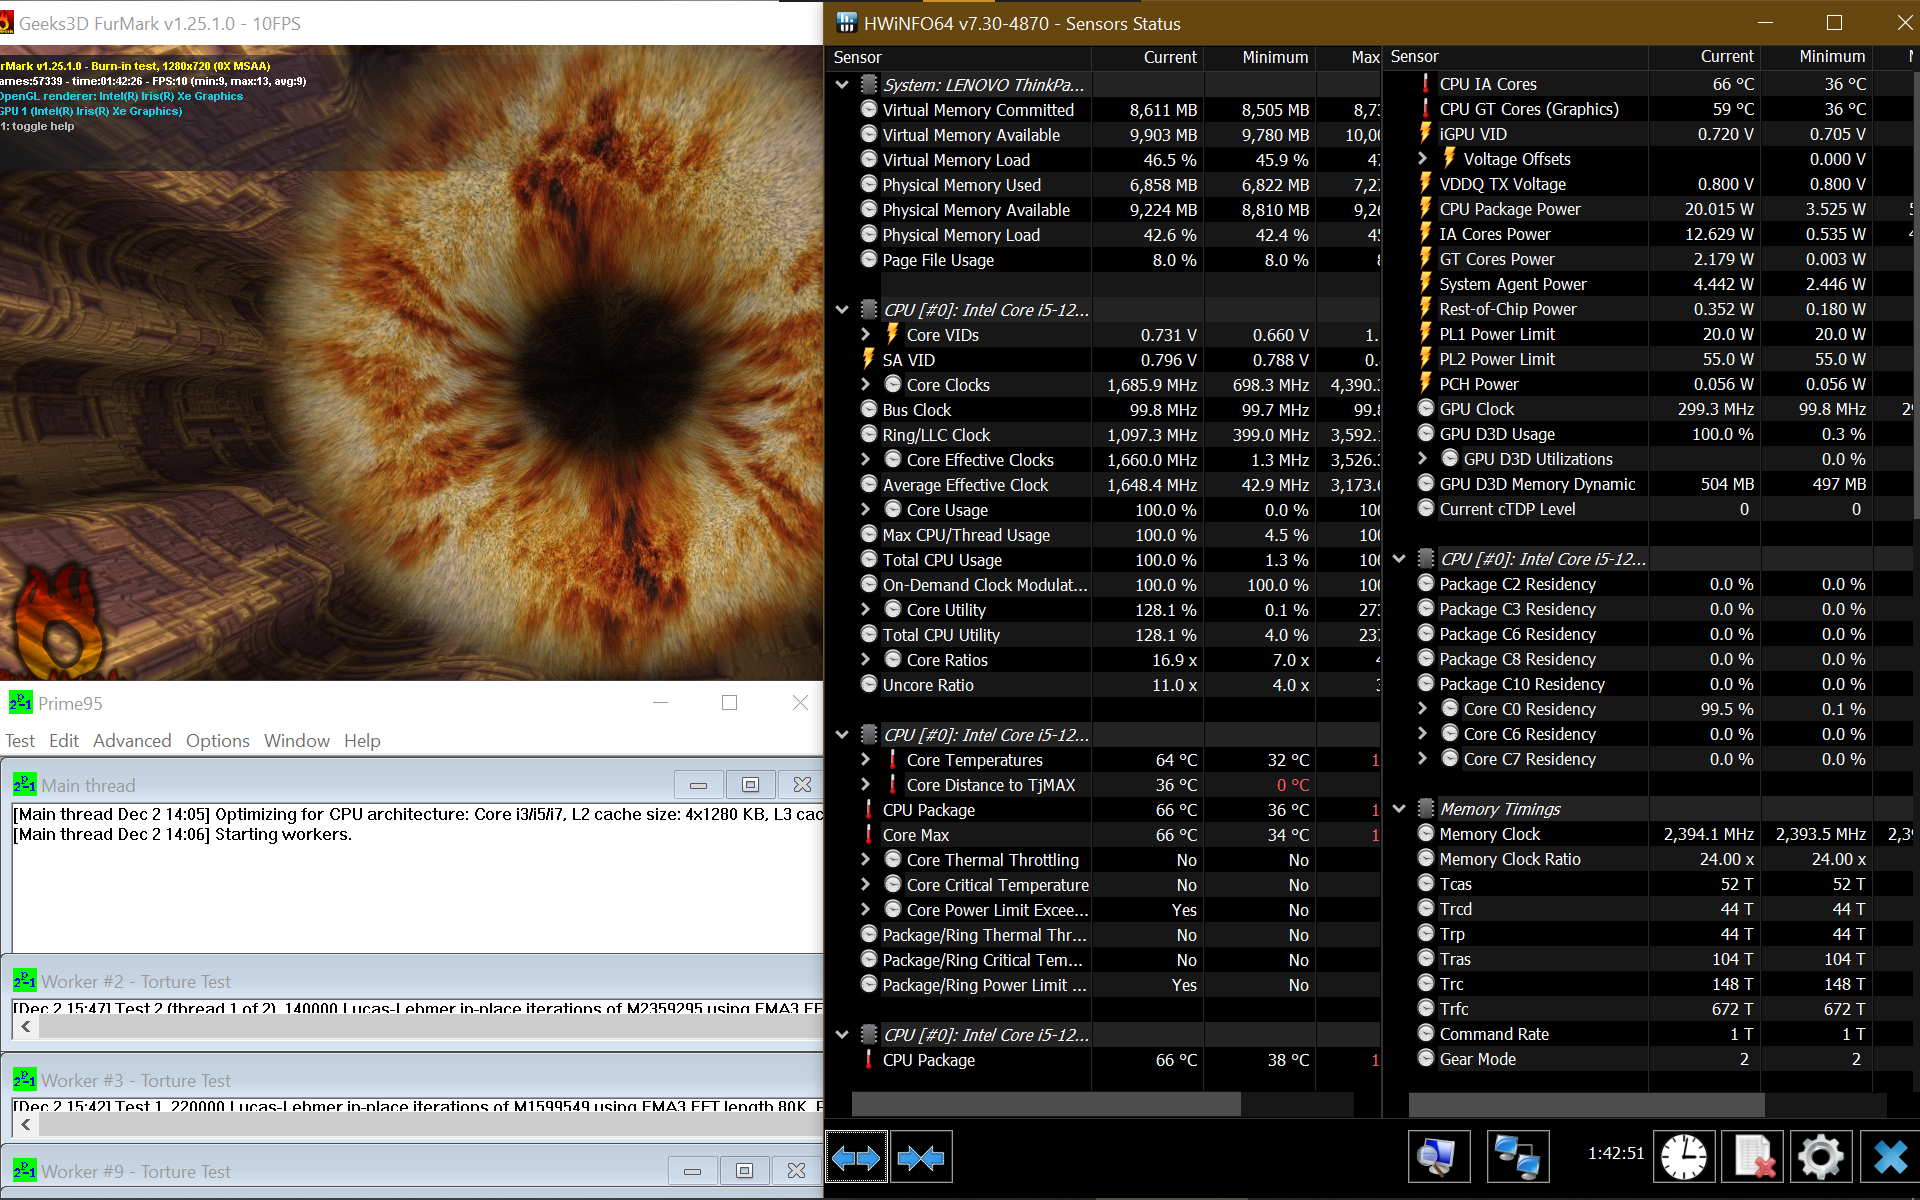
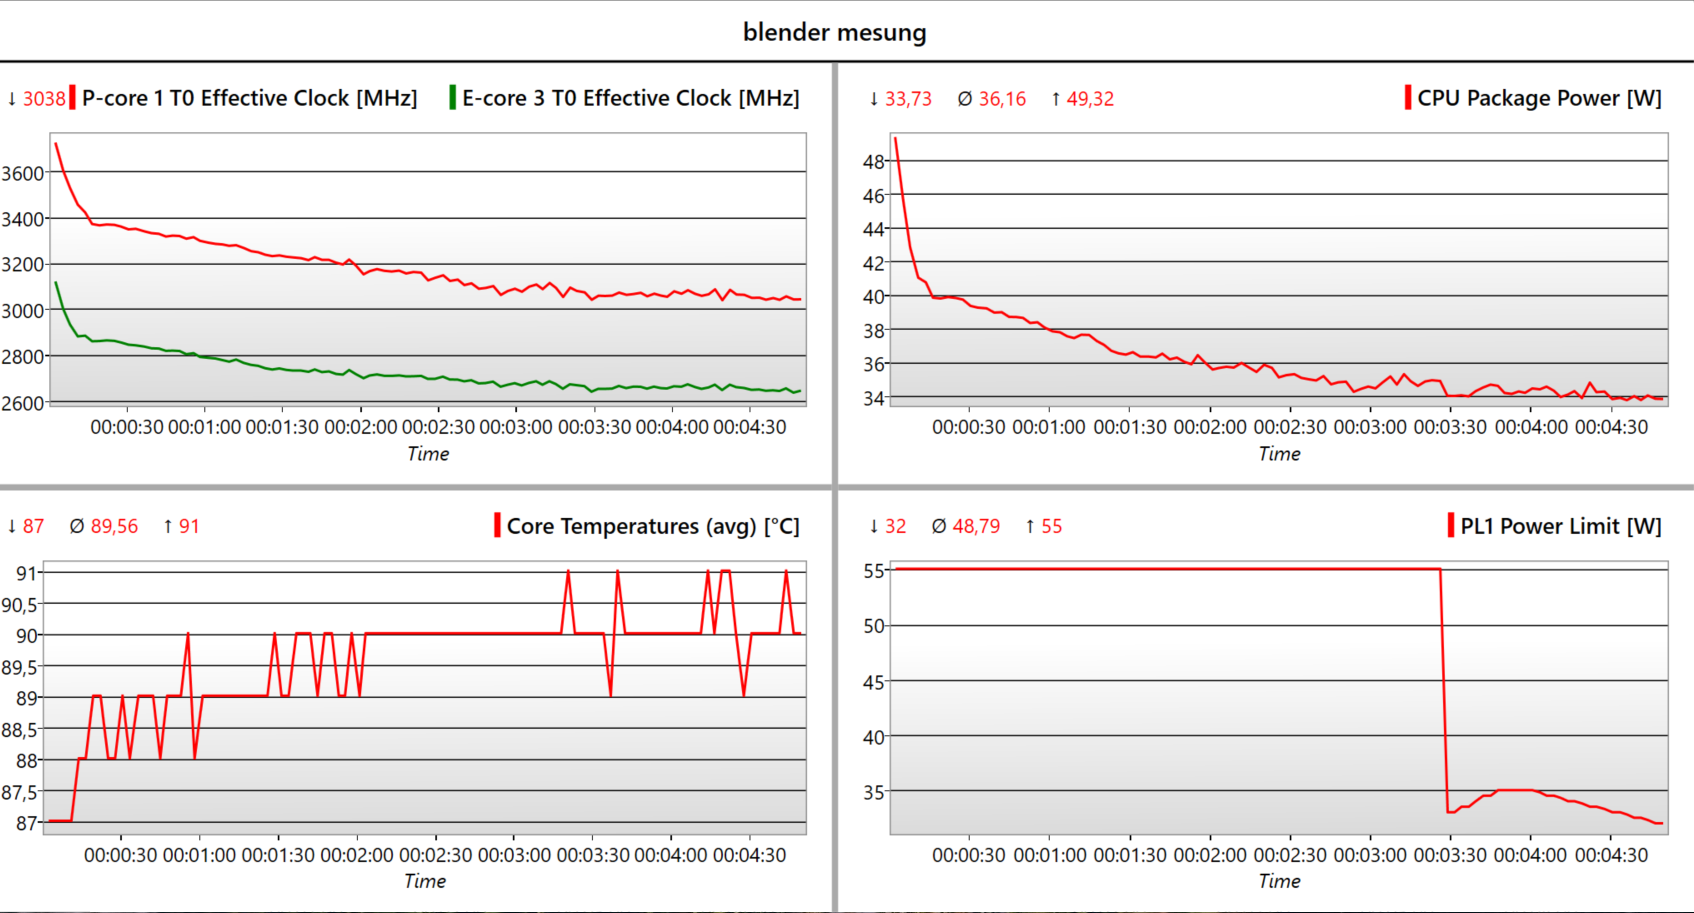
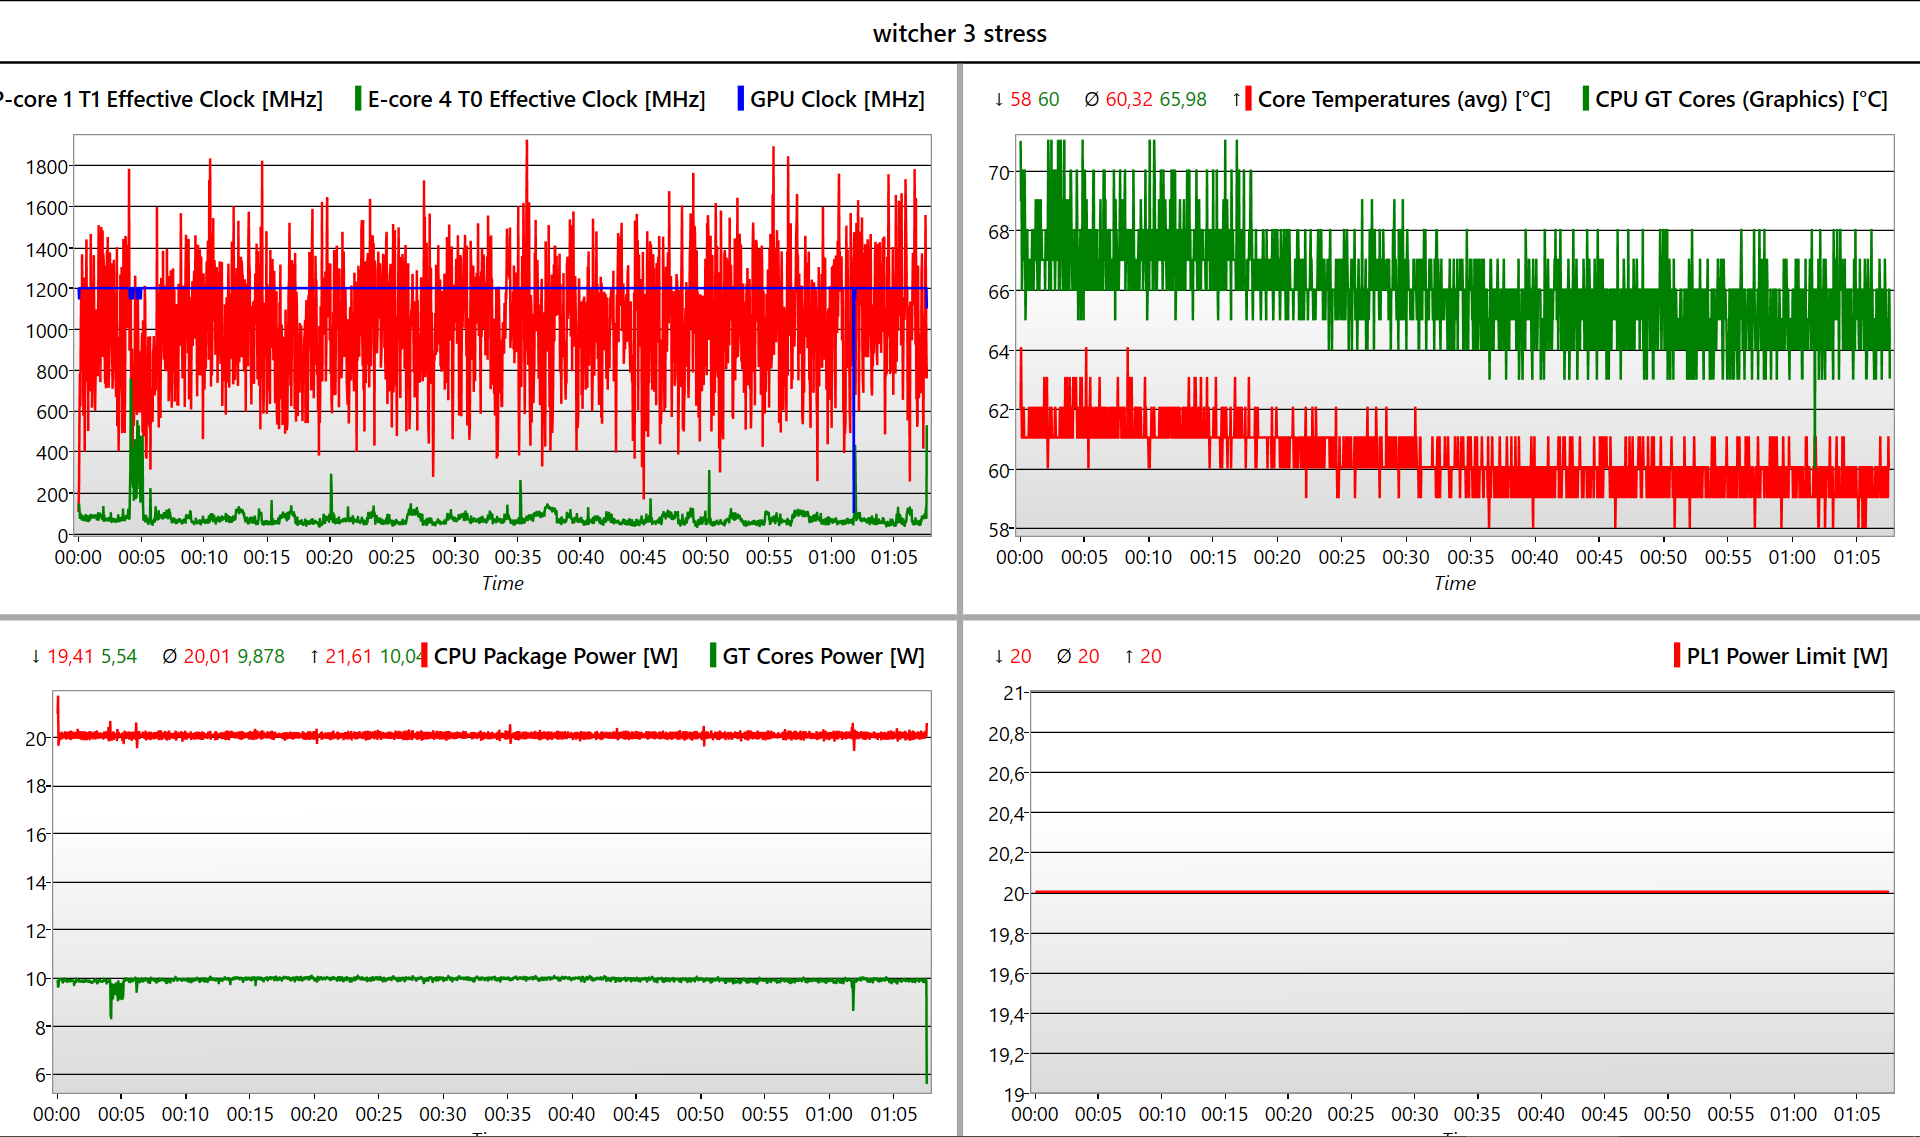
在综合负载(Prime95 + FurMark)下,P-cores在大约6分钟后将其时钟速度从3 GHz降至约1.5 GHz,这仍然高于其1.3 GHz的基本时钟。这随后导致核心温度从95°C下降到稳定的64°C(203°F到147°F)。iGPU只运行在300MHz和58°C(136°F),而不是完整的1,300MHz。
在纯粹的CPU负载下,P-cores在2GHz和2.5GHz之间波动。在Witcher 3 的压力测试中,iGPU运行在1200MHz(仅比其最大时钟低100MHz),其温度稳定在65℃(149℉)。
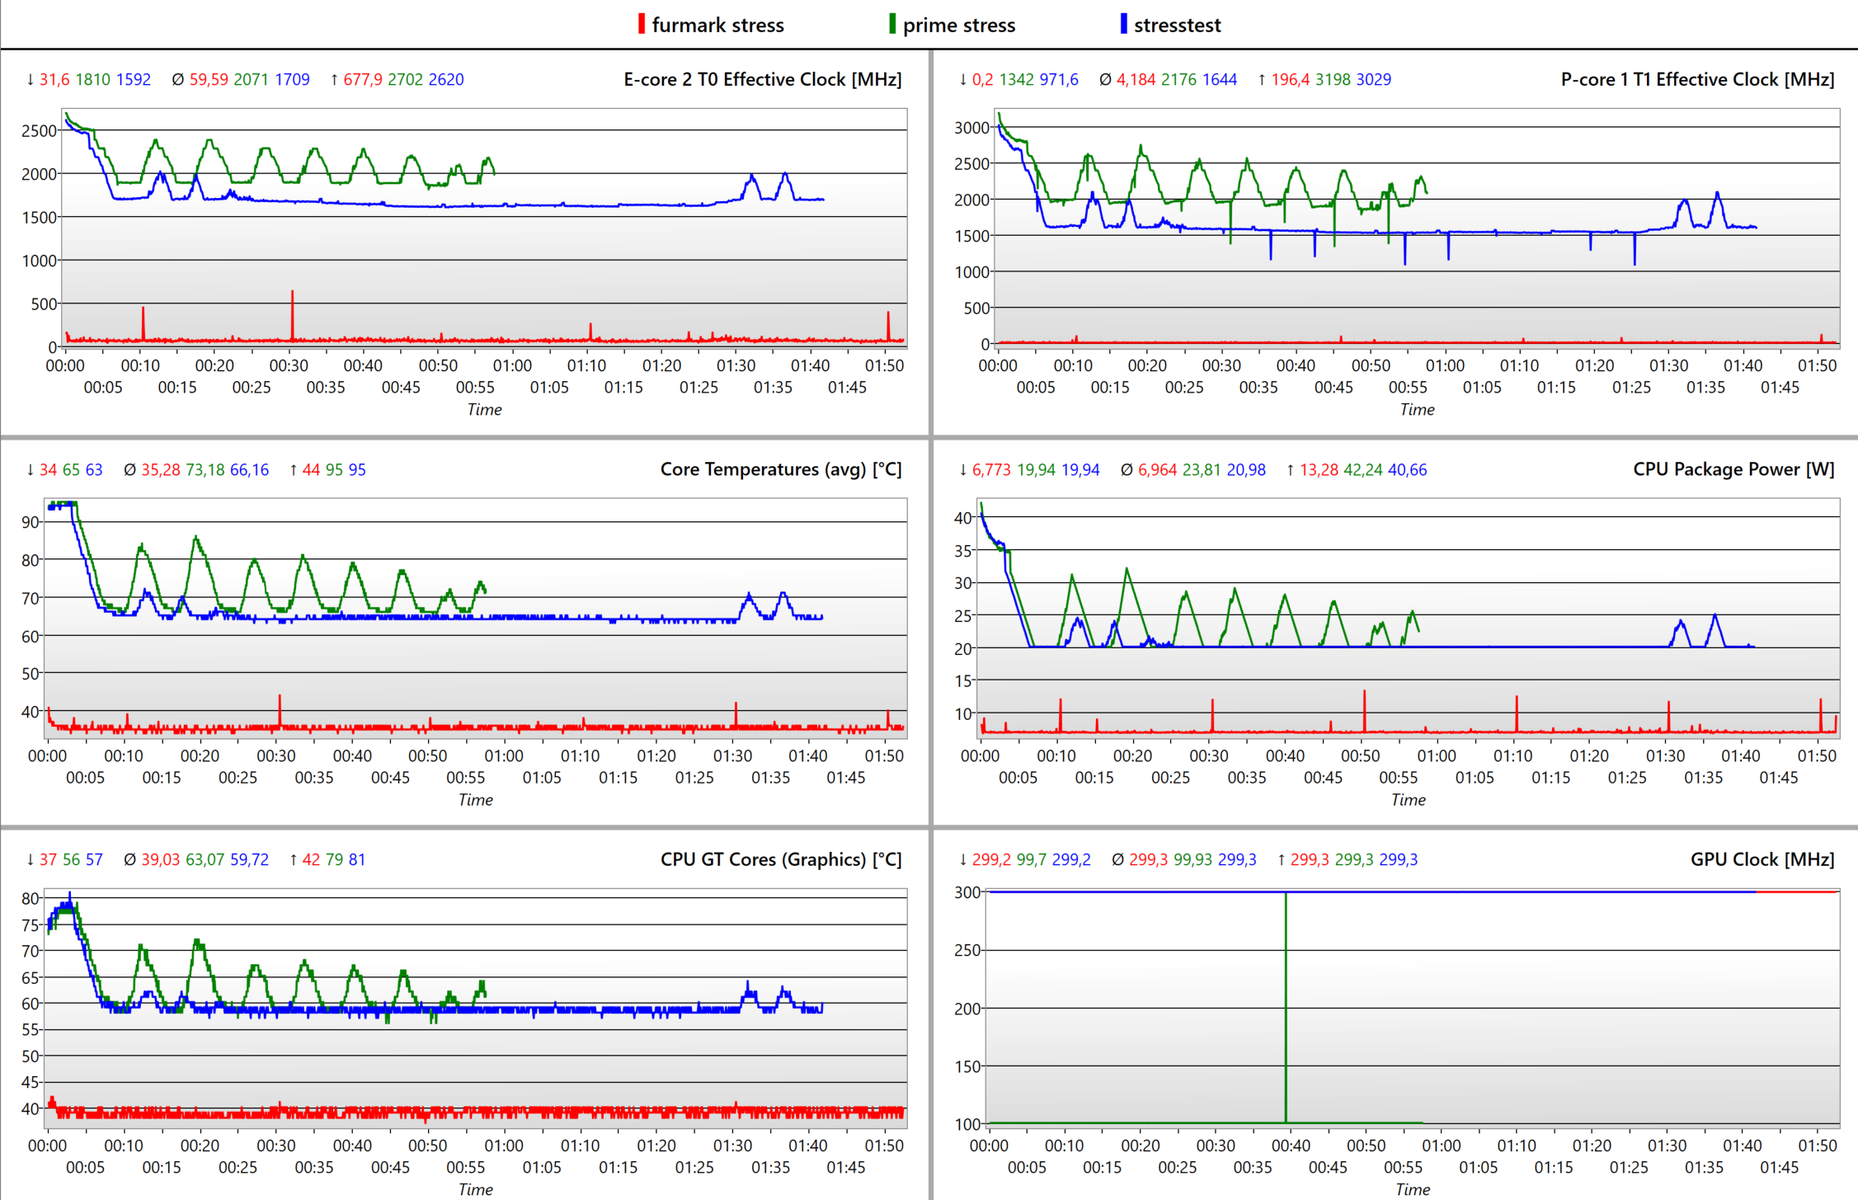
| CPU时钟(GHz) | GPU时钟(MHz) | CPU平均温度(℃) | GPU平均温度(℃) | |
| 系统空闲 | 0.04 | 100 | 27 | 31 |
| Prime95压力 | 2 - 2.5 | 100 | 73 | 63 |
| Prime95 + FurMark 压力 | 1.5 | 300 | 65 | 60 |
| Witcher 3 应力 | 0.9 | 1,200 | 60 | 65 |
发言人
联想已经改进了整个T系列的扬声器。T14s G3上的扬声器已经与ThinkPad X1 Carbon上的相当相似。中音和高音听起来很平衡,而且非常线性,但低音照旧缺乏。根据我们的测量,它们可以达到75dB(A)--响亮到足以填满一个普通大小的房间。这就是说,如果你想享受音乐,你应该使用外部音响系统或一副耳机(通过蓝牙或音频插孔)。
Lenovo ThinkPad T14s G3 21BR00CDGE audio analysis
(±) | speaker loudness is average but good (75.35 dB)
Bass 100 - 315 Hz
(-) | nearly no bass - on average 17.4% lower than median
(±) | linearity of bass is average (12.2% delta to prev. frequency)
Mids 400 - 2000 Hz
(+) | balanced mids - only 2.9% away from median
(+) | mids are linear (5.5% delta to prev. frequency)
Highs 2 - 16 kHz
(+) | balanced highs - only 2.1% away from median
(+) | highs are linear (6.8% delta to prev. frequency)
Overall 100 - 16.000 Hz
(±) | linearity of overall sound is average (16% difference to median)
Compared to same class
» 19% of all tested devices in this class were better, 6% similar, 76% worse
» The best had a delta of 7%, average was 21%, worst was 53%
Compared to all devices tested
» 25% of all tested devices were better, 5% similar, 69% worse
» The best had a delta of 4%, average was 23%, worst was 134%
Lenovo ThinkPad T14 G3-21CF004NGE audio analysis
(±) | speaker loudness is average but good (77.2 dB)
Bass 100 - 315 Hz
(-) | nearly no bass - on average 24.6% lower than median
(±) | linearity of bass is average (10.1% delta to prev. frequency)
Mids 400 - 2000 Hz
(+) | balanced mids - only 2.6% away from median
(+) | mids are linear (4.6% delta to prev. frequency)
Highs 2 - 16 kHz
(+) | balanced highs - only 3.3% away from median
(+) | highs are linear (3.8% delta to prev. frequency)
Overall 100 - 16.000 Hz
(±) | linearity of overall sound is average (18.8% difference to median)
Compared to same class
» 35% of all tested devices in this class were better, 7% similar, 58% worse
» The best had a delta of 7%, average was 21%, worst was 53%
Compared to all devices tested
» 44% of all tested devices were better, 8% similar, 49% worse
» The best had a delta of 4%, average was 23%, worst was 134%
电源管理。ThinkPad T14s G3采用了英特尔的技术,非常高效。
消耗功率
装备了ThinkPad T14s G3的 英特尔酷睿i5-1235U给我们提供了对比组中最低的功率使用测量值:在空闲状态下,它的平均功率为4.6瓦,最多为5.6瓦。这台 ThinkPad T14 AMD相比之下,需要的功率略高。附带的65W充电器只在综合压力测试中被推到极限--这种情况在日常使用中不太可能发生。即使如此,这也没有造成任何问题。
| Off / Standby | |
| Idle | |
| Load |
|
Key:
min: | |
| Lenovo ThinkPad T14s G3 21BR00CDGE i5-1235U, Iris Xe G7 80EUs, SK Hynix HFS512 GDE9X081N, IPS LED, 1920x1200, 14" | Lenovo ThinkPad T14s G2 20WM003TGE i7-1165G7, Iris Xe G7 96EUs, Samsung PM981a MZVLB1T0HBLR, IPS LED, 1920x1080, 14" | Lenovo ThinkPad T14 G3-21CF004NGE R7 PRO 6850U, Radeon 680M, Kioxia BG5 KBG5AZNV512G, IPS, 1920x1200, 14" | Lenovo ThinkPad X13 G3 21BN0046GE i5-1235U, Iris Xe G7 80EUs, SK Hynix HFS512 GDE9X081N, IPS Grade, 1920x1200, 13.3" | Lenovo ThinkPad T16 G1 21BWS00200 i5-1240P, Iris Xe G7 80EUs, Samsung PM9A1 MZVL2512HCJQ, IPS, 1920x1200, 16" | Lenovo ThinkPad X1 Carbon G10 21CC001RGE i5-1250P, Iris Xe G7 80EUs, Samsung PM9A1 MZVL2512HCJQ, IPS LED, 1920x1200, 14" | HP EliteBook 845 G9 6F6H9EA R5 PRO 6650U, Radeon 660M, Samsung PM991 MZVLQ512HBLU, IPS, 1920x1200, 14" | Dell Latitude 7420 JW6MH i5-1145G7, Iris Xe G7 80EUs, SK Hynix BC711 HFM512GD3HX015N, IPS, 1920x1080, 14" | Schenker Vision 14 2022 RTX 3050 Ti i7-12700H, GeForce RTX 3050 Ti Laptop GPU, Samsung SSD 980 Pro 1TB MZ-V8P1T0BW, IPS, 2880x1800, 14" | |
|---|---|---|---|---|---|---|---|---|---|
| Power Consumption | -7% | -6% | -12% | -18% | -5% | -14% | -14% | -139% | |
| Idle Minimum * (Watt) | 2.3 | 2.2 4% | 2.4 -4% | 2.7 -17% | 2.9 -26% | 2.9 -26% | 3 -30% | 2.7 -17% | 7.5 -226% |
| Idle Average * (Watt) | 4.6 | 5.5 -20% | 5.3 -15% | 5.2 -13% | 6 -30% | 4.9 -7% | 5 -9% | 6 -30% | 10.4 -126% |
| Idle Maximum * (Watt) | 5.6 | 6.1 -9% | 5.6 -0% | 6.2 -11% | 6.9 -23% | 6 -7% | 9 -61% | 7.6 -36% | 11.4 -104% |
| Load Average * (Watt) | 37.1 | 41.3 -11% | 39.7 -7% | 38.4 -4% | 27.3 26% | 29.3 21% | 41 -11% | 37 -0% | 83.3 -125% |
| Witcher 3 ultra * (Watt) | 32.8 | 34.5 -5% | 42.8 -30% | 41.9 -28% | 42.6 -30% | 36.6 -12% | 32.6 1% | 33.2 -1% | 92.7 -183% |
| Load Maximum * (Watt) | 65.8 | 67.3 -2% | 50.6 23% | 66.7 -1% | 81.53 -24% | 63.3 4% | 50 24% | 65 1% | 110.3 -68% |
* ... smaller is better
Power consumption Witcher 3 / Stress test
Power consumption with external monitor
电池寿命
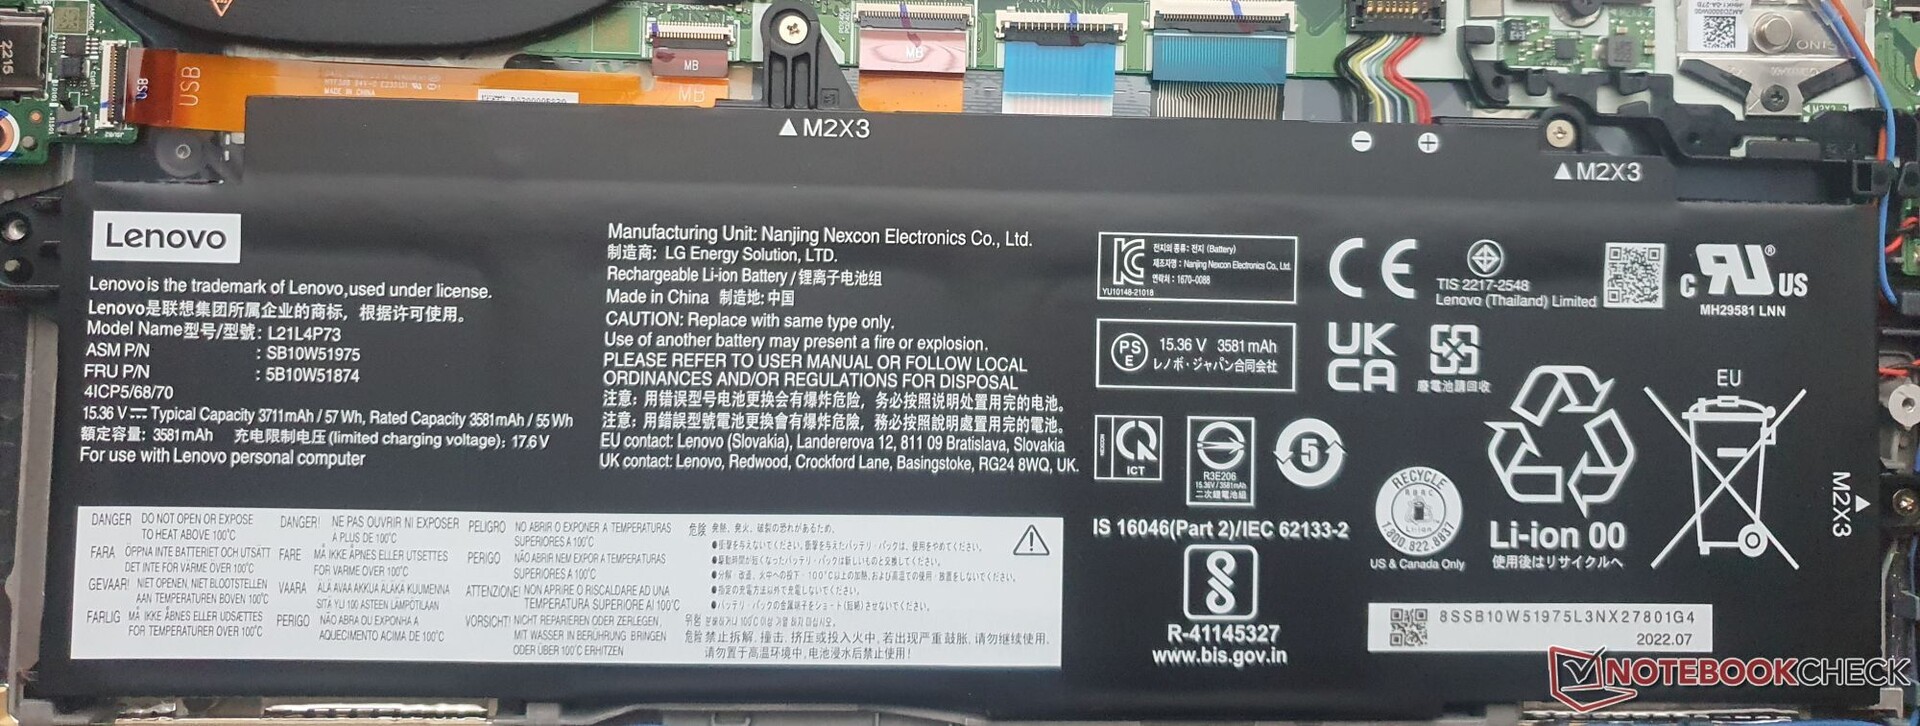
57Wh的电池提供了9小时36分钟的使用时间(通过Wi-Fi上网冲浪),几乎与上一代T14s的使用时间一样。低功耗的FHD+显示屏有助于笔记本电脑实现这一水平的电池寿命。特别是,ThinkPad T14s G3在全屏亮度下仍能坚持8小时以上。给电池充满电大约需要90分钟。
像 惠普EliteBook 845一样, ThinkPad T14 G3 AMD尽管电池体积比T14s G3小10%,但其持续时间却高达34%。T14s在满负荷的情况下能够保持116分钟,这意味着即使在电池供电的情况下,CPU的性能也能得到充分的利用。
| Lenovo ThinkPad T14s G3 21BR00CDGE i5-1235U, Iris Xe G7 80EUs, 57 Wh | Lenovo ThinkPad T14s G2 20WM003TGE i7-1165G7, Iris Xe G7 96EUs, 57 Wh | Lenovo ThinkPad T14 G3-21CF004NGE R7 PRO 6850U, Radeon 680M, 52.5 Wh | Lenovo ThinkPad X13 G3 21BN0046GE i5-1235U, Iris Xe G7 80EUs, 54.7 Wh | Lenovo ThinkPad X1 Yoga G7 21CE002HGE i7-1270P, Iris Xe G7 96EUs, 57 Wh | Lenovo ThinkPad X1 Carbon G10 21CC001RGE i5-1250P, Iris Xe G7 80EUs, 57 Wh | HP EliteBook 845 G9 6F6H9EA R5 PRO 6650U, Radeon 660M, 51 Wh | Dell Latitude 7420 JW6MH i5-1145G7, Iris Xe G7 80EUs, 63 Wh | Schenker Vision 14 2022 RTX 3050 Ti i7-12700H, GeForce RTX 3050 Ti Laptop GPU, 99.8 Wh | |
|---|---|---|---|---|---|---|---|---|---|
| Battery runtime | 31% | 47% | 30% | 26% | 43% | 26% | 74% | 36% | |
| H.264 (h) | 7.9 | 14.6 85% | 16.4 108% | 12.2 54% | 10.9 38% | 11.1 41% | |||
| WiFi v1.3 (h) | 9.6 | 9.7 1% | 12.9 34% | 10.2 6% | 8.9 -7% | 10.2 6% | 12.1 26% | 14.1 47% | 10.1 5% |
| Load (h) | 1.3 | 1.4 8% | 1.3 0% | 2 54% | 1.7 31% | 2.4 85% | 2.6 100% | 2.1 62% |
Pros
Cons
结论:高效的ThinkPad T14s G3是理想的商务笔记本电脑

通过T14s G3英特尔,联想创造了最好的,甚至是非常好的ThinkPads之一,当它涉及到将紧凑的设计与非常低的排放和高性能相结合时--这是商业用户在笔记本电脑中寻找的特征。该设备有一个坚固的底盘,配备16:10显示屏,并在不牺牲电池寿命的情况下获得了强大的CPU升级(大约比上一代产品多50%的性能)。
它是第一款带有OLED选项的T系列ThinkPad,我们在这次评测中没有测试到它。不幸的是,评测单元上的低功耗显示屏存在严重的重影和混浊,以及亮度不足的问题。该面板具有出色的对比度和色彩准确性,但想要更好的屏幕的用户可能应该选择OLED选项。
ThinkPad T14s G3 Intel是一个可靠的选择,适合那些正在寻找一个安静而又快速的商务笔记本电脑,没有任何重大缺点,同时也不想没有出色的输入设备、丰富的功能集和紧凑的外形因素的用户。
在内存选项方面,你应该考虑16GB是否足够,或者你是否想马上得到32GB。这是因为,与 HP EliteBook 845 G9, 申科视界14和 ThinkPad T14,T14s没有可升级的内存。
T14s已经变得更加类似于 变得更加类似于ThinkPad X1 Carbon,除了它的重量。但T14s的持续性能更好。如果你需要一个更加紧凑的笔记本电脑,那么 ThinkPad X13(具有相同的主板)可能值得一看。Schenker的Vision 14同样比T14s更小,并提供更高的效率和一个 RTX 3050 Ti.该 ThinkPad T14 AMD展示了AMD CPU的潜力和效率。这是ThinkPad T14s G3 AMD在我们即将进行的审查中仍需证明的东西。
价格和可用性
在德国,我们的评测模型(21BR00CDGE)通常价格为1,865欧元(1,980美元)。但目前在学生折扣后,€1,699 (US$1,803).或者,你可以得到一个AMD版本的快速Ryzen 7 PRO 6850U少50欧元(53美元)。Campuspoint甚至提供一个OLED模型.对于那些预算有限的人来说,有一个更便宜的,配备8GB内存的AMD型号价格约为1,600欧元(1,699美元)。
对于美国居民,你可以到联想美国公司来配置你的ThinkPad T14s G3。学生和教育工作者也同样可以享受折扣。
Lenovo ThinkPad T14s G3 21BR00CDGE
- 12/16/2022 v7 (old)
Marvin Gollor
Price comparison

