联想ThinkPad X13 G3笔记本电脑评测。英特尔Alder Lake-U在户外使用的耐力
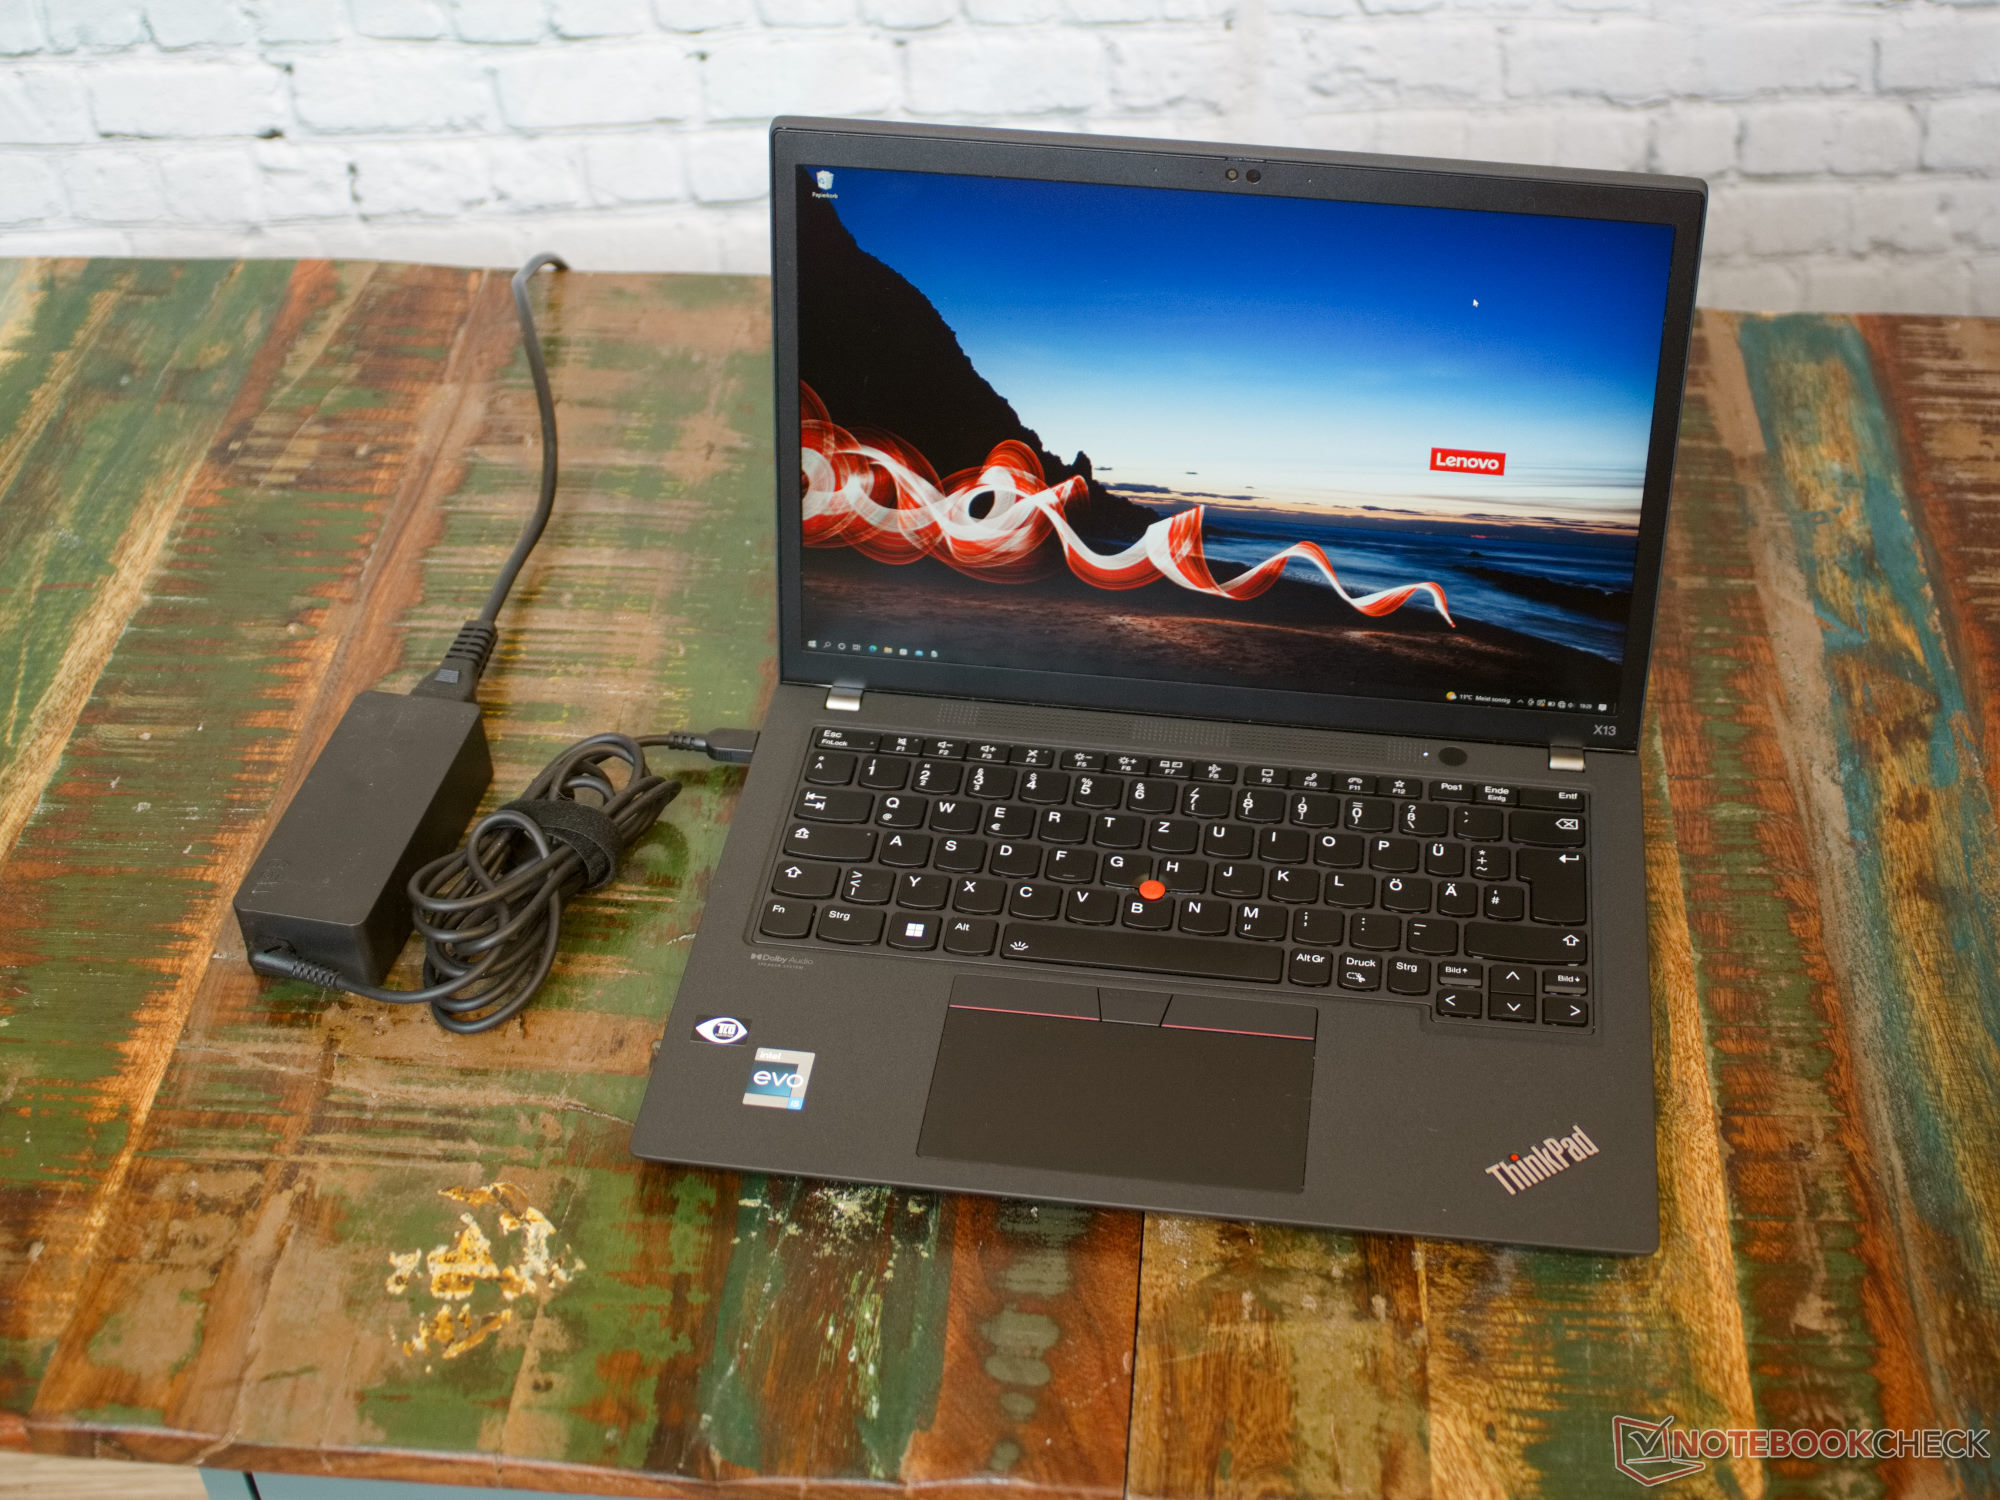
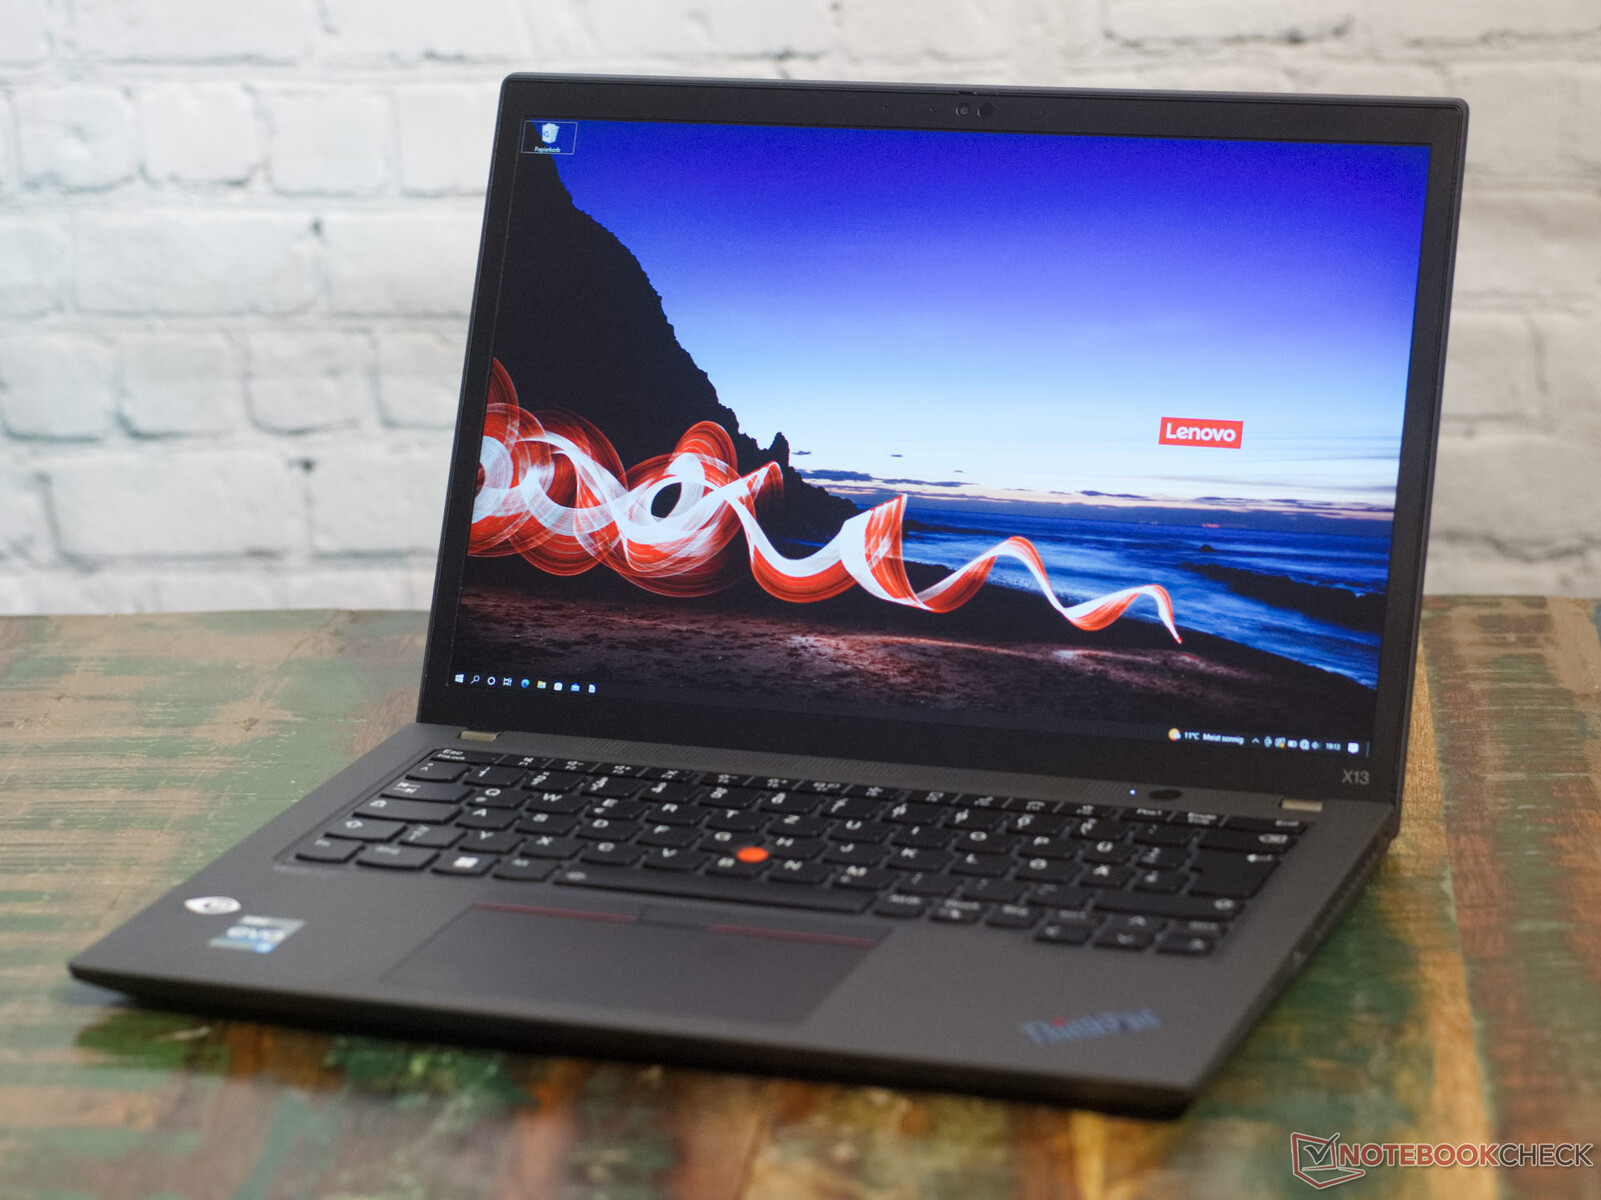
说到专业笔记本电脑,ThinkPad是联想的品牌。每种应用都有合适的设备。X系列特别轻便,移动性强,电池寿命长,但不一定有最好的计算性能。配备13.3英寸16:10显示器的ThinkPad X13第三代也是这种情况。由于采用了英特尔酷睿i5-1235U和16GB工作内存,这款轻巧的笔记本倒是更适合日常使用。镁合金外壳带来了稳定性和低重量。
我们的测试设备必须证明自己是ThinkPad X13 G2的继任者。 配备英特尔处理器的ThinkPad X13 G2的继任者。并不得不面对与各种小型办公笔记本的比较。在这些产品中,还有 配备AMD处理器的ThinkPad X13 G2和 ThinkPad X1 Titanium Yoga作为该公司自己的一款可转换产品。来自竞争对手的对比设备是HP Elite Dragonfly G3和 戴尔Latitude 13 7330在我们的数据库中。另一个特别有趣的选择是模块化的 框架笔记本电脑自己提供。
潜在的竞争对手比较
Rating | Date | Model | Weight | Height | Size | Resolution | Price |
|---|---|---|---|---|---|---|---|
| 89.4 % v7 (old) | 11 / 2022 | Lenovo ThinkPad X13 G3 21BN0046GE i5-1235U, Iris Xe G7 80EUs | 1.3 kg | 18.9 mm | 13.30" | 1920x1200 | |
| 85.1 % v7 (old) | 07 / 2022 | Framework Laptop 13.5 12th Gen Intel i7-1260P, Iris Xe G7 96EUs | 1.3 kg | 15.85 mm | 13.50" | 2256x1504 | |
| 91 % v7 (old) | 08 / 2022 | HP Elite Dragonfly G3 i7-1265U, Iris Xe G7 96EUs | 1.2 kg | 16.3 mm | 13.50" | 1920x1280 | |
| 89 % v7 (old) | 07 / 2022 | Dell Latitude 13 7330 i7-1265U, Iris Xe G7 96EUs | 1 kg | 16.96 mm | 13.30" | 1920x1080 | |
| 88.5 % v7 (old) | 03 / 2022 | Lenovo ThinkPad X1 Titanium Yoga G1 20QB0016GE i5-1140G7, Iris Xe G7 80EUs | 1.2 kg | 11.5 mm | 13.50" | 2256x1504 | |
| 90.6 % v7 (old) | 11 / 2021 | Lenovo ThinkPad X13 G2 AMD 20XH001KGE R5 PRO 5650U, Vega 7 | 1.4 kg | 18.19 mm | 13.30" | 1920x1200 |
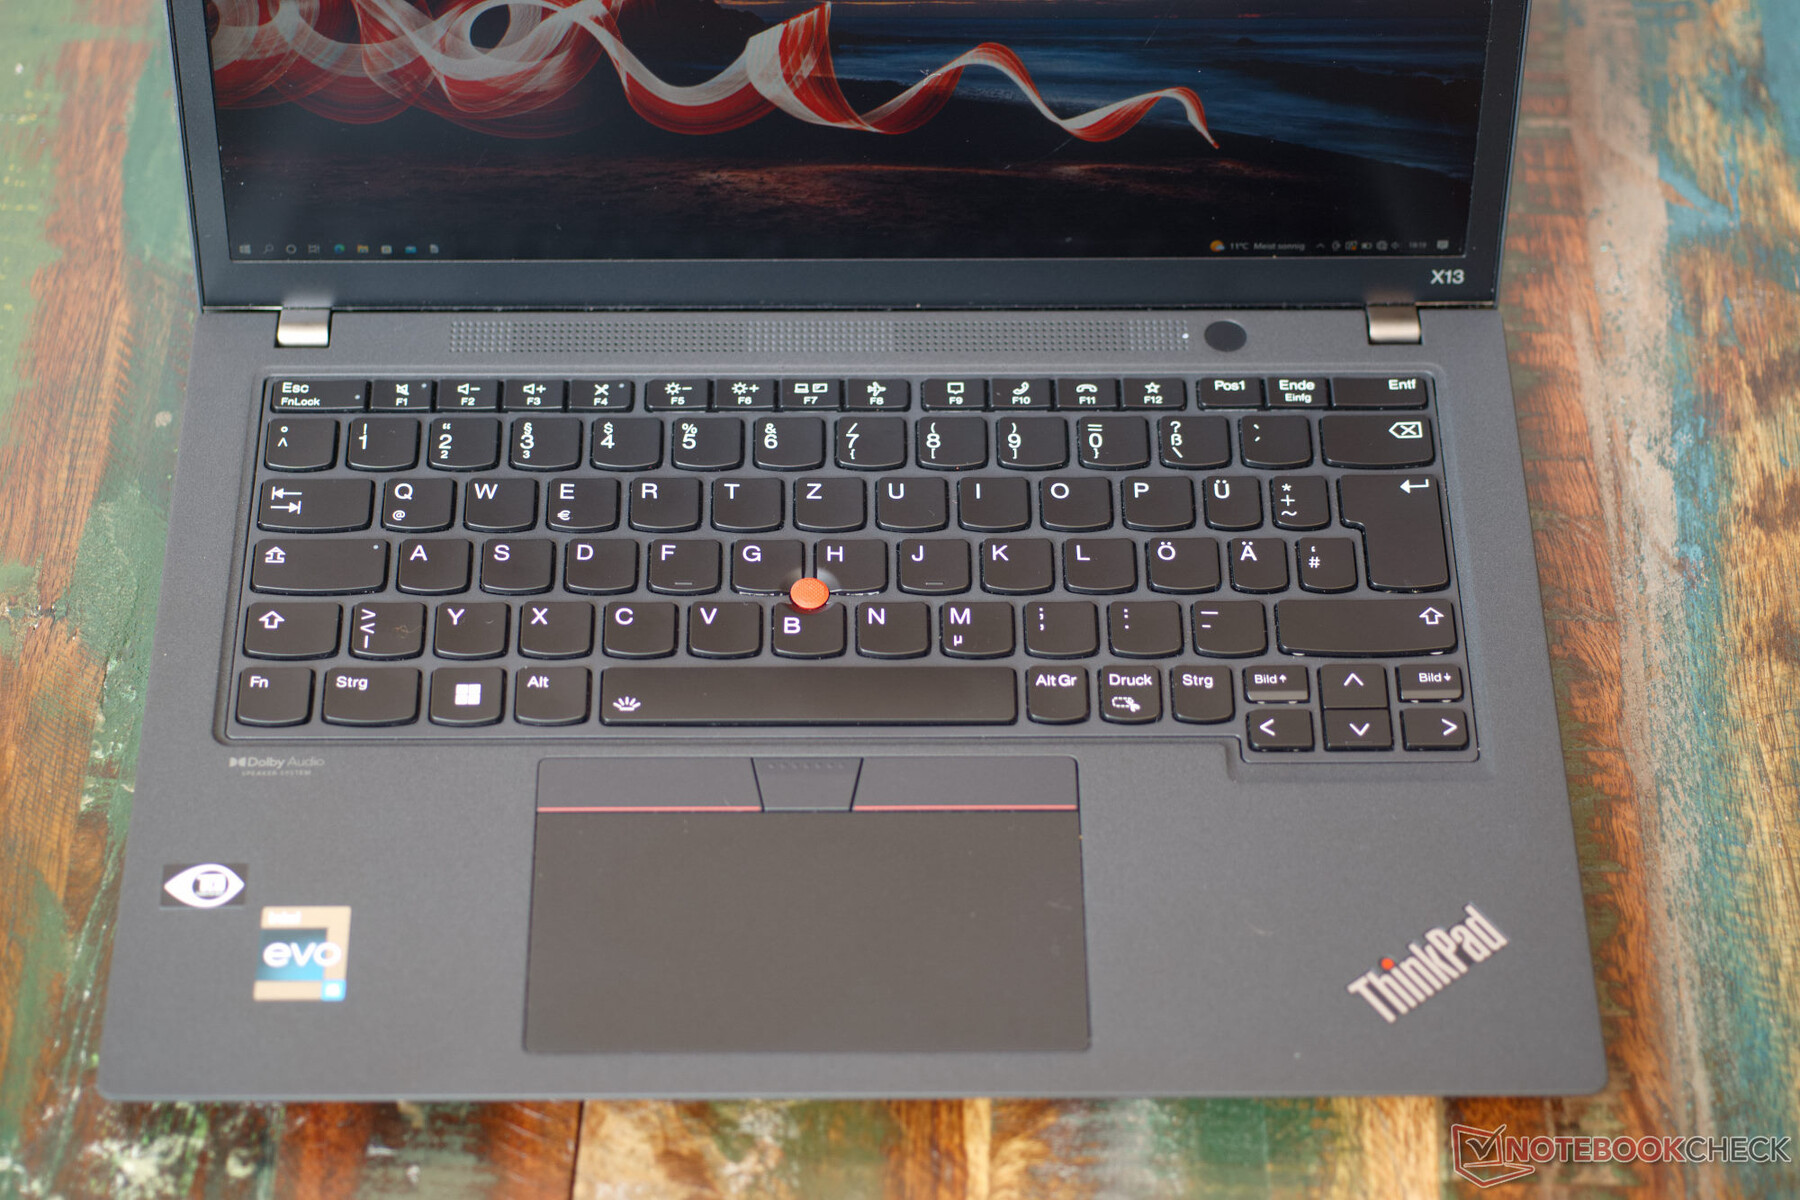
外壳 - 轻金属镁
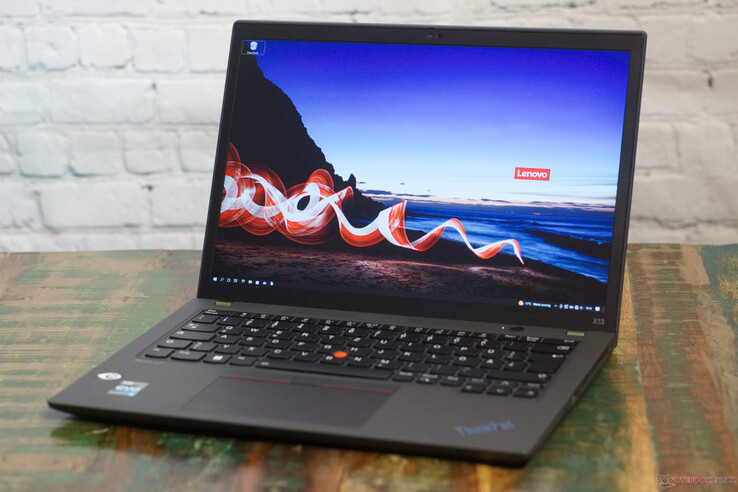
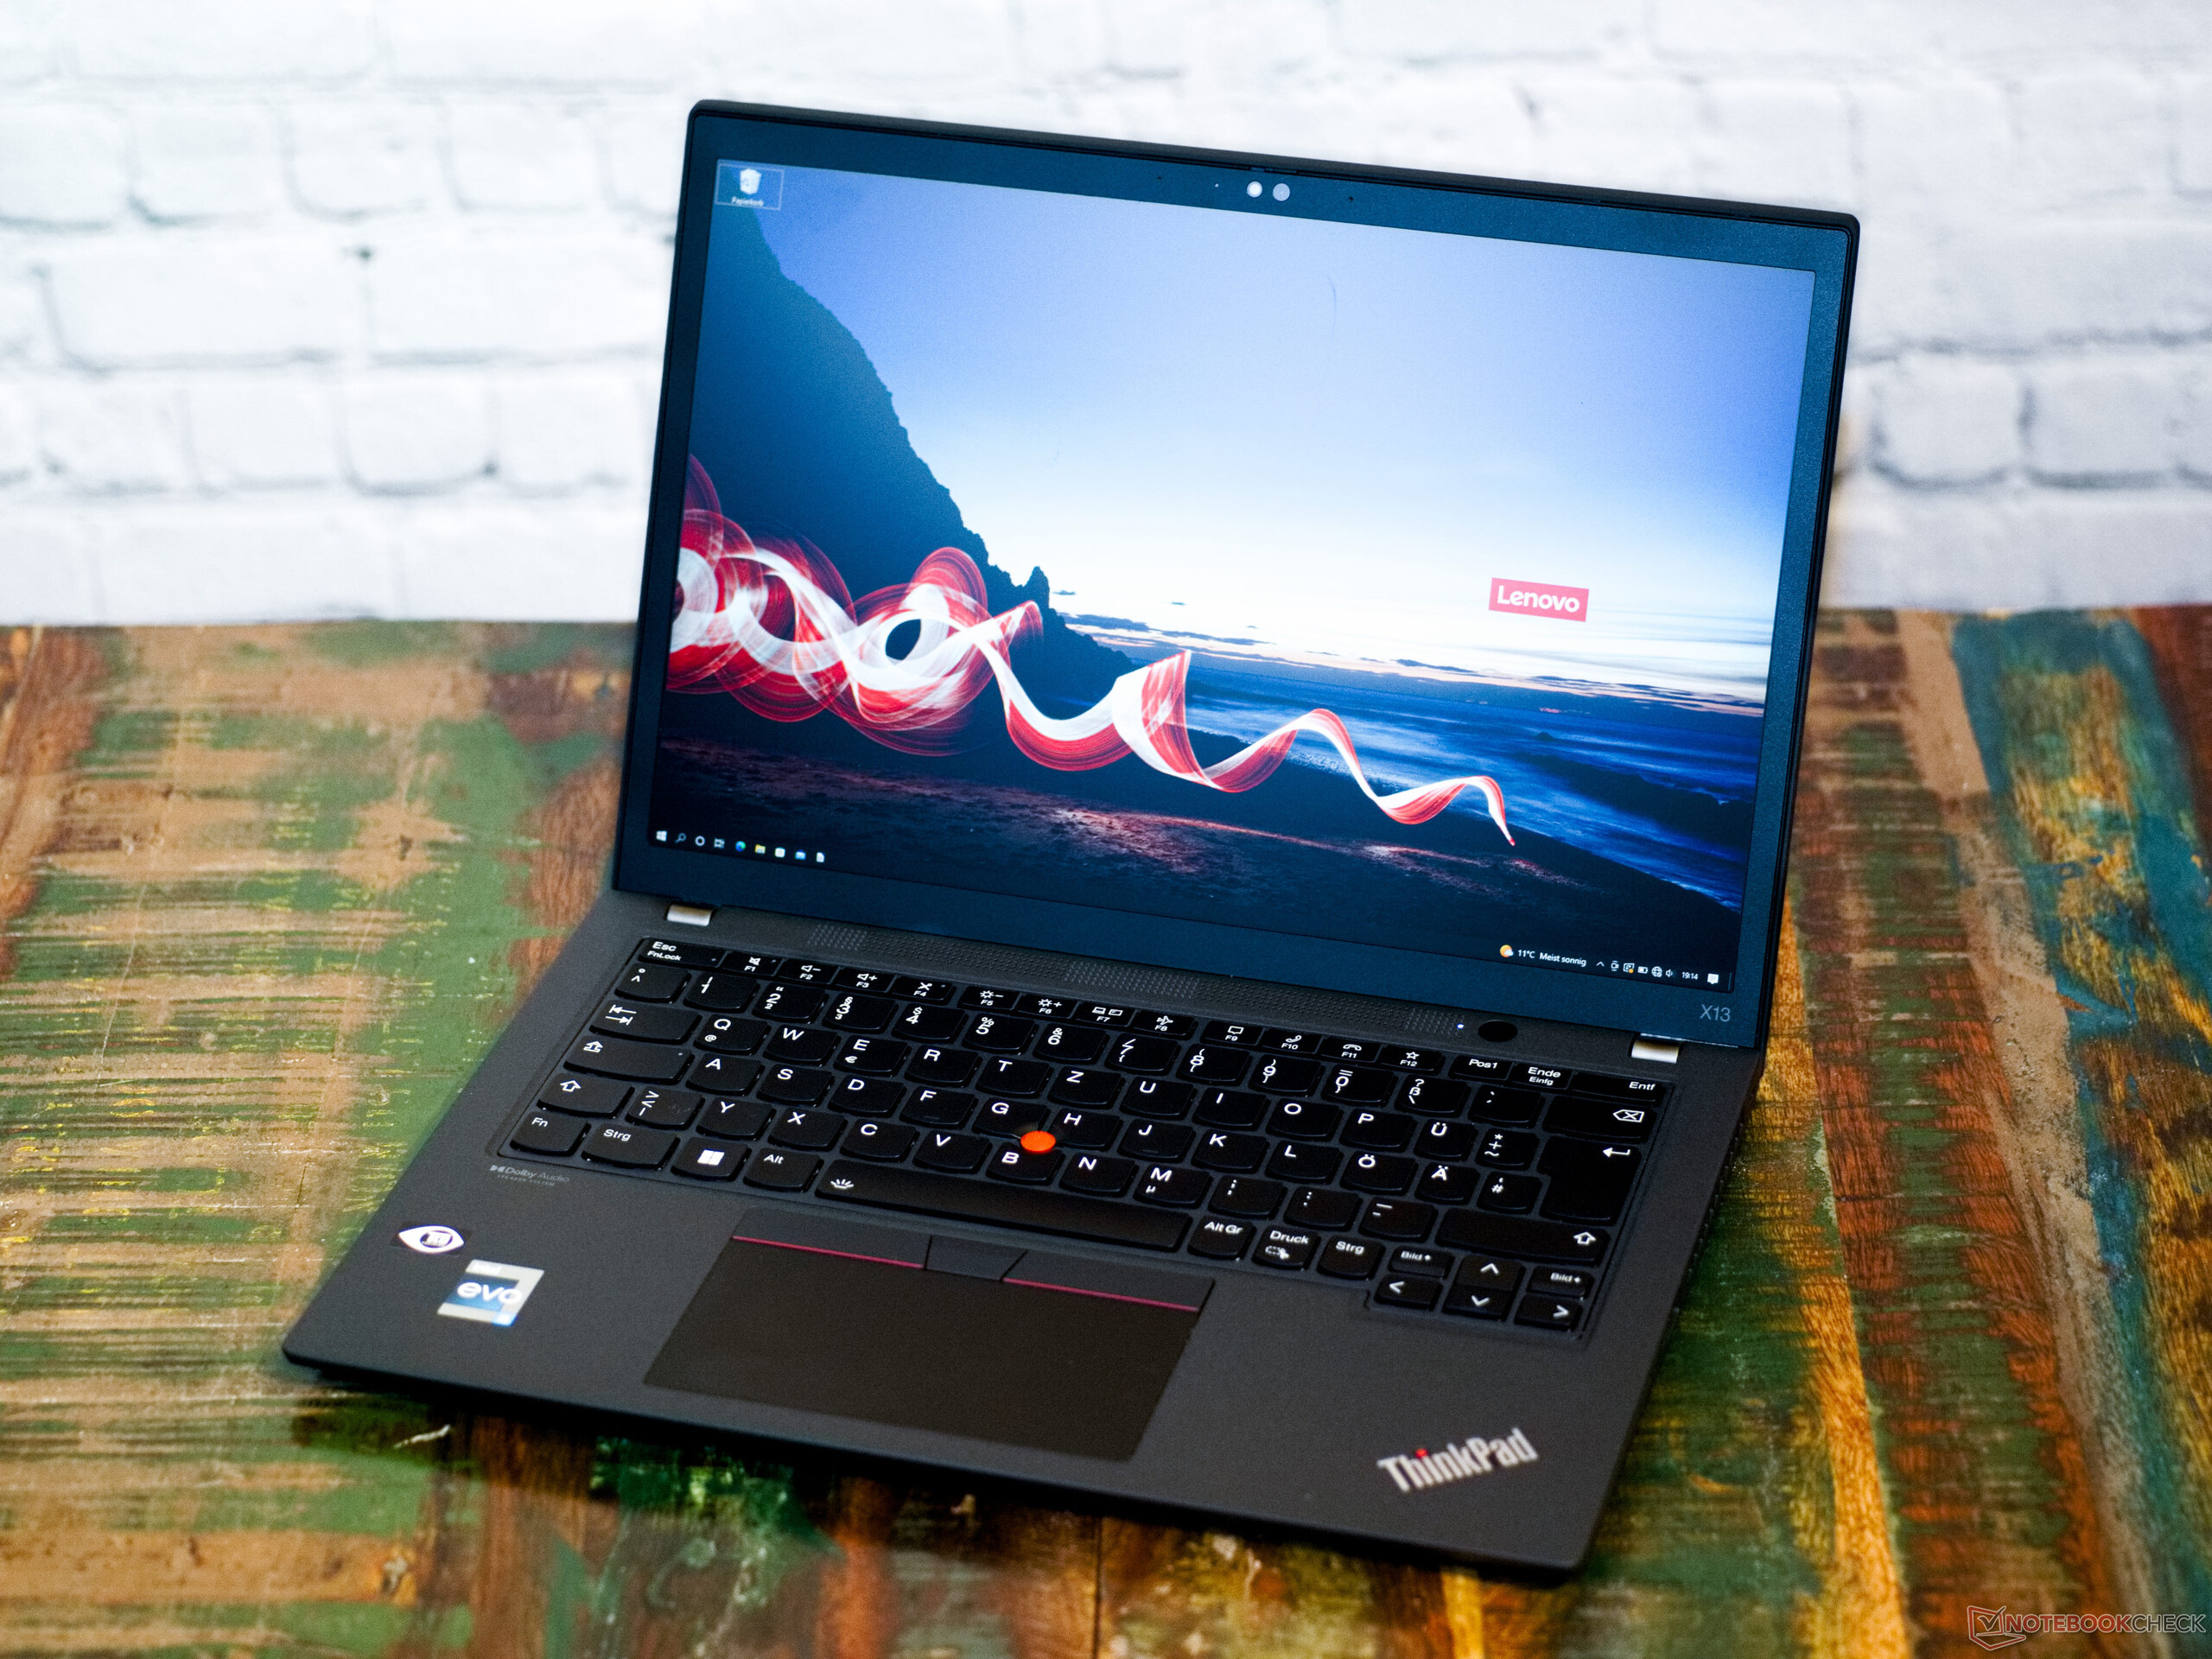
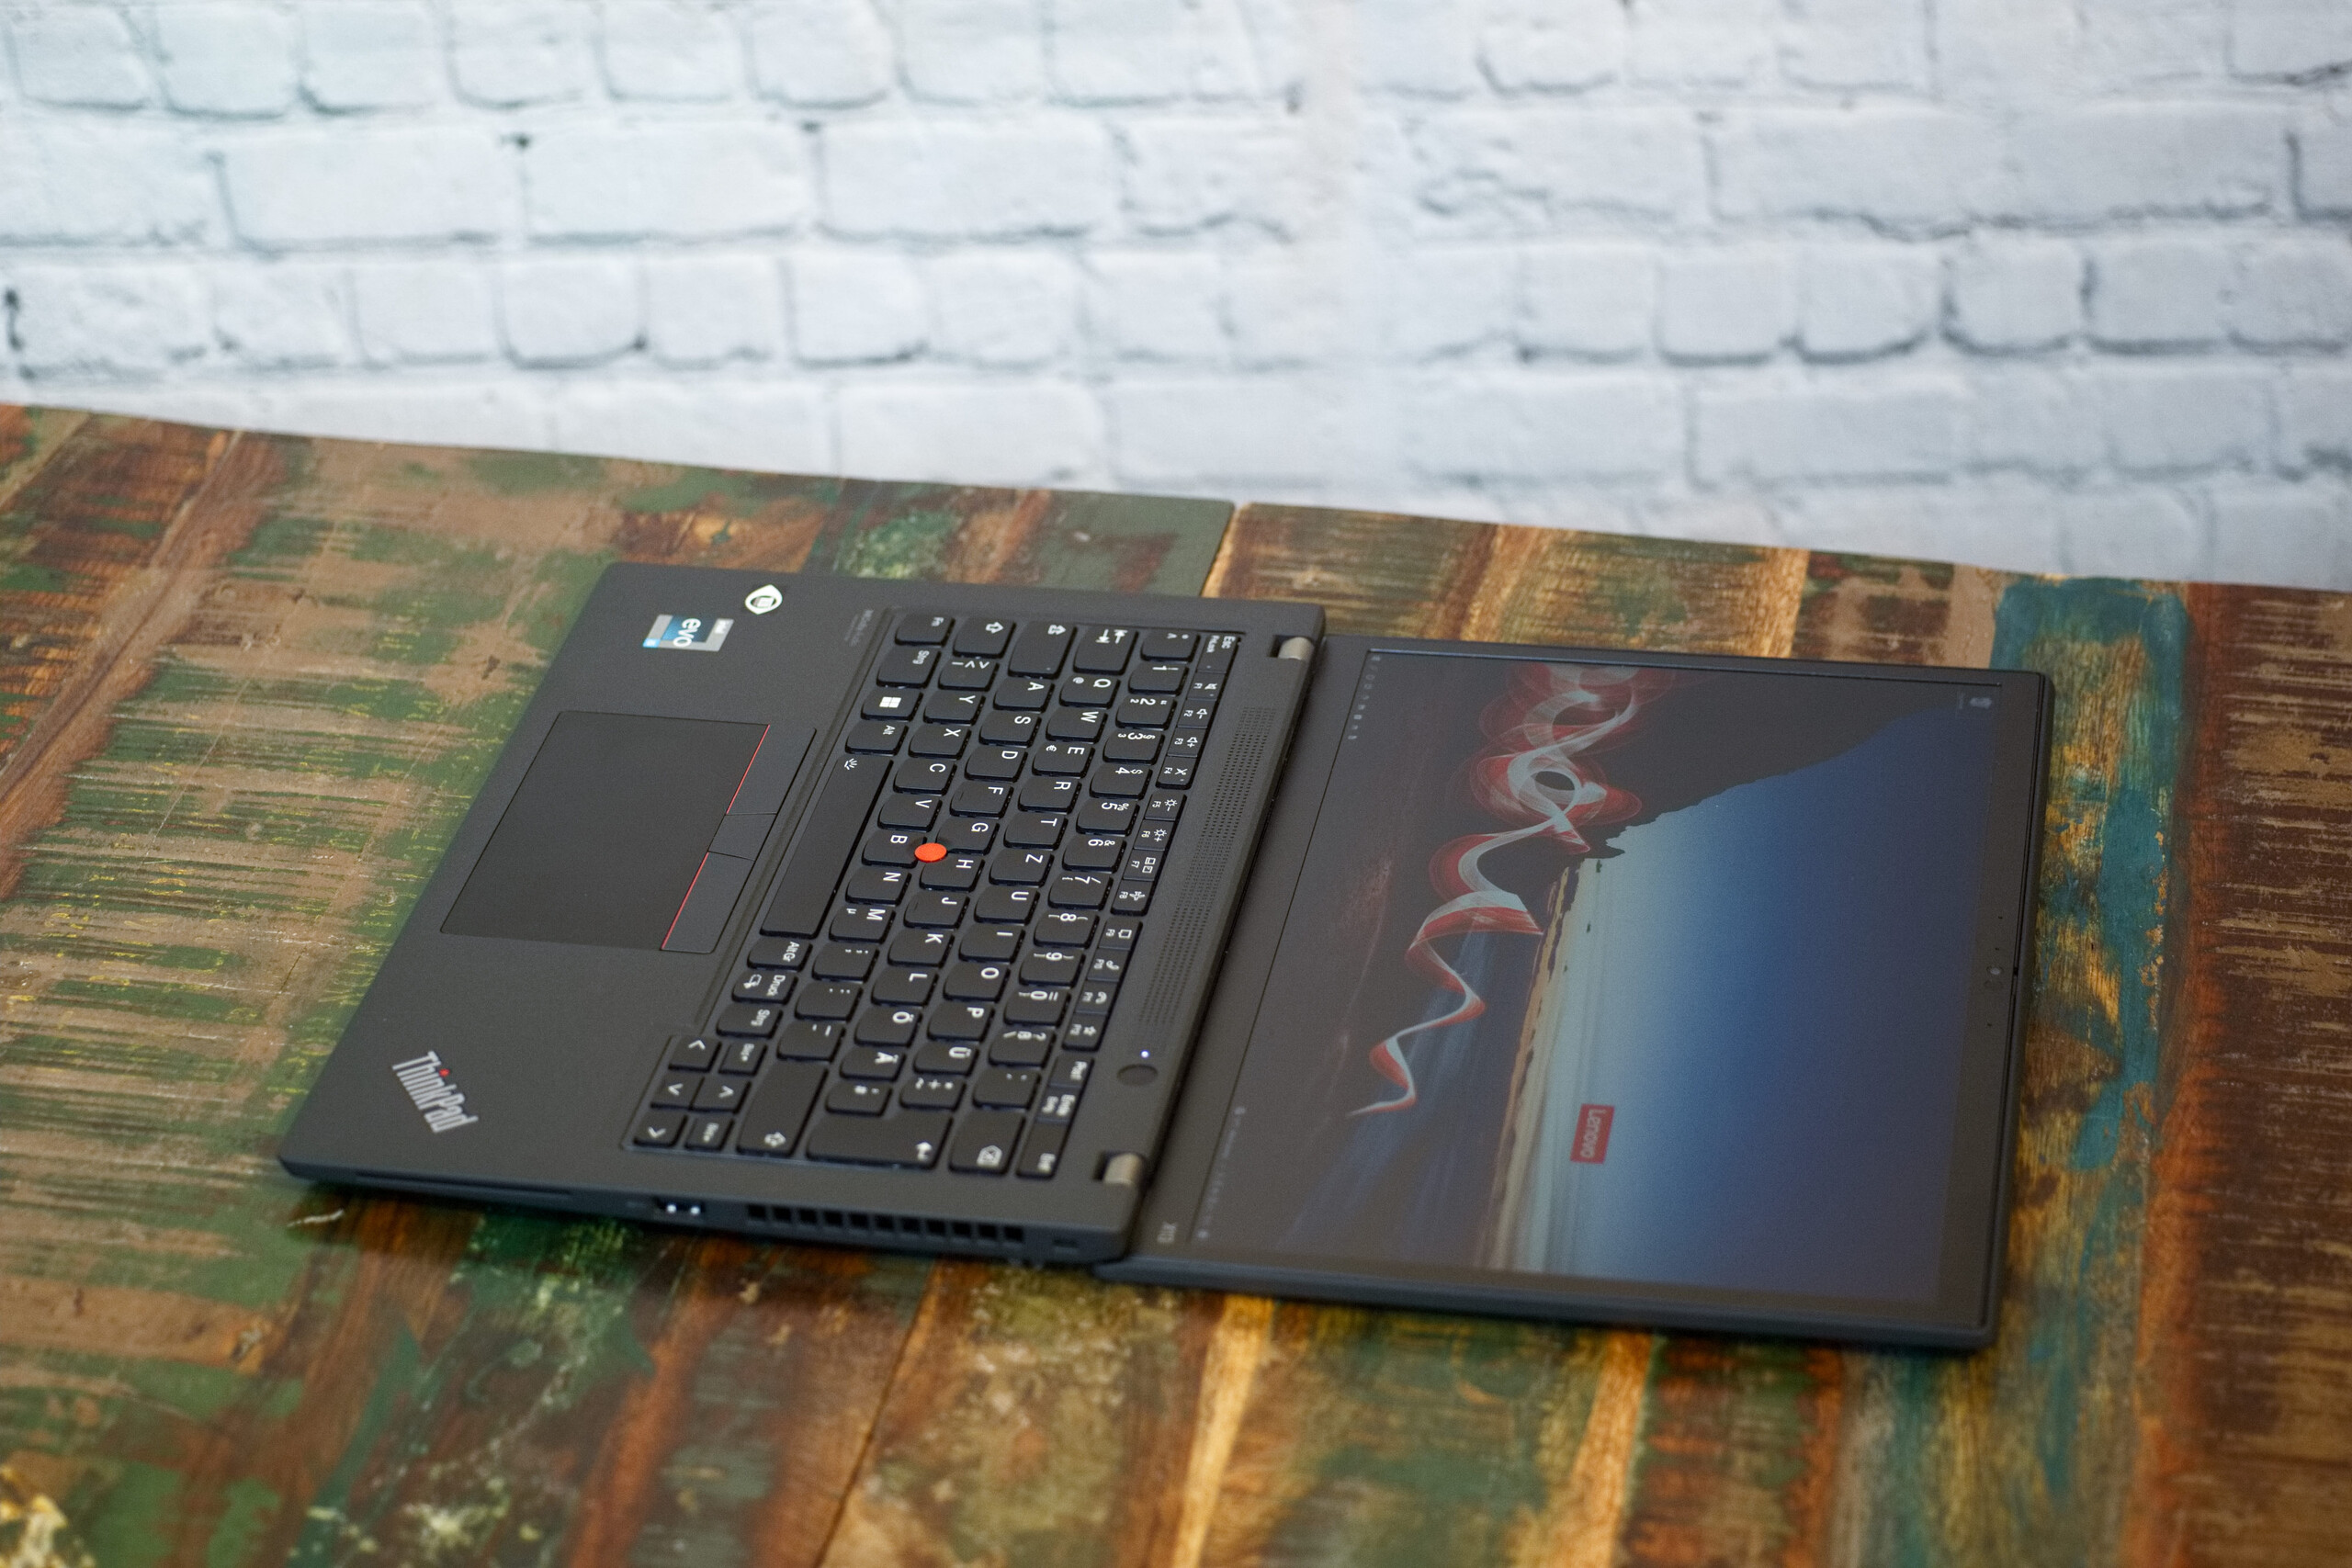
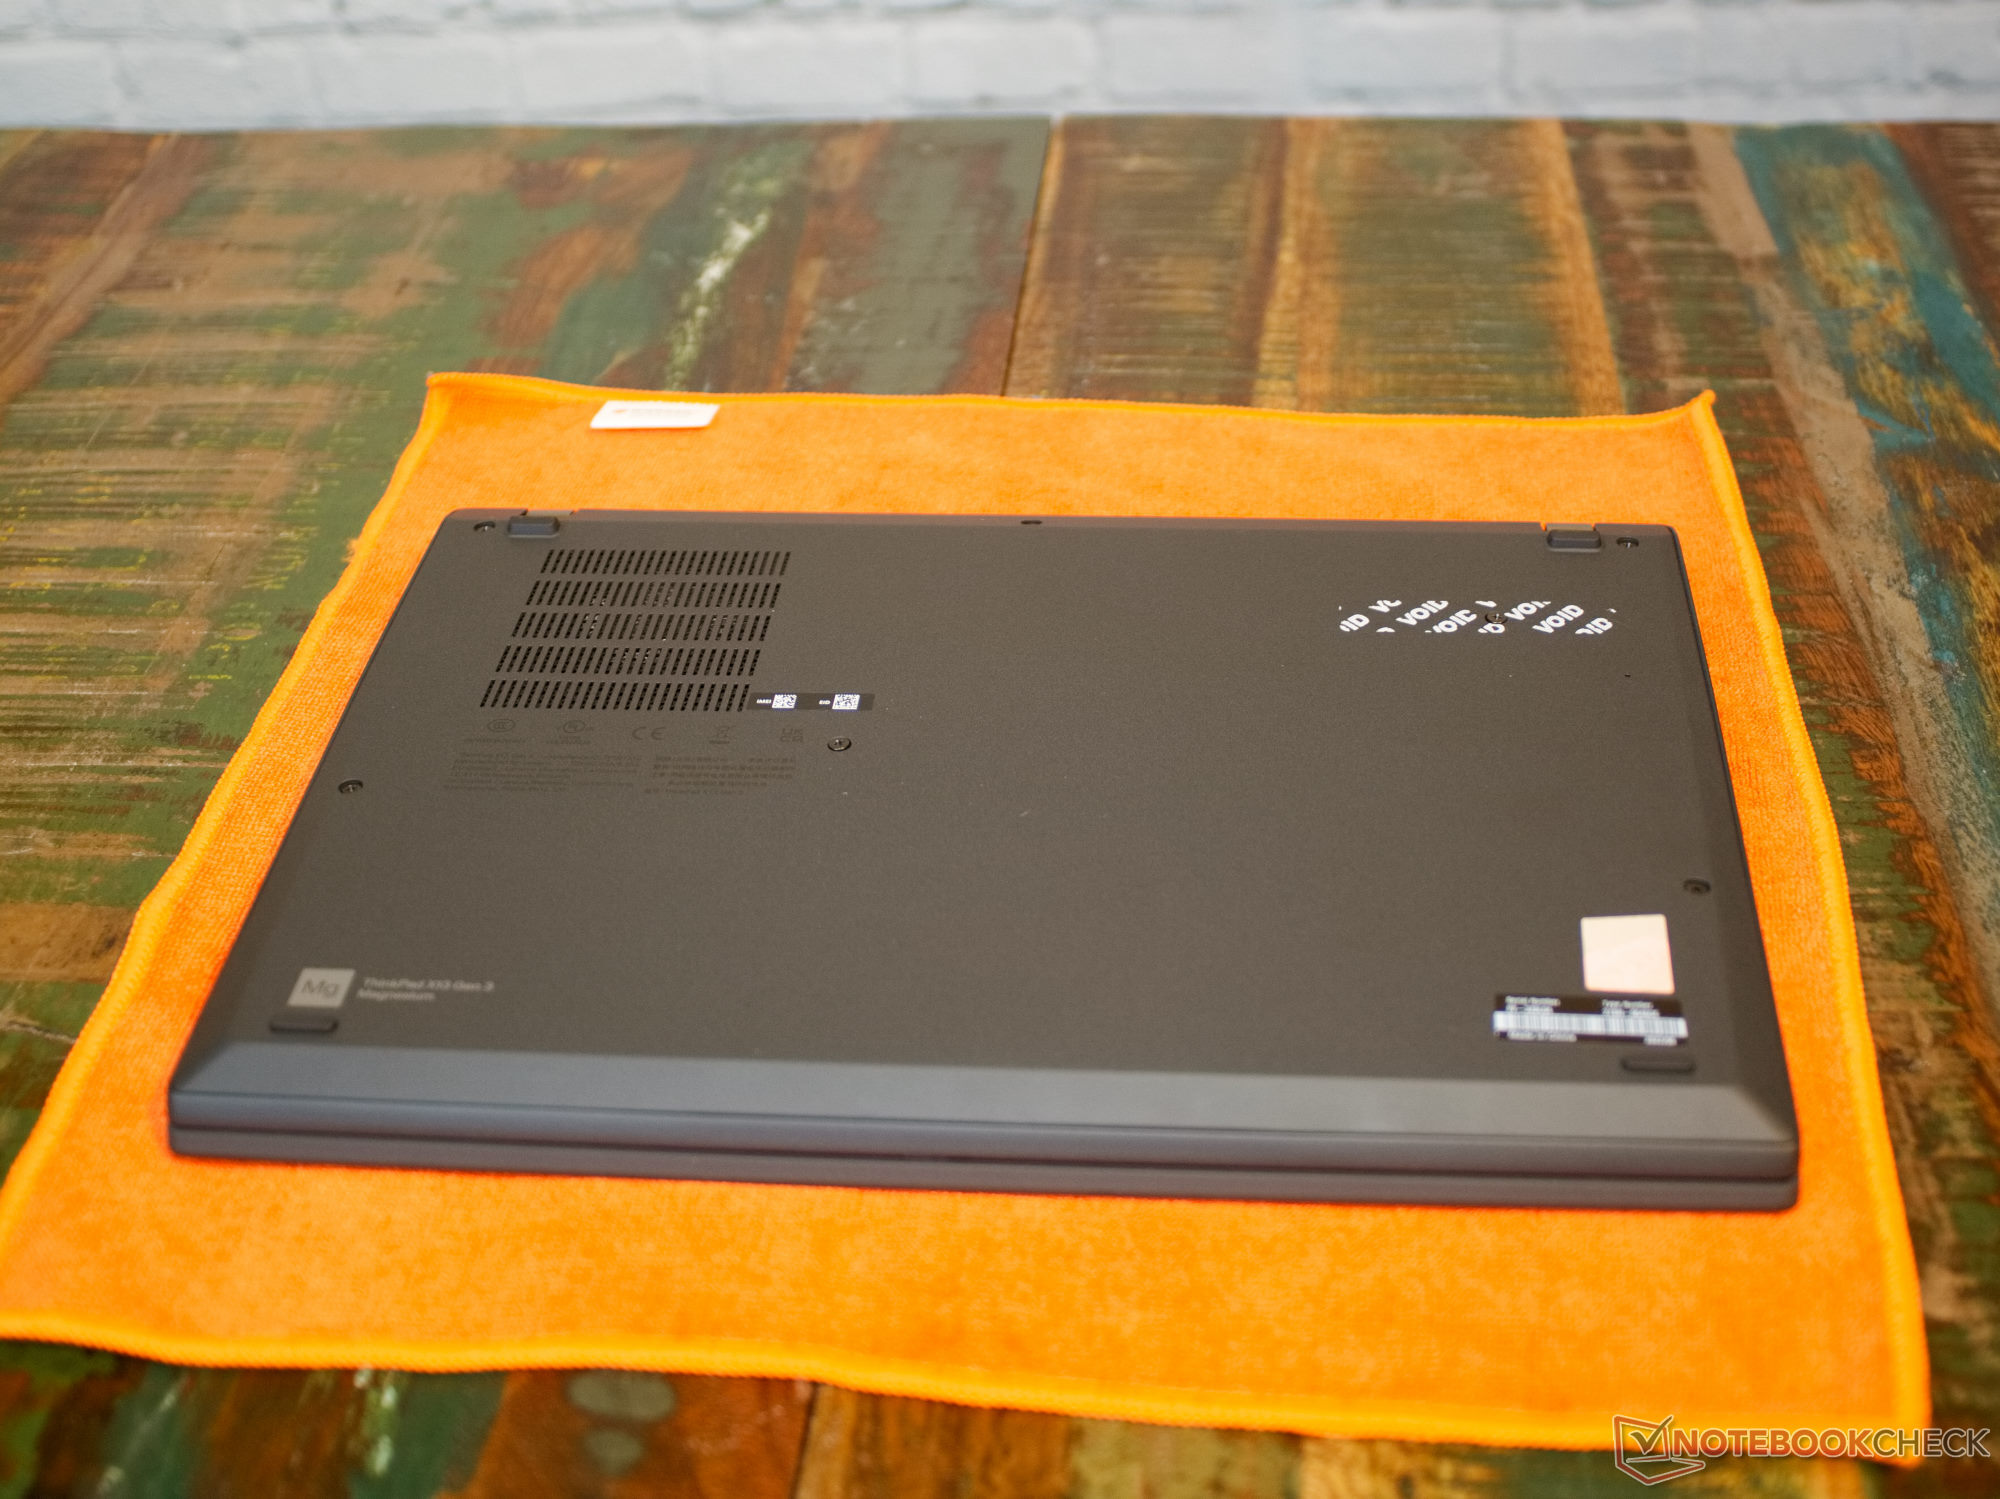
我们在这里遇到了一个典型的ThinkPad黑灰色的笔记本。易于更换的键盘中的红色TrackPoint,标志中闪亮的红色i-dot,以及经典的设计使笔记本具有识别价值。外壳是由镁合金制成的。这使ThinkPad X13在底座上有了很大的稳定性。另一方面,与底座不同的是,显示屏盖子不是由镁制成的,而是由玻璃纤维塑料制成的,相对来说容易变形。然而,没有任何吱吱作响或划痕。因此,整个笔记本电脑给人的感觉是高质量和耐磨损。
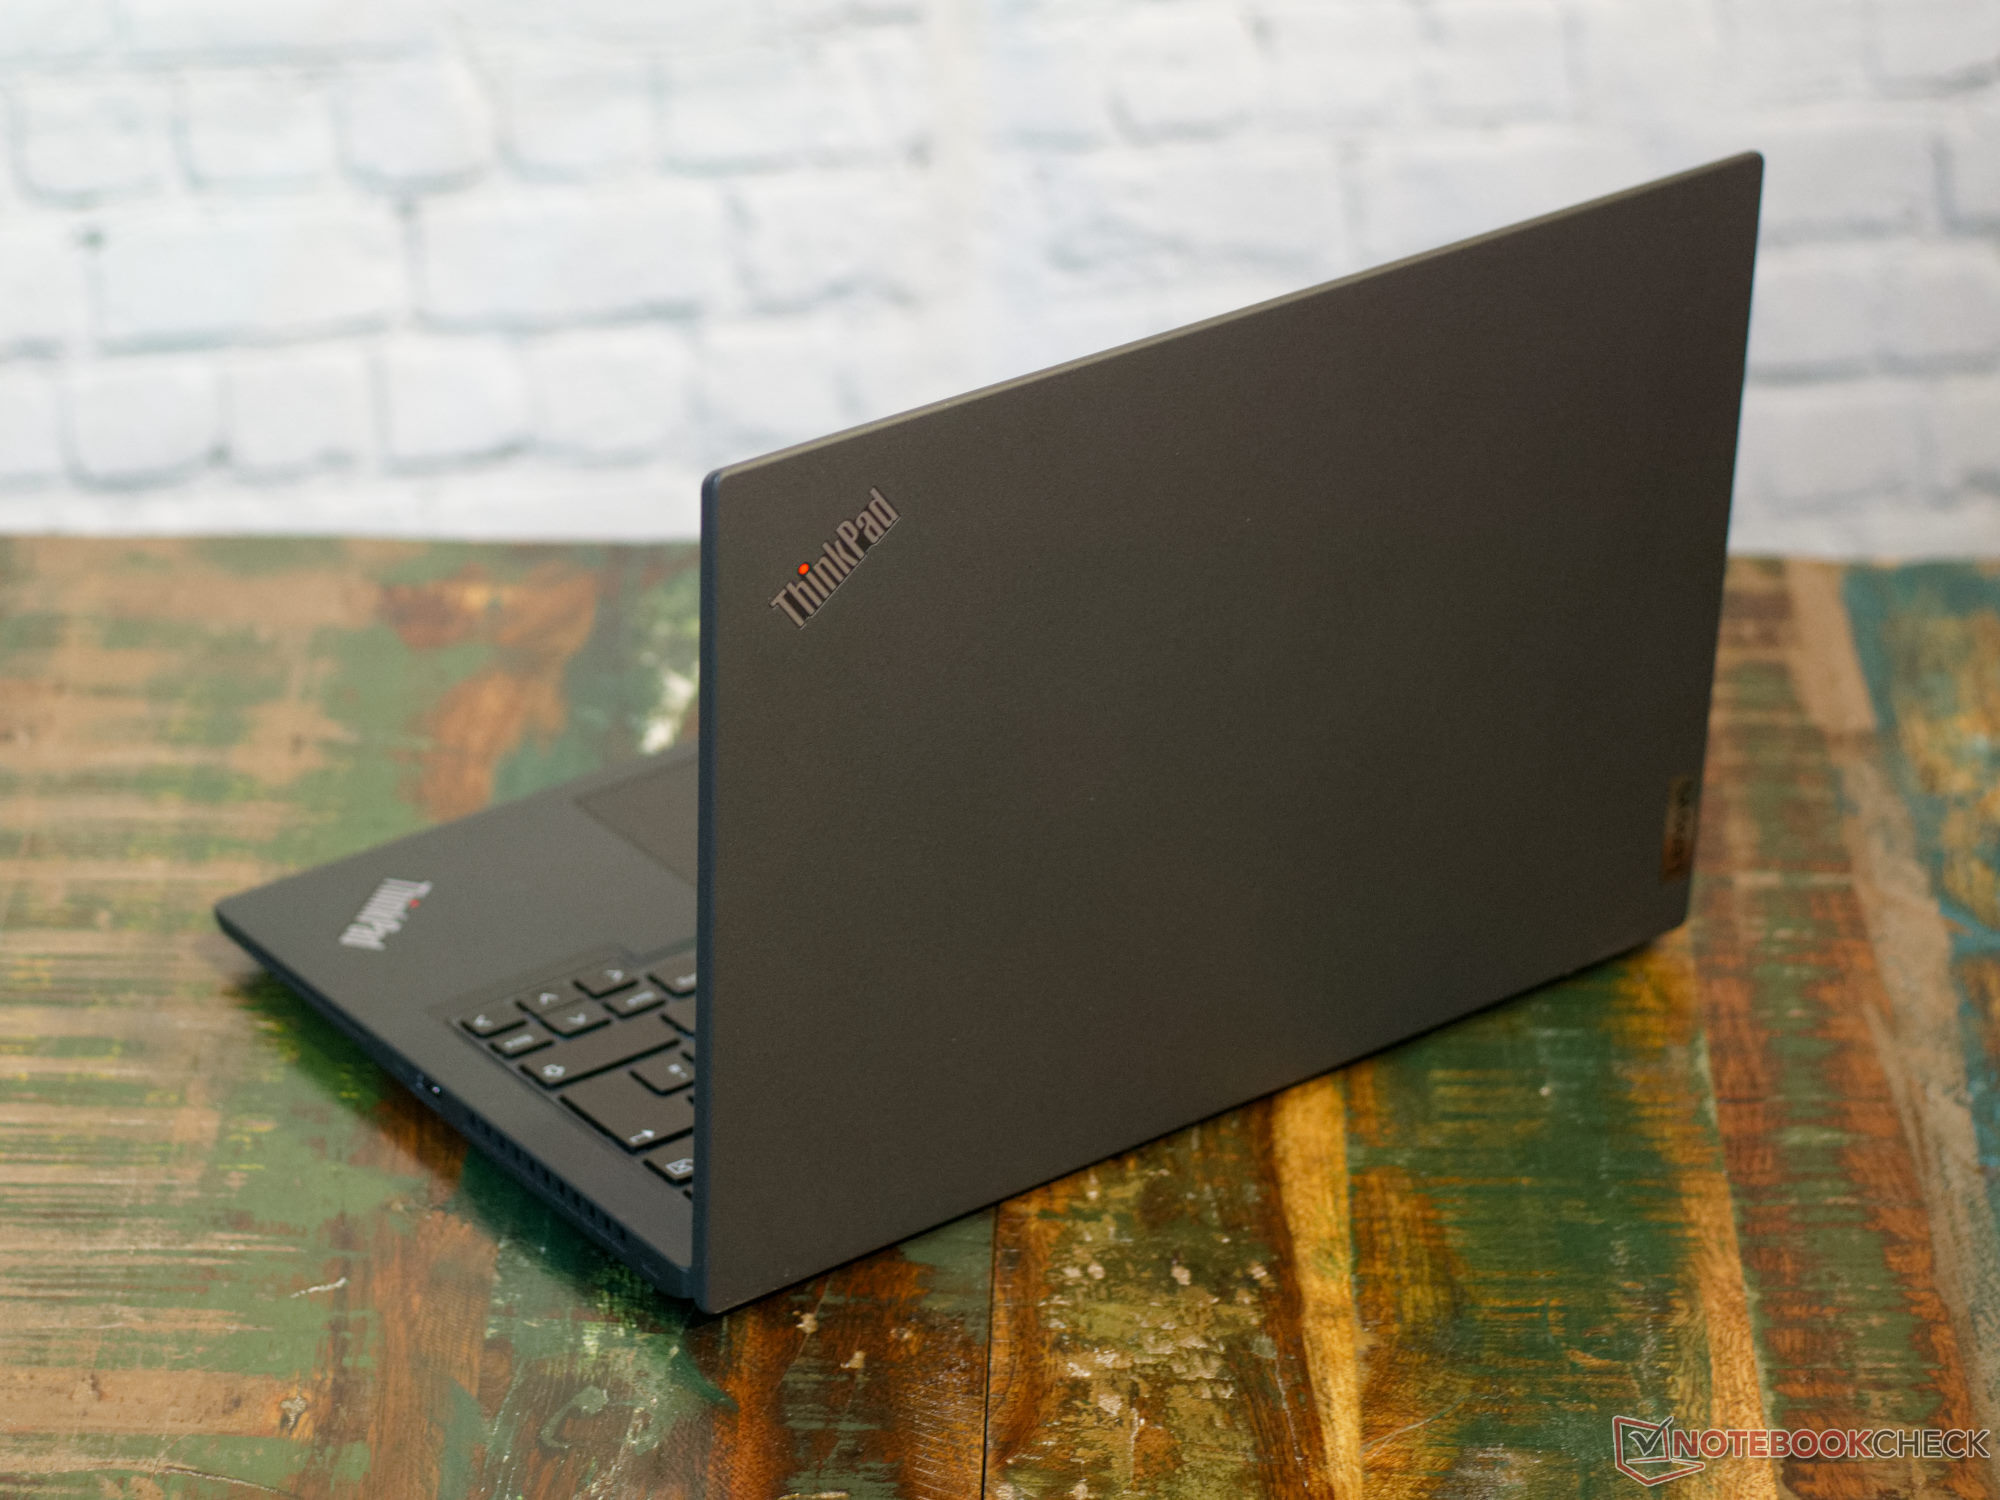
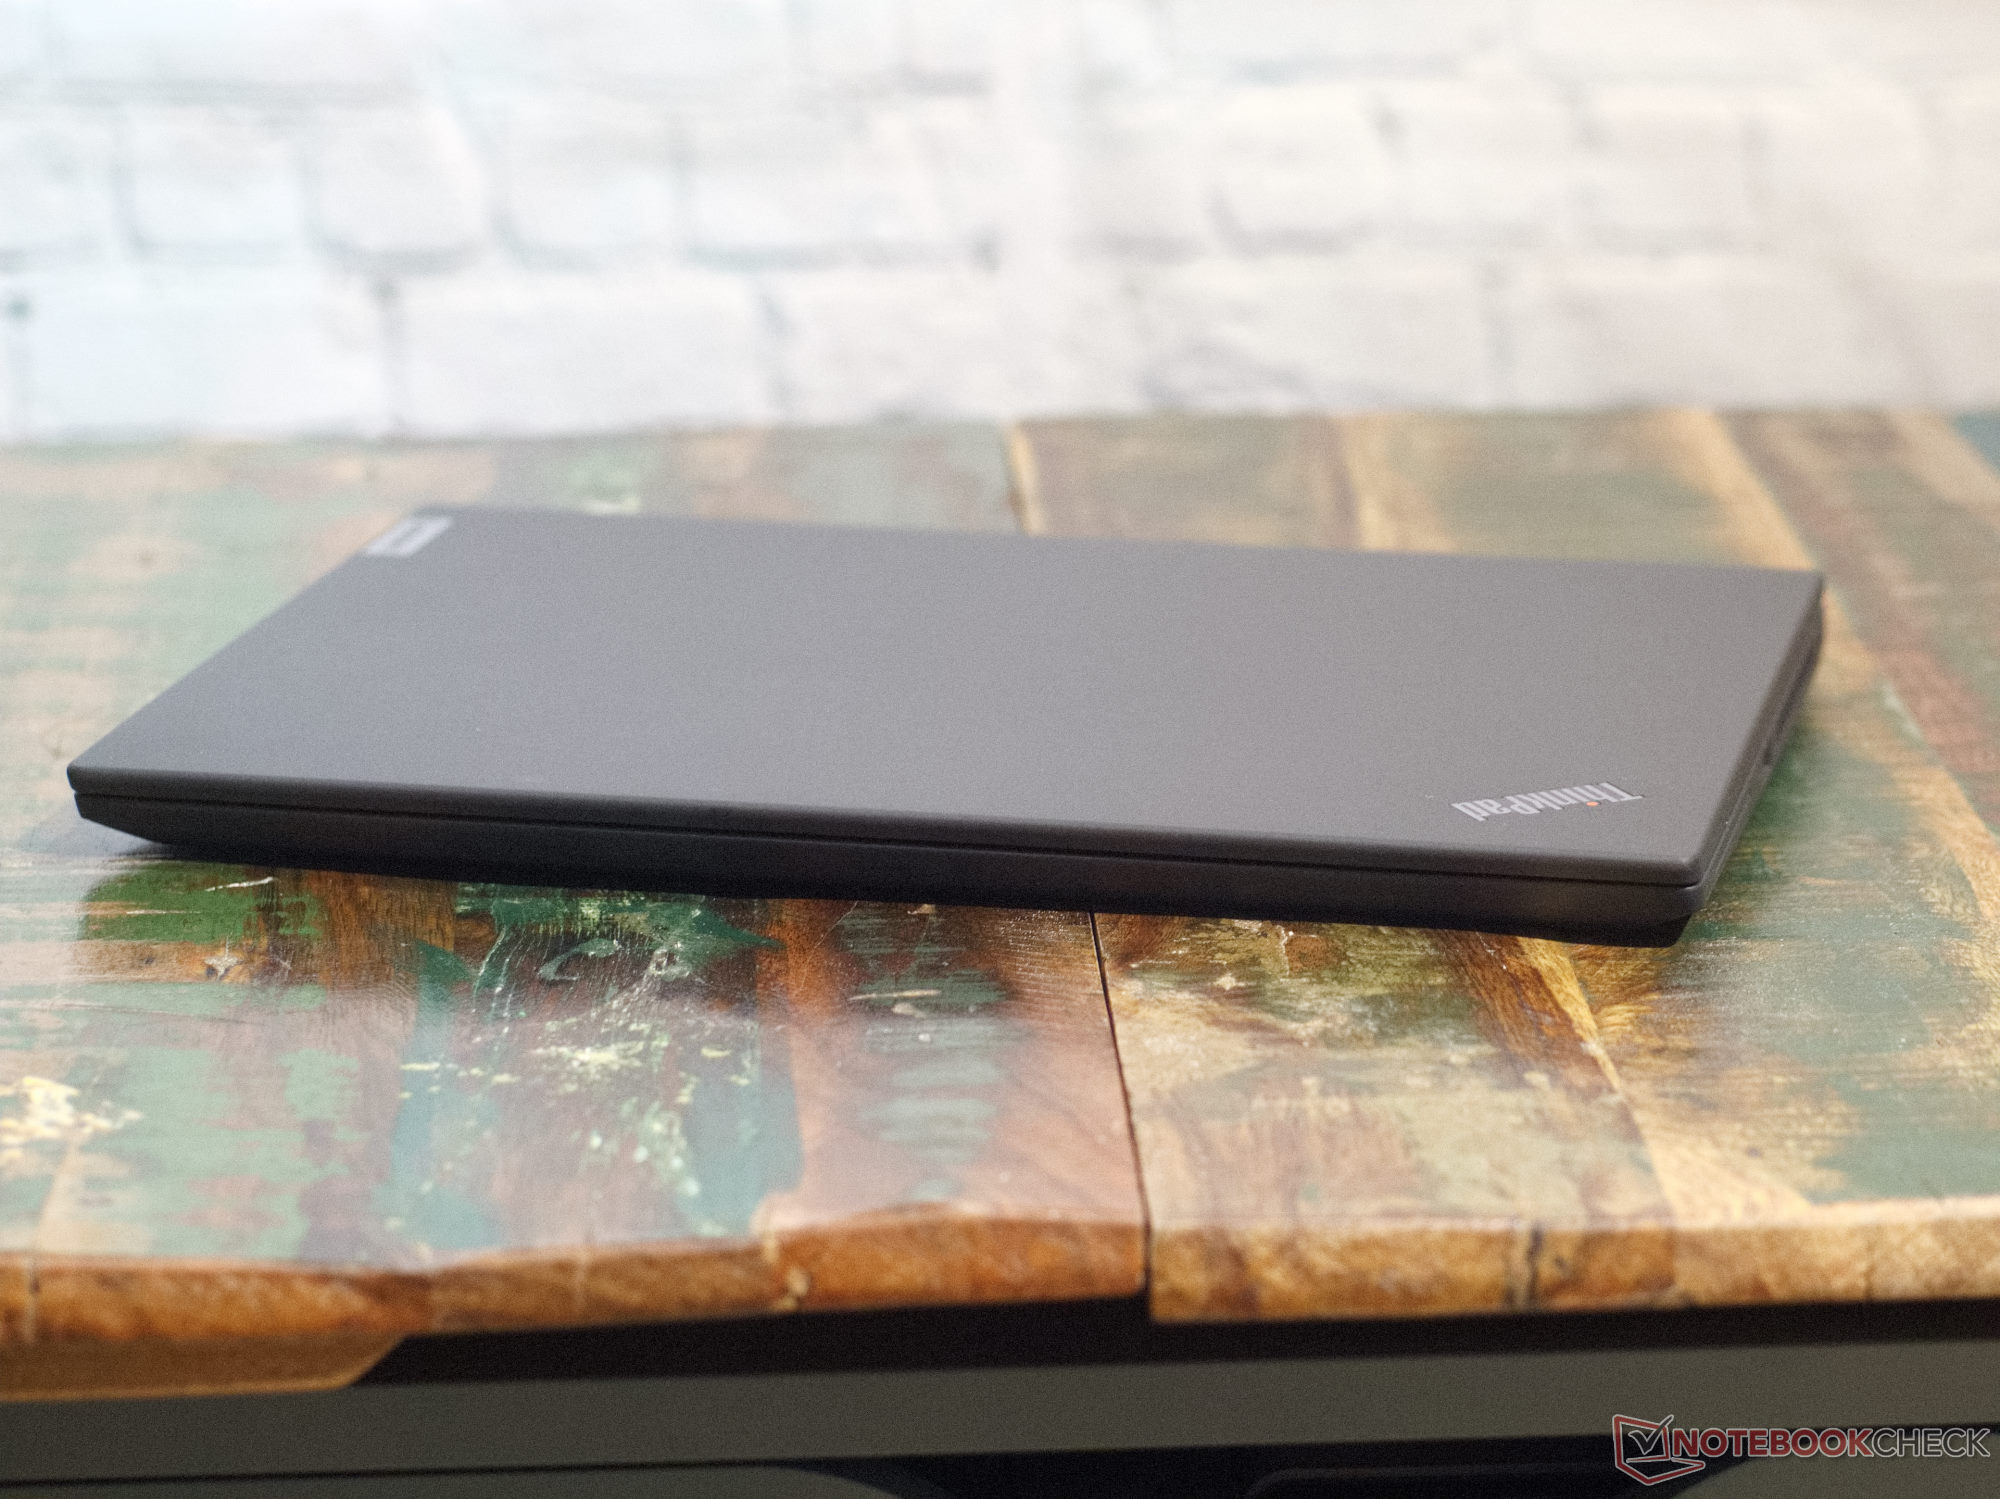
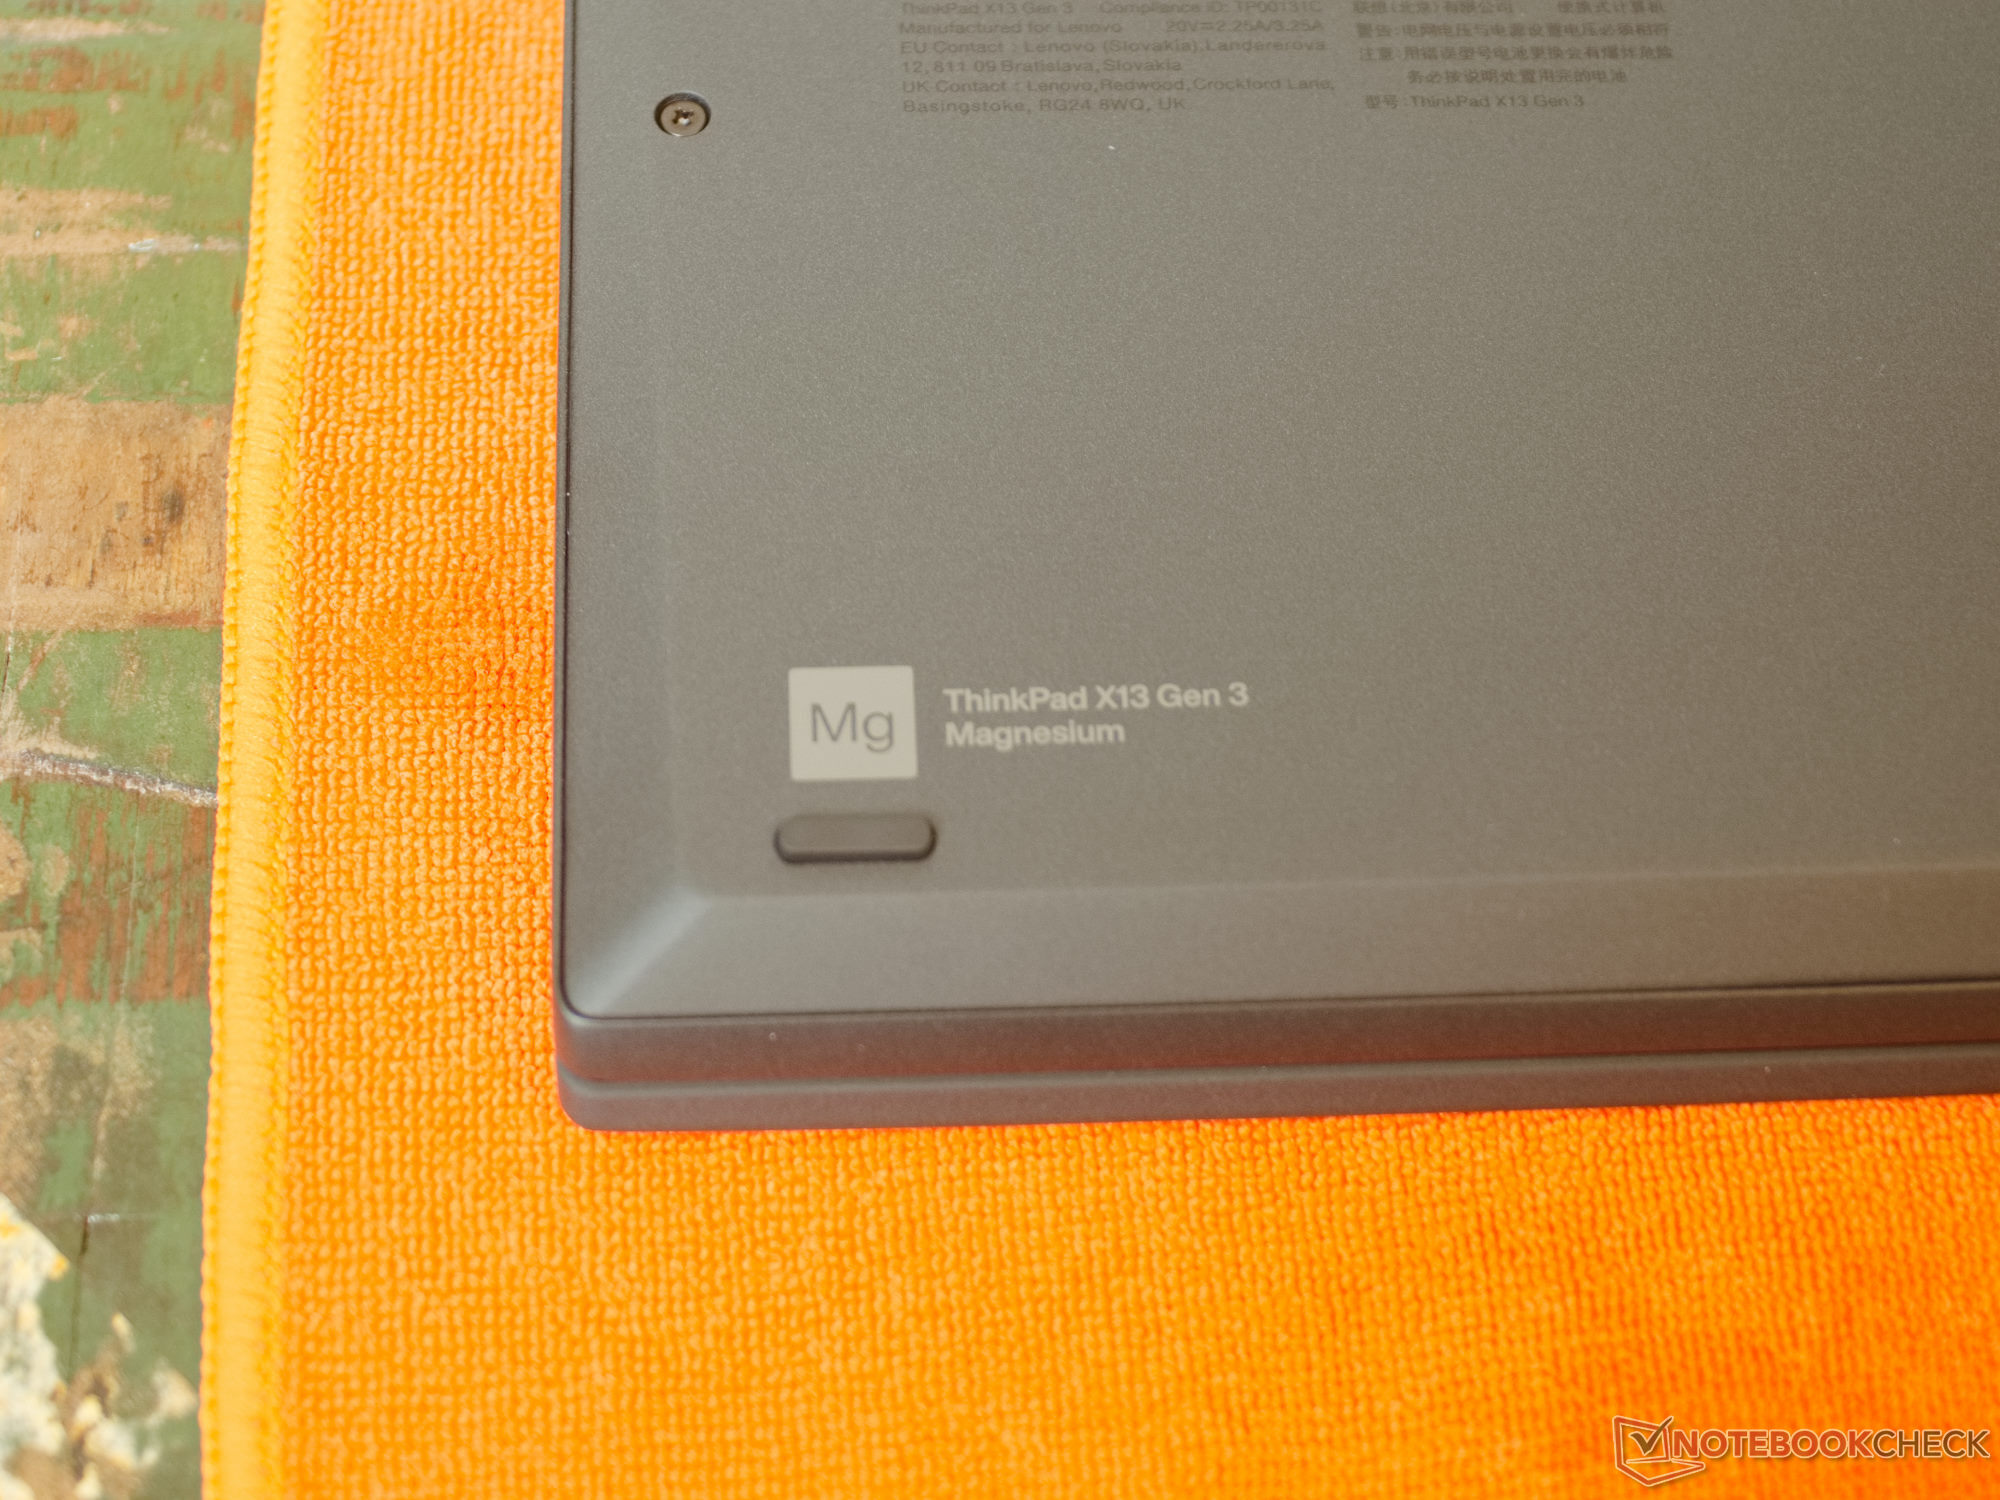
ThinkPad X13具有13英寸对角线的笔记本的典型尺寸。这款笔记本最多只有近2厘米的厚度。在重量方面,这款笔记本也没有突出的表现,无论是正面还是负面。由轻金属镁制成的外壳似乎并没有带来任何重量上的优势。
特点 - 带有DisplayPort和PD的USB Type-C,而不是扩展坞端口
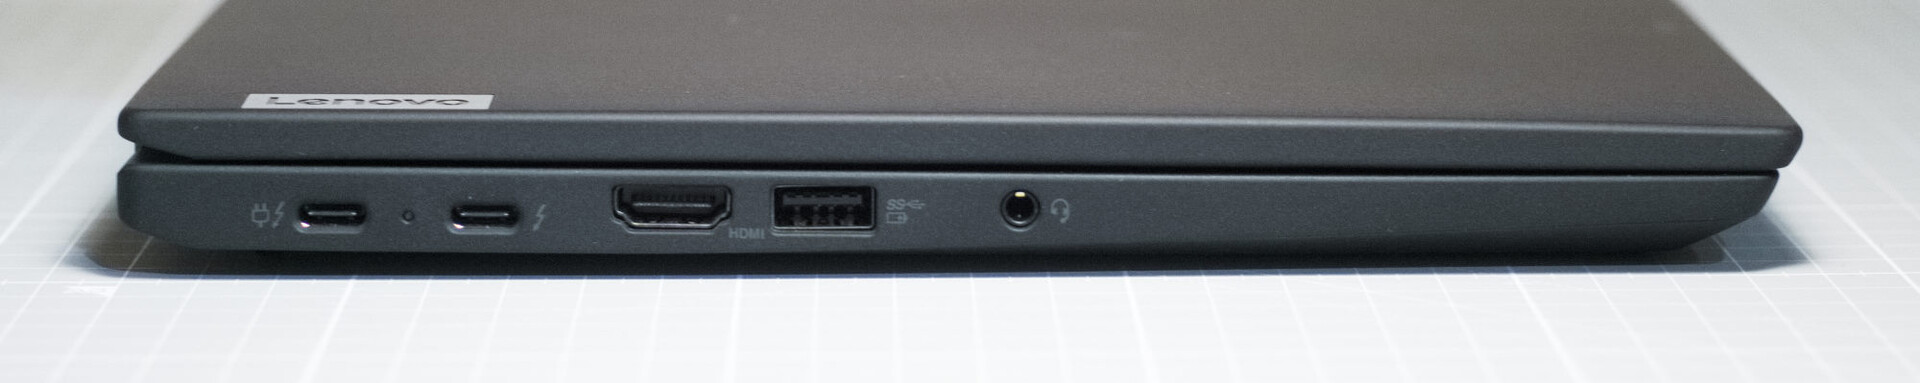
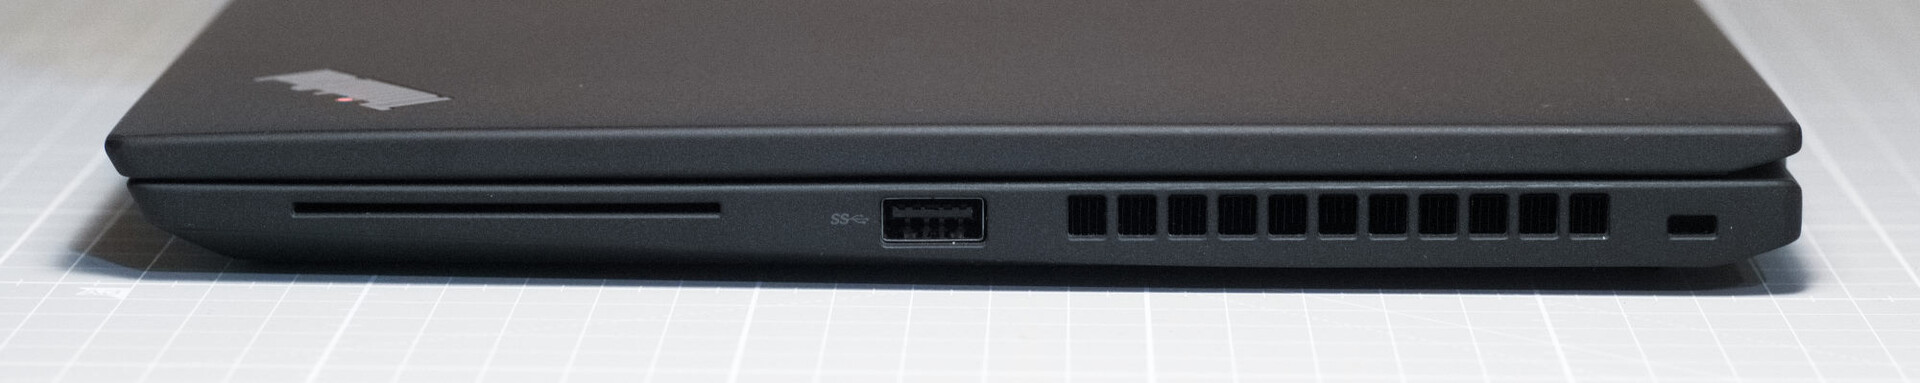
ThinkPad上的大多数端口都在左侧。右侧只有一个USB接口和一个智能卡读卡器。SIM卡插槽在办公笔记本电脑的背面有些隐藏。纳米SIM卡适合放在这里。两个USB-C端口都提供完整的功能,即Thunderbolt 4.0、DisplayPort和PowerDelivery。因此,联想的对接站的专有端口已经被取消了。
沟通
通过Wi-Fi 6E,联想ThinkPad X13达到了最先进的水平。英特尔AX211模块与GT-AXE11000一起提供了非常高的传输率。在我们的测试设备中提供了非常高的传输率。然而,这里必须提到的是,安装的Windows 10不支持6-GHz频段。除此之外,该笔记本电脑还支持蓝牙5.2。安装的LTE调制解调器可以连接到互联网,除了可用的WLAN。它支持两张SIM卡。连接可以通过nano-SIM卡或eSIM卡建立。
网络摄像头
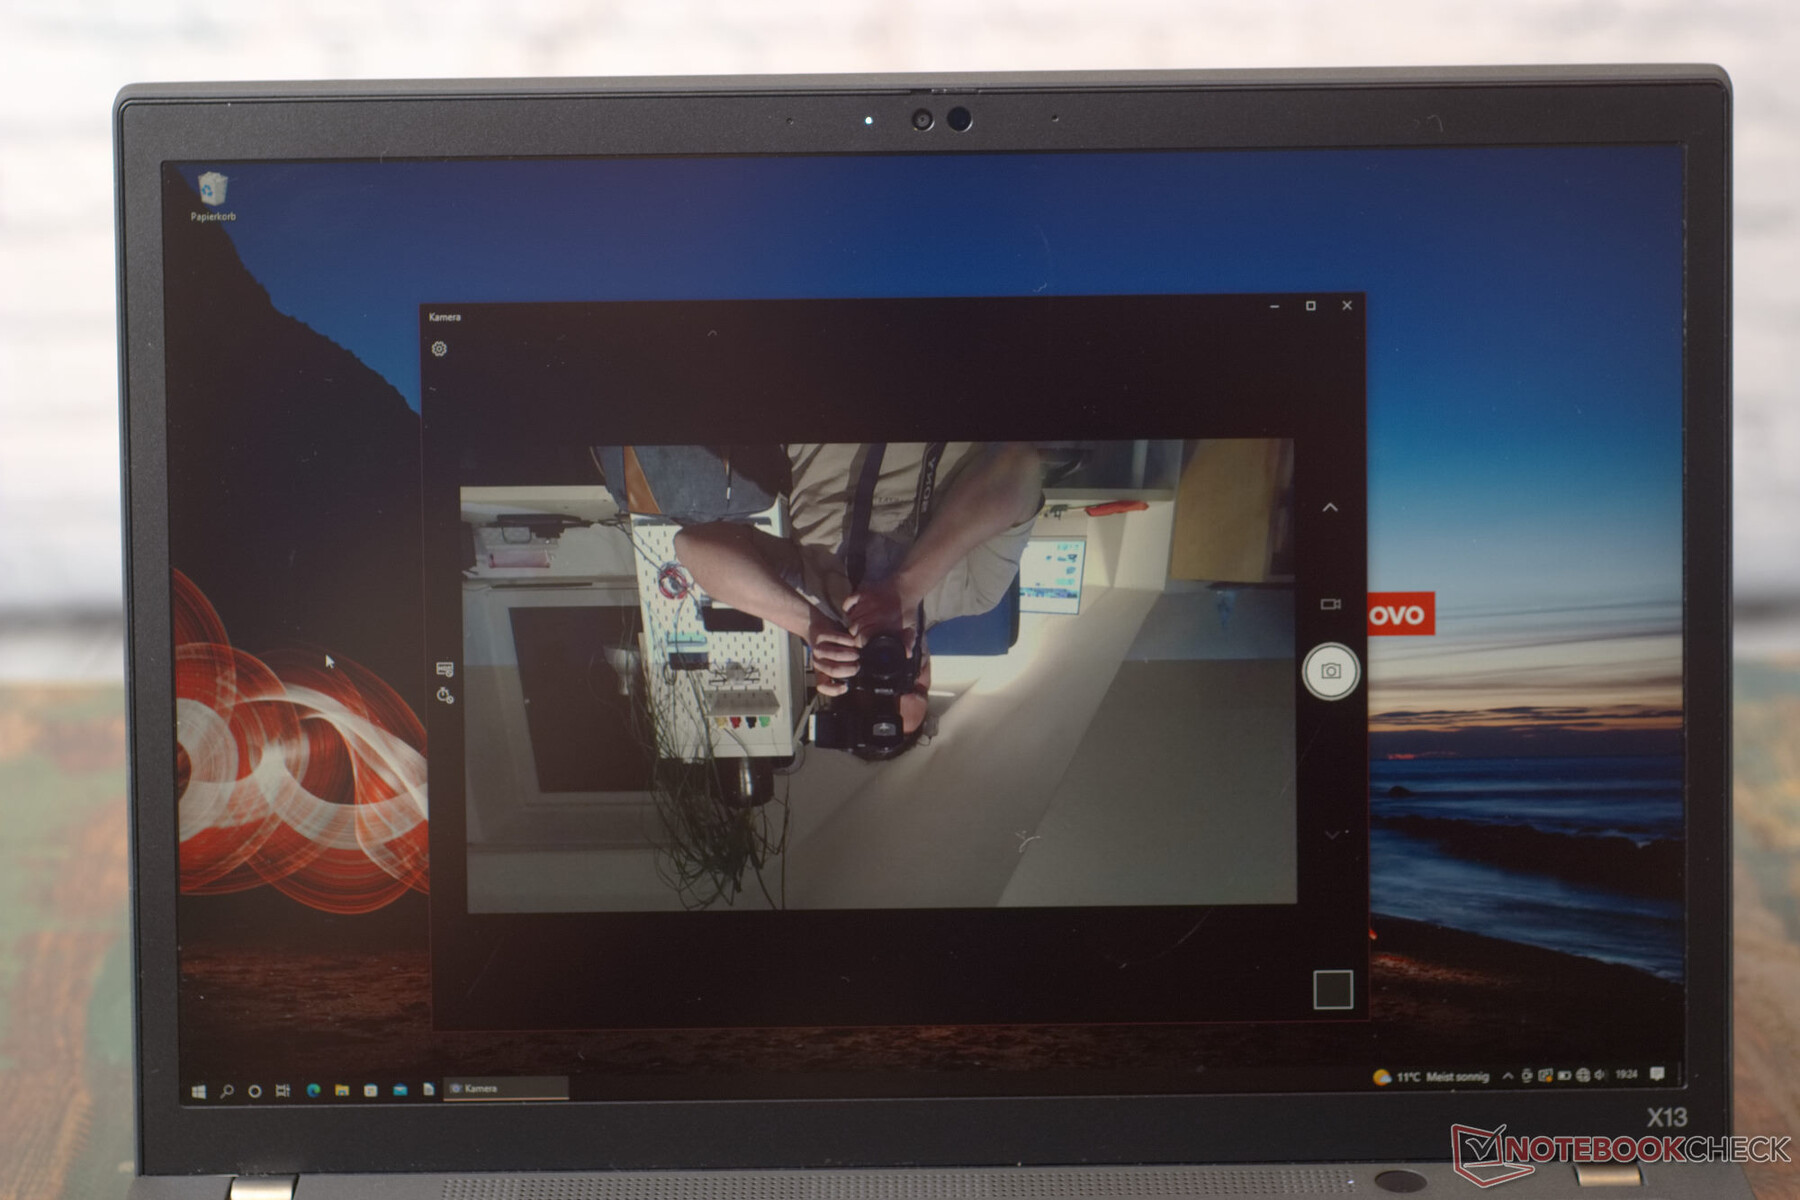
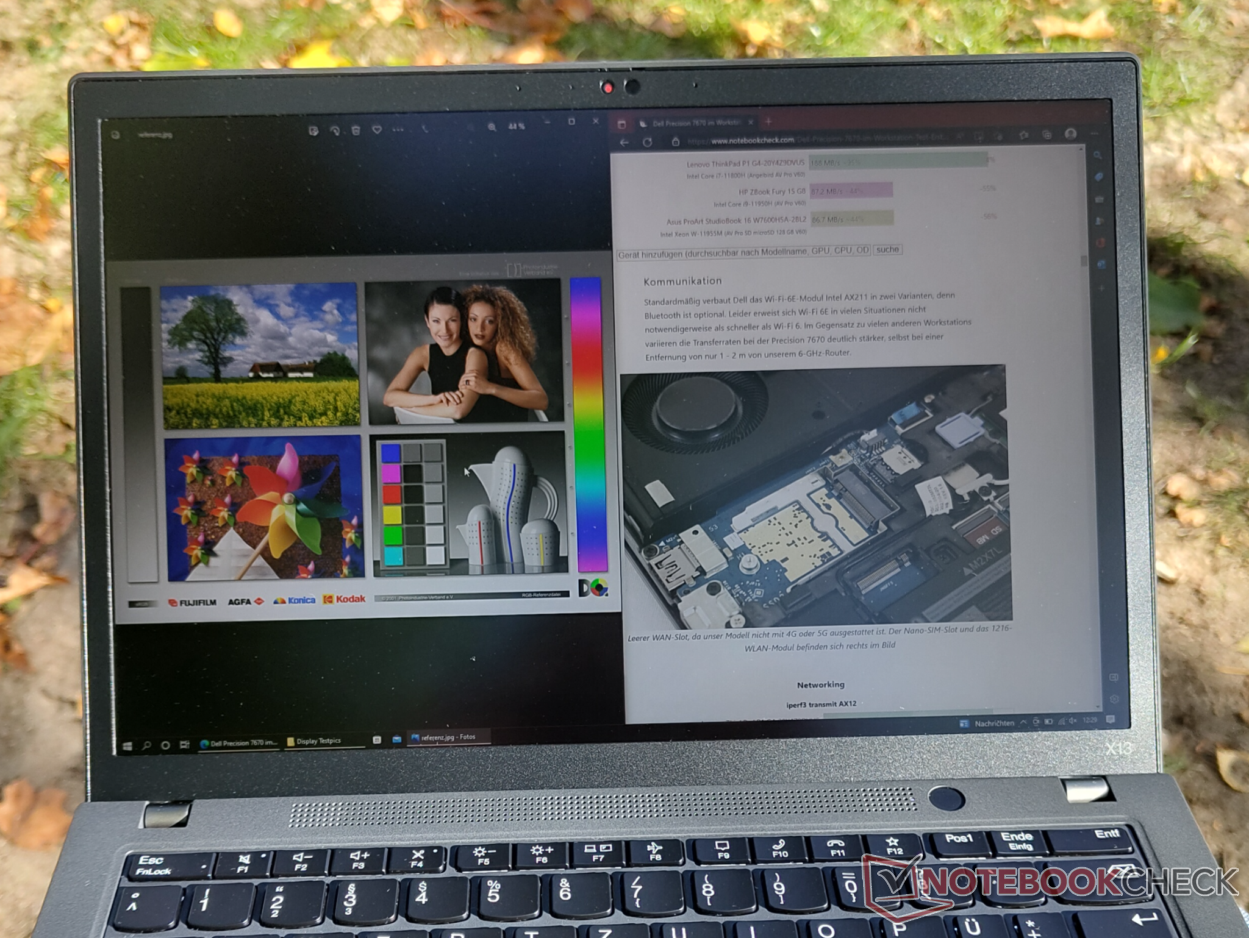
联想ThinkPad X13中支持Windows Hello的网络摄像头具有全高清分辨率,只要光线好,就能产生高对比度的清晰图像。然而,这里的镜头有一个明显的鱼眼效应。下面的测试图清楚地显示了图片向边缘扭曲的程度。在Windows 10 22H2更新后,网络摄像头出现了一个驱动错误。只要笔记本电脑从节能模式打开,摄像头的图像就会颠倒过来。然后,通过网络摄像头的Windows Hello就不能工作了。


安全问题
ThinkPad X13提供了许多不同的方法来保证设备的安全。右侧的Kensington锁槽可用于物理安全。在这里你还可以找到智能卡读卡器,它可以实现访问控制。指纹扫描仪被内置在电源按钮中。这也可以在启动前激活,从而保护设备免受操作系统的操纵。该设备的网络摄像头也有面部识别的选项。最后,英特尔酷睿i5的安全功能也可以使用。
辅料
ThinkPad X13的包装很安全,几乎没有塑料,配件也最少。除了附带的65瓦USB-C电源适配器外,盒子里只有文件。
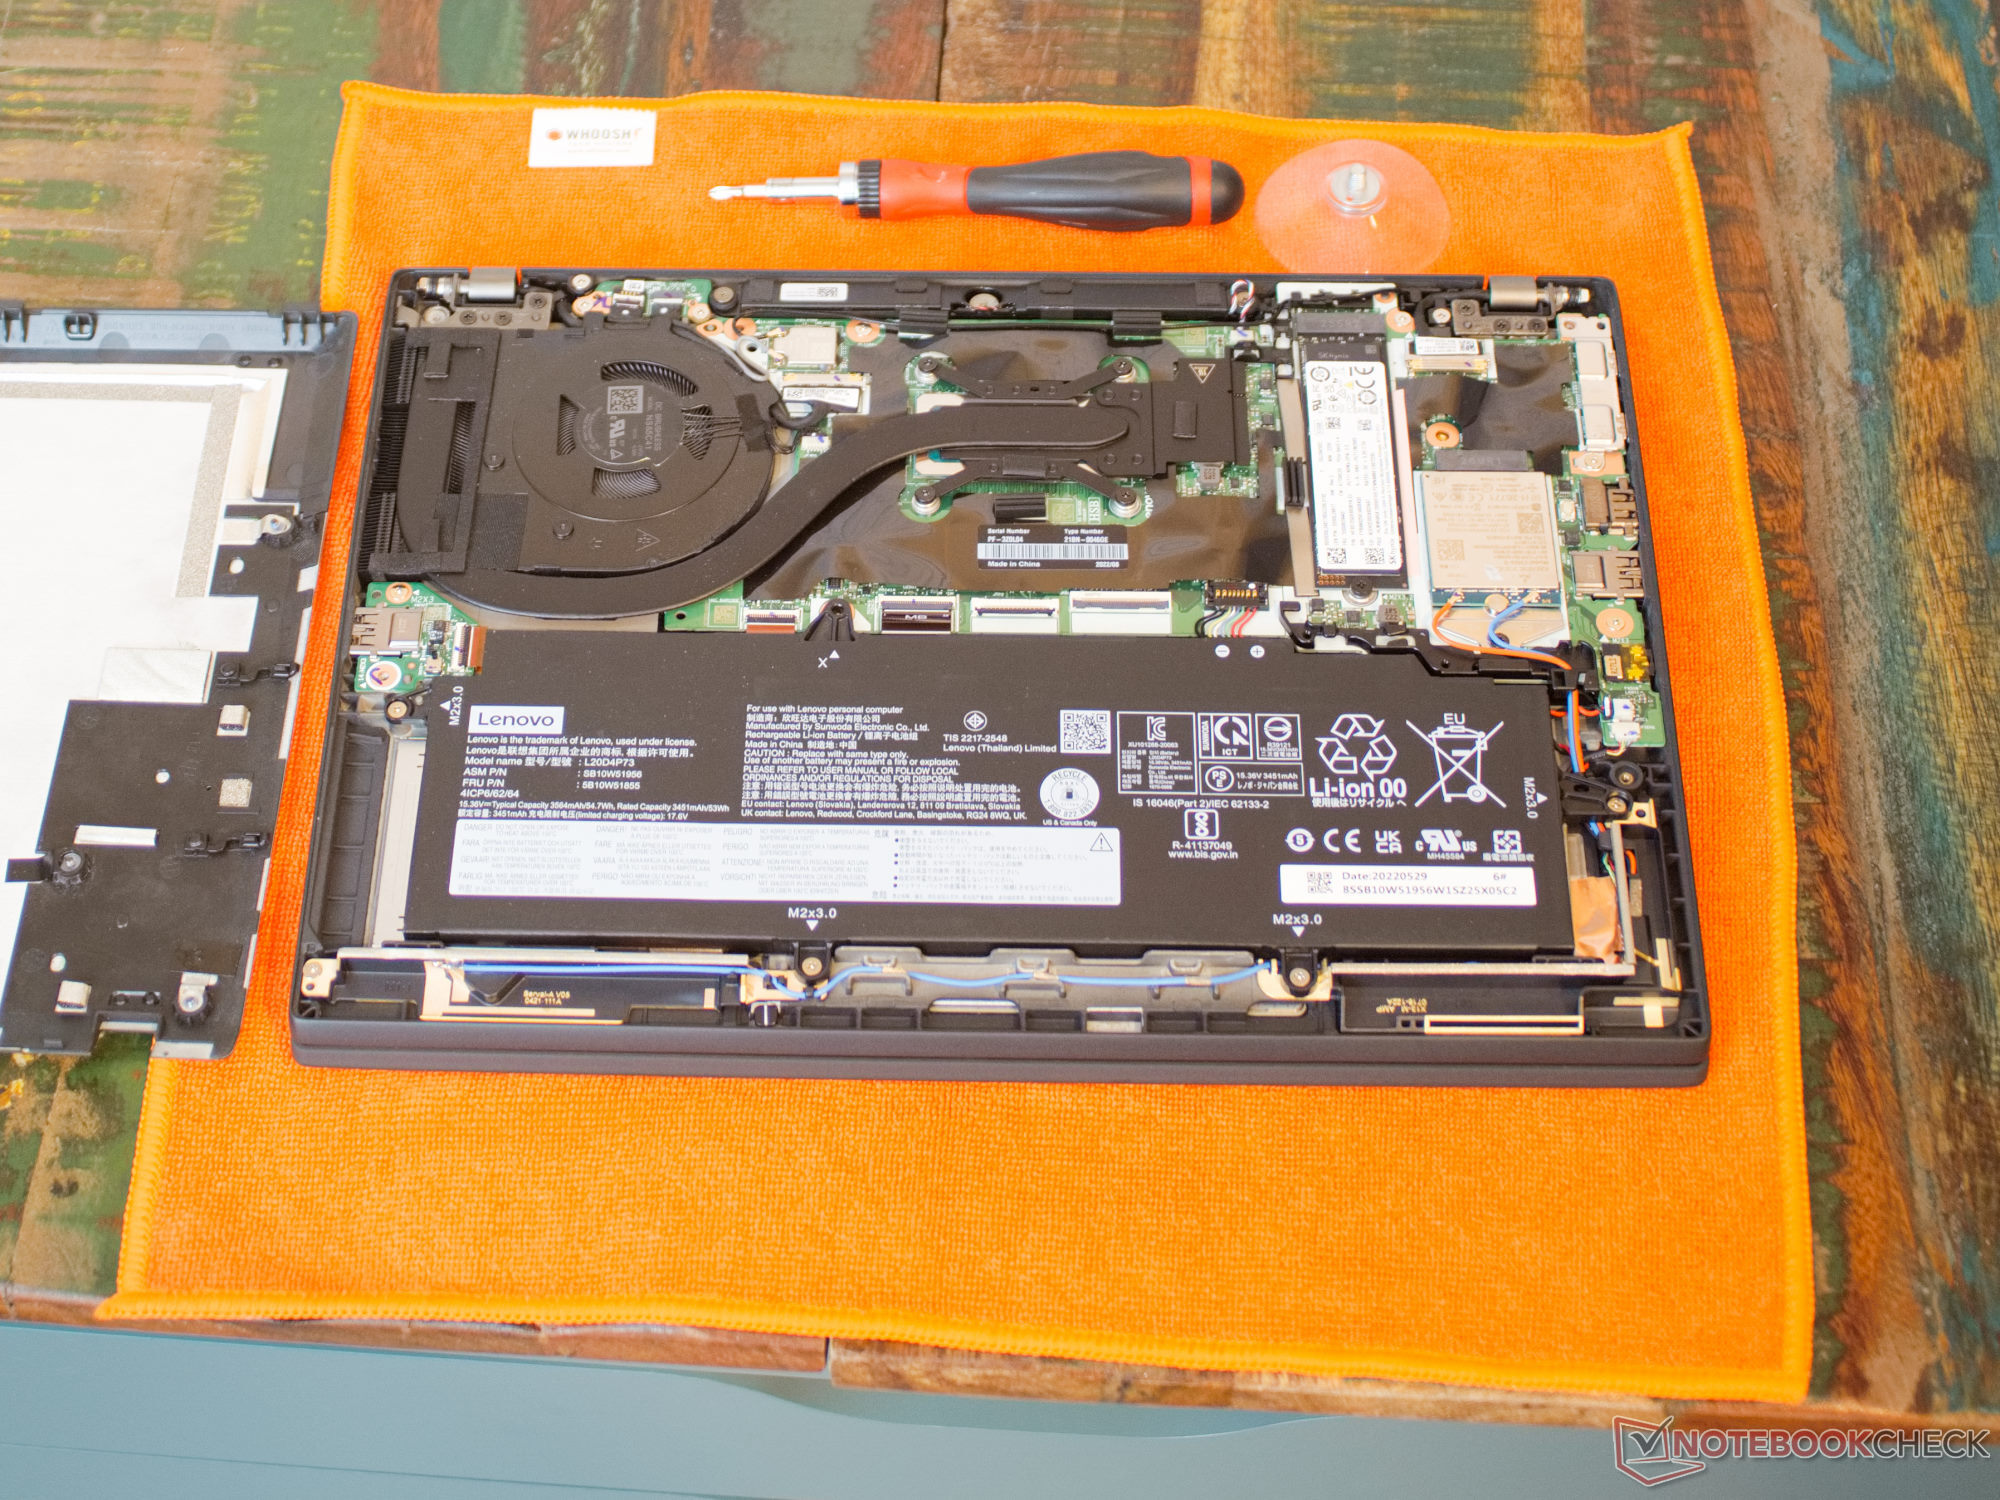
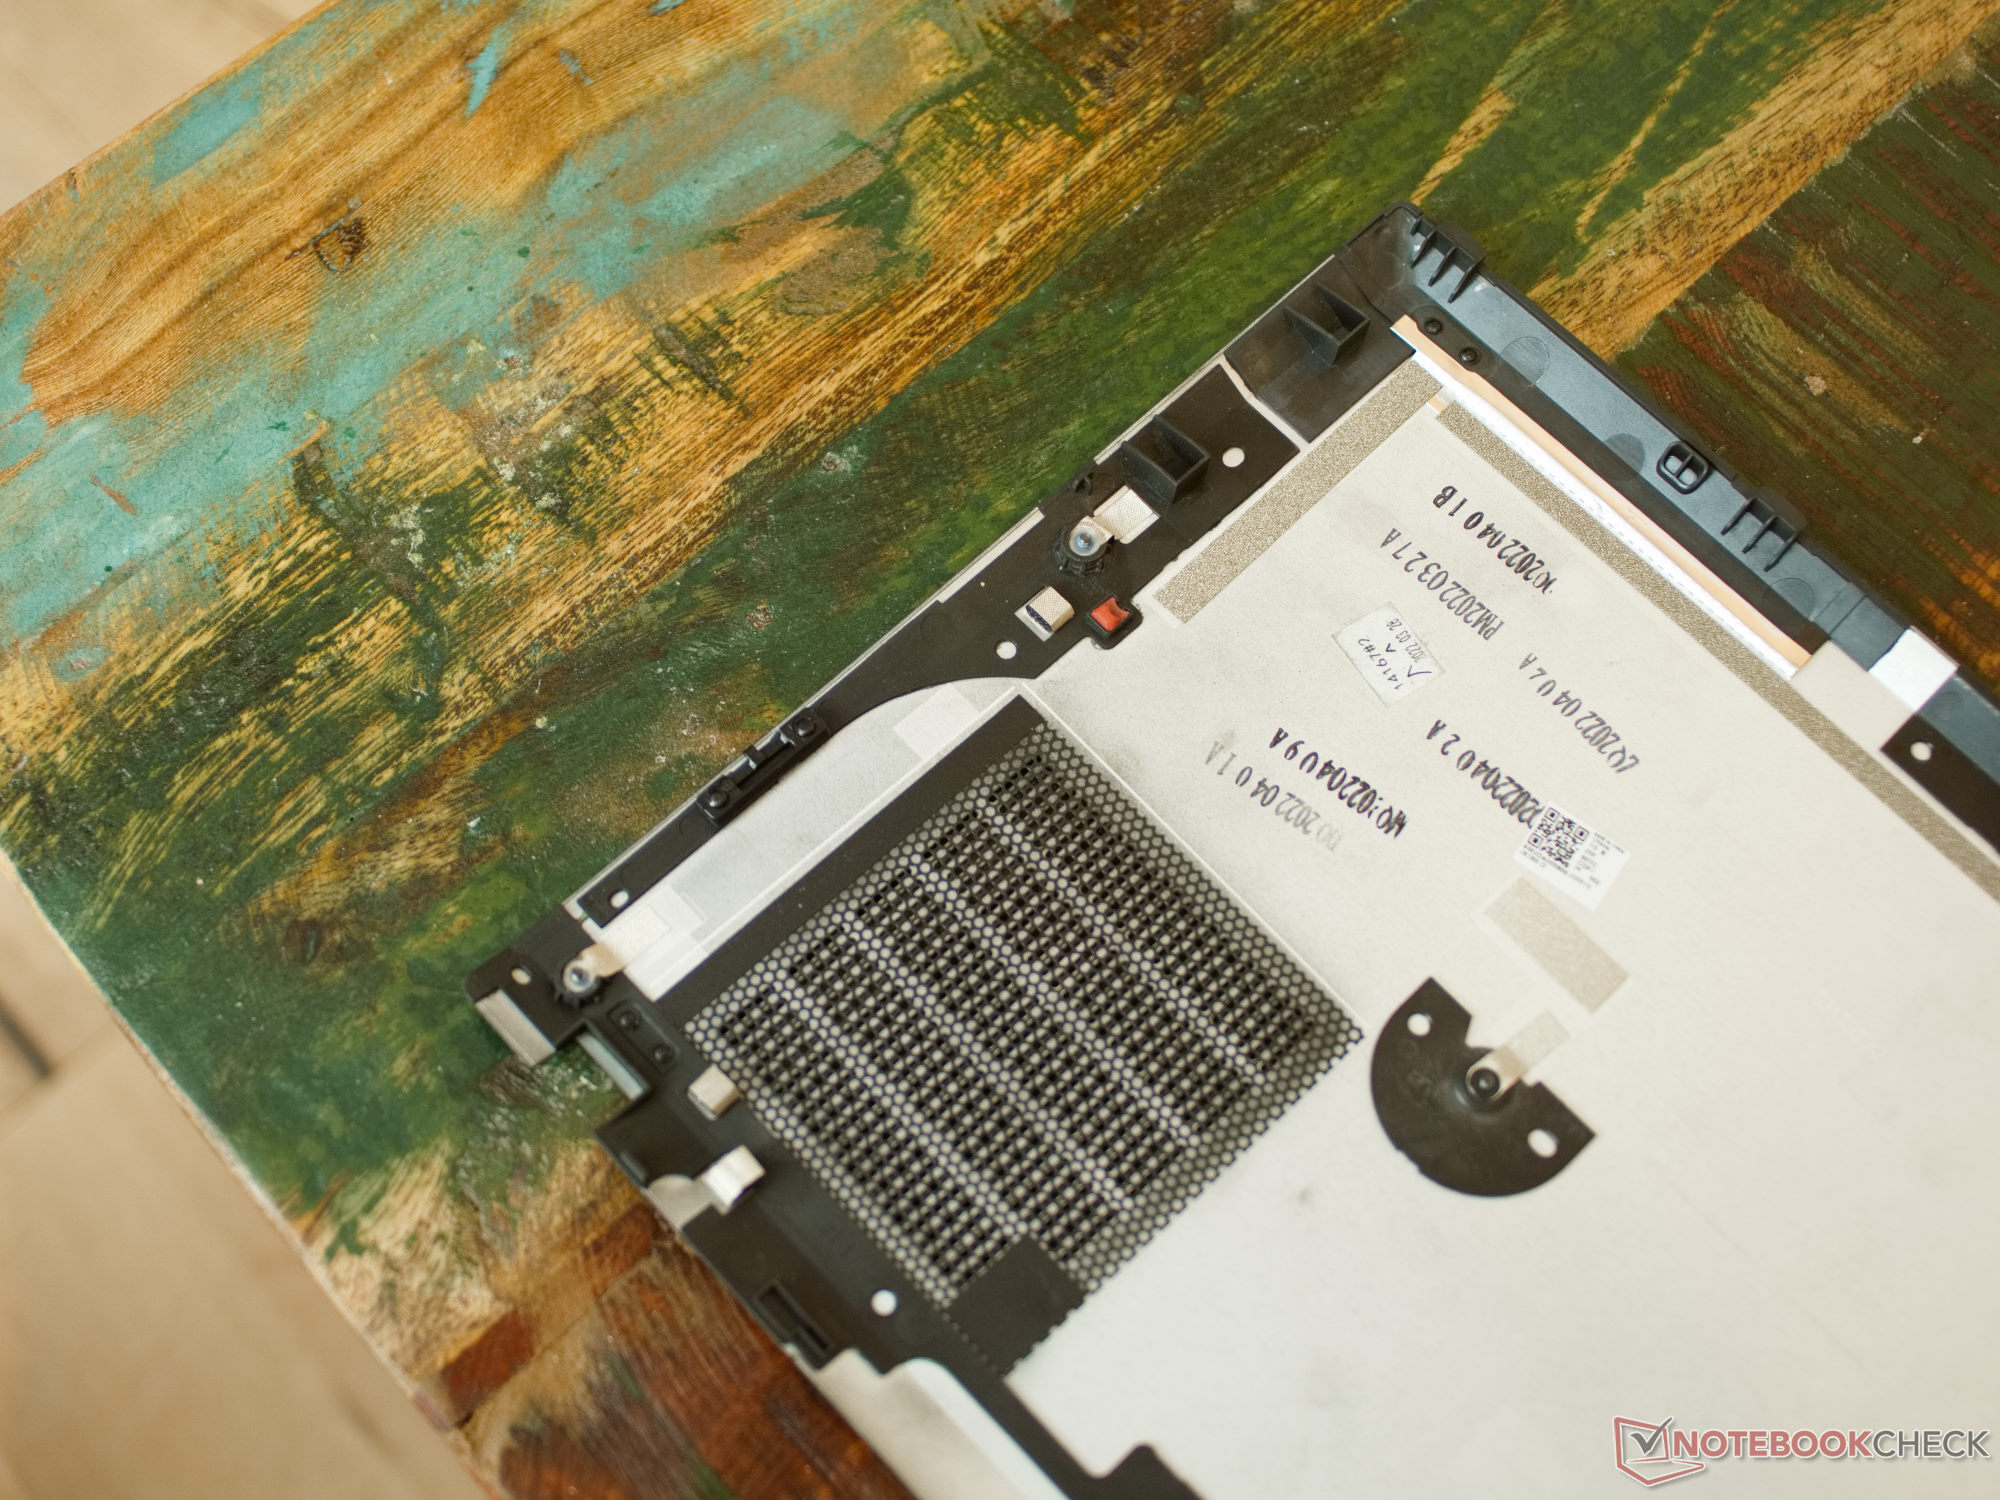
维护
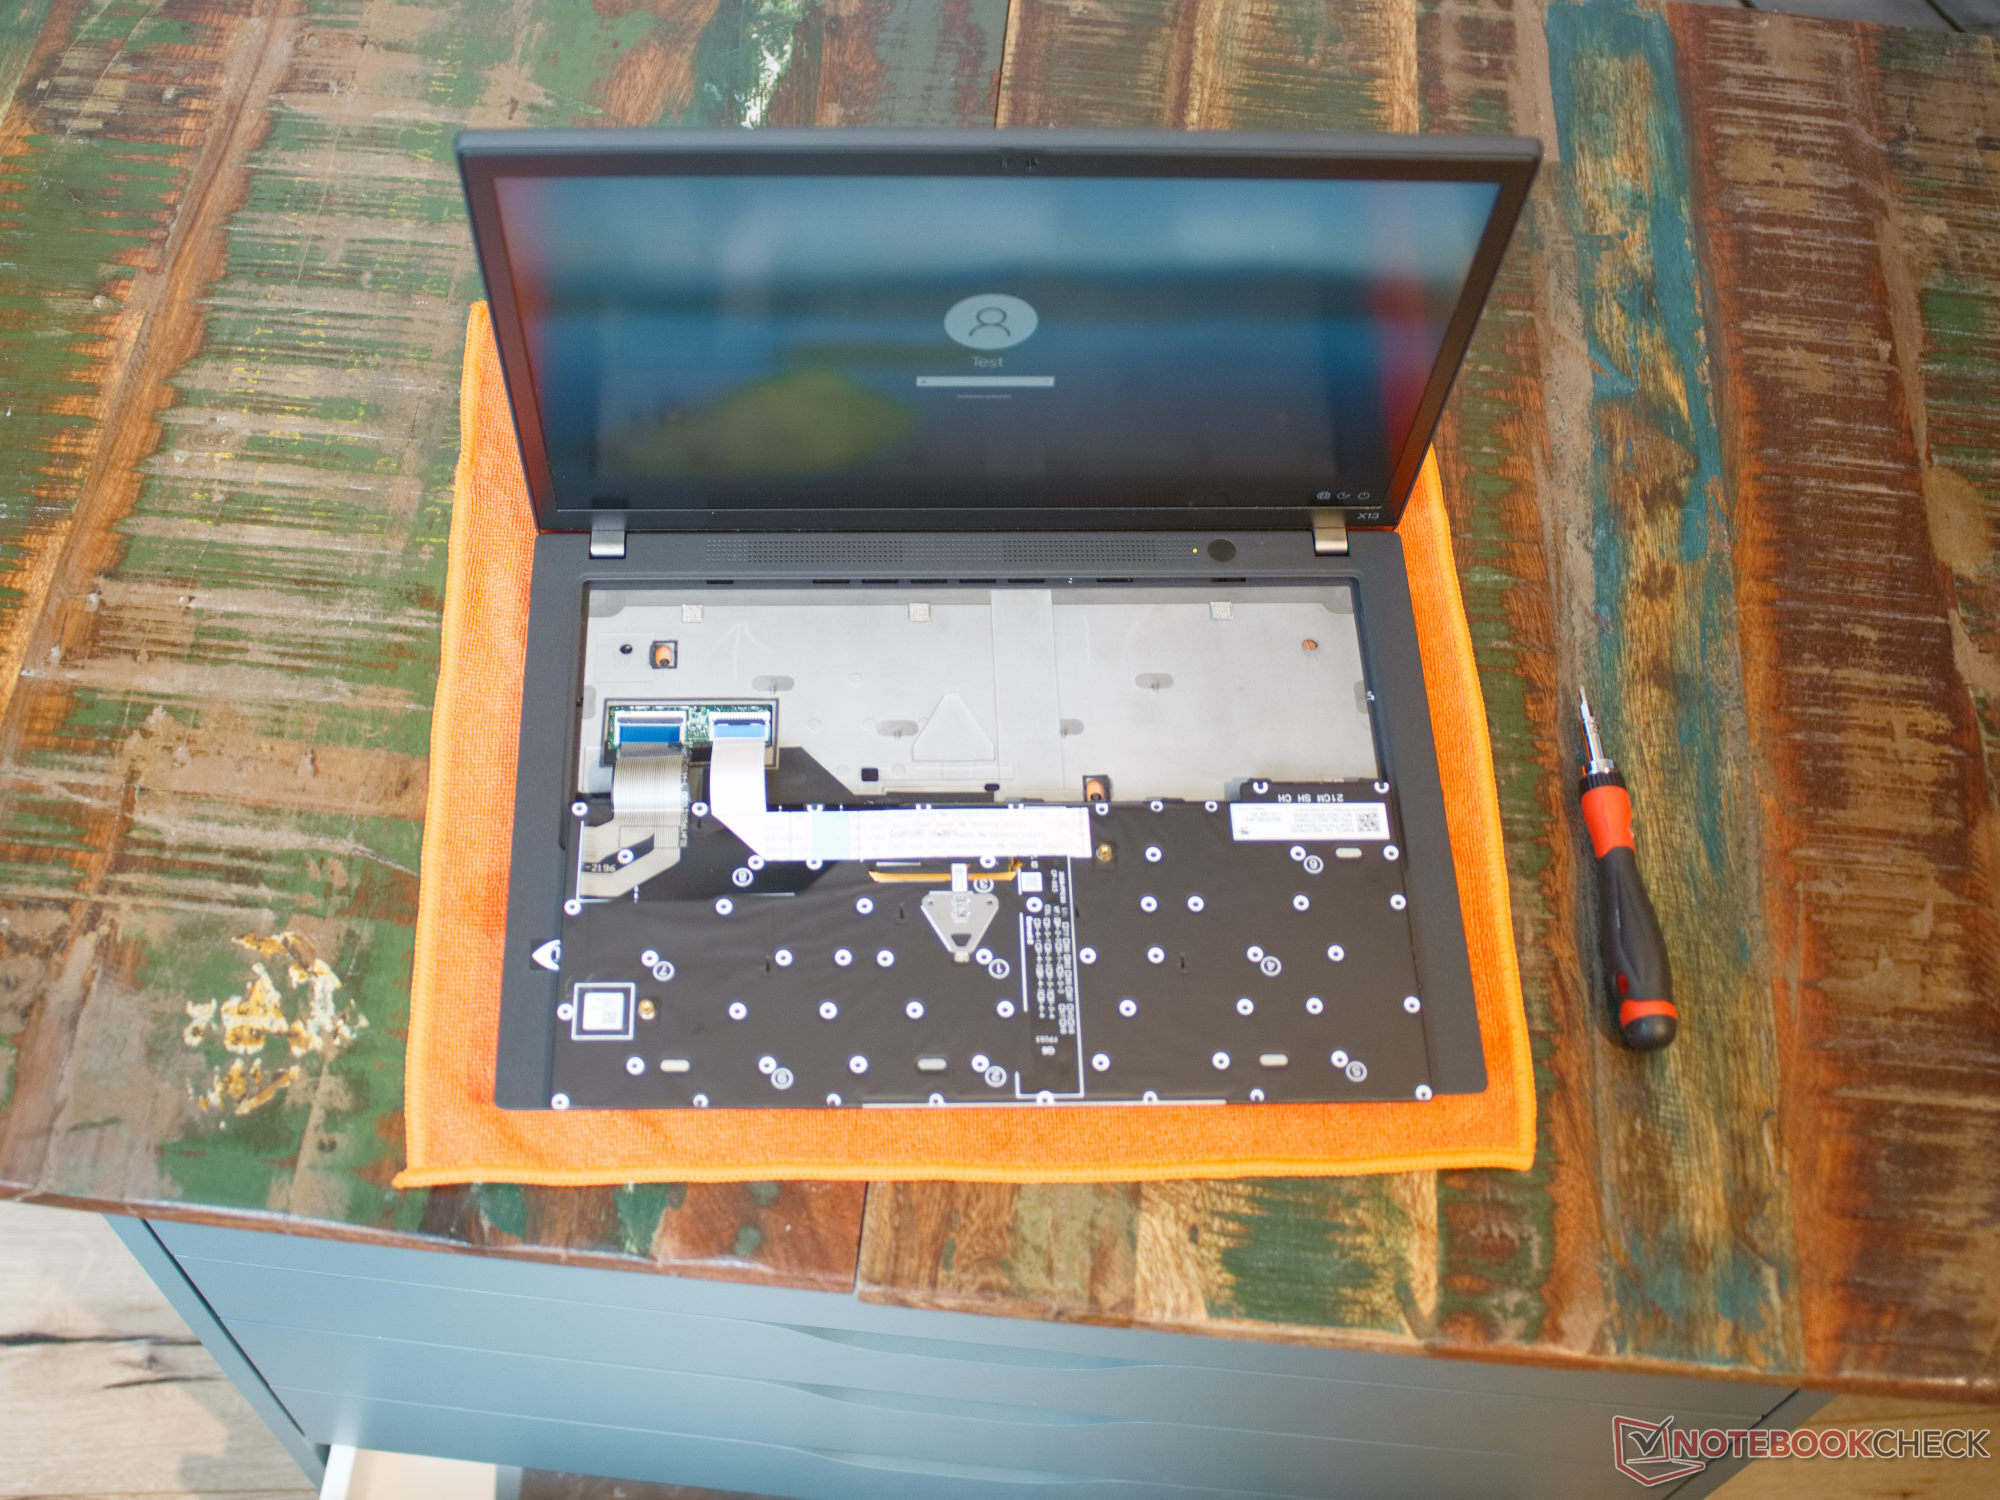
联想为许多笔记本电脑提供了大量的维护手册。硬件维护手册(PDF)也可以找到ThinkPad X13第3代。根据该手册,该笔记本电脑很容易打开。在里面,我们发现一个可拆卸的固态硬盘以及一个插入式的LTE模块。工作内存是焊接的,不能扩展。笔记本的键盘在损坏的情况下特别容易更换。联想笔记本电脑背面有两颗螺丝固定它。
担保
我们的评测样品有36个月的保修期。保修状态可以随时通过联想的商业优势计划进行检查。
输入设备 - 平键
键盘处于ThinkPad的典型水平。它有一个令人愉快的压力点。然而,大约1.5毫米的键程深度可以再高一点。红色的TrackPoint和一个触摸板可用于移动光标。然而,我们注意到,触摸板略微有些摇晃。
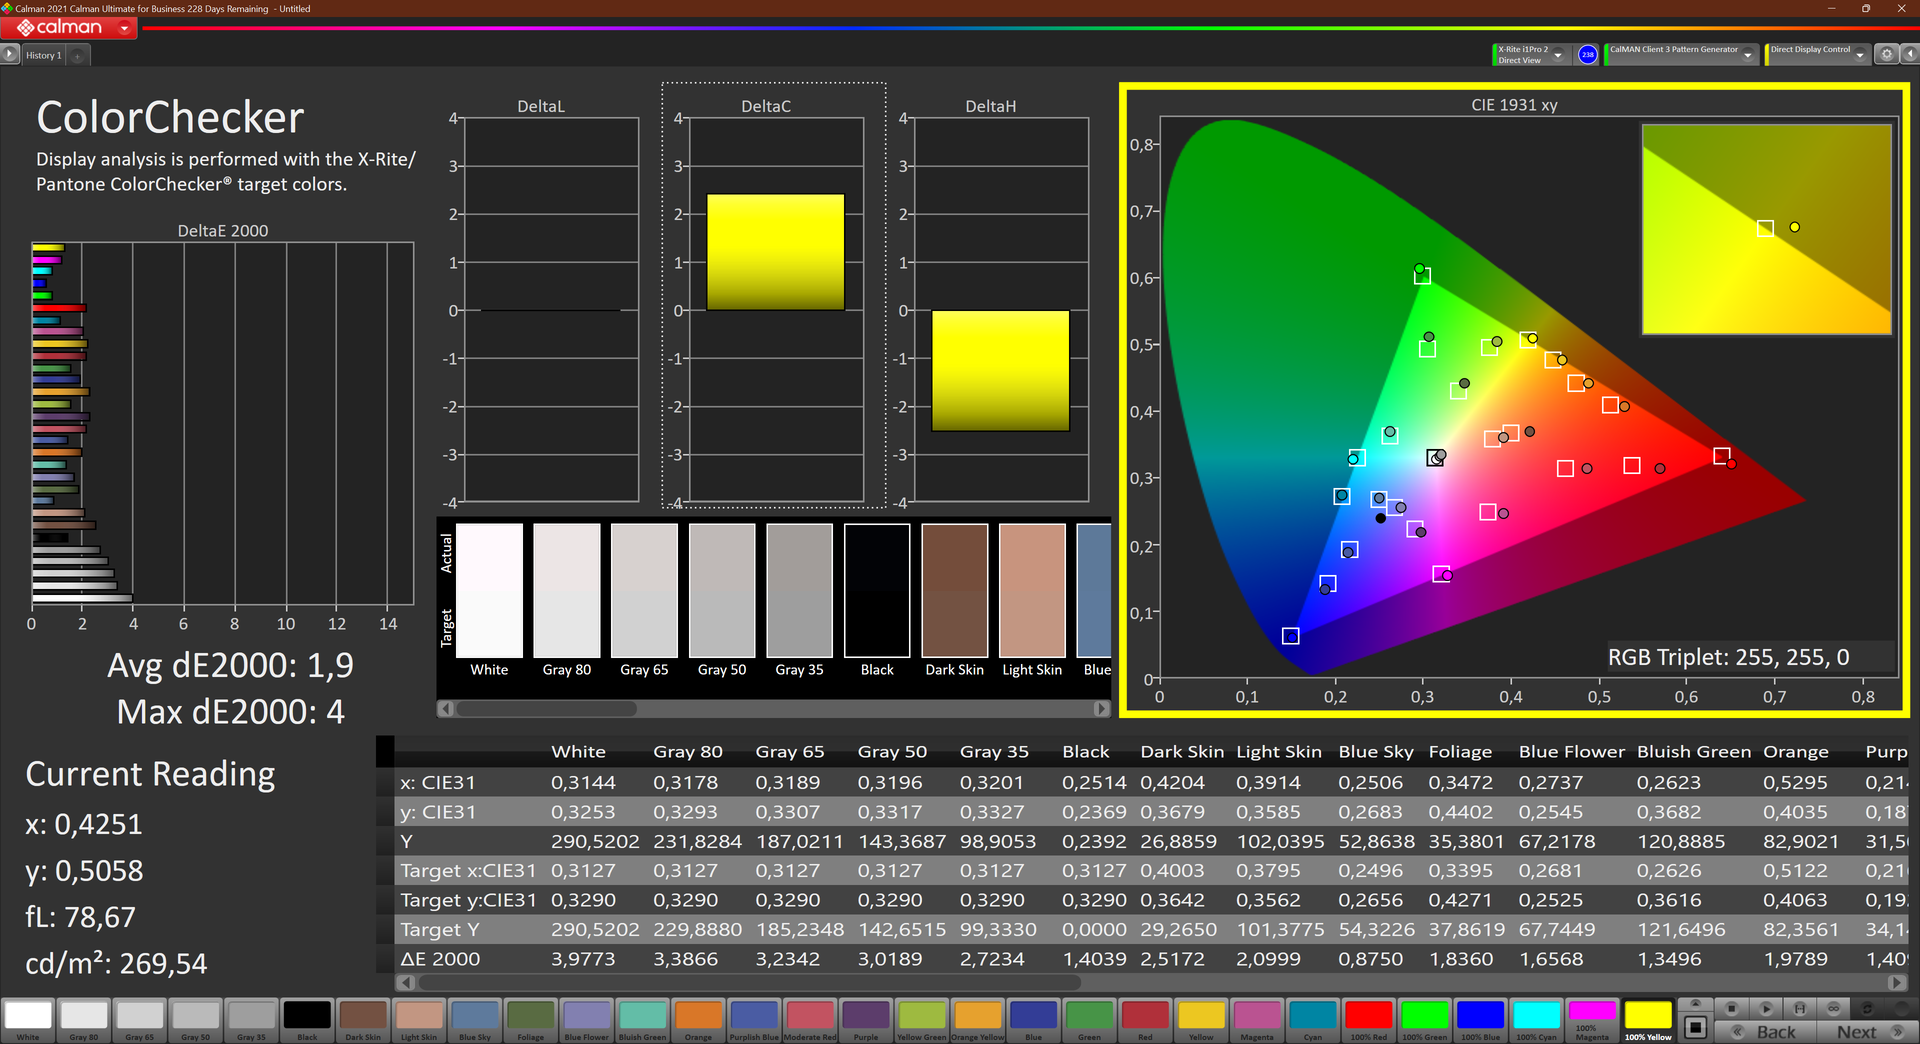
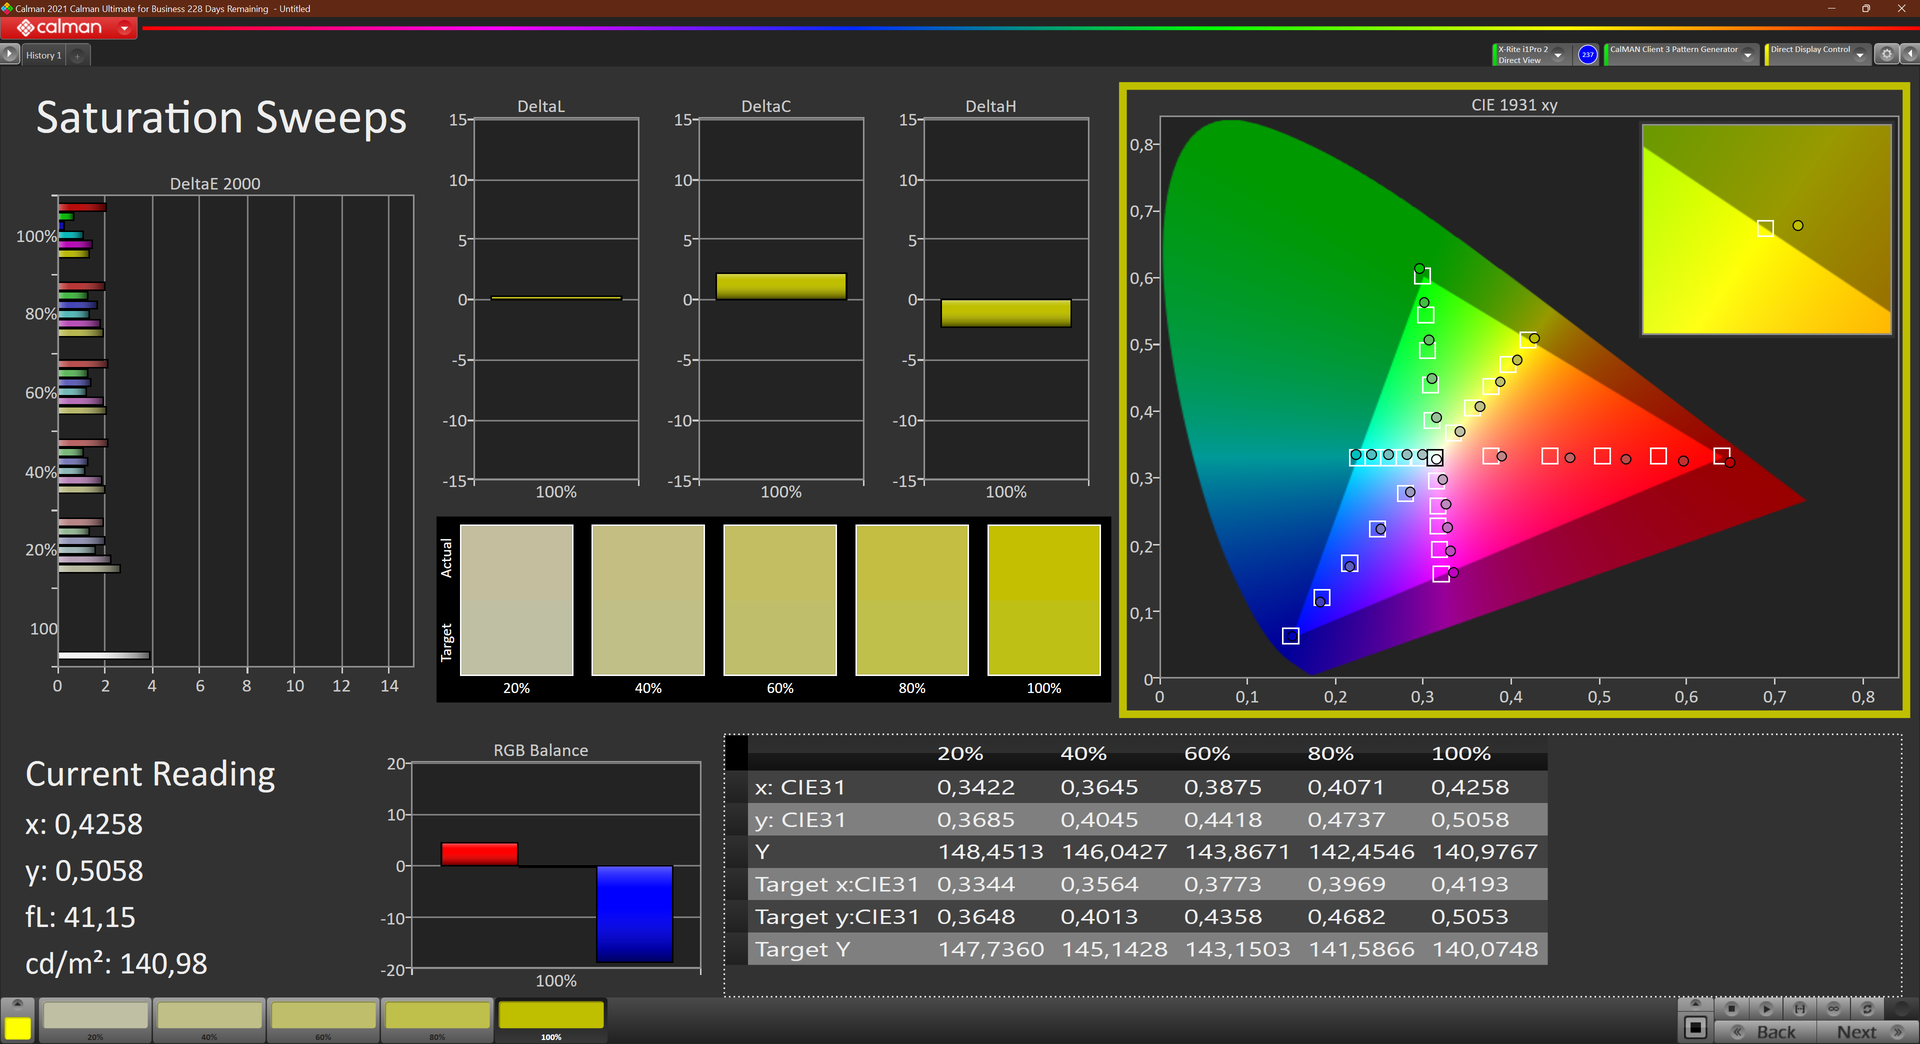
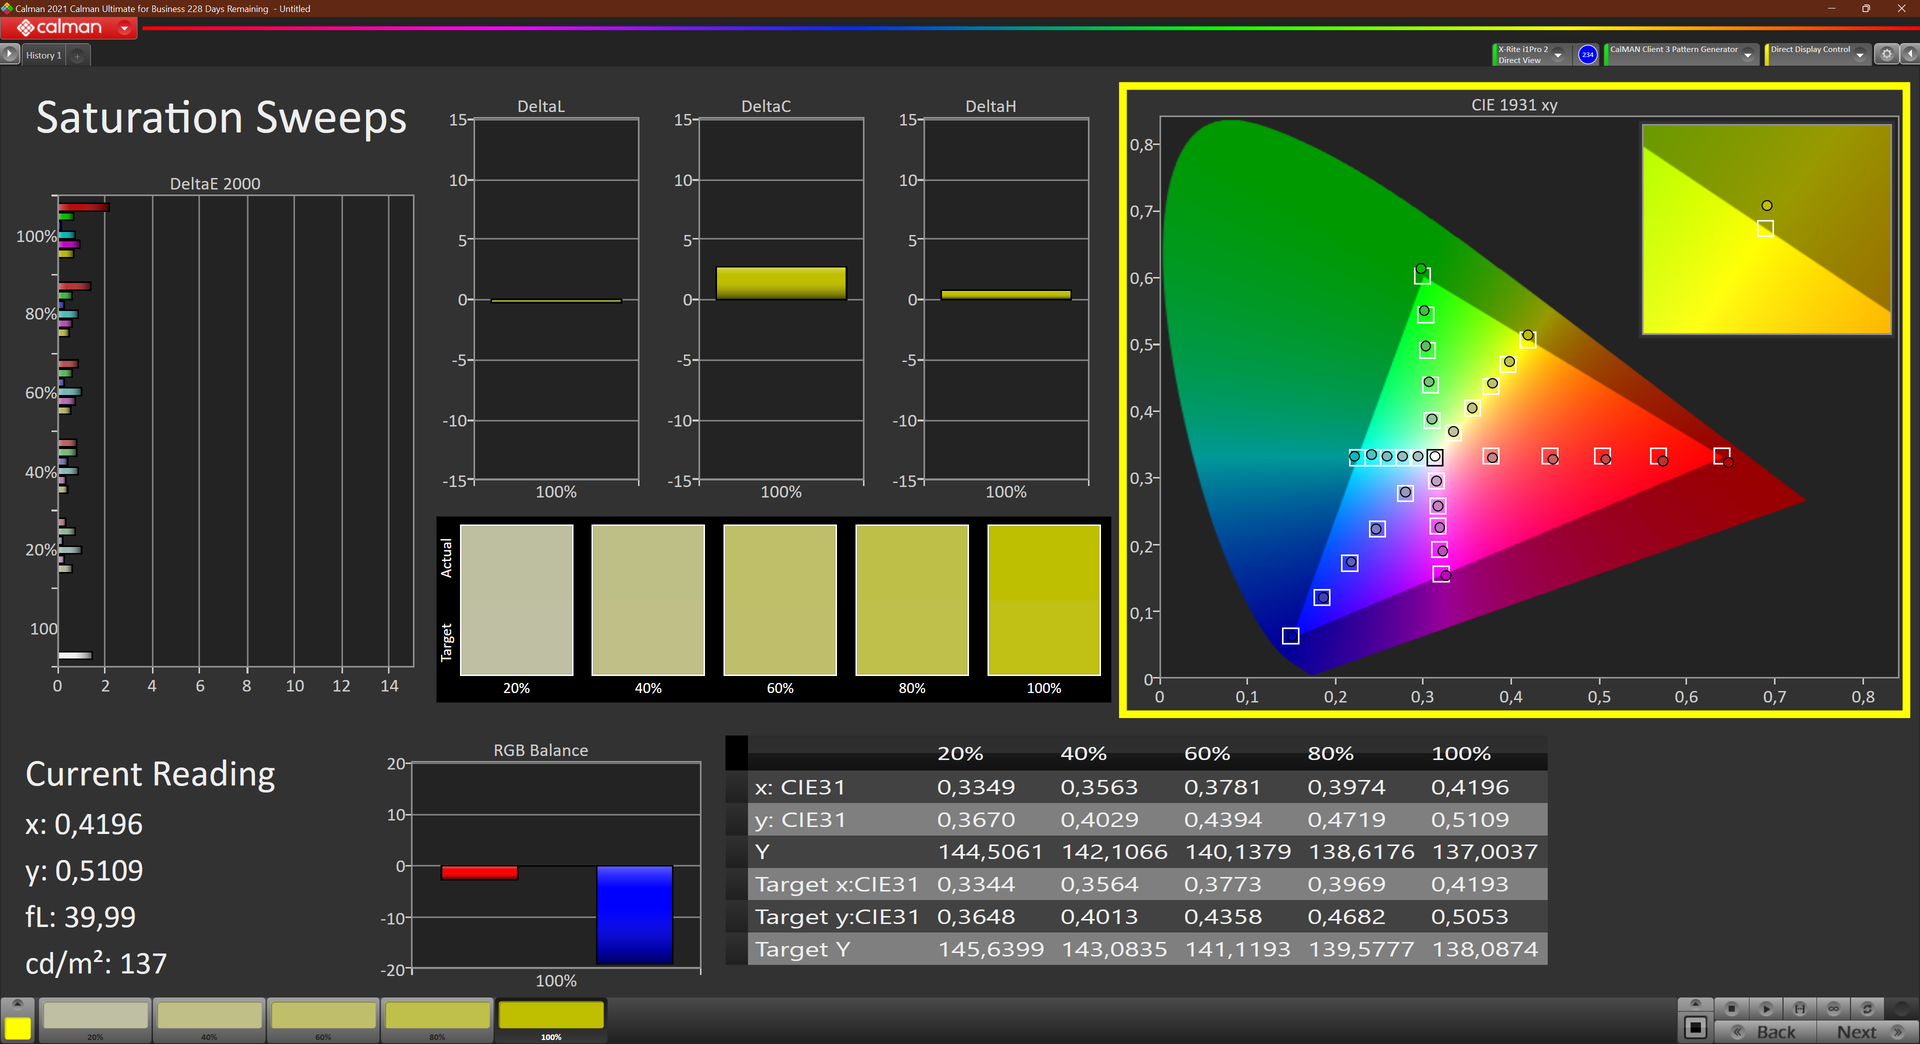
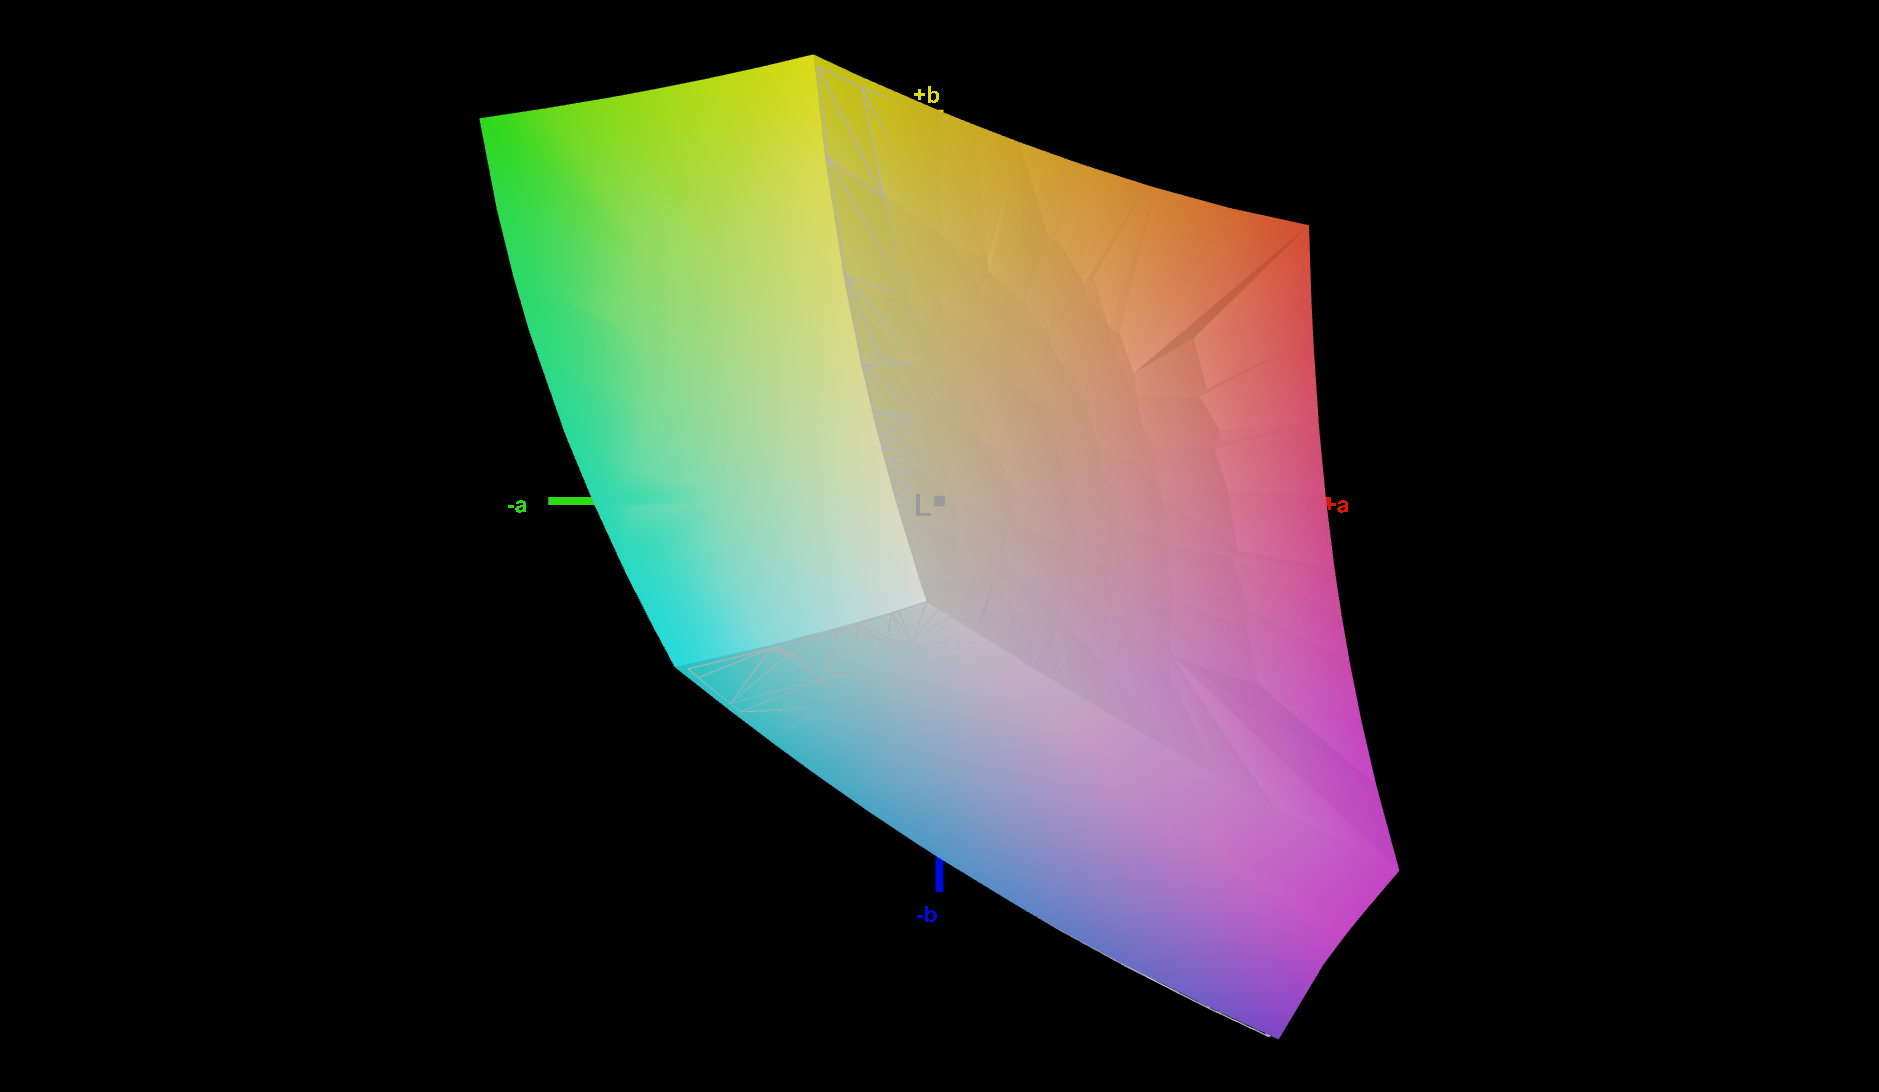
显示屏 - 16:10,色彩还原度非常好
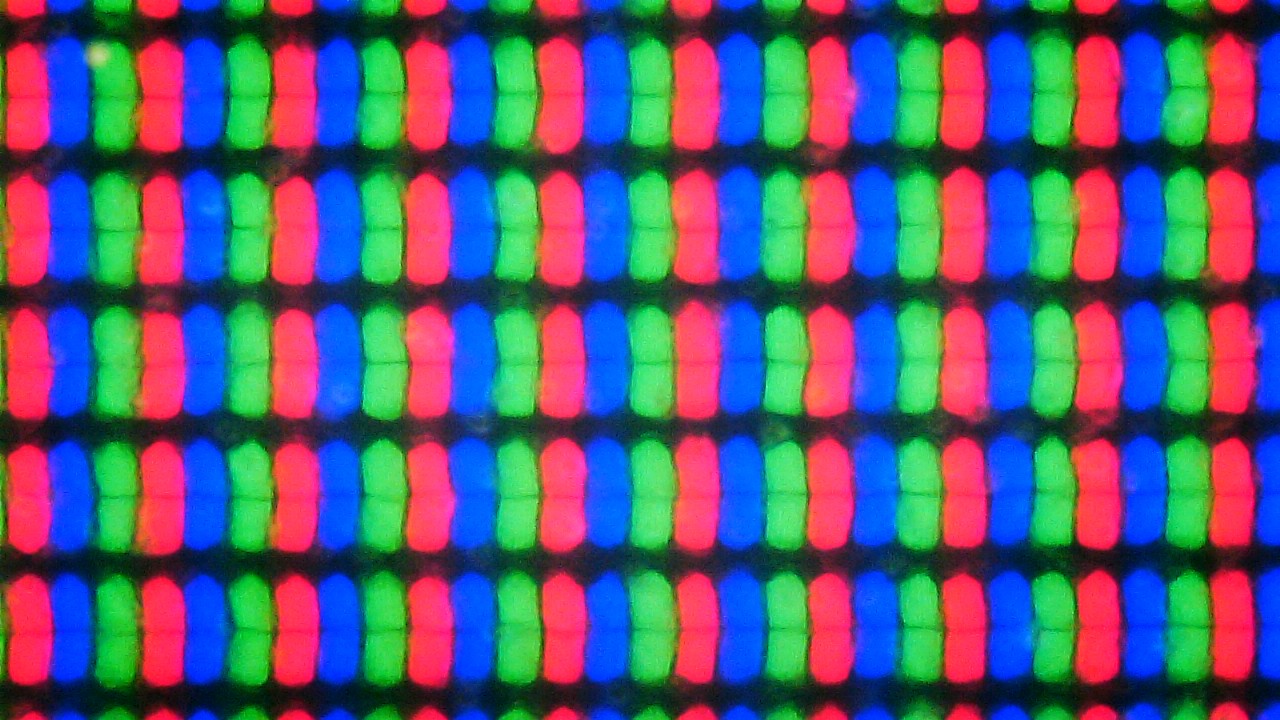

这款笔记本的屏幕是16:10格式,分辨率为1920 x 1200像素。因此,这里的13英寸显示屏比类似的16:9显示屏有更多的屏幕面积可用。联想规定该面板的NTSC覆盖率为72%,亮度为300 cd/m²。
ThinkPad X13第三代采用了IPS级LCD。我们测量了哑光屏的平均亮度为288 cd/m²,因此它在这里落后于所有对手。不过,1381:1的高对比度和哑光表面还是确保了屏幕的良好可读性,即使是在户外。
屏幕的照明并不真正均匀。我们不仅测量到右角的亮度增加,而且用肉眼也能感觉到光晕。
除了300cd/m²的IPS面板,ThinkPad X13 G3的配置中还有另外两种选择。因此,可以选择300cd/m²的触摸显示屏以及500cd/m²的ePrivacy显示屏。所有这三种屏幕都是由联想指定的,具有相同的技术数据。
| |||||||||||||||||||||||||
Brightness Distribution: 88 %
Center on Battery: 290 cd/m²
Contrast: 1381:1 (Black: 0.21 cd/m²)
ΔE ColorChecker Calman: 1.9 | ∀{0.5-29.43 Ø4.71}
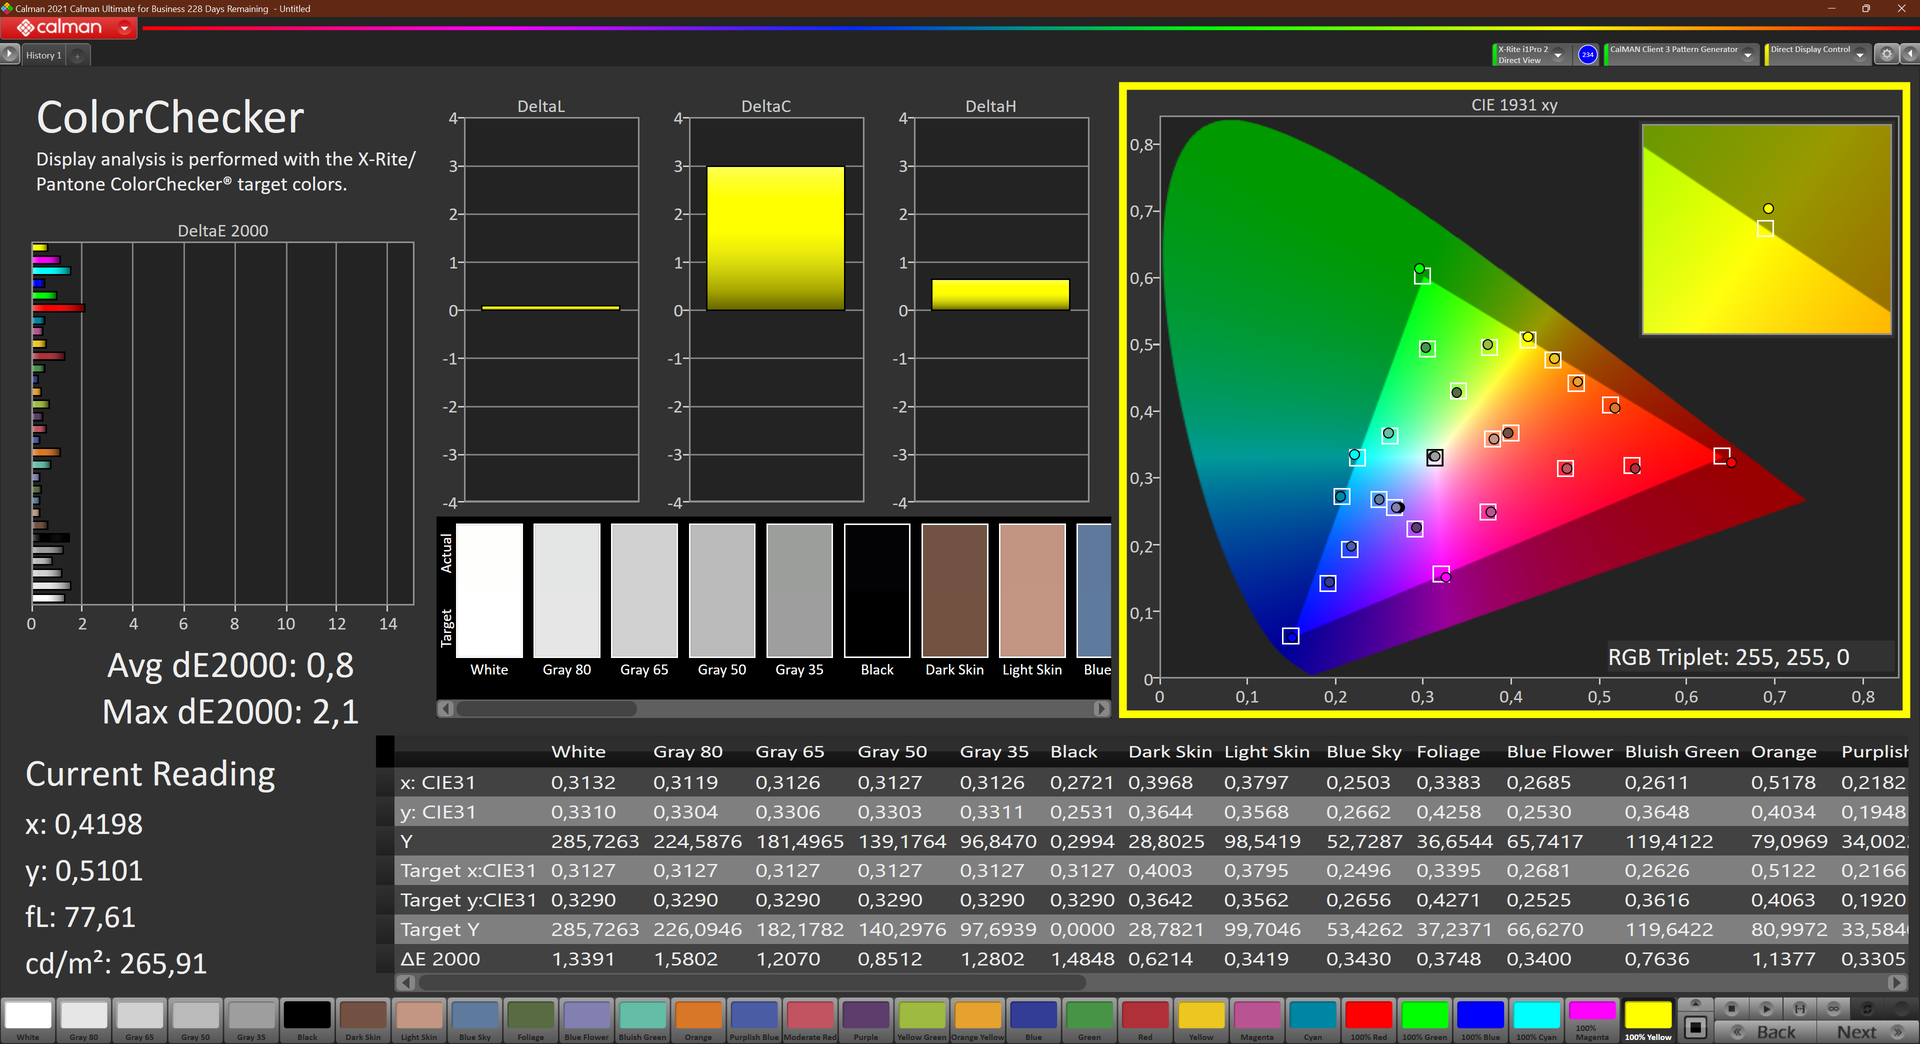
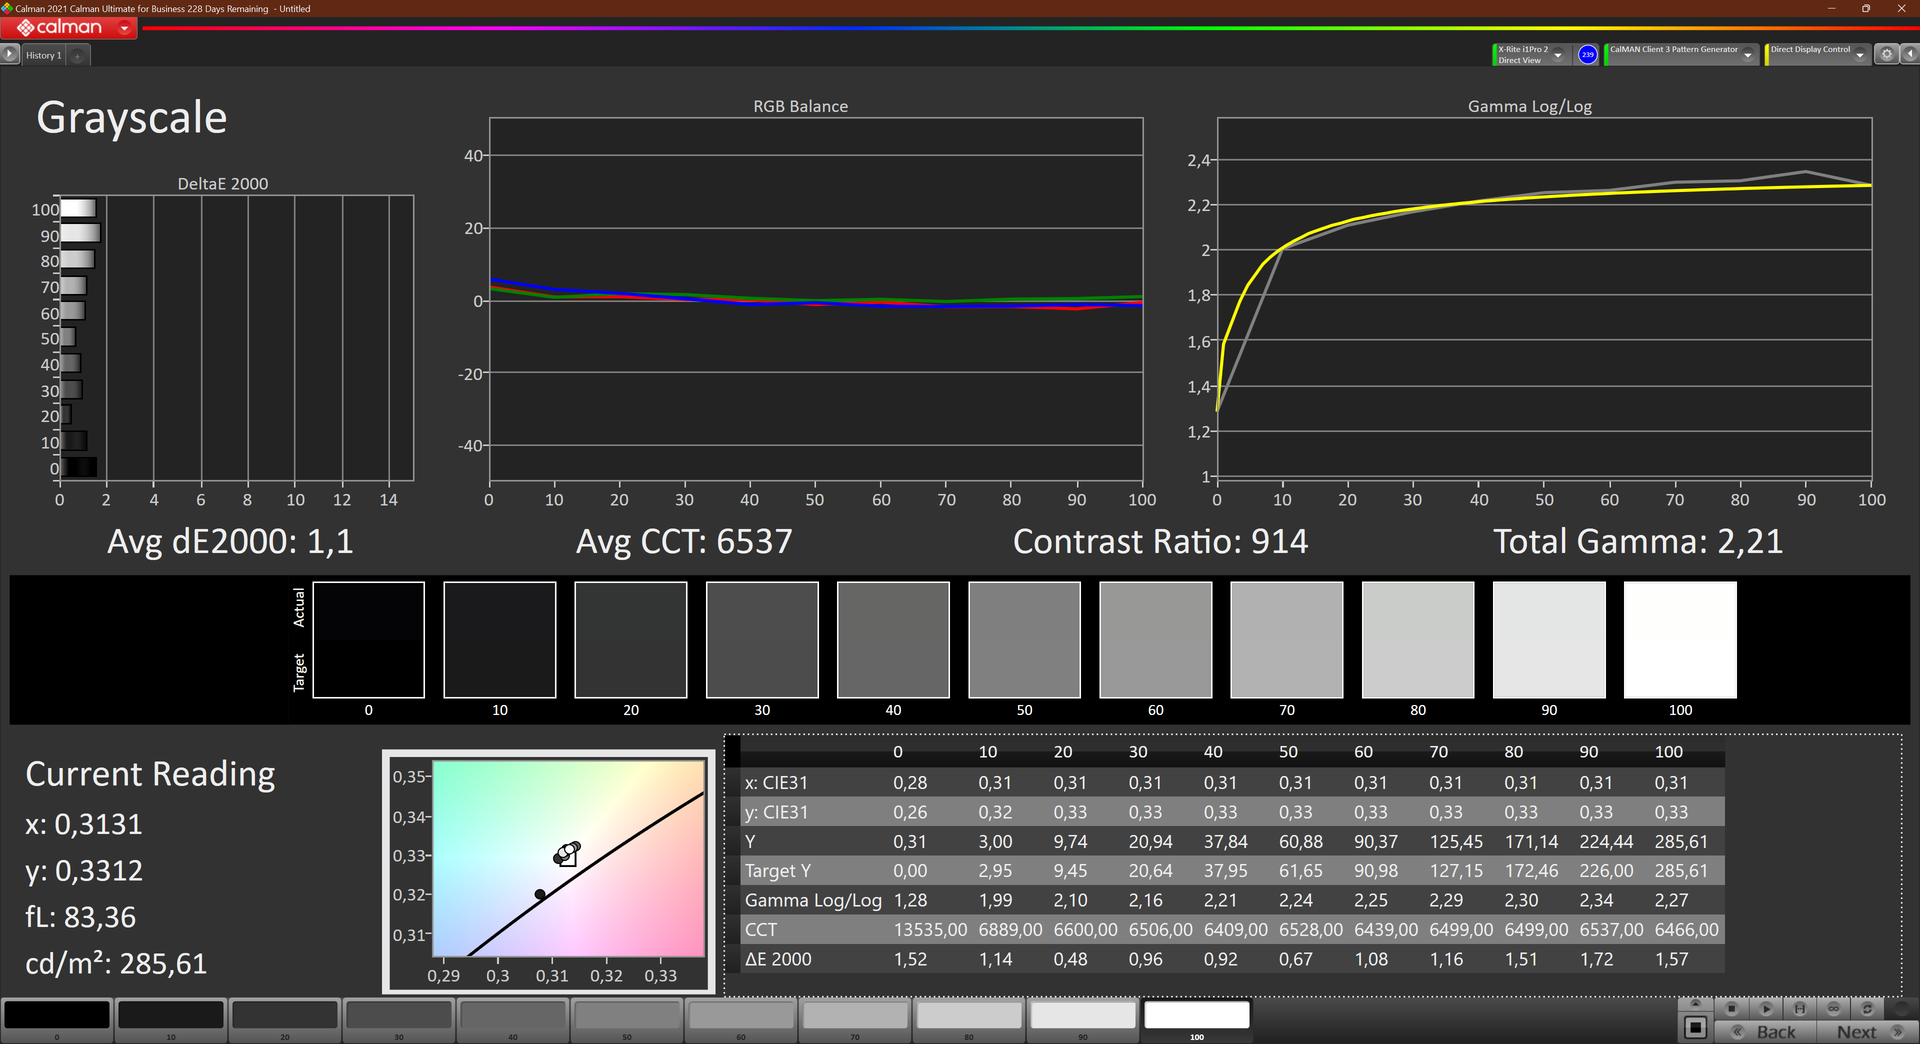
calibrated: 0.8
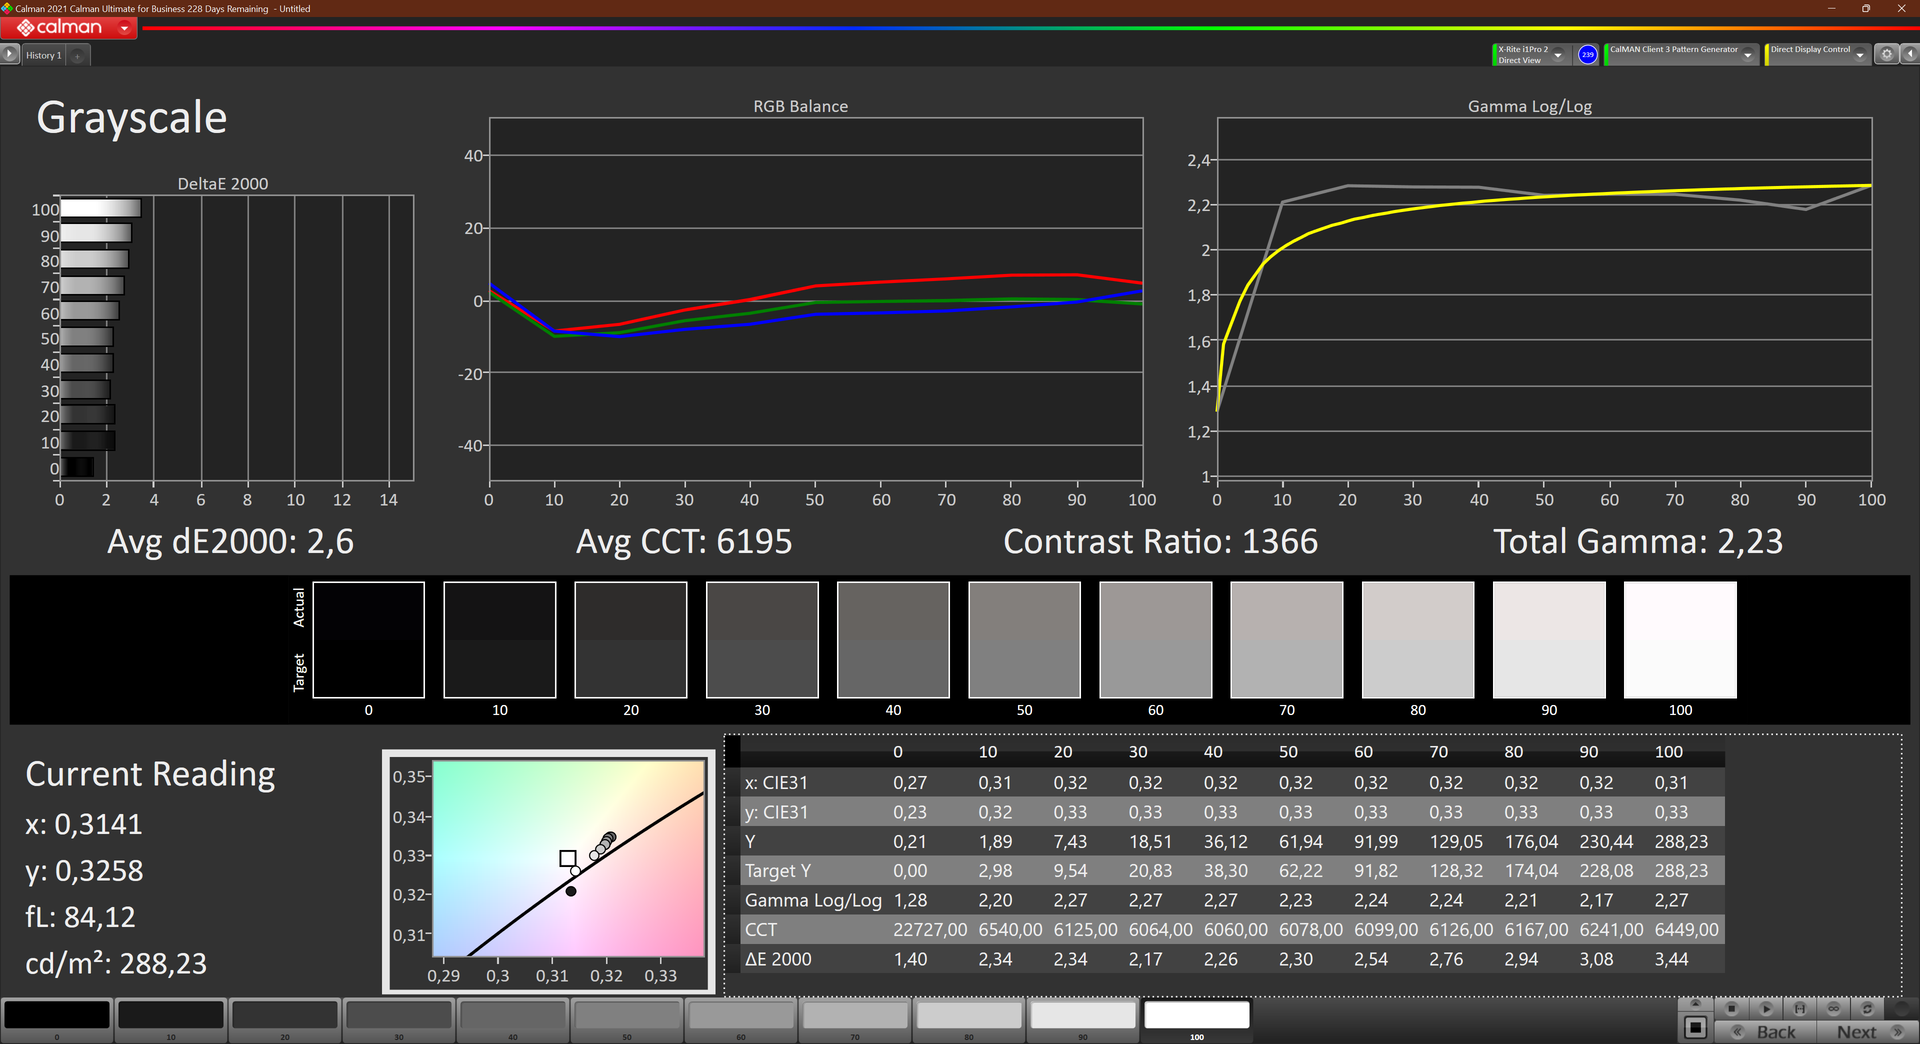
ΔE Greyscale Calman: 2.6 | ∀{0.09-98 Ø4.96}
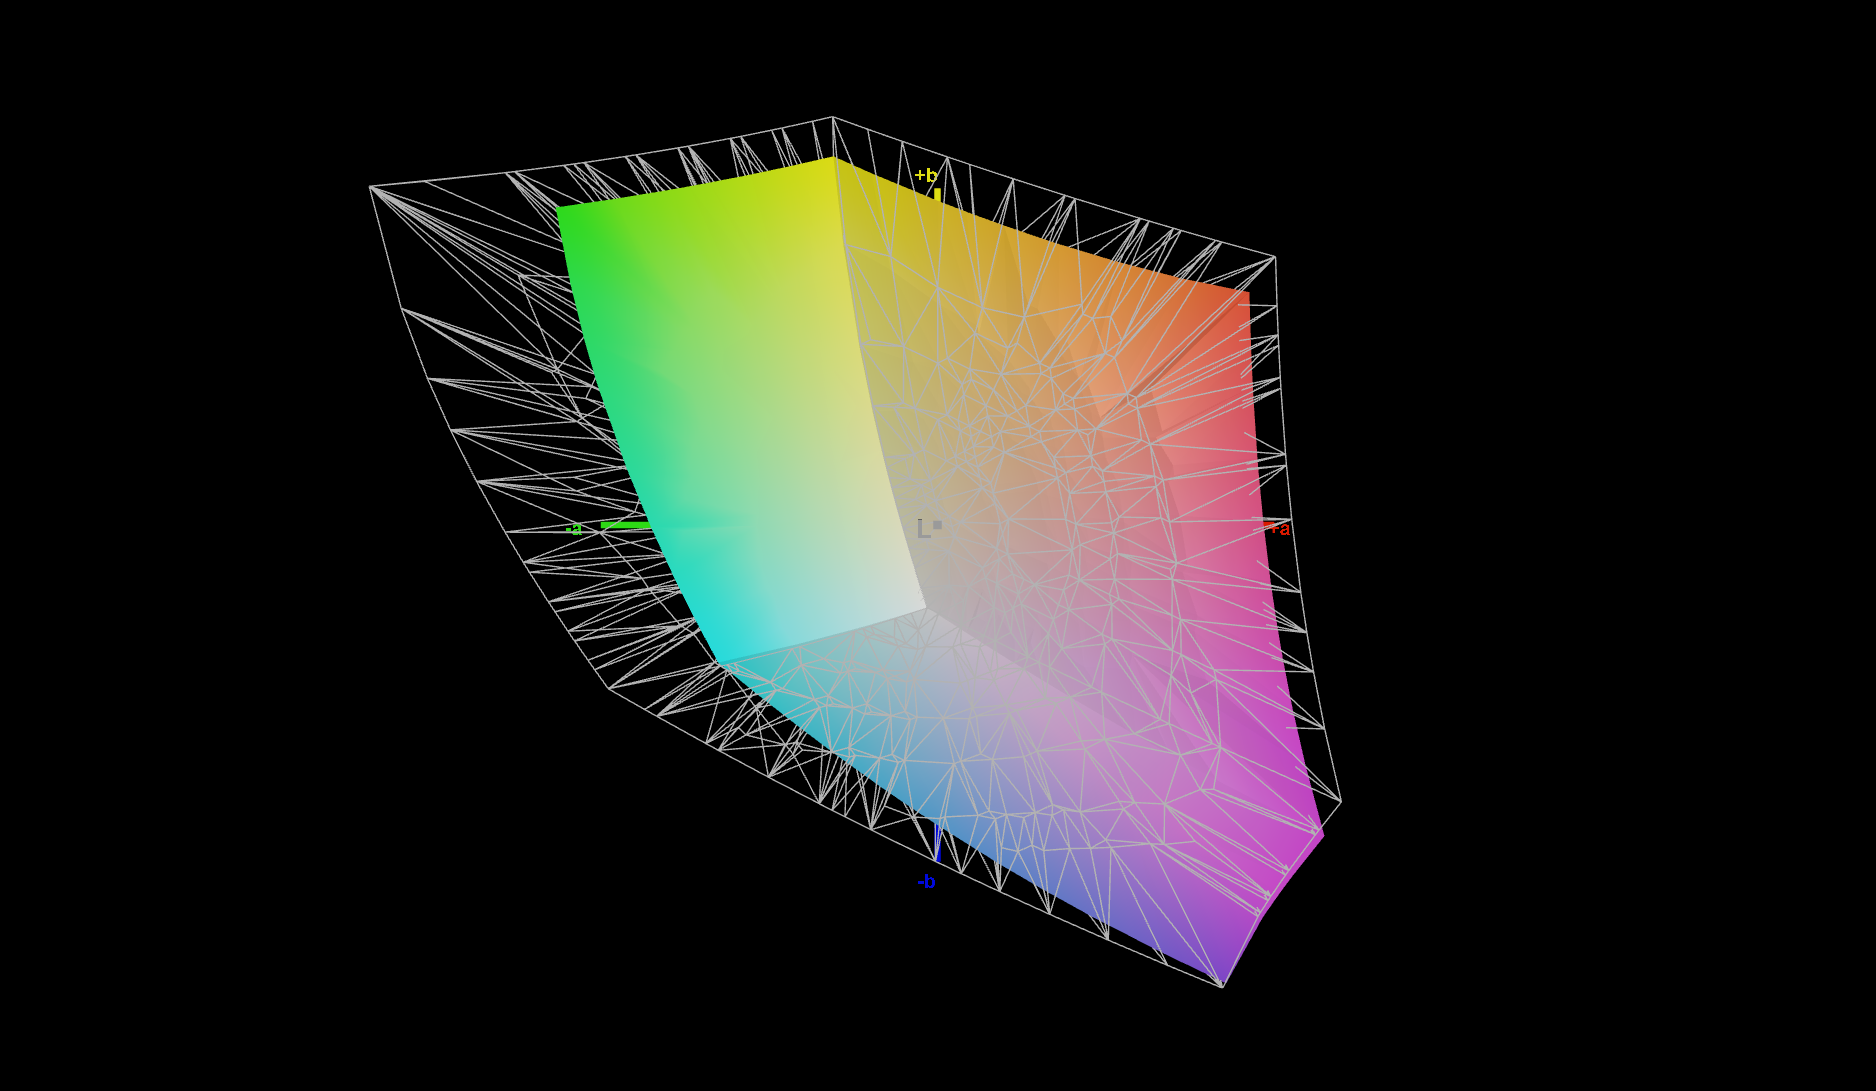
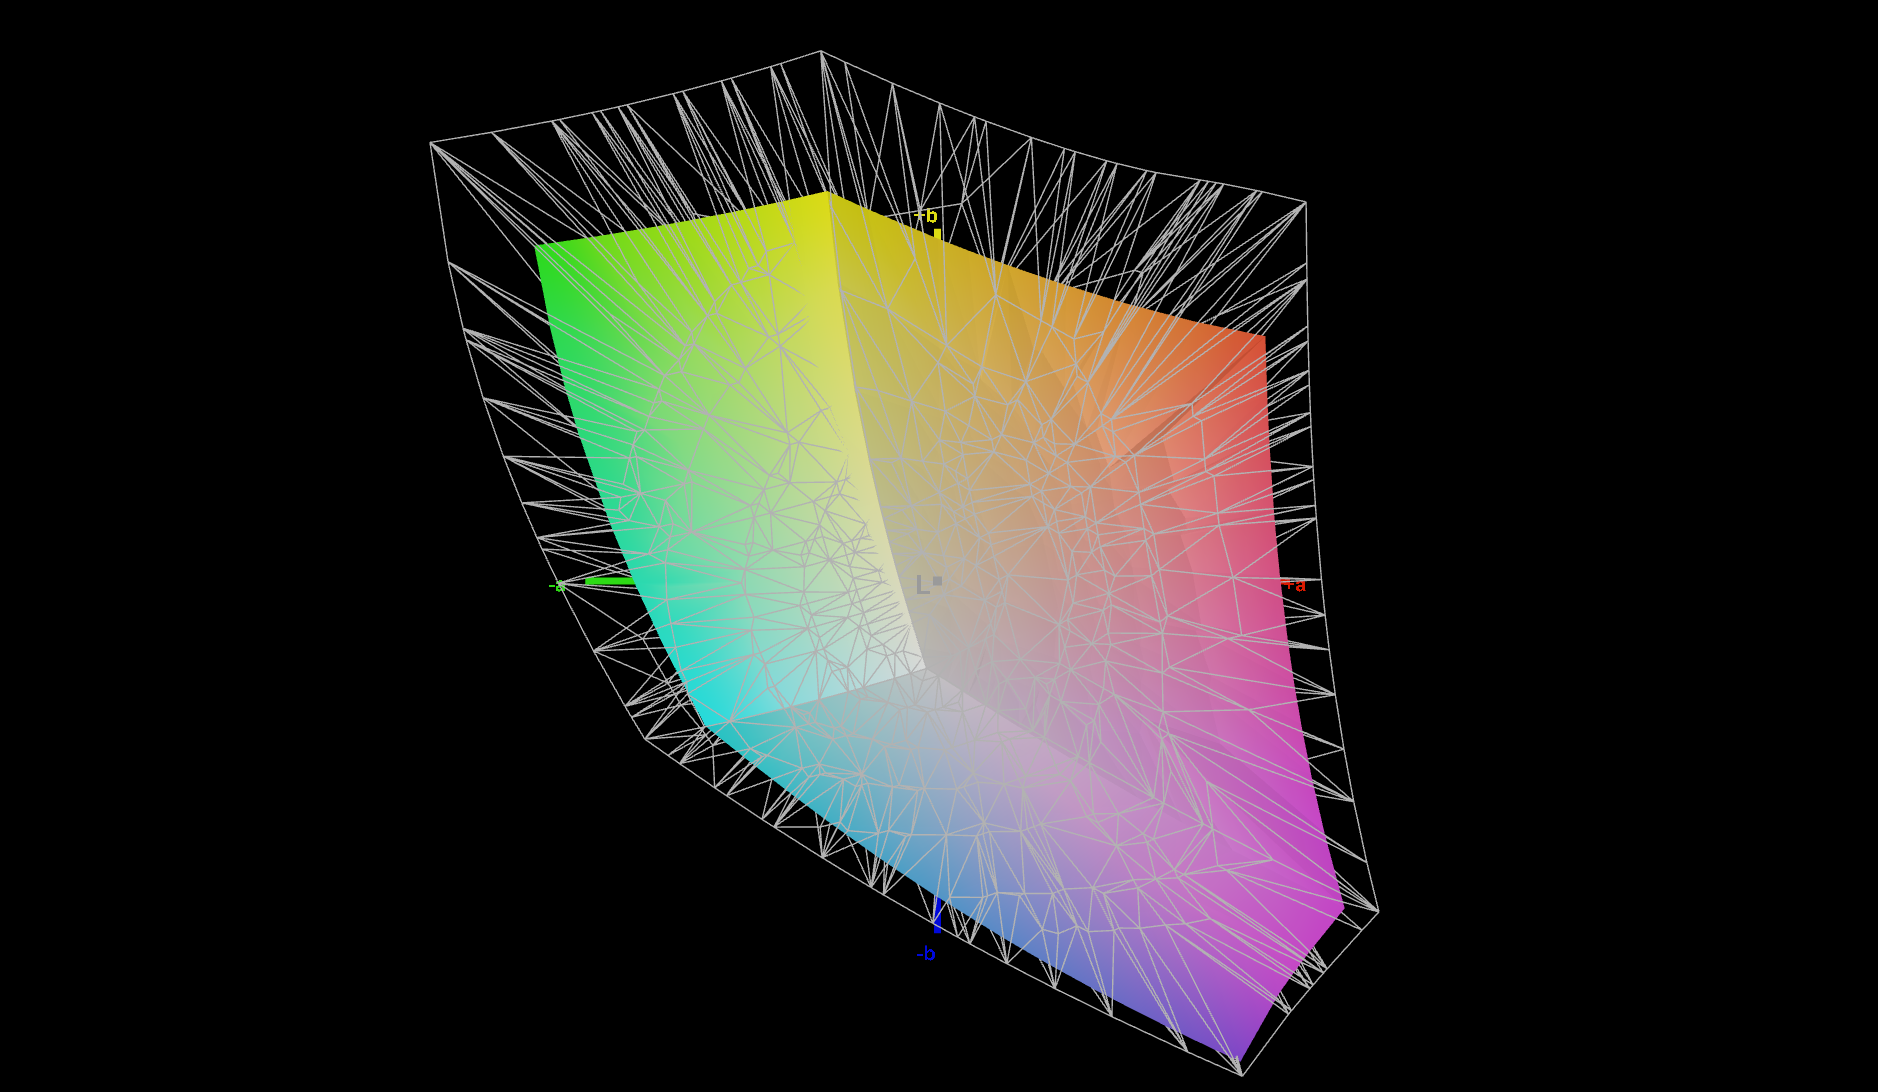
71% AdobeRGB 1998 (Argyll 3D)
99.8% sRGB (Argyll 3D)
70.4% Display P3 (Argyll 3D)
Gamma: 2.23
CCT: 6195 K
| Lenovo ThinkPad X13 G3 21BN0046GE NV133WUM-N61, IPS Grade, 1920x1200, 13.3" | Framework Laptop 13.5 12th Gen Intel BOE CQ NE135FBM-N41, IPS, 2256x1504, 13.5" | HP Elite Dragonfly G3 Chi Mei CMN13C0, IPS, 1920x1280, 13.5" | Dell Latitude 13 7330 LG Philips 133WF9, IPS, 1920x1080, 13.3" | Lenovo ThinkPad X1 Titanium Yoga G1 20QB0016GE LPM135M467, IPS LED, 2256x1504, 13.5" | Lenovo ThinkPad X13 G2 AMD 20XH001KGE NV133WUM-N61, IPS LED, 1920x1200, 13.3" | |
|---|---|---|---|---|---|---|
| Display | -0% | -2% | -5% | -3% | 0% | |
| Display P3 Coverage (%) | 70.4 | 69.9 -1% | 68 -3% | 66.1 -6% | 66.8 -5% | 70.1 0% |
| sRGB Coverage (%) | 99.8 | 99.4 0% | 98.3 -2% | 93.5 -6% | 98 -2% | 99.4 0% |
| AdobeRGB 1998 Coverage (%) | 71 | 71.1 0% | 69.9 -2% | 68.2 -4% | 68.6 -3% | 71.3 0% |
| Response Times | -69% | -130% | -106% | -188% | -49% | |
| Response Time Grey 50% / Grey 80% * (ms) | 22.9 ? | 34.7 ? -52% | 50.8 ? -122% | 48.4 ? -111% | 64 ? -179% | 34 ? -48% |
| Response Time Black / White * (ms) | 14.8 ? | 27.5 ? -86% | 35.2 ? -138% | 29.6 ? -100% | 44 ? -197% | 22 ? -49% |
| PWM Frequency (Hz) | ||||||
| Screen | -17% | -0% | 7% | 10% | 3% | |
| Brightness middle (cd/m²) | 290 | 449.6 55% | 387.2 34% | 460.1 59% | 465 60% | 309 7% |
| Brightness (cd/m²) | 288 | 431 50% | 360 25% | 445 55% | 451 57% | 297 3% |
| Brightness Distribution (%) | 88 | 90 2% | 80 -9% | 89 1% | 92 5% | 81 -8% |
| Black Level * (cd/m²) | 0.21 | 0.31 -48% | 0.26 -24% | 0.31 -48% | 0.28 -33% | 0.26 -24% |
| Contrast (:1) | 1381 | 1450 5% | 1489 8% | 1484 7% | 1661 20% | 1188 -14% |
| Colorchecker dE 2000 * | 1.9 | 2.76 -45% | 2.36 -24% | 2.42 -27% | 2 -5% | 1.6 16% |
| Colorchecker dE 2000 max. * | 4 | 7.96 -99% | 4.79 -20% | 3.97 1% | 4.7 -18% | 3 25% |
| Colorchecker dE 2000 calibrated * | 0.8 | 0.58 28% | 0.63 21% | 0.77 4% | 0.7 13% | 0.8 -0% |
| Greyscale dE 2000 * | 2.6 | 5.2 -100% | 3 -15% | 2.3 12% | 2.9 -12% | 2 23% |
| Gamma | 2.23 99% | 2.23 99% | 2.17 101% | 2.23 99% | 2.09 105% | 2.24 98% |
| CCT | 6195 105% | 6475 100% | 6137 106% | 6262 104% | 6181 105% | 6315 103% |
| Total Average (Program / Settings) | -29% /
-21% | -44% /
-19% | -35% /
-12% | -60% /
-21% | -15% /
-5% |
* ... smaller is better
显示屏的响应时间高于办公笔记本电脑的平均水平。另一方面,色彩偏差和可显示的色彩空间对于较高端的办公笔记本来说处于平均水平。
ThinkPad X13 Gen 3几乎完全再现了sRGB色彩空间,但只能不完全再现Adobe RGB和Display P3。经过校准,该屏幕实现了非常低的色彩偏差。使用信息框中的ICC配置文件,该笔记本实现的色彩偏差仅为ΔΕ0.8。
Display Response Times
| ↔ Response Time Black to White | ||
|---|---|---|
| 14.8 ms ... rise ↗ and fall ↘ combined | ↗ 7.2 ms rise | 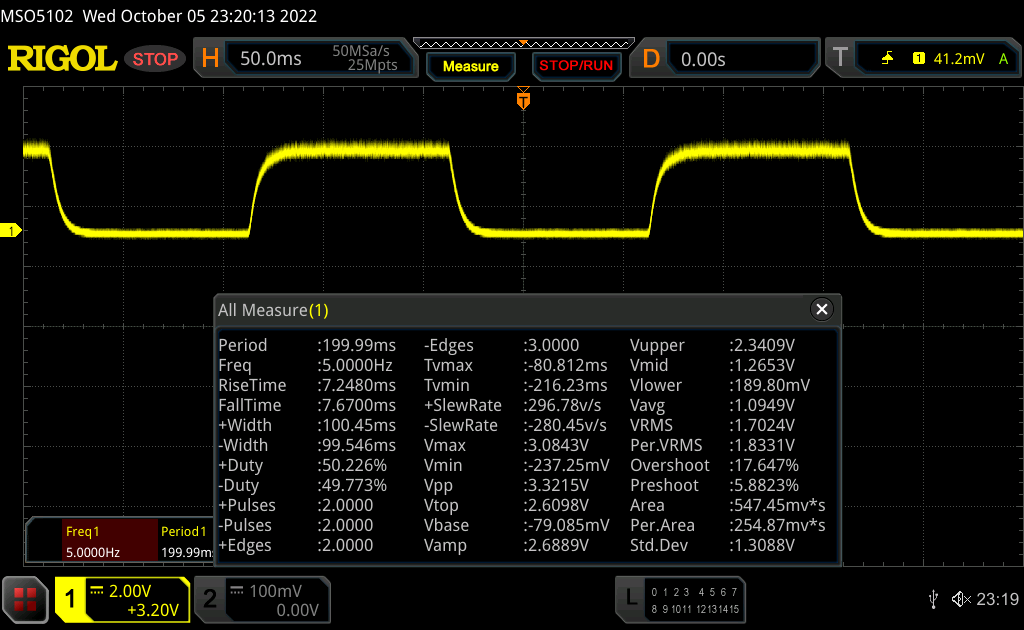 |
| ↘ 7.6 ms fall | ||
| The screen shows good response rates in our tests, but may be too slow for competitive gamers. In comparison, all tested devices range from 0.1 (minimum) to 240 (maximum) ms. » 36 % of all devices are better. This means that the measured response time is better than the average of all tested devices (19.8 ms). | ||
| ↔ Response Time 50% Grey to 80% Grey | ||
| 22.9 ms ... rise ↗ and fall ↘ combined | ↗ 8.6 ms rise | 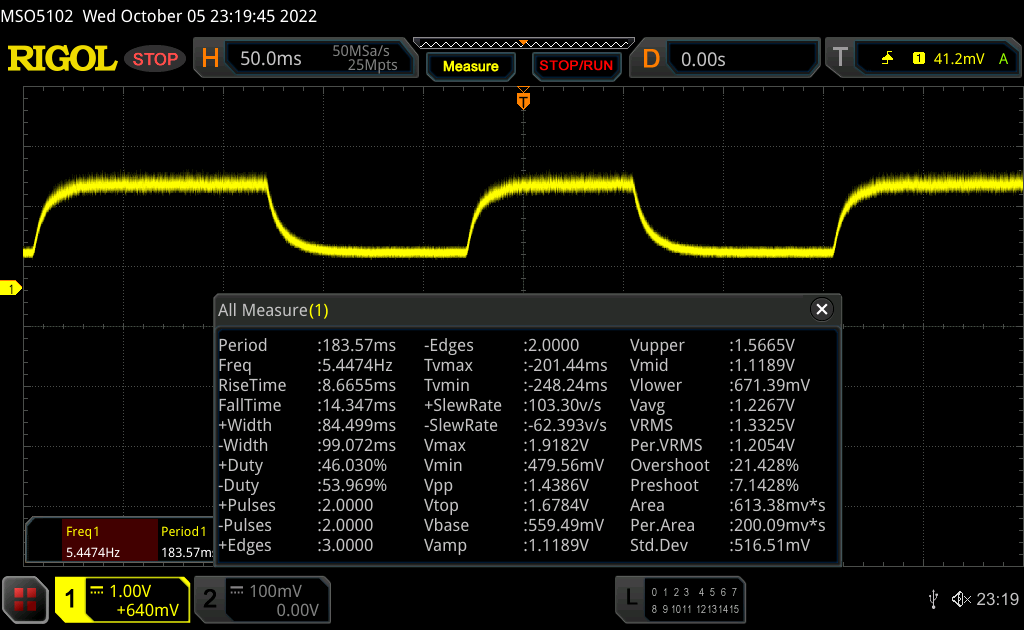 |
| ↘ 14.3 ms fall | ||
| The screen shows good response rates in our tests, but may be too slow for competitive gamers. In comparison, all tested devices range from 0.165 (minimum) to 636 (maximum) ms. » 34 % of all devices are better. This means that the measured response time is better than the average of all tested devices (30.9 ms). | ||
Screen Flickering / PWM (Pulse-Width Modulation)
| Screen flickering / PWM not detected | 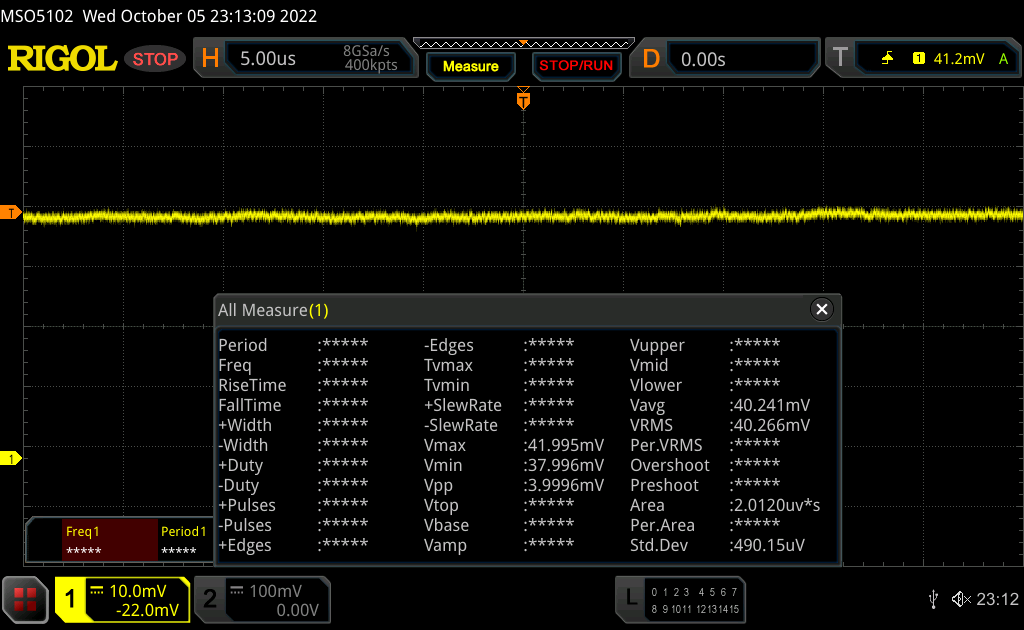 | ||
In comparison: 52 % of all tested devices do not use PWM to dim the display. If PWM was detected, an average of 7748 (minimum: 5 - maximum: 343500) Hz was measured. | |||
哑光屏幕以低反射和良好的可视角度而令人信服。

性能 - Alder-Lake带来轻微的性能提升
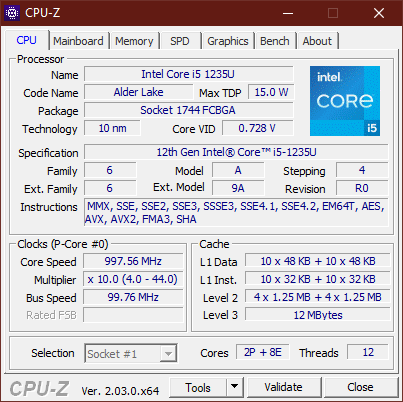
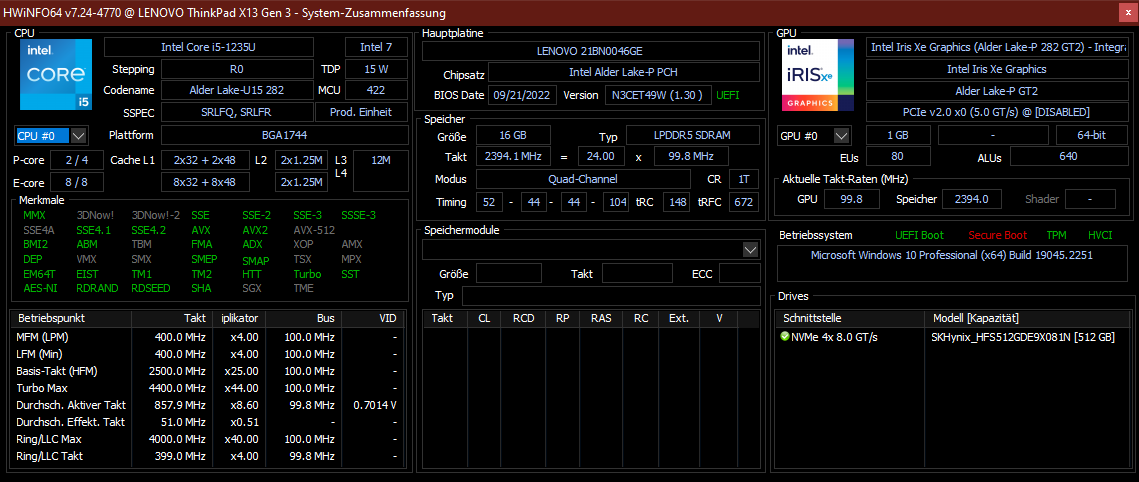
我们的测试设备配有 英特尔酷睿i5-1235U和16GB工作内存,是ThinkPad X13第三代的少数预配置版本之一。一般来说,ThinkPad可以相对自由地进行配置。有八种不同的Alder Lake一代的英特尔处理器,最高32GB的工作内存,各种操作系统和其他硬件选项。
测试条件
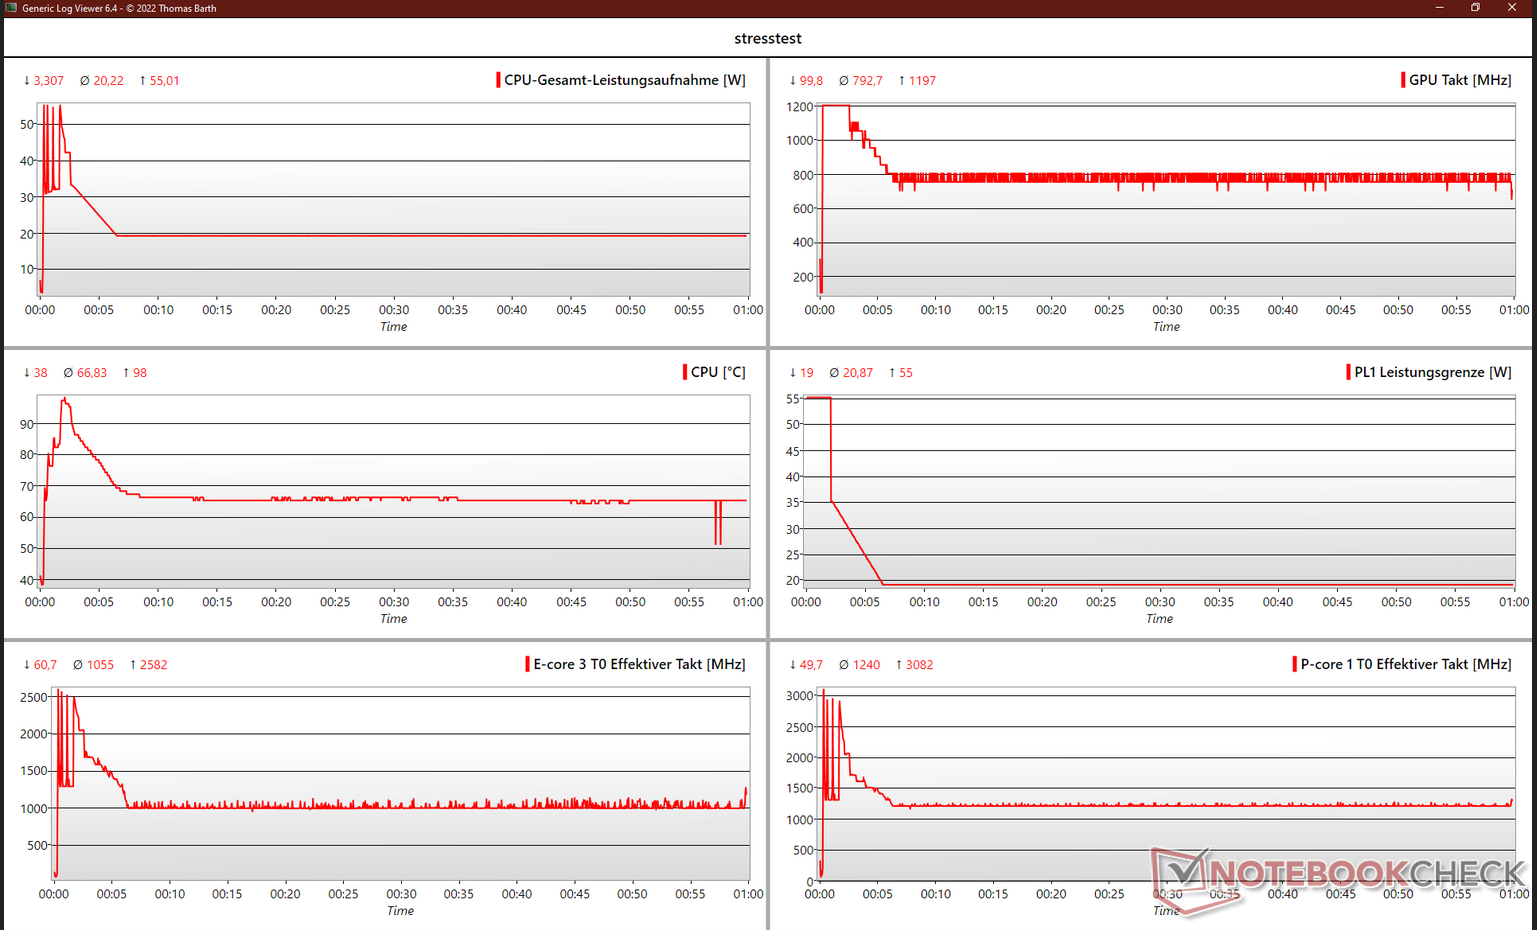
ThinkPad的电源控制是通过Windows的能源选项完成的。熟悉的滑块激活了Eco模式、自动电源模式和联想笔记本电脑中已知的电源模式。在所有三种性能模式下,笔记本电脑的提升性能约为56瓦。根据模式的不同,处理器的性能随后或多或少地缓慢下降到19瓦左右。从长远来看,性能控制不允许处理器温度超过70℃。
用PCMark、3DMark和各种处理器的基准测试都是在性能模式下运行。电池模式下的运行时间是在Eco模式下测试的。我们根据所有三种Power Smart设置中的不同负载测试了噪音排放和能源消耗。
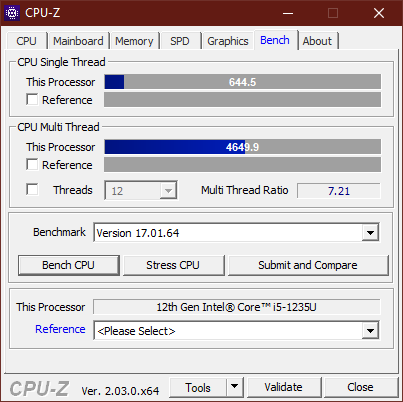
处理器
作为英特尔目前Alder-Lake一代的中端CPU,酷睿i5-1235U是一个中端产品。 酷睿i5-1235U是相对强大的。这里总共有十个核心。其中两个是P核,这意味着12个线程可以一起工作。由于该处理器在短期内有很高的可用性能,它可以在ThinkPad X13上显示出强大的性能。由于这已经成为英特尔处理器的典型,单核性能主要是令人信服的。X13 G3中的新英特尔处理器在Boost方面明显强于X13 G2中的处理器,但从长期来看处于同一水平。
小型办公笔记本电脑的性能管理有其缺陷。因此,正如我们的Cinebench R15循环所显示的,性能主要在较长的负载期间严重下降。
Cinebench R15 Multi loop
Cinebench R23: Multi Core | Single Core
Cinebench R20: CPU (Multi Core) | CPU (Single Core)
Cinebench R15: CPU Multi 64Bit | CPU Single 64Bit
Blender: v2.79 BMW27 CPU
7-Zip 18.03: 7z b 4 | 7z b 4 -mmt1
Geekbench 5.5: Multi-Core | Single-Core
HWBOT x265 Benchmark v2.2: 4k Preset
LibreOffice : 20 Documents To PDF
R Benchmark 2.5: Overall mean
| CPU Performance rating | |
| Average of class Subnotebook | |
| Framework Laptop 13.5 12th Gen Intel | |
| Dell Latitude 13 7330 | |
| Lenovo ThinkPad X13 G3 21BN0046GE | |
| Average Intel Core i5-1235U | |
| Lenovo ThinkPad X13 G2 AMD 20XH001KGE | |
| HP Elite Dragonfly G3 | |
| Lenovo ThinkPad X13 G2 20WK0024GE | |
| Cinebench R23 / Multi Core | |
| Average of class Subnotebook (1555 - 21812, n=60, last 2 years) | |
| Framework Laptop 13.5 12th Gen Intel | |
| Dell Latitude 13 7330 | |
| Lenovo ThinkPad X13 G2 AMD 20XH001KGE | |
| Average Intel Core i5-1235U (2485 - 9208, n=8) | |
| HP Elite Dragonfly G3 | |
| Lenovo ThinkPad X13 G2 20WK0024GE | |
| Lenovo ThinkPad X13 G3 21BN0046GE | |
| Cinebench R23 / Single Core | |
| Average of class Subnotebook (358 - 2213, n=61, last 2 years) | |
| Dell Latitude 13 7330 | |
| Lenovo ThinkPad X13 G3 21BN0046GE | |
| Framework Laptop 13.5 12th Gen Intel | |
| Average Intel Core i5-1235U (1444 - 1698, n=8) | |
| HP Elite Dragonfly G3 | |
| Lenovo ThinkPad X13 G2 20WK0024GE | |
| Lenovo ThinkPad X13 G2 AMD 20XH001KGE | |
| Cinebench R20 / CPU (Multi Core) | |
| Average of class Subnotebook (579 - 8541, n=57, last 2 years) | |
| Framework Laptop 13.5 12th Gen Intel | |
| Lenovo ThinkPad X13 G3 21BN0046GE | |
| Dell Latitude 13 7330 | |
| Lenovo ThinkPad X13 G2 AMD 20XH001KGE | |
| Average Intel Core i5-1235U (1783 - 3537, n=8) | |
| HP Elite Dragonfly G3 | |
| Lenovo ThinkPad X13 G2 20WK0024GE | |
| Cinebench R20 / CPU (Single Core) | |
| Framework Laptop 13.5 12th Gen Intel | |
| Average of class Subnotebook (128 - 832, n=57, last 2 years) | |
| Dell Latitude 13 7330 | |
| Lenovo ThinkPad X13 G3 21BN0046GE | |
| Average Intel Core i5-1235U (566 - 651, n=8) | |
| HP Elite Dragonfly G3 | |
| Lenovo ThinkPad X13 G2 20WK0024GE | |
| Lenovo ThinkPad X13 G2 AMD 20XH001KGE | |
| Cinebench R15 / CPU Multi 64Bit | |
| Average of class Subnotebook (327 - 3345, n=57, last 2 years) | |
| Framework Laptop 13.5 12th Gen Intel | |
| Dell Latitude 13 7330 | |
| Lenovo ThinkPad X13 G2 AMD 20XH001KGE | |
| HP Elite Dragonfly G3 | |
| Average Intel Core i5-1235U (785 - 1587, n=8) | |
| Lenovo ThinkPad X13 G3 21BN0046GE | |
| Lenovo ThinkPad X13 G2 20WK0024GE | |
| Cinebench R15 / CPU Single 64Bit | |
| Average of class Subnotebook (72.4 - 322, n=57, last 2 years) | |
| Framework Laptop 13.5 12th Gen Intel | |
| Dell Latitude 13 7330 | |
| Lenovo ThinkPad X13 G2 20WK0024GE | |
| HP Elite Dragonfly G3 | |
| Lenovo ThinkPad X13 G2 AMD 20XH001KGE | |
| Average Intel Core i5-1235U (151.5 - 242, n=8) | |
| Lenovo ThinkPad X13 G3 21BN0046GE | |
| Blender / v2.79 BMW27 CPU | |
| Lenovo ThinkPad X13 G2 20WK0024GE | |
| Average Intel Core i5-1235U (366 - 662, n=8) | |
| HP Elite Dragonfly G3 | |
| Lenovo ThinkPad X13 G3 21BN0046GE | |
| Lenovo ThinkPad X13 G2 AMD 20XH001KGE | |
| Dell Latitude 13 7330 | |
| Average of class Subnotebook (159 - 2271, n=58, last 2 years) | |
| Framework Laptop 13.5 12th Gen Intel | |
| 7-Zip 18.03 / 7z b 4 | |
| Framework Laptop 13.5 12th Gen Intel | |
| Average of class Subnotebook (11668 - 77867, n=57, last 2 years) | |
| Lenovo ThinkPad X13 G3 21BN0046GE | |
| Lenovo ThinkPad X13 G2 AMD 20XH001KGE | |
| Dell Latitude 13 7330 | |
| Average Intel Core i5-1235U (20166 - 38643, n=8) | |
| HP Elite Dragonfly G3 | |
| Lenovo ThinkPad X13 G2 20WK0024GE | |
| 7-Zip 18.03 / 7z b 4 -mmt1 | |
| Framework Laptop 13.5 12th Gen Intel | |
| Dell Latitude 13 7330 | |
| Average of class Subnotebook (2643 - 6699, n=59, last 2 years) | |
| Lenovo ThinkPad X13 G2 20WK0024GE | |
| Lenovo ThinkPad X13 G3 21BN0046GE | |
| Lenovo ThinkPad X13 G2 AMD 20XH001KGE | |
| Average Intel Core i5-1235U (4371 - 5233, n=8) | |
| HP Elite Dragonfly G3 | |
| Geekbench 5.5 / Multi-Core | |
| Average of class Subnotebook (2557 - 17218, n=49, last 2 years) | |
| Framework Laptop 13.5 12th Gen Intel | |
| Lenovo ThinkPad X13 G3 21BN0046GE | |
| HP Elite Dragonfly G3 | |
| Dell Latitude 13 7330 | |
| Average Intel Core i5-1235U (5528 - 8571, n=10) | |
| Lenovo ThinkPad X13 G2 AMD 20XH001KGE | |
| Lenovo ThinkPad X13 G2 20WK0024GE | |
| Geekbench 5.5 / Single-Core | |
| Average of class Subnotebook (726 - 2224, n=49, last 2 years) | |
| Dell Latitude 13 7330 | |
| Framework Laptop 13.5 12th Gen Intel | |
| Average Intel Core i5-1235U (1426 - 1643, n=10) | |
| Lenovo ThinkPad X13 G2 20WK0024GE | |
| HP Elite Dragonfly G3 | |
| Lenovo ThinkPad X13 G3 21BN0046GE | |
| Lenovo ThinkPad X13 G2 AMD 20XH001KGE | |
| HWBOT x265 Benchmark v2.2 / 4k Preset | |
| Average of class Subnotebook (0.97 - 25.1, n=57, last 2 years) | |
| Framework Laptop 13.5 12th Gen Intel | |
| Dell Latitude 13 7330 | |
| Lenovo ThinkPad X13 G2 AMD 20XH001KGE | |
| Lenovo ThinkPad X13 G3 21BN0046GE | |
| Average Intel Core i5-1235U (4.99 - 9.43, n=8) | |
| HP Elite Dragonfly G3 | |
| Lenovo ThinkPad X13 G2 20WK0024GE | |
| LibreOffice / 20 Documents To PDF | |
| HP Elite Dragonfly G3 | |
| Average of class Subnotebook (39.9 - 220, n=56, last 2 years) | |
| Lenovo ThinkPad X13 G2 AMD 20XH001KGE | |
| Average Intel Core i5-1235U (42.4 - 65.5, n=8) | |
| Dell Latitude 13 7330 | |
| Lenovo ThinkPad X13 G2 20WK0024GE | |
| Framework Laptop 13.5 12th Gen Intel | |
| Lenovo ThinkPad X13 G3 21BN0046GE | |
| R Benchmark 2.5 / Overall mean | |
| Lenovo ThinkPad X13 G2 20WK0024GE | |
| Lenovo ThinkPad X13 G2 AMD 20XH001KGE | |
| HP Elite Dragonfly G3 | |
| Average Intel Core i5-1235U (0.4986 - 0.603, n=8) | |
| Average of class Subnotebook (0.4024 - 1.456, n=58, last 2 years) | |
| Lenovo ThinkPad X13 G3 21BN0046GE | |
| Dell Latitude 13 7330 | |
| Framework Laptop 13.5 12th Gen Intel | |
* ... smaller is better
AIDA64: FP32 Ray-Trace | FPU Julia | CPU SHA3 | CPU Queen | FPU SinJulia | FPU Mandel | CPU AES | CPU ZLib | FP64 Ray-Trace | CPU PhotoWorxx
| Performance rating | |
| Average of class Subnotebook | |
| Lenovo ThinkPad X13 G2 AMD 20XH001KGE | |
| Framework Laptop 13.5 12th Gen Intel | |
| Lenovo ThinkPad X13 G3 21BN0046GE | |
| Dell Latitude 13 7330 | |
| HP Elite Dragonfly G3 | |
| Average Intel Core i5-1235U | |
| Lenovo ThinkPad X1 Titanium Yoga G1 20QB0016GE | |
| AIDA64 / FP32 Ray-Trace | |
| Average of class Subnotebook (1135 - 32888, n=58, last 2 years) | |
| Lenovo ThinkPad X13 G2 AMD 20XH001KGE | |
| Lenovo ThinkPad X13 G3 21BN0046GE | |
| Dell Latitude 13 7330 | |
| HP Elite Dragonfly G3 | |
| Framework Laptop 13.5 12th Gen Intel | |
| Average Intel Core i5-1235U (3078 - 7457, n=8) | |
| Lenovo ThinkPad X1 Titanium Yoga G1 20QB0016GE | |
| AIDA64 / FPU Julia | |
| Average of class Subnotebook (5218 - 123315, n=58, last 2 years) | |
| Lenovo ThinkPad X13 G2 AMD 20XH001KGE | |
| Lenovo ThinkPad X13 G3 21BN0046GE | |
| Dell Latitude 13 7330 | |
| HP Elite Dragonfly G3 | |
| Average Intel Core i5-1235U (15838 - 37760, n=8) | |
| Framework Laptop 13.5 12th Gen Intel | |
| Lenovo ThinkPad X1 Titanium Yoga G1 20QB0016GE | |
| AIDA64 / CPU SHA3 | |
| Average of class Subnotebook (444 - 5287, n=58, last 2 years) | |
| Lenovo ThinkPad X13 G3 21BN0046GE | |
| Dell Latitude 13 7330 | |
| Framework Laptop 13.5 12th Gen Intel | |
| Lenovo ThinkPad X13 G2 AMD 20XH001KGE | |
| Average Intel Core i5-1235U (978 - 2072, n=8) | |
| HP Elite Dragonfly G3 | |
| Lenovo ThinkPad X1 Titanium Yoga G1 20QB0016GE | |
| AIDA64 / CPU Queen | |
| Framework Laptop 13.5 12th Gen Intel | |
| Lenovo ThinkPad X13 G2 AMD 20XH001KGE | |
| Dell Latitude 13 7330 | |
| HP Elite Dragonfly G3 | |
| Lenovo ThinkPad X13 G3 21BN0046GE | |
| Average of class Subnotebook (10579 - 95002, n=48, last 2 years) | |
| Average Intel Core i5-1235U (45680 - 62404, n=8) | |
| Lenovo ThinkPad X1 Titanium Yoga G1 20QB0016GE | |
| AIDA64 / FPU SinJulia | |
| Lenovo ThinkPad X13 G2 AMD 20XH001KGE | |
| Average of class Subnotebook (744 - 18418, n=58, last 2 years) | |
| Framework Laptop 13.5 12th Gen Intel | |
| Lenovo ThinkPad X13 G3 21BN0046GE | |
| Dell Latitude 13 7330 | |
| HP Elite Dragonfly G3 | |
| Average Intel Core i5-1235U (3099 - 4644, n=8) | |
| Lenovo ThinkPad X1 Titanium Yoga G1 20QB0016GE | |
| AIDA64 / FPU Mandel | |
| Average of class Subnotebook (3341 - 65433, n=58, last 2 years) | |
| Lenovo ThinkPad X13 G2 AMD 20XH001KGE | |
| Lenovo ThinkPad X13 G3 21BN0046GE | |
| Dell Latitude 13 7330 | |
| HP Elite Dragonfly G3 | |
| Framework Laptop 13.5 12th Gen Intel | |
| Average Intel Core i5-1235U (8046 - 18819, n=8) | |
| Lenovo ThinkPad X1 Titanium Yoga G1 20QB0016GE | |
| AIDA64 / CPU AES | |
| Lenovo ThinkPad X13 G2 AMD 20XH001KGE | |
| Framework Laptop 13.5 12th Gen Intel | |
| Lenovo ThinkPad X1 Titanium Yoga G1 20QB0016GE | |
| Average of class Subnotebook (638 - 96917, n=58, last 2 years) | |
| Lenovo ThinkPad X13 G3 21BN0046GE | |
| Dell Latitude 13 7330 | |
| Average Intel Core i5-1235U (23386 - 67140, n=8) | |
| HP Elite Dragonfly G3 | |
| AIDA64 / CPU ZLib | |
| Average of class Subnotebook (164.9 - 1379, n=58, last 2 years) | |
| Framework Laptop 13.5 12th Gen Intel | |
| Lenovo ThinkPad X13 G3 21BN0046GE | |
| Dell Latitude 13 7330 | |
| Average Intel Core i5-1235U (329 - 633, n=8) | |
| Lenovo ThinkPad X13 G2 AMD 20XH001KGE | |
| HP Elite Dragonfly G3 | |
| Lenovo ThinkPad X1 Titanium Yoga G1 20QB0016GE | |
| AIDA64 / FP64 Ray-Trace | |
| Average of class Subnotebook (610 - 17495, n=58, last 2 years) | |
| Lenovo ThinkPad X13 G2 AMD 20XH001KGE | |
| Lenovo ThinkPad X13 G3 21BN0046GE | |
| Dell Latitude 13 7330 | |
| HP Elite Dragonfly G3 | |
| Framework Laptop 13.5 12th Gen Intel | |
| Average Intel Core i5-1235U (1670 - 3928, n=8) | |
| Lenovo ThinkPad X1 Titanium Yoga G1 20QB0016GE | |
| AIDA64 / CPU PhotoWorxx | |
| Average of class Subnotebook (6569 - 85600, n=58, last 2 years) | |
| Lenovo ThinkPad X13 G3 21BN0046GE | |
| HP Elite Dragonfly G3 | |
| Lenovo ThinkPad X1 Titanium Yoga G1 20QB0016GE | |
| Average Intel Core i5-1235U (15933 - 41909, n=8) | |
| Framework Laptop 13.5 12th Gen Intel | |
| Dell Latitude 13 7330 | |
| Lenovo ThinkPad X13 G2 AMD 20XH001KGE | |
系统性能
即使工作内存和大容量存储在这台办公笔记本电脑中工作得很快,但ThinkPad X13主要缺乏处理器能力,无法在系统性能比较中跟上。在PCMark和Crossmark中出现的长期负载,这台纤薄的笔记本电脑处理得并不理想。因此,在这里可以注意到,ThinkPad X13 G3在大多数领域只提供了平庸的结果,但特别是在Crossmark响应度测试中取得了很高的分数。内存和CPU的提升行为在这里受到特别强调。
CrossMark: Overall | Productivity | Creativity | Responsiveness
| PCMark 10 / Score | |
| Average of class Subnotebook (4920 - 9939, n=46, last 2 years) | |
| Framework Laptop 13.5 12th Gen Intel | |
| Lenovo ThinkPad X13 G2 AMD 20XH001KGE | |
| Dell Latitude 13 7330 | |
| Average Intel Core i5-1235U, Intel Iris Xe Graphics G7 80EUs (4528 - 5543, n=8) | |
| HP Elite Dragonfly G3 | |
| Lenovo ThinkPad X13 G3 21BN0046GE | |
| Lenovo ThinkPad X1 Titanium Yoga G1 20QB0016GE | |
| PCMark 10 / Essentials | |
| Framework Laptop 13.5 12th Gen Intel | |
| Dell Latitude 13 7330 | |
| Average of class Subnotebook (8552 - 11646, n=46, last 2 years) | |
| Lenovo ThinkPad X13 G2 AMD 20XH001KGE | |
| Average Intel Core i5-1235U, Intel Iris Xe Graphics G7 80EUs (9143 - 11273, n=8) | |
| Lenovo ThinkPad X1 Titanium Yoga G1 20QB0016GE | |
| HP Elite Dragonfly G3 | |
| Lenovo ThinkPad X13 G3 21BN0046GE | |
| PCMark 10 / Productivity | |
| Average of class Subnotebook (5435 - 16606, n=46, last 2 years) | |
| Lenovo ThinkPad X13 G2 AMD 20XH001KGE | |
| Framework Laptop 13.5 12th Gen Intel | |
| Dell Latitude 13 7330 | |
| Average Intel Core i5-1235U, Intel Iris Xe Graphics G7 80EUs (6440 - 7354, n=8) | |
| Lenovo ThinkPad X13 G3 21BN0046GE | |
| Lenovo ThinkPad X1 Titanium Yoga G1 20QB0016GE | |
| HP Elite Dragonfly G3 | |
| PCMark 10 / Digital Content Creation | |
| Average of class Subnotebook (5722 - 13779, n=46, last 2 years) | |
| Framework Laptop 13.5 12th Gen Intel | |
| Lenovo ThinkPad X13 G2 AMD 20XH001KGE | |
| HP Elite Dragonfly G3 | |
| Average Intel Core i5-1235U, Intel Iris Xe Graphics G7 80EUs (4220 - 5839, n=8) | |
| Dell Latitude 13 7330 | |
| Lenovo ThinkPad X13 G3 21BN0046GE | |
| Lenovo ThinkPad X1 Titanium Yoga G1 20QB0016GE | |
| CrossMark / Overall | |
| Framework Laptop 13.5 12th Gen Intel | |
| Average of class Subnotebook (365 - 2356, n=60, last 2 years) | |
| Dell Latitude 13 7330 | |
| HP Elite Dragonfly G3 | |
| Lenovo ThinkPad X13 G3 21BN0046GE | |
| Average Intel Core i5-1235U, Intel Iris Xe Graphics G7 80EUs (983 - 1644, n=8) | |
| CrossMark / Productivity | |
| Framework Laptop 13.5 12th Gen Intel | |
| Average of class Subnotebook (364 - 2277, n=60, last 2 years) | |
| Dell Latitude 13 7330 | |
| HP Elite Dragonfly G3 | |
| Average Intel Core i5-1235U, Intel Iris Xe Graphics G7 80EUs (1026 - 1676, n=8) | |
| Lenovo ThinkPad X13 G3 21BN0046GE | |
| CrossMark / Creativity | |
| Average of class Subnotebook (372 - 2743, n=60, last 2 years) | |
| Framework Laptop 13.5 12th Gen Intel | |
| HP Elite Dragonfly G3 | |
| Dell Latitude 13 7330 | |
| Lenovo ThinkPad X13 G3 21BN0046GE | |
| Average Intel Core i5-1235U, Intel Iris Xe Graphics G7 80EUs (1032 - 1618, n=8) | |
| CrossMark / Responsiveness | |
| Framework Laptop 13.5 12th Gen Intel | |
| Average of class Subnotebook (312 - 1854, n=60, last 2 years) | |
| Lenovo ThinkPad X13 G3 21BN0046GE | |
| Dell Latitude 13 7330 | |
| Average Intel Core i5-1235U, Intel Iris Xe Graphics G7 80EUs (746 - 1867, n=8) | |
| HP Elite Dragonfly G3 | |
| PCMark 10 Score | 4528 points | |
Help | ||
| AIDA64 / Memory Copy | |
| Average of class Subnotebook (14554 - 131023, n=58, last 2 years) | |
| HP Elite Dragonfly G3 | |
| Lenovo ThinkPad X13 G3 21BN0046GE | |
| Lenovo ThinkPad X1 Titanium Yoga G1 20QB0016GE | |
| Average Intel Core i5-1235U (24653 - 61921, n=8) | |
| Framework Laptop 13.5 12th Gen Intel | |
| Dell Latitude 13 7330 | |
| Lenovo ThinkPad X13 G2 AMD 20XH001KGE | |
| AIDA64 / Memory Read | |
| Average of class Subnotebook (15948 - 127174, n=58, last 2 years) | |
| Lenovo ThinkPad X13 G3 21BN0046GE | |
| HP Elite Dragonfly G3 | |
| Lenovo ThinkPad X1 Titanium Yoga G1 20QB0016GE | |
| Average Intel Core i5-1235U (24441 - 66108, n=8) | |
| Framework Laptop 13.5 12th Gen Intel | |
| Dell Latitude 13 7330 | |
| Lenovo ThinkPad X13 G2 AMD 20XH001KGE | |
| AIDA64 / Memory Write | |
| Average of class Subnotebook (15709 - 135141, n=58, last 2 years) | |
| Lenovo ThinkPad X1 Titanium Yoga G1 20QB0016GE | |
| Lenovo ThinkPad X13 G3 21BN0046GE | |
| HP Elite Dragonfly G3 | |
| Average Intel Core i5-1235U (25156 - 75808, n=8) | |
| Framework Laptop 13.5 12th Gen Intel | |
| Dell Latitude 13 7330 | |
| Lenovo ThinkPad X13 G2 AMD 20XH001KGE | |
| AIDA64 / Memory Latency | |
| Lenovo ThinkPad X13 G2 AMD 20XH001KGE | |
| HP Elite Dragonfly G3 | |
| Average of class Subnotebook (6.1 - 159.9, n=56, last 2 years) | |
| Lenovo ThinkPad X1 Titanium Yoga G1 20QB0016GE | |
| Lenovo ThinkPad X13 G3 21BN0046GE | |
| Average Intel Core i5-1235U (76.3 - 119, n=8) | |
| Framework Laptop 13.5 12th Gen Intel | |
| Dell Latitude 13 7330 | |
* ... smaller is better
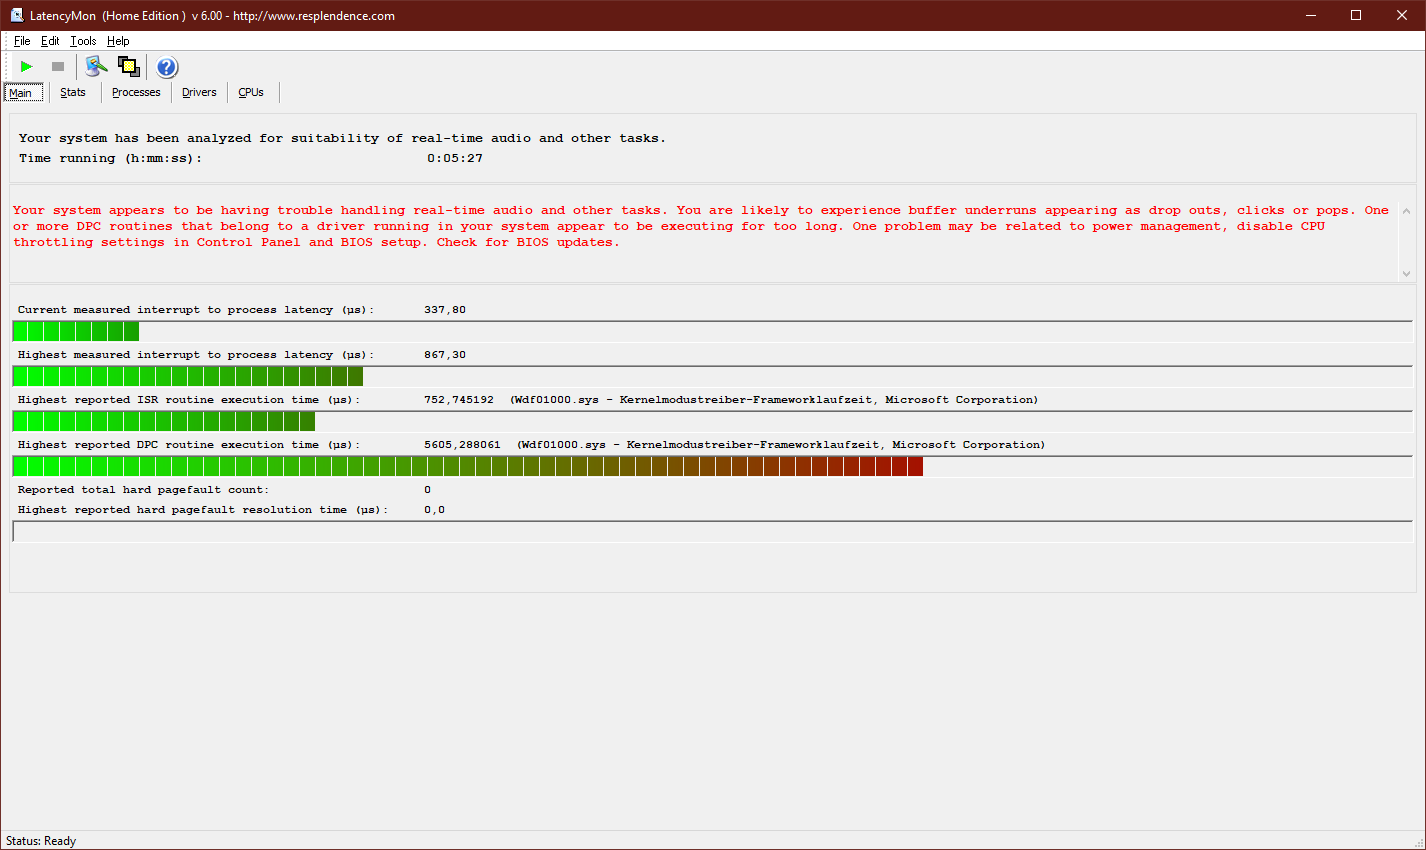
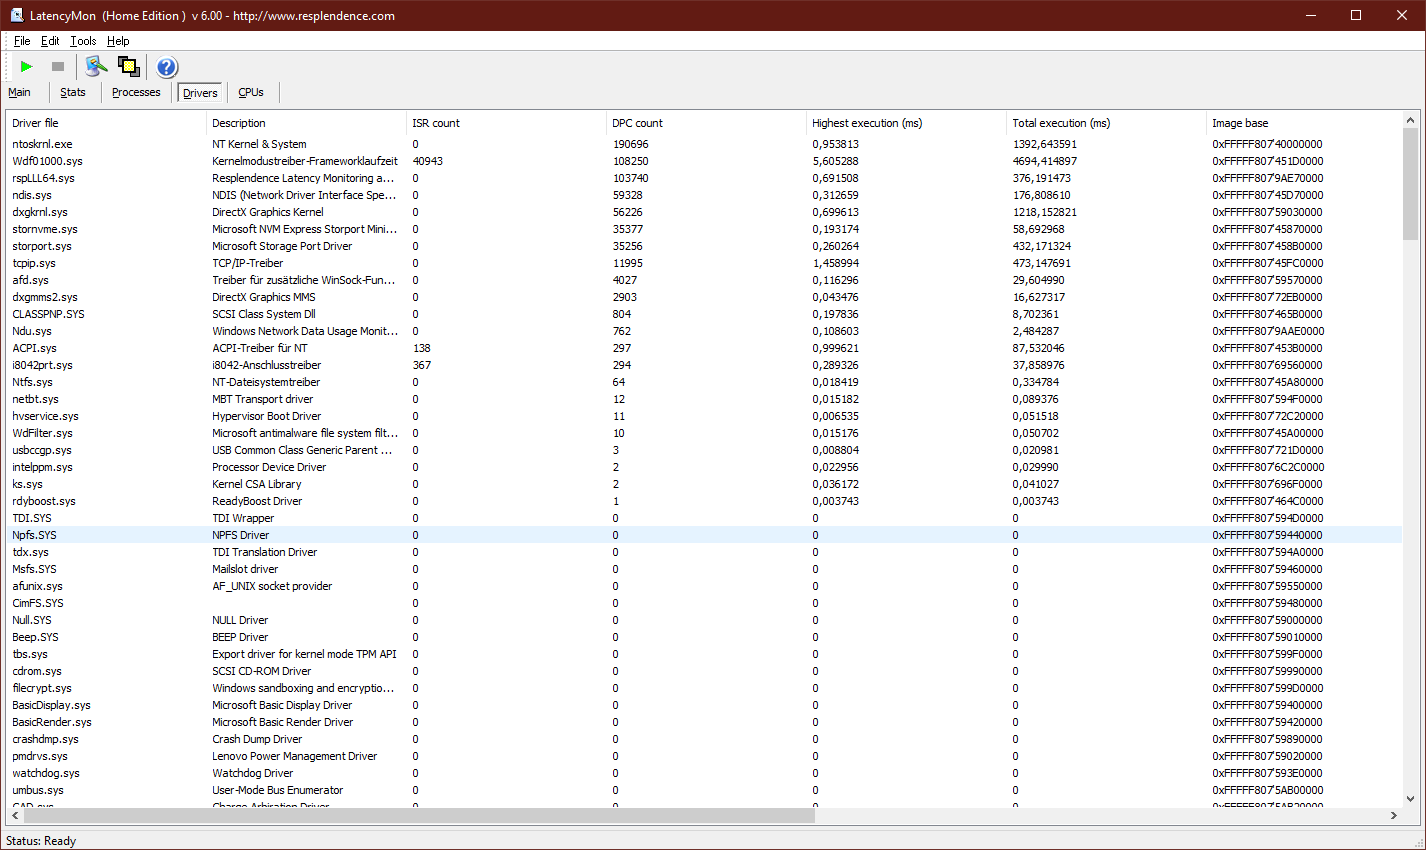
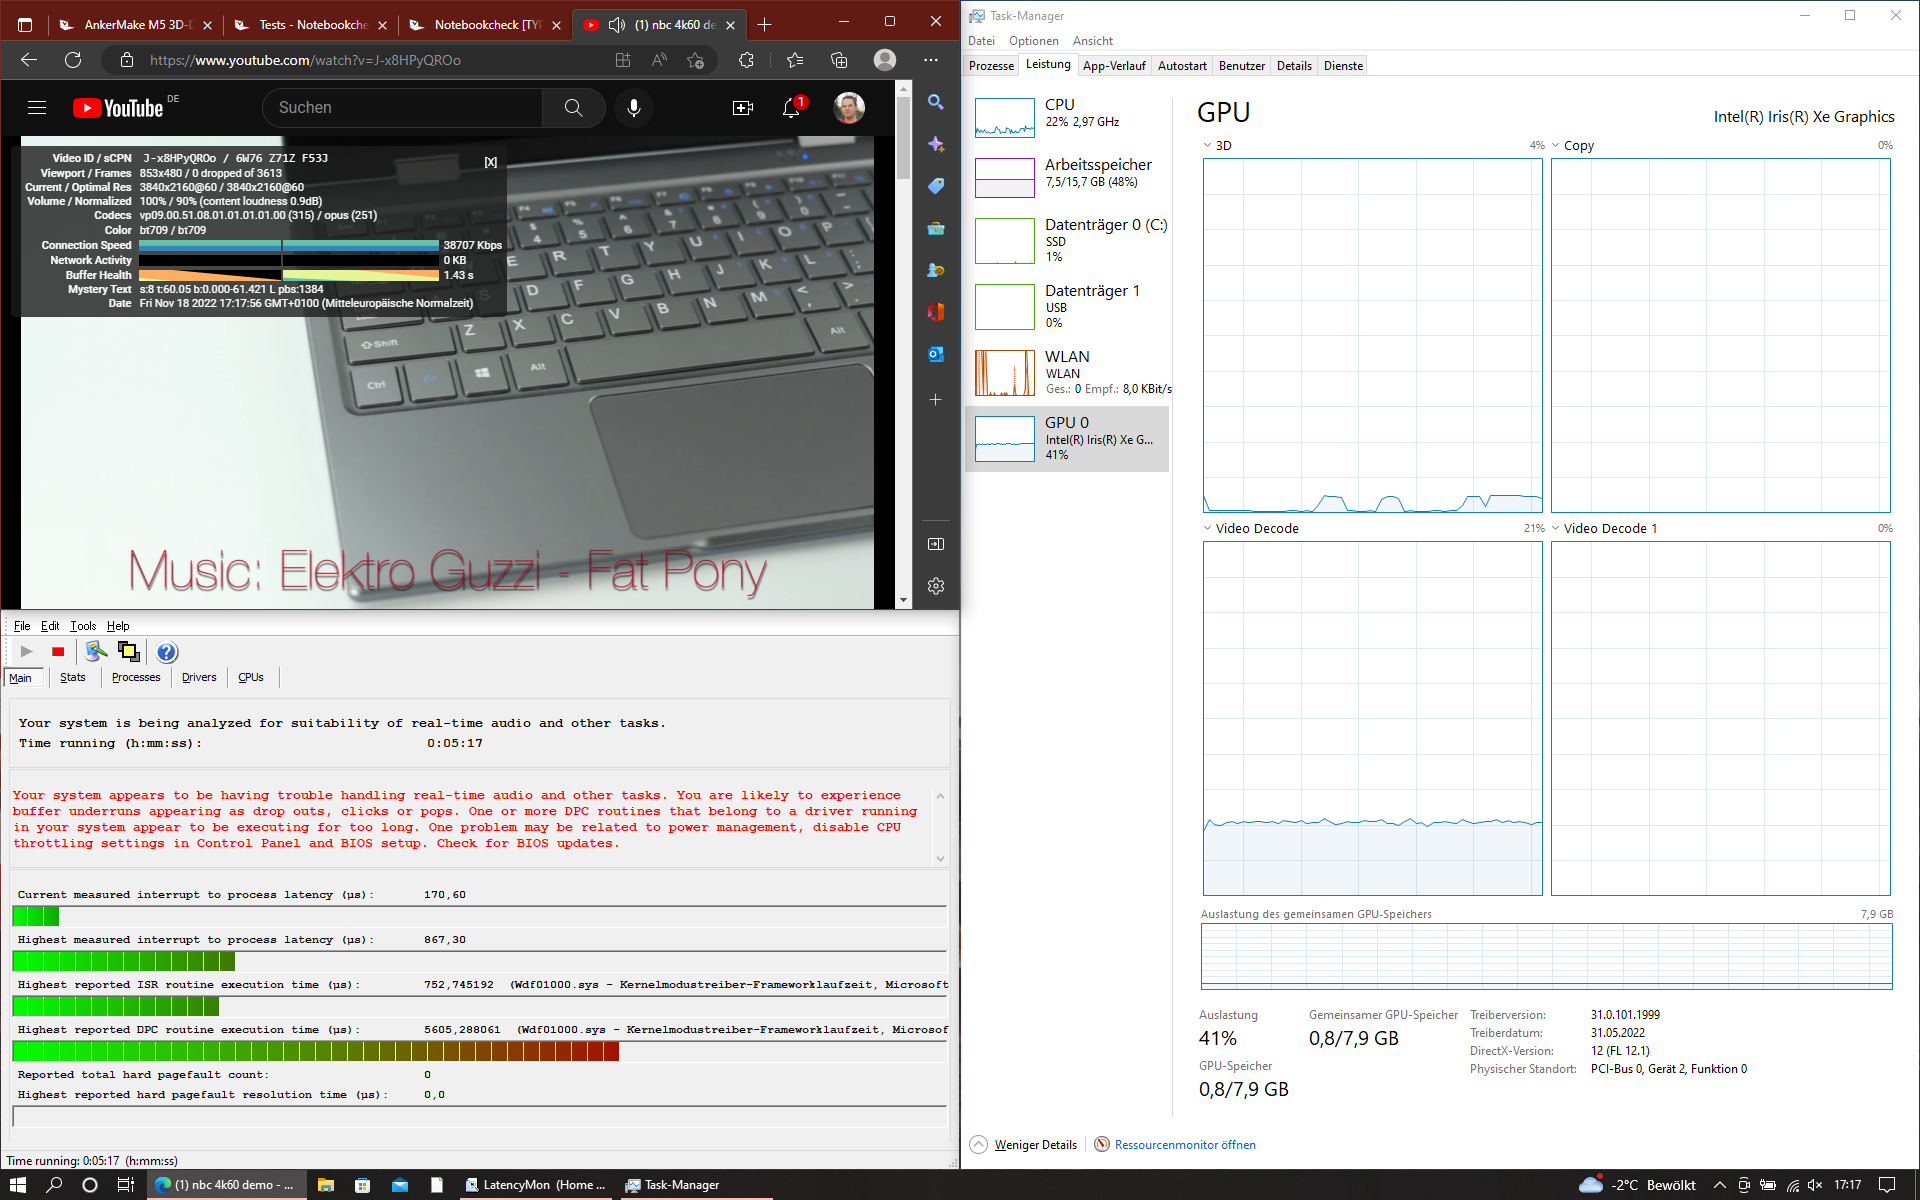
DPC延迟
在测试时,该笔记本的DPC延迟在最新的驱动程序下处于较高的范围。尽管如此,ThinkPad还是成功地播放了4K60HZ的YouTube测试视频,没有丢失一帧。
| DPC Latencies / LatencyMon - interrupt to process latency (max), Web, Youtube, Prime95 | |
| Framework Laptop 13.5 12th Gen Intel | |
| Lenovo ThinkPad X13 G2 AMD 20XH001KGE | |
| Lenovo ThinkPad X13 G3 21BN0046GE | |
| Dell Latitude 13 7330 | |
| Lenovo ThinkPad X1 Titanium Yoga G1 20QB0016GE | |
| HP Elite Dragonfly G3 | |
* ... smaller is better
大容量存储
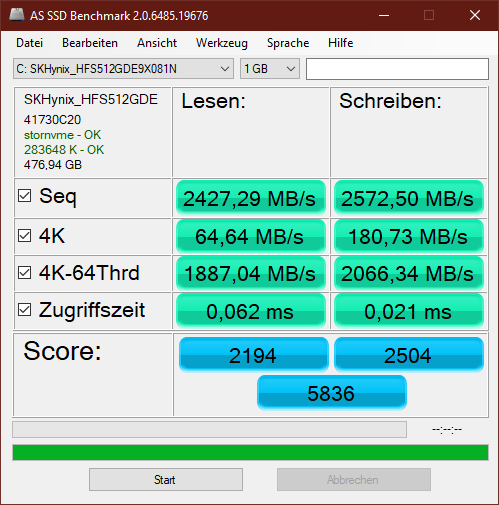
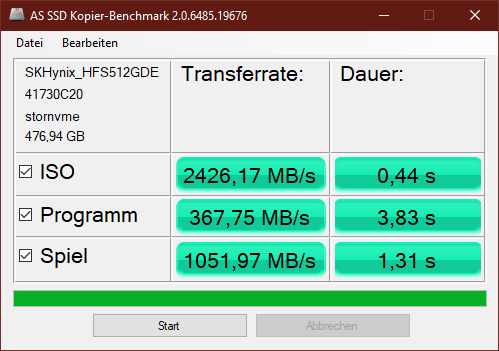
SK Hynix HFS512 GDE9X081N绝对是速度更快的M.2硬盘之一。因此,该固态硬盘在各种基准测试中提供了高传输率。在较长时间的负载中,固态硬盘的传输率会暂时崩溃。这种行为也可能是由短期过热引发的。

* ... smaller is better
Continuous Read: DiskSpd Read Loop, Queue Depth 8
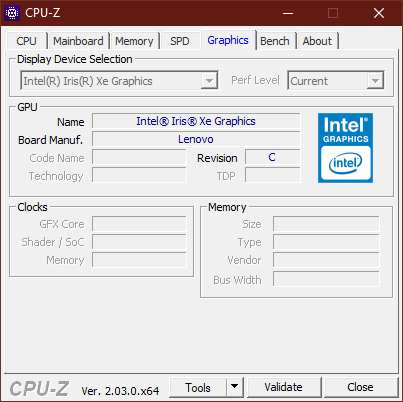
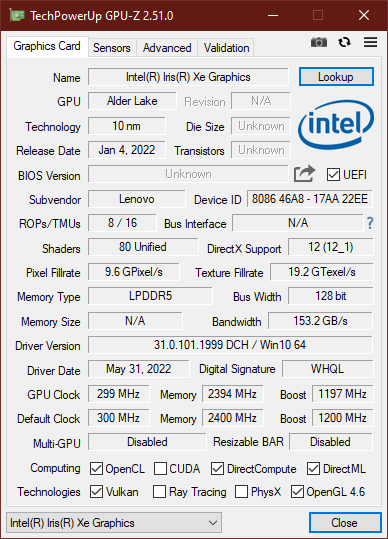
图形卡
ThinkPad X13没有提供专用的GPU,因此它必须依靠iGPU来实现。 英特尔酷睿i5-1235U.该带有80个EU的英特尔Xe同时也提供了相当高的性能。特别是在与快速工作内存相结合的情况下,如安装在这里,图形芯片可以说服人。在3DMark的图形基准测试和游戏基准测试中,分别取得了中等的分数和FPS。因此,这台小型笔记本电脑也适合于3D应用的小限制。
| 3DMark 11 Performance | 5674 points | |
| 3DMark Ice Storm Standard Score | 93199 points | |
| 3DMark Cloud Gate Standard Score | 20580 points | |
| 3DMark Fire Strike Score | 4171 points | |
| 3DMark Time Spy Score | 1468 points | |
Help | ||
游戏性能
ThinkPad X13第三代只有一个相对较小的屏幕。因此,全高清的游戏并不是绝对必要的。由于分辨率为1366 × 768像素,许多游戏即使在中等质量下也能以高帧率运行。你不能对带有80个着色器的英特尔Iris Xe有更多期待。
| low | med. | high | ultra | |
|---|---|---|---|---|
| GTA V (2015) | 82.2 | 19.6 | 8.69 | |
| The Witcher 3 (2015) | 77 | 52 | 15.8 | 10.7 |
| Dota 2 Reborn (2015) | 116.1 | 87.4 | 47.2 | 43.6 |
| Final Fantasy XV Benchmark (2018) | 36.7 | 19.8 | 19.8 | |
| X-Plane 11.11 (2018) | 52.6 | 33.7 | 30.2 | |
| Strange Brigade (2018) | 68.8 | 30.2 | 23.8 | 19.2 |
排放 - 几乎听不到的笔记本电脑
噪声排放
联想的这台办公笔记本电脑非常安静。我们可以确定最大为34 dB(A)。即使在安静的办公环境中,这也几乎听不到。最初,从笔记本电脑上可以感觉到一种安静的高频噪音。然而,几天后,线圈的啸叫声消失了。
Noise level
| Idle |
| 24.6 / 24.6 / 25.9 dB(A) |
| Load |
| 30.7 / 34.6 dB(A) |
 | ||
30 dB silent 40 dB(A) audible 50 dB(A) loud |
||
min: | ||
| Lenovo ThinkPad X13 G3 21BN0046GE Iris Xe G7 80EUs, i5-1235U, SK Hynix HFS512 GDE9X081N | Framework Laptop 13.5 12th Gen Intel Iris Xe G7 96EUs, i7-1260P, WDC PC SN730 SDBPNTY-512G | HP Elite Dragonfly G3 Iris Xe G7 96EUs, i7-1265U, Micron 3400 MTFDKBA512TFH 512GB | Dell Latitude 13 7330 Iris Xe G7 96EUs, i7-1265U, Toshiba KBG40ZNS512G NVMe | Lenovo ThinkPad X1 Titanium Yoga G1 20QB0016GE Iris Xe G7 80EUs, i5-1140G7, Lenovo UMIS RPJTJ256MEE1OWX | Lenovo ThinkPad X13 G2 AMD 20XH001KGE Vega 7, R5 PRO 5650U, Samsung SSD PM981a MZVLB512HBJQ | |
|---|---|---|---|---|---|---|
| Noise | -15% | 8% | -5% | -10% | 4% | |
| off / environment * (dB) | 24.6 | 22.8 7% | 22.8 7% | 23.4 5% | 25.61 -4% | 24.17 2% |
| Idle Minimum * (dB) | 24.6 | 23 7% | 23.2 6% | 23.4 5% | 25.61 -4% | 24.17 2% |
| Idle Average * (dB) | 24.6 | 23 7% | 23.2 6% | 23.4 5% | 25.61 -4% | 24.17 2% |
| Idle Maximum * (dB) | 25.9 | 23 11% | 23.2 10% | 23.4 10% | 25.61 1% | 24.17 7% |
| Load Average * (dB) | 30.7 | 47.3 -54% | 25.1 18% | 37.8 -23% | 40.14 -31% | 29.92 3% |
| Witcher 3 ultra * (dB) | 34.6 | 47.3 -37% | 32 8% | 39.2 -13% | ||
| Load Maximum * (dB) | 34.6 | 49.8 -44% | 35.2 -2% | 43 -24% | 40.14 -16% | 31.52 9% |
* ... smaller is better
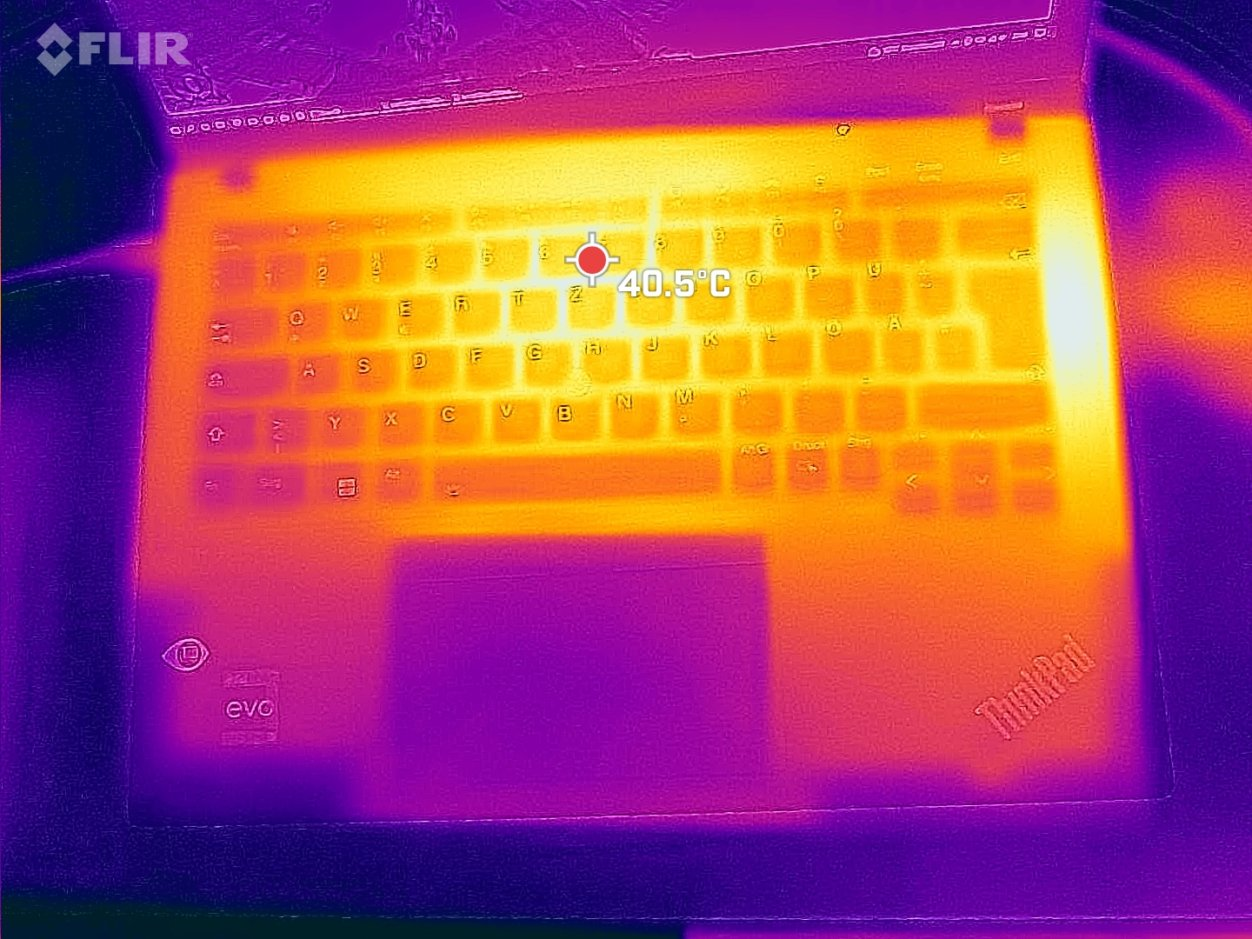
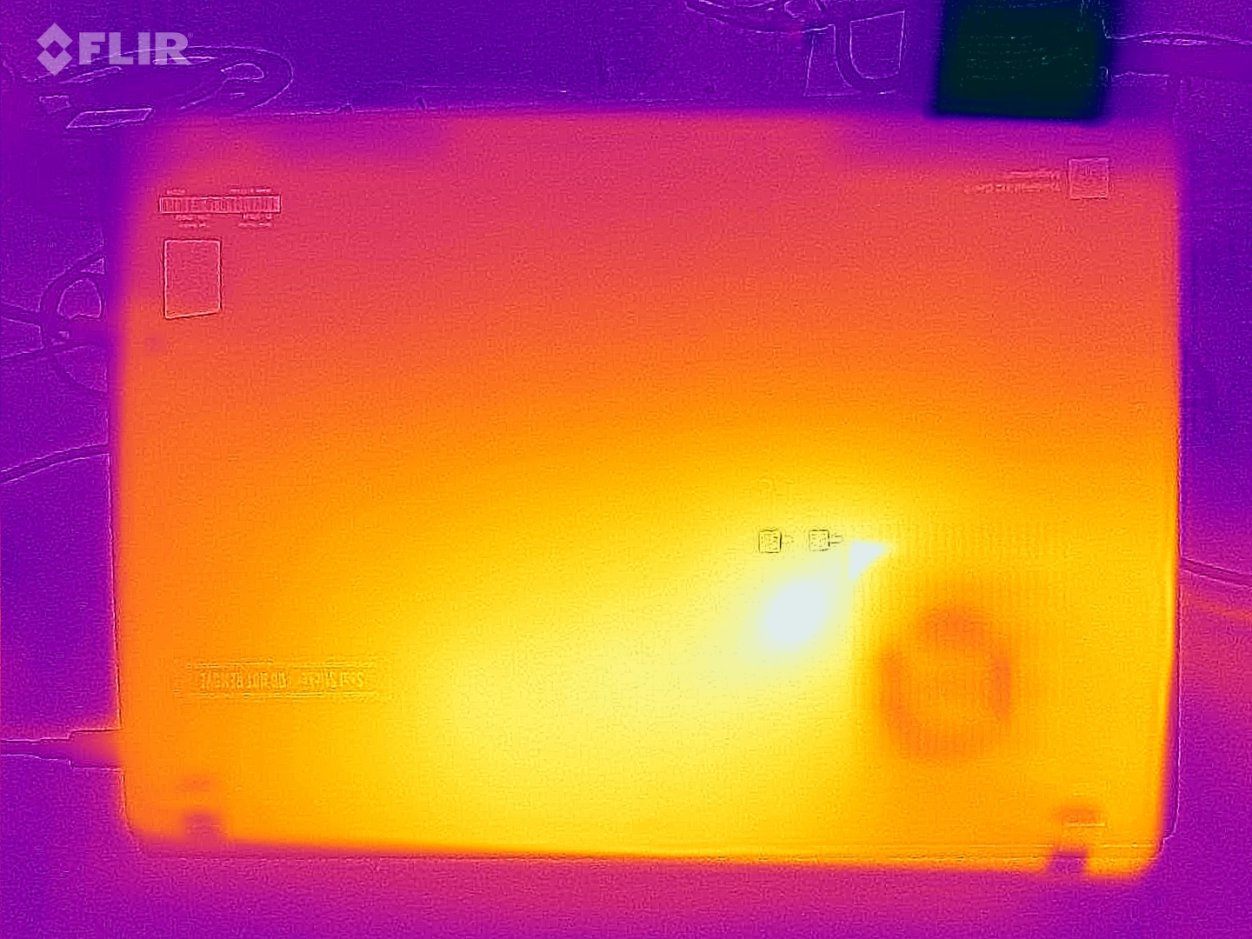
温度
虽然笔记本的表面温度并没有上升到很高的水平,但在笔记本的中间和右侧,机箱的实测温度达到45℃,也会让人感到不舒服。然而,我们只在长时间的负载下注意到这些表面温度。笔记本在正常使用中几乎没有升温。
(-) The maximum temperature on the upper side is 45.3 °C / 114 F, compared to the average of 35.9 °C / 97 F, ranging from 21.4 to 59 °C for the class Subnotebook.
(±) The bottom heats up to a maximum of 41.8 °C / 107 F, compared to the average of 39.2 °C / 103 F
(+) In idle usage, the average temperature for the upper side is 28.9 °C / 84 F, compared to the device average of 30.8 °C / 87 F.
(±) Playing The Witcher 3, the average temperature for the upper side is 35.9 °C / 97 F, compared to the device average of 30.8 °C / 87 F.
(+) The palmrests and touchpad are reaching skin temperature as a maximum (32.1 °C / 89.8 F) and are therefore not hot.
(-) The average temperature of the palmrest area of similar devices was 28.2 °C / 82.8 F (-3.9 °C / -7 F).
| Lenovo ThinkPad X13 G3 21BN0046GE Intel Core i5-1235U, Intel Iris Xe Graphics G7 80EUs | Framework Laptop 13.5 12th Gen Intel Intel Core i7-1260P, Intel Iris Xe Graphics G7 96EUs | HP Elite Dragonfly G3 Intel Core i7-1265U, Intel Iris Xe Graphics G7 96EUs | Dell Latitude 13 7330 Intel Core i7-1265U, Intel Iris Xe Graphics G7 96EUs | Lenovo ThinkPad X1 Titanium Yoga G1 20QB0016GE Intel Core i5-1140G7, Intel Iris Xe Graphics G7 80EUs | Lenovo ThinkPad X13 G2 AMD 20XH001KGE AMD Ryzen 5 PRO 5650U, AMD Radeon RX Vega 7 | |
|---|---|---|---|---|---|---|
| Heat | 13% | 10% | 16% | 6% | 13% | |
| Maximum Upper Side * (°C) | 45.3 | 36.8 19% | 39 14% | 38.6 15% | 46.3 -2% | 43.7 4% |
| Maximum Bottom * (°C) | 41.8 | 42.4 -1% | 42.2 -1% | 42 -0% | 43.3 -4% | 38 9% |
| Idle Upper Side * (°C) | 31.6 | 24.2 23% | 26.8 15% | 23.8 25% | 26.8 15% | 25.8 18% |
| Idle Bottom * (°C) | 32.6 | 29 11% | 28.2 13% | 24.6 25% | 28.3 13% | 26.2 20% |
* ... smaller is better
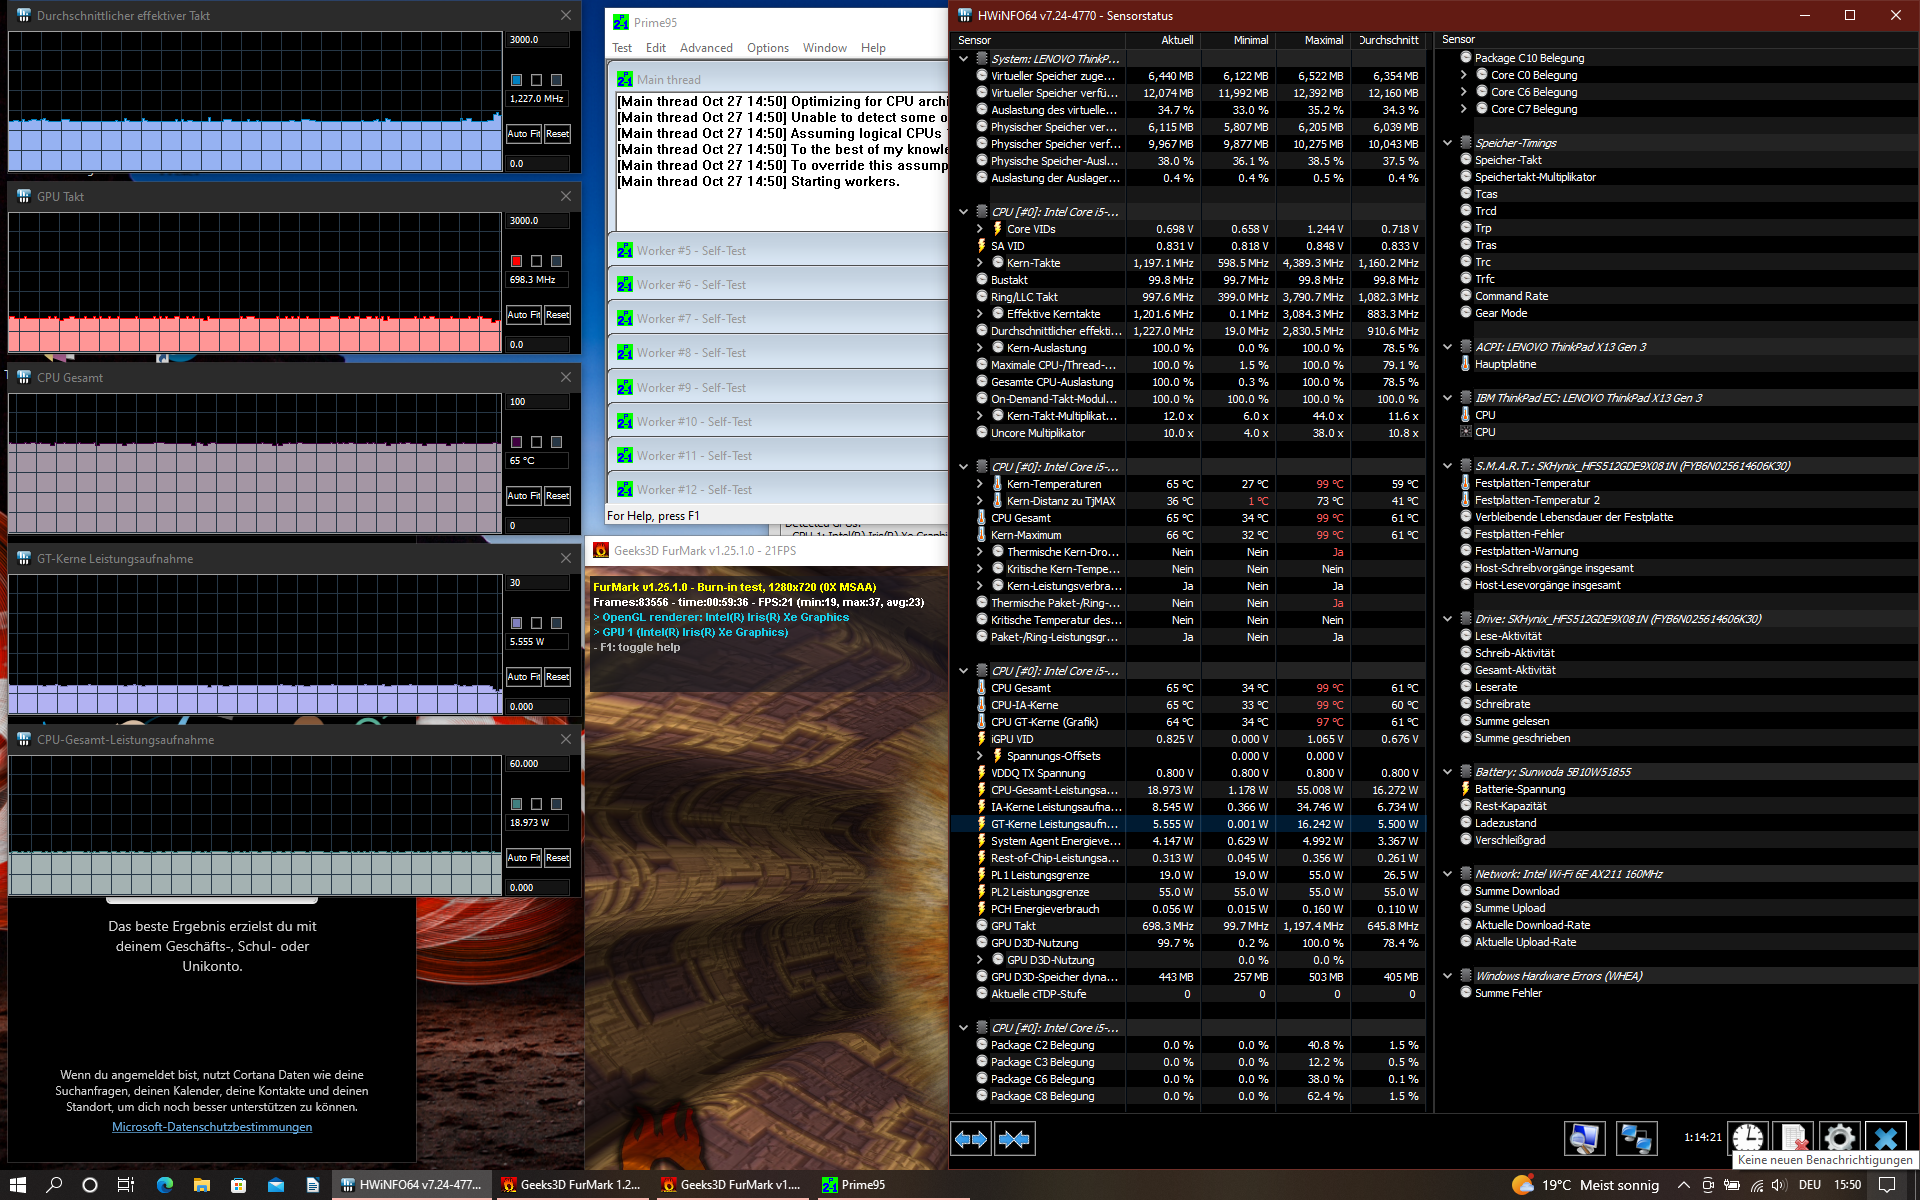
压力测试
在压力测试约7分钟后,无论采用何种电源模式,处理器的功耗和PL1都下降到19瓦。在此之前,我们可以确定一个高达55瓦的提升功率。笔记本电脑可以保持19瓦的持续功率不变。
扬声器
实际上,我们应该说的是ThinkPad X13 G3的单声道扬声器。包含左、右扬声器的模块在屏幕的正下方。因此,两个声道的驱动器只相隔大约11厘米。
来自小型扬声器模块的声音相当弱。高音和低音的再现过于安静。因此,这款超极本几乎不适合用于音乐播放。
Lenovo ThinkPad X13 G3 21BN0046GE audio analysis
(±) | speaker loudness is average but good (74.4 dB)
Bass 100 - 315 Hz
(-) | nearly no bass - on average 18.7% lower than median
(±) | linearity of bass is average (14.1% delta to prev. frequency)
Mids 400 - 2000 Hz
(+) | balanced mids - only 2.5% away from median
(+) | mids are linear (6.1% delta to prev. frequency)
Highs 2 - 16 kHz
(+) | balanced highs - only 1.6% away from median
(+) | highs are linear (3.9% delta to prev. frequency)
Overall 100 - 16.000 Hz
(±) | linearity of overall sound is average (16.6% difference to median)
Compared to same class
» 43% of all tested devices in this class were better, 6% similar, 51% worse
» The best had a delta of 5%, average was 18%, worst was 53%
Compared to all devices tested
» 29% of all tested devices were better, 6% similar, 65% worse
» The best had a delta of 4%, average was 23%, worst was 134%
HP Elite Dragonfly G3 audio analysis
(+) | speakers can play relatively loud (84.7 dB)
Bass 100 - 315 Hz
(±) | reduced bass - on average 9.4% lower than median
(±) | linearity of bass is average (11.4% delta to prev. frequency)
Mids 400 - 2000 Hz
(+) | balanced mids - only 0.9% away from median
(+) | mids are linear (2.8% delta to prev. frequency)
Highs 2 - 16 kHz
(+) | balanced highs - only 2.1% away from median
(+) | highs are linear (3.9% delta to prev. frequency)
Overall 100 - 16.000 Hz
(+) | overall sound is linear (6.6% difference to median)
Compared to same class
» 0% of all tested devices in this class were better, 0% similar, 100% worse
» The best had a delta of 7%, average was 21%, worst was 53%
Compared to all devices tested
» 1% of all tested devices were better, 0% similar, 99% worse
» The best had a delta of 4%, average was 23%, worst was 134%
能源管理--甚至更多的耐力
消耗功率
这款小型笔记本电脑在大多数情况下是相当节俭的能源消耗。只有在要求ThinkPad提供全部可用的计算能力时,能源消耗才会增加到66.7瓦特。然而,从长远来看,它又降到了36瓦左右。电源管理的影响在这里也很明显。因此,附带的65瓦的电源仍然在其规格范围内。
| Off / Standby | |
| Idle | |
| Load |
|
Key:
min: | |
| Lenovo ThinkPad X13 G3 21BN0046GE i5-1235U, Iris Xe G7 80EUs, SK Hynix HFS512 GDE9X081N, IPS Grade, 1920x1200, 13.3" | Framework Laptop 13.5 12th Gen Intel i7-1260P, Iris Xe G7 96EUs, WDC PC SN730 SDBPNTY-512G, IPS, 2256x1504, 13.5" | HP Elite Dragonfly G3 i7-1265U, Iris Xe G7 96EUs, Micron 3400 MTFDKBA512TFH 512GB, IPS, 1920x1280, 13.5" | Dell Latitude 13 7330 i7-1265U, Iris Xe G7 96EUs, Toshiba KBG40ZNS512G NVMe, IPS, 1920x1080, 13.3" | Lenovo ThinkPad X1 Titanium Yoga G1 20QB0016GE i5-1140G7, Iris Xe G7 80EUs, Lenovo UMIS RPJTJ256MEE1OWX, IPS LED, 2256x1504, 13.5" | Lenovo ThinkPad X13 G2 AMD 20XH001KGE R5 PRO 5650U, Vega 7, Samsung SSD PM981a MZVLB512HBJQ, IPS LED, 1920x1200, 13.3" | Average Intel Iris Xe Graphics G7 80EUs | Average of class Subnotebook | |
|---|---|---|---|---|---|---|---|---|
| Power Consumption | -49% | -11% | -3% | -6% | -3% | -29% | -20% | |
| Idle Minimum * (Watt) | 2.7 | 5.3 -96% | 3.4 -26% | 2.8 -4% | 3.75 -39% | 3.82 -41% | 4.49 ? -66% | 3.71 ? -37% |
| Idle Average * (Watt) | 5.2 | 8.4 -62% | 5.6 -8% | 4.8 8% | 7.75 -49% | 5.74 -10% | 7.4 ? -42% | 6.54 ? -26% |
| Idle Maximum * (Watt) | 6.2 | 11.2 -81% | 8.4 -35% | 7.3 -18% | 8.69 -40% | 7.65 -23% | 9.26 ? -49% | 7.89 ? -27% |
| Load Average * (Watt) | 38.4 | 57.4 -49% | 40.8 -6% | 48.1 -25% | 33.12 14% | 35.79 7% | 36.6 ? 5% | 42.1 ? -10% |
| Witcher 3 ultra * (Watt) | 41.9 | 46.7 -11% | 35.5 15% | 35.4 16% | 28.7 32% | 35.6 15% | ||
| Load Maximum * (Watt) | 66.7 | 61.2 8% | 68.4 -3% | 63.6 5% | 35.19 47% | 45.04 32% | 61.7 ? 7% | 65.1 ? 2% |
* ... smaller is better
Power consumption Witcher 3 / stress test
Power consumption external monitor
电池寿命
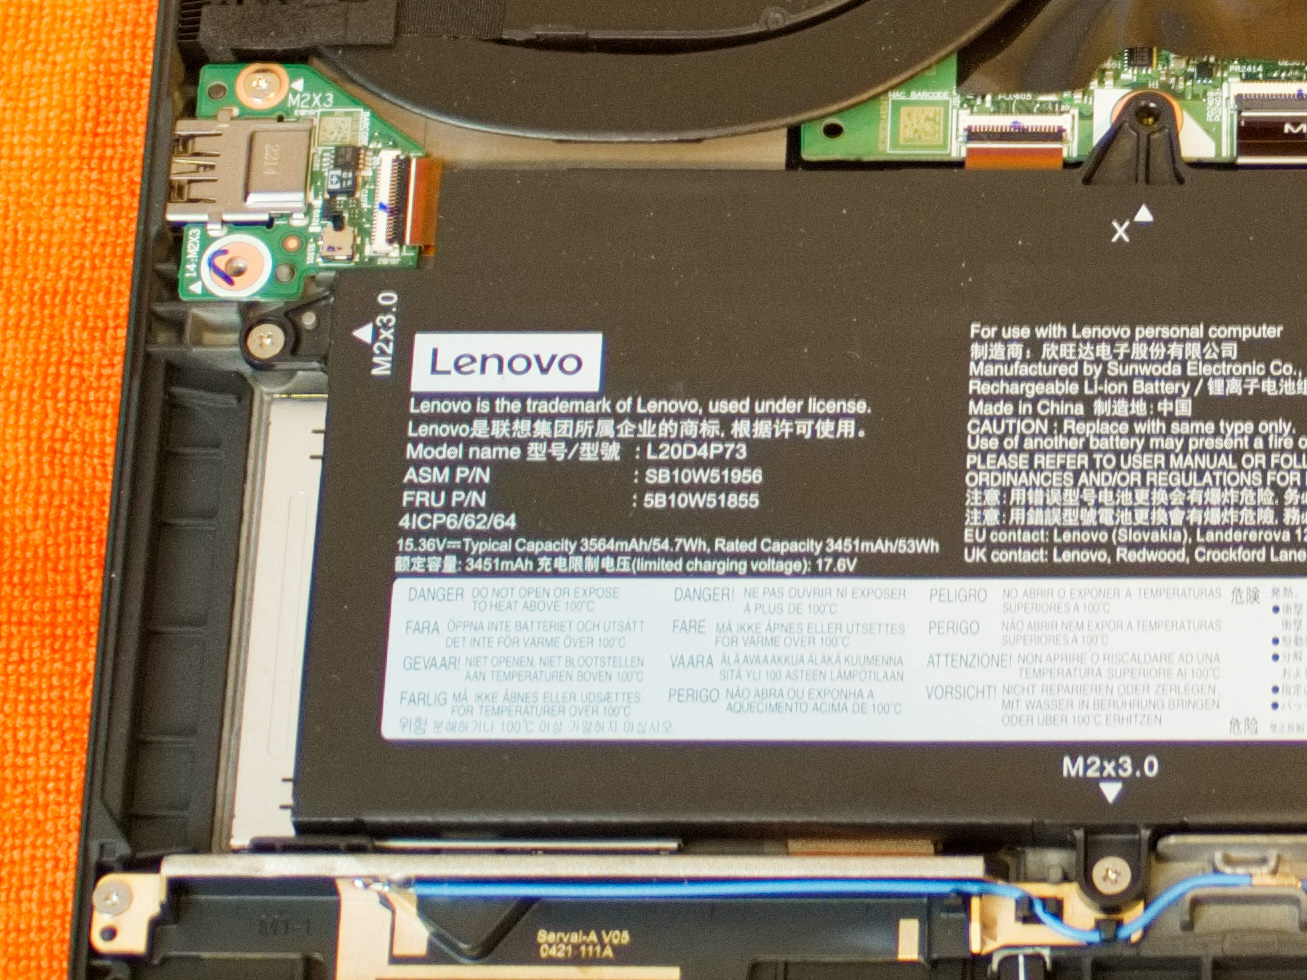
安装在联想ThinkPad X13 G3中的电池容量被指定为53瓦特小时。在实际的Wi-Fi网上冲浪测试中,所储存的能量足以让笔记本运行10个小时以上。即使在负载情况下,这款超极本仍然可以在不需要外部电源的情况下运行两个小时。
| Lenovo ThinkPad X13 G3 21BN0046GE i5-1235U, Iris Xe G7 80EUs, 54.7 Wh | Framework Laptop 13.5 12th Gen Intel i7-1260P, Iris Xe G7 96EUs, 55 Wh | HP Elite Dragonfly G3 i7-1265U, Iris Xe G7 96EUs, 68 Wh | Dell Latitude 13 7330 i7-1265U, Iris Xe G7 96EUs, 41 Wh | Lenovo ThinkPad X1 Titanium Yoga G1 20QB0016GE i5-1140G7, Iris Xe G7 80EUs, 44.5 Wh | Lenovo ThinkPad X13 G2 AMD 20XH001KGE R5 PRO 5650U, Vega 7, 54.7 Wh | Average of class Subnotebook | |
|---|---|---|---|---|---|---|---|
| Battery runtime | -26% | 86% | 2% | -20% | 46% | ||
| Reader / Idle (h) | 14.2 | 37.8 166% | 21.9 54% | 28.6 ? 101% | |||
| WiFi v1.3 (h) | 10.2 | 7.5 -26% | 11.8 16% | 8.3 -19% | 9.3 -9% | 14.1 ? 38% | |
| Load (h) | 2 | 3.5 75% | 1.4 -30% | 1.4 -30% | 1.998 ? 0% | ||
| H.264 (h) | 13.6 | 15.3 ? |
Pros
Cons
评语 - 空间不足的旅行笔记本
有了英特尔的Alder Lake处理器,ThinkPad X13 G3变得比它的前辈们更强大了一些。无论它是否配备了 英特尔- 还是 AMD处理器第二代的ThinkPad在冲刺阶段无法跟上第三代的步伐。配备AMD处理器的ThinkPad X13 G2在基准测试中的表现更好,负载时间更长。
对X13 G3的少数批评是跨时代的,主要可以归因于机箱内的有限空间。对于工作用笔记本电脑来说,一个键程更高的键盘是可取的,长期性能较低,笔记本的声音也很弱。在这里,那些正在寻找特别节省空间的笔记本的人可能确实要忍受这些限制。因为其他超极本如 HP Elite Dragonfly G3也有类似的批评之处。
对于这样一个紧凑的设备,ThinkPad X13 G3主要在连接方面提供了很多。快速的WLAN 6E和一个LTE调制解调器确保了与互联网的永久连接。16:10的显示屏很强大,超极本的性能也很充足。
联想ThinkPad X13的强大平台再次升级为最新一代英特尔处理器。这款稳定而又轻便的设备吸引着人们带着笔记本电脑旅行。将商用笔记本电脑与消费类设备相比较,一开始你可能不会注意到任何性能差异。然而,ThinkPads往往有明显的优势,特别是在软技能方面,如保修期、连接性和人体工程学。当然,这也适用于商业竞争,如非常相似的戴尔Latitude 7330 ,它也提供三年的保修期。
价格和可用性
即使是最小的ThinkPad也有很大的价格。ThinkPad X13 G3的各种配置起价约为1,500欧元,。.
Lenovo ThinkPad X13 G3 21BN0046GE
- 11/21/2022 v7 (old)
Marc Herter
Price comparison
