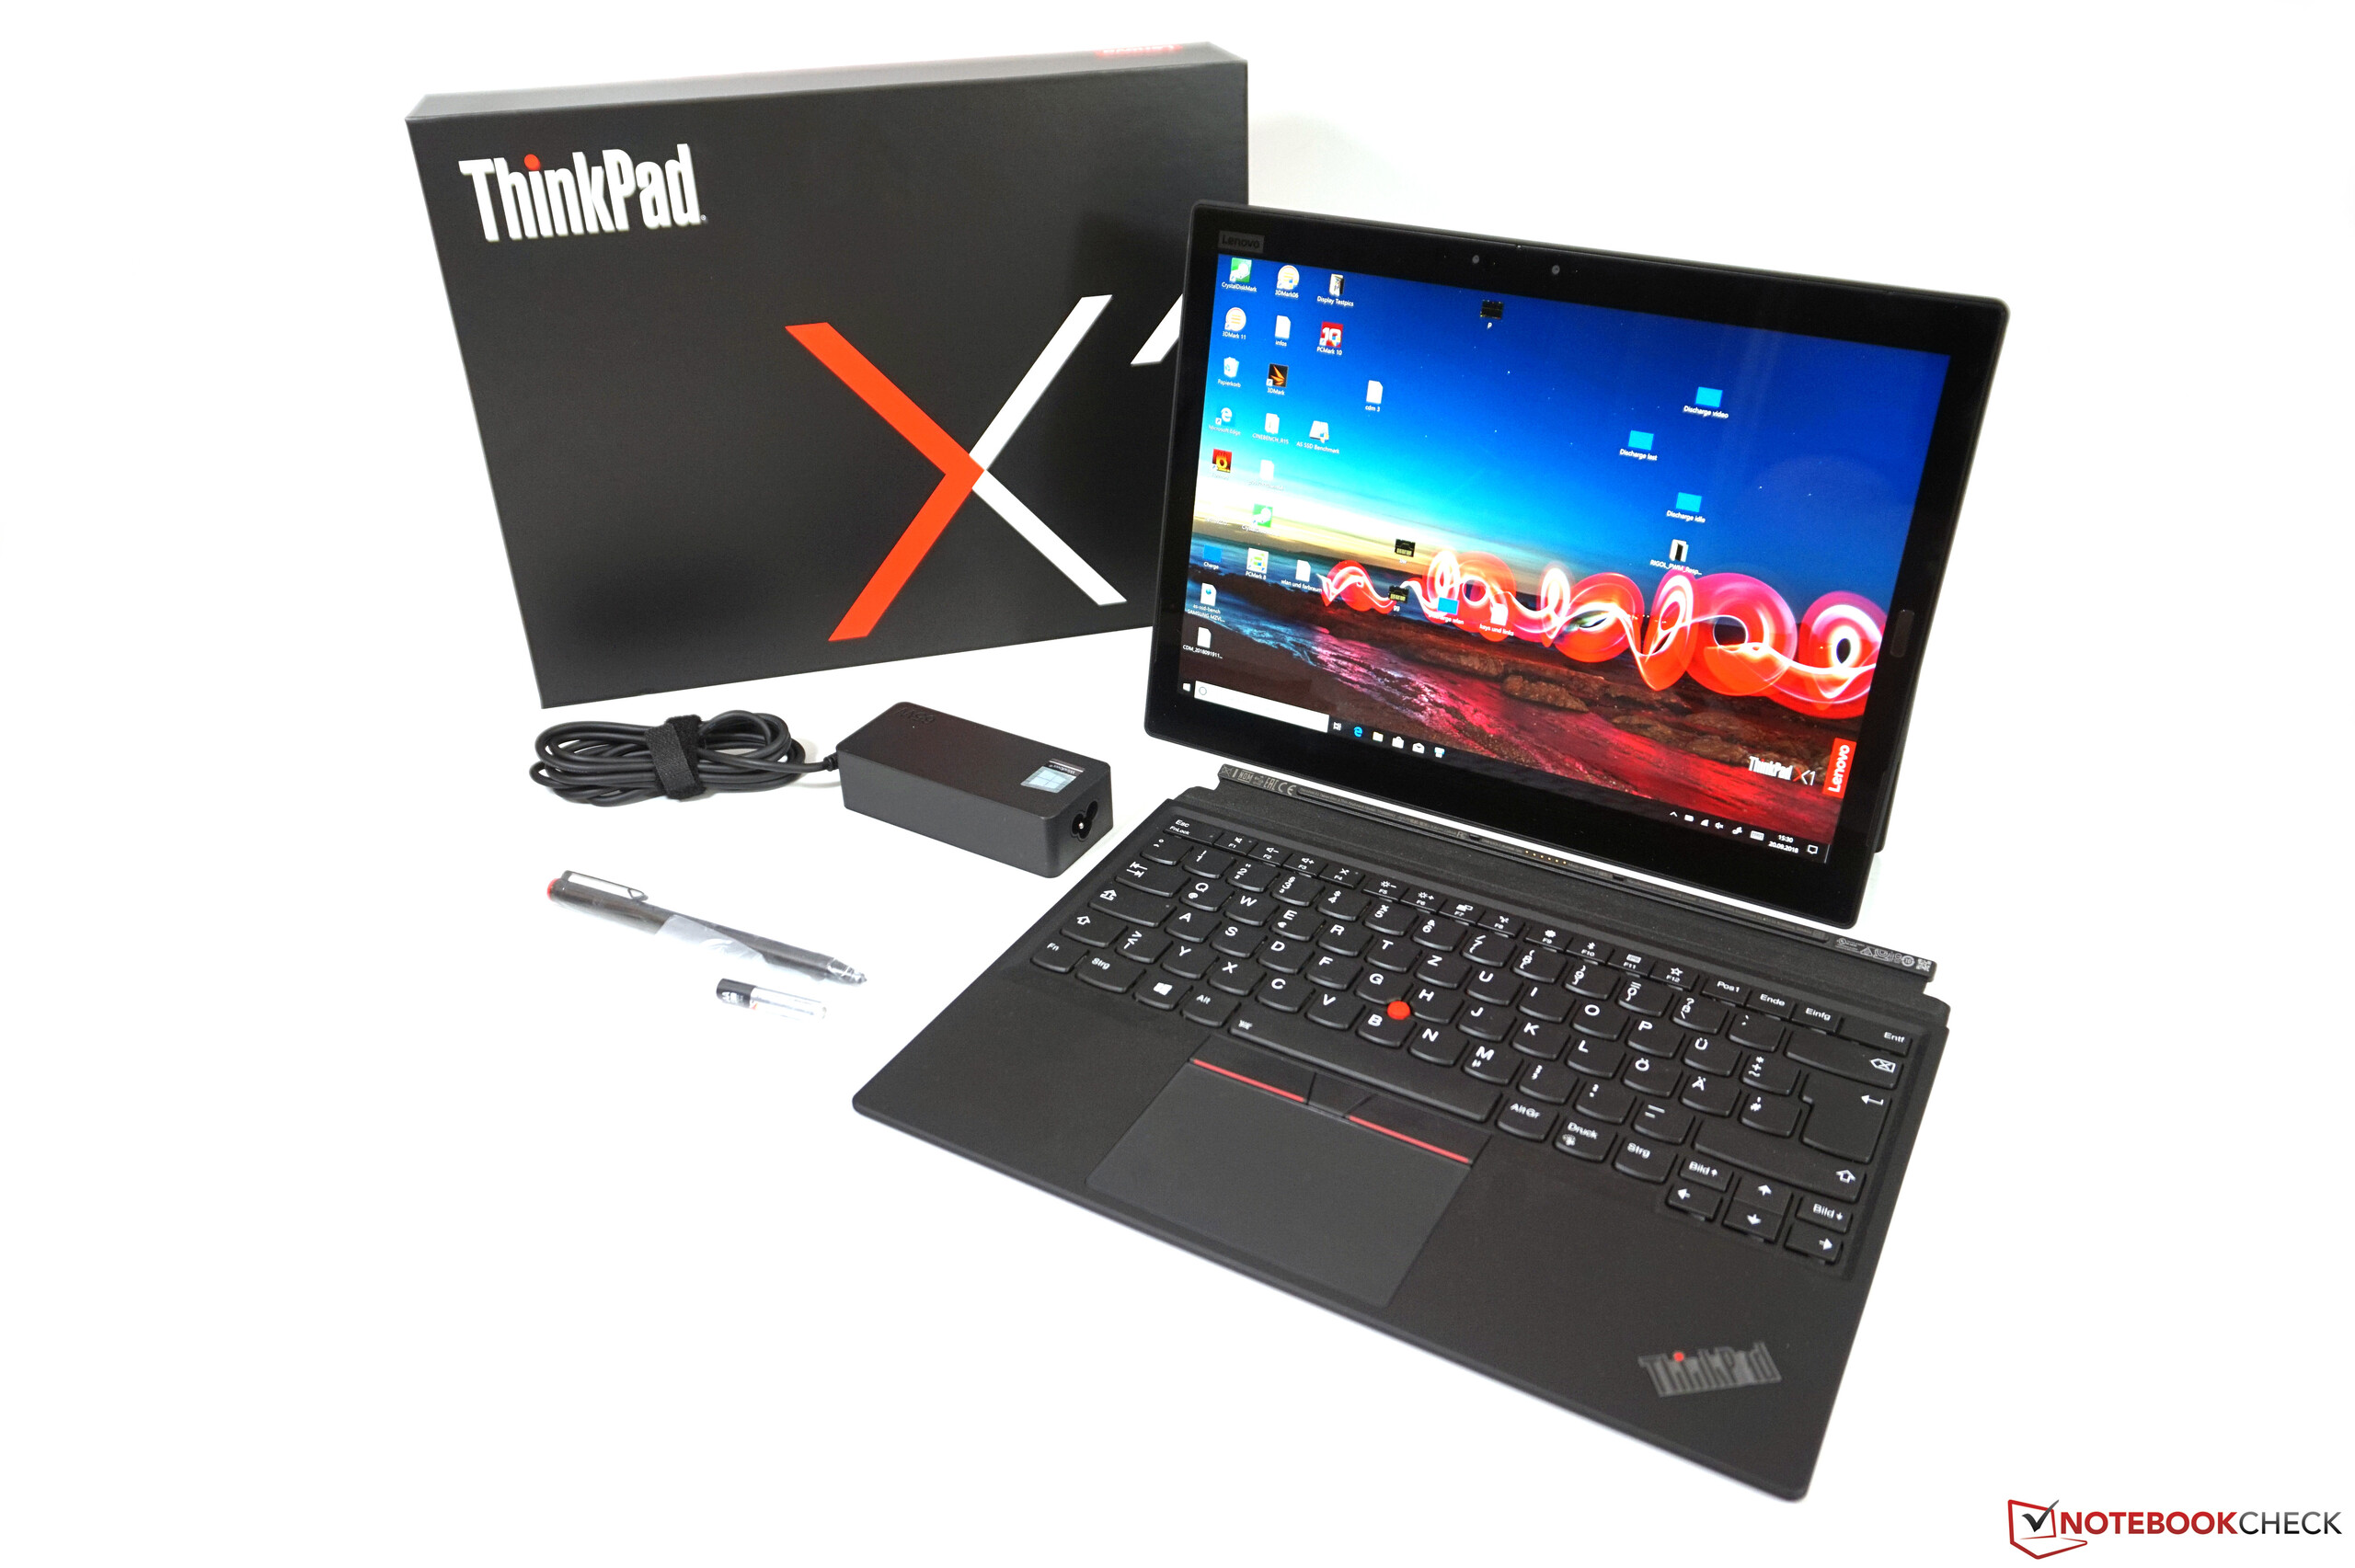
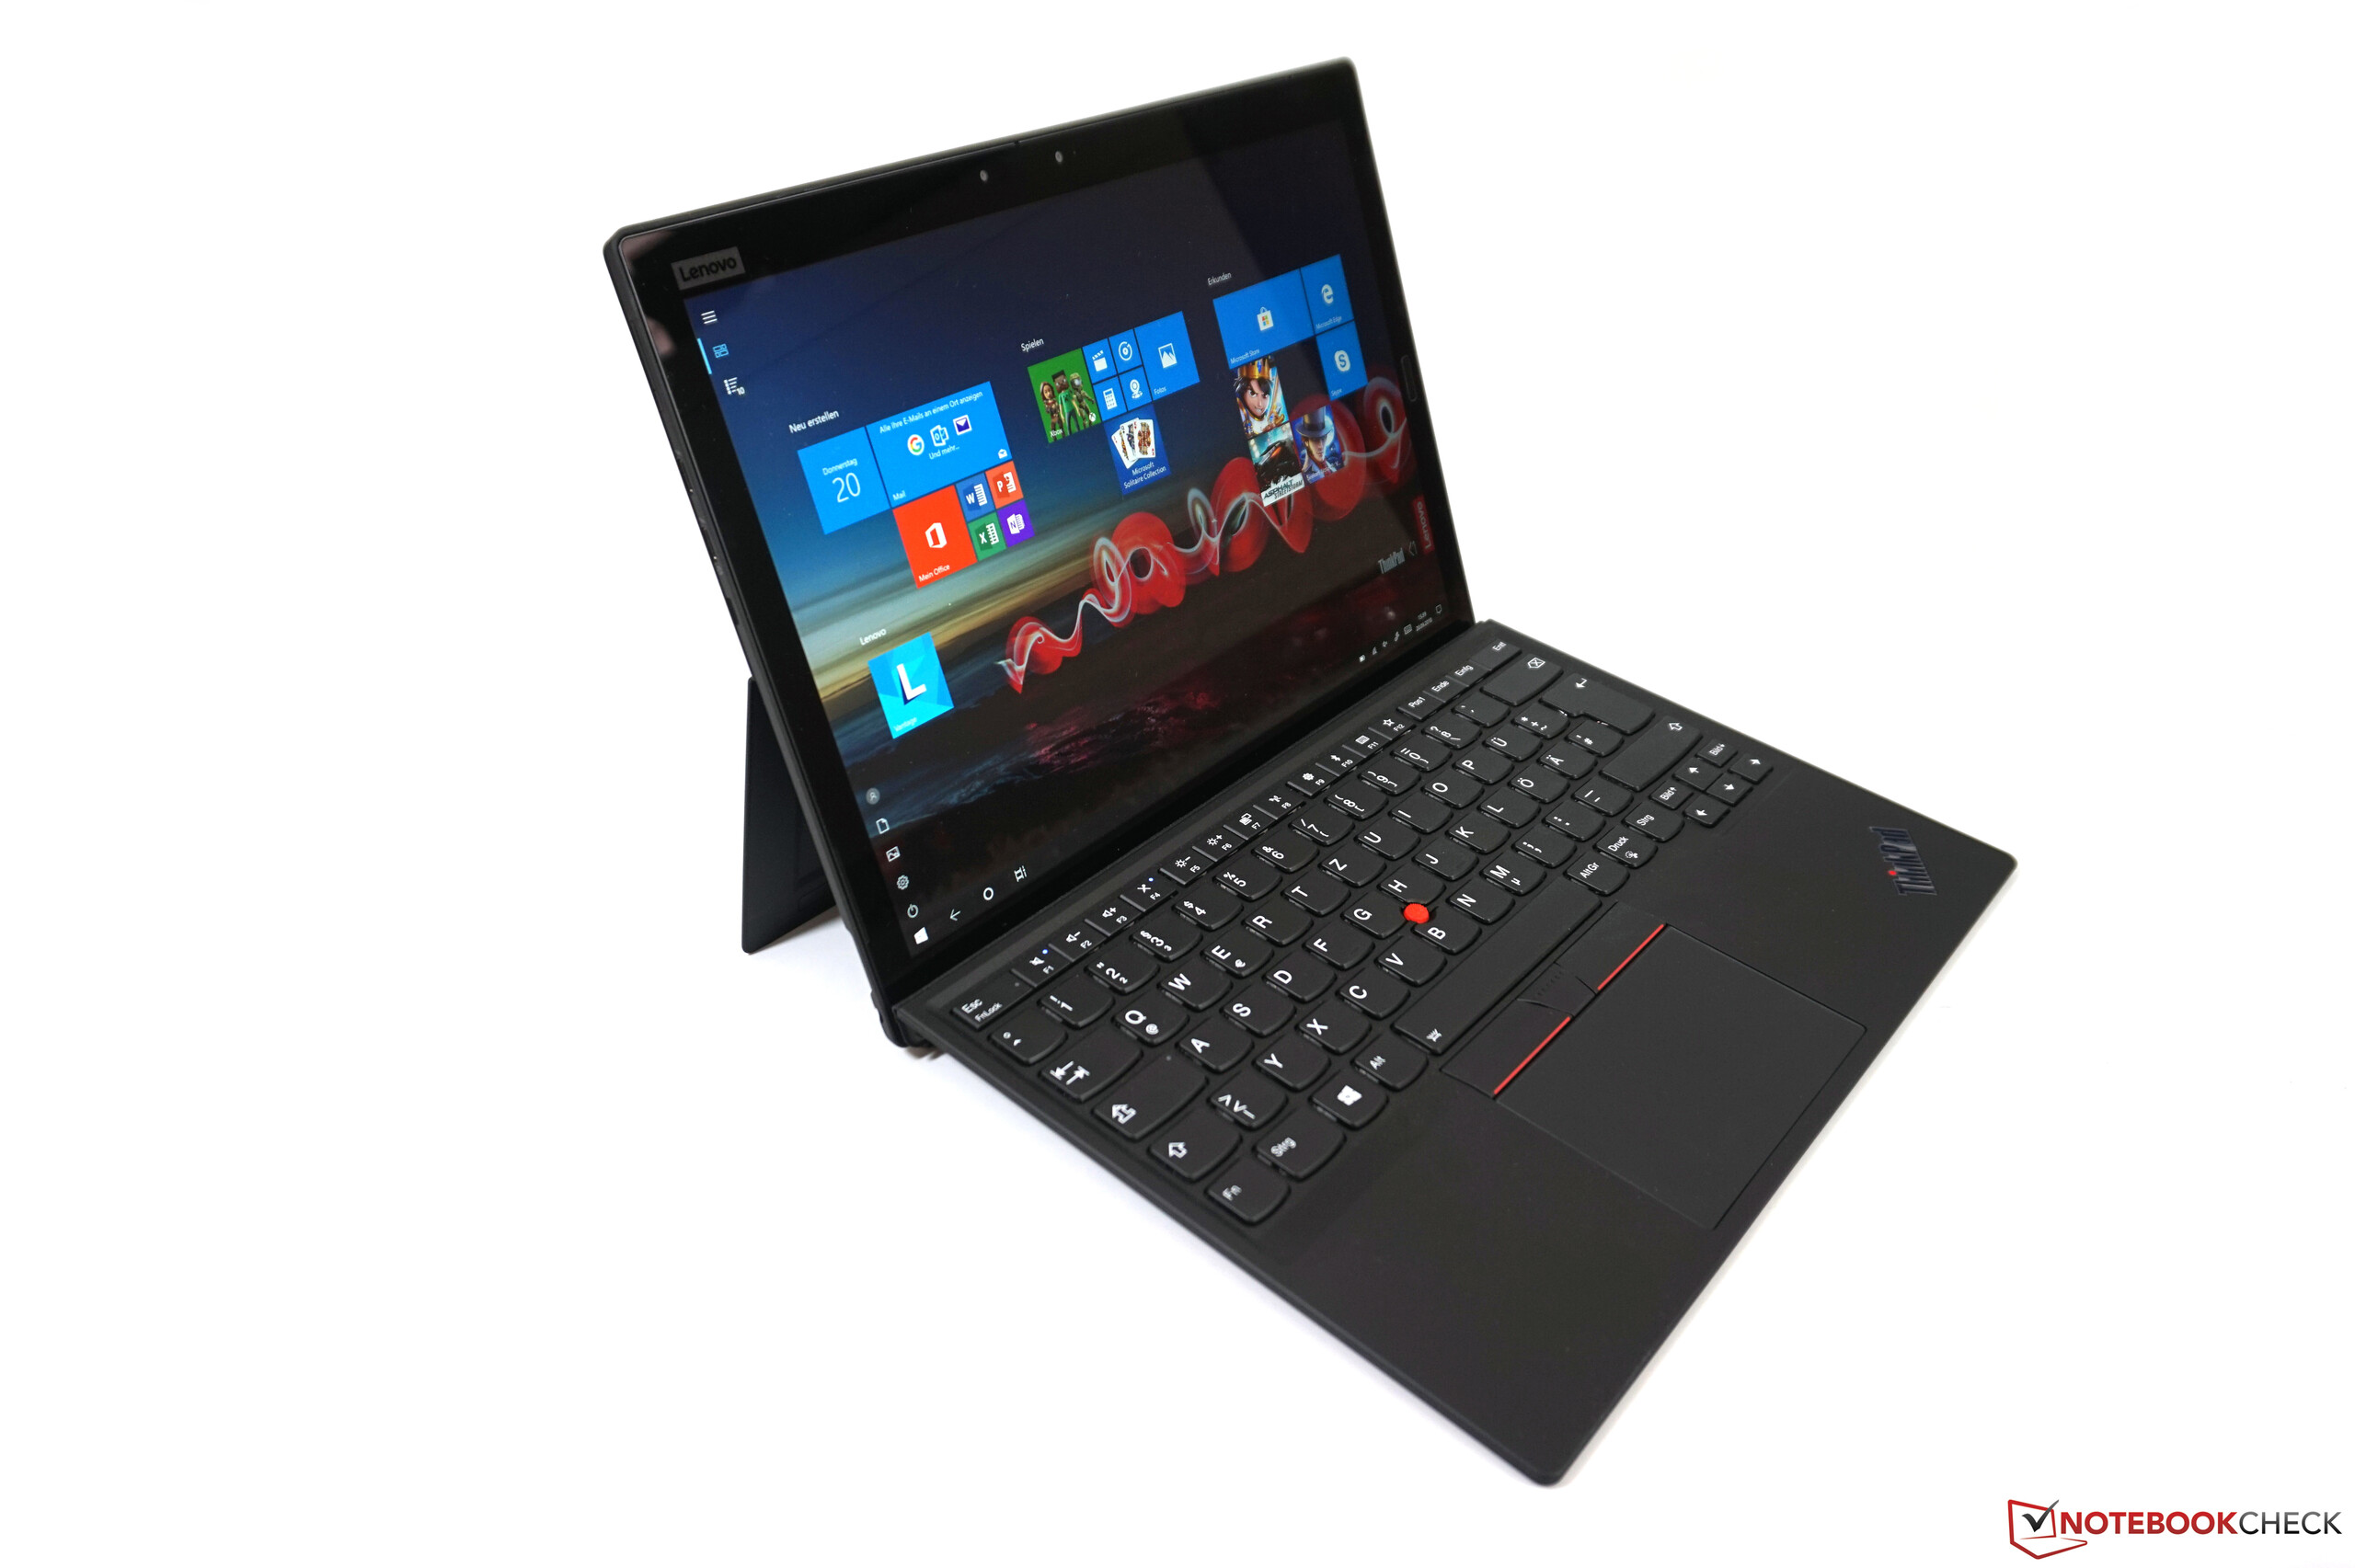
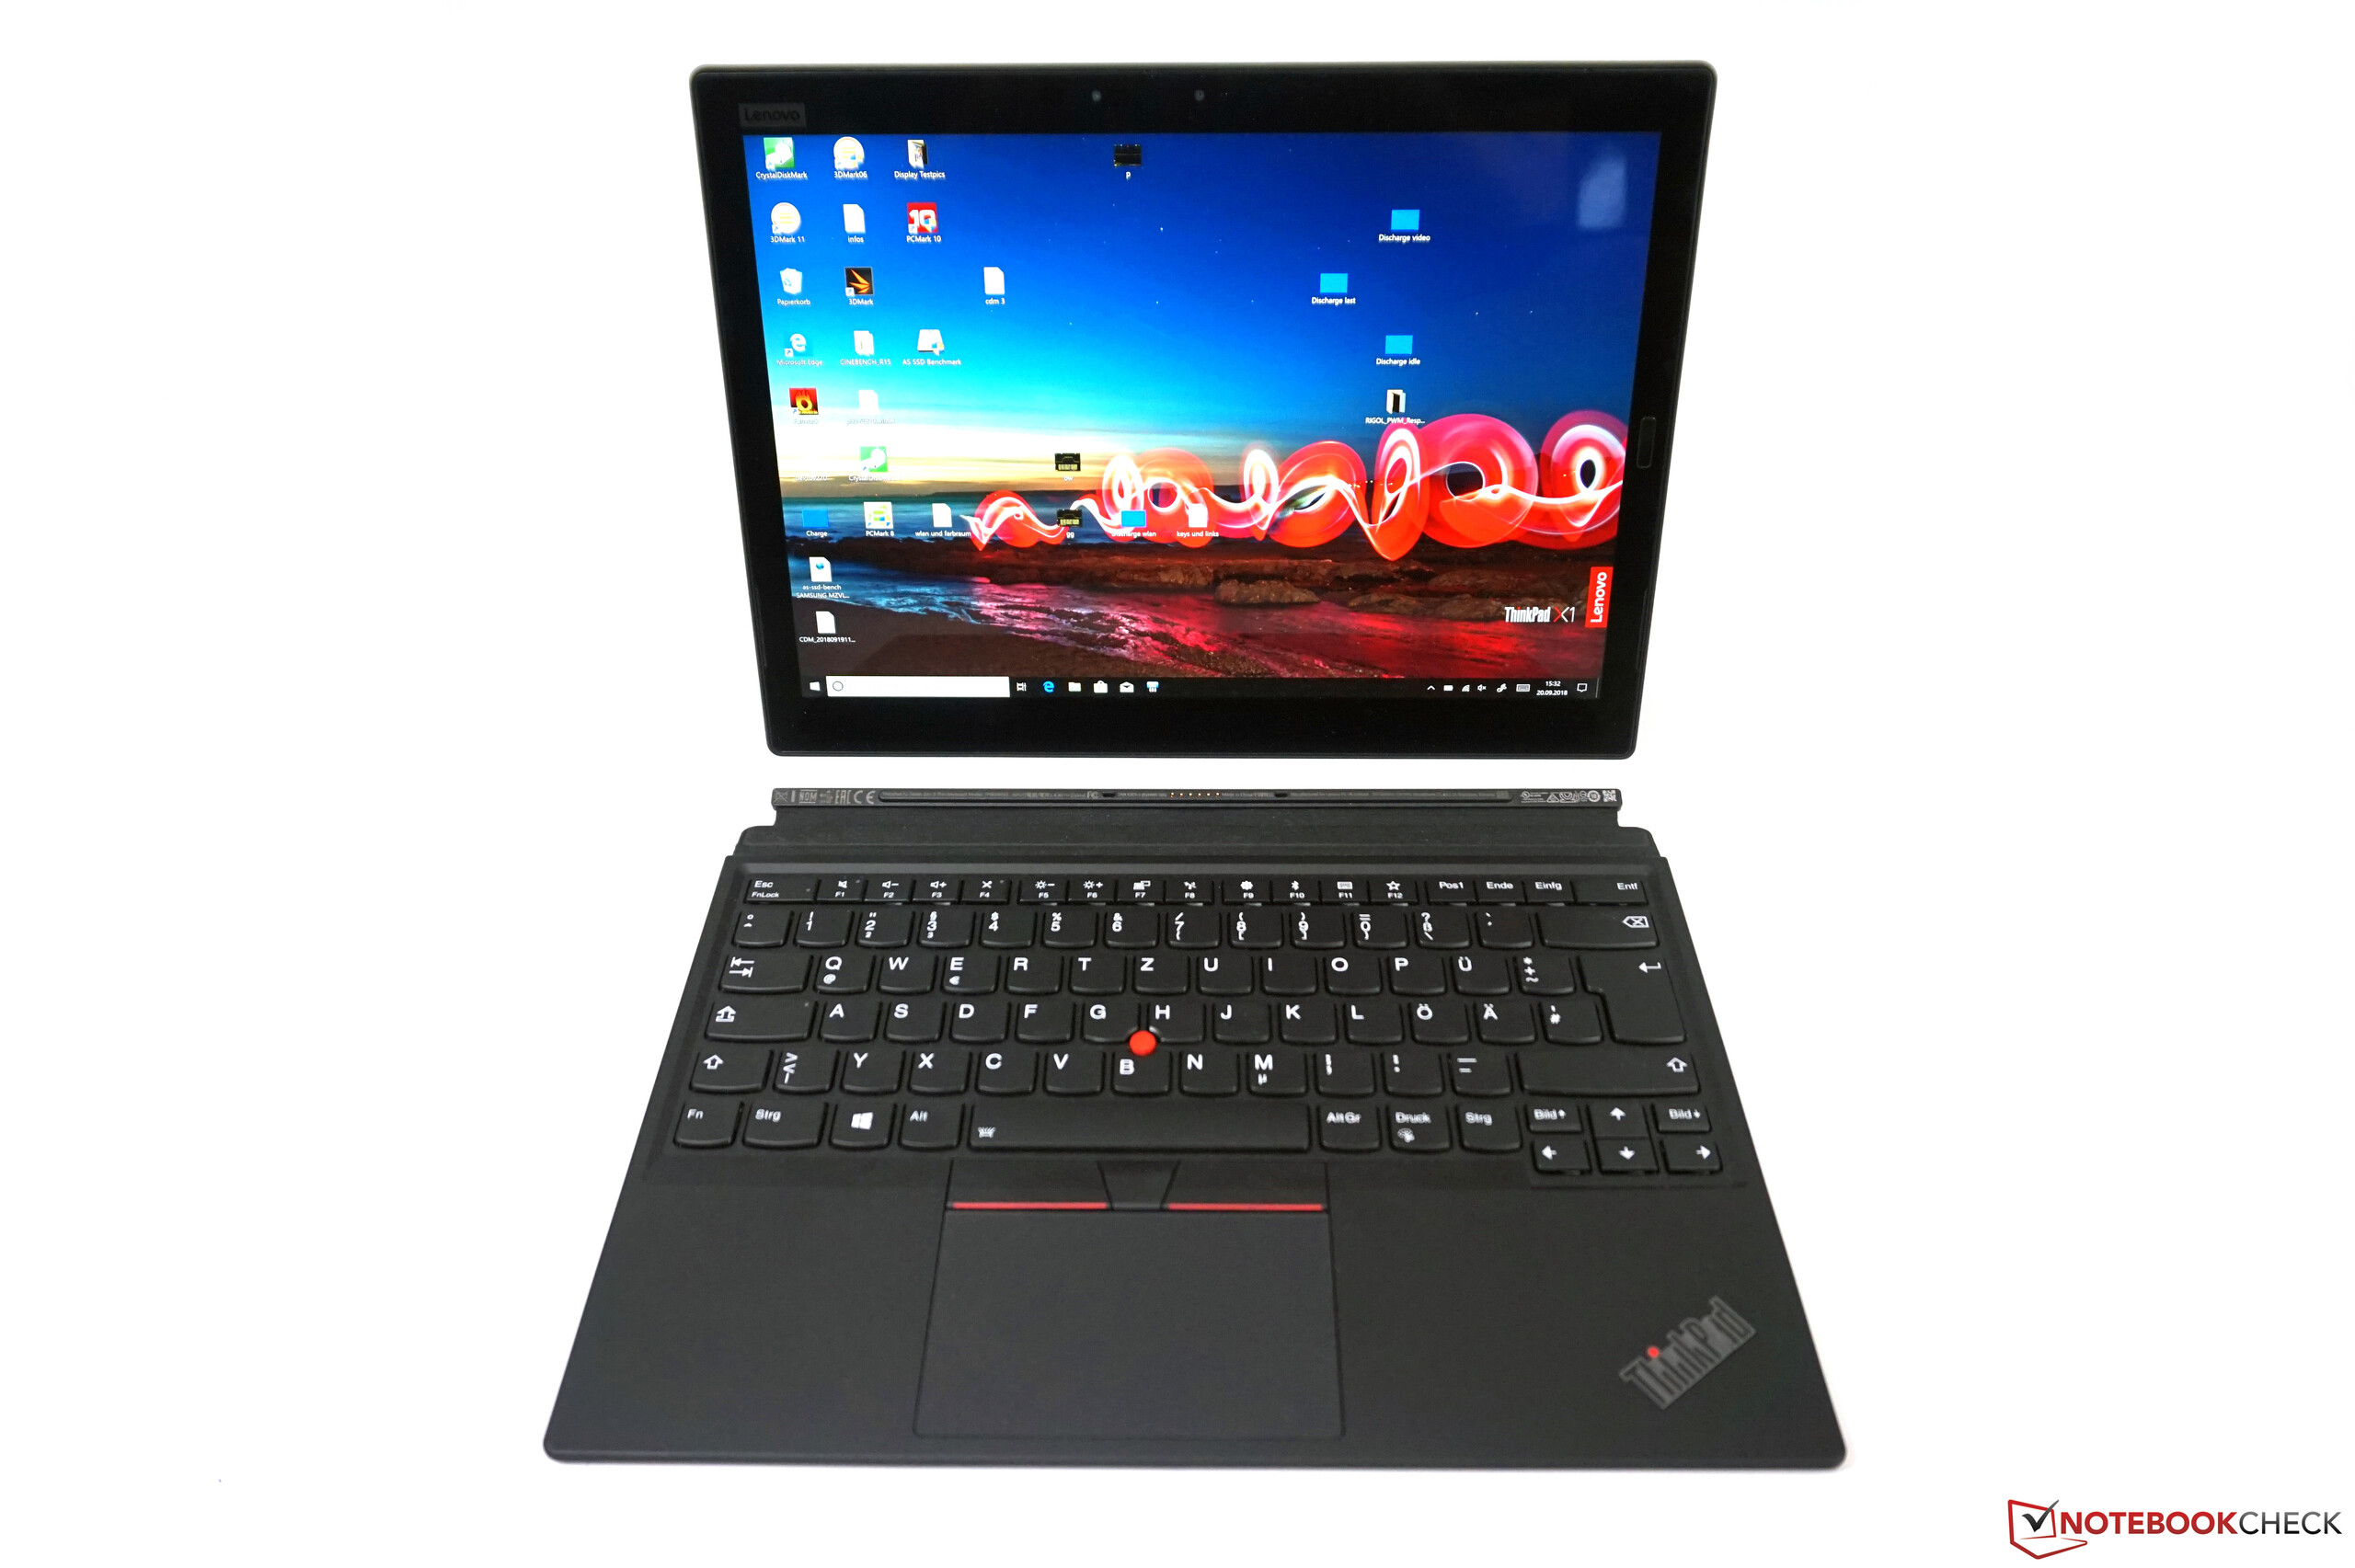
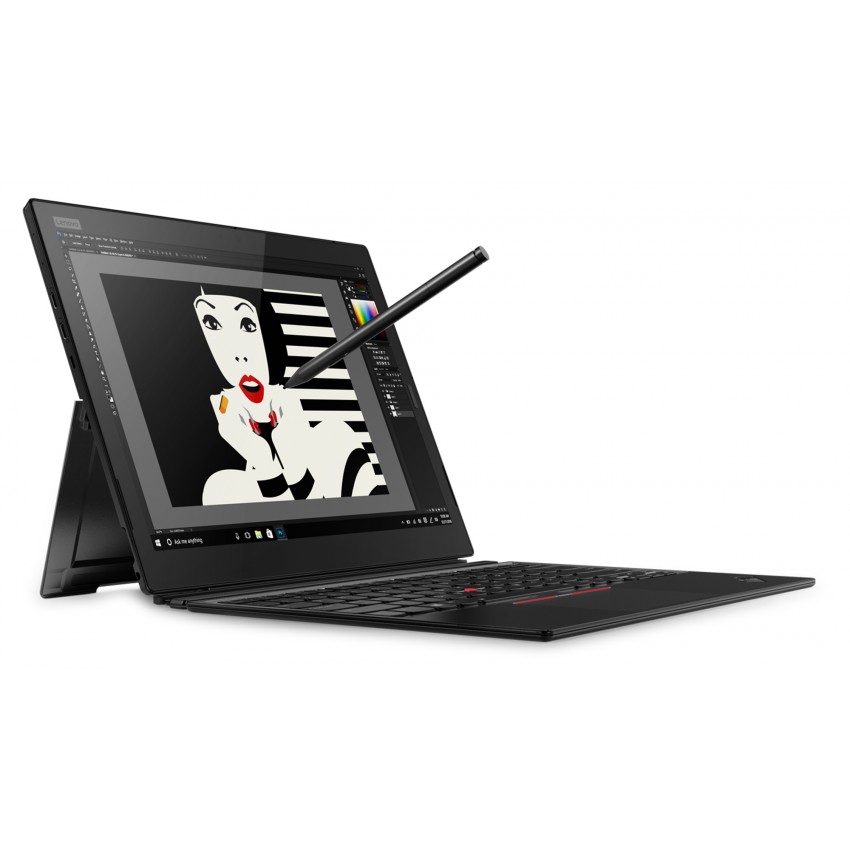
联想ThinkPad X1 Tablet 2018 (i5, 3K-IPS) 平板电脑评测
| SD Card Reader | |
| average JPG Copy Test (av. of 3 runs) | |
| Dell Latitude 5290 2-in-1 (Toshiba Exceria Pro M501 UHS-II) | |
| Lenovo ThinkPad X1 Tablet G3-20KJ001NGE (Toshiba Exceria Pro M501 UHS-II) | |
| Microsoft Surface Pro 6, Core i7, 512 GB (Toshiba Exceria Pro M501 microSDXC 64GB) | |
| Lenovo ThinkPad X1 Tablet Gen 2 (Toshiba Exceria Pro SDXC 64 GB UHS-II) | |
| Average of class Convertible (29.4 - 141, n=20, last 2 years) | |
| maximum AS SSD Seq Read Test (1GB) | |
| Dell Latitude 5290 2-in-1 (Toshiba Exceria Pro M501 UHS-II) | |
| Average of class Convertible (67.5 - 254, n=19, last 2 years) | |
| Lenovo ThinkPad X1 Tablet Gen 2 (Toshiba Exceria Pro SDXC 64 GB UHS-II) | |
| Microsoft Surface Pro 6, Core i7, 512 GB (Toshiba Exceria Pro M501 microSDXC 64GB) | |
| Lenovo ThinkPad X1 Tablet G3-20KJ001NGE (Toshiba Exceria Pro M501 UHS-II) | |
| |||||||||||||||||||||||||
Brightness Distribution: 76 %
Center on Battery: 470 cd/m²
Contrast: 1436:1 (Black: 0.33 cd/m²)
ΔE ColorChecker Calman: 3.2 | ∀{0.5-29.43 Ø4.71}
calibrated: 0.9
ΔE Greyscale Calman: 4.5 | ∀{0.09-98 Ø4.96}
99.4% sRGB (Argyll 1.6.3 3D)
64% AdobeRGB 1998 (Argyll 1.6.3 3D)
69.3% AdobeRGB 1998 (Argyll 3D)
99.1% sRGB (Argyll 3D)
68.1% Display P3 (Argyll 3D)
Gamma: 2.07
CCT: 5881 K
| Lenovo ThinkPad X1 Tablet G3-20KJ001NGE LP130QP1-SPA1, , 3000x2000, 13" | HP Elite x2 1013 G3-2TT14EA AU Optronics AUO101A, , 3000x2000, 13" | Microsoft Surface Pro 6, Core i7, 512 GB LGPhilips LP123WQ112604, , 2736x1824, 12.3" | Dell Latitude 5290 2-in-1 SHP1479, , 1920x1280, 12.3" | Toshiba Portege X30T-E-109 Toshiba TOS508F, , 1920x1080, 13.3" | Lenovo ThinkPad X1 Tablet Gen 2 LSN120QL01L01, , 2160x1440, 12" | |
|---|---|---|---|---|---|---|
| Display | -2% | -3% | 2% | -5% | ||
| Display P3 Coverage (%) | 68.1 67.8 | 67.5 -1% | 67.1 -1% | 70.5 4% | 67.2 -1% | |
| sRGB Coverage (%) | 99.4 99.1 | 96.7 -3% | 95.5 -4% | 98.6 -1% | 90.8 -9% | |
| AdobeRGB 1998 Coverage (%) | 69.9 69.3 | 68.2 -2% | 67.9 -3% | 71.5 2% | 66.5 -5% | |
| Response Times | 20% | 25% | -3% | 12% | 43% | |
| Response Time Grey 50% / Grey 80% * (ms) | 47.2 ? | 47 ? -0% | 43 ? 9% | 56.8 ? -20% | 42 ? 11% | 28.4 ? 40% |
| Response Time Black / White * (ms) | 42.4 ? | 26 ? 39% | 25 ? 41% | 36 ? 15% | 37 ? 13% | 22.8 ? 46% |
| PWM Frequency (Hz) | 22000 ? | 1852 ? | 17000 ? | 221.2 ? | ||
| Screen | -18% | -5% | -16% | -39% | -23% | |
| Brightness middle (cd/m²) | 474 | 452 -5% | 484 2% | 548 16% | 350 -26% | 388.1 -18% |
| Brightness (cd/m²) | 418 | 412 -1% | 473 13% | 545 30% | 343 -18% | 344 -18% |
| Brightness Distribution (%) | 76 | 85 12% | 91 20% | 86 13% | 73 -4% | 78 3% |
| Black Level * (cd/m²) | 0.33 | 0.48 -45% | 0.33 -0% | 0.51 -55% | 0.29 12% | 0.39 -18% |
| Contrast (:1) | 1436 | 942 -34% | 1467 2% | 1075 -25% | 1207 -16% | 995 -31% |
| Colorchecker dE 2000 * | 3.2 | 4.05 -27% | 4.29 -34% | 3.65 -14% | 6.36 -99% | 4.6 -44% |
| Colorchecker dE 2000 max. * | 6.1 | 6.64 -9% | 6.46 -6% | 7.15 -17% | 11.63 -91% | 9.1 -49% |
| Colorchecker dE 2000 calibrated * | 0.9 | 1.56 -73% | 1.34 -49% | 1.81 -101% | 1.7 -89% | |
| Greyscale dE 2000 * | 4.5 | 4.87 -8% | 4.3 4% | 5.5 -22% | 8.04 -79% | 6.1 -36% |
| Gamma | 2.07 106% | 2.71 81% | 2.51 88% | 2.154 102% | 2.47 89% | 2.07 106% |
| CCT | 5881 111% | 7160 91% | 7315 89% | 7052 92% | 7716 84% | 7104 91% |
| Color Space (Percent of AdobeRGB 1998) (%) | 64 | 62 -3% | 62 -3% | 65.2 2% | 59 -8% | 59 -8% |
| Color Space (Percent of sRGB) (%) | 99.4 | 97 -2% | 95 -4% | 99.1 0% | 91 -8% | 91 -8% |
| Total Average (Program / Settings) | 0% /
-10% | 6% /
-1% | -6% /
-11% | -11% /
-26% | 10% /
-12% |
* ... smaller is better
Display Response Times
| ↔ Response Time Black to White | ||
|---|---|---|
| 42.4 ms ... rise ↗ and fall ↘ combined | ↗ 19.6 ms rise | 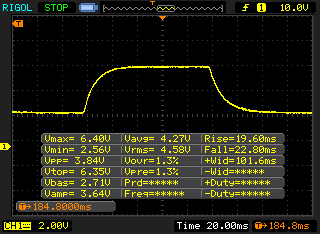 |
| ↘ 22.8 ms fall | ||
| The screen shows slow response rates in our tests and will be unsatisfactory for gamers. In comparison, all tested devices range from 0.1 (minimum) to 240 (maximum) ms. » 98 % of all devices are better. This means that the measured response time is worse than the average of all tested devices (19.8 ms). | ||
| ↔ Response Time 50% Grey to 80% Grey | ||
| 47.2 ms ... rise ↗ and fall ↘ combined | ↗ 21.2 ms rise | 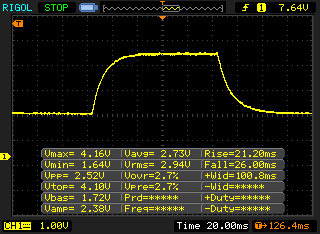 |
| ↘ 26 ms fall | ||
| The screen shows slow response rates in our tests and will be unsatisfactory for gamers. In comparison, all tested devices range from 0.165 (minimum) to 636 (maximum) ms. » 82 % of all devices are better. This means that the measured response time is worse than the average of all tested devices (31 ms). | ||
Screen Flickering / PWM (Pulse-Width Modulation)
| Screen flickering / PWM not detected | 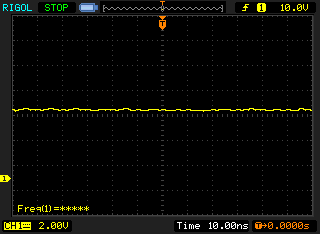 | ||
In comparison: 52 % of all tested devices do not use PWM to dim the display. If PWM was detected, an average of 7757 (minimum: 5 - maximum: 343500) Hz was measured. | |||
| PCMark 8 Home Score Accelerated v2 | 3479 points | |
| PCMark 8 Creative Score Accelerated v2 | 4767 points | |
| PCMark 8 Work Score Accelerated v2 | 4136 points | |
| PCMark 10 Score | 3544 points | |
Help | ||

| 3DMark 11 Performance | 2041 points | |
| 3DMark Cloud Gate Standard Score | 8625 points | |
| 3DMark Fire Strike Score | 1103 points | |
Help | ||
| low | med. | high | ultra | |
|---|---|---|---|---|
| BioShock Infinite (2013) | 59.2 | 34.8 | 30.2 | 10.1 |
| The Witcher 3 (2015) | 12.1 | |||
| Rocket League (2017) | 59.2 | 35.1 | 23.1 |
| 3DMark 11 | |
| 1280x720 Performance | |
| Lenovo ThinkPad X1 Tablet G3-20KJ001NGE | |
| Lenovo ThinkPad X1 Tablet G3-20KJ001NGE | |
| 1280x720 Performance GPU | |
| Lenovo ThinkPad X1 Tablet G3-20KJ001NGE | |
| Lenovo ThinkPad X1 Tablet G3-20KJ001NGE | |
| 1280x720 Performance Physics | |
| Lenovo ThinkPad X1 Tablet G3-20KJ001NGE | |
| Lenovo ThinkPad X1 Tablet G3-20KJ001NGE | |
| 3DMark | |
| 1920x1080 Fire Strike Score | |
| Lenovo ThinkPad X1 Tablet G3-20KJ001NGE | |
| Lenovo ThinkPad X1 Tablet G3-20KJ001NGE | |
| 1920x1080 Fire Strike Graphics | |
| Lenovo ThinkPad X1 Tablet G3-20KJ001NGE | |
| Lenovo ThinkPad X1 Tablet G3-20KJ001NGE | |
| 1920x1080 Fire Strike Physics | |
| Lenovo ThinkPad X1 Tablet G3-20KJ001NGE | |
| Lenovo ThinkPad X1 Tablet G3-20KJ001NGE | |
| BioShock Infinite | |
| 1920x1080 Ultra Preset, DX11 (DDOF) | |
| Lenovo ThinkPad X1 Tablet G3-20KJ001NGE | |
| Lenovo ThinkPad X1 Tablet G3-20KJ001NGE | |
| 1366x768 High Preset | |
| Lenovo ThinkPad X1 Tablet G3-20KJ001NGE | |
| Lenovo ThinkPad X1 Tablet G3-20KJ001NGE | |
| 1366x768 Medium Preset | |
| Lenovo ThinkPad X1 Tablet G3-20KJ001NGE | |
| Lenovo ThinkPad X1 Tablet G3-20KJ001NGE | |
| 1280x720 Very Low Preset | |
| Lenovo ThinkPad X1 Tablet G3-20KJ001NGE | |
| Lenovo ThinkPad X1 Tablet G3-20KJ001NGE | |
| Rocket League | |
| 1920x1080 High Quality AA:High FX | |
| Lenovo ThinkPad X1 Tablet G3-20KJ001NGE | |
| Lenovo ThinkPad X1 Tablet G3-20KJ001NGE | |
| 1920x1080 Quality AA:Medium FX | |
| Lenovo ThinkPad X1 Tablet G3-20KJ001NGE | |
| Lenovo ThinkPad X1 Tablet G3-20KJ001NGE | |
| 1280x720 Performance | |
| Lenovo ThinkPad X1 Tablet G3-20KJ001NGE | |
| Lenovo ThinkPad X1 Tablet G3-20KJ001NGE | |
| The Witcher 3 | |
| 1920x1080 Ultra Graphics & Postprocessing (HBAO+) | |
| Lenovo ThinkPad X1 Tablet G3-20KJ001NGE | |
| 1920x1080 High Graphics & Postprocessing (Nvidia HairWorks Off) | |
| Lenovo ThinkPad X1 Tablet G3-20KJ001NGE | |
| 1366x768 Medium Graphics & Postprocessing | |
| Lenovo ThinkPad X1 Tablet G3-20KJ001NGE | |
| 1024x768 Low Graphics & Postprocessing | |
| Lenovo ThinkPad X1 Tablet G3-20KJ001NGE | |
| Lenovo ThinkPad X1 Tablet G3-20KJ001NGE | |
Noise level
| Idle |
| 29.8 / 29.8 / 31.3 dB(A) |
| Load |
| 35.9 / 38.6 dB(A) |
 | ||
30 dB silent 40 dB(A) audible 50 dB(A) loud |
||
min: | ||
| Lenovo ThinkPad X1 Tablet G3-20KJ001NGE UHD Graphics 620, i5-8250U, Samsung PM961 MZVLW256HEHP | HP Elite x2 1013 G3-2TT14EA UHD Graphics 620, i5-8350U, Samsung PM961 MZVLW256HEHP | Microsoft Surface Pro 6, Core i7, 512 GB UHD Graphics 620, i7-8650U, Toshiba KBG30ZPZ512G | Dell Latitude 5290 2-in-1 UHD Graphics 620, i5-8350U, Toshiba XG5 KXG50ZNV256G | Toshiba Portege X30T-E-109 UHD Graphics 620, i5-8550U, Samsung SSD PM981 MZVLB1T0HALR | |
|---|---|---|---|---|---|
| Noise | 3% | 3% | 6% | 2% | |
| off / environment * (dB) | 29.8 | 30.3 -2% | 30.3 -2% | 28.5 4% | 30.3 -2% |
| Idle Minimum * (dB) | 29.8 | 30.3 -2% | 30.3 -2% | 28.5 4% | 30.9 -4% |
| Idle Average * (dB) | 29.8 | 30.3 -2% | 30.3 -2% | 28.5 4% | 30.9 -4% |
| Idle Maximum * (dB) | 31.3 | 31.2 -0% | 30.3 3% | 28.5 9% | 32.3 -3% |
| Load Average * (dB) | 35.9 | 32.8 9% | 33.5 7% | 28.5 21% | 32.7 9% |
| Load Maximum * (dB) | 38.6 | 32.9 15% | 33.5 13% | 41.6 -8% | 32.7 15% |
* ... smaller is better
(±) The maximum temperature on the upper side is 44.3 °C / 112 F, compared to the average of 35.4 °C / 96 F, ranging from 19.6 to 60 °C for the class Convertible.
(-) The bottom heats up to a maximum of 48.9 °C / 120 F, compared to the average of 36.9 °C / 98 F
(+) In idle usage, the average temperature for the upper side is 26.7 °C / 80 F, compared to the device average of 30.3 °C / 87 F.
(±) The palmrests and touchpad can get very hot to the touch with a maximum of 37.6 °C / 99.7 F.
(-) The average temperature of the palmrest area of similar devices was 28 °C / 82.4 F (-9.6 °C / -17.3 F).
Lenovo ThinkPad X1 Tablet G3-20KJ001NGE audio analysis
(±) | speaker loudness is average but good (73.6 dB)
Bass 100 - 315 Hz
(-) | nearly no bass - on average 21.7% lower than median
(±) | linearity of bass is average (9.5% delta to prev. frequency)
Mids 400 - 2000 Hz
(+) | balanced mids - only 4.7% away from median
(±) | linearity of mids is average (7.8% delta to prev. frequency)
Highs 2 - 16 kHz
(±) | higher highs - on average 7.8% higher than median
(±) | linearity of highs is average (14.2% delta to prev. frequency)
Overall 100 - 16.000 Hz
(-) | overall sound is not linear (33.2% difference to median)
Compared to same class
» 93% of all tested devices in this class were better, 1% similar, 6% worse
» The best had a delta of 6%, average was 20%, worst was 57%
Compared to all devices tested
» 92% of all tested devices were better, 1% similar, 7% worse
» The best had a delta of 4%, average was 23%, worst was 134%
HP Elite x2 1013 G3-2TT14EA audio analysis
(±) | speaker loudness is average but good (74.4 dB)
Bass 100 - 315 Hz
(-) | nearly no bass - on average 15.1% lower than median
(±) | linearity of bass is average (10.9% delta to prev. frequency)
Mids 400 - 2000 Hz
(±) | higher mids - on average 7.9% higher than median
(±) | linearity of mids is average (11.3% delta to prev. frequency)
Highs 2 - 16 kHz
(±) | higher highs - on average 5.2% higher than median
(+) | highs are linear (6.8% delta to prev. frequency)
Overall 100 - 16.000 Hz
(±) | linearity of overall sound is average (20.8% difference to median)
Compared to same class
» 55% of all tested devices in this class were better, 10% similar, 35% worse
» The best had a delta of 6%, average was 20%, worst was 57%
Compared to all devices tested
» 56% of all tested devices were better, 8% similar, 36% worse
» The best had a delta of 4%, average was 23%, worst was 134%
Microsoft Surface Pro 6, Core i7, 512 GB audio analysis
(-) | not very loud speakers (69.1 dB)
Bass 100 - 315 Hz
(±) | reduced bass - on average 11.4% lower than median
(±) | linearity of bass is average (10.6% delta to prev. frequency)
Mids 400 - 2000 Hz
(+) | balanced mids - only 4.3% away from median
(±) | linearity of mids is average (10.4% delta to prev. frequency)
Highs 2 - 16 kHz
(±) | higher highs - on average 5.7% higher than median
(±) | linearity of highs is average (8.1% delta to prev. frequency)
Overall 100 - 16.000 Hz
(±) | linearity of overall sound is average (21.4% difference to median)
Compared to same class
» 57% of all tested devices in this class were better, 12% similar, 32% worse
» The best had a delta of 6%, average was 20%, worst was 57%
Compared to all devices tested
» 60% of all tested devices were better, 7% similar, 33% worse
» The best had a delta of 4%, average was 23%, worst was 134%
| Off / Standby | |
| Idle | |
| Load |
|
Key:
min: | |
| Lenovo ThinkPad X1 Tablet G3-20KJ001NGE i5-8250U, UHD Graphics 620, Samsung PM961 MZVLW256HEHP, IPS, 3000x2000, 13" | HP Elite x2 1013 G3-2TT14EA i5-8350U, UHD Graphics 620, Samsung PM961 MZVLW256HEHP, IPS, 3000x2000, 13" | Microsoft Surface Pro 6, Core i7, 512 GB i7-8650U, UHD Graphics 620, Toshiba KBG30ZPZ512G, IPS, 2736x1824, 12.3" | Dell Latitude 5290 2-in-1 i5-8350U, UHD Graphics 620, Toshiba XG5 KXG50ZNV256G, IPS, 1920x1280, 12.3" | Toshiba Portege X30T-E-109 i5-8550U, UHD Graphics 620, Samsung SSD PM981 MZVLB1T0HALR, IPS, 1920x1080, 13.3" | Lenovo ThinkPad X1 Tablet Gen 2 i5-7Y54, HD Graphics 615, Samsung PM961 MZVLW256HEHP, IPS, 2160x1440, 12" | Average Intel UHD Graphics 620 | Average of class Convertible | |
|---|---|---|---|---|---|---|---|---|
| Power Consumption | 11% | 20% | 22% | 5% | 34% | 19% | 7% | |
| Idle Minimum * (Watt) | 4.8 | 4.9 -2% | 3.2 33% | 3 37% | 4.7 2% | 5 -4% | 3.81 ? 21% | 4.2 ? 12% |
| Idle Average * (Watt) | 9 | 8.9 1% | 8.7 3% | 7.2 20% | 9.4 -4% | 6.3 30% | 6.94 ? 23% | 6.89 ? 23% |
| Idle Maximum * (Watt) | 10.5 | 11 -5% | 10.4 1% | 10 5% | 16 -52% | 7.8 26% | 8.75 ? 17% | 8.63 ? 18% |
| Load Average * (Watt) | 42.8 | 32 25% | 29.2 32% | 37.1 13% | 26.4 38% | 19.5 54% | 35 ? 18% | 44.1 ? -3% |
| Load Maximum * (Watt) | 57.8 | 36 38% | 40.8 29% | 38.2 34% | 34 41% | 19.6 66% | 47.5 ? 18% | 66.5 ? -15% |
* ... smaller is better
| Lenovo ThinkPad X1 Tablet G3-20KJ001NGE i5-8250U, UHD Graphics 620, 42 Wh | HP Elite x2 1013 G3-2TT14EA i5-8350U, UHD Graphics 620, 50 Wh | Microsoft Surface Pro 6, Core i7, 512 GB i7-8650U, UHD Graphics 620, 45 Wh | Dell Latitude 5290 2-in-1 i5-8350U, UHD Graphics 620, 42 Wh | Toshiba Portege X30T-E-109 i5-8550U, UHD Graphics 620, Wh | Lenovo ThinkPad X1 Tablet Gen 2 i5-7Y54, HD Graphics 615, 37 Wh | Average of class Convertible | |
|---|---|---|---|---|---|---|---|
| Battery runtime | 14% | 41% | -12% | 39% | 17% | 70% | |
| Reader / Idle (h) | 13.2 | 13 -2% | 18.1 37% | 11 -17% | 26.7 ? 102% | ||
| H.264 (h) | 8.7 | 6.5 -25% | 15 ? 72% | ||||
| WiFi v1.3 (h) | 6.6 | 7.7 17% | 8.5 29% | 5 -24% | 9.2 39% | 7.4 12% | 12 ? 82% |
| Load (h) | 1.4 | 2.3 64% | 2.2 57% | 1.4 0% | 2.2 57% | 1.713 ? 22% |
Pros
Cons
让我们从介绍性问题开始——新的联想ThinkPad X1 Tablet是最好的商务二合一平板吗?这个问题一般无法回答,因为竞品的细节太不相同了,这往往取决于用户计划如何使用该设备。如果需要较长的电池寿命,并且如果设备经常在户外使用,则有更好的选择。其他设备也提供更多不同的端口。如果需要雾面屏,用户也不会对X1平板电脑感到满意。
尽管如此,我们在测试中已经看到,第三代X1平板电脑总体来说是一款非常好的设备。是的,弱点的确存在,但这些不会以同样的方式影响每个用户。如果设备主要与扩展坞一起使用,并且如果平板电脑主要用于通过会议记笔记,那么马马虎虎的电池寿命和缺失的USB-A端口应该不是问题。
让我们谈谈积极的方面:稳定的机身,非常好的输入设备,优秀的键盘,非常好的屏幕(特别是校色后)和带有雷电3的USB-C。随着最新的四核CPU升级,这台二合一平板提供了与普通商用超级本相似的CPU性能水平,尽管这确实意味着风扇声音明显并且负载下的温度相当高。话虽这么说,X1 Tablet的i7选项不知道,在连续负载下比i5慢得多。
“通过完全重新设计的ThinkPad X1平板电脑,联想提供了一台非常好的商务用二合一平板电脑,进一步淡化了平板电脑和典型商务本之间的界限。然而,X1平板电脑并没有提供电池寿命方面的突破,而且可选的i7 CPU没有任何意义。”
在查看我们的评分时,我们发现竞品之间的界限越来越模糊。作为二合一平板,X1 Tablet的得分为89%。如果这款设备被评为办公室笔记本电脑或超极本,它将获得90%的评分,因为这两个类别都更加重视输入设备和接口选择——也就是ThinkPad X1 Tablet所擅长的两个类别。
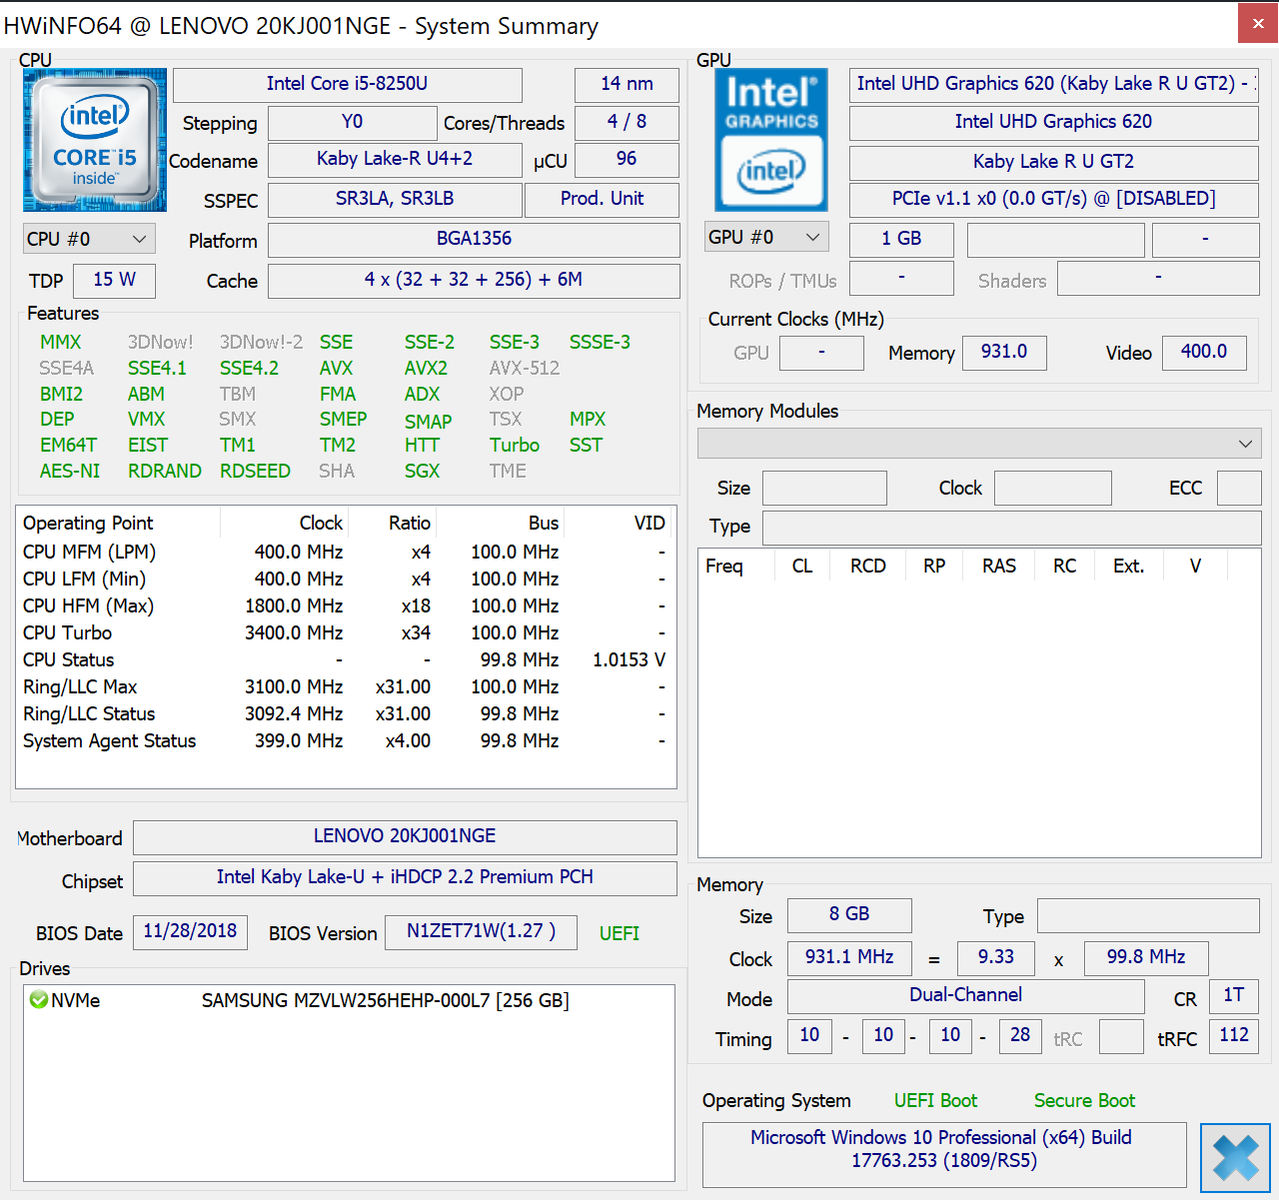
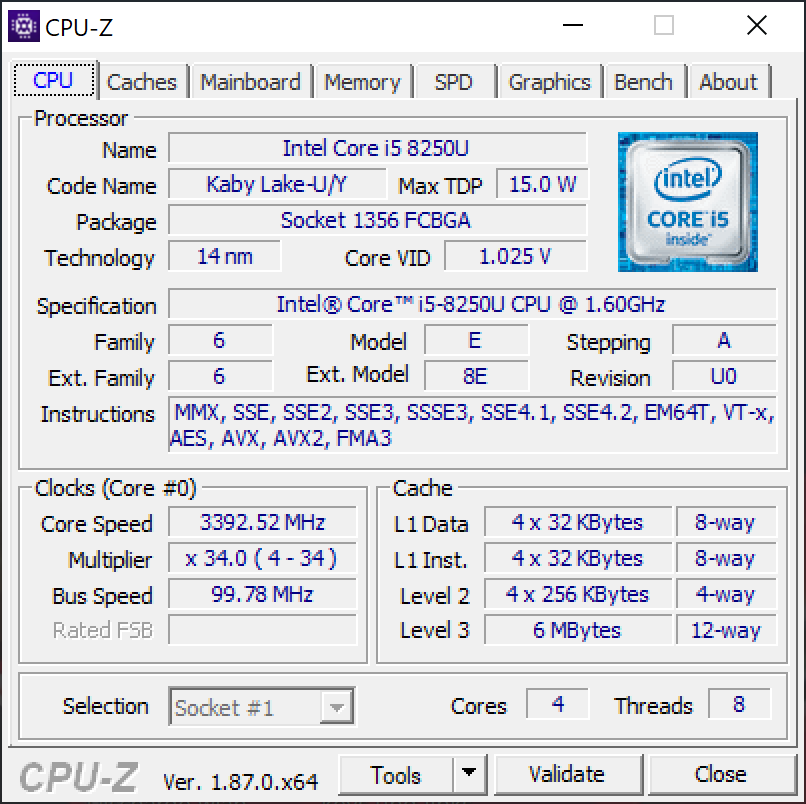
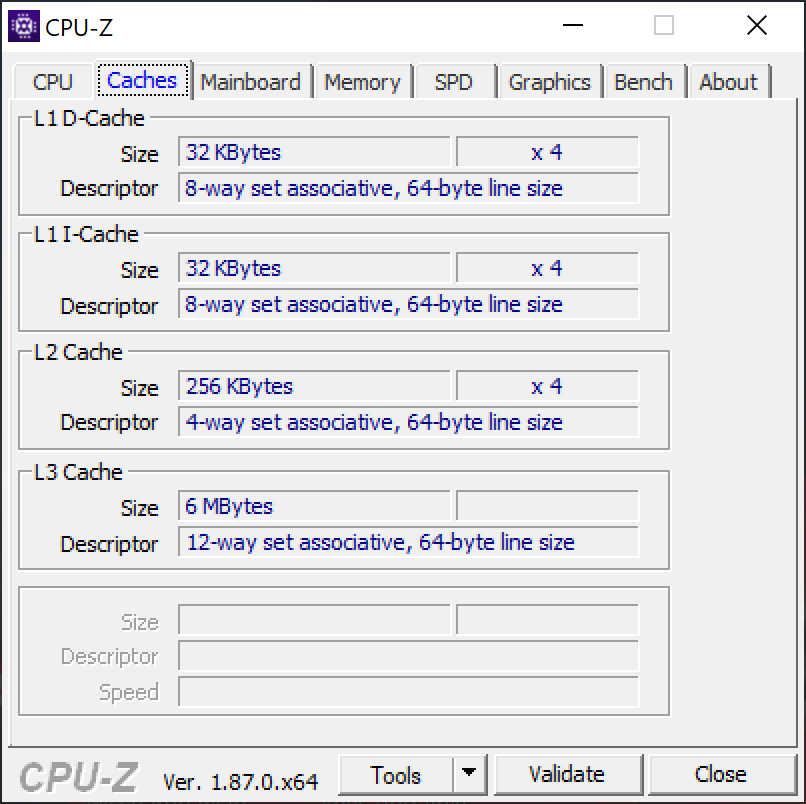
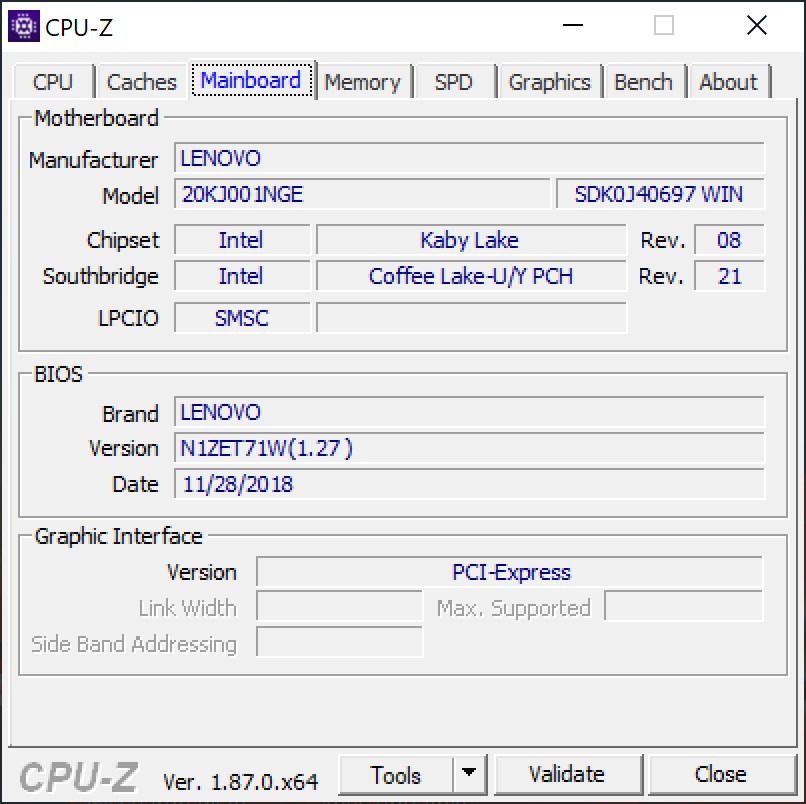
Lenovo ThinkPad X1 Tablet G3-20KJ001NGE
- 10/17/2019 v7 (old)
Andreas Osthoff
Price comparison

