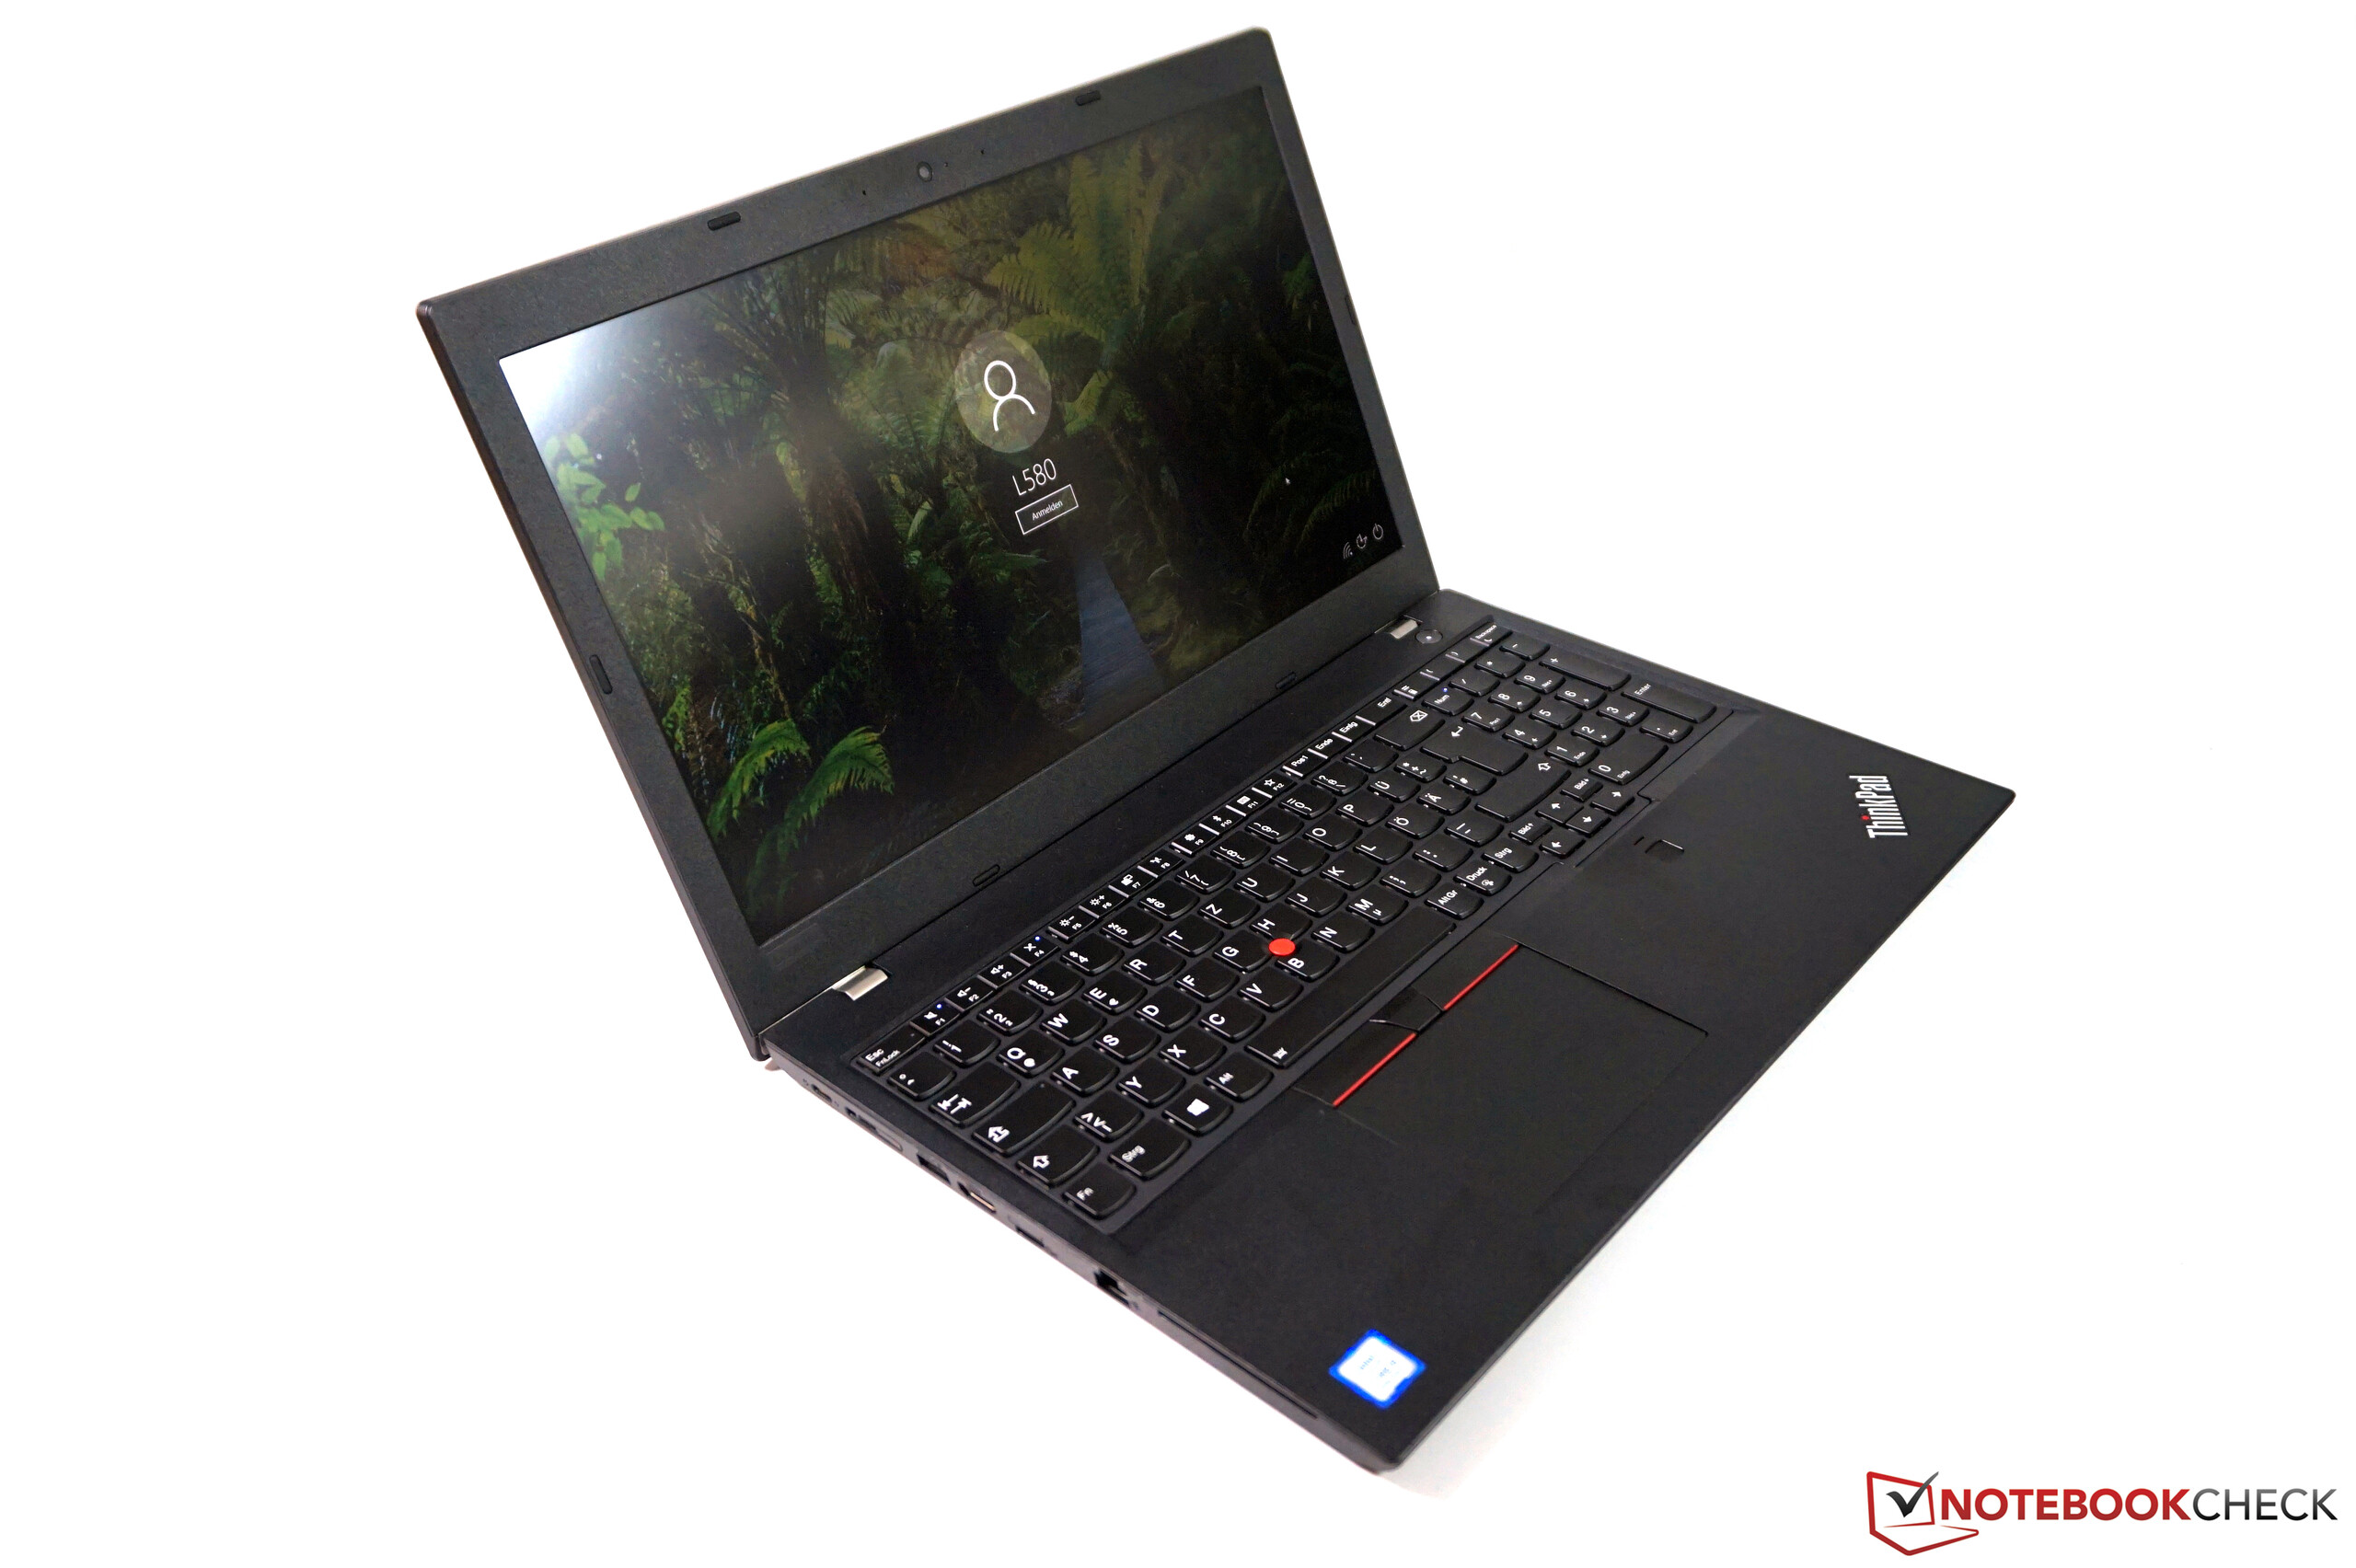
联想ThinkPad L580笔记本电脑评测:可靠的商务本,还有块不错的键盘
| SD Card Reader | |
| average JPG Copy Test (av. of 3 runs) | |
| Lenovo ThinkPad E590-20NC0003GE (Toshiba Exceria Pro M501 64 GB UHS-II) | |
| Lenovo ThinkPad L580-20LW000VGE (Toshiba Exceria Pro M501) | |
| HP ProBook 450 G6-5TJ93EA (Toshiba Exceria Pro SDXC 64 GB UHS-II) | |
| Lenovo Thinkpad L570 20J9S01600 (Toshiba Exceria Pro SDXC 64 GB UHS-II) | |
| Average of class Office (19.8 - 198.5, n=22, last 2 years) | |
| Acer TravelMate P2510-G2-MG-50WE (Toshiba Exceria Pro SDXC 64 GB UHS-II) | |
| maximum AS SSD Seq Read Test (1GB) | |
| Lenovo ThinkPad L580-20LW000VGE (Toshiba Exceria Pro M501) | |
| Lenovo ThinkPad E590-20NC0003GE (Toshiba Exceria Pro M501 64 GB UHS-II) | |
| HP ProBook 450 G6-5TJ93EA (Toshiba Exceria Pro SDXC 64 GB UHS-II) | |
| Average of class Office (27.4 - 249, n=21, last 2 years) | |
| Acer TravelMate P2510-G2-MG-50WE (Toshiba Exceria Pro SDXC 64 GB UHS-II) | |
| Networking | |
| iperf3 transmit AX12 | |
| Lenovo ThinkPad E590-20NC0003GE | |
| HP ProBook 450 G6-5TJ93EA | |
| Lenovo Thinkpad L570 20J9S01600 | |
| Acer TravelMate P2510-G2-MG-50WE | |
| Lenovo ThinkPad L580-20LW000VGE | |
| iperf3 receive AX12 | |
| HP ProBook 450 G6-5TJ93EA | |
| Lenovo ThinkPad L580-20LW000VGE | |
| Lenovo ThinkPad E590-20NC0003GE | |
| Acer TravelMate P2510-G2-MG-50WE | |
| Lenovo Thinkpad L570 20J9S01600 | |
| |||||||||||||||||||||||||
Brightness Distribution: 80 %
Center on Battery: 269 cd/m²
Contrast: 1281:1 (Black: 0.21 cd/m²)
ΔE ColorChecker Calman: 3.9 | ∀{0.5-29.43 Ø4.71}
calibrated: 3.7
ΔE Greyscale Calman: 1.5 | ∀{0.09-98 Ø4.96}
64.3% sRGB (Argyll 1.6.3 3D)
40.8% AdobeRGB 1998 (Argyll 1.6.3 3D)
44.29% AdobeRGB 1998 (Argyll 3D)
64.4% sRGB (Argyll 3D)
42.86% Display P3 (Argyll 3D)
Gamma: 2.21
CCT: 6332 K
| Lenovo ThinkPad L580-20LW000VGE N156HCE-EAA, , 1920x1080, 15.6" | Lenovo Thinkpad L570 20J9S01600 Lenovo LP156WF6-SPK4, , 1920x1080, 15.6" | Lenovo ThinkPad E590-20NC0003GE LP156WFC-SPDB, , 1920x1080, 15.6" | Acer TravelMate P2510-G2-MG-50WE Chi Mei CMN15D3, , 1920x1080, 15.6" | HP ProBook 450 G6-5TJ93EA Chi Mei CMN15FE, , 1920x1080, 15.6" | |
|---|---|---|---|---|---|
| Display | -12% | -11% | -1% | 0% | |
| Display P3 Coverage (%) | 42.86 | 37.68 -12% | 38.21 -11% | 42.27 -1% | 42.83 0% |
| sRGB Coverage (%) | 64.4 | 56.4 -12% | 57.5 -11% | 63.5 -1% | 64.2 0% |
| AdobeRGB 1998 Coverage (%) | 44.29 | 38.97 -12% | 39.47 -11% | 43.69 -1% | 44.29 0% |
| Response Times | 16% | -10% | -18% | 5% | |
| Response Time Grey 50% / Grey 80% * (ms) | 33.6 ? | 43 ? -28% | 40 ? -19% | 40 ? -19% | 34.4 ? -2% |
| Response Time Black / White * (ms) | 27.6 ? | 11 ? 60% | 27.6 ? -0% | 32 ? -16% | 24.4 ? 12% |
| PWM Frequency (Hz) | 24750 ? | 25000 ? | 26040 ? | ||
| Screen | -31% | -17% | 9% | -12% | |
| Brightness middle (cd/m²) | 269 | 276 3% | 254 -6% | 259 -4% | 242 -10% |
| Brightness (cd/m²) | 237 | 252 6% | 251 6% | 230 -3% | 226 -5% |
| Brightness Distribution (%) | 80 | 85 6% | 90 13% | 82 2% | 88 10% |
| Black Level * (cd/m²) | 0.21 | 0.45 -114% | 0.2 5% | 0.19 10% | 0.21 -0% |
| Contrast (:1) | 1281 | 613 -52% | 1270 -1% | 1363 6% | 1152 -10% |
| Colorchecker dE 2000 * | 3.9 | 5.01 -28% | 5.6 -44% | 3.13 20% | 4.7 -21% |
| Colorchecker dE 2000 max. * | 16.3 | 9.71 40% | 15.4 6% | 7.81 52% | 18.5 -13% |
| Colorchecker dE 2000 calibrated * | 3.7 | 4.9 -32% | 3.09 16% | 4 -8% | |
| Greyscale dE 2000 * | 1.5 | 3.69 -146% | 3.1 -107% | 1.42 5% | 2.7 -80% |
| Gamma | 2.21 100% | 2.39 92% | 2.22 99% | 2.36 93% | 2.26 97% |
| CCT | 6332 103% | 7023 93% | 6450 101% | 6391 102% | 6442 101% |
| Color Space (Percent of AdobeRGB 1998) (%) | 40.8 | 36 -12% | 36.3 -11% | 40 -2% | 40.8 0% |
| Color Space (Percent of sRGB) (%) | 64.3 | 56.3 -12% | 57.1 -11% | 63 -2% | 64 0% |
| Total Average (Program / Settings) | -9% /
-21% | -13% /
-15% | -3% /
4% | -2% /
-8% |
* ... smaller is better
Display Response Times
| ↔ Response Time Black to White | ||
|---|---|---|
| 27.6 ms ... rise ↗ and fall ↘ combined | ↗ 15.2 ms rise | 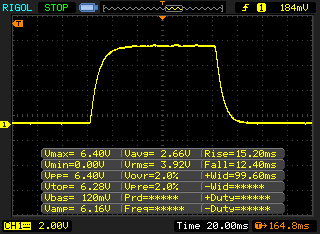 |
| ↘ 12.4 ms fall | ||
| The screen shows relatively slow response rates in our tests and may be too slow for gamers. In comparison, all tested devices range from 0.1 (minimum) to 240 (maximum) ms. » 70 % of all devices are better. This means that the measured response time is worse than the average of all tested devices (19.8 ms). | ||
| ↔ Response Time 50% Grey to 80% Grey | ||
| 33.6 ms ... rise ↗ and fall ↘ combined | ↗ 15.6 ms rise | 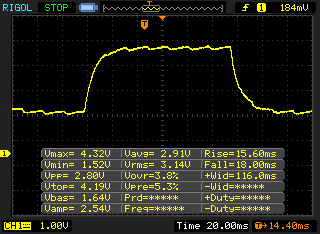 |
| ↘ 18 ms fall | ||
| The screen shows slow response rates in our tests and will be unsatisfactory for gamers. In comparison, all tested devices range from 0.165 (minimum) to 636 (maximum) ms. » 46 % of all devices are better. This means that the measured response time is similar to the average of all tested devices (30.9 ms). | ||
Screen Flickering / PWM (Pulse-Width Modulation)
| Screen flickering / PWM detected | 24750 Hz | ≤ 40 % brightness setting | 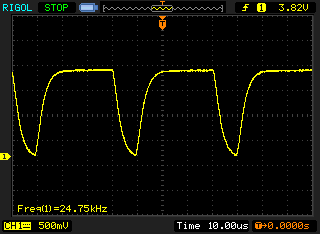 |
The display backlight flickers at 24750 Hz (worst case, e.g., utilizing PWM) Flickering detected at a brightness setting of 40 % and below. There should be no flickering or PWM above this brightness setting. The frequency of 24750 Hz is quite high, so most users sensitive to PWM should not notice any flickering. In comparison: 52 % of all tested devices do not use PWM to dim the display. If PWM was detected, an average of 7744 (minimum: 5 - maximum: 343500) Hz was measured. | |||
| Cinebench R15 | |
| CPU Single 64Bit | |
| Average of class Office (99.5 - 316, n=77, last 2 years) | |
| Lenovo ThinkPad E590-20NC0003GE | |
| Acer TravelMate P2510-G2-MG-50WE | |
| Average Intel Core i5-8250U (81 - 147, n=97) | |
| Lenovo ThinkPad L580-20LW000VGE | |
| HP ProBook 450 G6-5TJ93EA | |
| Lenovo Thinkpad L570 20J9S01600 | |
| CPU Multi 64Bit | |
| Average of class Office (250 - 3380, n=77, last 2 years) | |
| Lenovo ThinkPad L580-20LW000VGE | |
| Average Intel Core i5-8250U (320 - 730, n=101) | |
| HP ProBook 450 G6-5TJ93EA | |
| Lenovo ThinkPad E590-20NC0003GE | |
| Acer TravelMate P2510-G2-MG-50WE | |
| Lenovo Thinkpad L570 20J9S01600 | |
| PCMark 8 | |
| Home Score Accelerated v2 | |
| Average of class Office (n=1last 2 years) | |
| Average Intel Core i5-8250U, Intel UHD Graphics 620 (2986 - 4458, n=69) | |
| Lenovo Thinkpad L570 20J9S01600 | |
| Acer TravelMate P2510-G2-MG-50WE | |
| HP ProBook 450 G6-5TJ93EA | |
| Lenovo ThinkPad L580-20LW000VGE | |
| Lenovo ThinkPad E590-20NC0003GE | |
| Work Score Accelerated v2 | |
| Average of class Office (n=1last 2 years) | |
| HP ProBook 450 G6-5TJ93EA | |
| Acer TravelMate P2510-G2-MG-50WE | |
| Lenovo ThinkPad L580-20LW000VGE | |
| Average Intel Core i5-8250U, Intel UHD Graphics 620 (2699 - 5106, n=58) | |
| Lenovo Thinkpad L570 20J9S01600 | |
| Lenovo ThinkPad E590-20NC0003GE | |
| PCMark 10 - Score | |
| Average of class Office (2601 - 9298, n=68, last 2 years) | |
| HP ProBook 450 G6-5TJ93EA | |
| Lenovo ThinkPad L580-20LW000VGE | |
| Average Intel Core i5-8250U, Intel UHD Graphics 620 (3358 - 4081, n=67) | |
| Lenovo ThinkPad E590-20NC0003GE | |
| PCMark 8 Home Score Accelerated v2 | 3211 points | |
| PCMark 8 Work Score Accelerated v2 | 4653 points | |
| PCMark 10 Score | 3519 points | |
Help | ||

| 3DMark 11 - 1280x720 Performance GPU | |
| Average of class Office (2551 - 18313, n=72, last 2 years) | |
| HP ProBook 450 G6-5TJ93EA | |
| Acer TravelMate P2510-G2-MG-50WE | |
| Lenovo ThinkPad E590-20NC0003GE | |
| Average Intel UHD Graphics 620 (1144 - 3432, n=244) | |
| Lenovo ThinkPad L580-20LW000VGE | |
| Lenovo Thinkpad L570 20J9S01600 | |
| 3DMark | |
| 1280x720 Cloud Gate Standard Graphics | |
| Average of class Office (11640 - 118515, n=38, last 2 years) | |
| HP ProBook 450 G6-5TJ93EA | |
| Acer TravelMate P2510-G2-MG-50WE | |
| Lenovo ThinkPad E590-20NC0003GE | |
| Average Intel UHD Graphics 620 (6205 - 16400, n=225) | |
| Lenovo ThinkPad L580-20LW000VGE | |
| Lenovo Thinkpad L570 20J9S01600 | |
| 1920x1080 Fire Strike Graphics | |
| Average of class Office (736 - 21871, n=75, last 2 years) | |
| HP ProBook 450 G6-5TJ93EA | |
| Acer TravelMate P2510-G2-MG-50WE | |
| Lenovo ThinkPad E590-20NC0003GE | |
| Average Intel UHD Graphics 620 (557 - 2608, n=213) | |
| Lenovo ThinkPad L580-20LW000VGE | |
| Lenovo Thinkpad L570 20J9S01600 | |
| 3DMark 11 Performance | 1816 points | |
| 3DMark Cloud Gate Standard Score | 7733 points | |
| 3DMark Fire Strike Score | 963 points | |
Help | ||
| low | med. | high | ultra | |
|---|---|---|---|---|
| BioShock Infinite (2013) | 46.6 | 27.5 | 23.3 | 7.7 |
Noise level
| Idle |
| 29.9 / 29.9 / 31.6 dB(A) |
| Load |
| 33.1 / 36 dB(A) |
 | ||
30 dB silent 40 dB(A) audible 50 dB(A) loud |
||
min: | ||
| Lenovo ThinkPad L580-20LW000VGE UHD Graphics 620, i5-8250U, Samsung PM961 MZVLW256HEHP | Lenovo Thinkpad L570 20J9S01600 HD Graphics 620, i5-7200U, Samsung PM961 NVMe MZVLW512HMJP | Lenovo ThinkPad E590-20NC0003GE UHD Graphics 620, i7-8565U, Toshiba KBG30ZMT512G | Acer TravelMate P2510-G2-MG-50WE GeForce MX130, i5-8250U, SK Hynix HFS256G39TND-N210A | HP ProBook 450 G6-5TJ93EA GeForce MX130, i7-8565U, Samsung SSD PM981 MZVLB512HAJQ | |
|---|---|---|---|---|---|
| Noise | 2% | 6% | -3% | 1% | |
| off / environment * (dB) | 29.9 | 30.3 -1% | 29.3 2% | 30.3 -1% | 29 3% |
| Idle Minimum * (dB) | 29.9 | 30.3 -1% | 29.3 2% | 30.3 -1% | 29 3% |
| Idle Average * (dB) | 29.9 | 30.3 -1% | 29.3 2% | 30.3 -1% | 29 3% |
| Idle Maximum * (dB) | 31.6 | 30.3 4% | 29.3 7% | 31 2% | 29 8% |
| Load Average * (dB) | 33.1 | 33.2 -0% | 30.6 8% | 35.6 -8% | 34.2 -3% |
| Load Maximum * (dB) | 36 | 33.1 8% | 30.6 15% | 38.6 -7% | 38.4 -7% |
| Witcher 3 ultra * (dB) | 34.2 |
* ... smaller is better
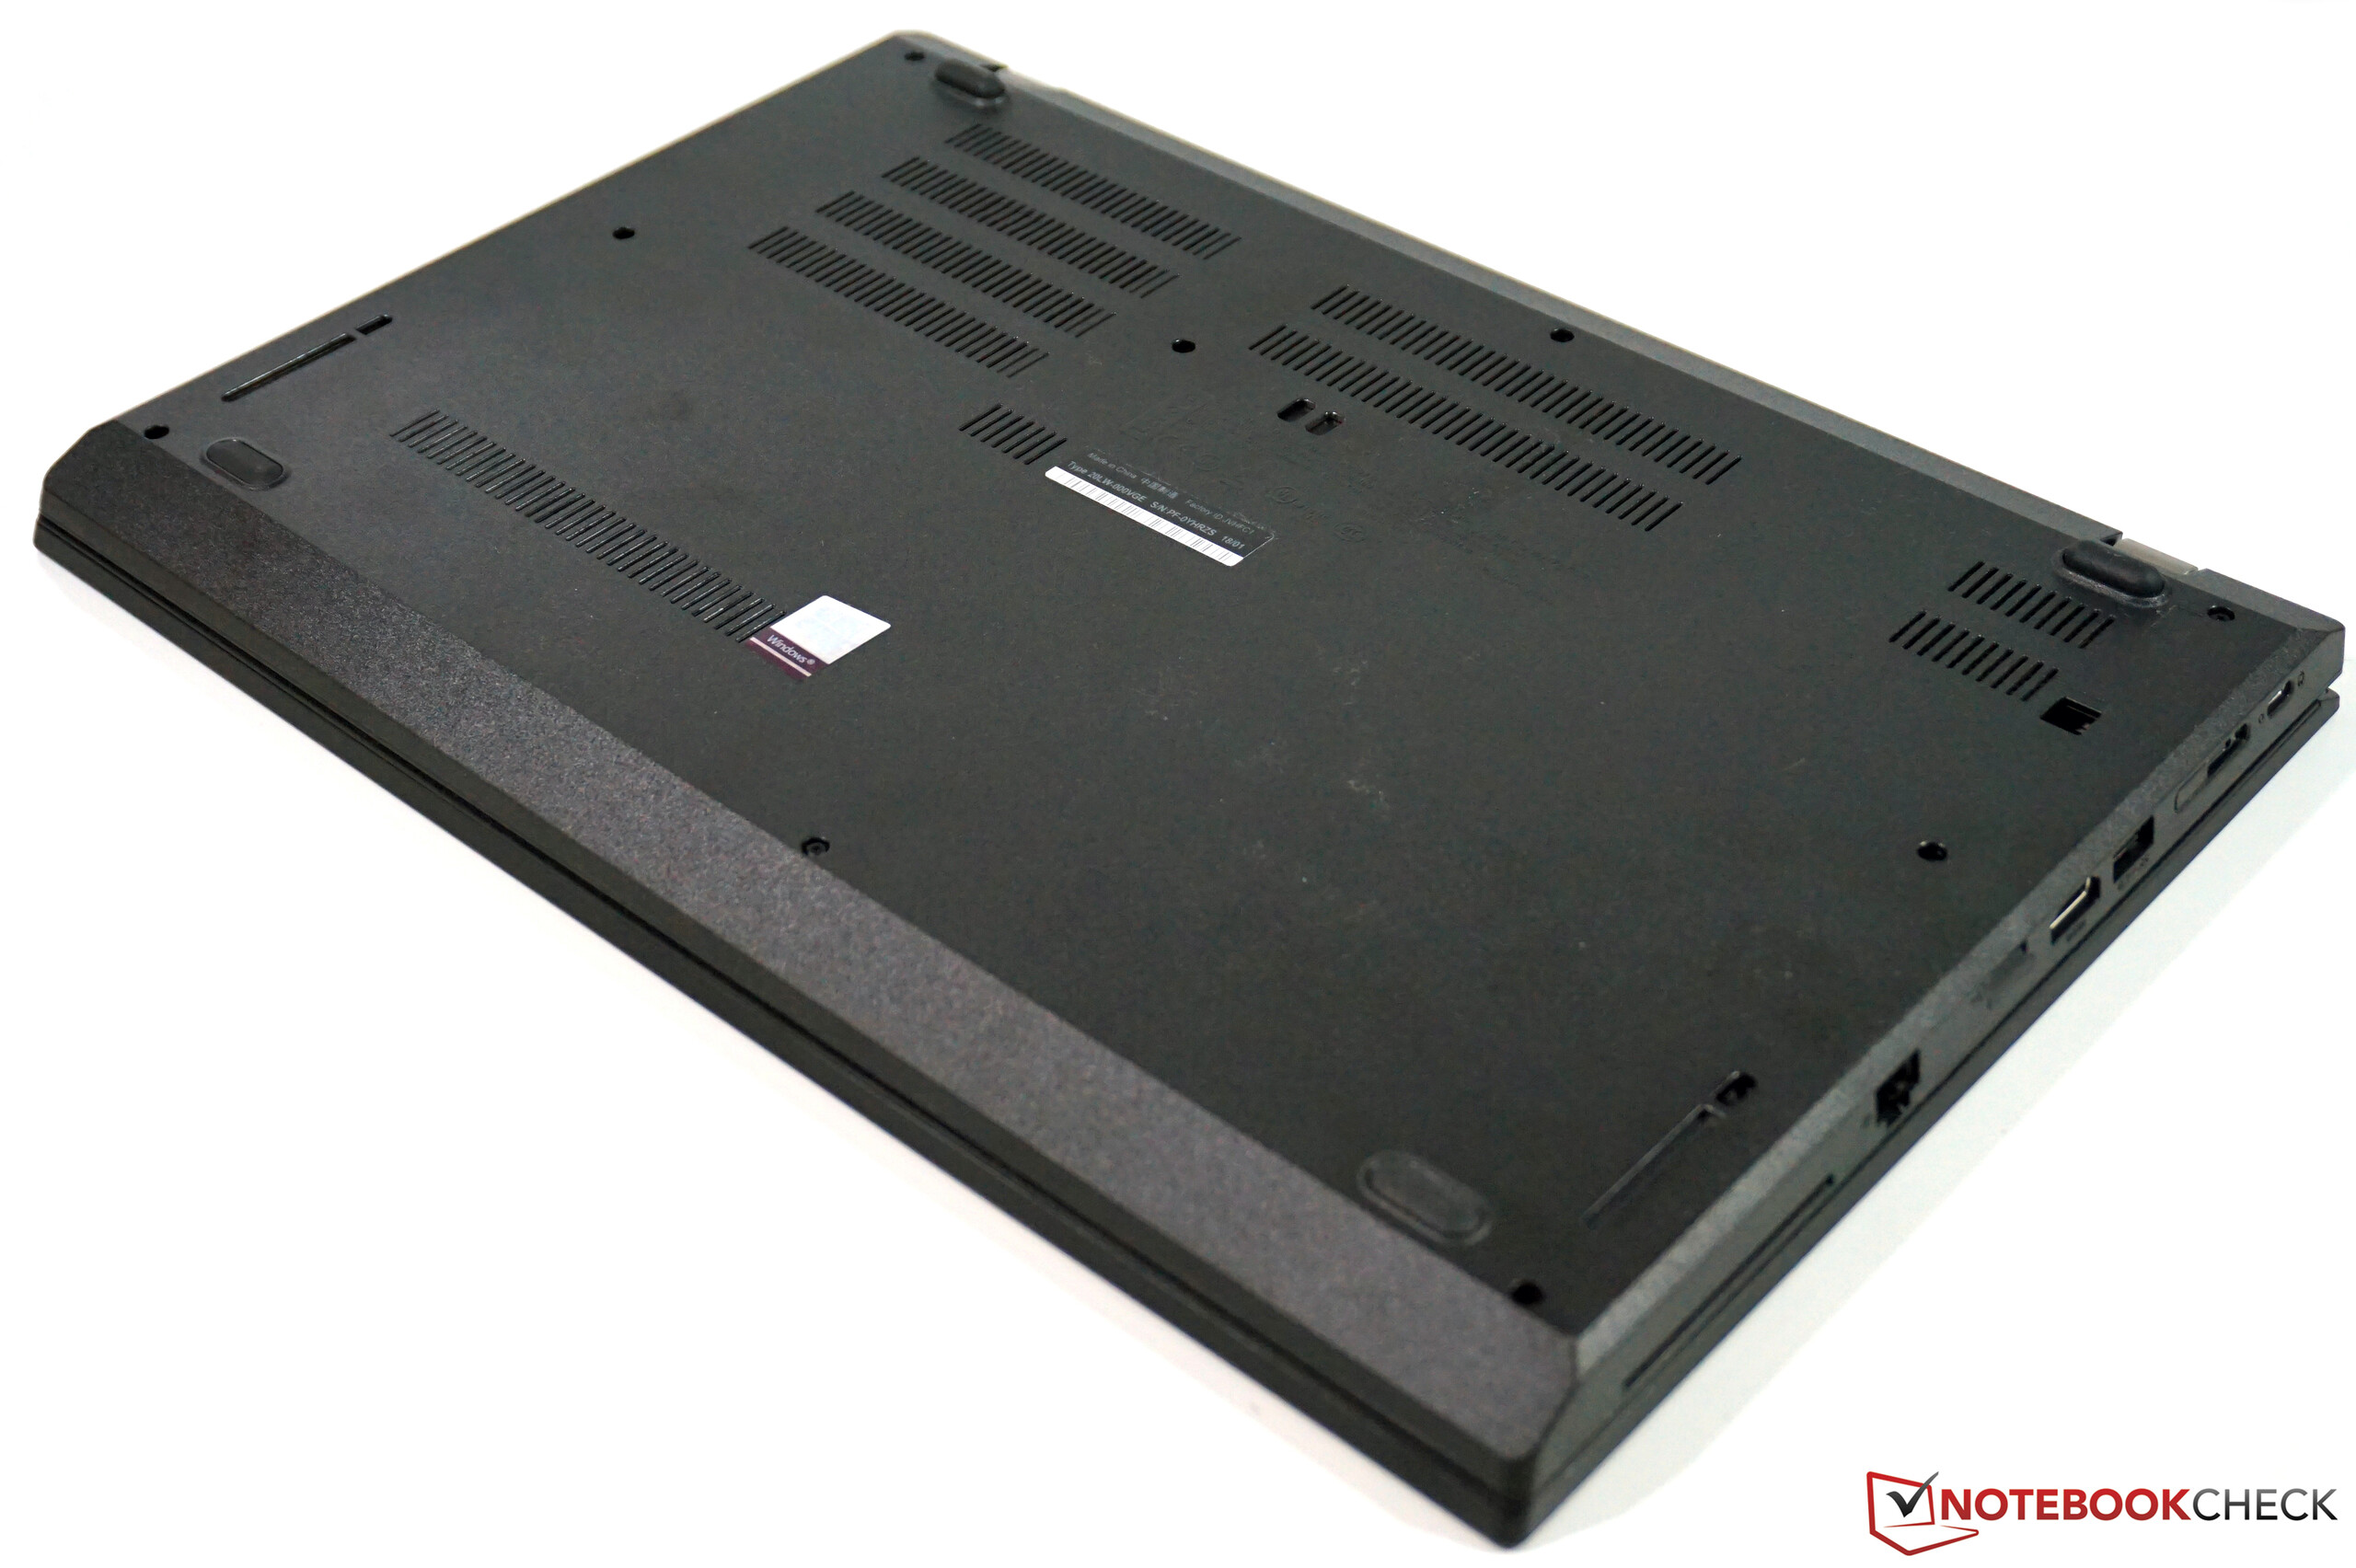
(±) The maximum temperature on the upper side is 43 °C / 109 F, compared to the average of 34.3 °C / 94 F, ranging from 21.2 to 62.5 °C for the class Office.
(-) The bottom heats up to a maximum of 46.2 °C / 115 F, compared to the average of 36.8 °C / 98 F
(+) In idle usage, the average temperature for the upper side is 23.1 °C / 74 F, compared to the device average of 29.5 °C / 85 F.
(+) The palmrests and touchpad are cooler than skin temperature with a maximum of 24.3 °C / 75.7 F and are therefore cool to the touch.
(+) The average temperature of the palmrest area of similar devices was 27.6 °C / 81.7 F (+3.3 °C / 6 F).
Lenovo ThinkPad L580-20LW000VGE audio analysis
(±) | speaker loudness is average but good (78 dB)
Bass 100 - 315 Hz
(-) | nearly no bass - on average 18.5% lower than median
(±) | linearity of bass is average (11.7% delta to prev. frequency)
Mids 400 - 2000 Hz
(+) | balanced mids - only 2.6% away from median
(±) | linearity of mids is average (7.3% delta to prev. frequency)
Highs 2 - 16 kHz
(±) | higher highs - on average 6% higher than median
(±) | linearity of highs is average (10.4% delta to prev. frequency)
Overall 100 - 16.000 Hz
(±) | linearity of overall sound is average (20.3% difference to median)
Compared to same class
» 45% of all tested devices in this class were better, 10% similar, 45% worse
» The best had a delta of 7%, average was 21%, worst was 53%
Compared to all devices tested
» 53% of all tested devices were better, 8% similar, 39% worse
» The best had a delta of 4%, average was 23%, worst was 134%
HP ProBook 450 G6-5TJ93EA audio analysis
(±) | speaker loudness is average but good (74.4 dB)
Bass 100 - 315 Hz
(-) | nearly no bass - on average 21.8% lower than median
(±) | linearity of bass is average (10.6% delta to prev. frequency)
Mids 400 - 2000 Hz
(±) | higher mids - on average 5.6% higher than median
(±) | linearity of mids is average (7.7% delta to prev. frequency)
Highs 2 - 16 kHz
(±) | higher highs - on average 5.1% higher than median
(+) | highs are linear (4.6% delta to prev. frequency)
Overall 100 - 16.000 Hz
(±) | linearity of overall sound is average (27.1% difference to median)
Compared to same class
» 84% of all tested devices in this class were better, 5% similar, 11% worse
» The best had a delta of 7%, average was 21%, worst was 53%
Compared to all devices tested
» 83% of all tested devices were better, 4% similar, 14% worse
» The best had a delta of 4%, average was 23%, worst was 134%
Lenovo ThinkPad E590-20NC0003GE audio analysis
(-) | not very loud speakers (70 dB)
Bass 100 - 315 Hz
(-) | nearly no bass - on average 19.7% lower than median
(±) | linearity of bass is average (13.6% delta to prev. frequency)
Mids 400 - 2000 Hz
(+) | balanced mids - only 4.1% away from median
(+) | mids are linear (6.3% delta to prev. frequency)
Highs 2 - 16 kHz
(+) | balanced highs - only 3.5% away from median
(±) | linearity of highs is average (14.5% delta to prev. frequency)
Overall 100 - 16.000 Hz
(±) | linearity of overall sound is average (24.7% difference to median)
Compared to same class
» 73% of all tested devices in this class were better, 7% similar, 20% worse
» The best had a delta of 7%, average was 21%, worst was 53%
Compared to all devices tested
» 75% of all tested devices were better, 5% similar, 19% worse
» The best had a delta of 4%, average was 23%, worst was 134%
| Off / Standby | |
| Idle | |
| Load |
|
Key:
min: | |
| Lenovo ThinkPad L580-20LW000VGE i5-8250U, UHD Graphics 620, Samsung PM961 MZVLW256HEHP, IPS, 1920x1080, 15.6" | Lenovo Thinkpad L570 20J9S01600 i5-7200U, HD Graphics 620, Samsung PM961 NVMe MZVLW512HMJP, IPS, 1920x1080, 15.6" | Lenovo ThinkPad E590-20NC0003GE i7-8565U, UHD Graphics 620, Toshiba KBG30ZMT512G, IPS LED, 1920x1080, 15.6" | Acer TravelMate P2510-G2-MG-50WE i5-8250U, GeForce MX130, SK Hynix HFS256G39TND-N210A, IPS, 1920x1080, 15.6" | HP ProBook 450 G6-5TJ93EA i7-8565U, GeForce MX130, Samsung SSD PM981 MZVLB512HAJQ, IPS, 1920x1080, 15.6" | |
|---|---|---|---|---|---|
| Power Consumption | 13% | -1% | -9% | -19% | |
| Idle Minimum * (Watt) | 4.4 | 4 9% | 3.72 15% | 3.3 25% | 3.12 29% |
| Idle Average * (Watt) | 7.2 | 7.4 -3% | 7.8 -8% | 5.6 22% | 6.3 12% |
| Idle Maximum * (Watt) | 8.3 | 7.7 7% | 10.32 -24% | 7.8 6% | 9.78 -18% |
| Load Average * (Watt) | 36.4 | 30.6 16% | 30.24 17% | 54 -48% | 57.6 -58% |
| Load Maximum * (Watt) | 42.5 | 28.2 34% | 44 -4% | 63 -48% | 67.3 -58% |
| Witcher 3 ultra * (Watt) | 42 |
* ... smaller is better
| Lenovo ThinkPad L580-20LW000VGE i5-8250U, UHD Graphics 620, 45 Wh | Lenovo Thinkpad L570 20J9S01600 i5-7200U, HD Graphics 620, 48 Wh | Lenovo ThinkPad E590-20NC0003GE i7-8565U, UHD Graphics 620, 45 Wh | Acer TravelMate P2510-G2-MG-50WE i5-8250U, GeForce MX130, 48 Wh | HP ProBook 450 G6-5TJ93EA i7-8565U, GeForce MX130, 45 Wh | Average of class Office | |
|---|---|---|---|---|---|---|
| Battery runtime | ||||||
| WiFi v1.3 (h) | 7.6 | 8.9 17% | 6.4 -16% | 8.4 11% | 9.7 28% | 13.2 ? 74% |
Pros
Cons
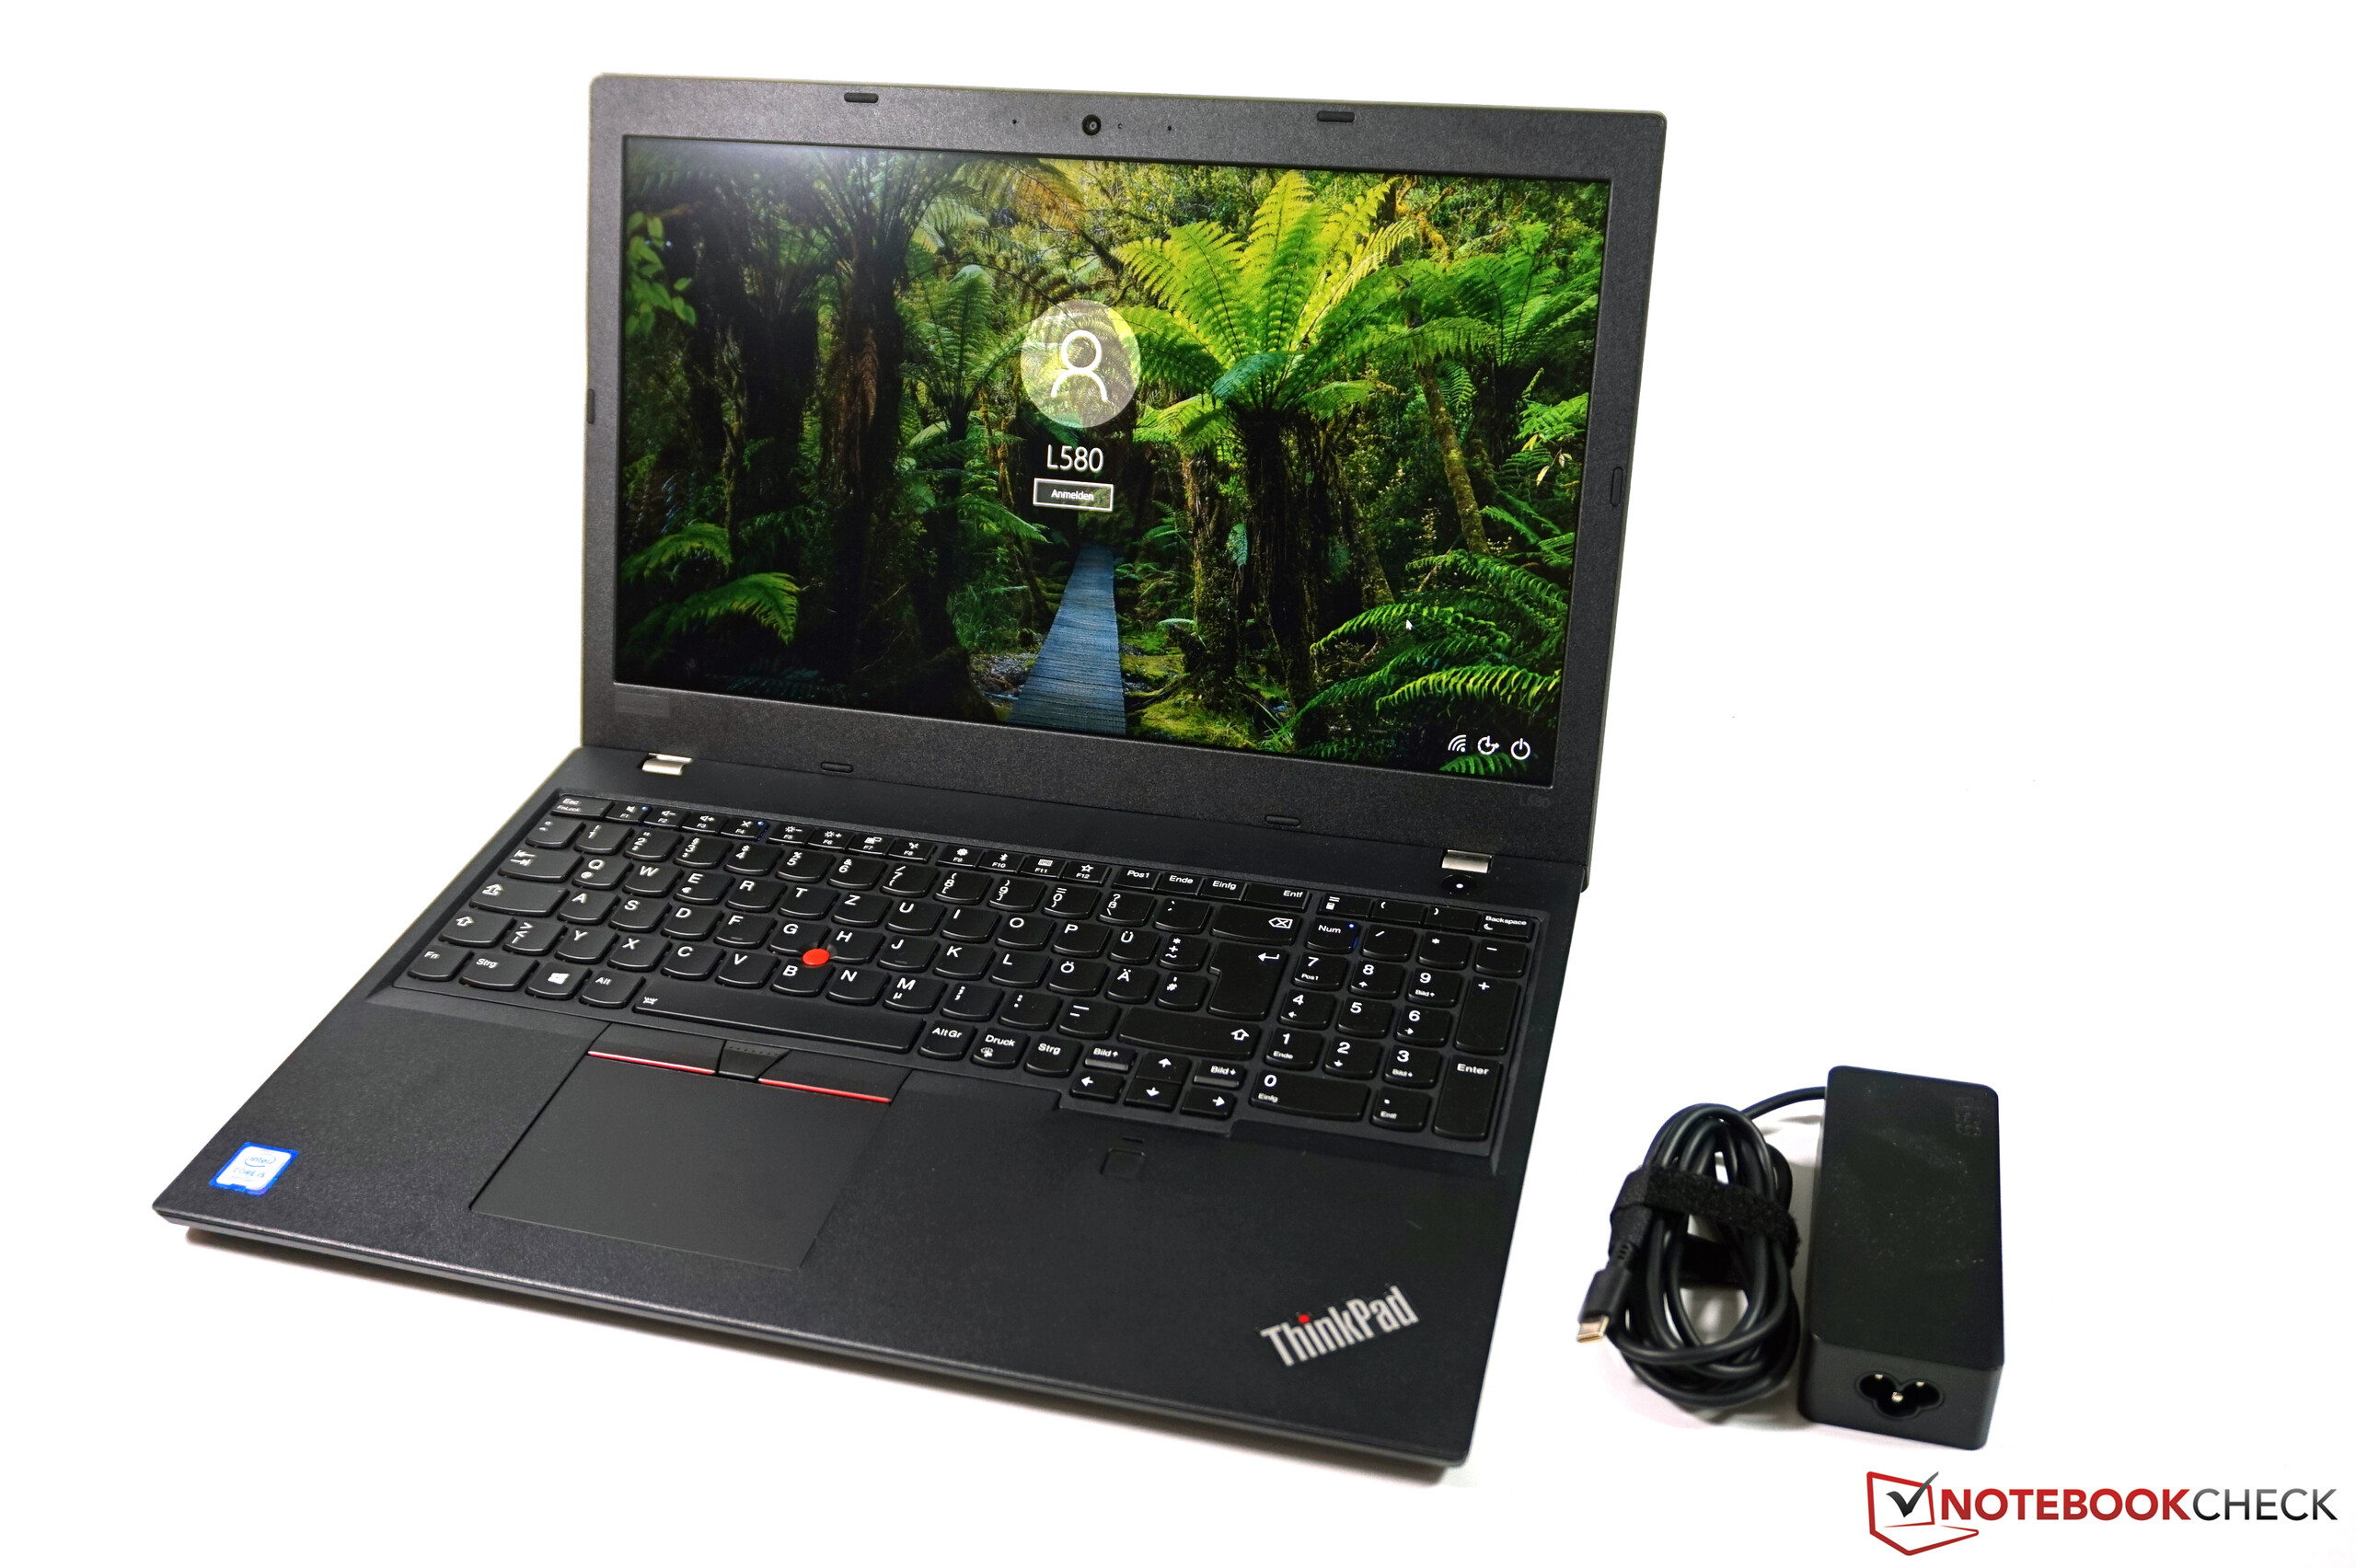
联想=ThinkPad L580是一款坚固耐用的办公本,该笔记本电脑的主要优点是其出色的输入设备。 但是,在其他方面该机器的都只不过维持了该价位级别的平均水平。显示屏也不是特别亮,虽然争对手也是如此。
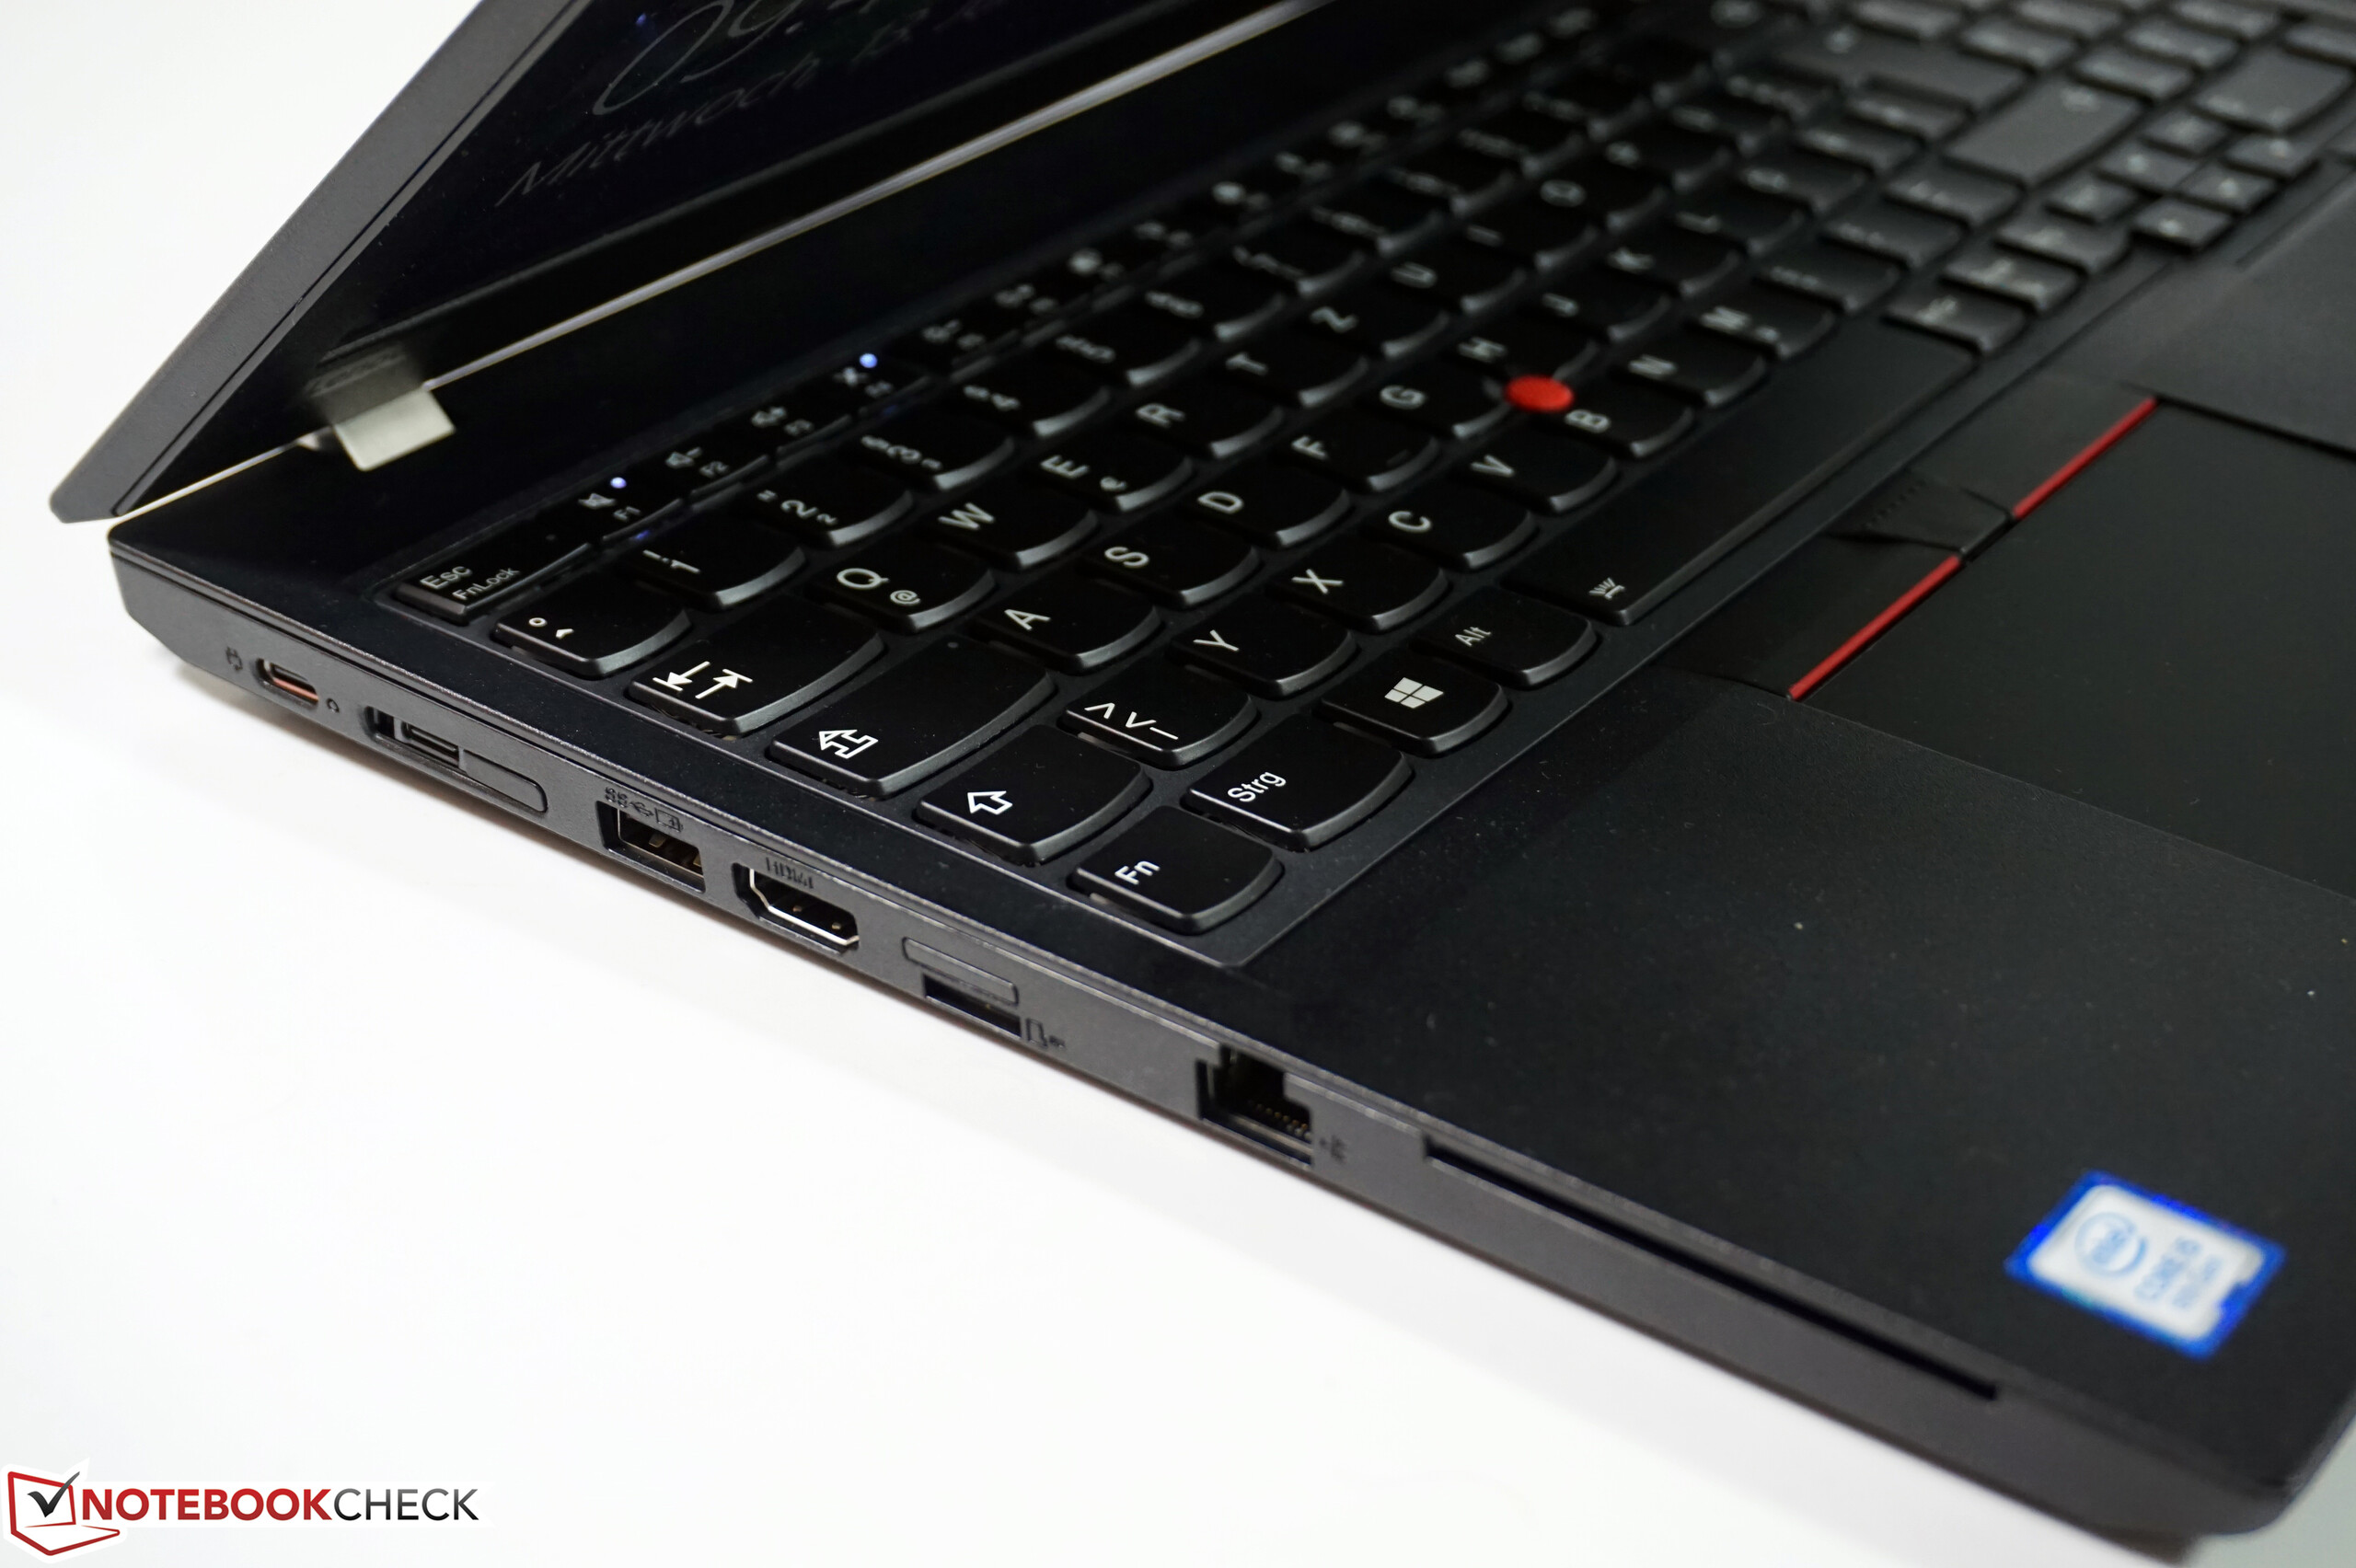
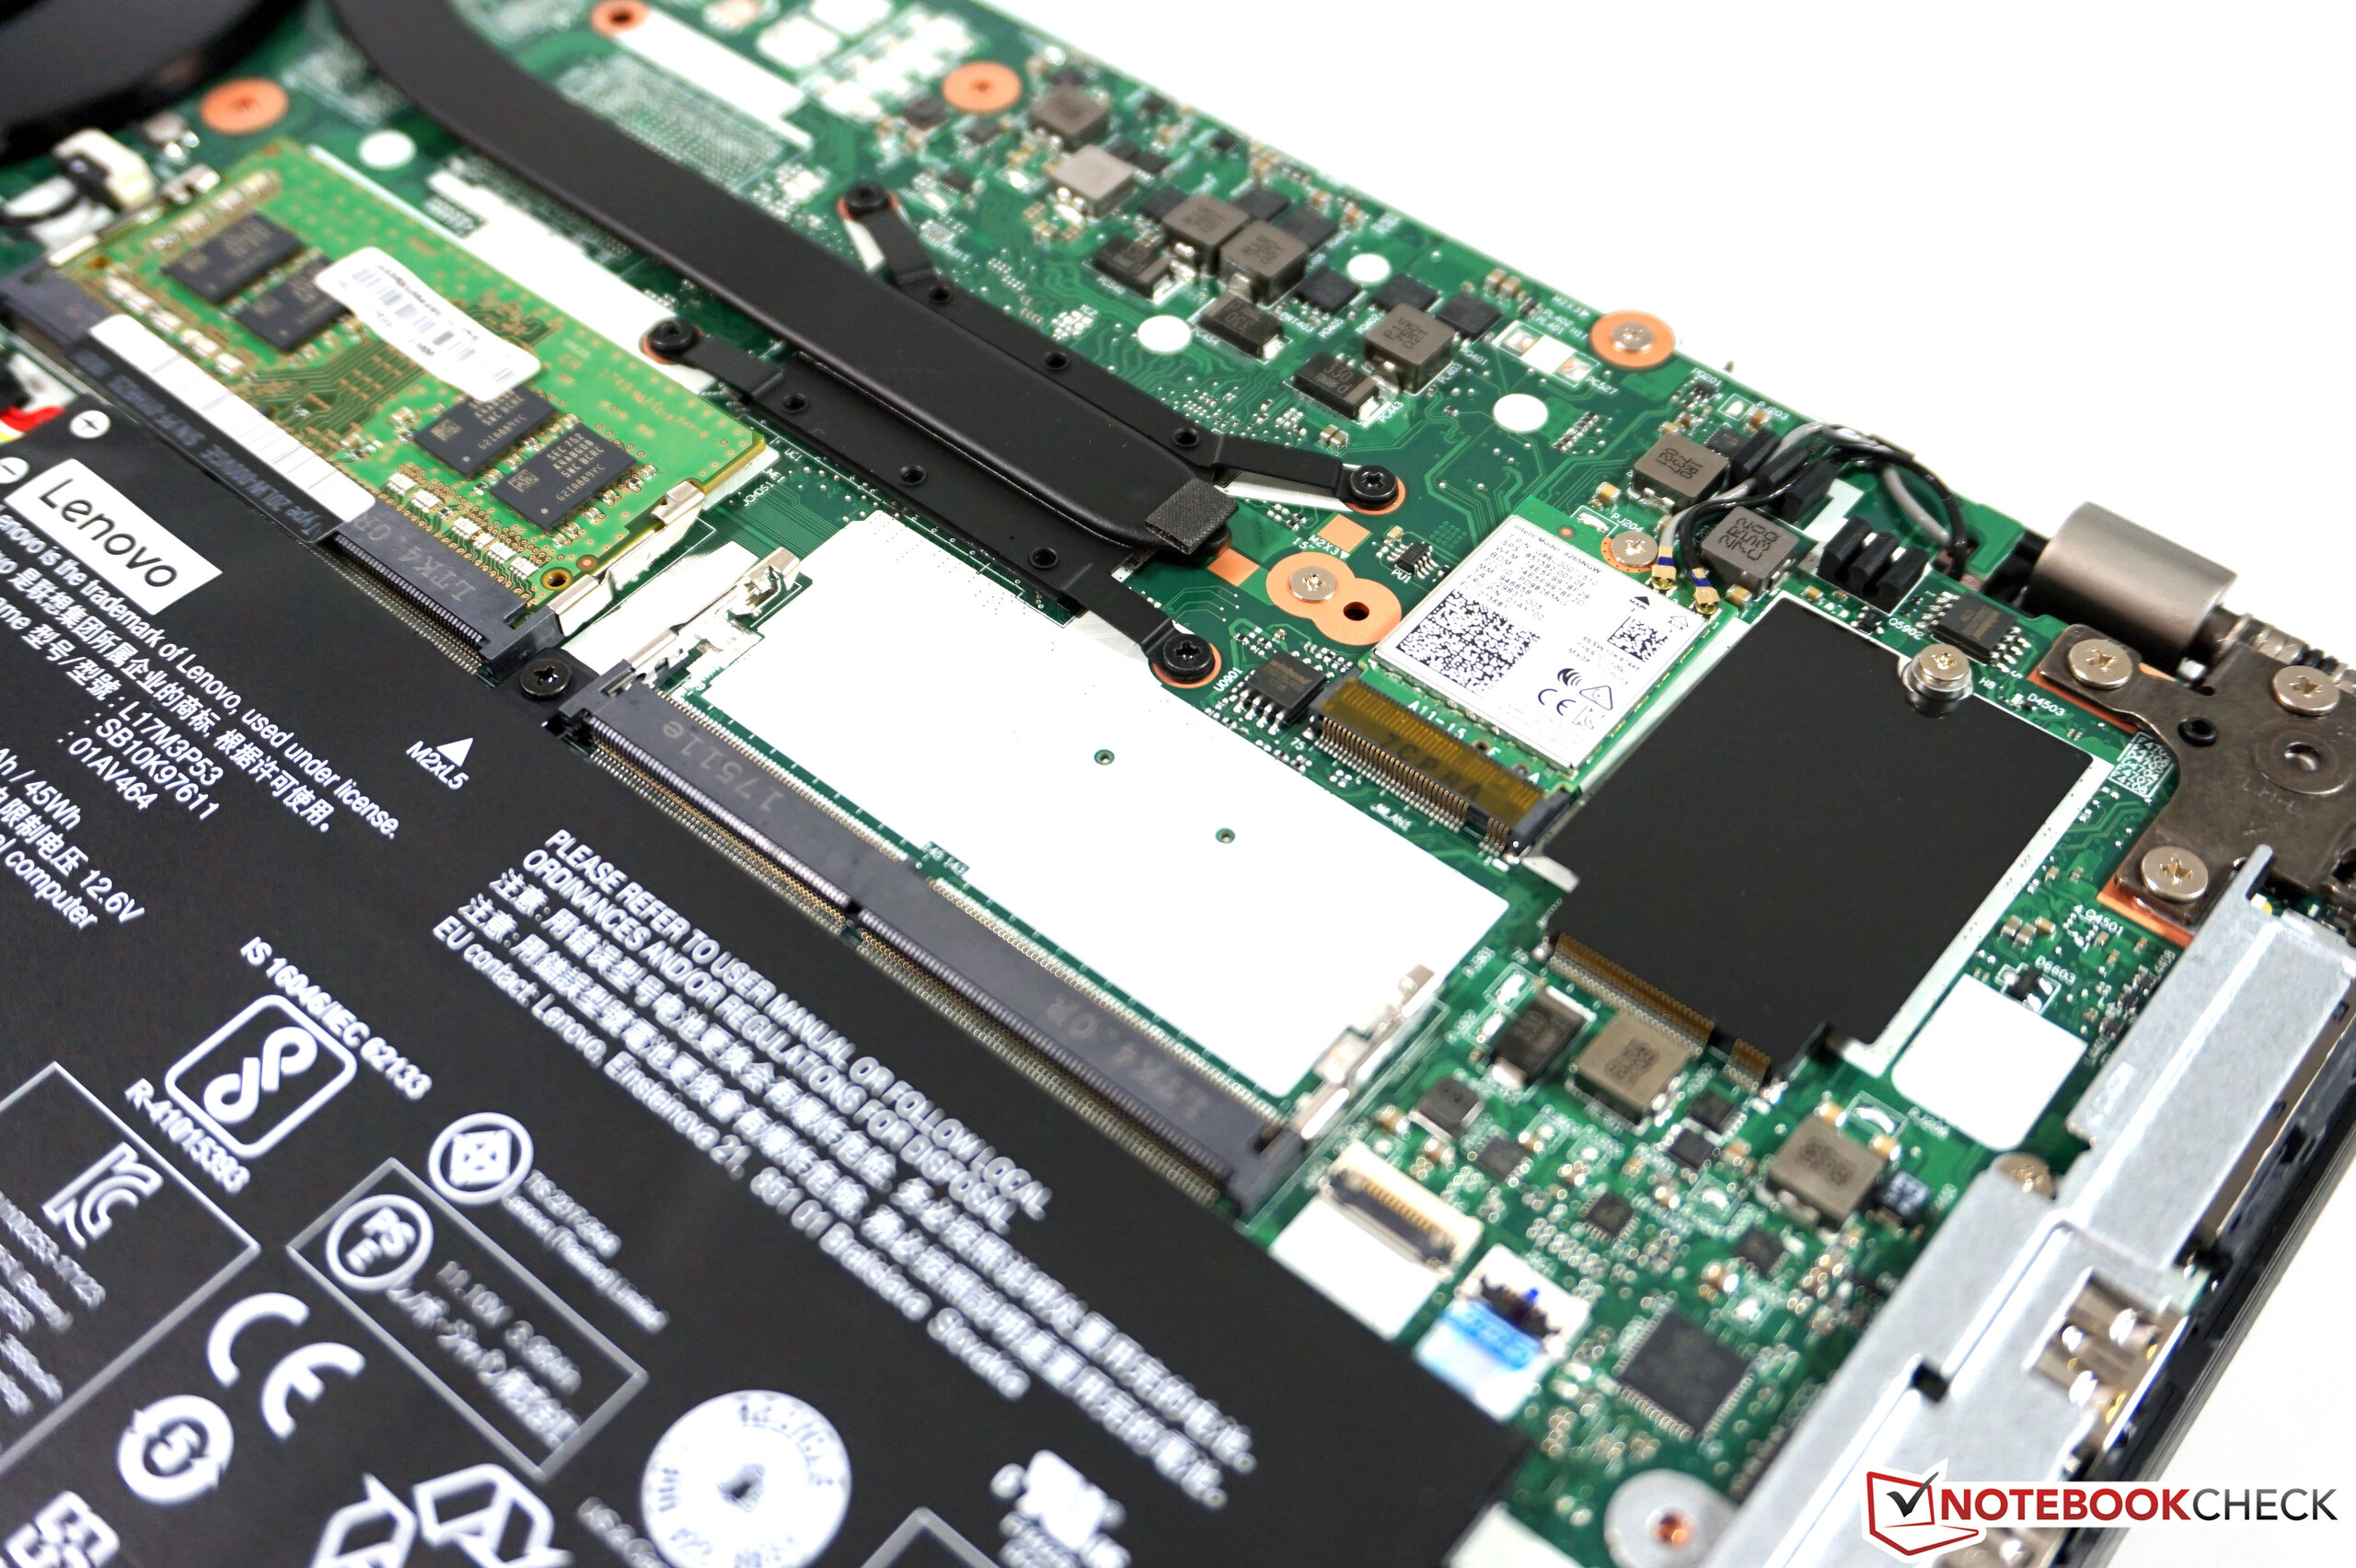
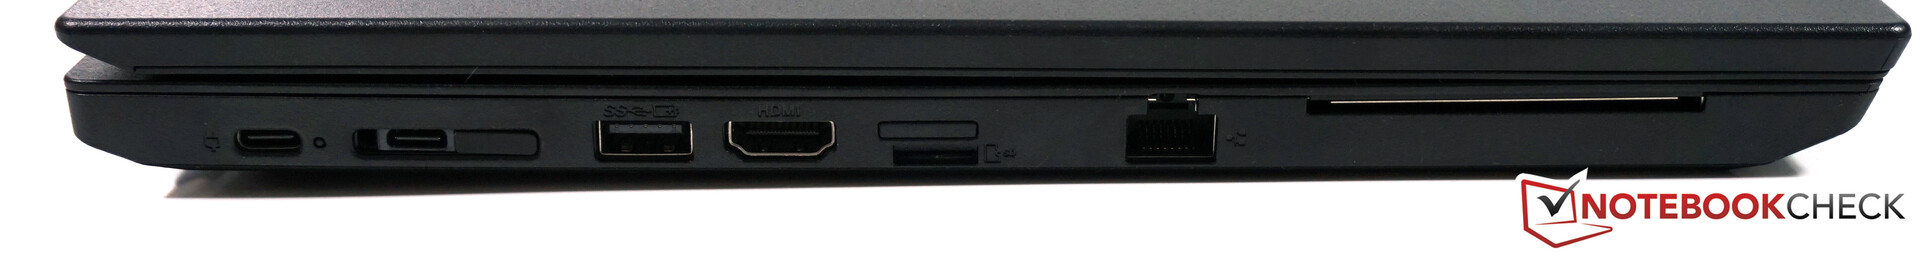
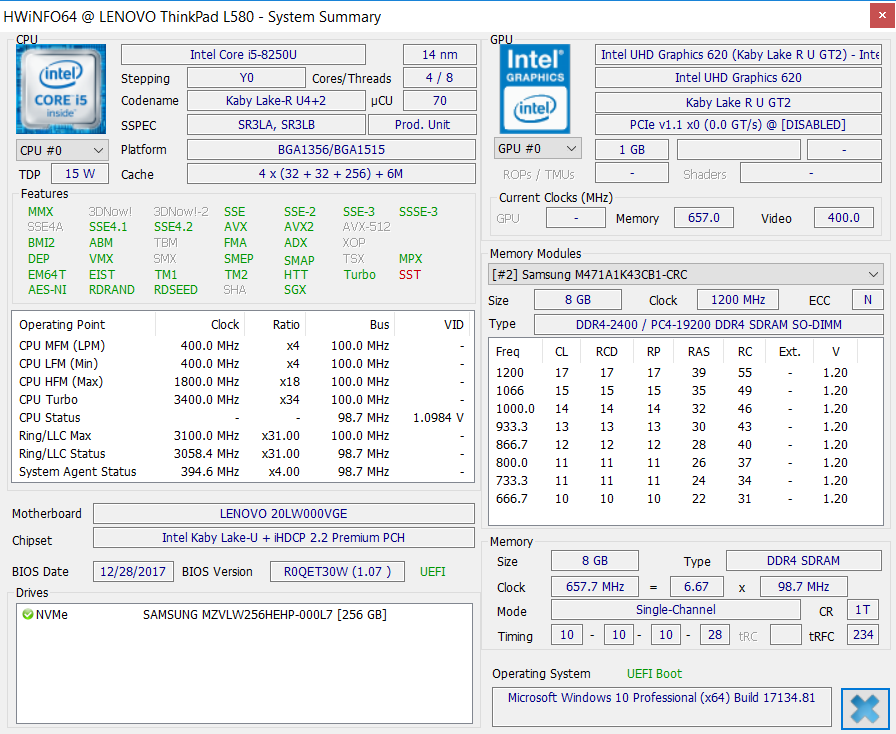
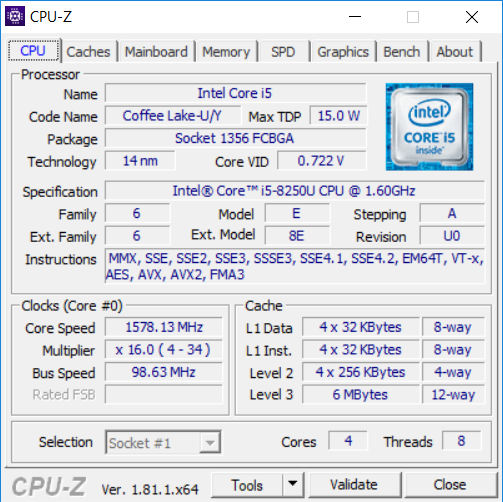
尽管ThinkPad L580无法利用处理器的全部性能,但与其双核前身型号相比,四核笔记本电脑当然能更快且完全足以胜任大多数常规任务。 接口数量足够,风扇的噪音也不会令人讨厌,并且设备不会变得太热。
在办公环境下,ThinkPad L580主要以其出色的键盘而与众不同,并且没有真正的弱点。 总体而言,它是一款不错的办公笔记本。
Lenovo ThinkPad L580-20LW000VGE
- 10/04/2019 v7 (old)
Andreas Osthoff
Price comparison

