华硕TUF FX505DY(Ryzen 5 3550H, Radeon RX 560X)笔记本电脑•评测•
| Networking | |
| iperf3 transmit AX12 | |
| MSI GP63 Leopard 8RE-013US | |
| Asus FX504GD | |
| Asus TUF FX505DY | |
| Lenovo Legion Y530-15ICH | |
| iperf3 receive AX12 | |
| Asus FX504GD | |
| MSI GP63 Leopard 8RE-013US | |
| Asus TUF FX505DY | |
| Lenovo Legion Y530-15ICH | |
| |||||||||||||||||||||||||
Brightness Distribution: 82 %
Center on Battery: 211.5 cd/m²
Contrast: 920:1 (Black: 0.23 cd/m²)
ΔE ColorChecker Calman: 3.92 | ∀{0.5-29.43 Ø4.71}
calibrated: 4.16
ΔE Greyscale Calman: 3.1 | ∀{0.09-98 Ø4.96}
60% sRGB (Argyll 1.6.3 3D)
38.1% AdobeRGB 1998 (Argyll 1.6.3 3D)
41.4% AdobeRGB 1998 (Argyll 3D)
60.2% sRGB (Argyll 3D)
40.04% Display P3 (Argyll 3D)
Gamma: 2.23
CCT: 6578 K
| Asus TUF FX505DY Panda LM156LF-CL03, IPS, 15.6", 1920x1080 | MSI GP63 Leopard 8RE-013US Chi Mei CMN15F4 (N156HHE-GA1 CMN), TN LED, 120 Hz, 15.6", 1920x1080 | Asus FX504GD AU Optronics B156HTN03.8, TN LED, 15.6", 1920x1080 | Lenovo Legion Y530-15ICH LG Display LP156WFG-SPB2, IPS, 15.6", 1920x1080 | Acer Nitro 5 AN515-42-R6V0 AU Optronics B156HAN06.0 (AUO60ED), IPS, 15.6", 1920x1080 | Gigabyte Sabre 15G ID: LGD0533, Name: LG Display LP156WF6-SPK3, IPS, 15.6", 1920x1080 | |
|---|---|---|---|---|---|---|
| Display | 101% | -7% | 55% | 53% | -3% | |
| Display P3 Coverage (%) | 40.04 | 91.5 129% | 37.09 -7% | 62.5 56% | 63.4 58% | 38.97 -3% |
| sRGB Coverage (%) | 60.2 | 100 66% | 55.8 -7% | 93 54% | 87.4 45% | 58.2 -3% |
| AdobeRGB 1998 Coverage (%) | 41.4 | 85.9 107% | 38.34 -7% | 63.8 54% | 64 55% | 40.3 -3% |
| Response Times | 60% | 29% | 66% | -7% | 23% | |
| Response Time Grey 50% / Grey 80% * (ms) | 44.8 ? | 24 ? 46% | 41.6 ? 7% | 15 ? 67% | 48.4 ? -8% | 32 ? 29% |
| Response Time Black / White * (ms) | 30.8 ? | 8.4 ? 73% | 15.2 ? 51% | 11 ? 64% | 32.8 ? -6% | 25.6 ? 17% |
| PWM Frequency (Hz) | 20830 ? | 26040 ? | 20000 ? | |||
| Screen | -5% | -34% | 10% | 19% | -25% | |
| Brightness middle (cd/m²) | 211.5 | 368.5 74% | 260 23% | 305 44% | 299 41% | 248.4 17% |
| Brightness (cd/m²) | 200 | 341 71% | 241 21% | 284 42% | 284 42% | 241 21% |
| Brightness Distribution (%) | 82 | 87 6% | 85 4% | 83 1% | 88 7% | 84 2% |
| Black Level * (cd/m²) | 0.23 | 0.34 -48% | 0.55 -139% | 0.52 -126% | 0.24 -4% | 0.3 -30% |
| Contrast (:1) | 920 | 1084 18% | 473 -49% | 587 -36% | 1246 35% | 828 -10% |
| Colorchecker dE 2000 * | 3.92 | 8.91 -127% | 7 -79% | 3.63 7% | 4.98 -27% | 7.5 -91% |
| Colorchecker dE 2000 max. * | 17.63 | 14.39 18% | 22.52 -28% | 8.18 54% | 7.67 56% | 25.2 -43% |
| Colorchecker dE 2000 calibrated * | 4.16 | 2.87 31% | 5.27 -27% | 1.31 69% | 3.7 11% | |
| Greyscale dE 2000 * | 3.1 | 12 -287% | 6.1 -97% | 4.77 -54% | 4.58 -48% | 6.5 -110% |
| Gamma | 2.23 99% | 1.825 121% | 1.97 112% | 2.54 87% | 2.55 86% | 2.19 100% |
| CCT | 6578 99% | 11519 56% | 7894 82% | 7500 87% | 6397 102% | 7852 83% |
| Color Space (Percent of AdobeRGB 1998) (%) | 38.1 | 85.94 126% | 35.5 -7% | 59 55% | 57 50% | 37 -3% |
| Color Space (Percent of sRGB) (%) | 60 | 99.98 67% | 61 2% | 93 55% | 87 45% | 57.9 -3% |
| Total Average (Program / Settings) | 52% /
23% | -4% /
-21% | 44% /
25% | 22% /
22% | -2% /
-14% |
* ... smaller is better
Display Response Times
| ↔ Response Time Black to White | ||
|---|---|---|
| 30.8 ms ... rise ↗ and fall ↘ combined | ↗ 17.6 ms rise | 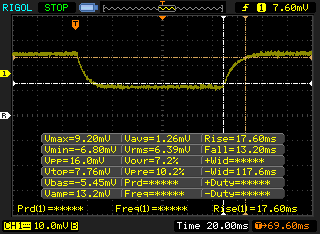 |
| ↘ 13.2 ms fall | ||
| The screen shows slow response rates in our tests and will be unsatisfactory for gamers. In comparison, all tested devices range from 0.1 (minimum) to 240 (maximum) ms. » 83 % of all devices are better. This means that the measured response time is worse than the average of all tested devices (19.8 ms). | ||
| ↔ Response Time 50% Grey to 80% Grey | ||
| 44.8 ms ... rise ↗ and fall ↘ combined | ↗ 18.8 ms rise | 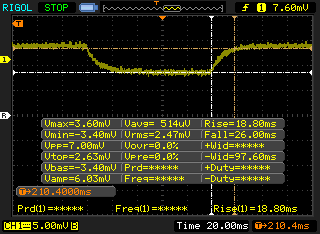 |
| ↘ 26 ms fall | ||
| The screen shows slow response rates in our tests and will be unsatisfactory for gamers. In comparison, all tested devices range from 0.165 (minimum) to 636 (maximum) ms. » 76 % of all devices are better. This means that the measured response time is worse than the average of all tested devices (31 ms). | ||
Screen Flickering / PWM (Pulse-Width Modulation)
| Screen flickering / PWM detected | 20830 Hz | ≤ 30 % brightness setting | 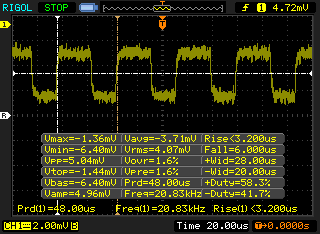 |
The display backlight flickers at 20830 Hz (worst case, e.g., utilizing PWM) Flickering detected at a brightness setting of 30 % and below. There should be no flickering or PWM above this brightness setting. The frequency of 20830 Hz is quite high, so most users sensitive to PWM should not notice any flickering. In comparison: 52 % of all tested devices do not use PWM to dim the display. If PWM was detected, an average of 7754 (minimum: 5 - maximum: 343500) Hz was measured. | |||
| Cinebench R15 | |
| CPU Single 64Bit | |
| Asus ZenBook 15 UX533FD | |
| Dell Precision 7530 | |
| Asus FX504GD | |
| MSI GP63 Leopard 8RE-013US | |
| Gigabyte Sabre 15G | |
| Acer Nitro 5 AN515-42-R6V0 | |
| Lenovo Legion Y520-15IKBA-80WY001VGE | |
| Asus TUF FX505DY | |
| Asus GL702ZC-GC104T | |
| Honor Magicbook | |
| CPU Multi 64Bit | |
| Asus GL702ZC-GC104T | |
| Dell Precision 7530 | |
| MSI GP63 Leopard 8RE-013US | |
| Asus ZenBook 15 UX533FD | |
| Asus TUF FX505DY | |
| Gigabyte Sabre 15G | |
| Acer Nitro 5 AN515-42-R6V0 | |
| Asus FX504GD | |
| Honor Magicbook | |
| Lenovo Legion Y520-15IKBA-80WY001VGE | |
| PCMark 8 Home Score Accelerated v2 | 4560 points | |
| PCMark 8 Work Score Accelerated v2 | 5223 points | |
| PCMark 10 Score | 4405 points | |
Help | ||
| Asus TUF FX505DY WDC PC SN520 SDAPNUW-256G | MSI GP63 Leopard 8RE-013US Samsung PM871b MZNLN128HAHQ | Lenovo Legion Y530-15ICH Samsung SSD PM981 MZVLB256HAHQ | Acer Nitro 5 AN515-42-R6V0 SK Hynix HFS128G39TND | Gigabyte Sabre 15G Liteonit CV3-8D128 | |
|---|---|---|---|---|---|
| AS SSD | -60% | -1% | -119% | -60% | |
| Seq Read (MB/s) | 1059 | 504 -52% | 1808 71% | 470.8 -56% | 516 -51% |
| Seq Write (MB/s) | 1180 | 462.9 -61% | 1429 21% | 126.8 -89% | 479.8 -59% |
| 4K Read (MB/s) | 37.55 | 21.88 -42% | 46.1 23% | 23.64 -37% | 28.3 -25% |
| 4K Write (MB/s) | 110.6 | 60.8 -45% | 97 -12% | 54.5 -51% | 53.8 -51% |
| 4K-64 Read (MB/s) | 619 | 253 -59% | 536 -13% | 203.1 -67% | 257 -58% |
| 4K-64 Write (MB/s) | 502 | 137.8 -73% | 273.6 -45% | 127.1 -75% | 132.2 -74% |
| Access Time Read * (ms) | 0.087 | 0.155 -78% | 0.085 2% | 0.121 -39% | 0.141 -62% |
| Access Time Write * (ms) | 0.034 | 0.072 -112% | 0.038 -12% | 0.269 -691% | 0.073 -115% |
| Score Read (Points) | 762 | 325 -57% | 763 0% | 274 -64% | 337 -56% |
| Score Write (Points) | 730 | 245 -66% | 514 -30% | 194 -73% | 234 -68% |
| Score Total (Points) | 1899 | 742 -61% | 1663 -12% | 600 -68% | 752 -60% |
| Copy ISO MB/s (MB/s) | 1166 | 690 -41% | 446.8 -62% | ||
| Copy Program MB/s (MB/s) | 507 | 328.1 -35% | 195.3 -61% | ||
| Copy Game MB/s (MB/s) | 480.3 | 220.7 -54% | 323.5 -33% |
* ... smaller is better

| 3DMark | |
| 1920x1080 Fire Strike Graphics | |
| Asus Zephyrus S GX531GM | |
| Asus GL702ZC-GC104T | |
| Intel Hades Canyon NUC8i7HVK | |
| Lenovo Legion Y730-15ICH i5-8300H | |
| Schenker XMG P506 | |
| Dell XPS 15 9575 i5-8305G | |
| Asus FX504GD | |
| Asus TUF FX505DY | |
| Acer Nitro 5 AN515-42-R6V0 | |
| Lenovo Legion Y520-15IKBA-80WY001VGE | |
| Asus ZenBook 15 UX533FD | |
| Asus GL552VW-DK725T | |
| Honor Magicbook | |
| 2560x1440 Time Spy Graphics | |
| Asus Zephyrus S GX531GM | |
| Asus GL702ZC-GC104T | |
| Intel Hades Canyon NUC8i7HVK | |
| Asus TUF FX505DY | |
| Asus FX504GD | |
| 3DMark 11 | |
| 1280x720 Performance GPU | |
| Asus GL702ZC-GC104T | |
| Intel Hades Canyon NUC8i7HVK | |
| Asus Zephyrus S GX531GM | |
| Schenker XMG P506 | |
| Dell XPS 15 9575 i5-8305G | |
| Lenovo Legion Y730-15ICH i5-8300H | |
| Acer Nitro 5 AN515-42-R6V0 | |
| Lenovo Legion Y520-15IKBA-80WY001VGE | |
| Asus TUF FX505DY | |
| Asus FX504GD | |
| Asus ZenBook 15 UX533FD | |
| Asus GL552VW-DK725T | |
| Honor Magicbook | |
| 1280x720 Performance Combined | |
| Intel Hades Canyon NUC8i7HVK | |
| Asus GL702ZC-GC104T | |
| Schenker XMG P506 | |
| Lenovo Legion Y730-15ICH i5-8300H | |
| Dell XPS 15 9575 i5-8305G | |
| Asus FX504GD | |
| Asus Zephyrus S GX531GM | |
| Asus ZenBook 15 UX533FD | |
| Asus TUF FX505DY | |
| Lenovo Legion Y520-15IKBA-80WY001VGE | |
| Acer Nitro 5 AN515-42-R6V0 | |
| Asus GL552VW-DK725T | |
| Honor Magicbook | |
| 3DMark 06 Standard Score | 25730 points | |
| 3DMark 11 Performance | 7714 points | |
| 3DMark Ice Storm Standard Score | 57356 points | |
| 3DMark Cloud Gate Standard Score | 18476 points | |
| 3DMark Fire Strike Score | 5515 points | |
| 3DMark Time Spy Score | 1925 points | |
Help | ||
| The Witcher 3 - 1920x1080 Ultra Graphics & Postprocessing (HBAO+) | |
| MSI GP63 Leopard 8RE-013US | |
| Asus GL702ZC-GC104T | |
| Intel Hades Canyon NUC8i7HVK | |
| Asus ZenBook 15 UX533FD | |
| Lenovo Legion Y730-15ICH i5-8300H | |
| Schenker XMG P506 | |
| Dell XPS 15 9575 i5-8305G | |
| Asus TUF FX505DY | |
| Asus FX504GD | |
| Lenovo Legion Y520-15IKBA-80WY001VGE | |
| Acer Nitro 5 AN515-42-R6V0 | |
| Asus GL552VW-DK725T | |
| low | med. | high | ultra | |
|---|---|---|---|---|
| BioShock Infinite (2013) | 134.3 | 118 | 114 | 53.1 |
| The Witcher 3 (2015) | 108.8 | 70.3 | 38.5 | 22.7 |
| Rise of the Tomb Raider (2016) | 108.6 | 65.7 | 35.3 | 26.6 |
| Asus TUF FX505DY Radeon RX 560X (Laptop), R5 3550H, WDC PC SN520 SDAPNUW-256G | MSI GP63 Leopard 8RE-013US GeForce GTX 1060 Mobile, i7-8750H, Samsung PM871b MZNLN128HAHQ | Asus FX504GD GeForce GTX 1050 Mobile, i5-8300H, Seagate Mobile HDD 1TB ST1000LX015-1U7172 | Lenovo Legion Y530-15ICH GeForce GTX 1060 Mobile, i7-8750H, Samsung SSD PM981 MZVLB256HAHQ | Acer Nitro 5 AN515-42-R6V0 Radeon RX 560X (Laptop), R7 2700U, SK Hynix HFS128G39TND | Gigabyte Sabre 15G GeForce GTX 1050 Mobile, i7-7700HQ, Liteonit CV3-8D128 | |
|---|---|---|---|---|---|---|
| Noise | -6% | 1% | -2% | 1% | -9% | |
| off / environment * (dB) | 28.2 | 28.4 -1% | 28.1 -0% | 30.2 -7% | 29 -3% | 28.2 -0% |
| Idle Minimum * (dB) | 28.2 | 32.8 -16% | 29 -3% | 30.9 -10% | 29 -3% | 33 -17% |
| Idle Average * (dB) | 28.2 | 32.8 -16% | 29.2 -4% | 30.9 -10% | 31 -10% | 33.3 -18% |
| Idle Maximum * (dB) | 28.2 | 33 -17% | 29.7 -5% | 31.6 -12% | 32 -13% | 34.7 -23% |
| Load Average * (dB) | 43.9 | 35.8 18% | 44.3 -1% | 42.3 4% | 36 18% | 44.5 -1% |
| Witcher 3 ultra * (dB) | 49 | 51 -4% | 40.7 17% | 44 10% | 49.2 -0% | |
| Load Maximum * (dB) | 50.6 | 52.3 -3% | 47.7 6% | 40 21% | 46 9% | 52.8 -4% |
* ... smaller is better
Noise level
| Idle |
| 28.2 / 28.2 / 28.2 dB(A) |
| Load |
| 43.9 / 50.6 dB(A) |
 | ||
30 dB silent 40 dB(A) audible 50 dB(A) loud |
||
min: | ||
(±) The maximum temperature on the upper side is 44.2 °C / 112 F, compared to the average of 40.4 °C / 105 F, ranging from 21.2 to 68.8 °C for the class Gaming.
(-) The bottom heats up to a maximum of 49.4 °C / 121 F, compared to the average of 43.2 °C / 110 F
(+) In idle usage, the average temperature for the upper side is 24.2 °C / 76 F, compared to the device average of 33.9 °C / 93 F.
(+) Playing The Witcher 3, the average temperature for the upper side is 28.4 °C / 83 F, compared to the device average of 33.9 °C / 93 F.
(+) The palmrests and touchpad are cooler than skin temperature with a maximum of 27.4 °C / 81.3 F and are therefore cool to the touch.
(±) The average temperature of the palmrest area of similar devices was 28.8 °C / 83.8 F (+1.4 °C / 2.5 F).
Asus TUF FX505DY audio analysis
(±) | speaker loudness is average but good (74.2 dB)
Bass 100 - 315 Hz
(-) | nearly no bass - on average 19.4% lower than median
(±) | linearity of bass is average (9.9% delta to prev. frequency)
Mids 400 - 2000 Hz
(±) | higher mids - on average 7% higher than median
(±) | linearity of mids is average (8.3% delta to prev. frequency)
Highs 2 - 16 kHz
(±) | higher highs - on average 6.3% higher than median
(±) | linearity of highs is average (7.6% delta to prev. frequency)
Overall 100 - 16.000 Hz
(-) | overall sound is not linear (31.6% difference to median)
Compared to same class
» 97% of all tested devices in this class were better, 1% similar, 2% worse
» The best had a delta of 6%, average was 18%, worst was 132%
Compared to all devices tested
» 91% of all tested devices were better, 2% similar, 8% worse
» The best had a delta of 4%, average was 23%, worst was 134%
Apple MacBook 12 (Early 2016) 1.1 GHz audio analysis
(+) | speakers can play relatively loud (83.6 dB)
Bass 100 - 315 Hz
(±) | reduced bass - on average 11.3% lower than median
(±) | linearity of bass is average (14.2% delta to prev. frequency)
Mids 400 - 2000 Hz
(+) | balanced mids - only 2.4% away from median
(+) | mids are linear (5.5% delta to prev. frequency)
Highs 2 - 16 kHz
(+) | balanced highs - only 2% away from median
(+) | highs are linear (4.5% delta to prev. frequency)
Overall 100 - 16.000 Hz
(+) | overall sound is linear (10.2% difference to median)
Compared to same class
» 7% of all tested devices in this class were better, 2% similar, 90% worse
» The best had a delta of 5%, average was 18%, worst was 53%
Compared to all devices tested
» 5% of all tested devices were better, 1% similar, 94% worse
» The best had a delta of 4%, average was 23%, worst was 134%
| Off / Standby | |
| Idle | |
| Load |
|
Key:
min: | |
| Asus TUF FX505DY R5 3550H, Radeon RX 560X (Laptop), WDC PC SN520 SDAPNUW-256G, IPS, 1920x1080, 15.6" | MSI GP63 Leopard 8RE-013US i7-8750H, GeForce GTX 1060 Mobile, Samsung PM871b MZNLN128HAHQ, TN LED, 120 Hz, 1920x1080, 15.6" | Asus FX504GD i5-8300H, GeForce GTX 1050 Mobile, Seagate Mobile HDD 1TB ST1000LX015-1U7172, TN LED, 1920x1080, 15.6" | Lenovo Legion Y530-15ICH i7-8750H, GeForce GTX 1060 Mobile, Samsung SSD PM981 MZVLB256HAHQ, IPS, 1920x1080, 15.6" | Acer Nitro 5 AN515-42-R6V0 R7 2700U, Radeon RX 560X (Laptop), SK Hynix HFS128G39TND, IPS, 1920x1080, 15.6" | Gigabyte Sabre 15G i7-7700HQ, GeForce GTX 1050 Mobile, Liteonit CV3-8D128, IPS, 1920x1080, 15.6" | |
|---|---|---|---|---|---|---|
| Power Consumption | -52% | -18% | -42% | -30% | -19% | |
| Idle Minimum * (Watt) | 5.2 | 7.99 -54% | 7.2 -38% | 7.3 -40% | 7 -35% | 8 -54% |
| Idle Average * (Watt) | 7.5 | 12.15 -62% | 10.2 -36% | 11.1 -48% | 10 -33% | 10.9 -45% |
| Idle Maximum * (Watt) | 9.4 | 13.4 -43% | 10.9 -16% | 12.6 -34% | 18 -91% | 11 -17% |
| Load Average * (Watt) | 73 | 103.62 -42% | 93.3 -28% | 109 -49% | 79 -8% | 76.7 -5% |
| Witcher 3 ultra * (Watt) | 90 | 156.1 -73% | 95.8 -6% | 98 -9% | 94.9 -5% | |
| Load Maximum * (Watt) | 120.7 | 164.29 -36% | 102.5 15% | 168 -39% | 128 -6% | 106.4 12% |
* ... smaller is better
| Asus TUF FX505DY R5 3550H, Radeon RX 560X (Laptop), 48 Wh | MSI GP63 Leopard 8RE-013US i7-8750H, GeForce GTX 1060 Mobile, 51 Wh | Asus FX504GD i5-8300H, GeForce GTX 1050 Mobile, 48 Wh | Lenovo Legion Y530-15ICH i7-8750H, GeForce GTX 1060 Mobile, 52 Wh | Acer Nitro 5 AN515-42-R6V0 R7 2700U, Radeon RX 560X (Laptop), 48 Wh | Gigabyte Sabre 15G i7-7700HQ, GeForce GTX 1050 Mobile, 47 Wh | |
|---|---|---|---|---|---|---|
| Battery runtime | -24% | -30% | -37% | 4% | -15% | |
| Reader / Idle (h) | 8.7 | 7.5 -14% | 7.5 -14% | 8.3 -5% | 8.2 -6% | |
| WiFi v1.3 (h) | 5.5 | 4.8 -13% | 3.7 -33% | 3.8 -31% | 5.7 4% | 4.4 -20% |
| Load (h) | 1.6 | 0.9 -44% | 0.9 -44% | 0.4 -75% | 1.3 -19% |
Pros
Cons
TUF FX505DY是我们测试过的最平衡的AMD游戏笔记本电脑。Strix GL702ZC配备了高端CPU与中档GPU,而FX550IU配备了低端CPU和中档GPU,但FX505DY成功地将中档Ryzen 5 3550H与中档Radeon RX 560X结合在一起,打造了一台廉价的1080p游戏本。其整体性能与英特尔酷睿i5-8300H和GeForce GTX 1050组合的游戏笔记本电脑相当,但价格更低,这正是AMD和华硕对于这款新TUF笔记本的目标。
这台电脑的主要问题是时机问题。配备GTX 1050甚至1050 Ti GPU的笔记本电脑价格一直在下降,以为RTX笔记本电脑腾出空间。现在以类似的价格发现性能相当的系统并不难。如果在一年前,当1050价格还比较高的时候推出FX505DY,那么它便是一台更具吸引力的替代产品。
由于上述原因,FX505DY在竞争中没有任何重大优势,但它也不是一个不好的选择。它是第一款真正能和Intel-Nvidia产品正面竞争的笔记本,这非常重要。作为市场上第一款Zen +游戏笔记本电脑,它展示了未来Ryzen游戏笔记本电脑可以带来的许多好处。我们仍然希望Ryzen-Nvidia笔记本电脑可以真正削弱英特尔的统治地位。
强大的Ryzen Zen +在笔记本上首次亮相,但来得有点晚了。华硕TUF FX505DY是英特尔酷睿i5-8300H和GTX 1050的理想替代品。该系统有望在不久的将来为Ryzen-Turing游戏笔记本电脑铺平道路,并且在价格上明显优于Intel产品。
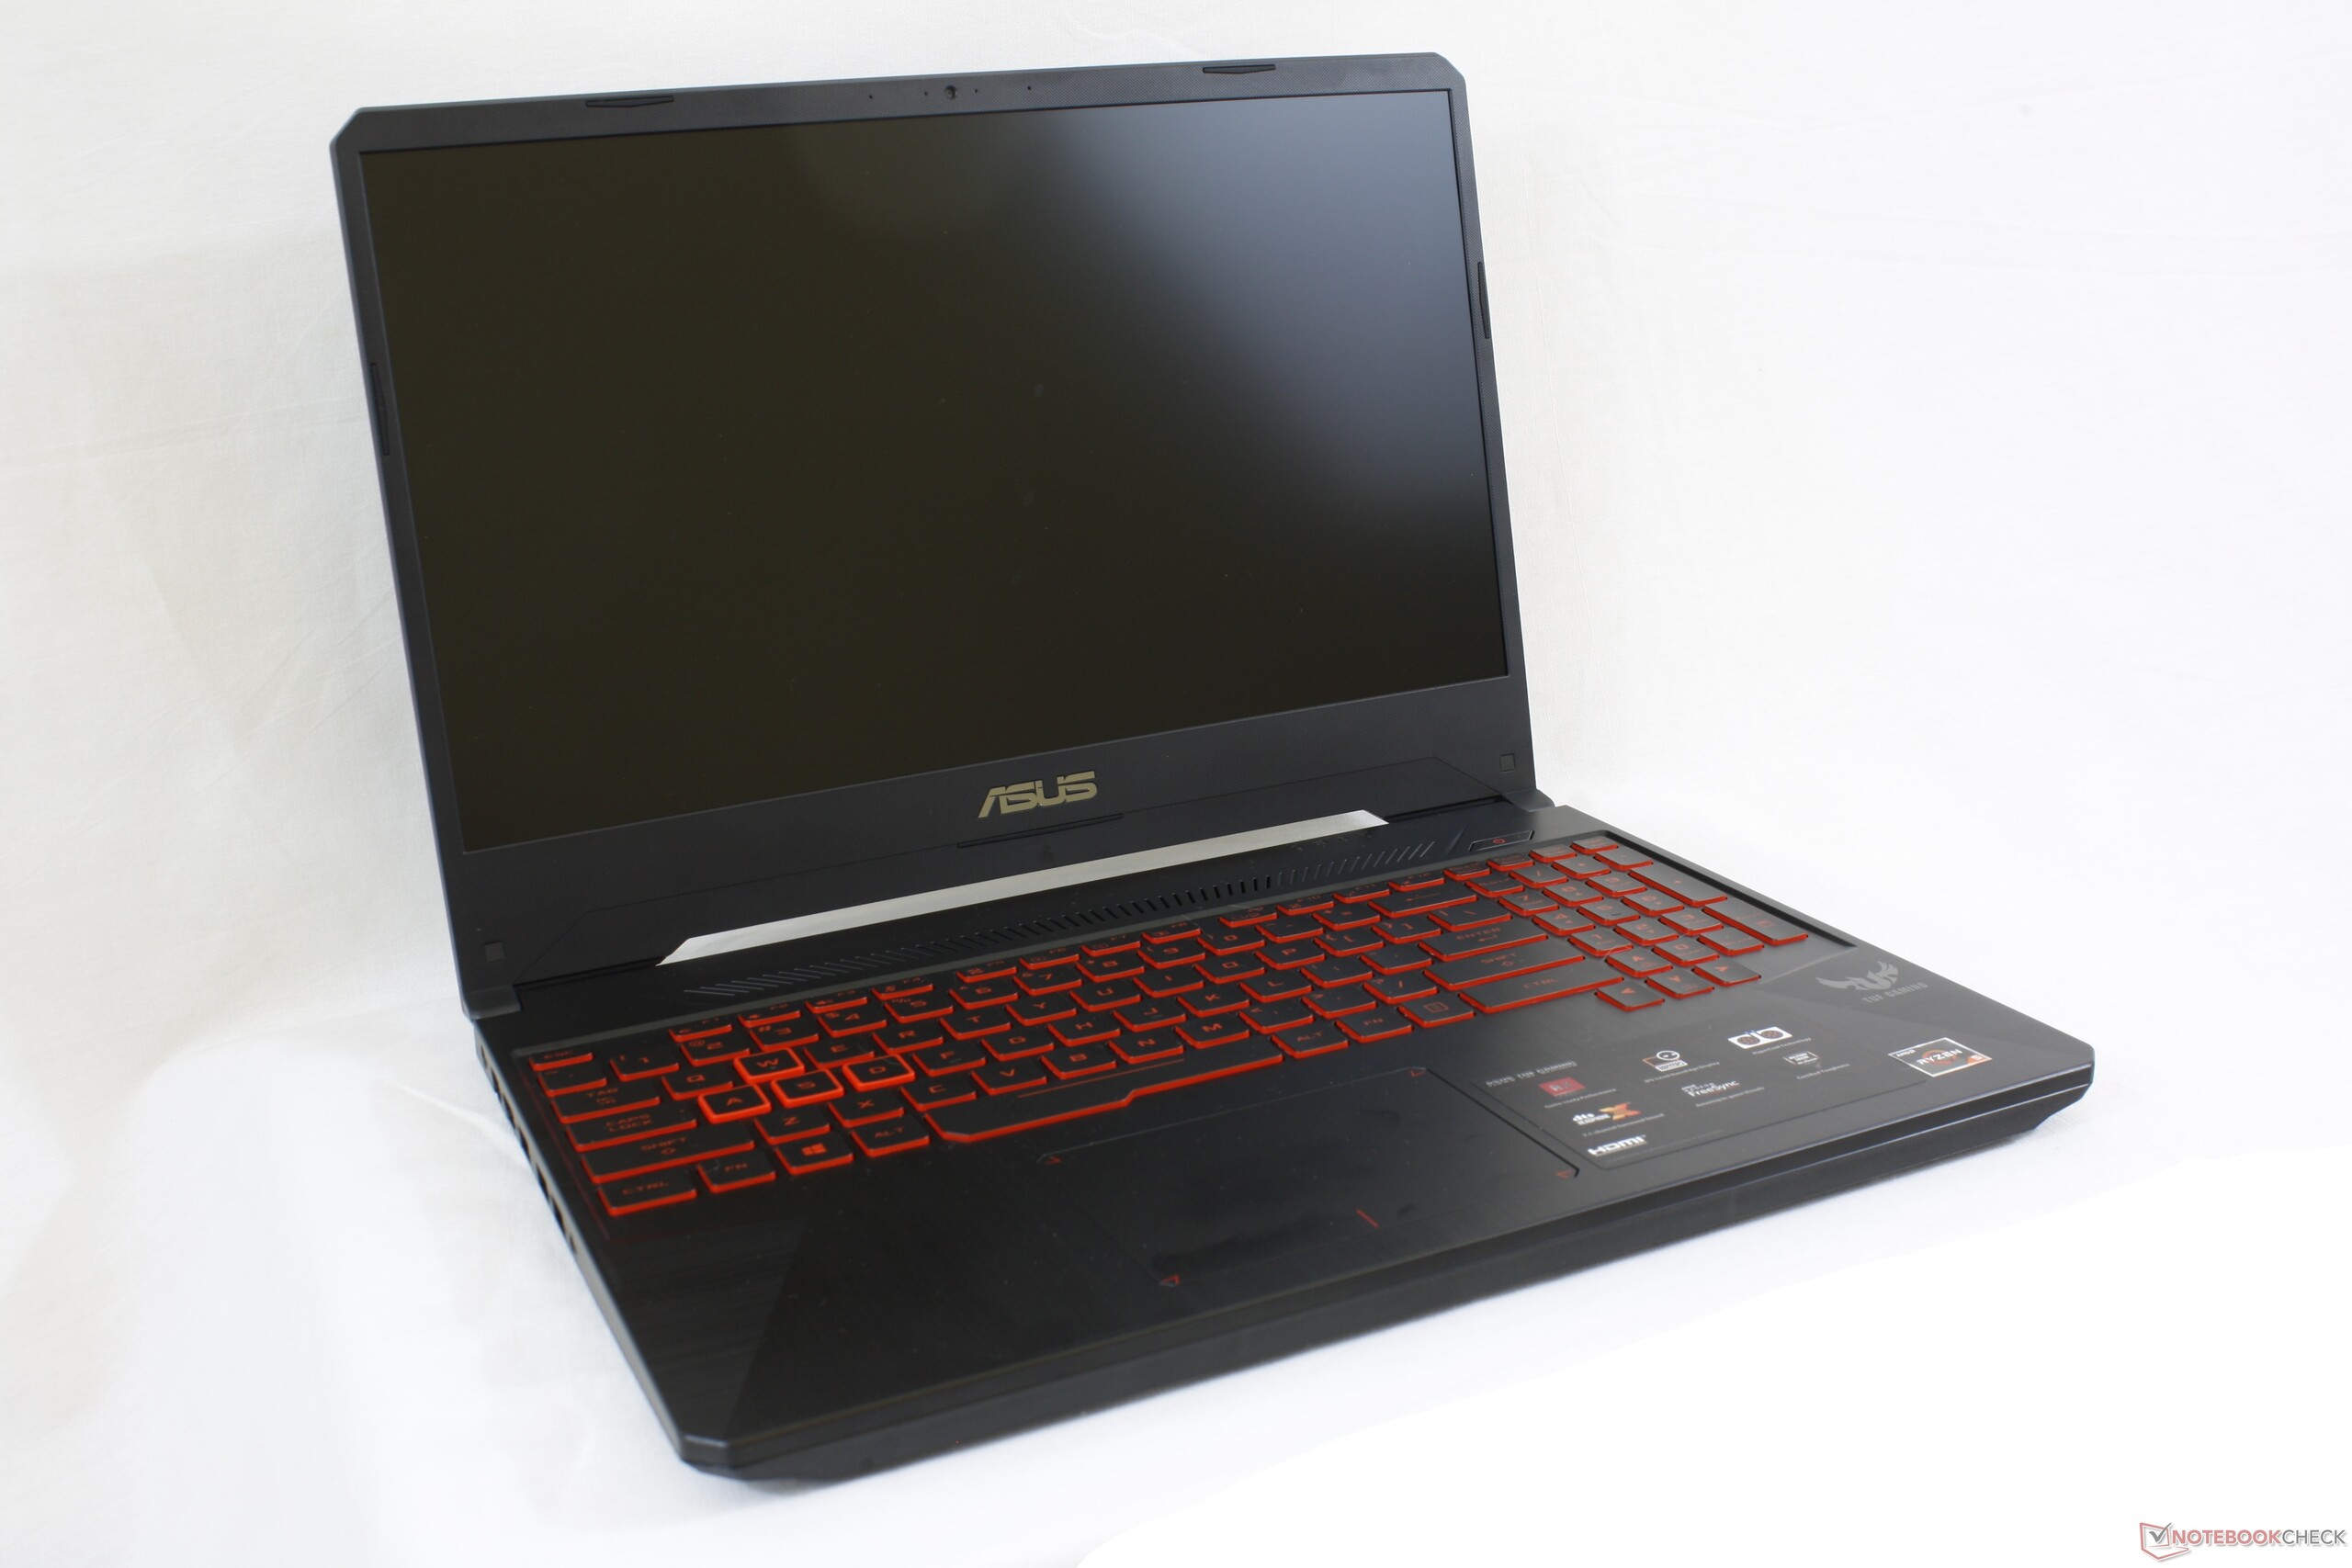
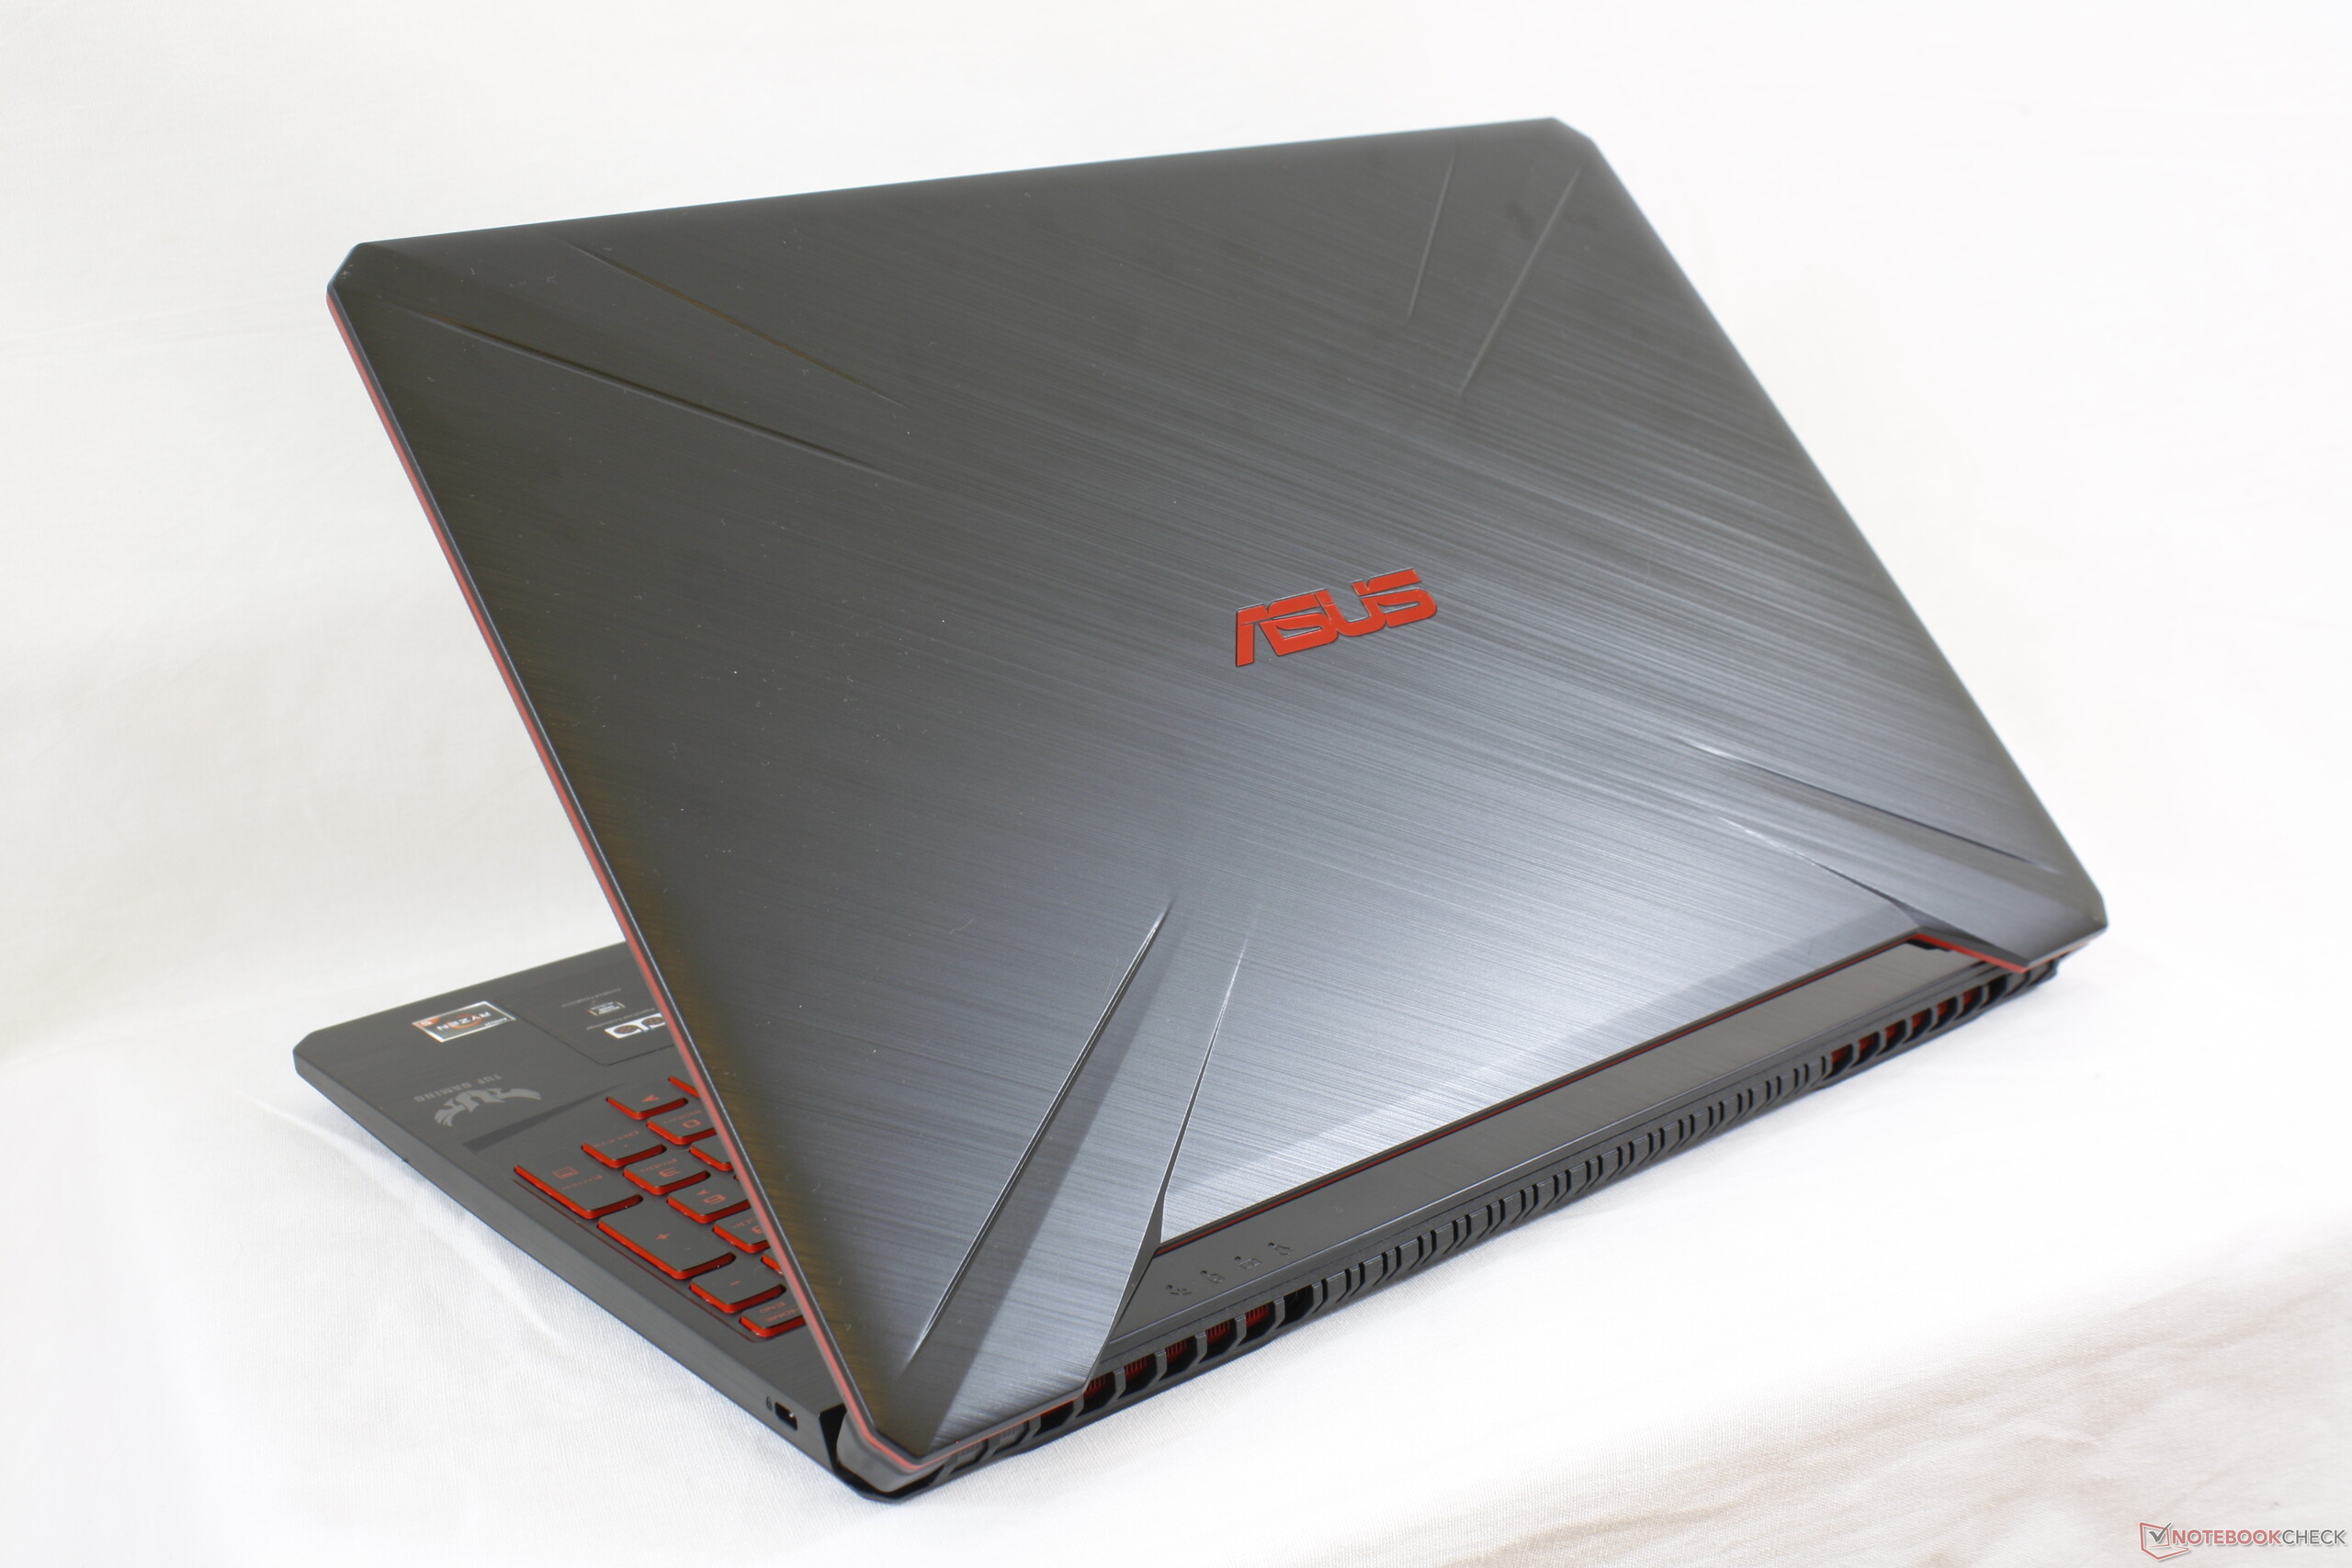
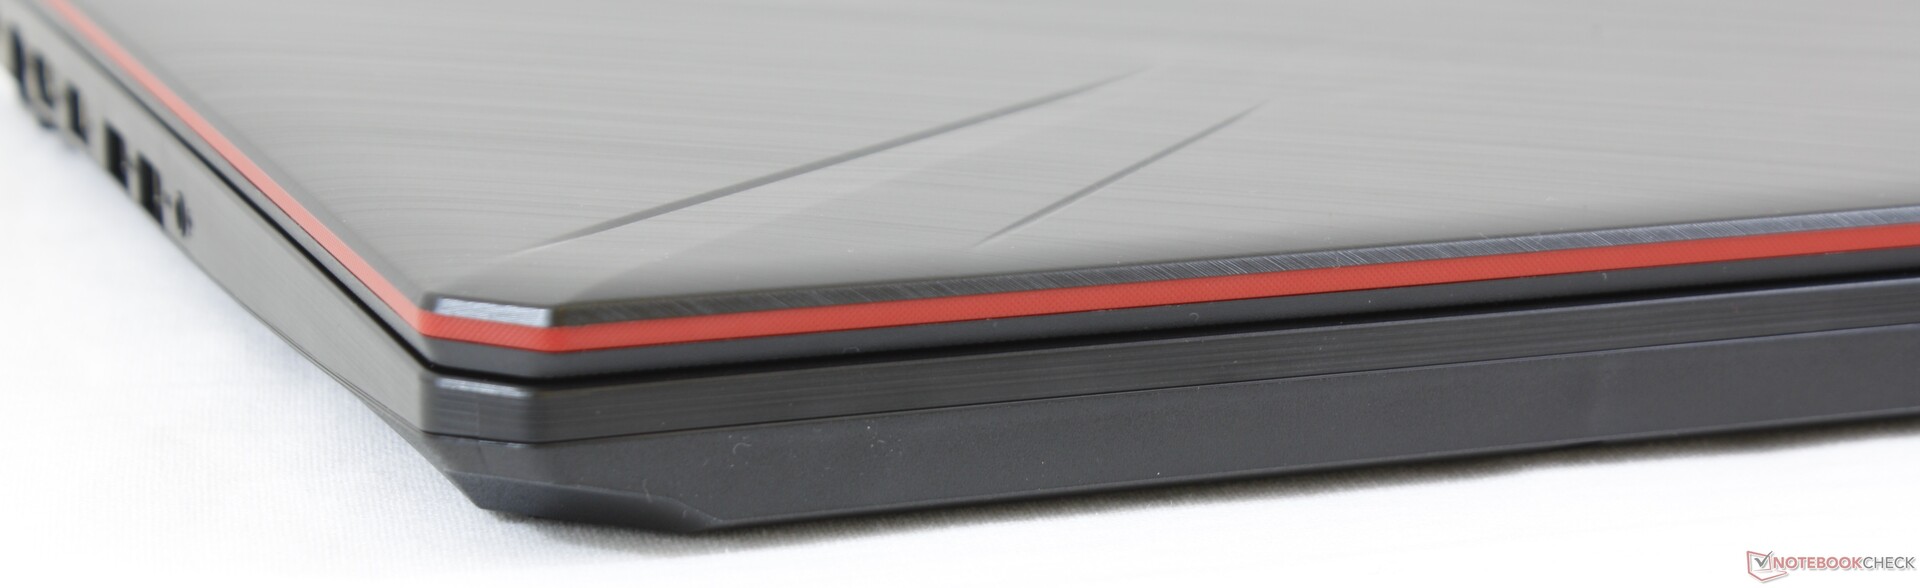
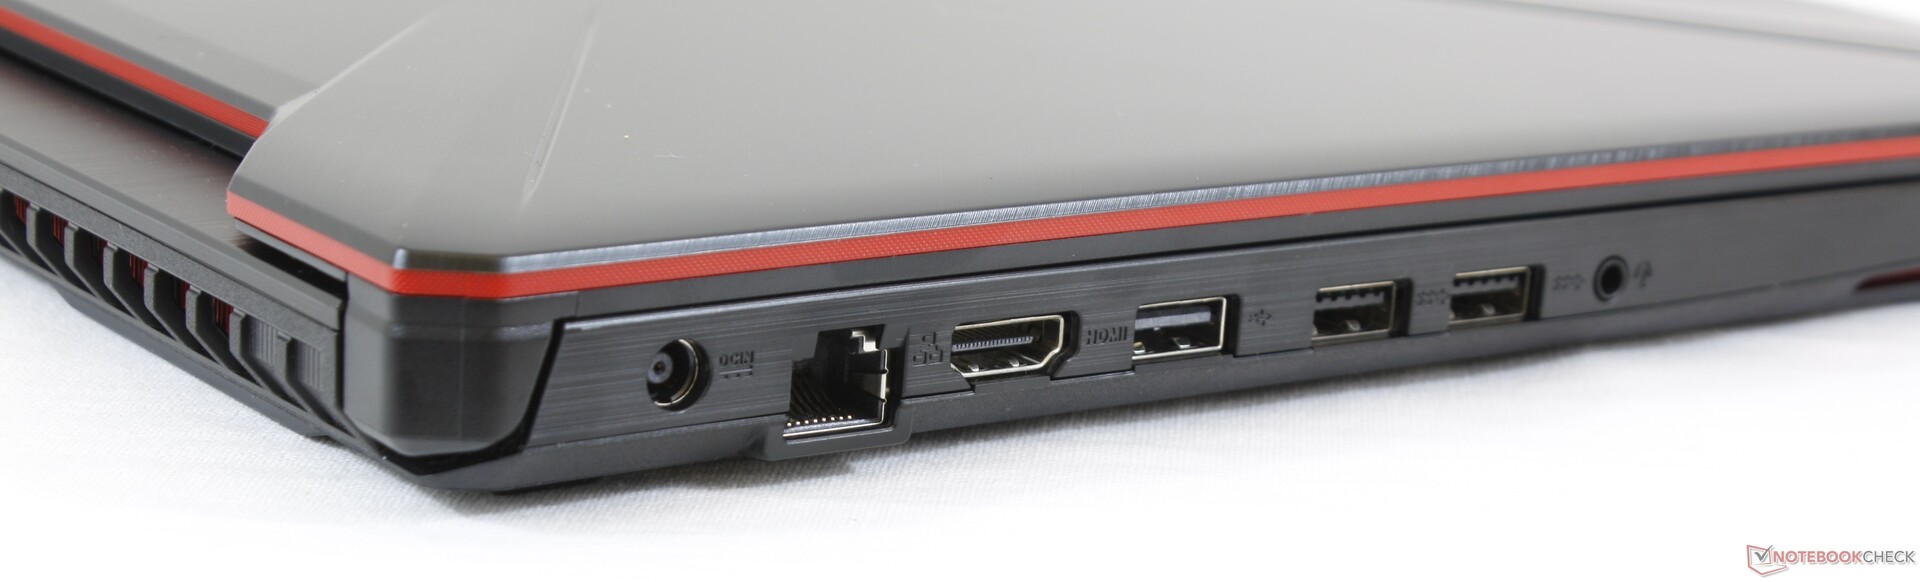
Asus TUF FX505DY
- 03/08/2019 v6 (old)
Allen Ngo
Price comparison

