LG Gram 14T90P敞篷车回顾。联想Yoga和惠普Spectre的挑战者
16:10的LG Gram 14T90P继承了老一代的16:9 Gram 14T90N通过引入更快的英特尔第11代处理器选项和新的机箱设计,成为一个完整的系列更新。与所有其他Gram型号一样,Gram 14T90P旨在最大限度地提高显示质量,同时最大限度地减轻重量,成为其尺寸类别中最轻的Core U系列笔记本电脑之一。
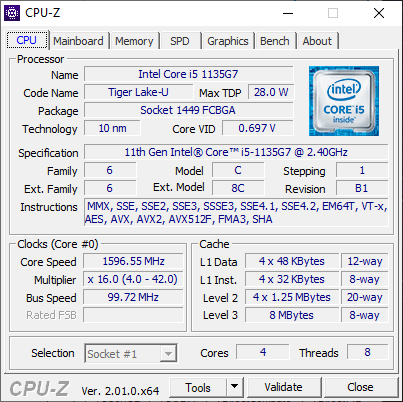
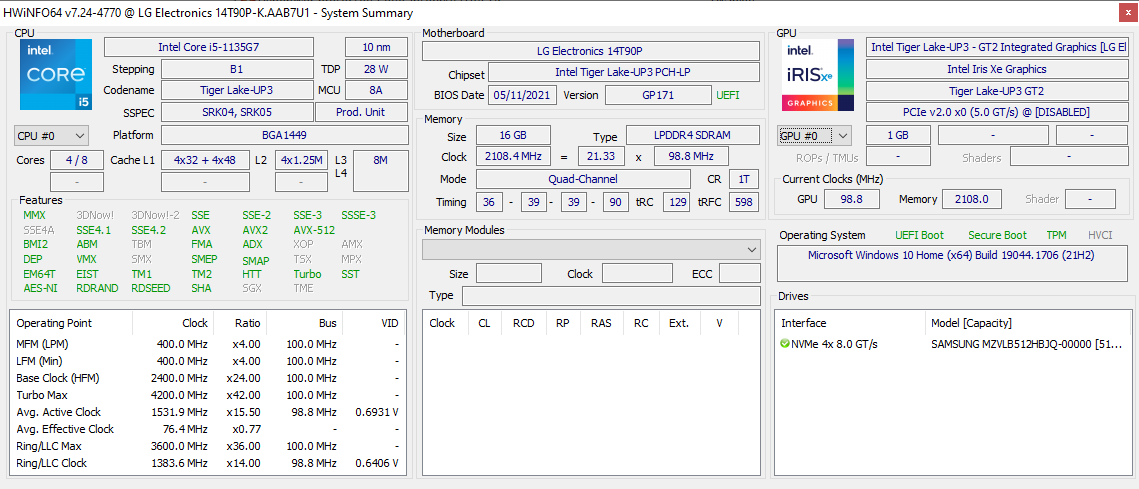
我们的评测单位已经配置了酷睿i5-1135G7处理器,16GB焊接内存,512GB NVMe固态硬盘,以及14英寸1200p IPS触摸屏,零售价约为1000至1100美元。其他SKU可以用酷睿i7-1165G7代替,但都配有相同的1200p面板。
这个领域的直接竞争对手包括其他高端次笔记本转换器,如 华硕Zenbook Flip 14, 惠普Spectre x360 14, 戴尔XPS 13 2合1, 微星峰会E13翻转, 或 联想Yoga 9 14.
更多LG评论。
潜在的竞争者比较
案例--从旧的设计中大幅升级
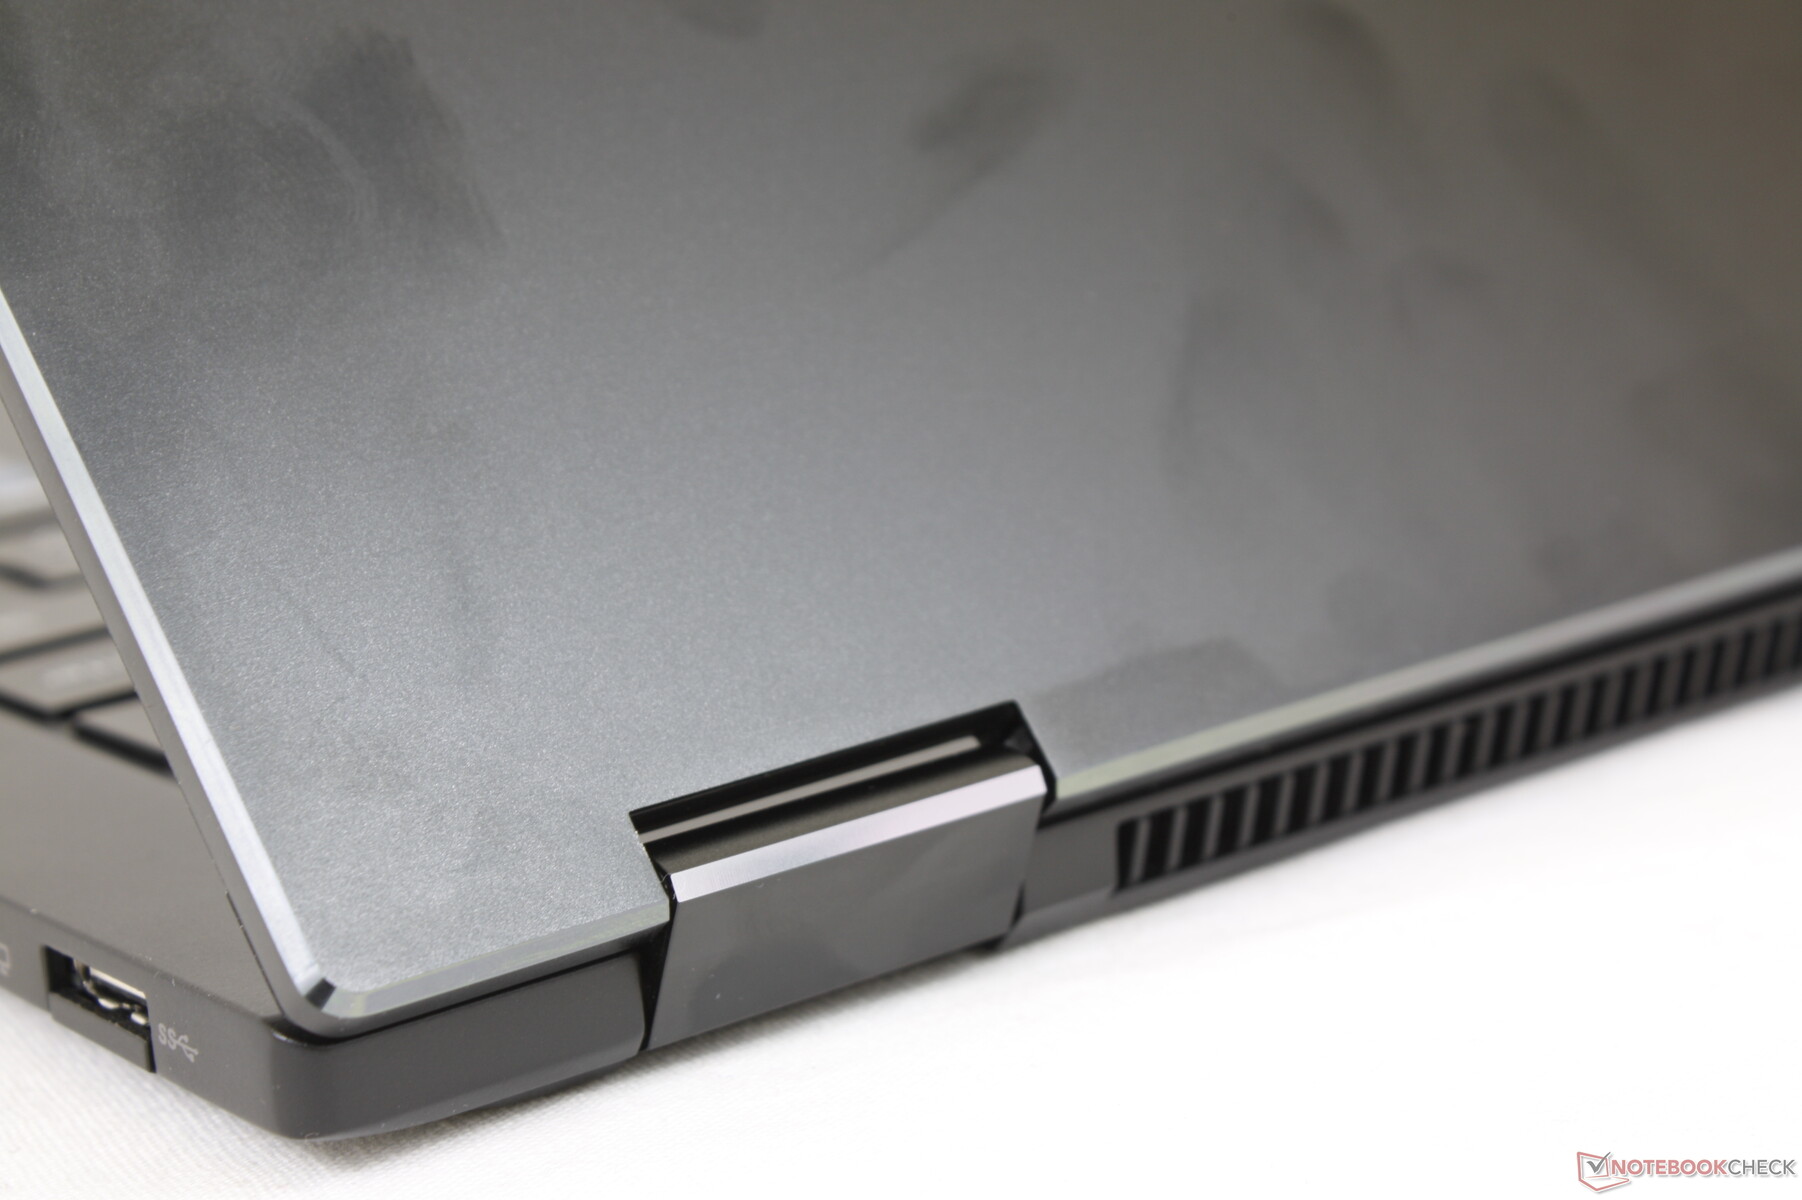
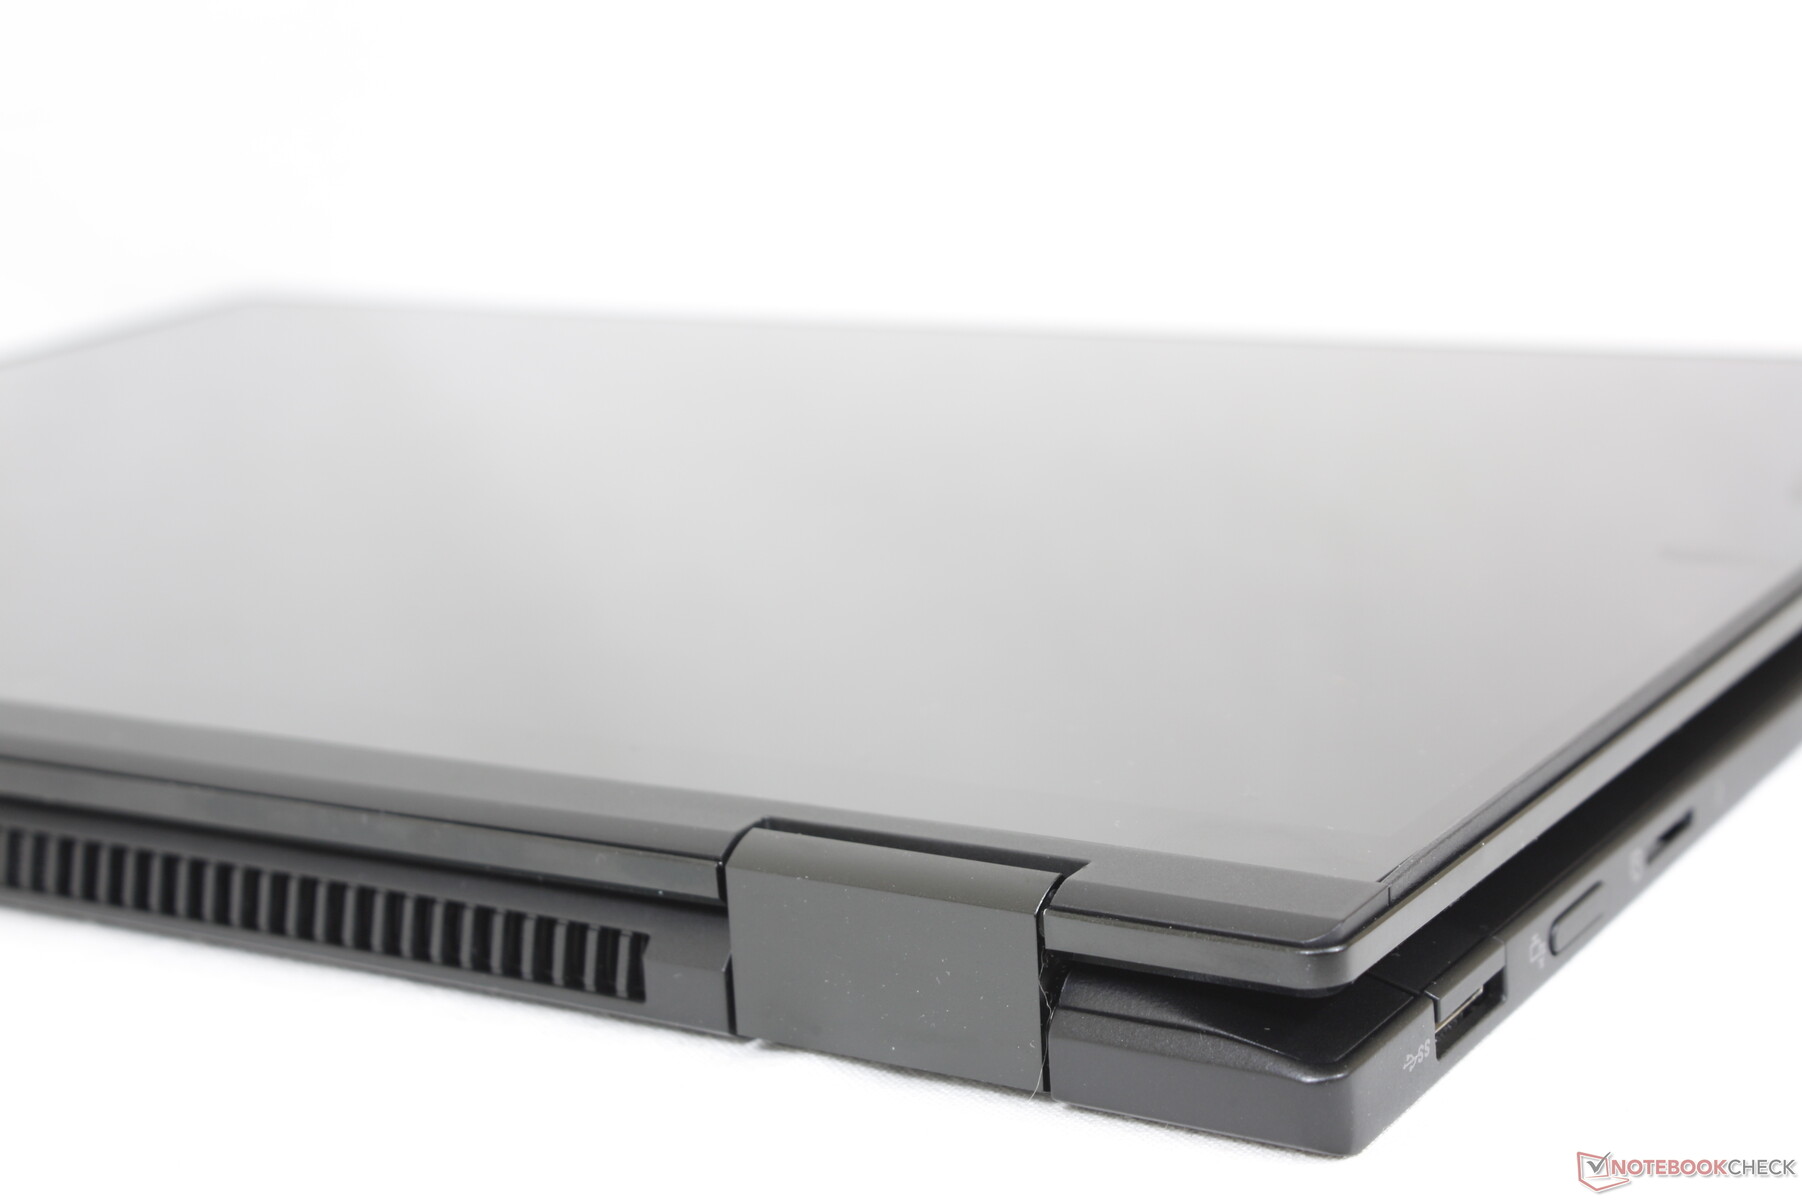
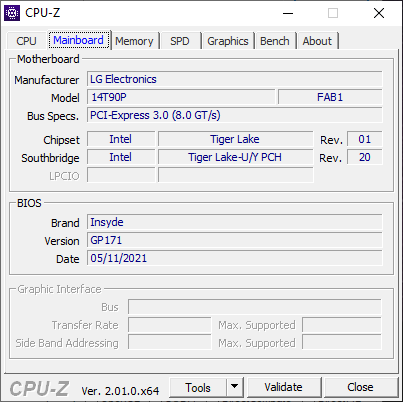
机箱设计基本上是最近的16英寸格拉姆的小型化版本。 16T90P.它可能不像戴尔XPS、惠普Spectre或华硕Zenbook系列那样具有视觉冲击力,但它通过更轻和通过MIL-STD 810G规格认证来弥补这一点。它的底座和盖子也比老式的Gram 14T90N更坚固,扭动最小,没有吱吱作响,不容易弯曲或损坏,比起 三星Galaxy Book Pro 360系列.
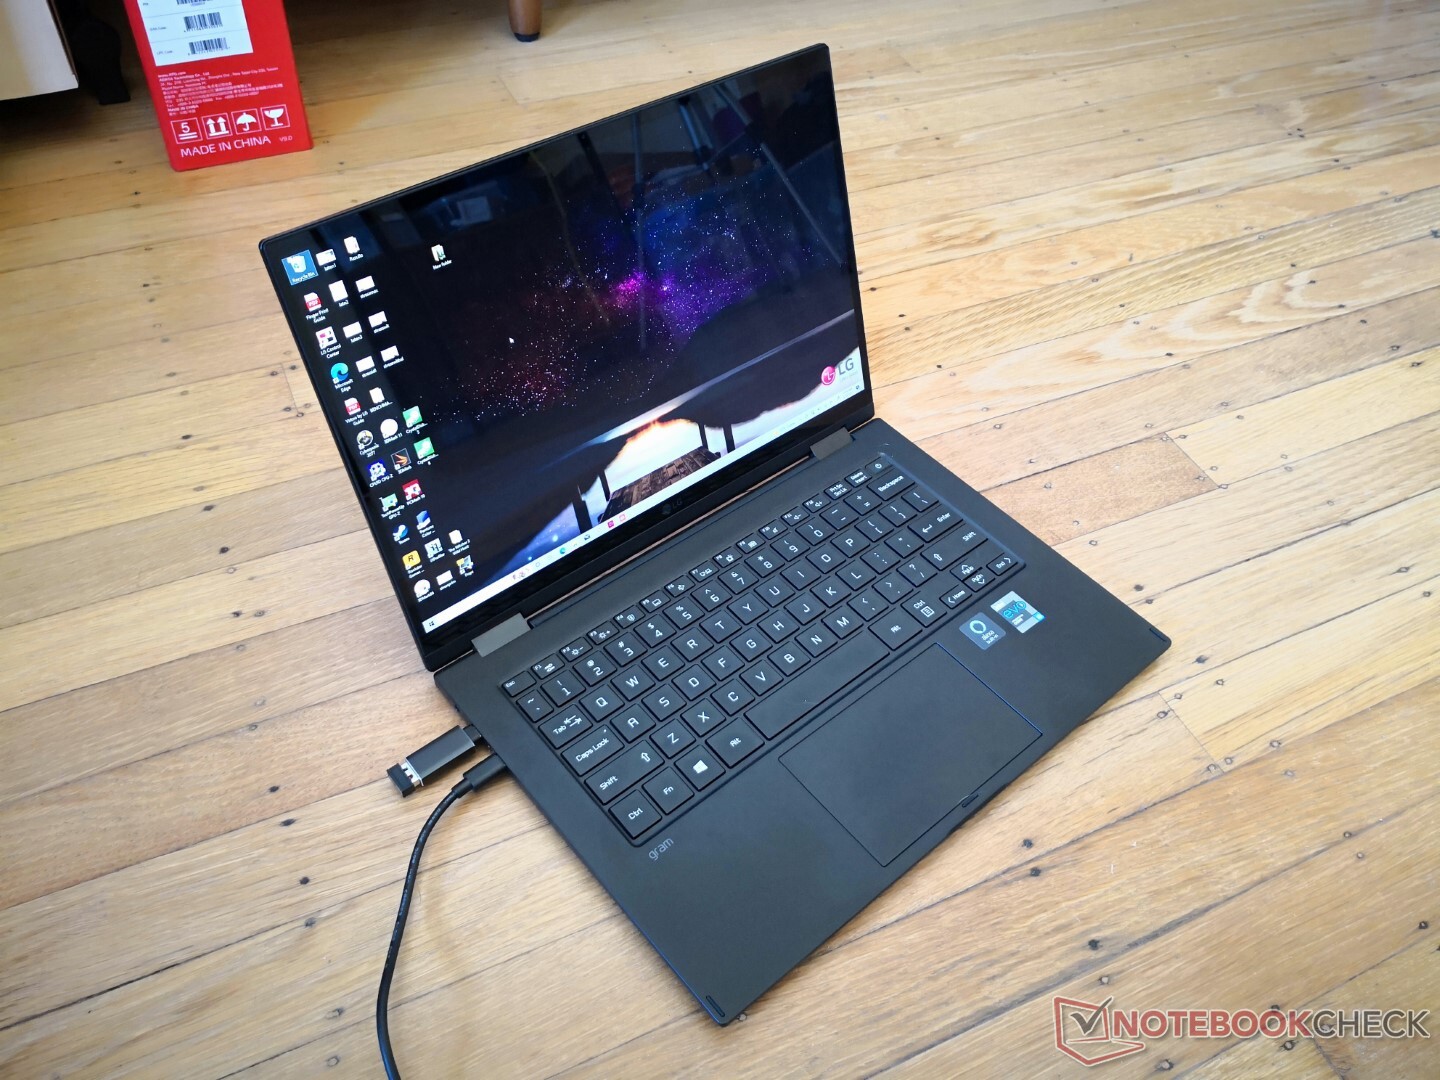
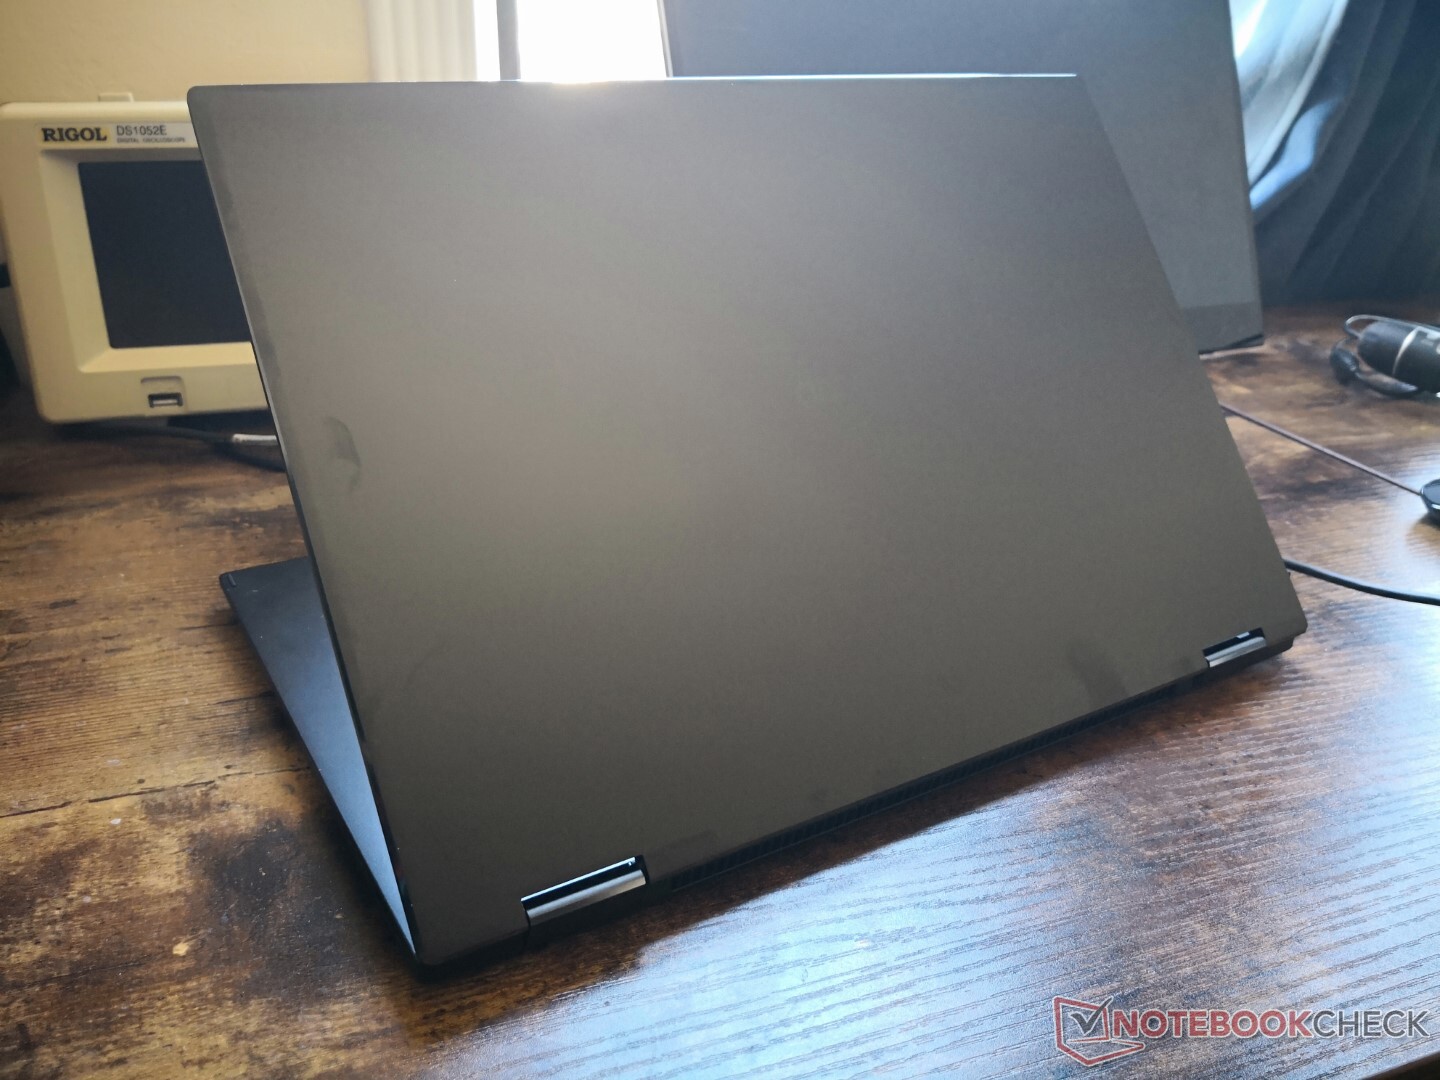
尺寸与之前的Gram 14T90N略有不同,但总体体积和重量几乎相同。因此,用户获得了一个更大的16:10触摸屏,而不需要一个更大或更重的机箱。该系统比大多数竞争性敞篷车要轻约100克至200克,这在操作或旅行时是很明显的。
尺寸比较
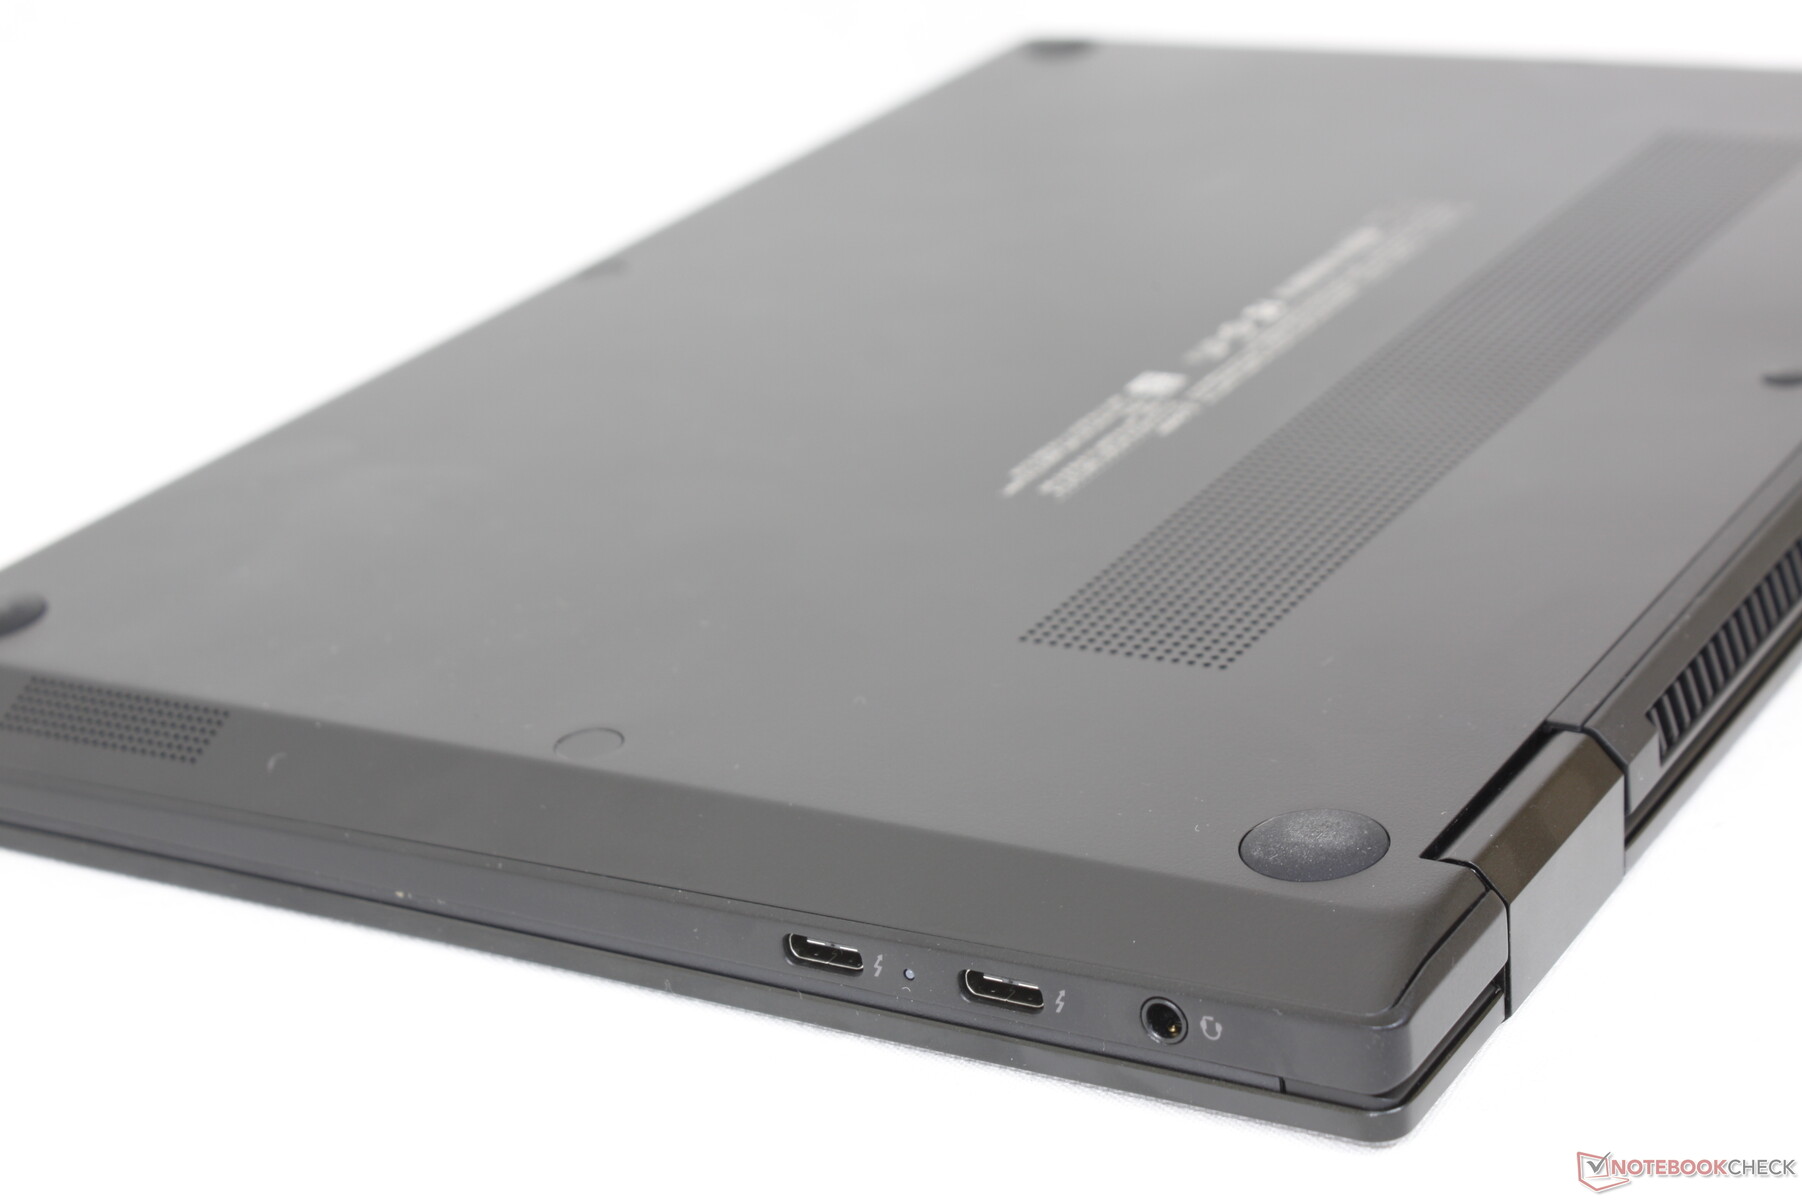
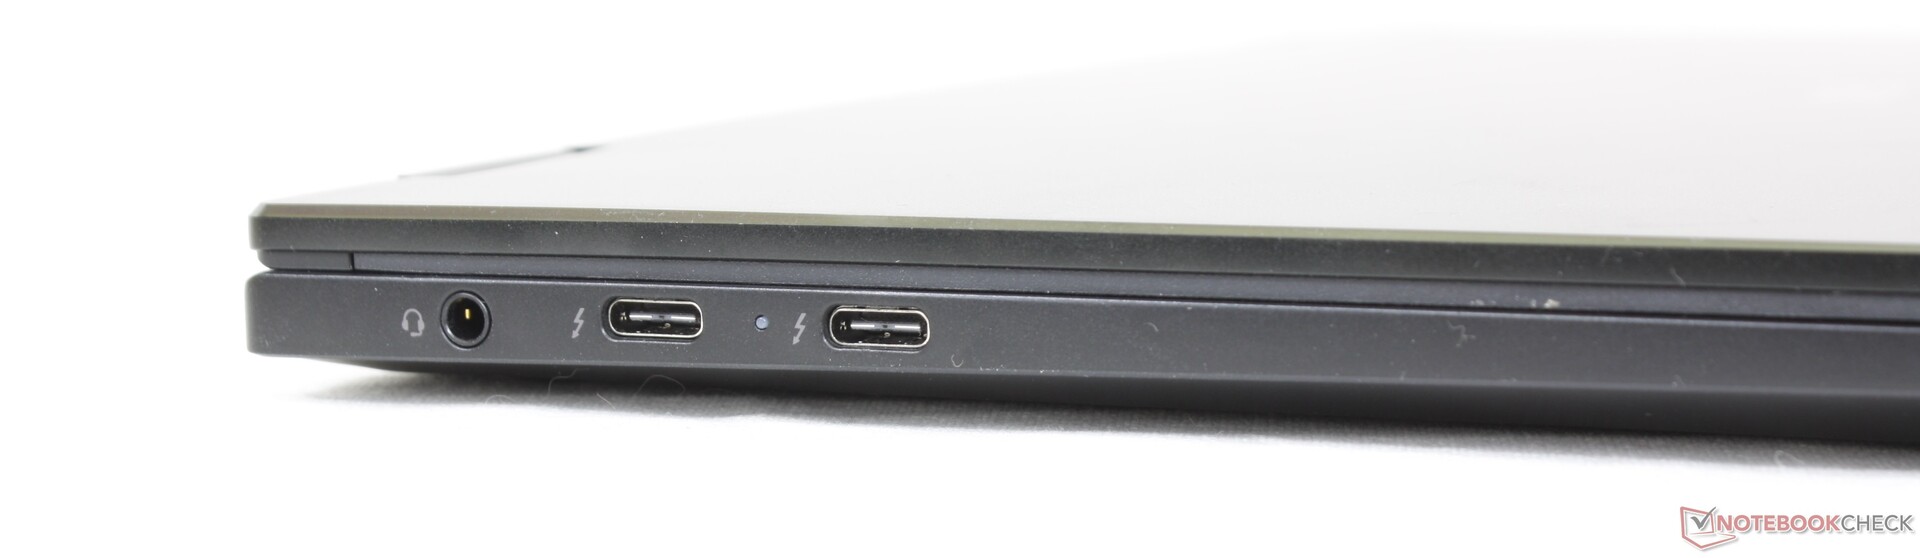
连接性 - 2x Thunderbolt 4
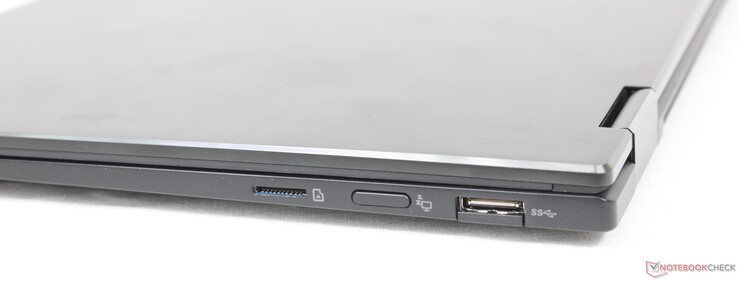
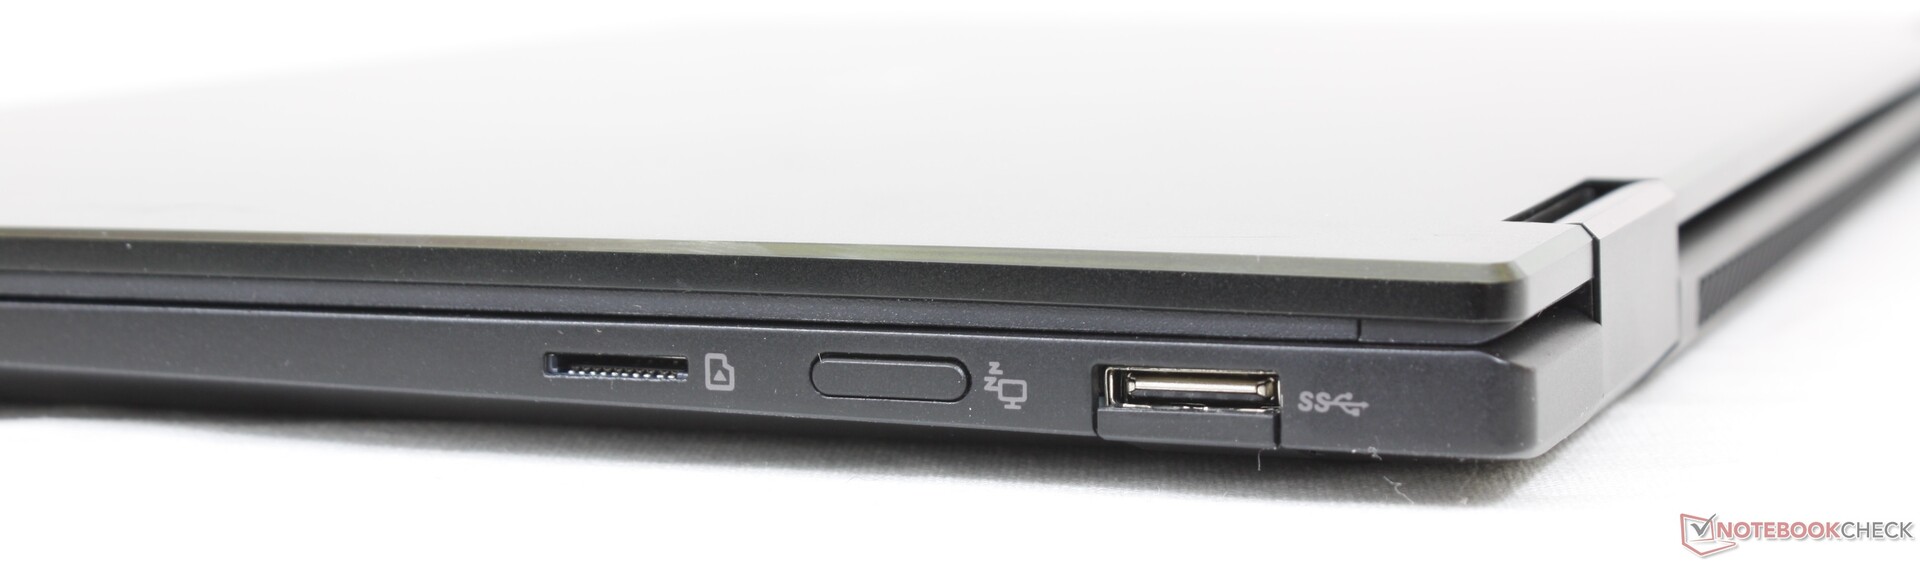
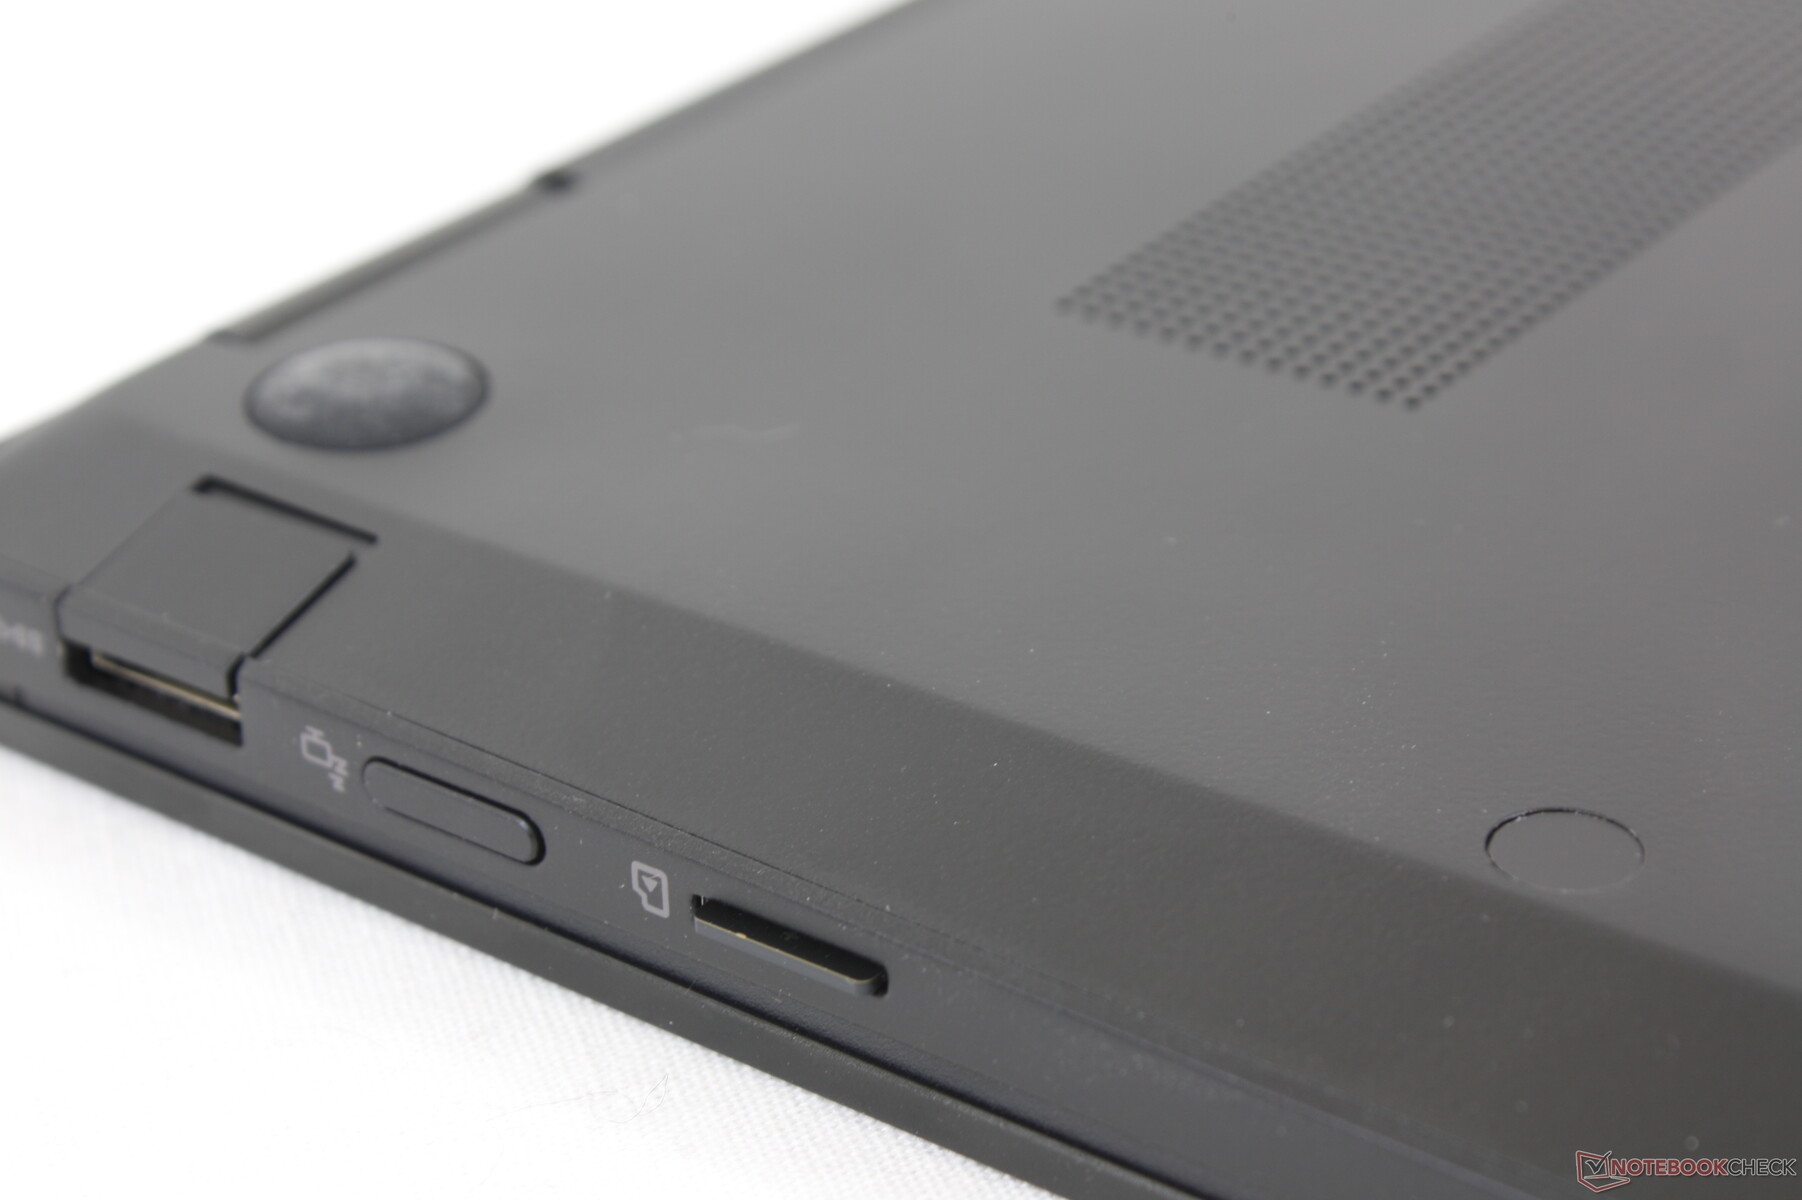
端口选项与较大的格拉姆16T90P相同。格兰14T90P取消了格兰14Z90P或格兰14T90N上的HDMI端口和Kensington锁插槽,同时提供比14Z90P更少的选项。例如,只有一个全尺寸的USB-A端口,而不是两个,这意味着鼓励用户利用USB-C配件或扩展坞来代替。
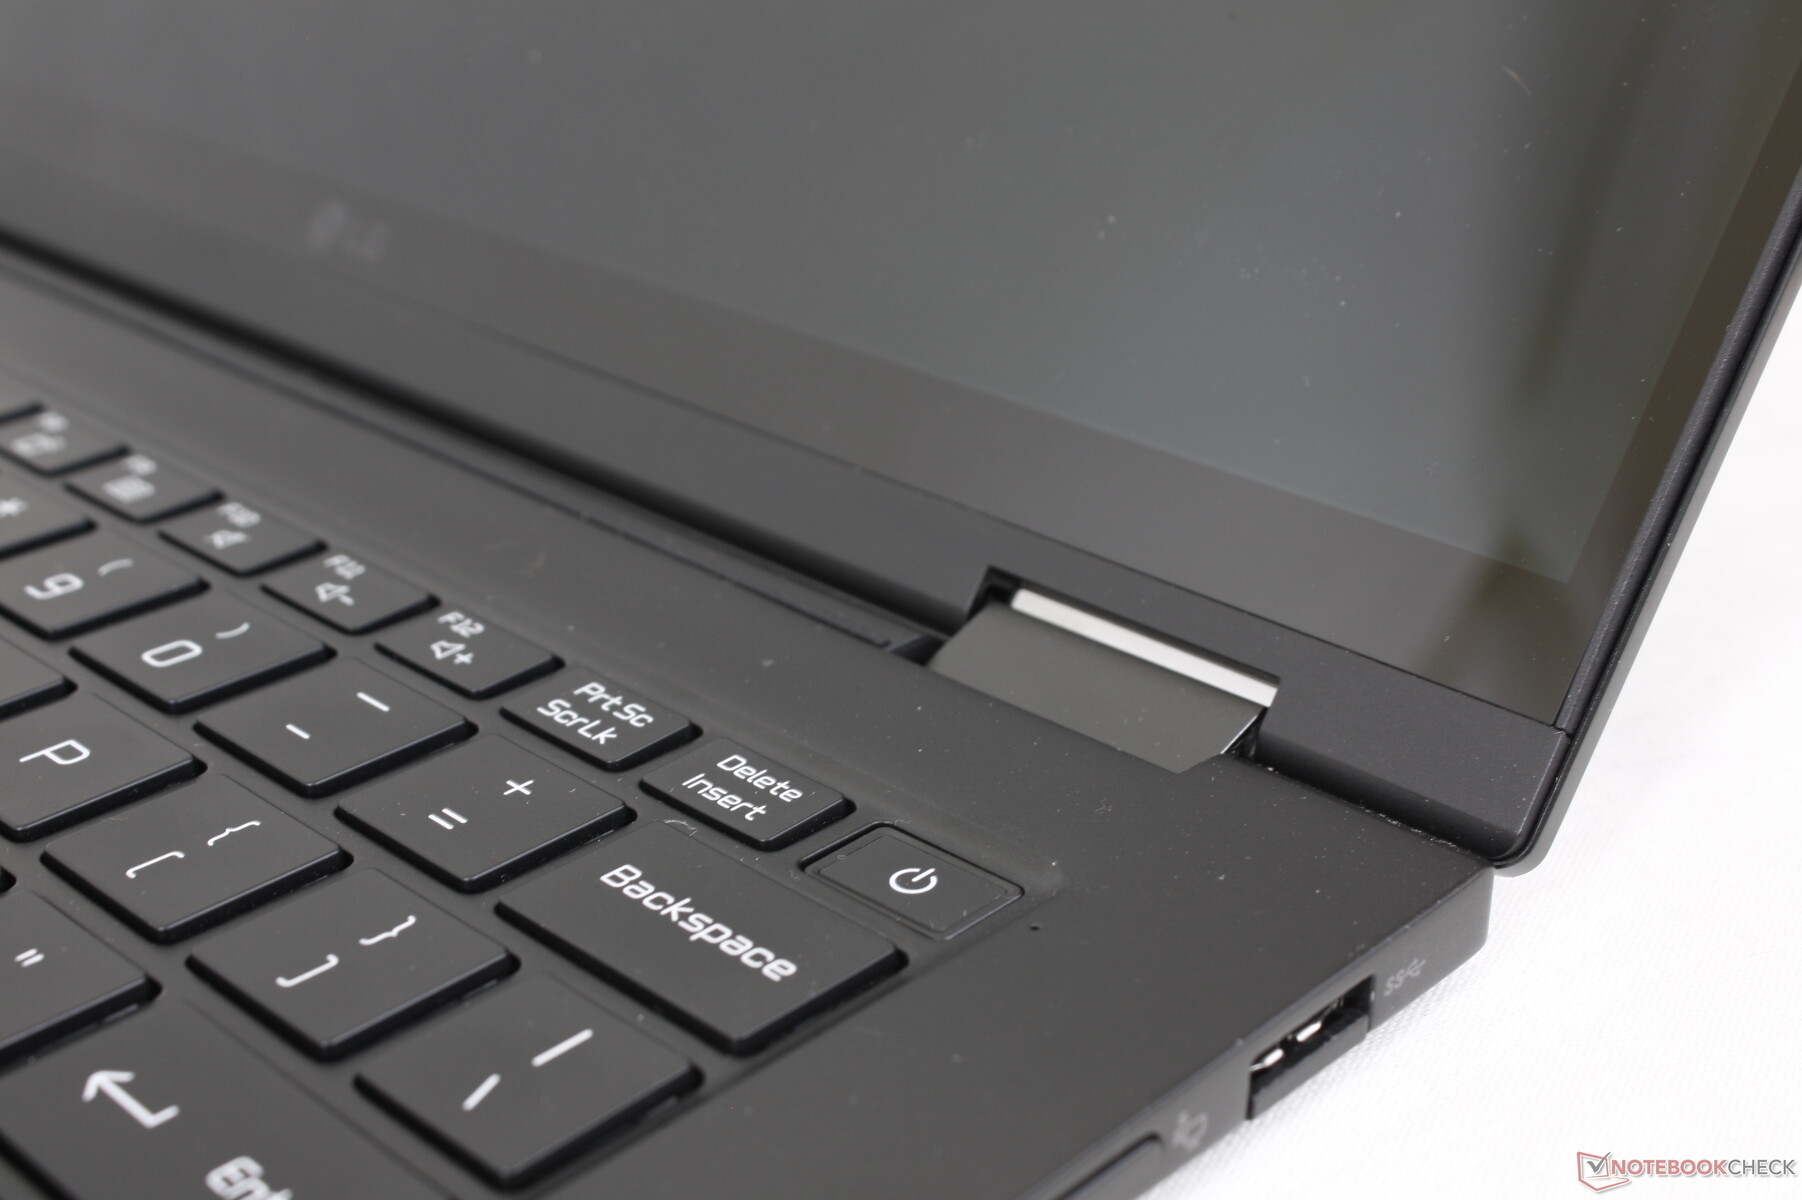
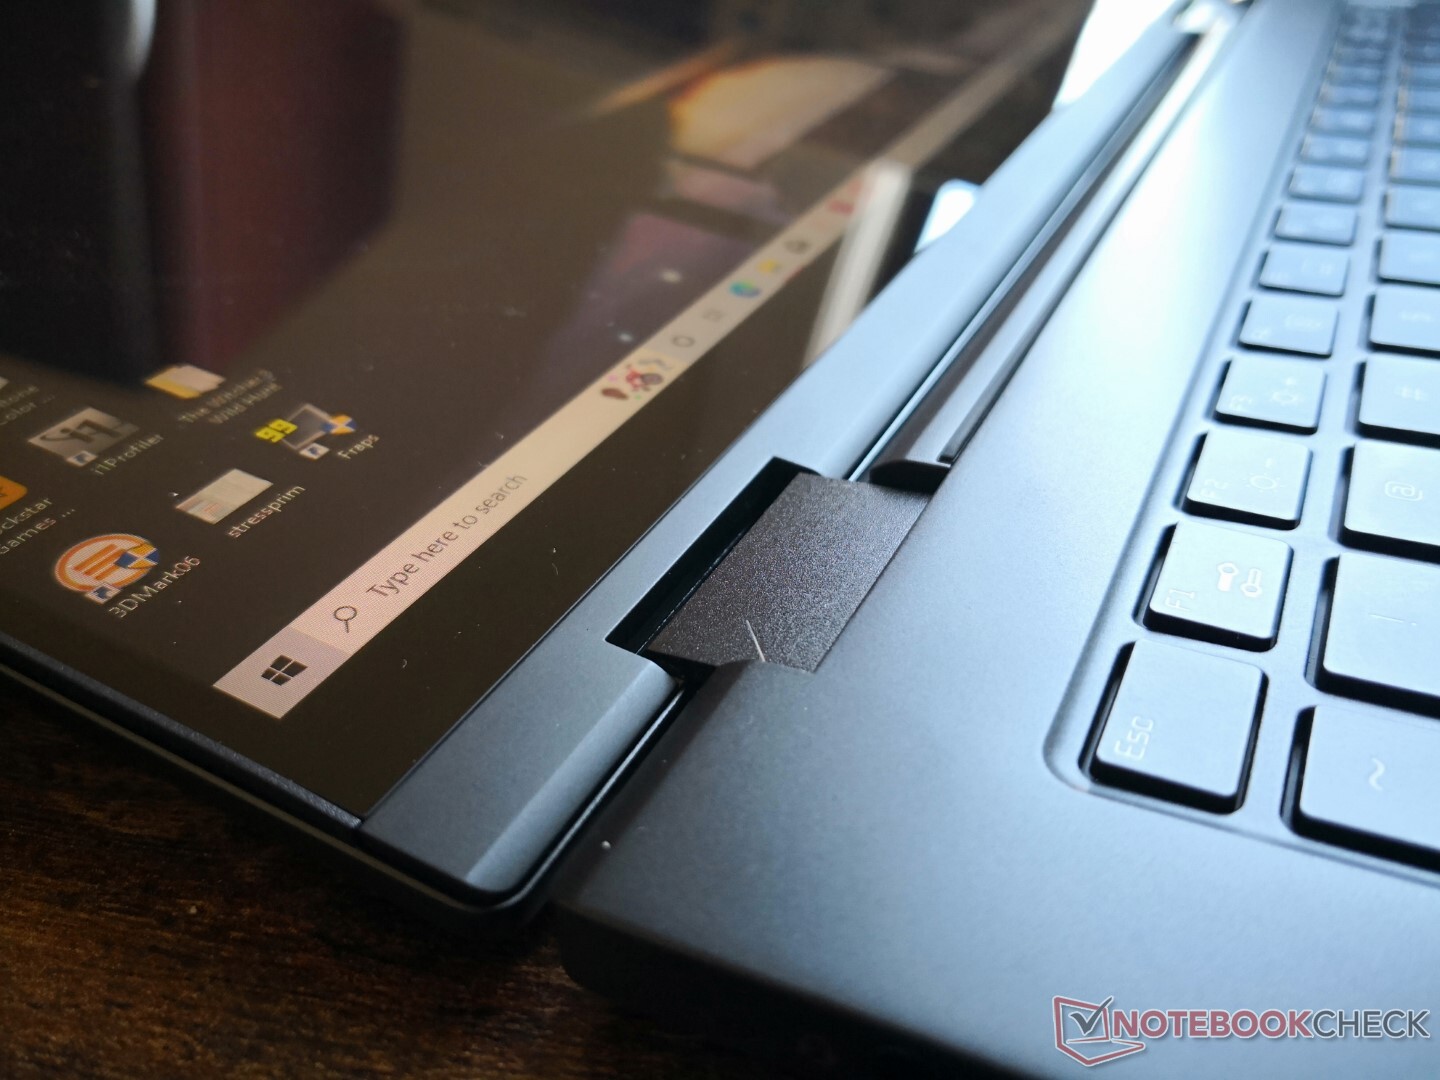
按下右侧边缘的按钮可以打开或关闭显示器。这是一个奇怪的功能,我们在许多其他转换设备上没有看到,而且不幸的是,它不是用户可定制的。

SD卡阅读器
从弹簧式MicroSD读卡器的传输速率平均在85MB/s左右。将1GB的图片从我们的UHS-II卡上移到桌面上,大约需要15秒,与迄今为止的所有其他克拉克机型相似。
| SD Card Reader | |
| average JPG Copy Test (av. of 3 runs) | |
| HP Spectre x360 14-ea0378ng (Toshiba Exceria Pro M501 microSDXC 64GB) | |
| Dell XPS 13 9310 2-in-1 (AV Pro V60) | |
| Asus ZenBook Flip 14 UN5401QA-KN085W (AV Pro SD microSD 128 GB V60) | |
| LG Gram 14T90N (Toshiba Exceria Pro M501 64 GB UHS-II) | |
| MSI Summit E13 Flip Evo A11MT (AV PRO microSD 128 GB V60) | |
| LG Gram 14T90P (AV Pro V60) | |
| maximum AS SSD Seq Read Test (1GB) | |
| HP Spectre x360 14-ea0378ng (Toshiba Exceria Pro M501 microSDXC 64GB) | |
| Dell XPS 13 9310 2-in-1 (AV Pro V60) | |
| Asus ZenBook Flip 14 UN5401QA-KN085W (AV Pro SD microSD 128 GB V60) | |
| LG Gram 14T90P (AV Pro V60) | |
| MSI Summit E13 Flip Evo A11MT (AV PRO microSD 128 GB V60) | |
| LG Gram 14T90N (Toshiba Exceria Pro M501 64 GB UHS-II) | |
沟通
英特尔AX201是支持Wi-Fi 6和蓝牙5.2的标准配置。在与华硕GT-AXE11000配对时,我们没有遇到任何连接问题,与我们在最近的 华硕Zenbook Pro 15.
| Networking | |
| iperf3 transmit AX12 | |
| Asus ZenBook Flip 14 UN5401QA-KN085W | |
| Lenovo Yoga 9 14IAP7 82LU0001US | |
| Dell XPS 13 9310 2-in-1 | |
| HP Spectre x360 14-ea0378ng | |
| MSI Summit E13 Flip Evo A11MT | |
| LG Gram 14T90N | |
| iperf3 receive AX12 | |
| Asus ZenBook Flip 14 UN5401QA-KN085W | |
| Dell XPS 13 9310 2-in-1 | |
| Lenovo Yoga 9 14IAP7 82LU0001US | |
| MSI Summit E13 Flip Evo A11MT | |
| LG Gram 14T90N | |
| HP Spectre x360 14-ea0378ng | |
| iperf3 receive AXE11000 | |
| LG Gram 14T90P | |
| iperf3 transmit AXE11000 | |
| LG Gram 14T90P | |
网络摄像头
摄像头只有720p,不支持Windows Hello,甚至不支持隐私快门。这肯定需要在未来的机型上解决。


维护
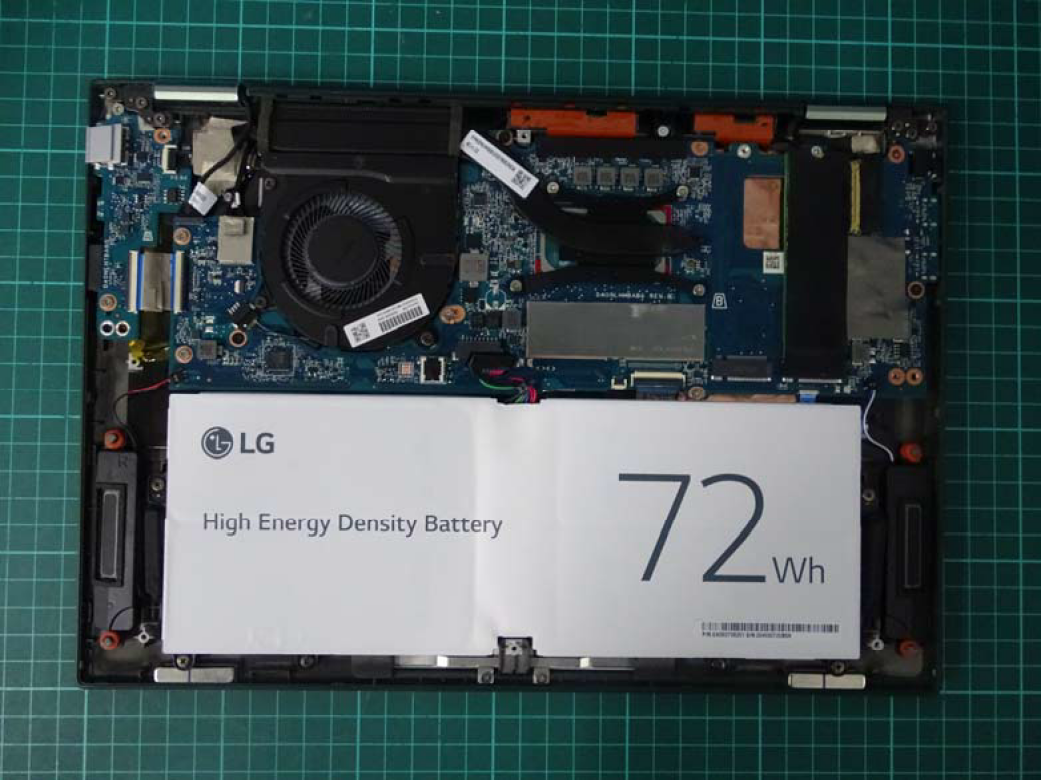
与迄今为止的其他每一台格拉姆笔记本电脑一样,底板被设计成非常难以打开,因为螺丝被隐藏在贴纸和橡胶脚下。这是一个耻辱,因为该系统可以支持多达两个内部M.2 2280固态硬盘,而不是一个额外的存储空间,但LG已经让业主恼火地难以添加自己的驱动器。
内存和WLAN都是焊接的,用户无法升级。
由于我们无法在不损坏的情况下打开我们的测试设备,我们可以参考FCC的官方图片。.
配件和保修
零售盒包括一支Wacom主动式手写笔以及通常的文件和AC适配器。标准的一年有限保修期适用。
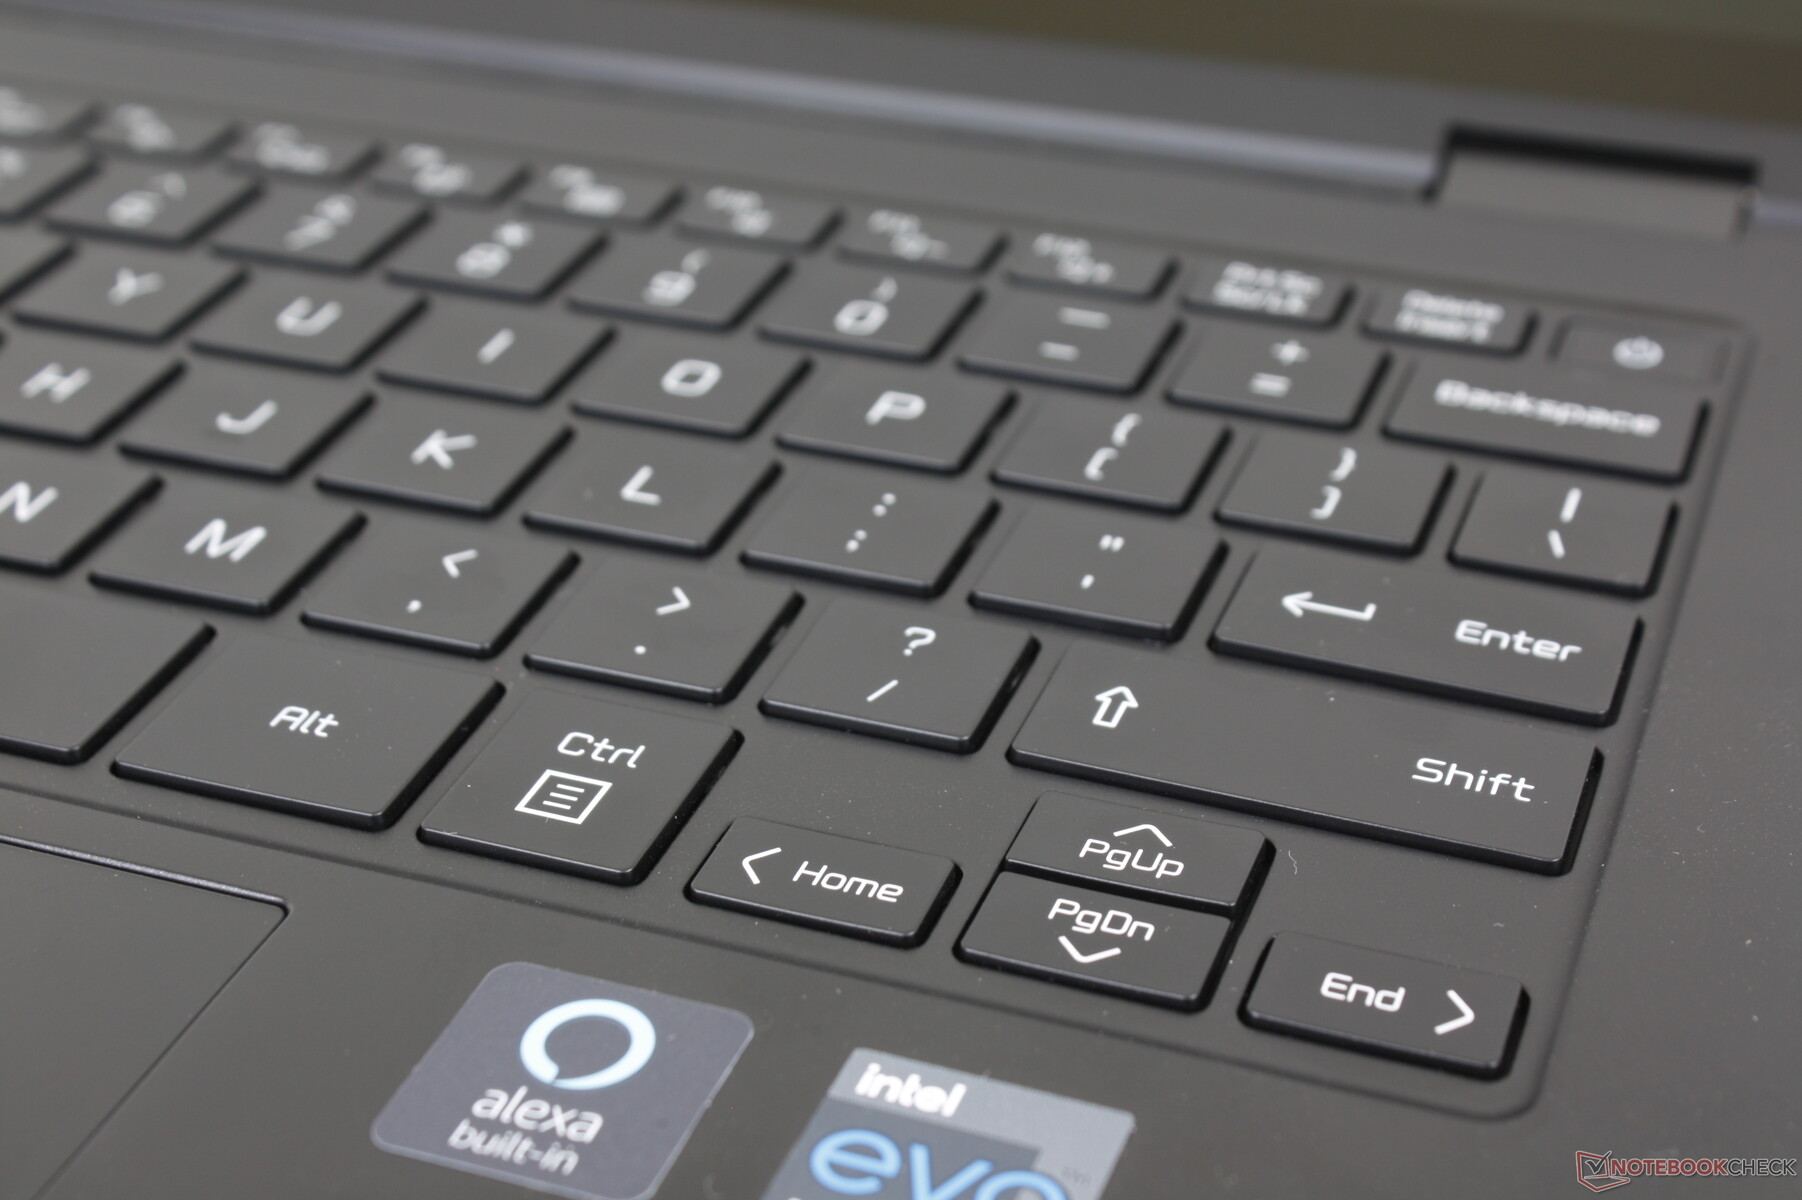
输入设备 - 伟大的键盘,糟糕的点击板
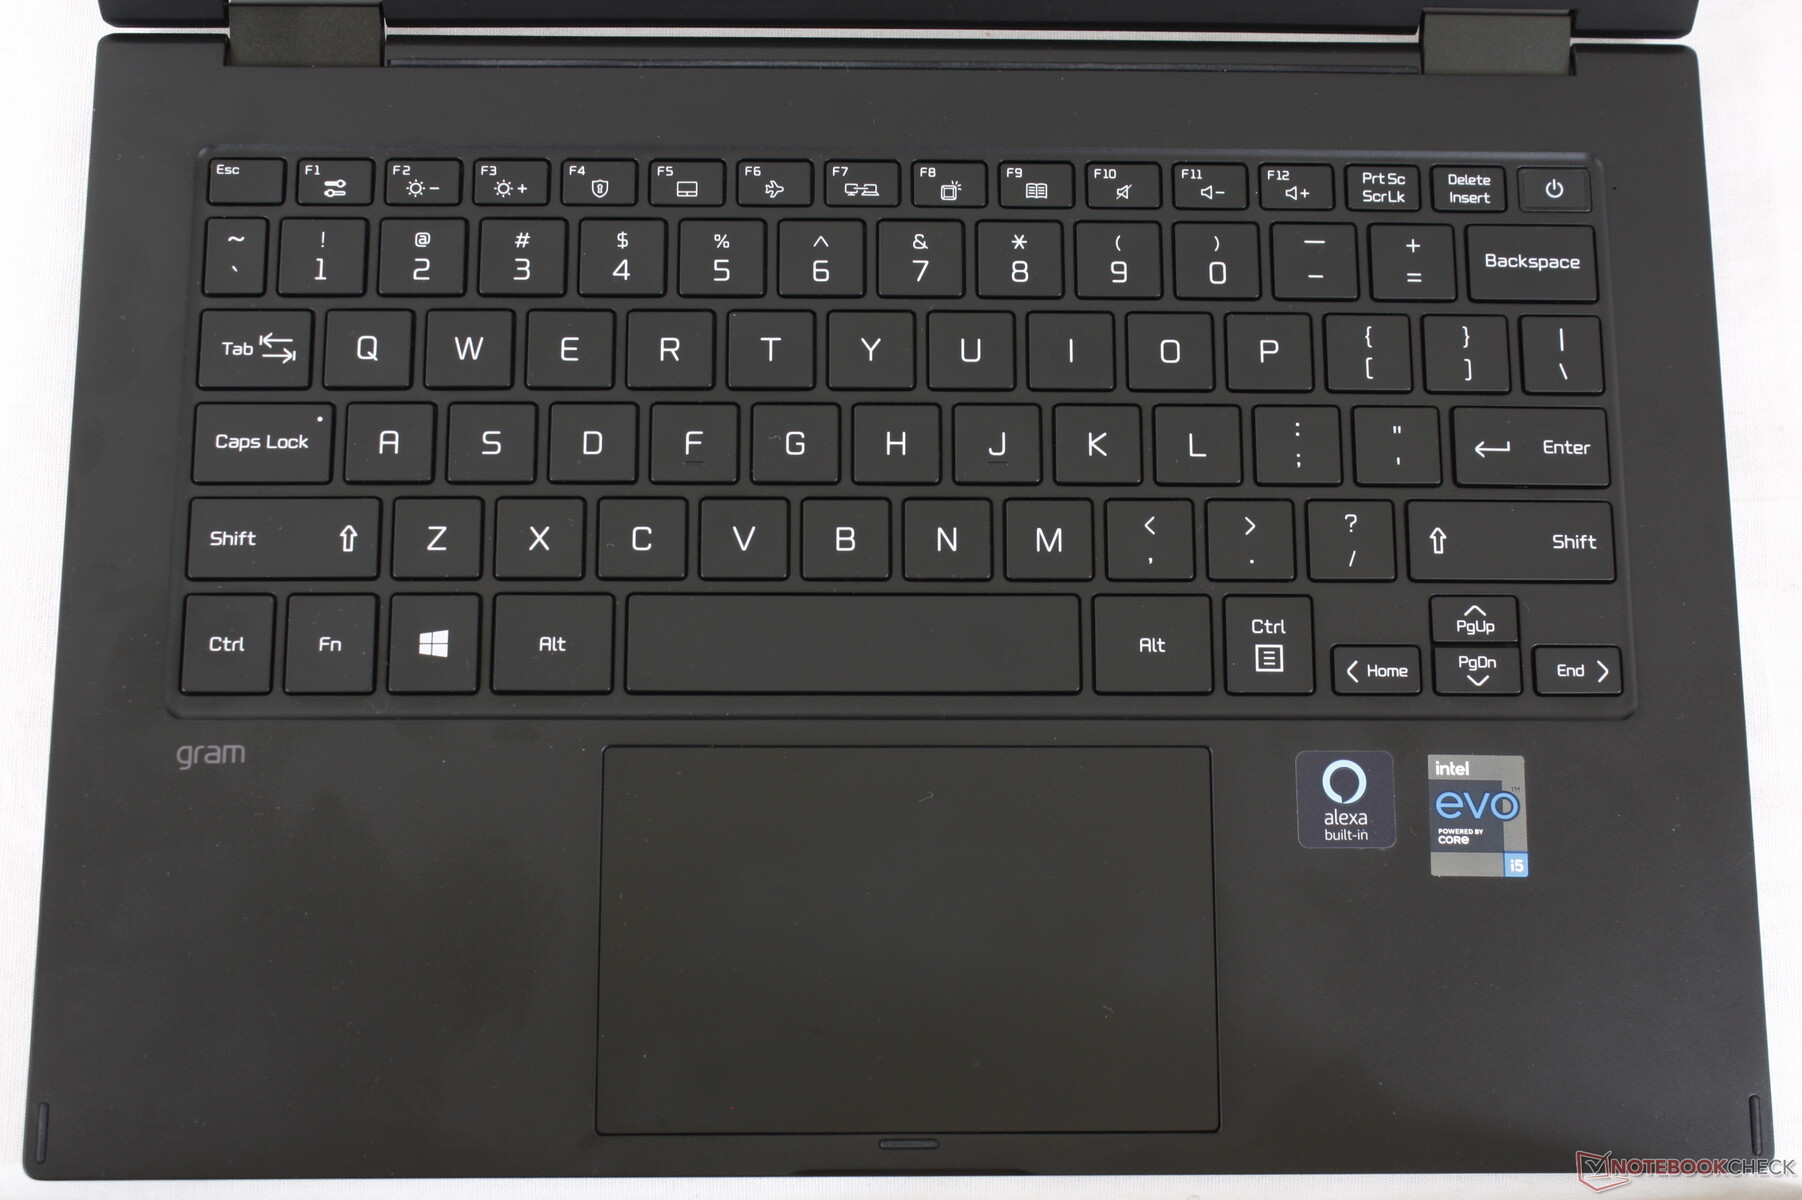
键盘
与大多数其他超极本相比,键盘按键的反馈明显更坚硬,更不像海绵状。如果你习惯于在较软的键盘上打字,如华硕Vivobook、惠普Pavilion 、联想IdeaPad,甚至是Razer Blade,那么你会对Gram 14T90P上的按键有多硬感到惊讶。然而,更坚硬的按键带来的后果是比平均水平更响亮的敲击声,使打字体验略显嘈杂。
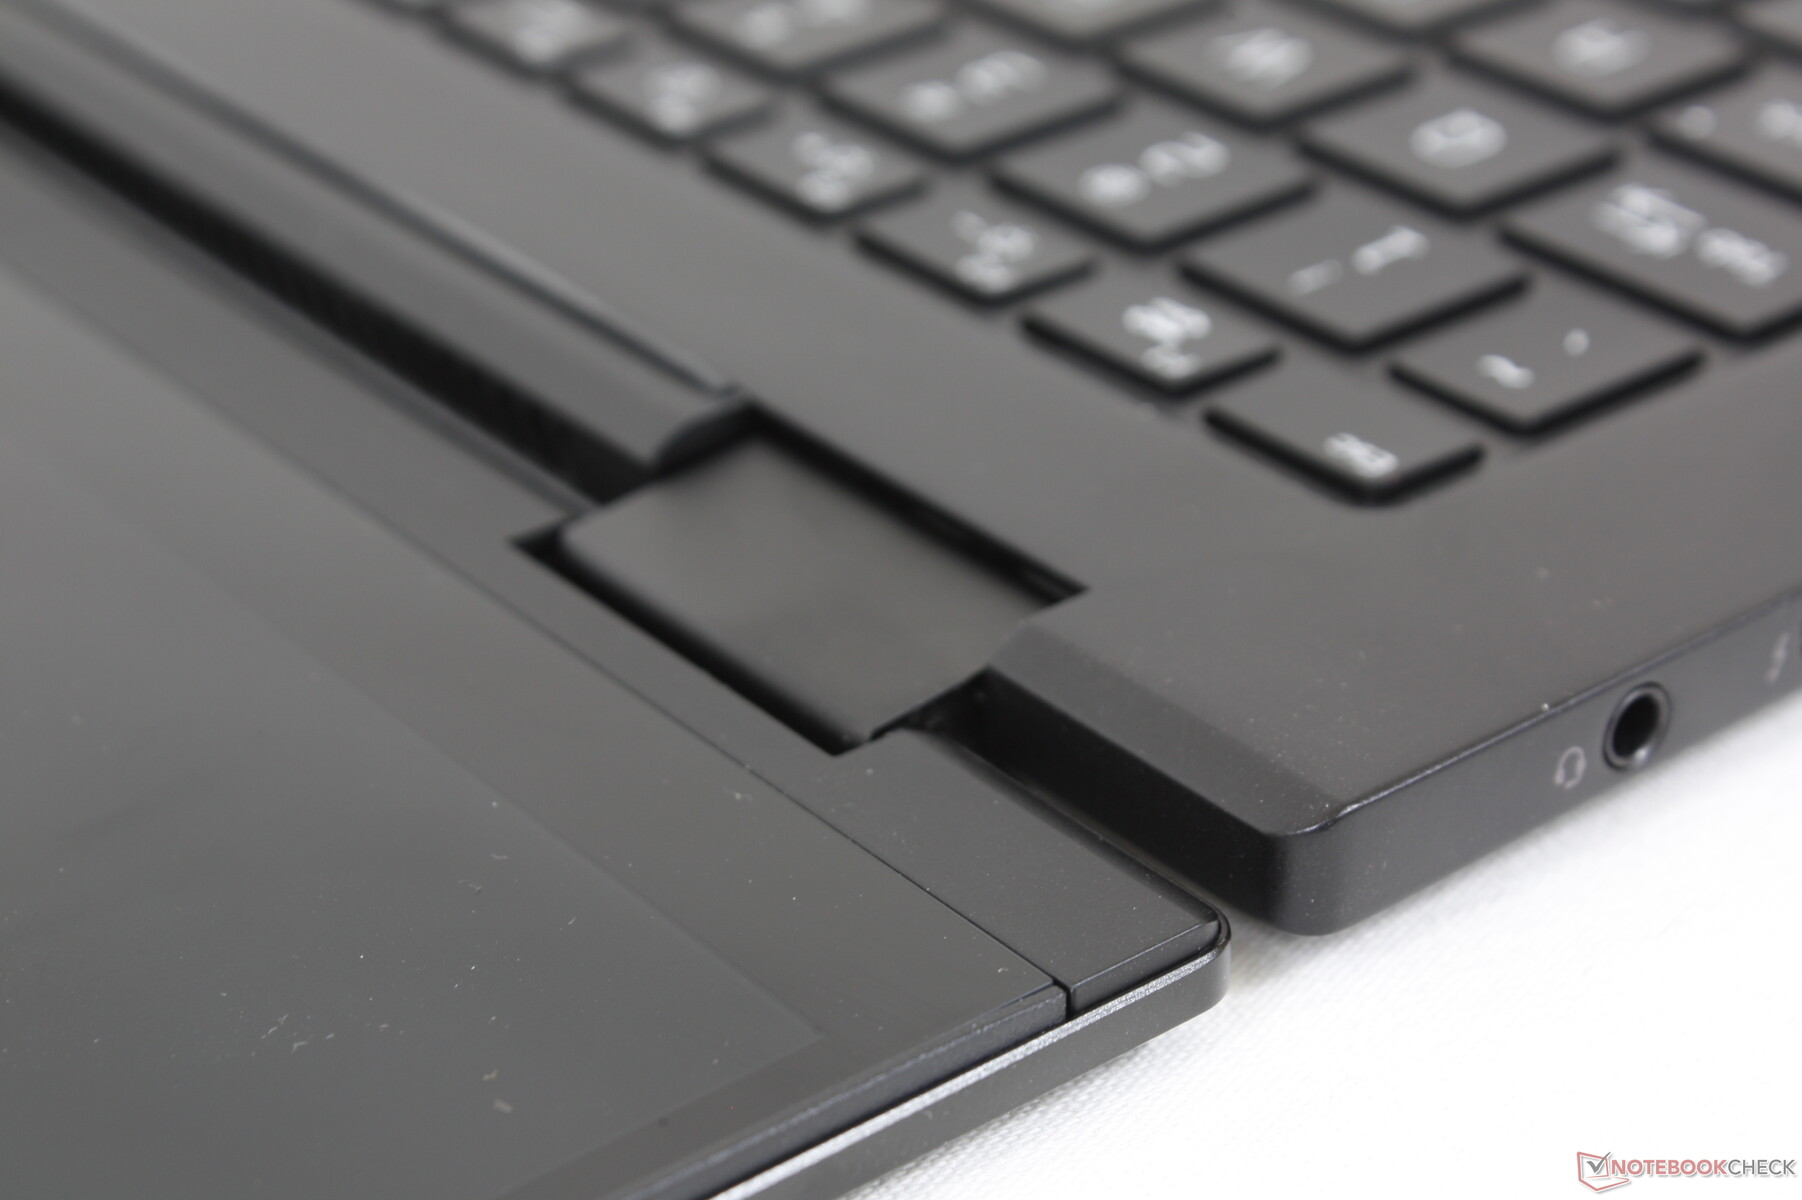
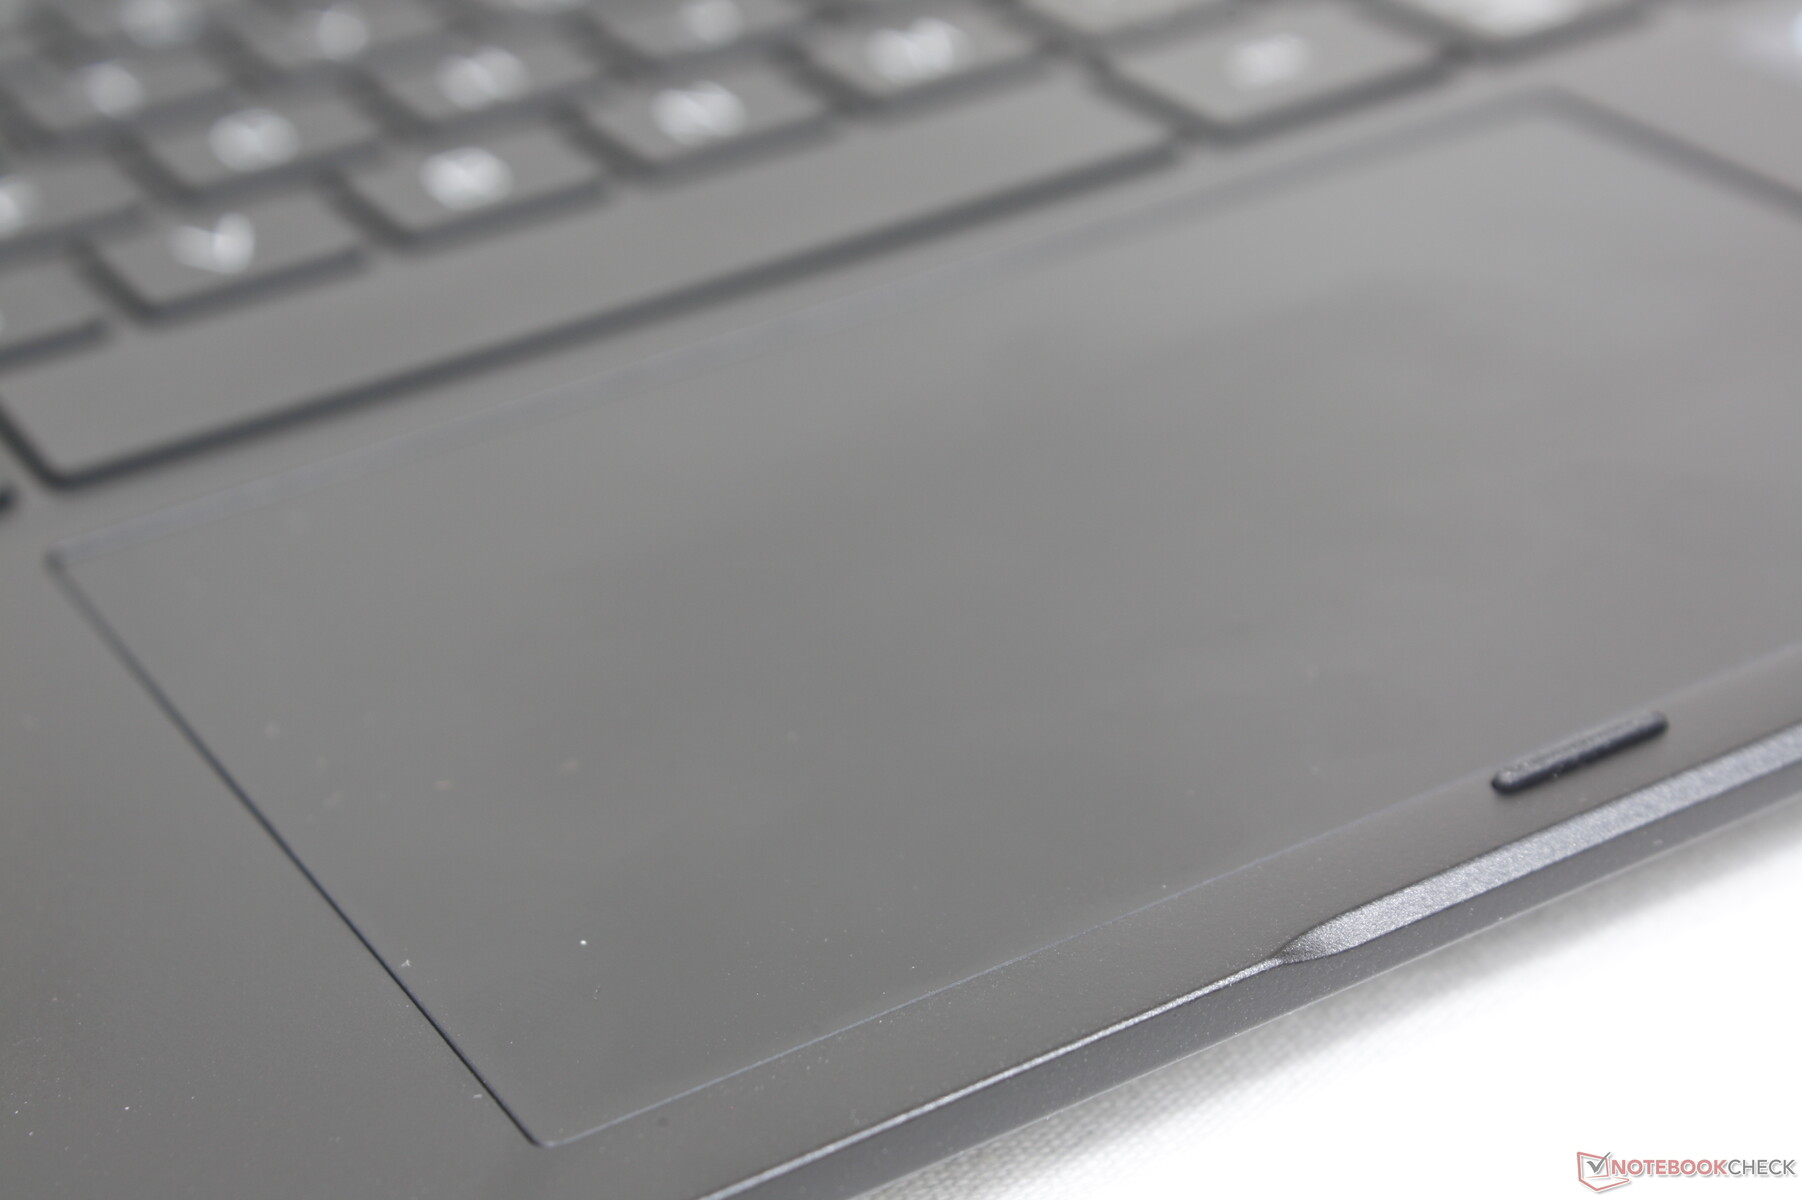
触摸板
与键盘相比,我们对点击板的印象不深。虽然它比Gram 14T90N上的点击板要大(11.3 x 7厘米,10.5 x 6.5厘米),可以更容易地进行光标控制和多点触摸输入,但点击的反馈太过柔和安静。更有力的反馈会使人感到更满意。

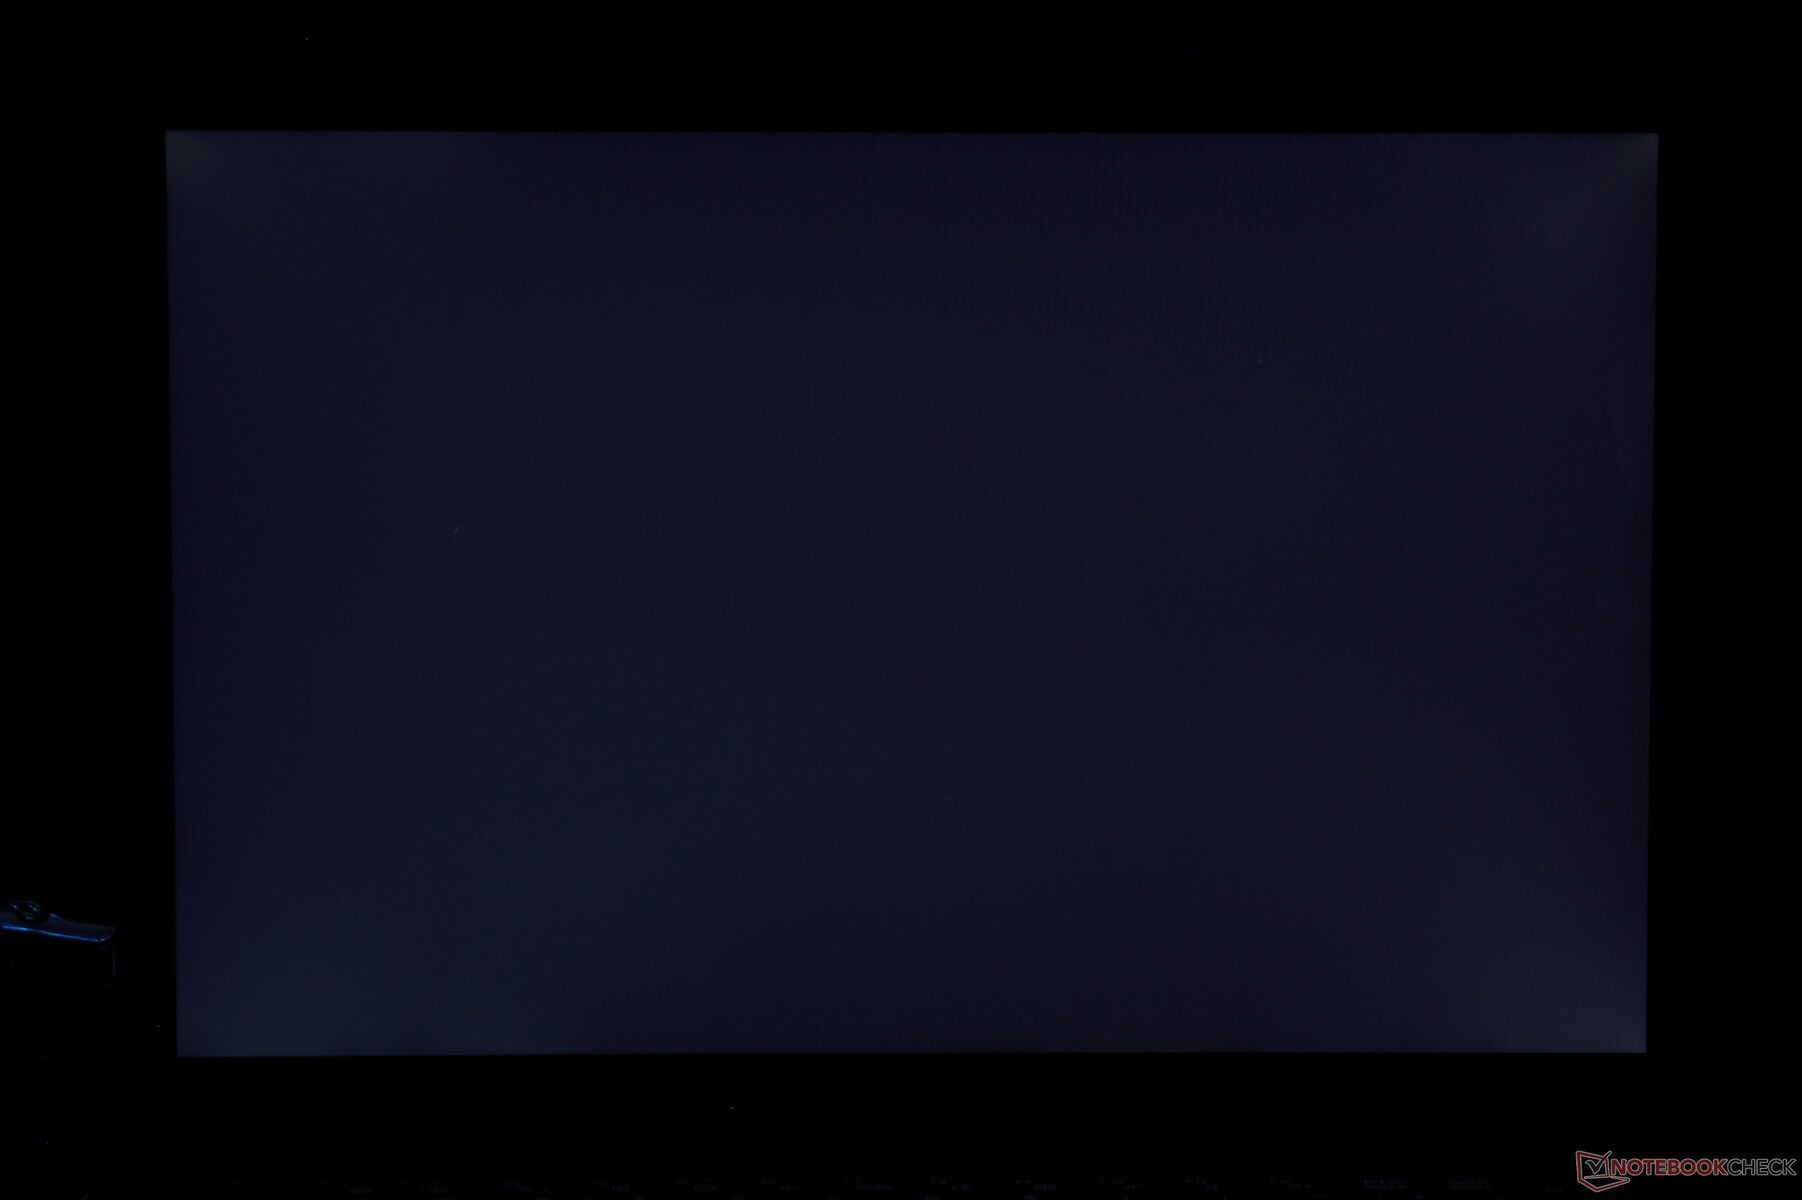
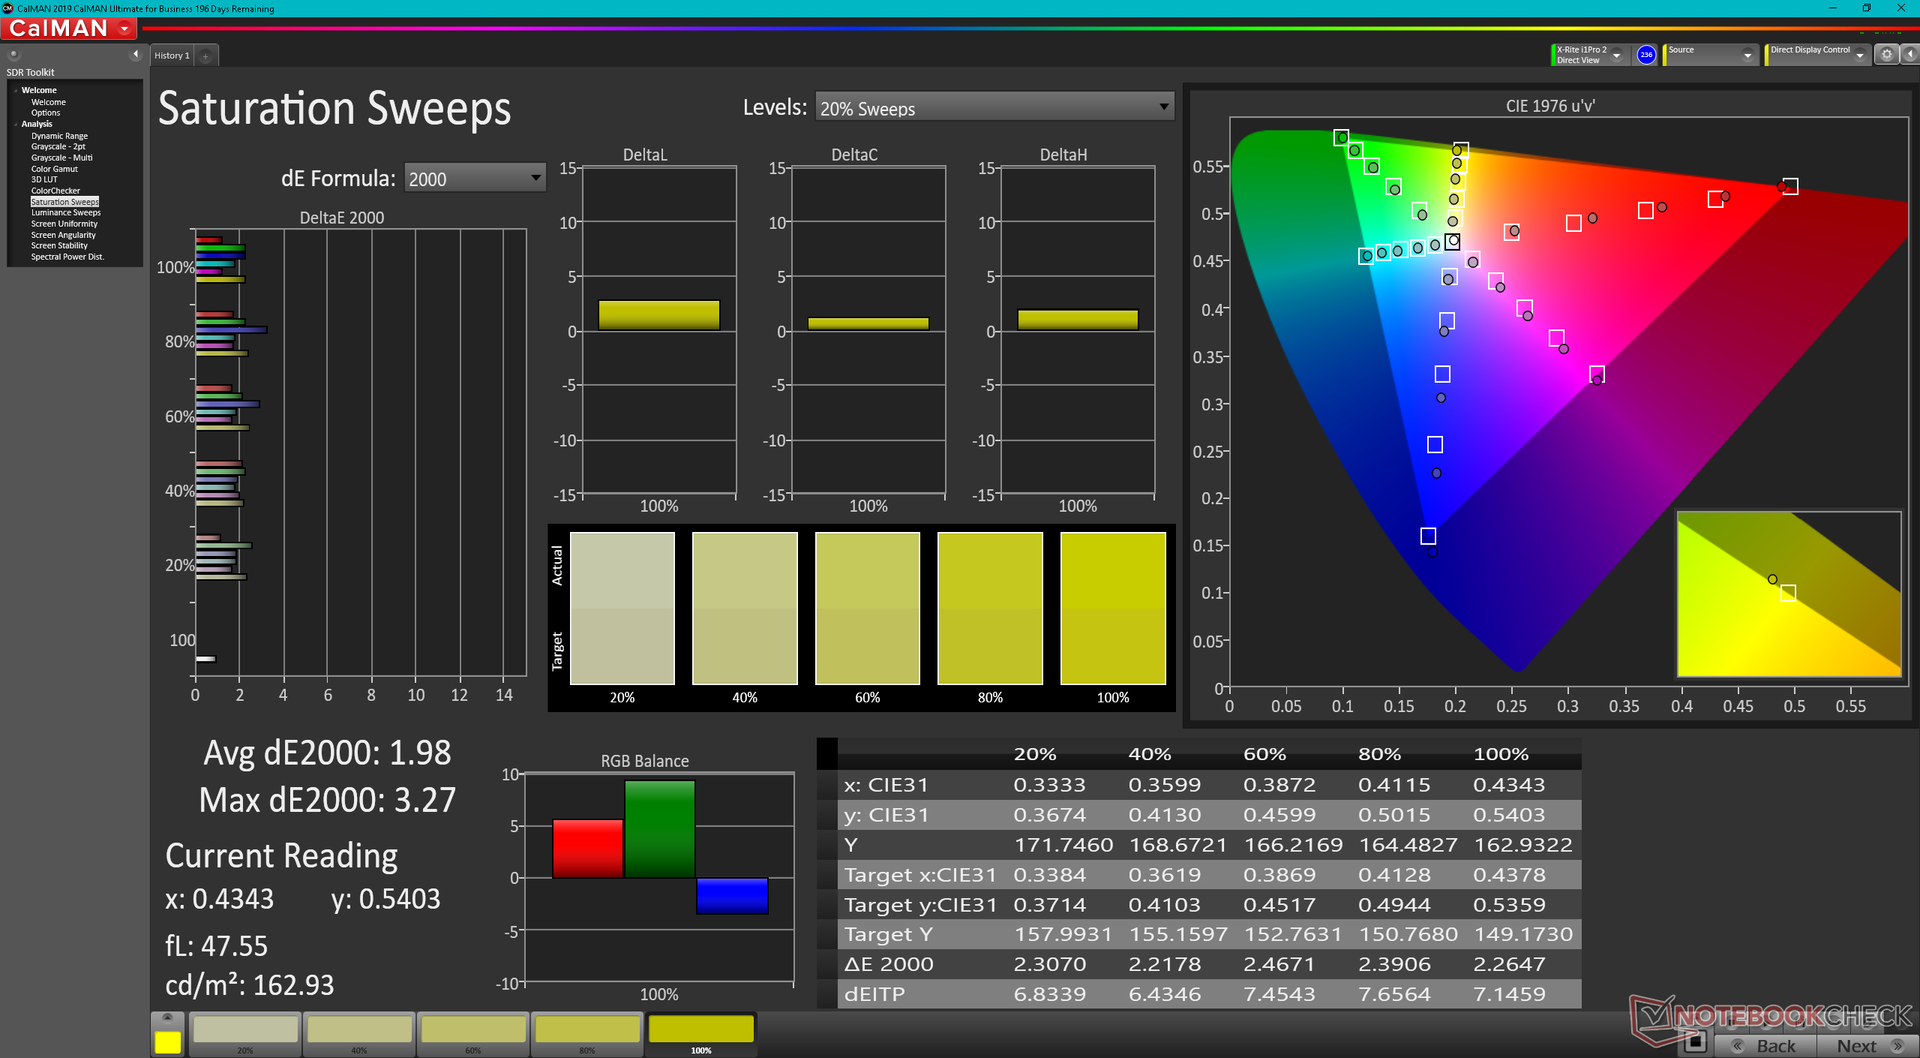
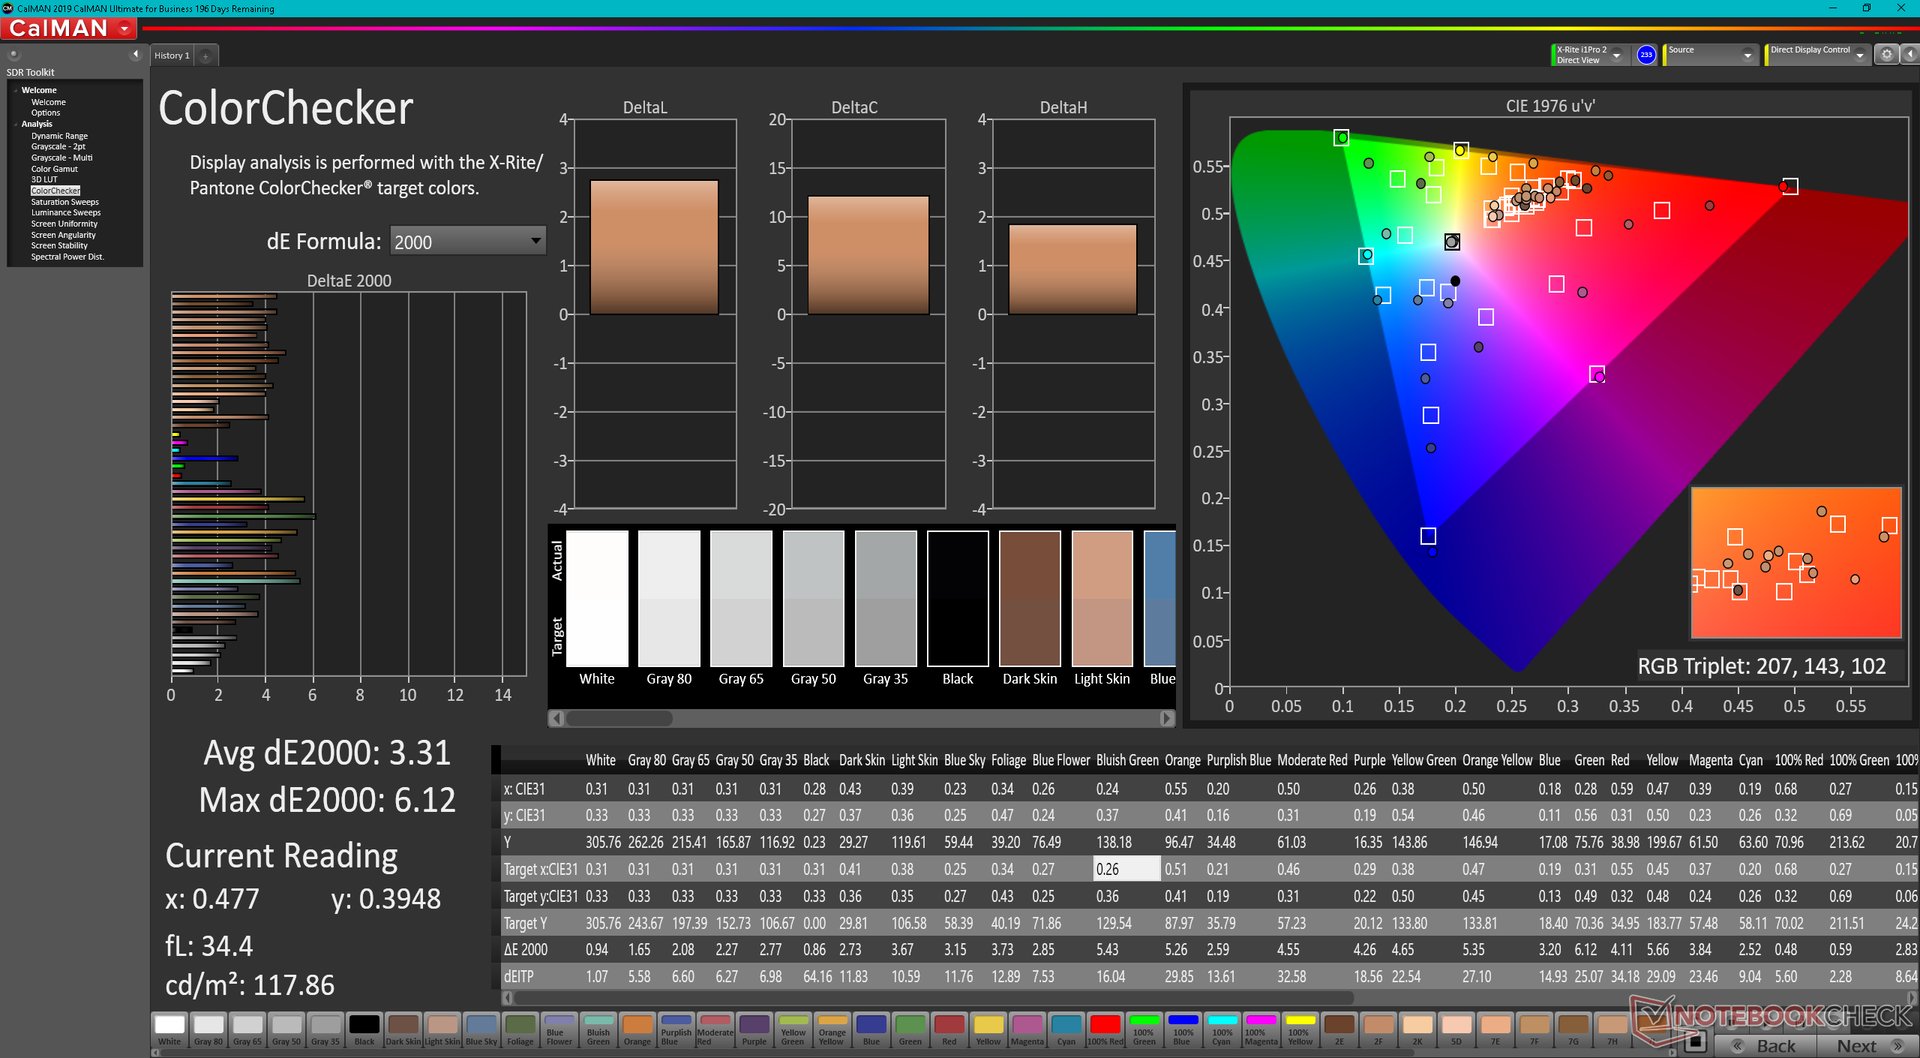
显示屏 - 锐利,颜色出色
LG Gram 14T90P使用相同的高品质的LG飞利浦LP140WU1-SPA1 IPS面板,因为发现在 格兰14Z90P.因此,色彩再现、响应时间和对比度等属性在它们之间基本相同,可以获得非常相似的观看体验。
与Gram 14T90N的显示屏相比,我们的Gram 14T90P提供了更深的色彩和稍快的黑白灰响应时间,而不影响亮度或对比度。即便如此,我们还是希望在未来看到OLED和/或90赫兹面板,因为这样的功能正在成为高端次笔记本的标准,比如竞争者的华硕Zenbook Flip 14.
| |||||||||||||||||||||||||
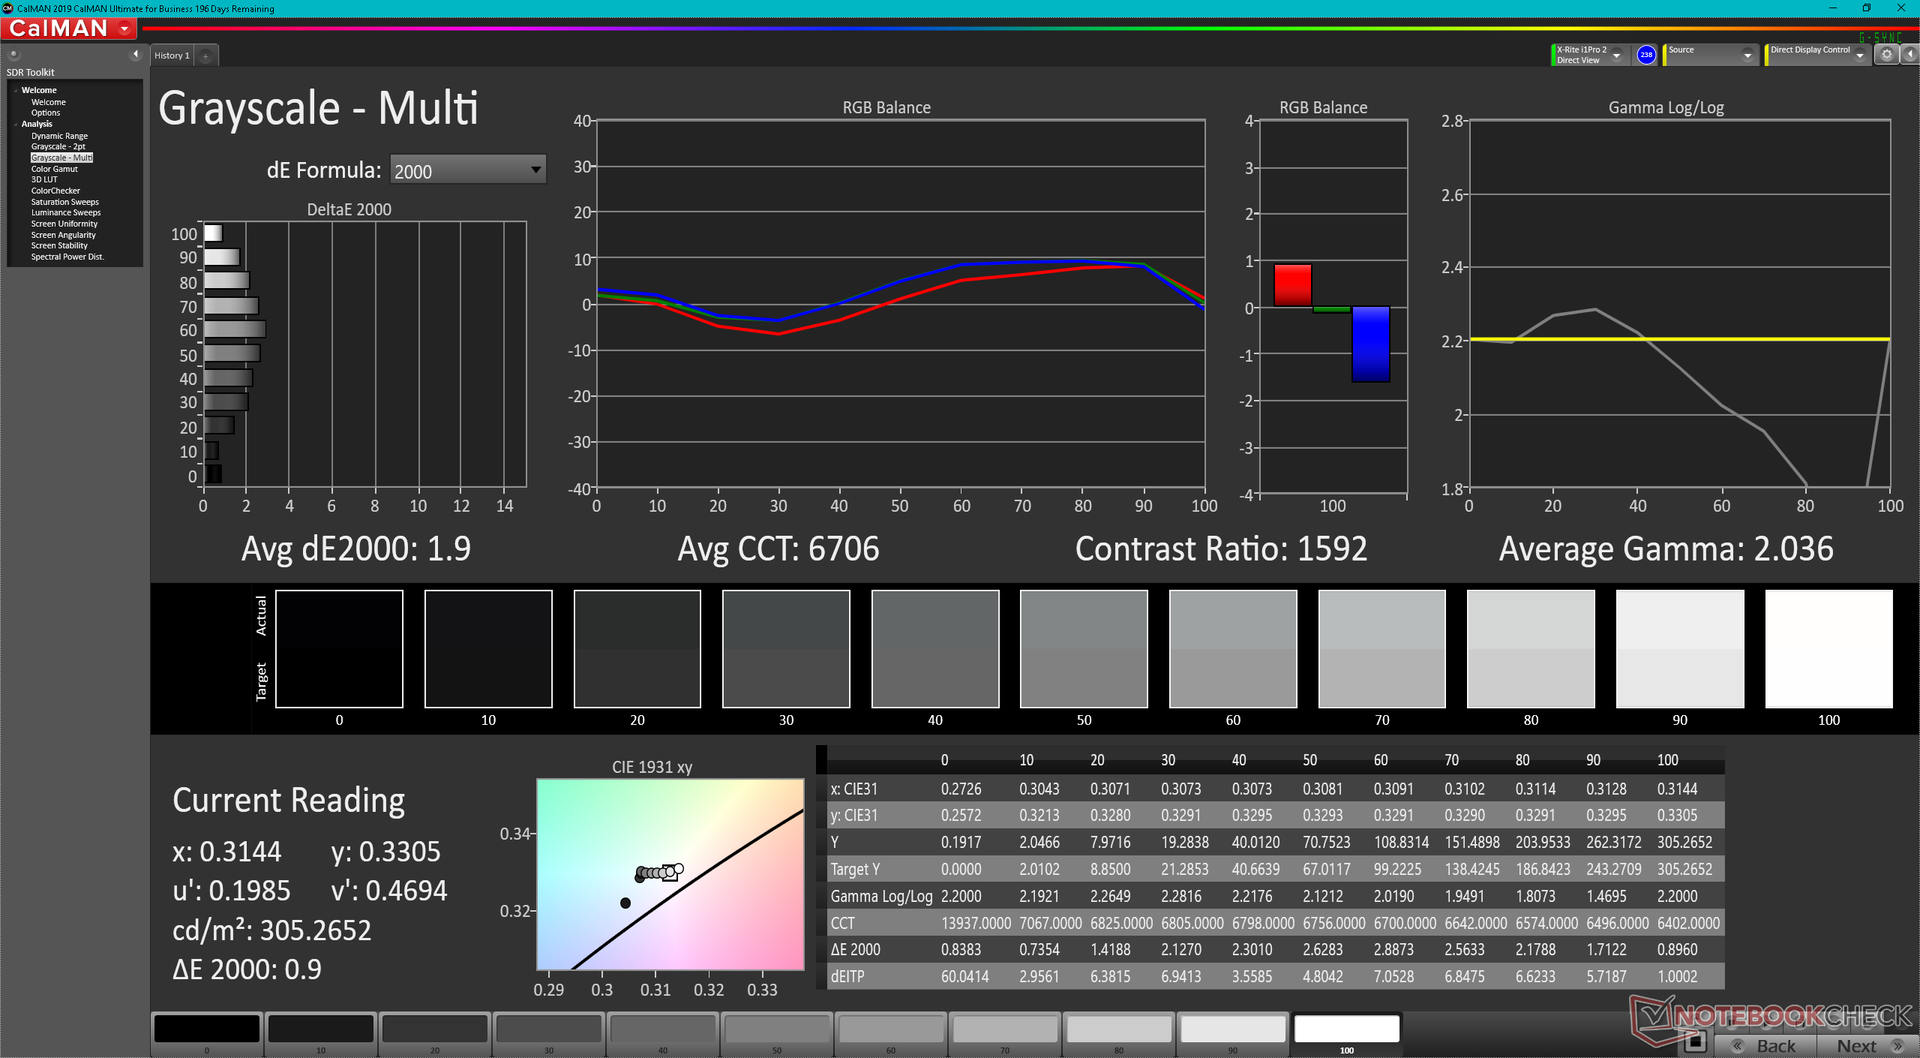
Brightness Distribution: 87 %
Center on Battery: 305.5 cd/m²
Contrast: 1131:1 (Black: 0.27 cd/m²)
ΔE ColorChecker Calman: 3.31 | ∀{0.5-29.43 Ø4.72}
ΔE Greyscale Calman: 1.9 | ∀{0.09-98 Ø4.97}
100% sRGB (Argyll 3D)
98.8% Display P3 (Argyll 3D)
Gamma: 2.04
CCT: 6706 K
| LG Gram 14T90P LG Philips LP140WU1-SPA1, IPS, 1900x1200, 14" | Dell XPS 13 9310 2-in-1 Sharp LQ134N1, IPS, 1920x1200, 13.4" | Lenovo Yoga 9 14IAP7 82LU0001US Lenovo LEN140WQ+, OLED, 2880x1800, 14" | Asus ZenBook Flip 14 UN5401QA-KN085W SDC4154, OLED, 2880x1800, 14" | HP Spectre x360 14-ea0378ng Samsung SDC4148, OLED, 3000x2000, 13.5" | MSI Summit E13 Flip Evo A11MT Sharp LQ134N1JW53, IPS, 1920x1200, 13.4" | LG Gram 14T90N LG Philips LP140WFA-SPY1, IPS, 1920x1080, 14" | |
|---|---|---|---|---|---|---|---|
| Display | -15% | 1% | 1% | 1% | -15% | -19% | |
| Display P3 Coverage (%) | 98.8 | 69.7 -29% | 99.8 1% | 99.7 1% | 99.9 1% | 69.8 -29% | 65 -34% |
| sRGB Coverage (%) | 100 | 99 -1% | 100 0% | 100 0% | 100 0% | 98.8 -1% | 95.7 -4% |
| AdobeRGB 1998 Coverage (%) | 71.7 | 98.7 | 98.6 | 96.1 | 70.6 | 66.7 | |
| Response Times | -31% | 97% | 94% | 94% | -46% | -16% | |
| Response Time Grey 50% / Grey 80% * (ms) | 44 ? | 55.6 ? -26% | 1.2 ? 97% | 2 ? 95% | 2 ? 95% | 64 ? -45% | 54 ? -23% |
| Response Time Black / White * (ms) | 30 ? | 40.4 ? -35% | 1.2 ? 96% | 2 ? 93% | 2 ? 93% | 44 ? -47% | 32.8 ? -9% |
| PWM Frequency (Hz) | 2500 ? | 347.2 ? | 250 ? | ||||
| Screen | -16% | -13% | 11% | 419% | 38% | -12% | |
| Brightness middle (cd/m²) | 305.5 | 555.7 82% | 367.3 20% | 366 20% | 370 21% | 551.3 80% | 322.2 5% |
| Brightness (cd/m²) | 289 | 528 83% | 369 28% | 369 28% | 374 29% | 517 79% | 301 4% |
| Brightness Distribution (%) | 87 | 90 3% | 97 11% | 96 10% | 90 3% | 91 5% | 86 -1% |
| Black Level * (cd/m²) | 0.27 | 0.35 -30% | 0.01 96% | 0.37 -37% | 0.25 7% | ||
| Contrast (:1) | 1131 | 1588 40% | 37000 3171% | 1490 32% | 1289 14% | ||
| Colorchecker dE 2000 * | 3.31 | 4.83 -46% | 5.2 -57% | 2.84 14% | 2.57 22% | 1.45 56% | 3.62 -9% |
| Colorchecker dE 2000 max. * | 6.12 | 8.46 -38% | 8.04 -31% | 5.29 14% | 4.52 26% | 2.86 53% | 6.9 -13% |
| Greyscale dE 2000 * | 1.9 | 6.1 -221% | 2.8 -47% | 2.32 -22% | 2.2 -16% | 1.3 32% | 3.9 -105% |
| Gamma | 2.04 108% | 1.98 111% | 2.21 100% | 2.44 90% | 2.36 93% | 2.14 103% | 2.43 91% |
| CCT | 6706 97% | 6686 97% | 5992 108% | 6170 105% | 6154 106% | 6580 99% | 6344 102% |
| Colorchecker dE 2000 calibrated * | 0.76 | 2.81 | 2.31 | 1.7 | 1.22 | ||
| Color Space (Percent of AdobeRGB 1998) (%) | 85.8 | 65 | 61.3 | ||||
| Color Space (Percent of sRGB) (%) | 100 | 99 | 95.6 | ||||
| Total Average (Program / Settings) | -21% /
-18% | 28% /
12% | 35% /
25% | 171% /
295% | -8% /
15% | -16% /
-14% |
* ... smaller is better
LG宣传DCI-P3的覆盖率为99%,我们可以用我们自己的X-Rite色度计确认这一点。奇怪的是,计算AdobeRGB的结果是有误差的,但覆盖率应该是非常相似的,约为99%。这是为数不多的14英寸16:10 IPS面板,提供与大多数OLED面板相似的色域。
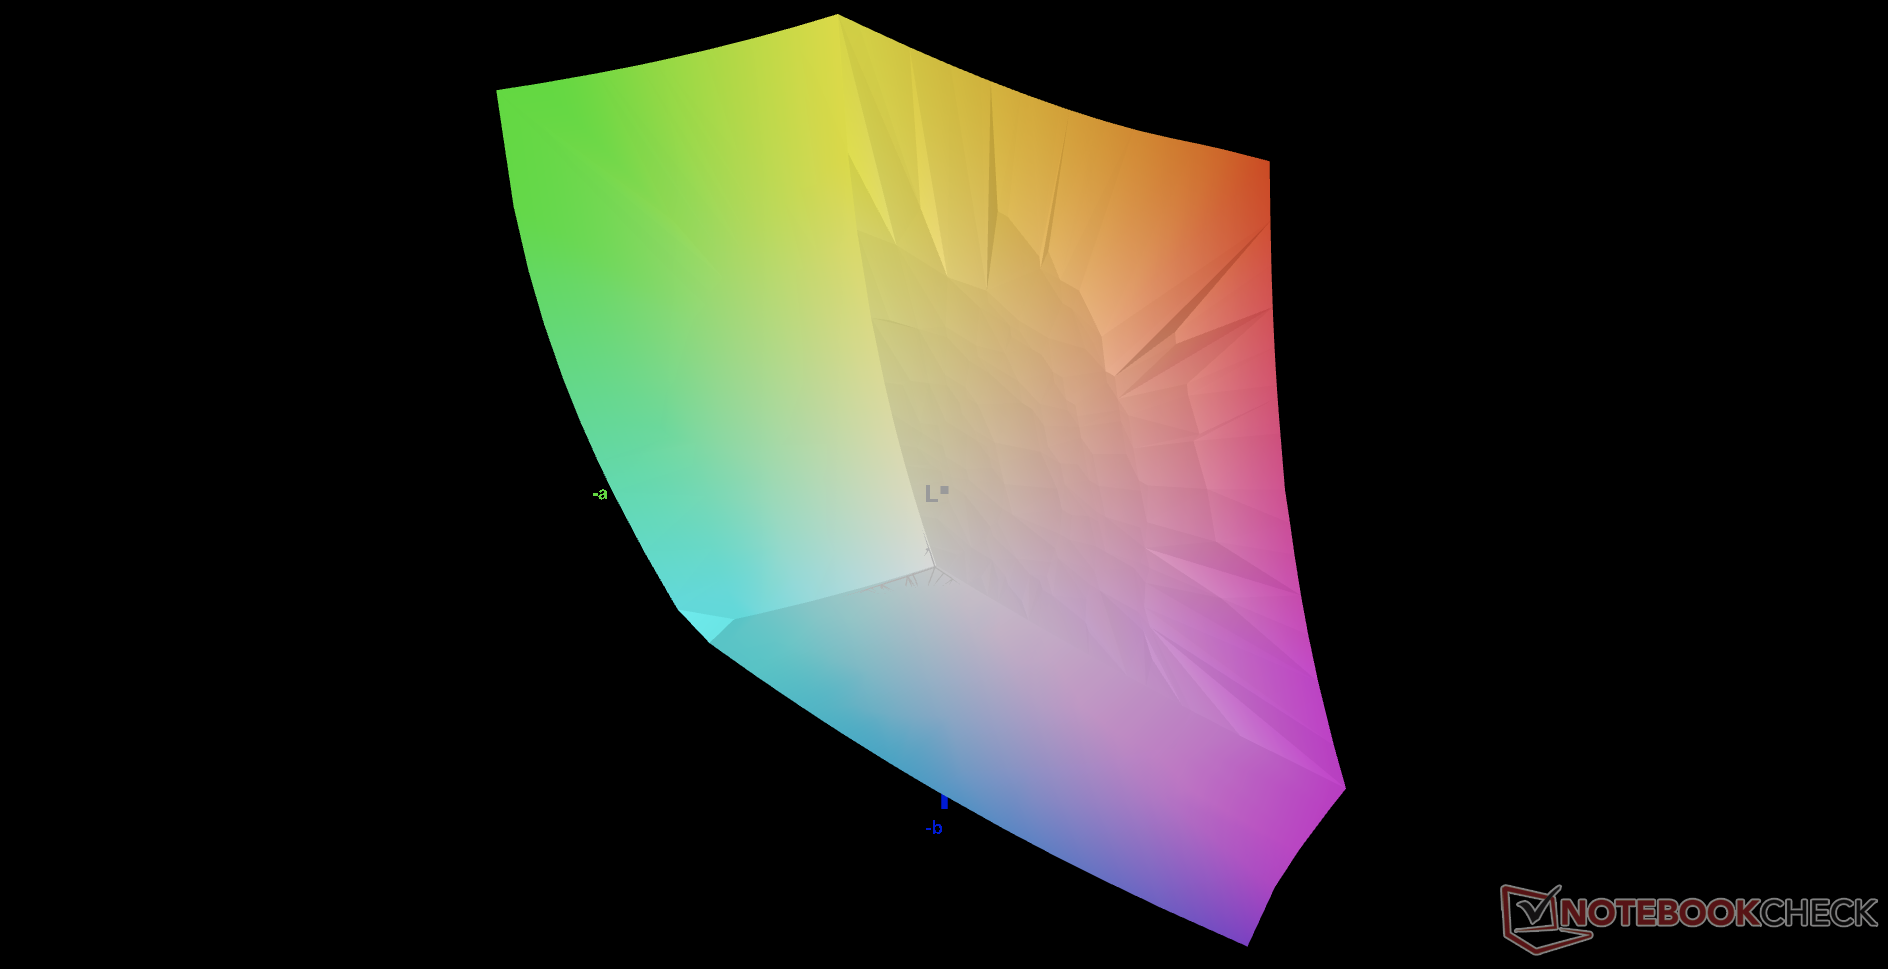
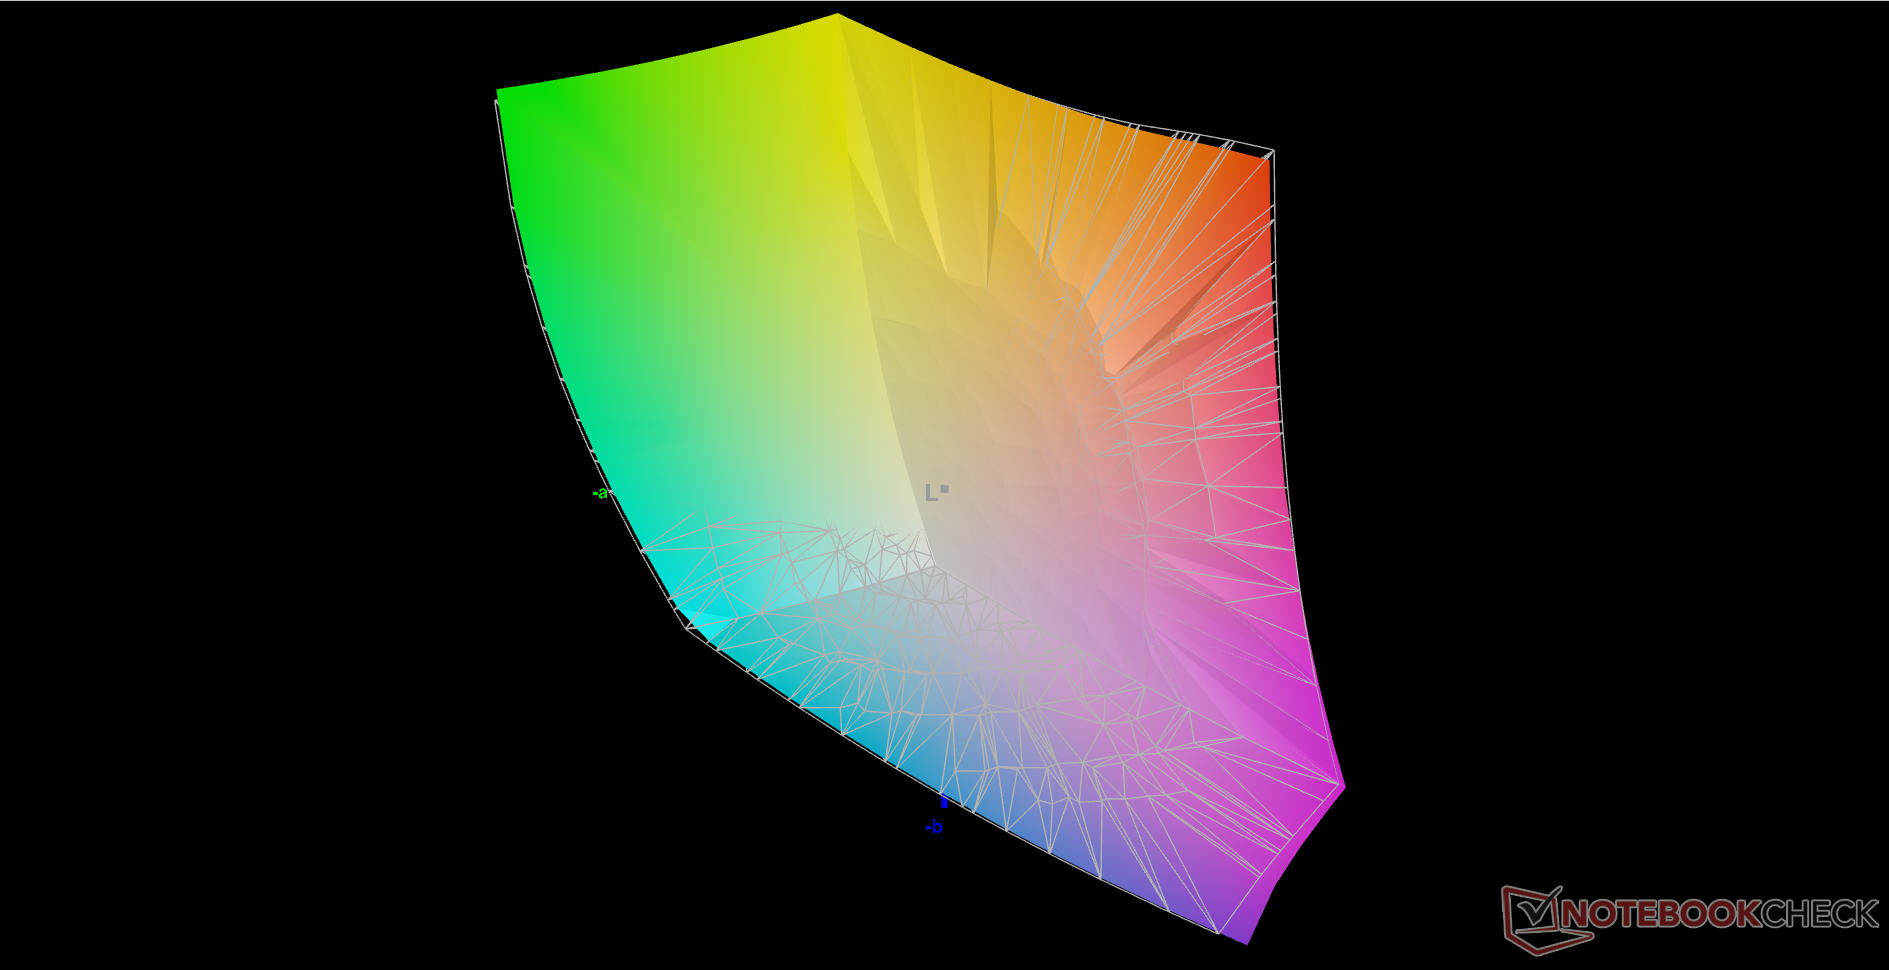
这款显示器开箱后的校准效果不错。平均灰度和ColorChecker DeltaE值分别为1.9和3.31。
Display Response Times
| ↔ Response Time Black to White | ||
|---|---|---|
| 30 ms ... rise ↗ and fall ↘ combined | ↗ 15.2 ms rise | 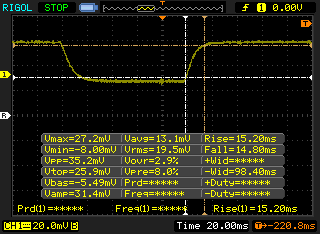 |
| ↘ 14.8 ms fall | ||
| The screen shows slow response rates in our tests and will be unsatisfactory for gamers. In comparison, all tested devices range from 0.1 (minimum) to 240 (maximum) ms. » 80 % of all devices are better. This means that the measured response time is worse than the average of all tested devices (19.8 ms). | ||
| ↔ Response Time 50% Grey to 80% Grey | ||
| 44 ms ... rise ↗ and fall ↘ combined | ↗ 21.2 ms rise | 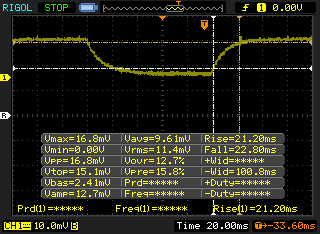 |
| ↘ 22.8 ms fall | ||
| The screen shows slow response rates in our tests and will be unsatisfactory for gamers. In comparison, all tested devices range from 0.165 (minimum) to 636 (maximum) ms. » 73 % of all devices are better. This means that the measured response time is worse than the average of all tested devices (31 ms). | ||
Screen Flickering / PWM (Pulse-Width Modulation)
| Screen flickering / PWM not detected |  | ||
In comparison: 52 % of all tested devices do not use PWM to dim the display. If PWM was detected, an average of 7769 (minimum: 5 - maximum: 343500) Hz was measured. | |||
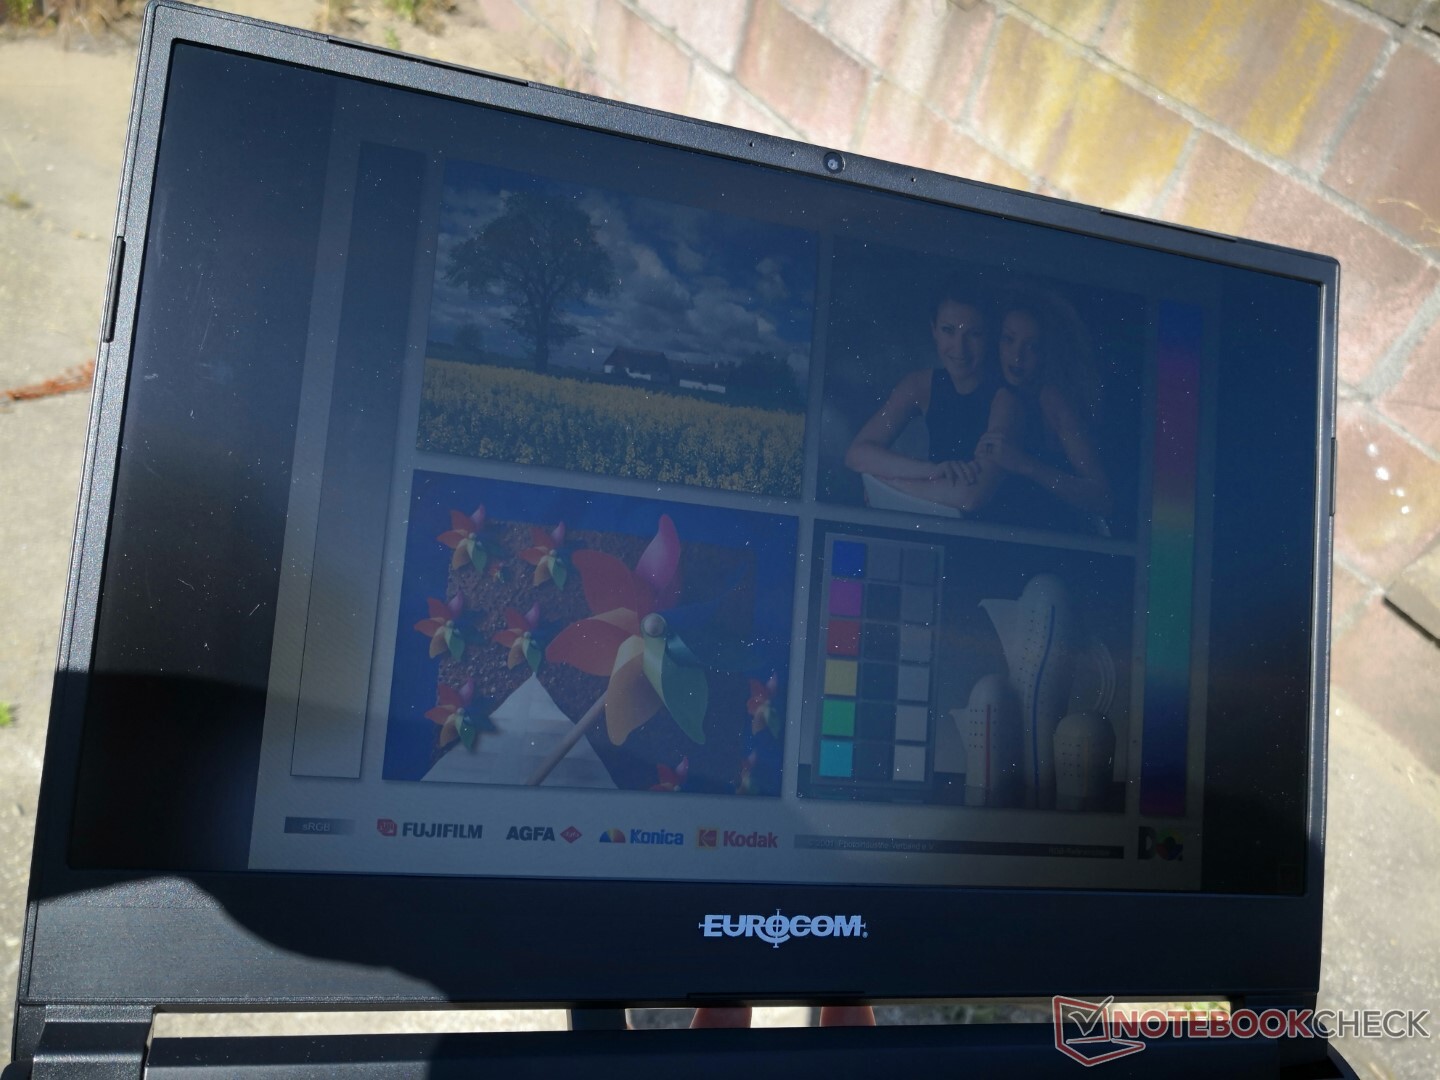
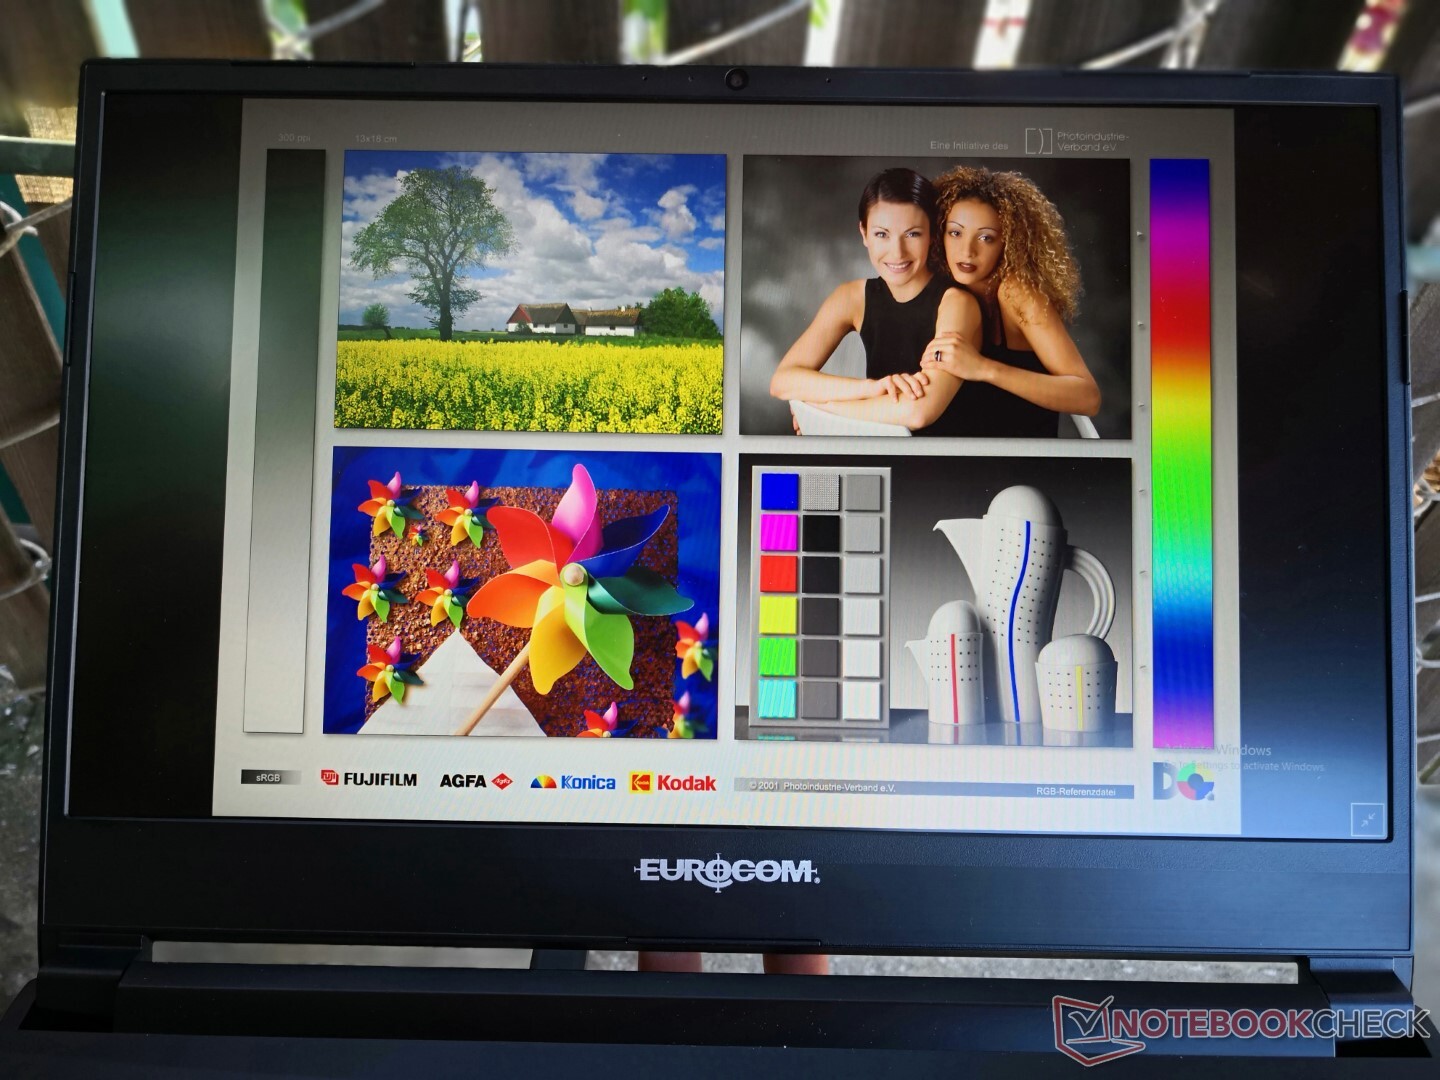
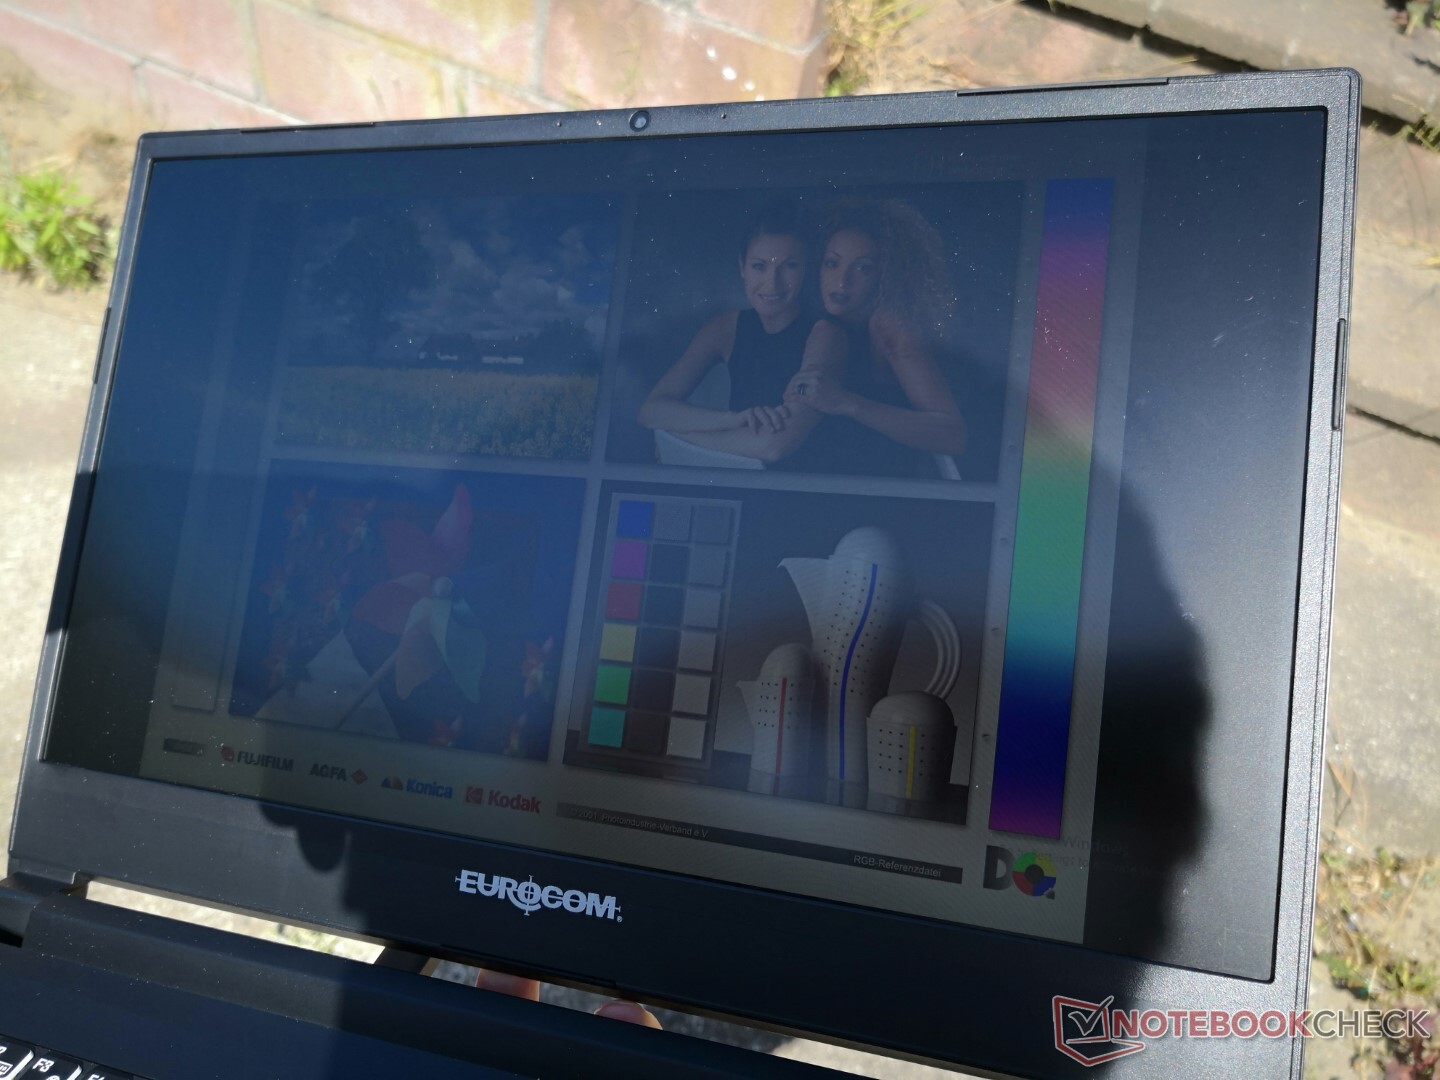
在300尼特的情况下,显示屏的亮度对于室内条件来说是足够的,但对于户外的舒适观看来说,还没有达到需要的程度。替代产品如戴尔XPS 13 9310二合一或微星Summit E13 Flip的显示屏要亮得多,每个都超过500尼特,在户外更容易观看。

性能 - 第11代英特尔
测试条件
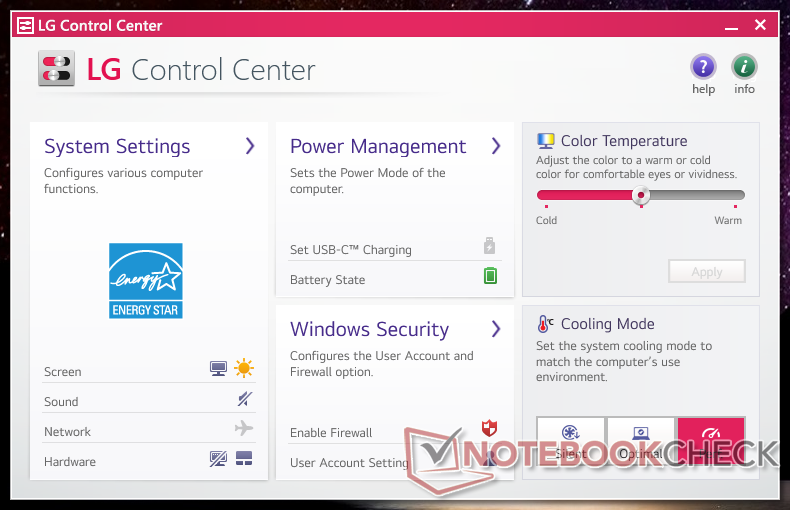
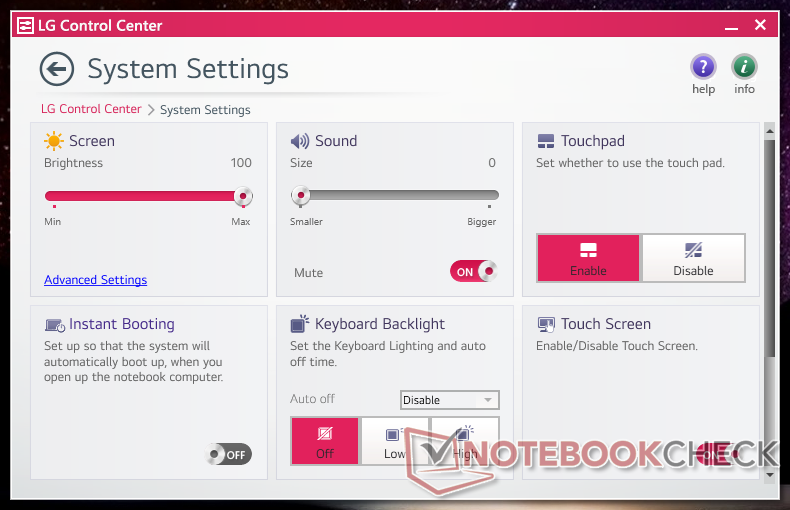
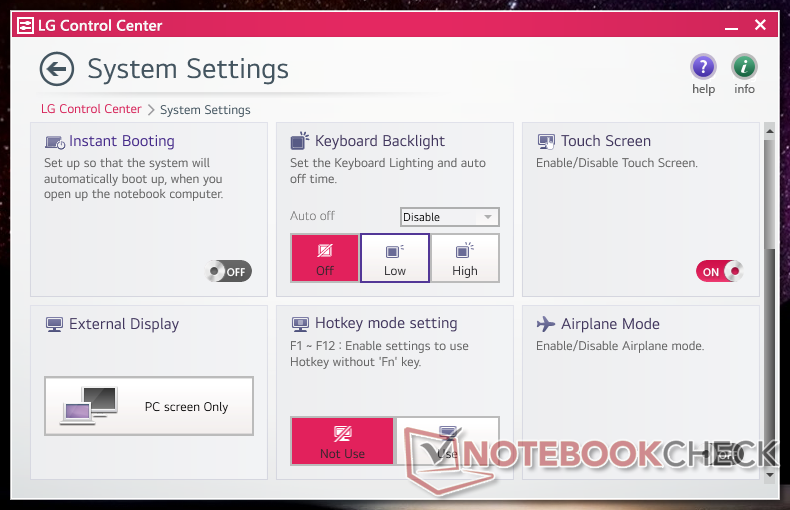
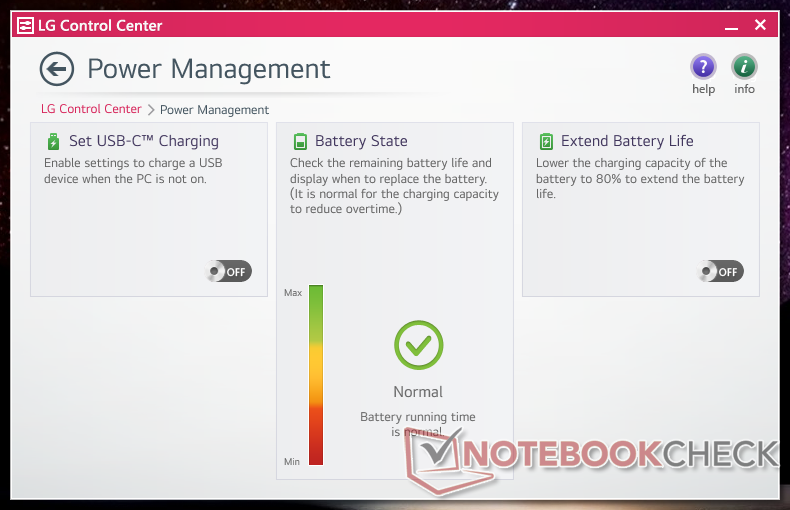
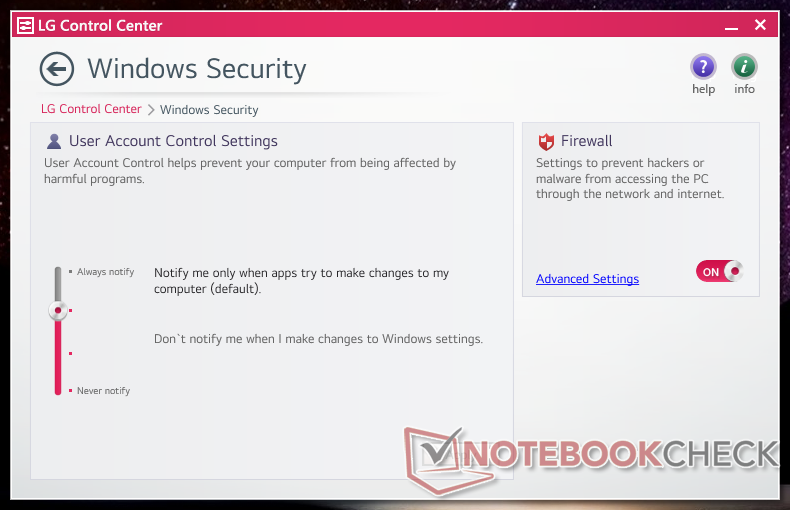
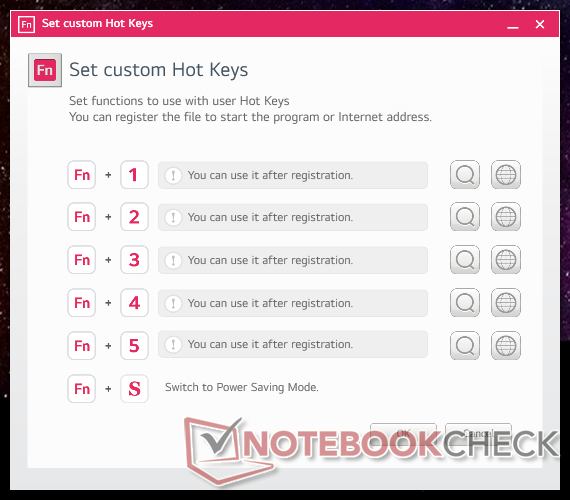
在运行任何性能基准测试之前,我们的设备被设置为性能模式,以获得尽可能高的分数。强烈建议熟悉预装的LG控制中心软件,因为关键设置和功能在这里切换,如下图所示。令人讨厌的是,该软件的用户界面非常小,而且不能被最大化。
请注意,每次重启或关机后,系统会自动重置为平衡模式,即使事先将电源配置文件设置为静音或性能。
处理器
CPU性能在我们数据库中配备相同的笔记本电脑的几个百分点之内。 酷睿i5-1135G7处理器。因此,性能并没有因为要适应超轻的可折叠机箱设计而被扼杀太多。升级到 酷睿i7-1165G7SKU有可能将多线程性能提高25%,但可能会少得多,因为我们配置中的Core i5已经可以达到90℃以上的温度。
Turbo Boost的可持续性很好,但并不完美。当循环运行CineBench R15 xT时,我们最初的796分最终会下降并稳定在大约666分,表示由于热限制,性能随时间下降了16%。这两台 戴尔Latitude 14和Acer Swift 3 SF314都能够持续更快地运行相同的处理器,正如我们下面的对比图所示。
Cinebench R15 Multi Loop
Cinebench R23: Multi Core | Single Core
Cinebench R15: CPU Multi 64Bit | CPU Single 64Bit
Blender: v2.79 BMW27 CPU
7-Zip 18.03: 7z b 4 | 7z b 4 -mmt1
Geekbench 5.5: Multi-Core | Single-Core
HWBOT x265 Benchmark v2.2: 4k Preset
LibreOffice : 20 Documents To PDF
R Benchmark 2.5: Overall mean
| Cinebench R20 / CPU (Multi Core) | |
| Asus ZenBook Flip 14 UN5401QA-KN085W | |
| Lenovo IdeaPad 5 Pro 14ACN6 | |
| Lenovo Yoga 9 14IAP7 82LU0001US | |
| Dell Inspiron 14 7400 7415 2-in-1 | |
| HP Pavilion Aero 13 be0097nr | |
| Asus ZenBook 14X OLED UX5400EA-L7154W | |
| MSI Summit E13 Flip Evo A11MT | |
| LG Gram 14T90P | |
| Average Intel Core i5-1135G7 (979 - 2382, n=62) | |
| Dell XPS 13 9310 2-in-1 | |
| Acer Spin 3 SP314-54N-56S5 | |
| Asus ZenBook 14 UX434FL-DB77 | |
| Infinix INBook X2 | |
| LG Gram 14T90N | |
| Cinebench R20 / CPU (Single Core) | |
| Lenovo Yoga 9 14IAP7 82LU0001US | |
| Asus ZenBook 14X OLED UX5400EA-L7154W | |
| MSI Summit E13 Flip Evo A11MT | |
| HP Pavilion Aero 13 be0097nr | |
| Asus ZenBook Flip 14 UN5401QA-KN085W | |
| Lenovo IdeaPad 5 Pro 14ACN6 | |
| LG Gram 14T90P | |
| Average Intel Core i5-1135G7 (375 - 527, n=62) | |
| Dell Inspiron 14 7400 7415 2-in-1 | |
| Dell XPS 13 9310 2-in-1 | |
| Asus ZenBook 14 UX434FL-DB77 | |
| Acer Spin 3 SP314-54N-56S5 | |
| Infinix INBook X2 | |
| LG Gram 14T90N | |
| Cinebench R23 / Multi Core | |
| Asus ZenBook Flip 14 UN5401QA-KN085W | |
| Lenovo IdeaPad 5 Pro 14ACN6 | |
| Lenovo Yoga 9 14IAP7 82LU0001US | |
| Dell Inspiron 14 7400 7415 2-in-1 | |
| HP Pavilion Aero 13 be0097nr | |
| Asus ZenBook 14X OLED UX5400EA-L7154W | |
| MSI Summit E13 Flip Evo A11MT | |
| Dell XPS 13 9310 2-in-1 | |
| LG Gram 14T90P | |
| Average Intel Core i5-1135G7 (2786 - 6136, n=55) | |
| Acer Spin 3 SP314-54N-56S5 | |
| Infinix INBook X2 | |
| Cinebench R23 / Single Core | |
| Lenovo Yoga 9 14IAP7 82LU0001US | |
| MSI Summit E13 Flip Evo A11MT | |
| Asus ZenBook 14X OLED UX5400EA-L7154W | |
| HP Pavilion Aero 13 be0097nr | |
| Asus ZenBook Flip 14 UN5401QA-KN085W | |
| Dell XPS 13 9310 2-in-1 | |
| LG Gram 14T90P | |
| Lenovo IdeaPad 5 Pro 14ACN6 | |
| Average Intel Core i5-1135G7 (1062 - 1373, n=53) | |
| Dell Inspiron 14 7400 7415 2-in-1 | |
| Acer Spin 3 SP314-54N-56S5 | |
| Infinix INBook X2 | |
| Cinebench R15 / CPU Multi 64Bit | |
| Asus ZenBook Flip 14 UN5401QA-KN085W | |
| Lenovo IdeaPad 5 Pro 14ACN6 | |
| Lenovo Yoga 9 14IAP7 82LU0001US | |
| HP Pavilion Aero 13 be0097nr | |
| Dell Inspiron 14 7400 7415 2-in-1 | |
| Asus ZenBook 14X OLED UX5400EA-L7154W | |
| MSI Summit E13 Flip Evo A11MT | |
| LG Gram 14T90P | |
| Average Intel Core i5-1135G7 (431 - 941, n=65) | |
| Dell XPS 13 9310 2-in-1 | |
| Asus ZenBook 14 UX434FL-DB77 | |
| Acer Spin 3 SP314-54N-56S5 | |
| Infinix INBook X2 | |
| LG Gram 14T90N | |
| Cinebench R15 / CPU Single 64Bit | |
| Lenovo Yoga 9 14IAP7 82LU0001US | |
| HP Pavilion Aero 13 be0097nr | |
| Asus ZenBook Flip 14 UN5401QA-KN085W | |
| Lenovo IdeaPad 5 Pro 14ACN6 | |
| MSI Summit E13 Flip Evo A11MT | |
| Asus ZenBook 14X OLED UX5400EA-L7154W | |
| Average Intel Core i5-1135G7 (141.4 - 205, n=61) | |
| Dell Inspiron 14 7400 7415 2-in-1 | |
| Asus ZenBook 14 UX434FL-DB77 | |
| Acer Spin 3 SP314-54N-56S5 | |
| Dell XPS 13 9310 2-in-1 | |
| LG Gram 14T90N | |
| Infinix INBook X2 | |
| LG Gram 14T90P | |
| Blender / v2.79 BMW27 CPU | |
| LG Gram 14T90N | |
| Infinix INBook X2 | |
| Acer Spin 3 SP314-54N-56S5 | |
| Asus ZenBook 14 UX434FL-DB77 | |
| Average Intel Core i5-1135G7 (499 - 1044, n=60) | |
| LG Gram 14T90P | |
| Dell XPS 13 9310 2-in-1 | |
| MSI Summit E13 Flip Evo A11MT | |
| Asus ZenBook 14X OLED UX5400EA-L7154W | |
| Dell Inspiron 14 7400 7415 2-in-1 | |
| Lenovo Yoga 9 14IAP7 82LU0001US | |
| HP Pavilion Aero 13 be0097nr | |
| Lenovo IdeaPad 5 Pro 14ACN6 | |
| Asus ZenBook Flip 14 UN5401QA-KN085W | |
| 7-Zip 18.03 / 7z b 4 | |
| Asus ZenBook Flip 14 UN5401QA-KN085W | |
| Lenovo Yoga 9 14IAP7 82LU0001US | |
| HP Pavilion Aero 13 be0097nr | |
| Lenovo IdeaPad 5 Pro 14ACN6 | |
| Dell Inspiron 14 7400 7415 2-in-1 | |
| Asus ZenBook 14X OLED UX5400EA-L7154W | |
| MSI Summit E13 Flip Evo A11MT | |
| Dell XPS 13 9310 2-in-1 | |
| LG Gram 14T90P | |
| Average Intel Core i5-1135G7 (14745 - 24873, n=62) | |
| Acer Spin 3 SP314-54N-56S5 | |
| Asus ZenBook 14 UX434FL-DB77 | |
| Infinix INBook X2 | |
| LG Gram 14T90N | |
| 7-Zip 18.03 / 7z b 4 -mmt1 | |
| HP Pavilion Aero 13 be0097nr | |
| Asus ZenBook Flip 14 UN5401QA-KN085W | |
| Lenovo IdeaPad 5 Pro 14ACN6 | |
| MSI Summit E13 Flip Evo A11MT | |
| Dell XPS 13 9310 2-in-1 | |
| Asus ZenBook 14X OLED UX5400EA-L7154W | |
| LG Gram 14T90P | |
| Lenovo Yoga 9 14IAP7 82LU0001US | |
| Average Intel Core i5-1135G7 (3924 - 4921, n=62) | |
| LG Gram 14T90N | |
| Dell Inspiron 14 7400 7415 2-in-1 | |
| Acer Spin 3 SP314-54N-56S5 | |
| Asus ZenBook 14 UX434FL-DB77 | |
| Infinix INBook X2 | |
| Geekbench 5.5 / Multi-Core | |
| Lenovo Yoga 9 14IAP7 82LU0001US | |
| Asus ZenBook Flip 14 UN5401QA-KN085W | |
| Asus ZenBook 14X OLED UX5400EA-L7154W | |
| Asus ZenBook 14X OLED UX5400EA-L7154W | |
| MSI Summit E13 Flip Evo A11MT | |
| LG Gram 14T90P | |
| Average Intel Core i5-1135G7 (3475 - 5472, n=58) | |
| Acer Spin 3 SP314-54N-56S5 | |
| LG Gram 14T90N | |
| Infinix INBook X2 | |
| Asus ZenBook 14 UX434FL-DB77 | |
| Geekbench 5.5 / Single-Core | |
| Lenovo Yoga 9 14IAP7 82LU0001US | |
| MSI Summit E13 Flip Evo A11MT | |
| Asus ZenBook 14X OLED UX5400EA-L7154W | |
| Asus ZenBook 14X OLED UX5400EA-L7154W | |
| LG Gram 14T90P | |
| Asus ZenBook Flip 14 UN5401QA-KN085W | |
| Average Intel Core i5-1135G7 (1147 - 1428, n=58) | |
| LG Gram 14T90N | |
| Acer Spin 3 SP314-54N-56S5 | |
| Infinix INBook X2 | |
| Asus ZenBook 14 UX434FL-DB77 | |
| HWBOT x265 Benchmark v2.2 / 4k Preset | |
| Asus ZenBook Flip 14 UN5401QA-KN085W | |
| Lenovo IdeaPad 5 Pro 14ACN6 | |
| Lenovo Yoga 9 14IAP7 82LU0001US | |
| HP Pavilion Aero 13 be0097nr | |
| Dell Inspiron 14 7400 7415 2-in-1 | |
| Asus ZenBook 14X OLED UX5400EA-L7154W | |
| MSI Summit E13 Flip Evo A11MT | |
| Dell XPS 13 9310 2-in-1 | |
| LG Gram 14T90P | |
| Average Intel Core i5-1135G7 (3.57 - 7.6, n=57) | |
| Asus ZenBook 14 UX434FL-DB77 | |
| Acer Spin 3 SP314-54N-56S5 | |
| Infinix INBook X2 | |
| LG Gram 14T90N | |
| LibreOffice / 20 Documents To PDF | |
| Asus ZenBook 14X OLED UX5400EA-L7154W | |
| Asus ZenBook 14 UX434FL-DB77 | |
| Infinix INBook X2 | |
| Dell Inspiron 14 7400 7415 2-in-1 | |
| LG Gram 14T90N | |
| Acer Spin 3 SP314-54N-56S5 | |
| Asus ZenBook Flip 14 UN5401QA-KN085W | |
| LG Gram 14T90P | |
| Lenovo IdeaPad 5 Pro 14ACN6 | |
| HP Pavilion Aero 13 be0097nr | |
| Average Intel Core i5-1135G7 (44.2 - 62.9, n=60) | |
| Lenovo Yoga 9 14IAP7 82LU0001US | |
| MSI Summit E13 Flip Evo A11MT | |
| R Benchmark 2.5 / Overall mean | |
| Asus ZenBook 14 UX434FL-DB77 | |
| Infinix INBook X2 | |
| Acer Spin 3 SP314-54N-56S5 | |
| LG Gram 14T90N | |
| Average Intel Core i5-1135G7 (0.619 - 0.727, n=59) | |
| LG Gram 14T90P | |
| Asus ZenBook 14X OLED UX5400EA-L7154W | |
| Dell XPS 13 9310 2-in-1 | |
| Dell Inspiron 14 7400 7415 2-in-1 | |
| MSI Summit E13 Flip Evo A11MT | |
| Asus ZenBook Flip 14 UN5401QA-KN085W | |
| Lenovo IdeaPad 5 Pro 14ACN6 | |
| HP Pavilion Aero 13 be0097nr | |
| Lenovo Yoga 9 14IAP7 82LU0001US | |
Cinebench R23: Multi Core | Single Core
Cinebench R15: CPU Multi 64Bit | CPU Single 64Bit
Blender: v2.79 BMW27 CPU
7-Zip 18.03: 7z b 4 | 7z b 4 -mmt1
Geekbench 5.5: Multi-Core | Single-Core
HWBOT x265 Benchmark v2.2: 4k Preset
LibreOffice : 20 Documents To PDF
R Benchmark 2.5: Overall mean
* ... smaller is better
AIDA64: FP32 Ray-Trace | FPU Julia | CPU SHA3 | CPU Queen | FPU SinJulia | FPU Mandel | CPU AES | CPU ZLib | FP64 Ray-Trace | CPU PhotoWorxx
| Performance rating | |
| Asus ZenBook Flip 14 UN5401QA-KN085W | |
| Lenovo Yoga 9 14IAP7 82LU0001US | |
| MSI Summit E13 Flip Evo A11MT | |
| LG Gram 14T90P | |
| Dell XPS 13 9310 2-in-1 | |
| Average Intel Core i5-1135G7 | |
| HP Spectre x360 14-ea0378ng | |
| AIDA64 / FP32 Ray-Trace | |
| Asus ZenBook Flip 14 UN5401QA-KN085W | |
| MSI Summit E13 Flip Evo A11MT | |
| LG Gram 14T90P | |
| Dell XPS 13 9310 2-in-1 | |
| Average Intel Core i5-1135G7 (4313 - 7952, n=45) | |
| Lenovo Yoga 9 14IAP7 82LU0001US | |
| HP Spectre x360 14-ea0378ng | |
| AIDA64 / FPU Julia | |
| Asus ZenBook Flip 14 UN5401QA-KN085W | |
| MSI Summit E13 Flip Evo A11MT | |
| Dell XPS 13 9310 2-in-1 | |
| LG Gram 14T90P | |
| Average Intel Core i5-1135G7 (19402 - 32283, n=45) | |
| Lenovo Yoga 9 14IAP7 82LU0001US | |
| HP Spectre x360 14-ea0378ng | |
| AIDA64 / CPU SHA3 | |
| Asus ZenBook Flip 14 UN5401QA-KN085W | |
| MSI Summit E13 Flip Evo A11MT | |
| Dell XPS 13 9310 2-in-1 | |
| LG Gram 14T90P | |
| Lenovo Yoga 9 14IAP7 82LU0001US | |
| Average Intel Core i5-1135G7 (1316 - 2172, n=45) | |
| HP Spectre x360 14-ea0378ng | |
| AIDA64 / CPU Queen | |
| Asus ZenBook Flip 14 UN5401QA-KN085W | |
| Lenovo Yoga 9 14IAP7 82LU0001US | |
| MSI Summit E13 Flip Evo A11MT | |
| HP Spectre x360 14-ea0378ng | |
| Dell XPS 13 9310 2-in-1 | |
| LG Gram 14T90P | |
| Average Intel Core i5-1135G7 (39000 - 46951, n=45) | |
| AIDA64 / FPU SinJulia | |
| Asus ZenBook Flip 14 UN5401QA-KN085W | |
| Lenovo Yoga 9 14IAP7 82LU0001US | |
| MSI Summit E13 Flip Evo A11MT | |
| LG Gram 14T90P | |
| Dell XPS 13 9310 2-in-1 | |
| Average Intel Core i5-1135G7 (3497 - 4445, n=45) | |
| HP Spectre x360 14-ea0378ng | |
| AIDA64 / FPU Mandel | |
| Asus ZenBook Flip 14 UN5401QA-KN085W | |
| MSI Summit E13 Flip Evo A11MT | |
| Dell XPS 13 9310 2-in-1 | |
| LG Gram 14T90P | |
| Average Intel Core i5-1135G7 (12569 - 19635, n=45) | |
| Lenovo Yoga 9 14IAP7 82LU0001US | |
| HP Spectre x360 14-ea0378ng | |
| AIDA64 / CPU AES | |
| Asus ZenBook Flip 14 UN5401QA-KN085W | |
| MSI Summit E13 Flip Evo A11MT | |
| Dell XPS 13 9310 2-in-1 | |
| LG Gram 14T90P | |
| Average Intel Core i5-1135G7 (28988 - 67977, n=45) | |
| HP Spectre x360 14-ea0378ng | |
| Lenovo Yoga 9 14IAP7 82LU0001US | |
| AIDA64 / CPU ZLib | |
| Asus ZenBook Flip 14 UN5401QA-KN085W | |
| Lenovo Yoga 9 14IAP7 82LU0001US | |
| MSI Summit E13 Flip Evo A11MT | |
| LG Gram 14T90P | |
| Dell XPS 13 9310 2-in-1 | |
| Average Intel Core i5-1135G7 (265 - 373, n=51) | |
| HP Spectre x360 14-ea0378ng | |
| AIDA64 / FP64 Ray-Trace | |
| Asus ZenBook Flip 14 UN5401QA-KN085W | |
| MSI Summit E13 Flip Evo A11MT | |
| LG Gram 14T90P | |
| Dell XPS 13 9310 2-in-1 | |
| Average Intel Core i5-1135G7 (2226 - 4291, n=45) | |
| Lenovo Yoga 9 14IAP7 82LU0001US | |
| HP Spectre x360 14-ea0378ng | |
| AIDA64 / CPU PhotoWorxx | |
| Lenovo Yoga 9 14IAP7 82LU0001US | |
| LG Gram 14T90P | |
| MSI Summit E13 Flip Evo A11MT | |
| Dell XPS 13 9310 2-in-1 | |
| HP Spectre x360 14-ea0378ng | |
| Average Intel Core i5-1135G7 (9004 - 45366, n=45) | |
| Asus ZenBook Flip 14 UN5401QA-KN085W | |
系统性能
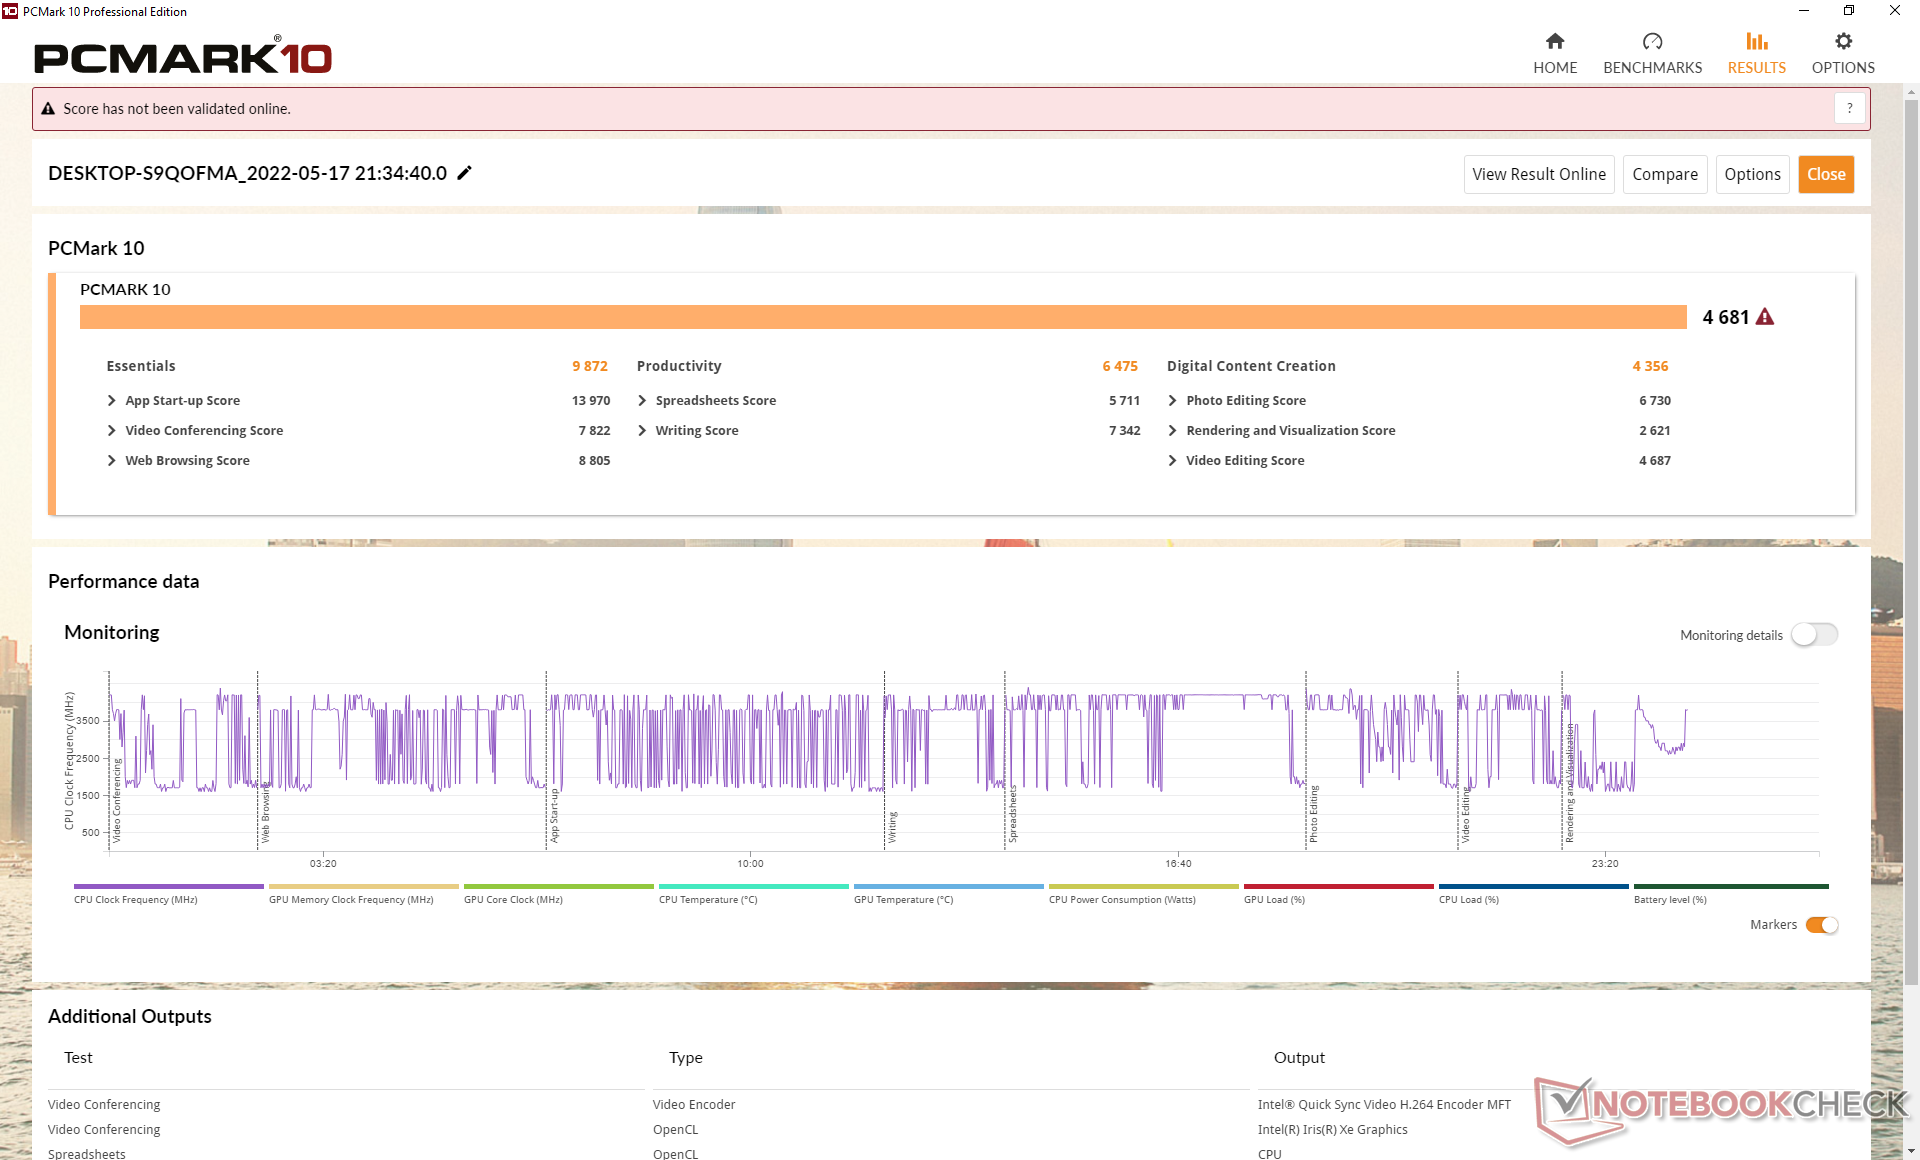
PCMark 10的结果普遍高于老款Gram 14T90N,特别是在数字内容创作分测试中,GPU的性能得到了青睐。然而,我们的生产力得分却较低,原因不明。
CrossMark: Overall | Productivity | Creativity | Responsiveness
| PCMark 10 / Score | |
| Asus ZenBook Flip 14 UN5401QA-KN085W | |
| Lenovo Yoga 9 14IAP7 82LU0001US | |
| Dell XPS 13 9310 2-in-1 | |
| MSI Summit E13 Flip Evo A11MT | |
| LG Gram 14T90P | |
| Average Intel Core i5-1135G7, Intel Iris Xe Graphics G7 80EUs (4026 - 4952, n=53) | |
| HP Spectre x360 14-ea0378ng | |
| LG Gram 14T90N | |
| PCMark 10 / Essentials | |
| Lenovo Yoga 9 14IAP7 82LU0001US | |
| Dell XPS 13 9310 2-in-1 | |
| Asus ZenBook Flip 14 UN5401QA-KN085W | |
| LG Gram 14T90P | |
| HP Spectre x360 14-ea0378ng | |
| Average Intel Core i5-1135G7, Intel Iris Xe Graphics G7 80EUs (8149 - 9917, n=53) | |
| LG Gram 14T90N | |
| MSI Summit E13 Flip Evo A11MT | |
| PCMark 10 / Productivity | |
| Asus ZenBook Flip 14 UN5401QA-KN085W | |
| LG Gram 14T90N | |
| MSI Summit E13 Flip Evo A11MT | |
| Dell XPS 13 9310 2-in-1 | |
| LG Gram 14T90P | |
| Lenovo Yoga 9 14IAP7 82LU0001US | |
| HP Spectre x360 14-ea0378ng | |
| Average Intel Core i5-1135G7, Intel Iris Xe Graphics G7 80EUs (5040 - 6619, n=53) | |
| PCMark 10 / Digital Content Creation | |
| Lenovo Yoga 9 14IAP7 82LU0001US | |
| Asus ZenBook Flip 14 UN5401QA-KN085W | |
| Dell XPS 13 9310 2-in-1 | |
| MSI Summit E13 Flip Evo A11MT | |
| Average Intel Core i5-1135G7, Intel Iris Xe Graphics G7 80EUs (3548 - 5255, n=53) | |
| LG Gram 14T90P | |
| HP Spectre x360 14-ea0378ng | |
| LG Gram 14T90N | |
| CrossMark / Overall | |
| Lenovo Yoga 9 14IAP7 82LU0001US | |
| LG Gram 14T90P | |
| Average Intel Core i5-1135G7, Intel Iris Xe Graphics G7 80EUs (1058 - 1293, n=11) | |
| CrossMark / Productivity | |
| Lenovo Yoga 9 14IAP7 82LU0001US | |
| LG Gram 14T90P | |
| Average Intel Core i5-1135G7, Intel Iris Xe Graphics G7 80EUs (1148 - 1332, n=11) | |
| CrossMark / Creativity | |
| Lenovo Yoga 9 14IAP7 82LU0001US | |
| LG Gram 14T90P | |
| Average Intel Core i5-1135G7, Intel Iris Xe Graphics G7 80EUs (895 - 1263, n=11) | |
| CrossMark / Responsiveness | |
| Lenovo Yoga 9 14IAP7 82LU0001US | |
| LG Gram 14T90P | |
| Average Intel Core i5-1135G7, Intel Iris Xe Graphics G7 80EUs (923 - 1320, n=11) | |
| PCMark 10 Score | 4681 points | |
Help | ||
| AIDA64 / Memory Copy | |
| Lenovo Yoga 9 14IAP7 82LU0001US | |
| LG Gram 14T90P | |
| Dell XPS 13 9310 2-in-1 | |
| MSI Summit E13 Flip Evo A11MT | |
| HP Spectre x360 14-ea0378ng | |
| Average Intel Core i5-1135G7 (17443 - 63889, n=45) | |
| Asus ZenBook Flip 14 UN5401QA-KN085W | |
| AIDA64 / Memory Read | |
| Lenovo Yoga 9 14IAP7 82LU0001US | |
| LG Gram 14T90P | |
| Dell XPS 13 9310 2-in-1 | |
| MSI Summit E13 Flip Evo A11MT | |
| HP Spectre x360 14-ea0378ng | |
| Average Intel Core i5-1135G7 (19716 - 63705, n=45) | |
| Asus ZenBook Flip 14 UN5401QA-KN085W | |
| AIDA64 / Memory Write | |
| LG Gram 14T90P | |
| Dell XPS 13 9310 2-in-1 | |
| Lenovo Yoga 9 14IAP7 82LU0001US | |
| MSI Summit E13 Flip Evo A11MT | |
| HP Spectre x360 14-ea0378ng | |
| Average Intel Core i5-1135G7 (18722 - 66778, n=45) | |
| Asus ZenBook Flip 14 UN5401QA-KN085W | |
| AIDA64 / Memory Latency | |
| Asus ZenBook Flip 14 UN5401QA-KN085W | |
| MSI Summit E13 Flip Evo A11MT | |
| Dell XPS 13 9310 2-in-1 | |
| HP Spectre x360 14-ea0378ng | |
| LG Gram 14T90P | |
| Average Intel Core i5-1135G7 (68.3 - 107, n=51) | |
* ... smaller is better
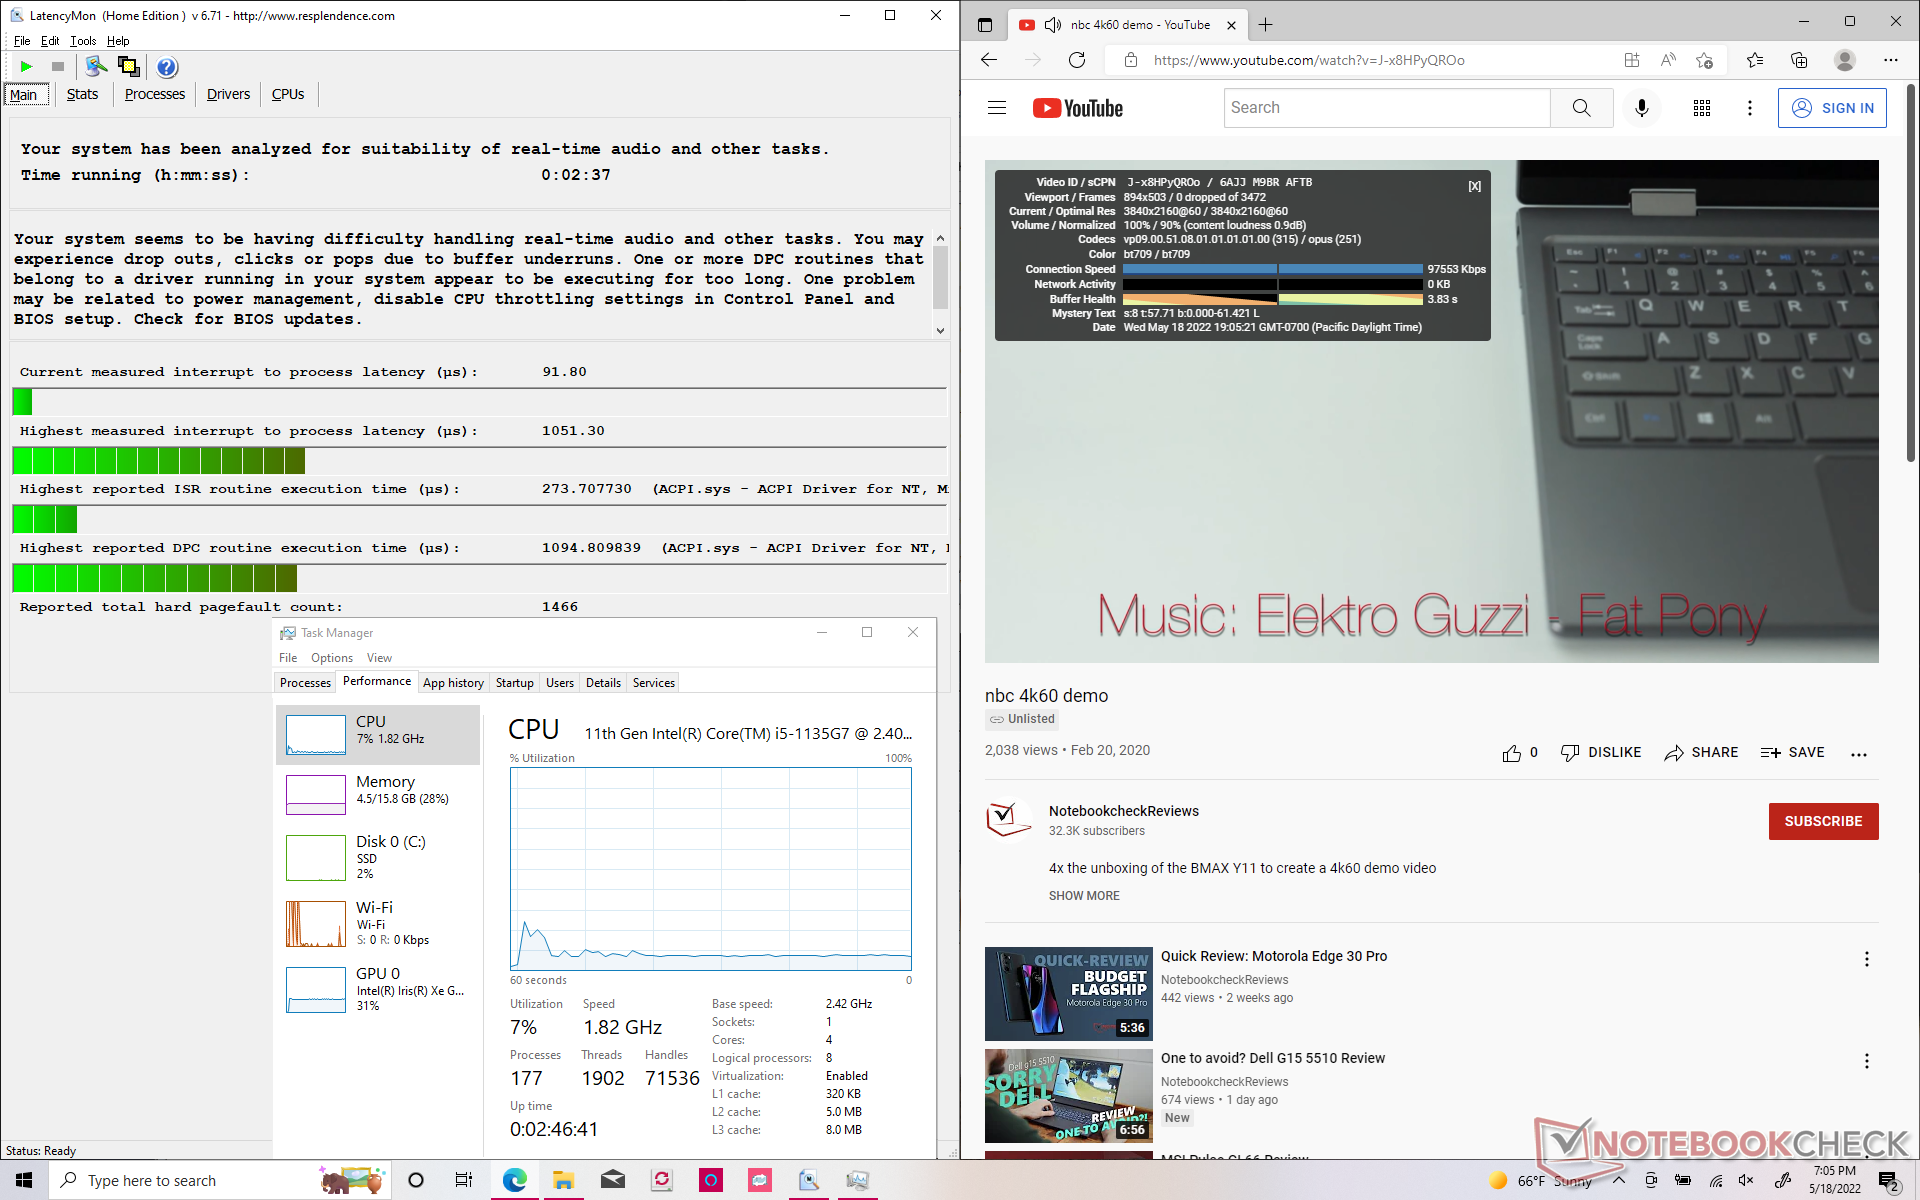
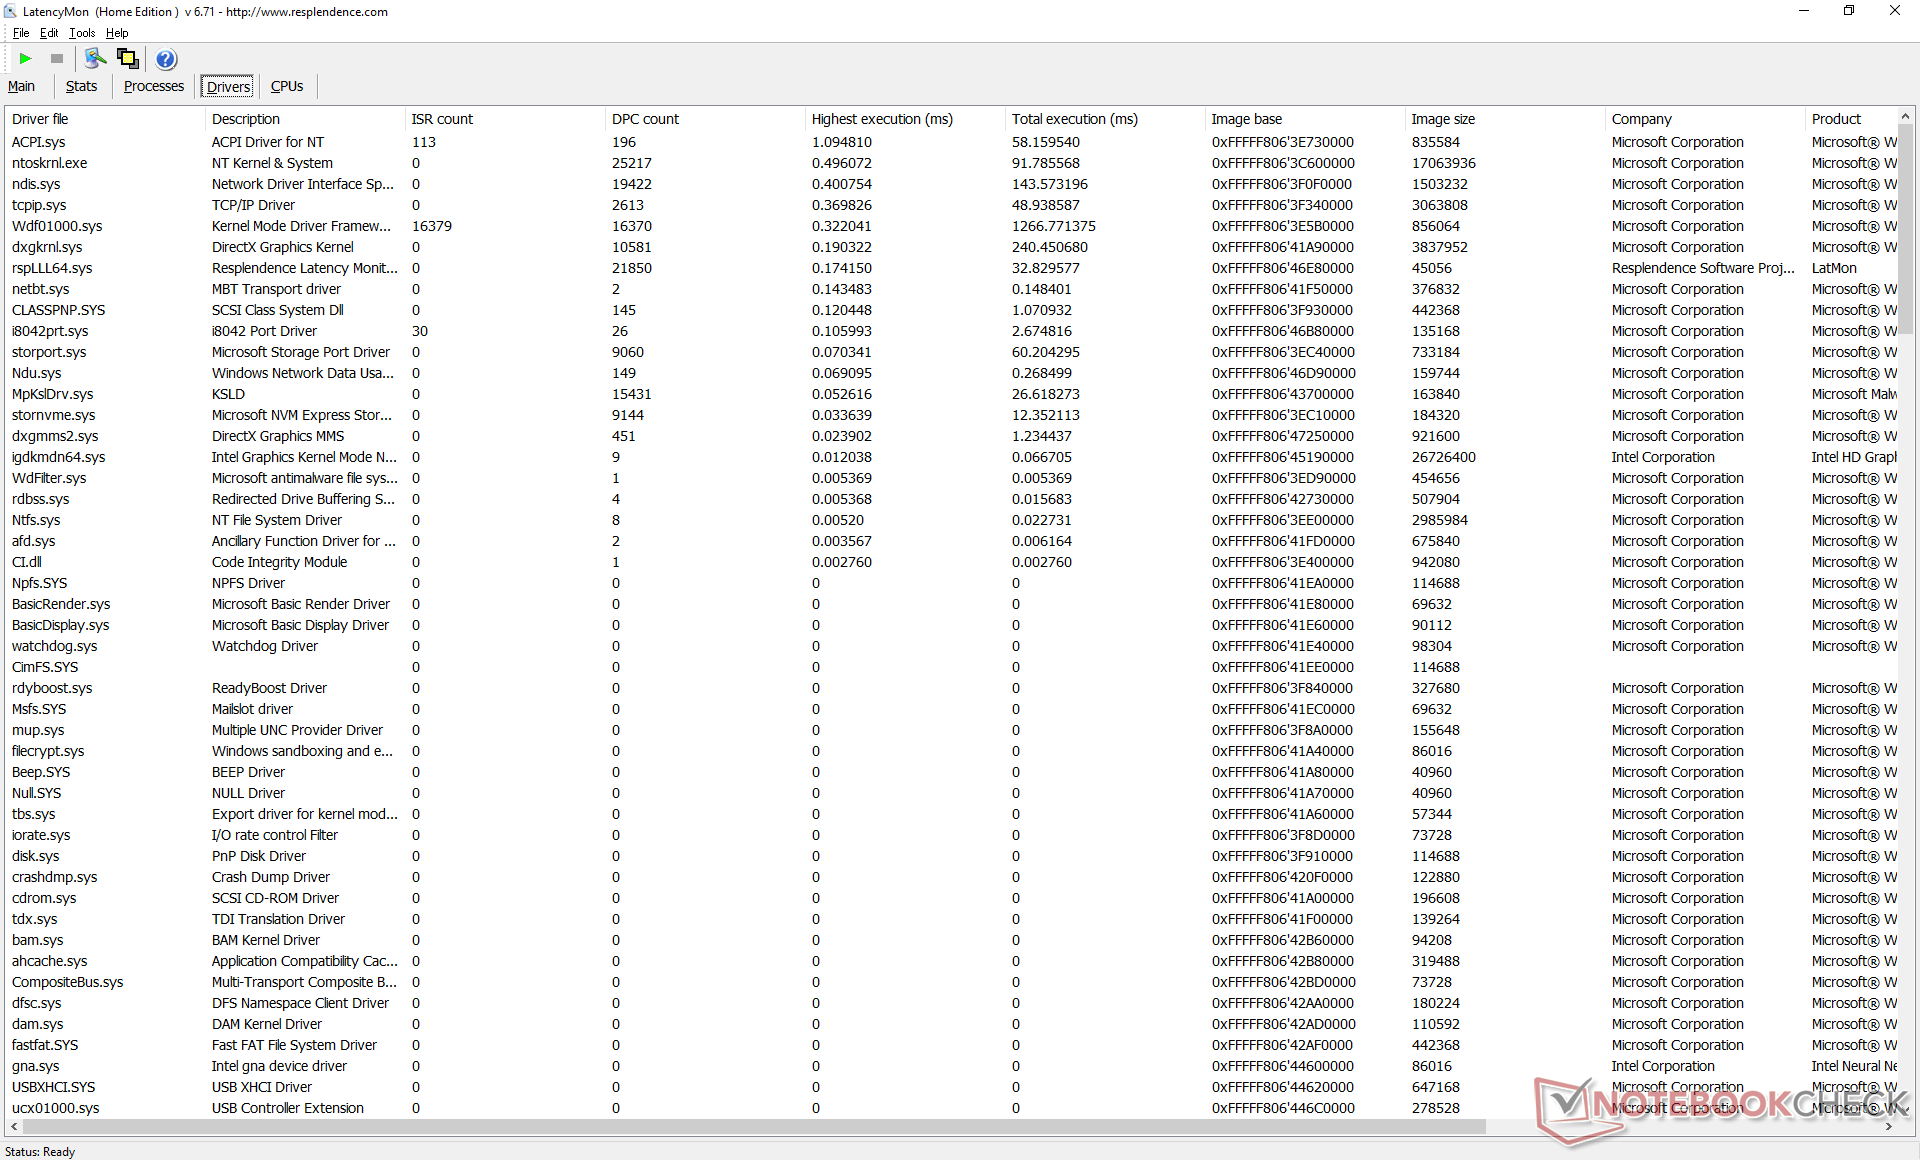
DPC延时
LatencyMon显示在我们的主页上打开多个浏览器标签时有轻微的DPC问题。在60 FPS的情况下,4K视频播放是完美的,绝对没有丢帧。
| DPC Latencies / LatencyMon - interrupt to process latency (max), Web, Youtube, Prime95 | |
| MSI Summit E13 Flip Evo A11MT | |
| HP Spectre x360 14-ea0378ng | |
| Lenovo Yoga 9 14IAP7 82LU0001US | |
| LG Gram 14T90N | |
| LG Gram 14T90P | |
| Asus ZenBook Flip 14 UN5401QA-KN085W | |
| Dell XPS 13 9310 2-in-1 | |
* ... smaller is better
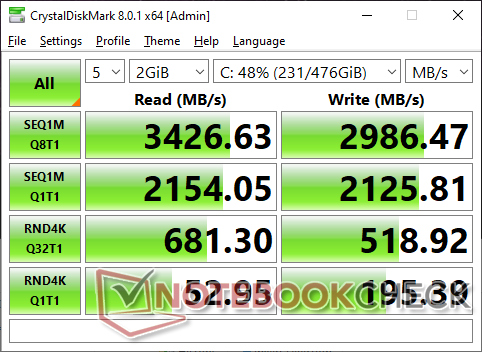
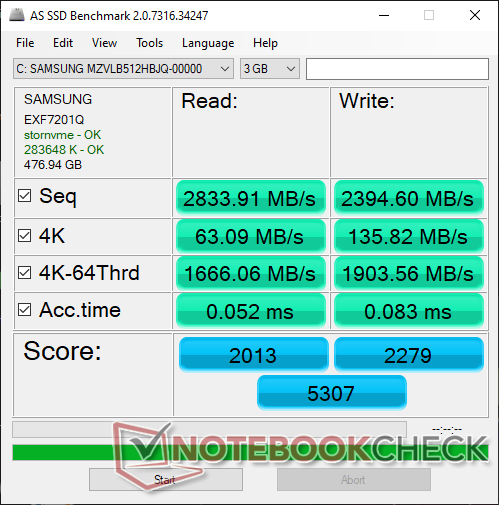
存储设备--配备PCIe3驱动器
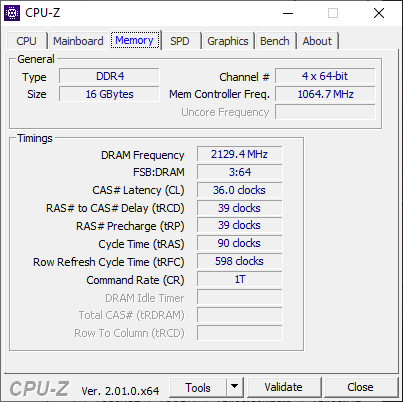
我们的设备配备了相同的512GB三星PM981aPCIe3 x4 NVMe固态硬盘,与Gram 14T90N相同,尽管Tiger Lake-UP3主板应该能够支持PCIe4 x4终端用户升级,以获得更快的速度。尽管如此,在我们的测试中,PM981a在长时间内维持其最大传输率~3400 MB/s没有问题。它仍然是面向消费者的最快PCIe3 NVMe驱动器之一。

| Drive Performance rating - Percent | |
| Lenovo Yoga 9 14IAP7 82LU0001US | |
| MSI Summit E13 Flip Evo A11MT | |
| LG Gram 14T90P | |
| LG Gram 14T90N | |
| Asus ZenBook Flip 14 UN5401QA-KN085W | |
| HP Spectre x360 14-ea0378ng | |
| Dell XPS 13 9310 2-in-1 | |
* ... smaller is better
Disk Throttling: DiskSpd Read Loop, Queue Depth 8
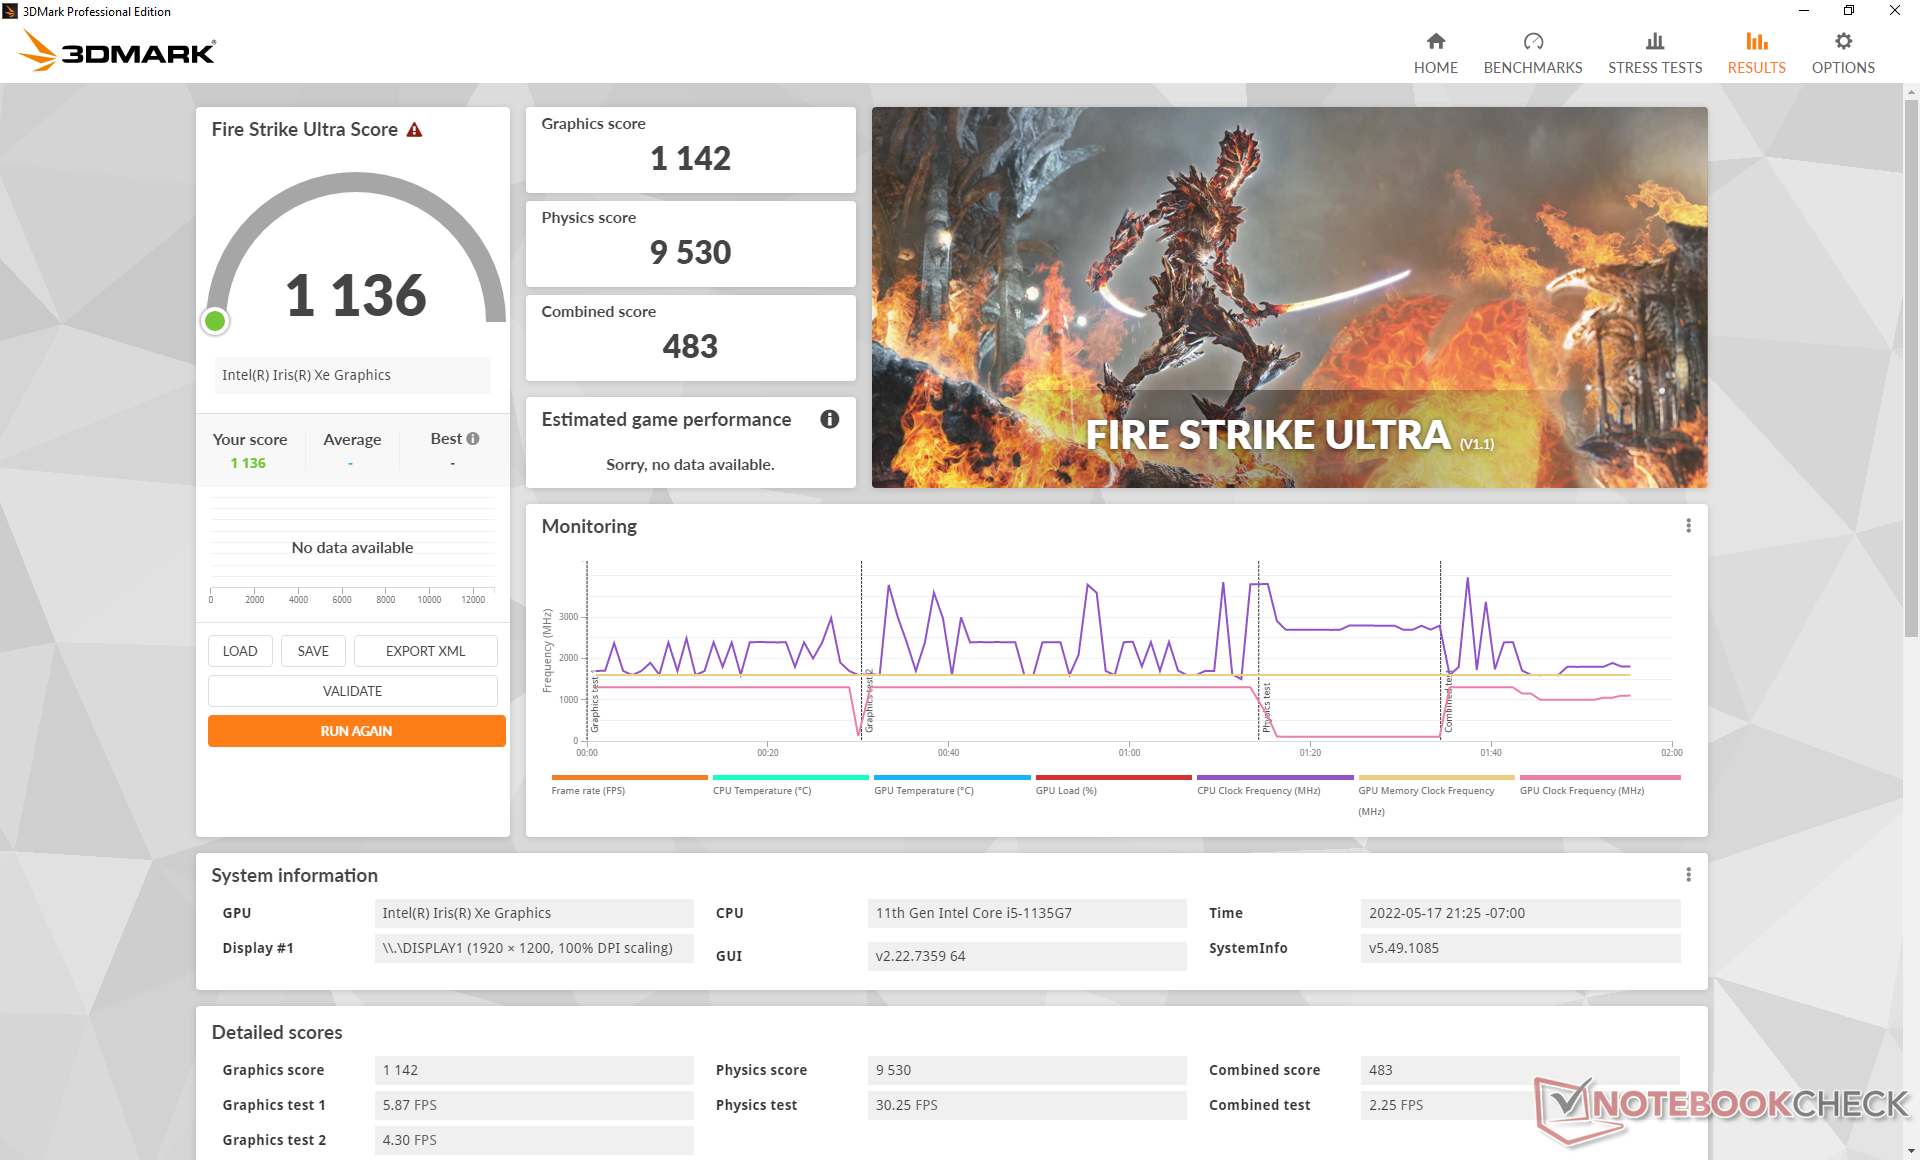
GPU性能
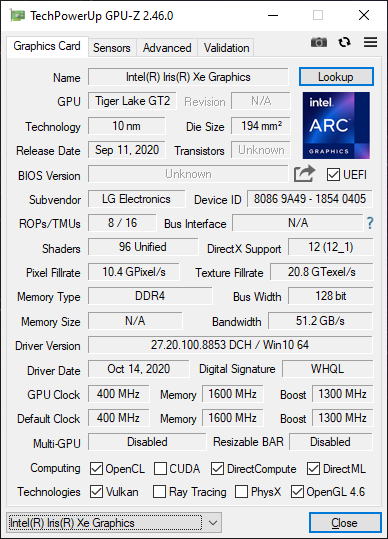
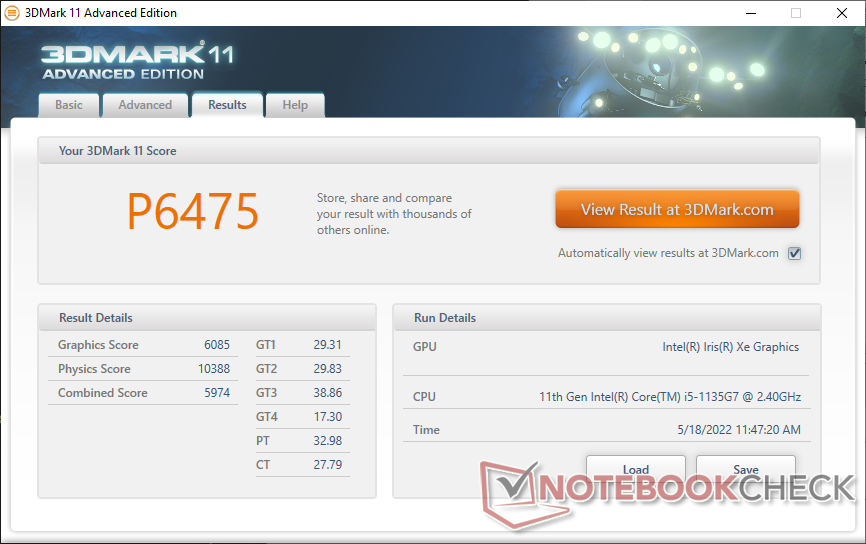
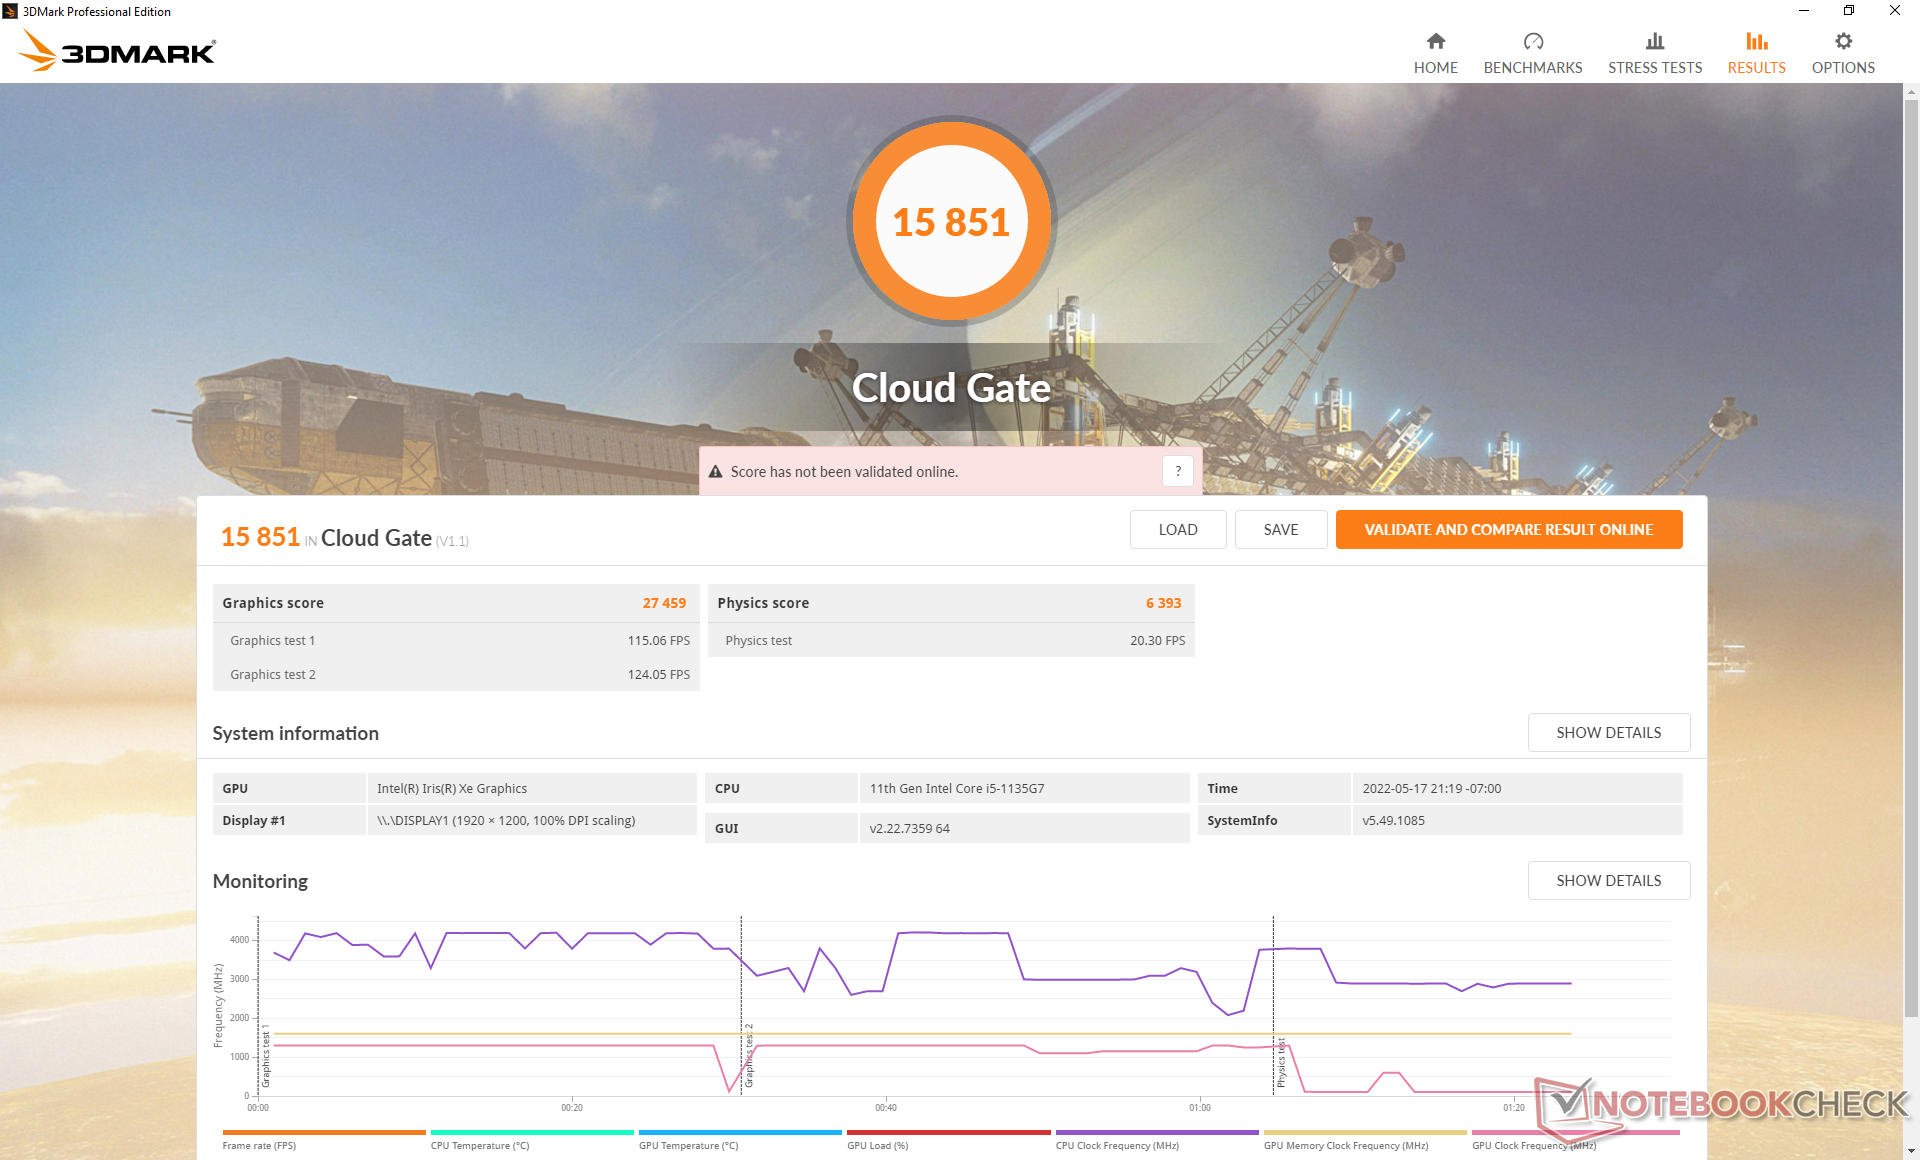
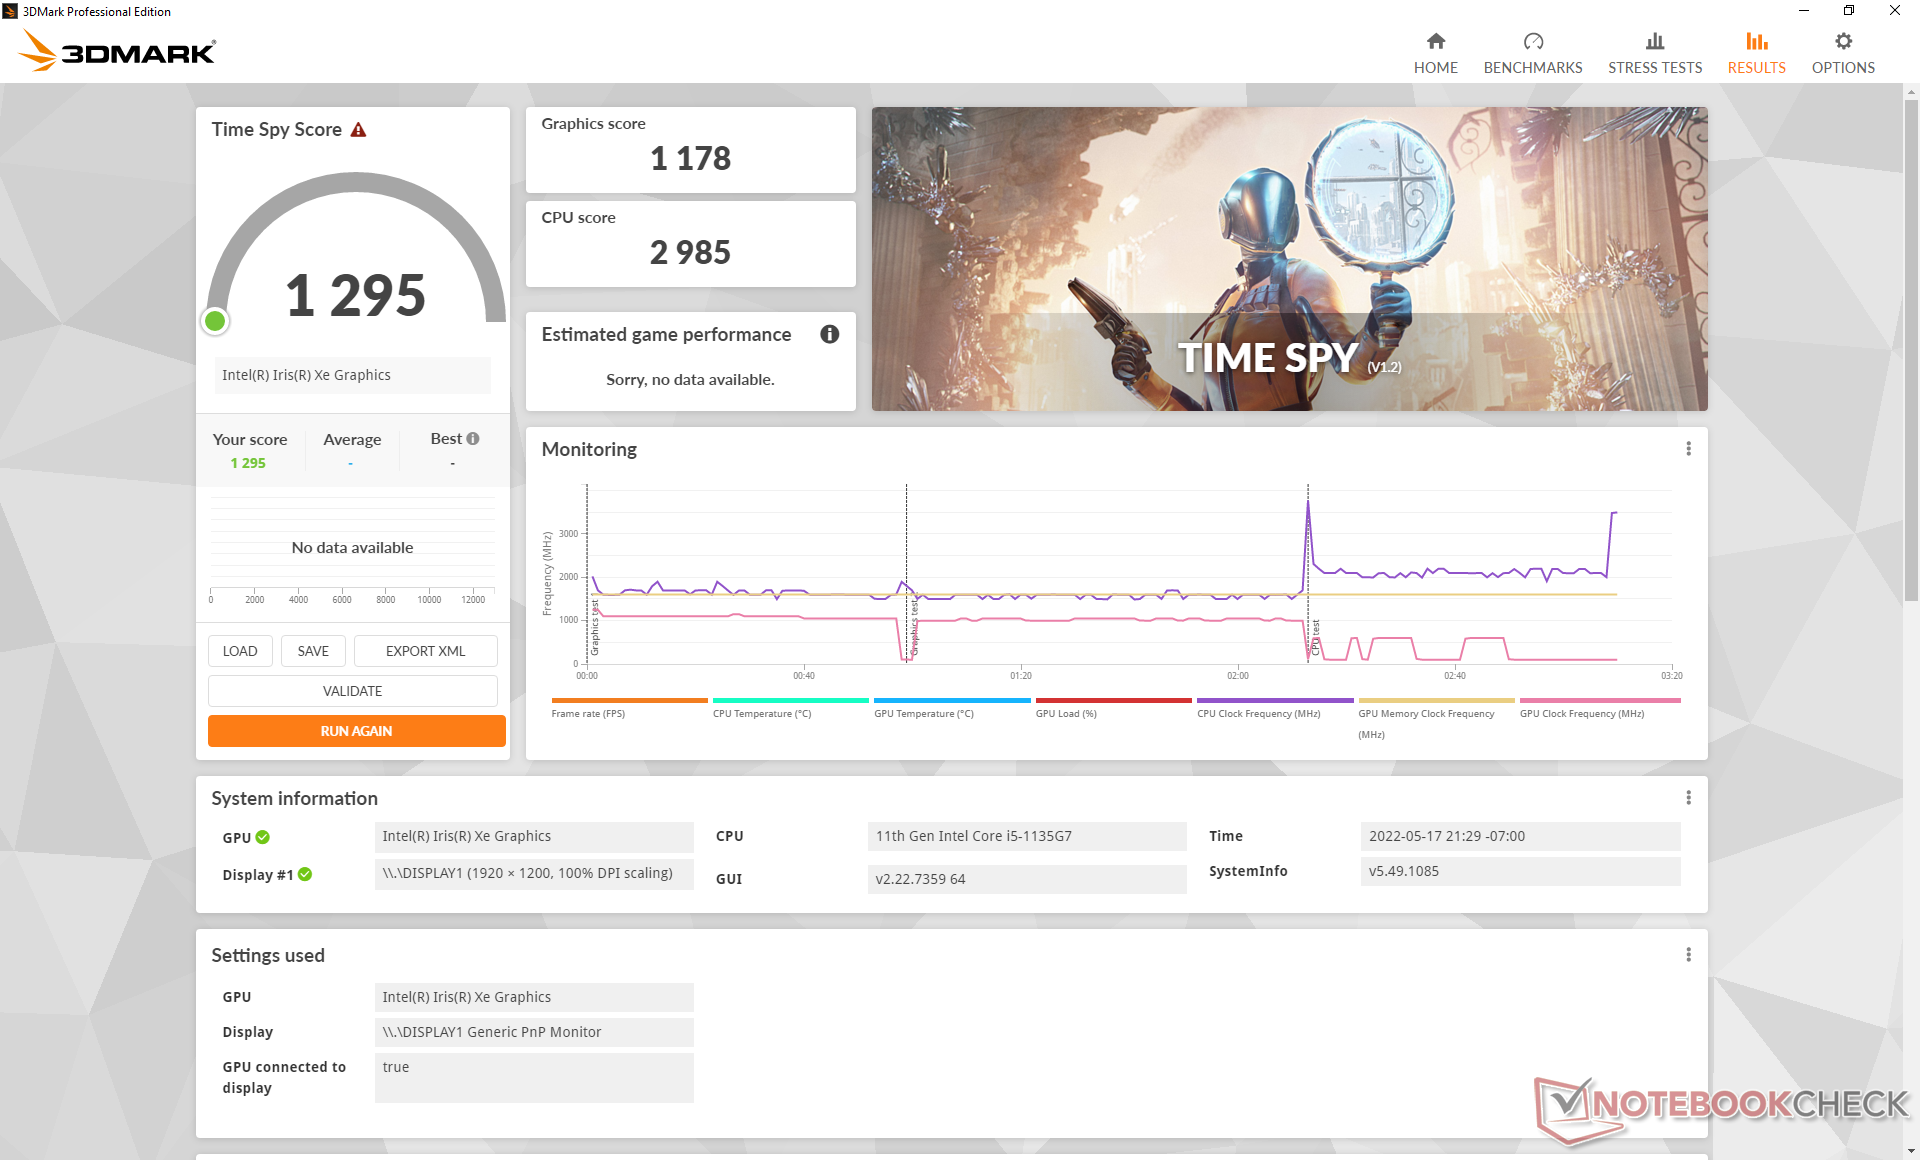
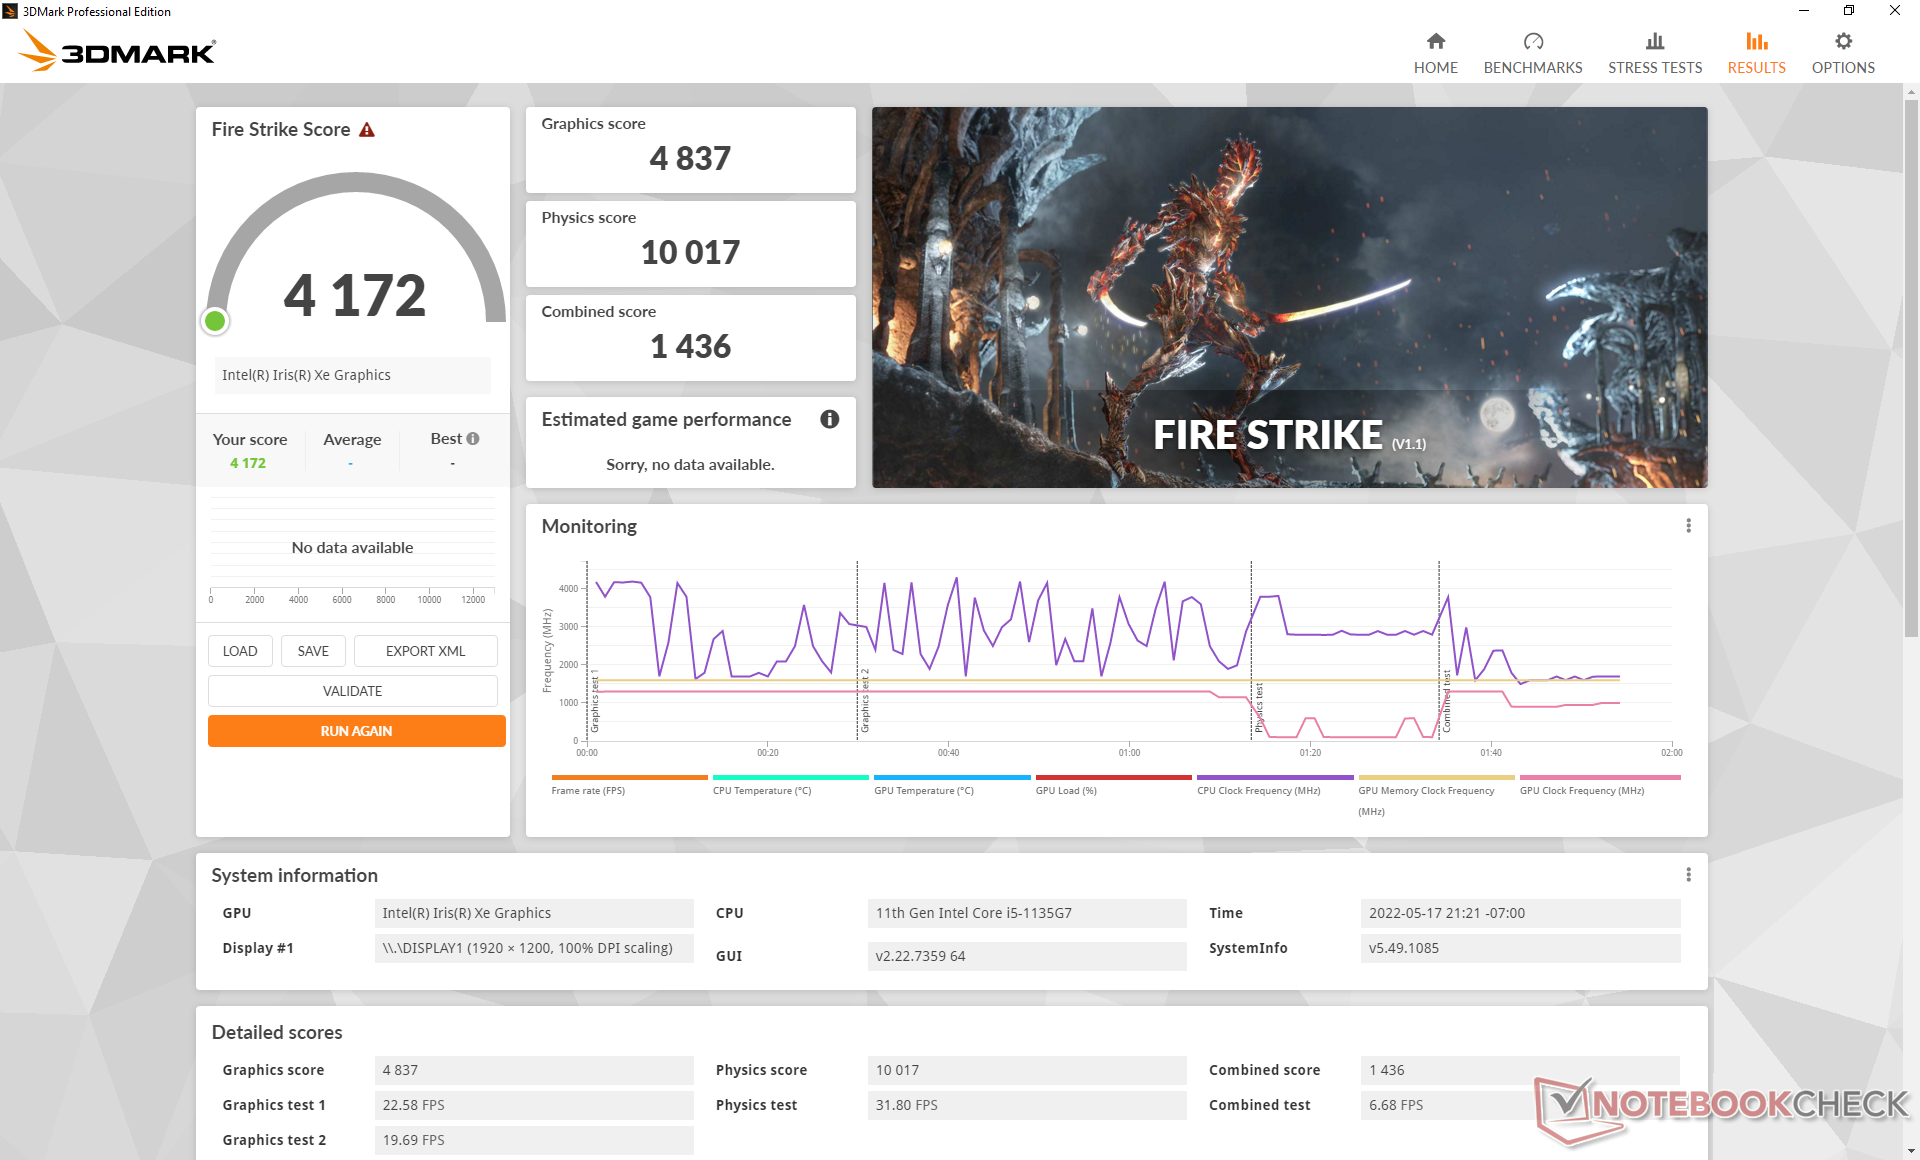
集成的图形性能来自 Iris Xe 80 EUs是优秀的,比配备相同GPU的大多数其他笔记本电脑更快。当与更常见的Core i7 Iris Xe 96 EUs,我们的酷睿i5 Iris Xe 80 EUs可能会慢15%到30%左右。这仍然是一个显著的升级,从 UHD Graphics 620不过,与老式的Gram 14T90N上的620相比,仍然是一个重大的升级。
不幸的是,性能并不像我们希望的那样稳定。当空转时 Witcher 3例如,在低720p设置下,帧率会在75和85FPS之间波动,而不是像大多数其他笔记本电脑那样一直保持稳定。连续两次运行Fire Strike ,也会导致相对较大的物理分数差异(10017分对11226分)。我们建议启用vsync来限制屏幕撕裂和不稳定的帧时间。
| 3DMark 11 - 1280x720 Performance GPU | |
| MSI Summit E13 Flip Evo A11MT | |
| Lenovo Yoga 9 14IAP7 82LU0001US | |
| Dell XPS 13 9310 2-in-1 | |
| LG Gram 14T90P | |
| HP Pavilion Aero 13 be0097nr | |
| Asus ZenBook Flip 14 UN5401QA-KN085W | |
| Dell Inspiron 14 7400 7415 2-in-1 | |
| Lenovo IdeaPad 5 Pro 14ACN6 | |
| Average Intel Iris Xe Graphics G7 80EUs (2246 - 6579, n=112) | |
| Infinix INBook X2 | |
| Asus ZenBook 14 UX434FL-DB77 | |
| Acer Spin 3 SP314-54N-56S5 | |
| LG Gram 14T90N | |
| 3DMark 11 Performance | 6475 points | |
| 3DMark Cloud Gate Standard Score | 15851 points | |
| 3DMark Fire Strike Score | 4172 points | |
| 3DMark Time Spy Score | 1295 points | |
Help | ||
Witcher 3 FPS Chart
| low | med. | high | ultra | |
|---|---|---|---|---|
| GTA V (2015) | 83.3 | 75.1 | 25.9 | 11.4 |
| The Witcher 3 (2015) | 89.8 | 55.6 | 32.3 | 14.1 |
| Dota 2 Reborn (2015) | 85.8 | 73.3 | 46 | 42.2 |
| Final Fantasy XV Benchmark (2018) | 34.4 | 20.1 | 15.6 | |
| X-Plane 11.11 (2018) | 40.5 | 32.8 | 30.2 | |
| Strange Brigade (2018) | 88.3 | 36.3 | 28.4 | 23.2 |
排放
系统噪音 - 在大多数情况下都很安静
风扇噪音行为与我们在Gram 14T90N上观察到的类似,后者已经是一台相对安静的机器。我们能够测量到只有28.3 dB(A),即使在运行3DMark 06的第一个基准场景后,也比戴尔XPS 13更安静。 联想Yoga 9 14和华硕ZenBook Flip 14在类似条件下的噪音。在游戏或CPU处于100%利用率的情况下,风扇噪音似乎达到了35 dB(A)。
Noise level
| Idle |
| 25.5 / 25.5 / 25.5 dB(A) |
| Load |
| 28.3 / 35 dB(A) |
 | ||
30 dB silent 40 dB(A) audible 50 dB(A) loud |
||
min: | ||
| LG Gram 14T90P Iris Xe G7 80EUs, i5-1135G7, Samsung SSD PM981a MZVLB512HBJQ | Dell XPS 13 9310 2-in-1 Iris Xe G7 96EUs, i7-1165G7, Toshiba BG4 KBG40ZPZ512G | Lenovo Yoga 9 14IAP7 82LU0001US Iris Xe G7 96EUs, i7-1260P, Samsung PM9A1 MZVL2512HCJQ | Asus ZenBook Flip 14 UN5401QA-KN085W Vega 8, R7 5800H, Intel SSD 600p SSDPEKKW512G7 | HP Spectre x360 14-ea0378ng Iris Xe G7 96EUs, i7-1165G7, Intel Optane Memory H10 with Solid State Storage 32GB + 1TB HBRPEKNX0203AH(L/H) | MSI Summit E13 Flip Evo A11MT Iris Xe G7 96EUs, i7-1185G7, Phison 1TB SM2801T24GKBB4S-E162 | LG Gram 14T90N UHD Graphics 620, i7-10510U, Samsung SSD PM981a MZVLB512HBJQ | |
|---|---|---|---|---|---|---|---|
| Noise | -7% | -5% | -13% | -8% | -12% | -16% | |
| off / environment * (dB) | 25.4 | 24.3 4% | 22.9 10% | 26 -2% | 26 -2% | 24.5 4% | 29 -14% |
| Idle Minimum * (dB) | 25.5 | 24.8 3% | 23.3 9% | 26 -2% | 26 -2% | 24.7 3% | 30 -18% |
| Idle Average * (dB) | 25.5 | 24.8 3% | 23.5 8% | 26 -2% | 26 -2% | 24.7 3% | 30 -18% |
| Idle Maximum * (dB) | 25.5 | 24.8 3% | 23.5 8% | 27.3 -7% | 26 -2% | 26.4 -4% | 30 -18% |
| Load Average * (dB) | 28.3 | 38 -34% | 33.2 -17% | 39.8 -41% | 37.5 -33% | 37.8 -34% | 35.2 -24% |
| Witcher 3 ultra * (dB) | 35 | 38 -9% | 44.9 -28% | 41.4 -18% | |||
| Load Maximum * (dB) | 35 | 41.5 -19% | 44.6 -27% | 42.4 -21% | 36.3 -4% | 48.8 -39% | 37 -6% |
* ... smaller is better
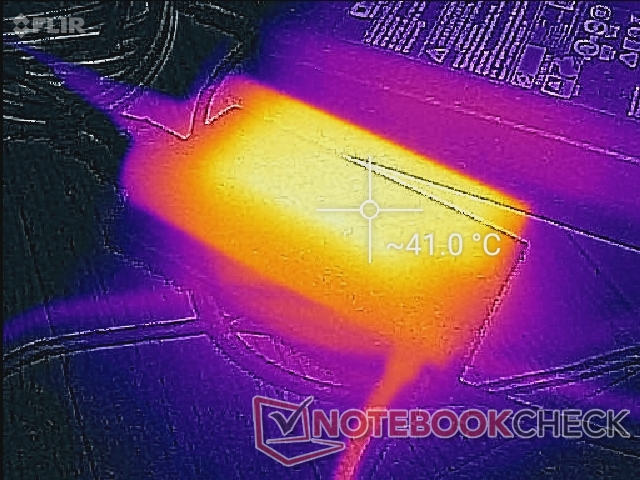
温度
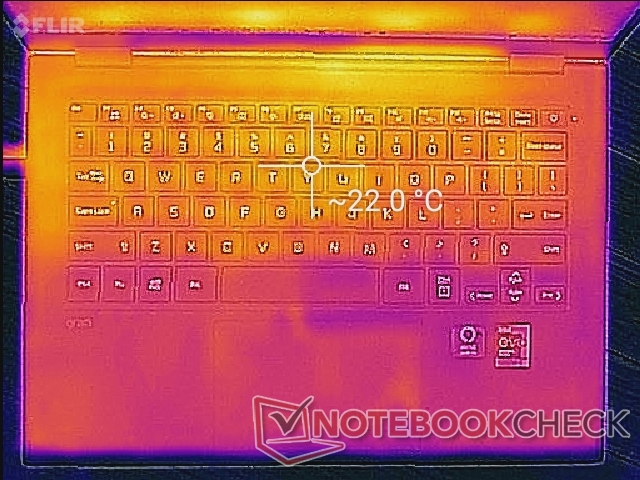
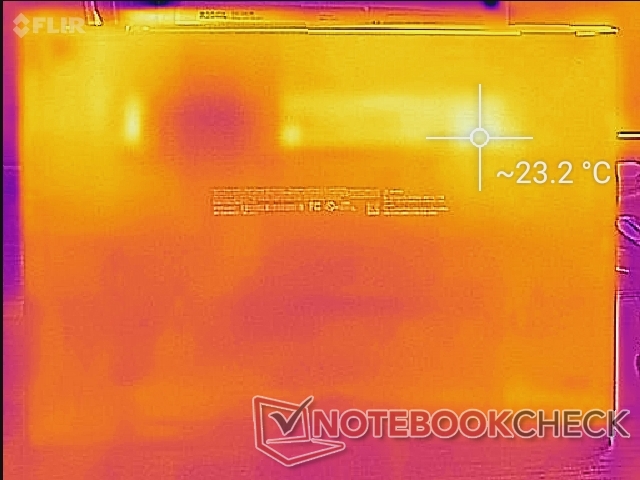
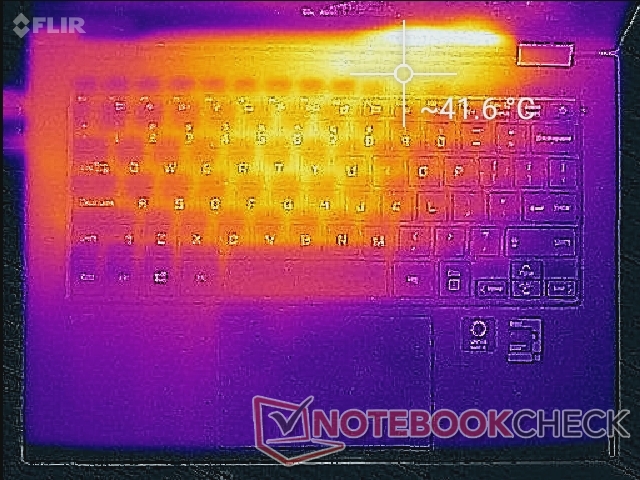
在运行低负载时,表面温度比我们在竞争产品联想Yoga 9 14IAP7上观察到的要低,而在运行更高的负载时,它们之间的温度是差不多的。热点是离键盘中心最近的地方,它可以达到40摄氏度,与格力14T90N或上述联想的温度相当。
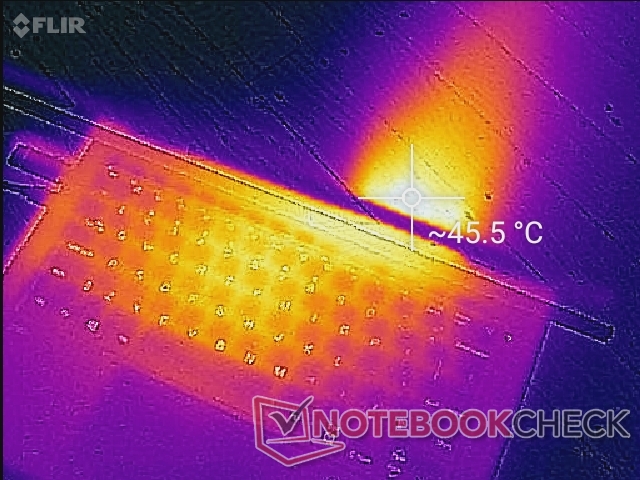
(±) The maximum temperature on the upper side is 41.6 °C / 107 F, compared to the average of 35.4 °C / 96 F, ranging from 19.6 to 60 °C for the class Convertible.
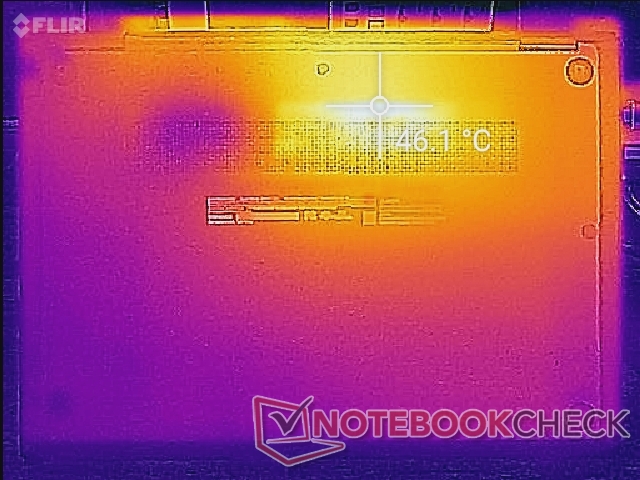
(-) The bottom heats up to a maximum of 46.2 °C / 115 F, compared to the average of 36.9 °C / 98 F
(+) In idle usage, the average temperature for the upper side is 21.6 °C / 71 F, compared to the device average of 30.3 °C / 87 F.
(+) The palmrests and touchpad are cooler than skin temperature with a maximum of 26.2 °C / 79.2 F and are therefore cool to the touch.
(±) The average temperature of the palmrest area of similar devices was 28 °C / 82.4 F (+1.8 °C / 3.2 F).
| LG Gram 14T90P Intel Core i5-1135G7, Intel Iris Xe Graphics G7 80EUs | Dell XPS 13 9310 2-in-1 Intel Core i7-1165G7, Intel Iris Xe Graphics G7 96EUs | Lenovo Yoga 9 14IAP7 82LU0001US Intel Core i7-1260P, Intel Iris Xe Graphics G7 96EUs | Asus ZenBook Flip 14 UN5401QA-KN085W AMD Ryzen 7 5800H, AMD Radeon RX Vega 8 (Ryzen 4000/5000) | HP Spectre x360 14-ea0378ng Intel Core i7-1165G7, Intel Iris Xe Graphics G7 96EUs | MSI Summit E13 Flip Evo A11MT Intel Core i7-1185G7, Intel Iris Xe Graphics G7 96EUs | LG Gram 14T90N Intel Core i7-10510U, Intel UHD Graphics 620 | |
|---|---|---|---|---|---|---|---|
| Heat | -12% | -29% | -29% | -8% | -33% | -14% | |
| Maximum Upper Side * (°C) | 41.6 | 51 -23% | 43.2 -4% | 42.7 -3% | 37.1 11% | 52 -25% | 43.2 -4% |
| Maximum Bottom * (°C) | 46.2 | 45.4 2% | 45.6 1% | 53.1 -15% | 43.1 7% | 57.4 -24% | 41.6 10% |
| Idle Upper Side * (°C) | 22.6 | 24.4 -8% | 34.6 -53% | 32.9 -46% | 29 -28% | 30.4 -35% | 29.2 -29% |
| Idle Bottom * (°C) | 23.2 | 27.4 -18% | 37 -59% | 35.2 -52% | 28.6 -23% | 34.2 -47% | 30.6 -32% |
* ... smaller is better
压力测试
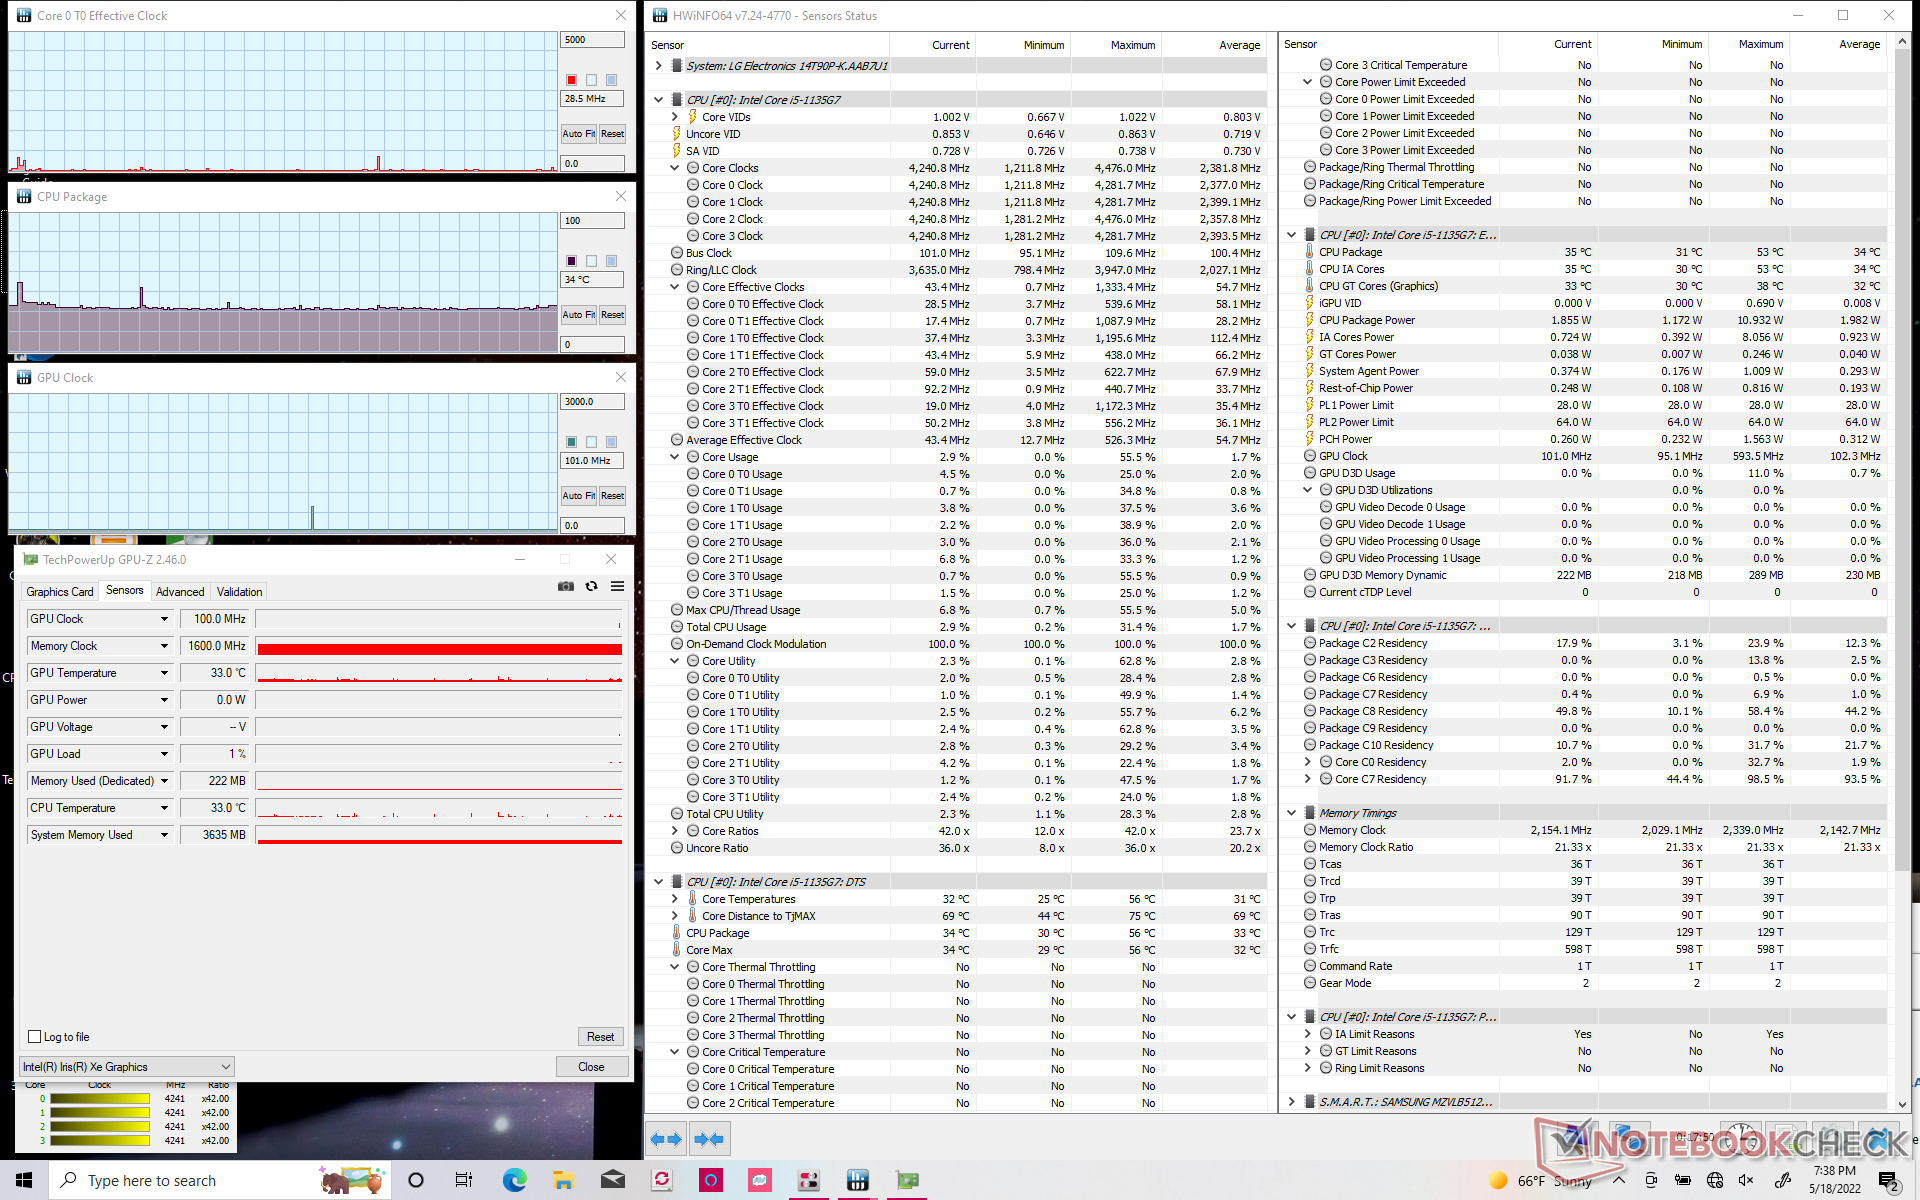
当在Prime95下受压时,CPU会在几秒钟内提升到3.5 GHz和95 C,然后稳步下降,最终稳定在2.1 GHz和73 C。我们怀疑处理器不会稳定在更高的时钟速率,以保持皮肤温度。在测试开始时,CPU的TDP会高达47W,然后再稳定在只有18W的结果。相比之下,在惠普Spectre x360 14上运行这个相同的测试 HP Spectre x360 14进行同样的测试,酷睿i7-1165G7将导致循环的CPU时钟速率和温度分别为2.1 - 3.4 GHz和75 - 95 C,平均性能更高。
在性能模式下运行会导致更高的时钟速率和温度,正如我们的图表和下表所示。
如果在电池电源上运行,性能不会受到限制,因为Fire Strike ,主电源和电池上的得分非常相似。
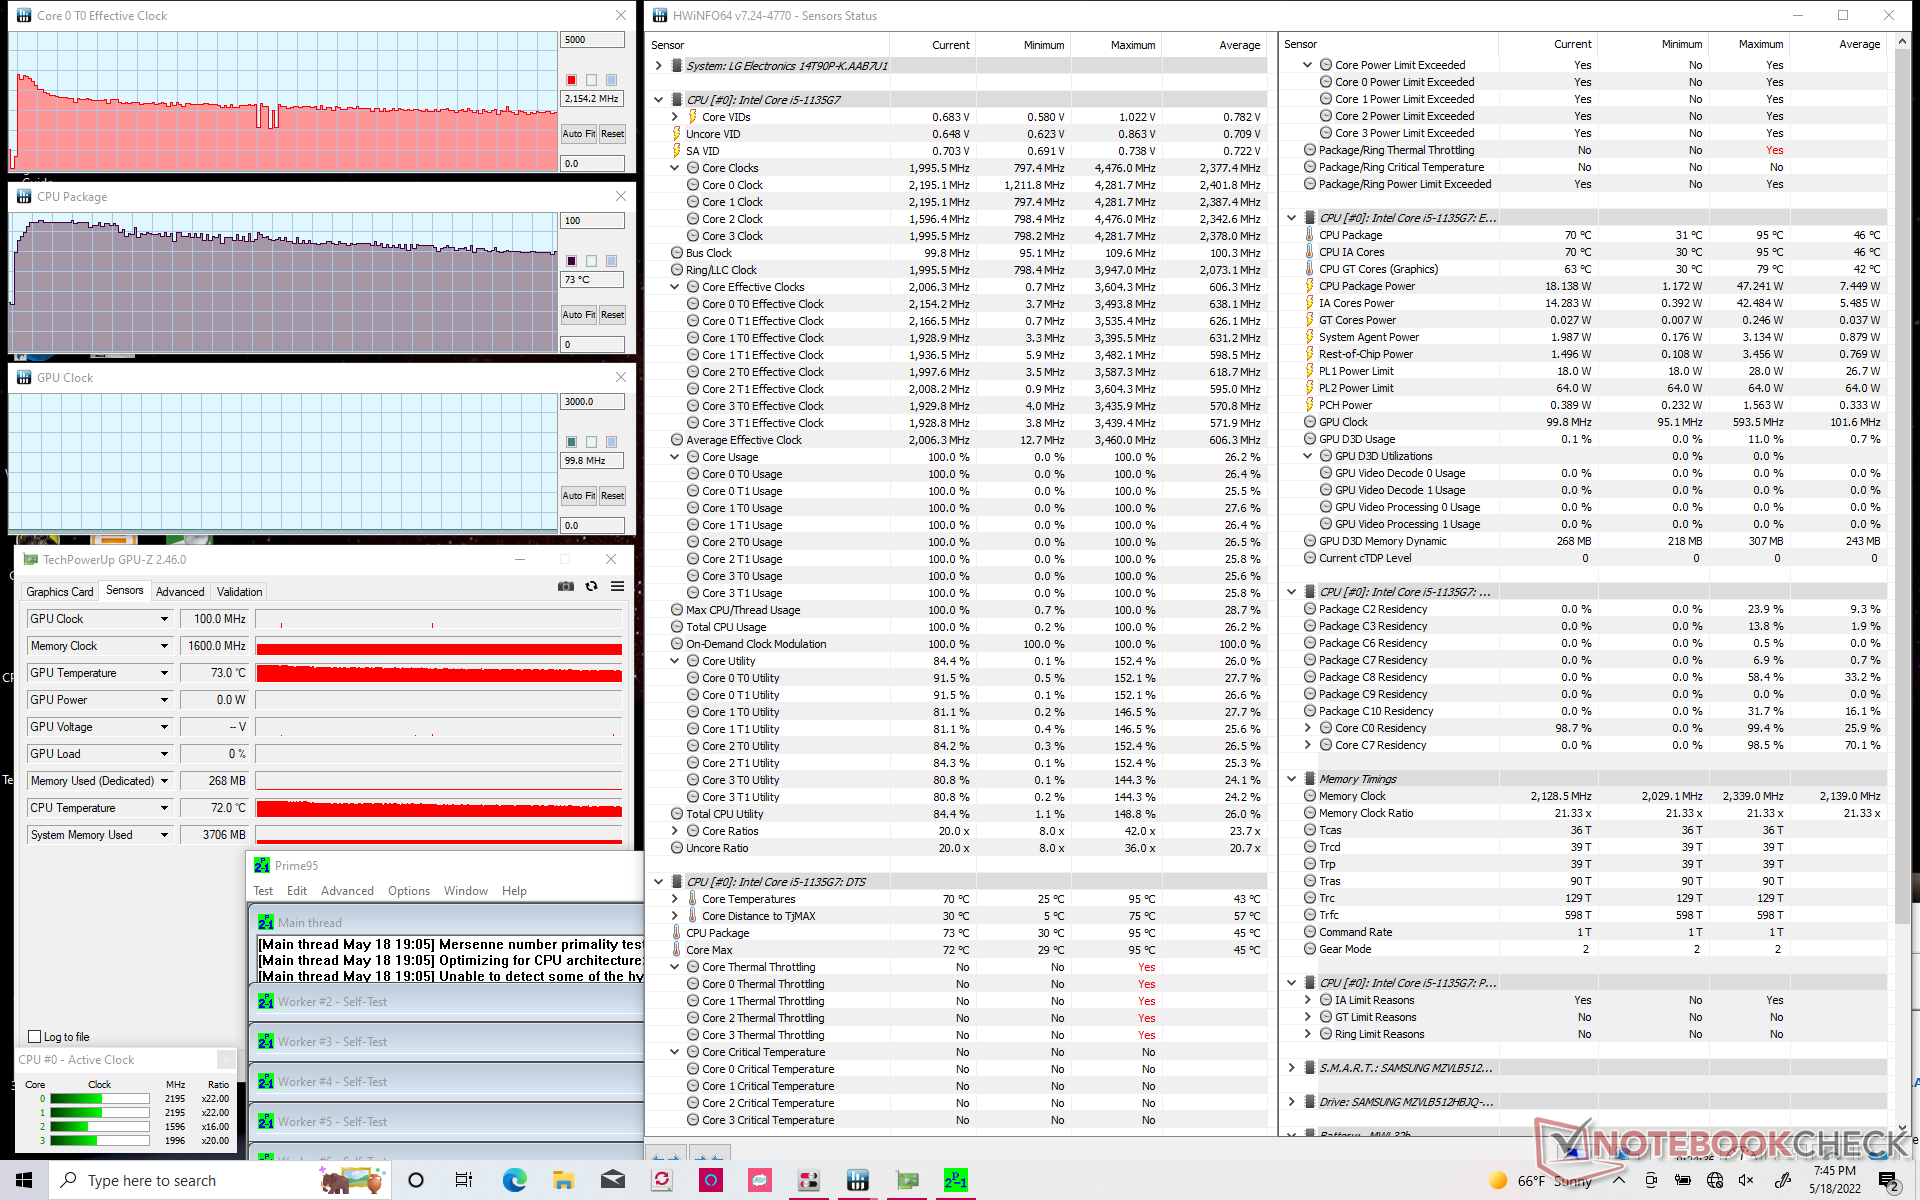
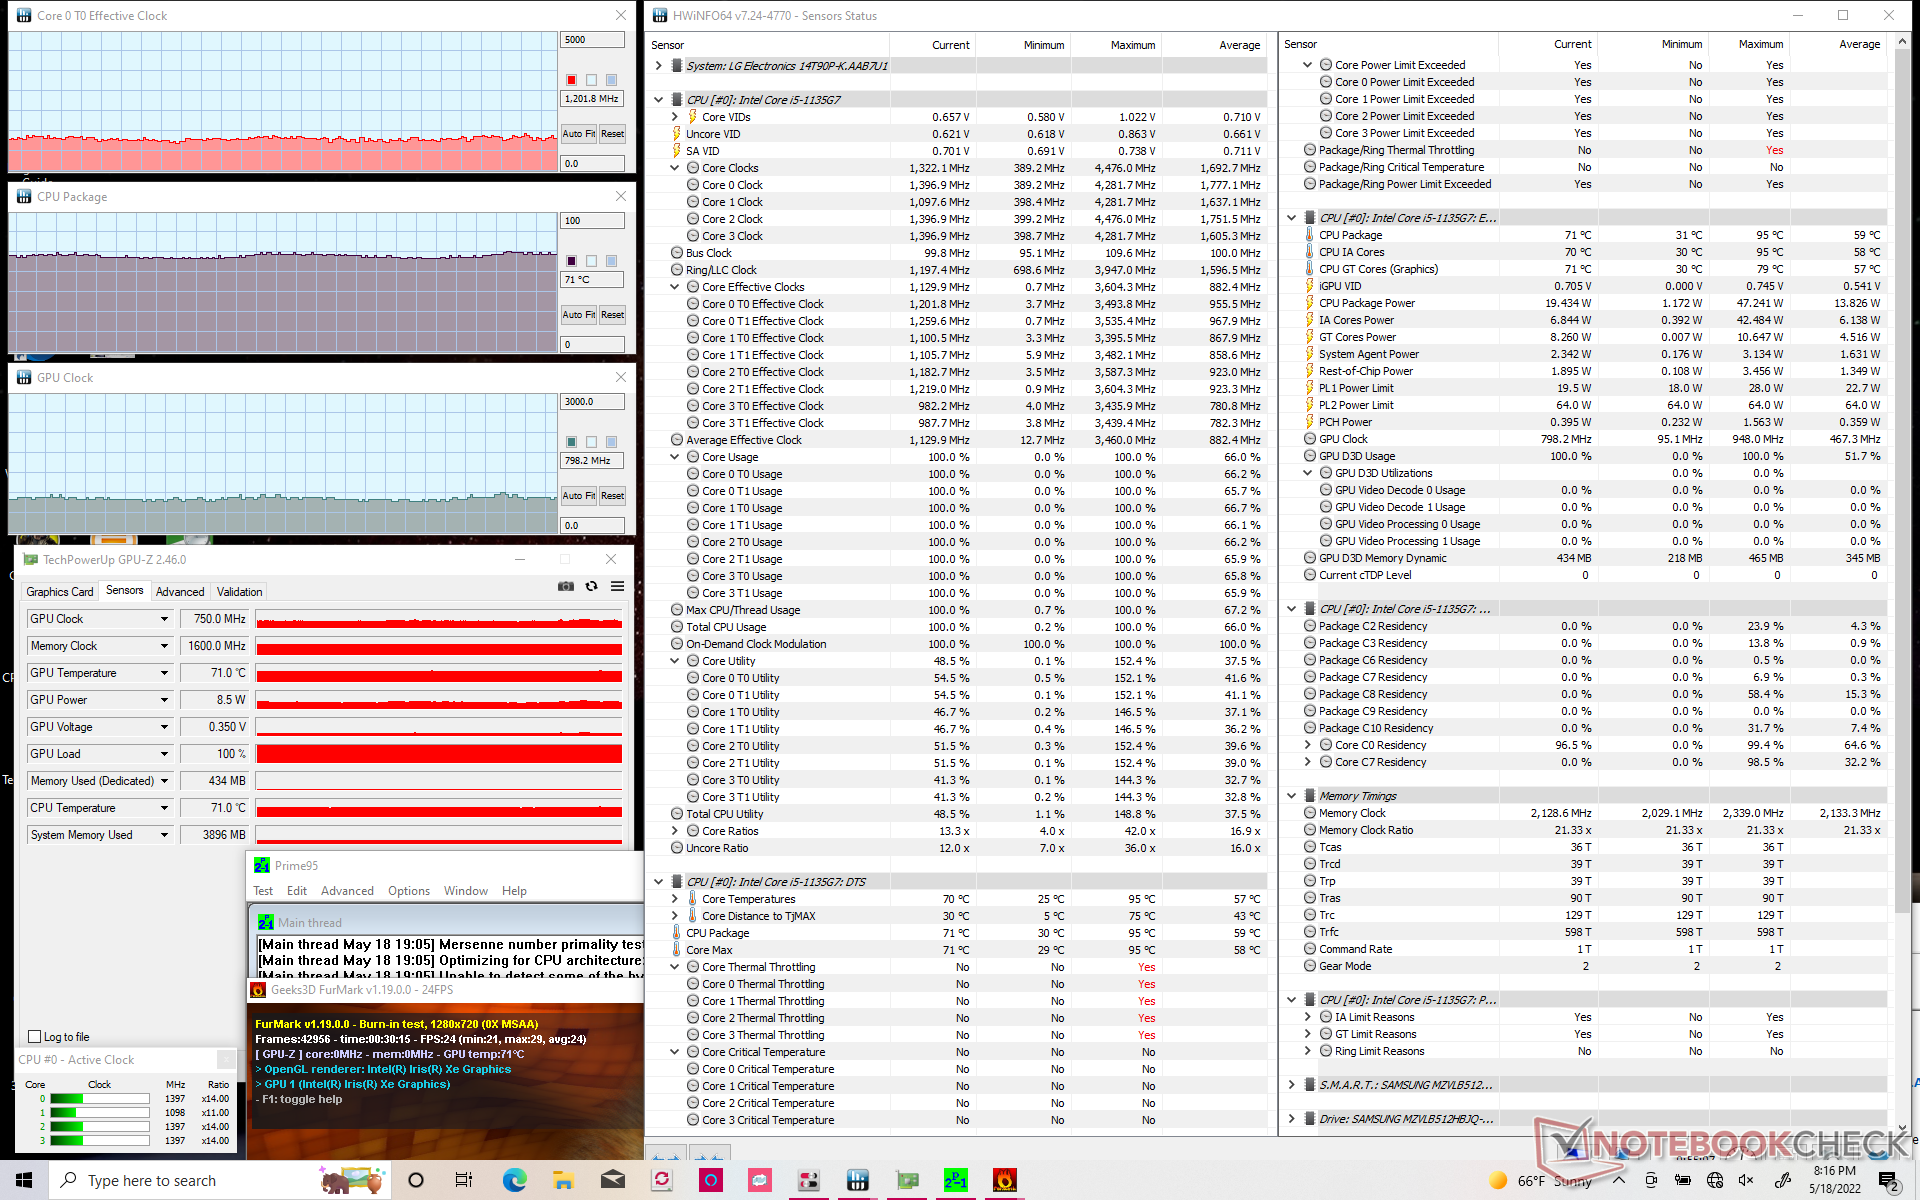
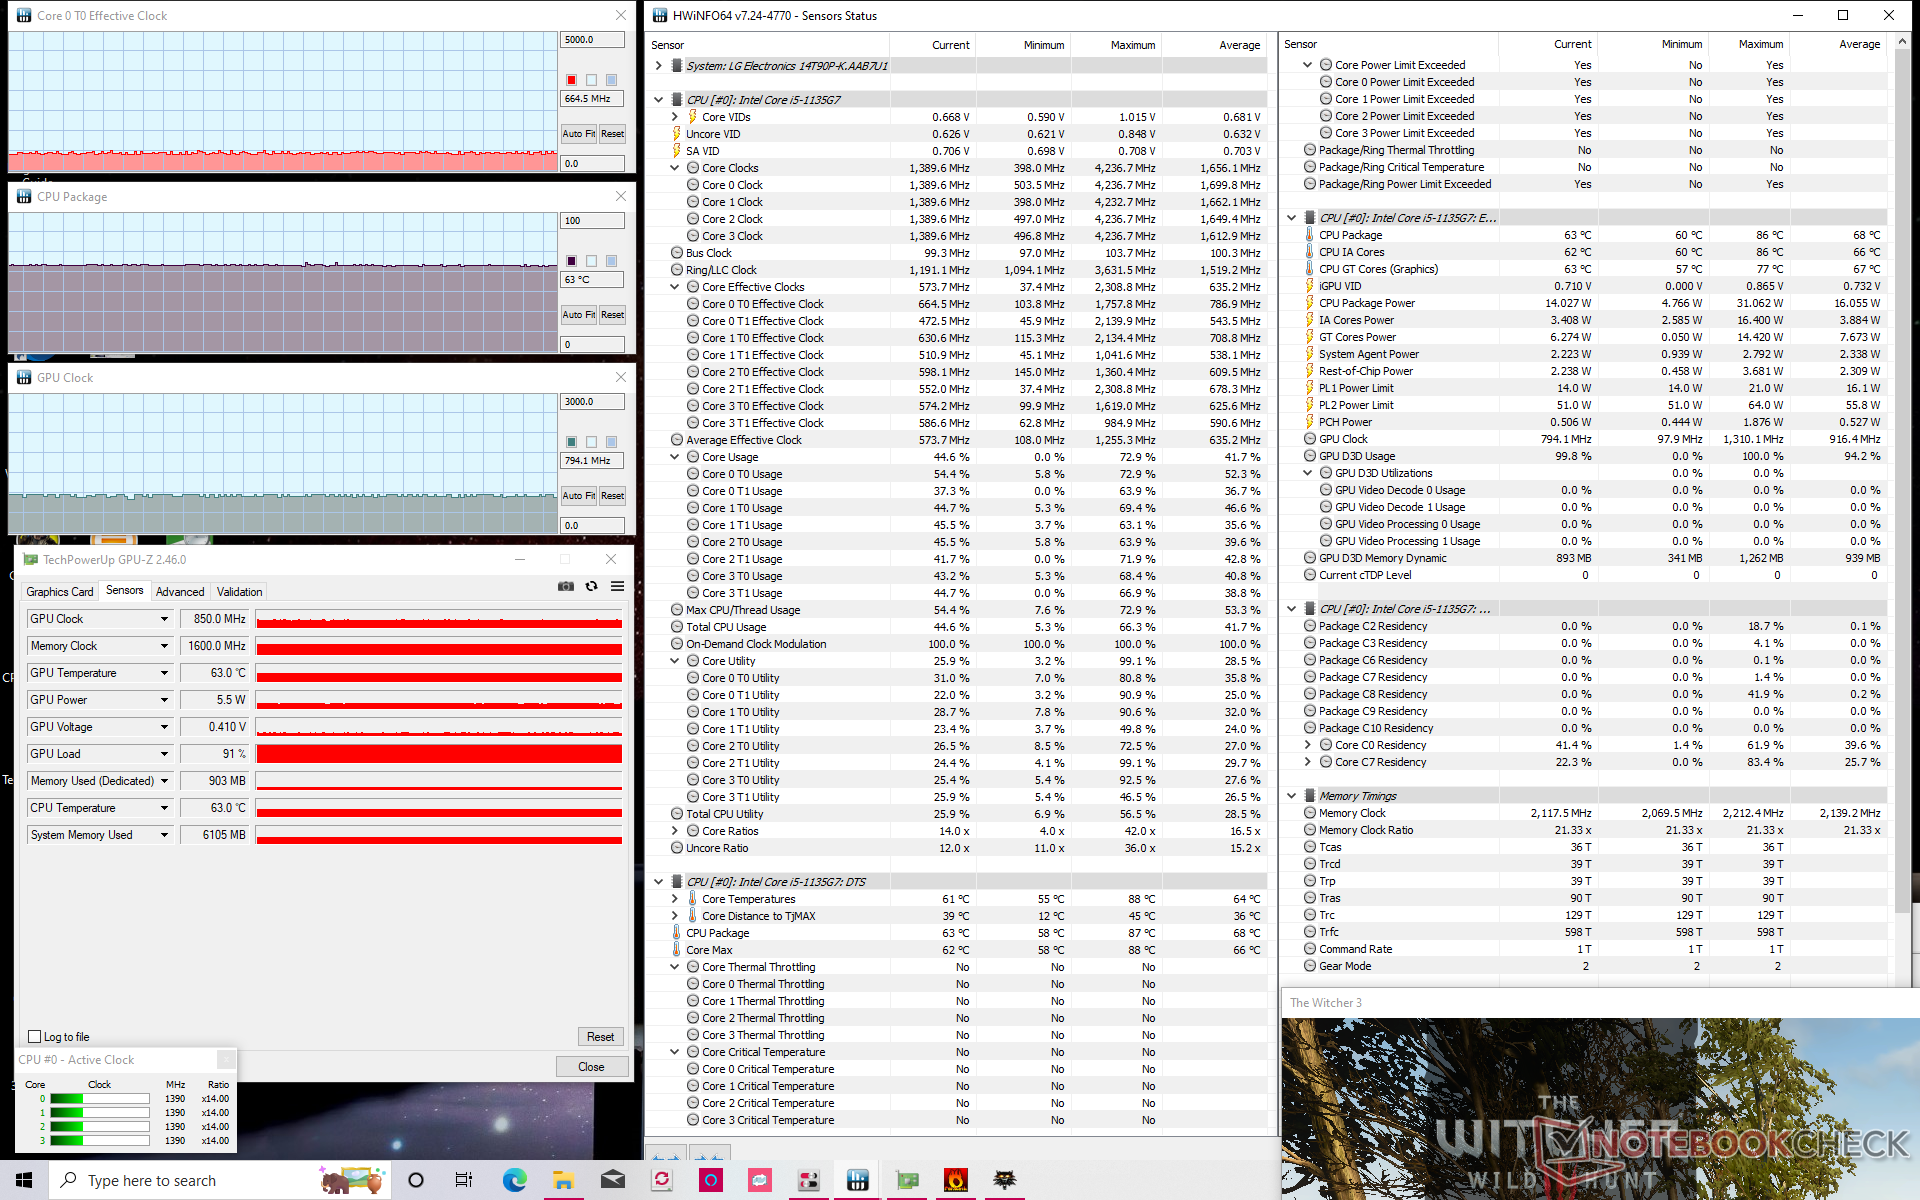
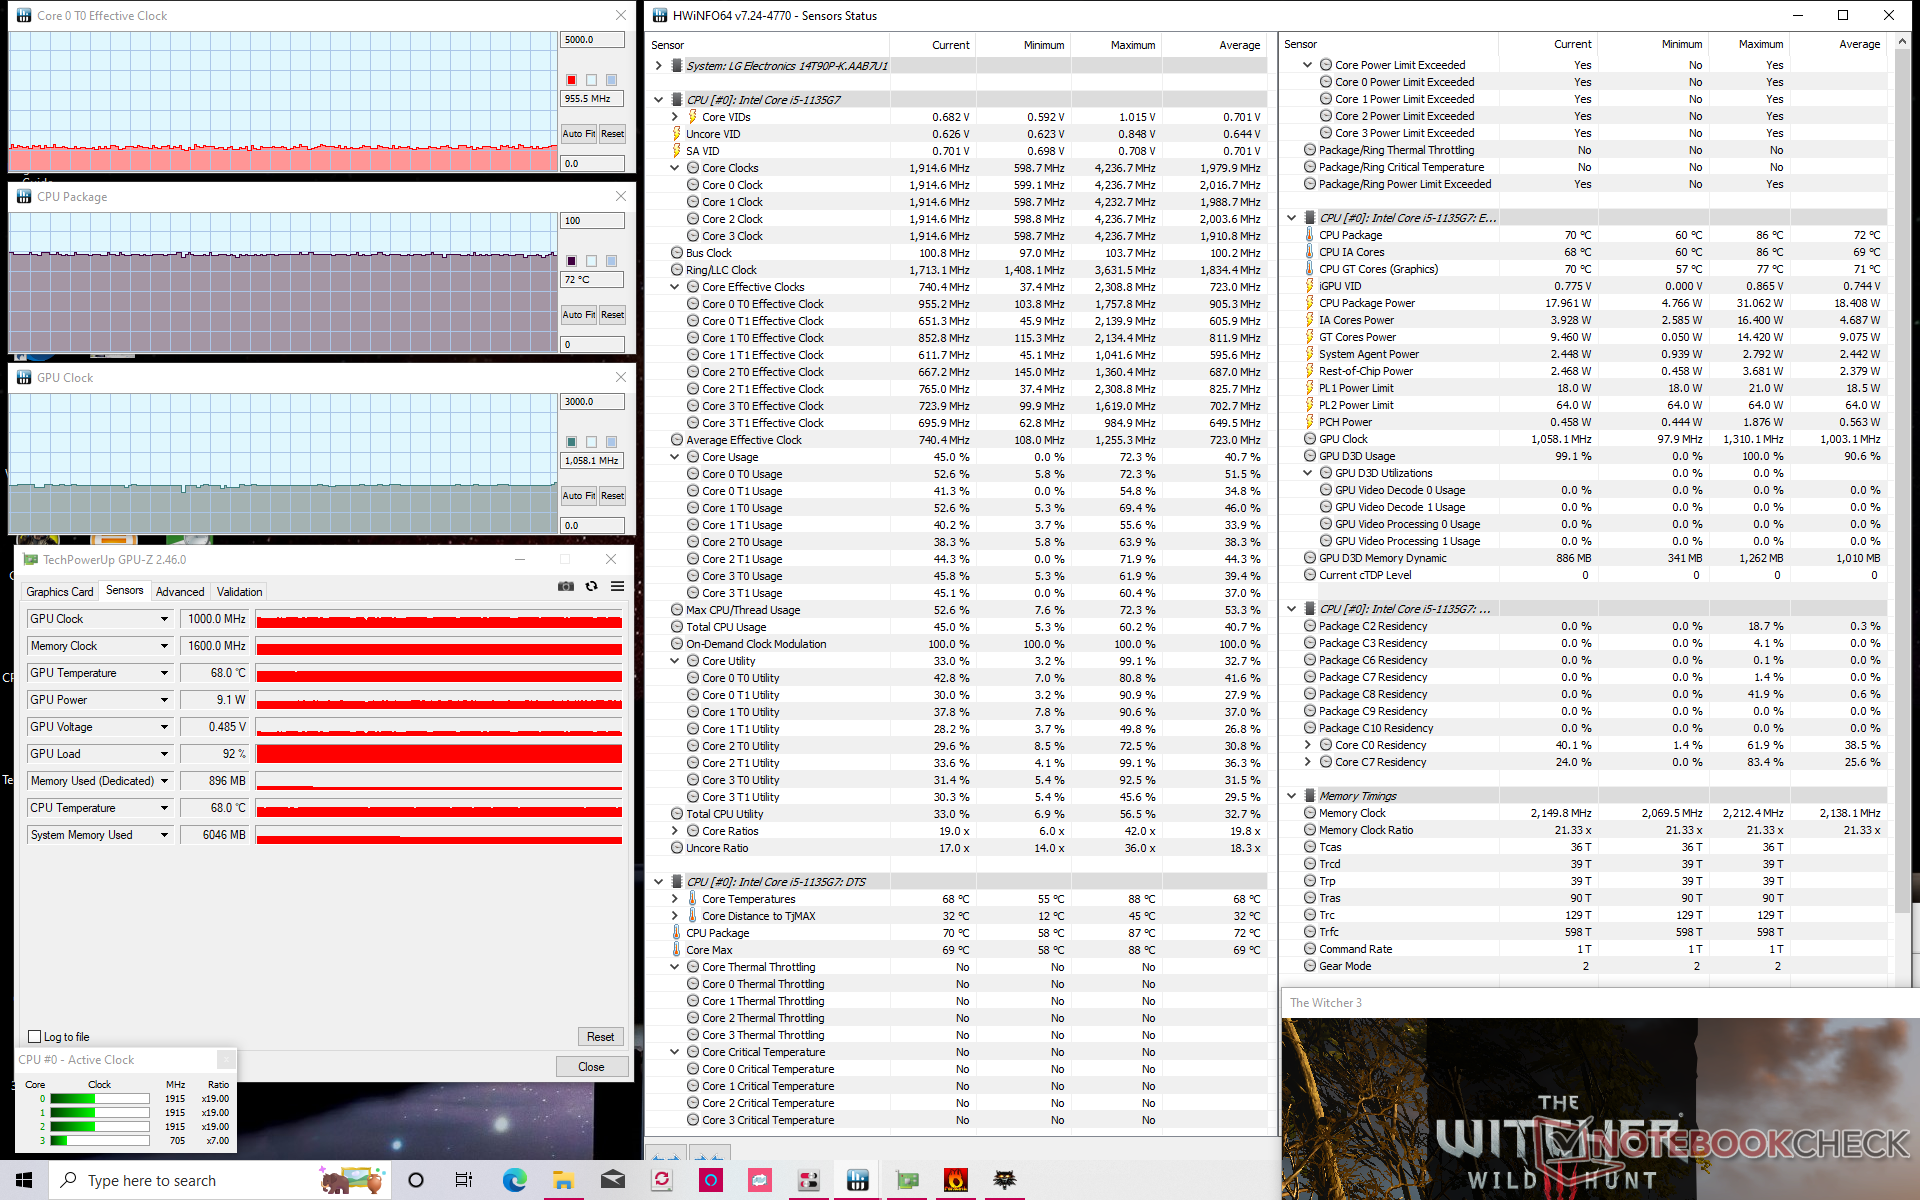
| CPU时钟(GHz) | GPU时钟(MHz) | CPU平均温度(°C) | |
| 系统空闲 | -- | -- | 34 |
| Prime95压力 | 2.1 | -- | 73 |
| Prime95 + FurMark压力 | ~1.2 | 750 - 900 | 71 |
| Witcher 3 压力(平衡功率曲线) | 0.6 | 800 | 63 |
| Witcher 3 压力(性能功率曲线) | ~1.0 | 1000 | 72 |
发言人
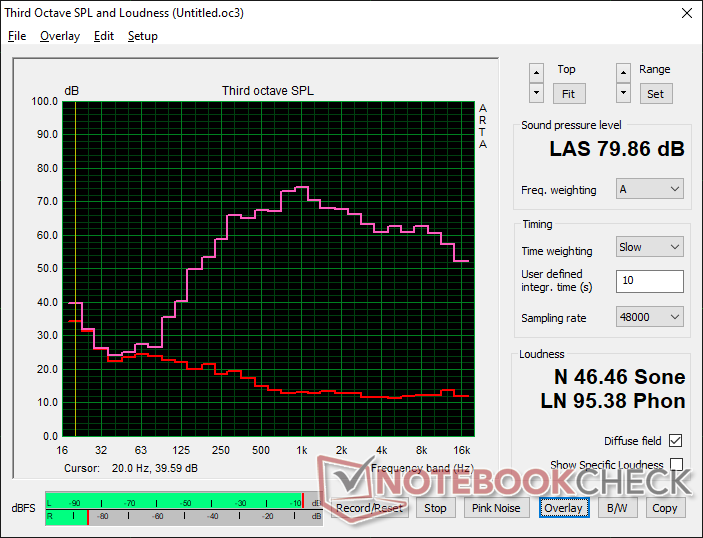
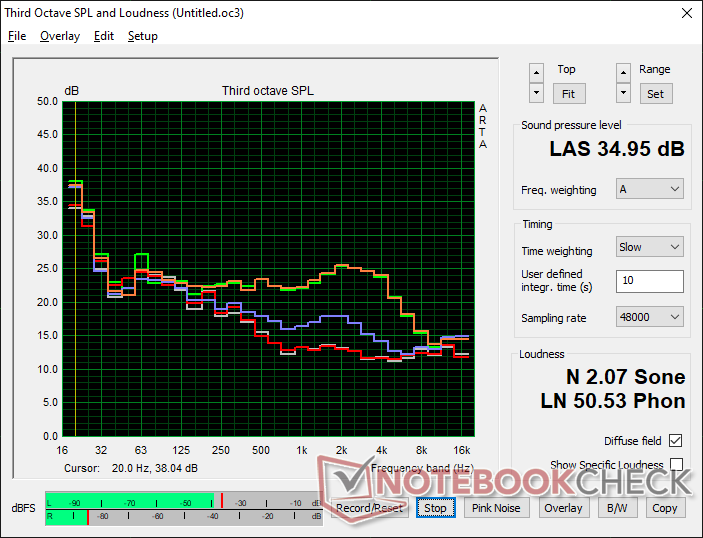
LG Gram 14T90P audio analysis
(±) | speaker loudness is average but good (79.9 dB)
Bass 100 - 315 Hz
(±) | reduced bass - on average 13.1% lower than median
(±) | linearity of bass is average (13.3% delta to prev. frequency)
Mids 400 - 2000 Hz
(±) | higher mids - on average 6.6% higher than median
(+) | mids are linear (4.3% delta to prev. frequency)
Highs 2 - 16 kHz
(+) | balanced highs - only 1.3% away from median
(+) | highs are linear (3.9% delta to prev. frequency)
Overall 100 - 16.000 Hz
(±) | linearity of overall sound is average (15.3% difference to median)
Compared to same class
» 25% of all tested devices in this class were better, 5% similar, 70% worse
» The best had a delta of 6%, average was 20%, worst was 57%
Compared to all devices tested
» 22% of all tested devices were better, 4% similar, 74% worse
» The best had a delta of 4%, average was 24%, worst was 134%
Apple MacBook Pro 16 2021 M1 Pro audio analysis
(+) | speakers can play relatively loud (84.7 dB)
Bass 100 - 315 Hz
(+) | good bass - only 3.8% away from median
(+) | bass is linear (5.2% delta to prev. frequency)
Mids 400 - 2000 Hz
(+) | balanced mids - only 1.3% away from median
(+) | mids are linear (2.1% delta to prev. frequency)
Highs 2 - 16 kHz
(+) | balanced highs - only 1.9% away from median
(+) | highs are linear (2.7% delta to prev. frequency)
Overall 100 - 16.000 Hz
(+) | overall sound is linear (4.6% difference to median)
Compared to same class
» 0% of all tested devices in this class were better, 0% similar, 100% worse
» The best had a delta of 5%, average was 17%, worst was 45%
Compared to all devices tested
» 0% of all tested devices were better, 0% similar, 100% worse
» The best had a delta of 4%, average was 24%, worst was 134%
能源管理
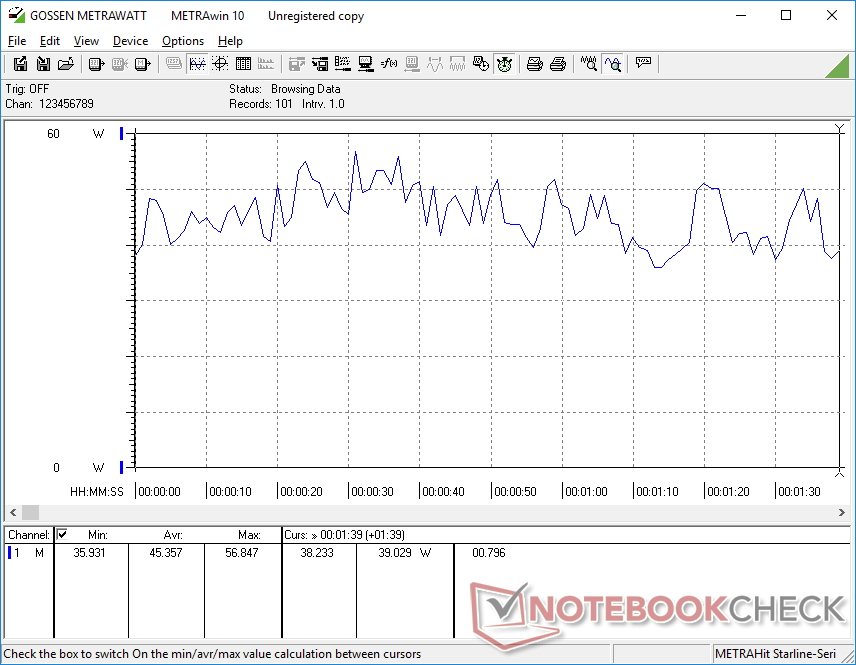
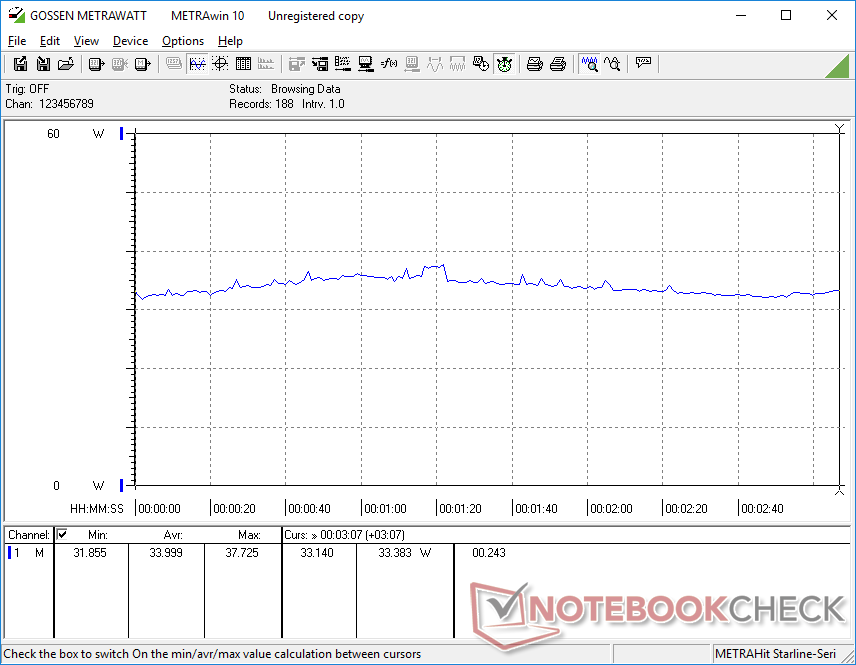
消耗功率
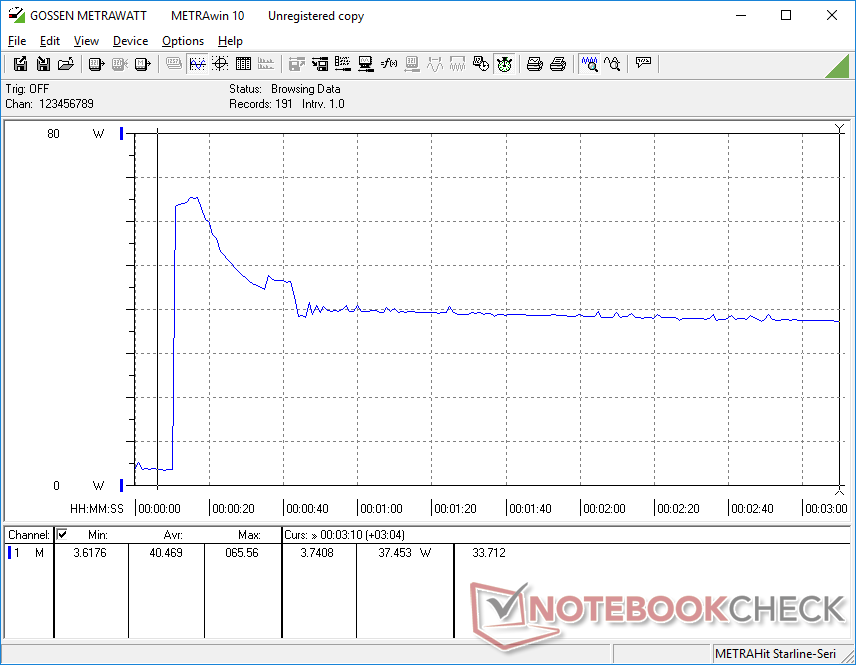
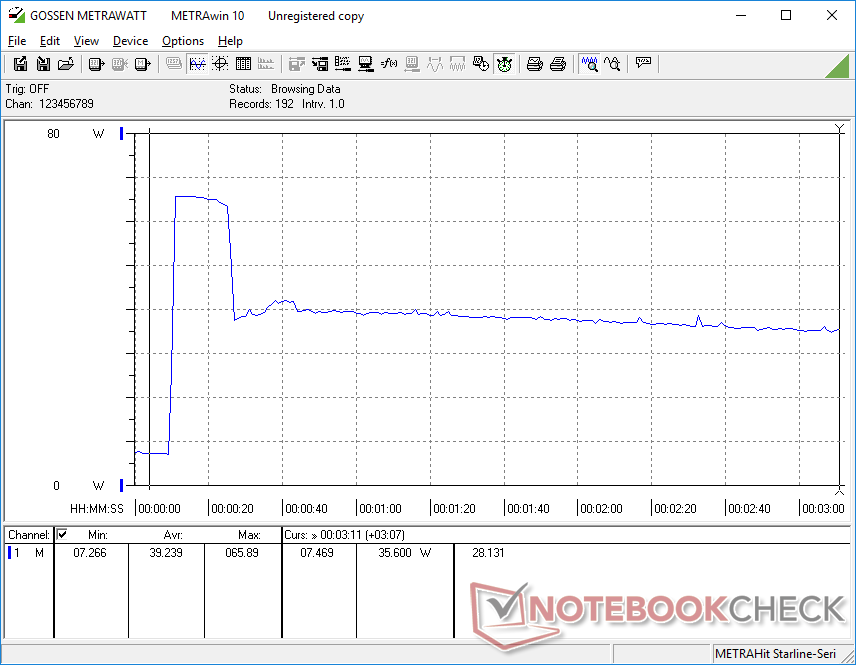
该系统非常省电,在桌面上闲置时仅消耗2瓦至7瓦,这取决于电源配置文件和亮度设置。运行游戏级负载将需要大约45瓦,或比LG Gram 14T90N多出大约36%的功率。然而,GPU的性能至少快了2到3倍,因此,较高的功耗是非常值得的图形收益。
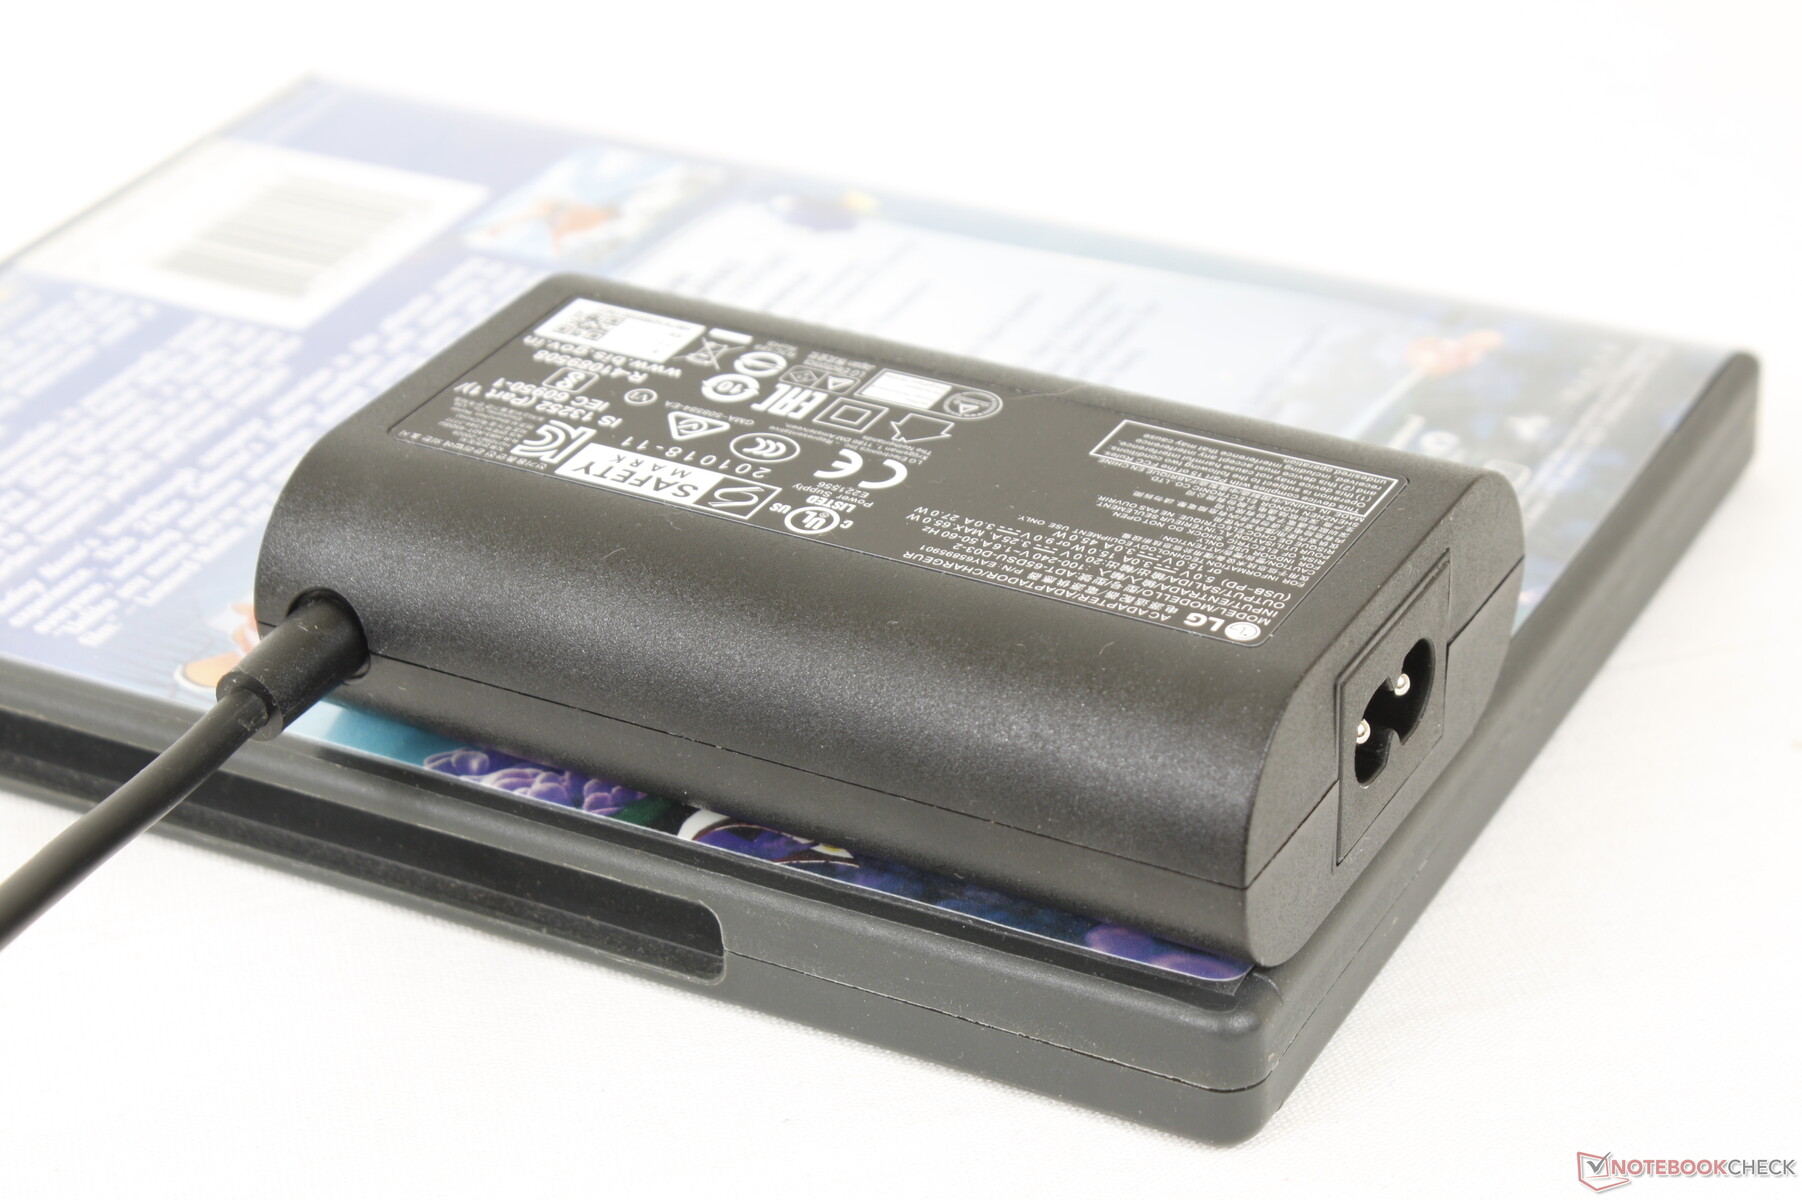
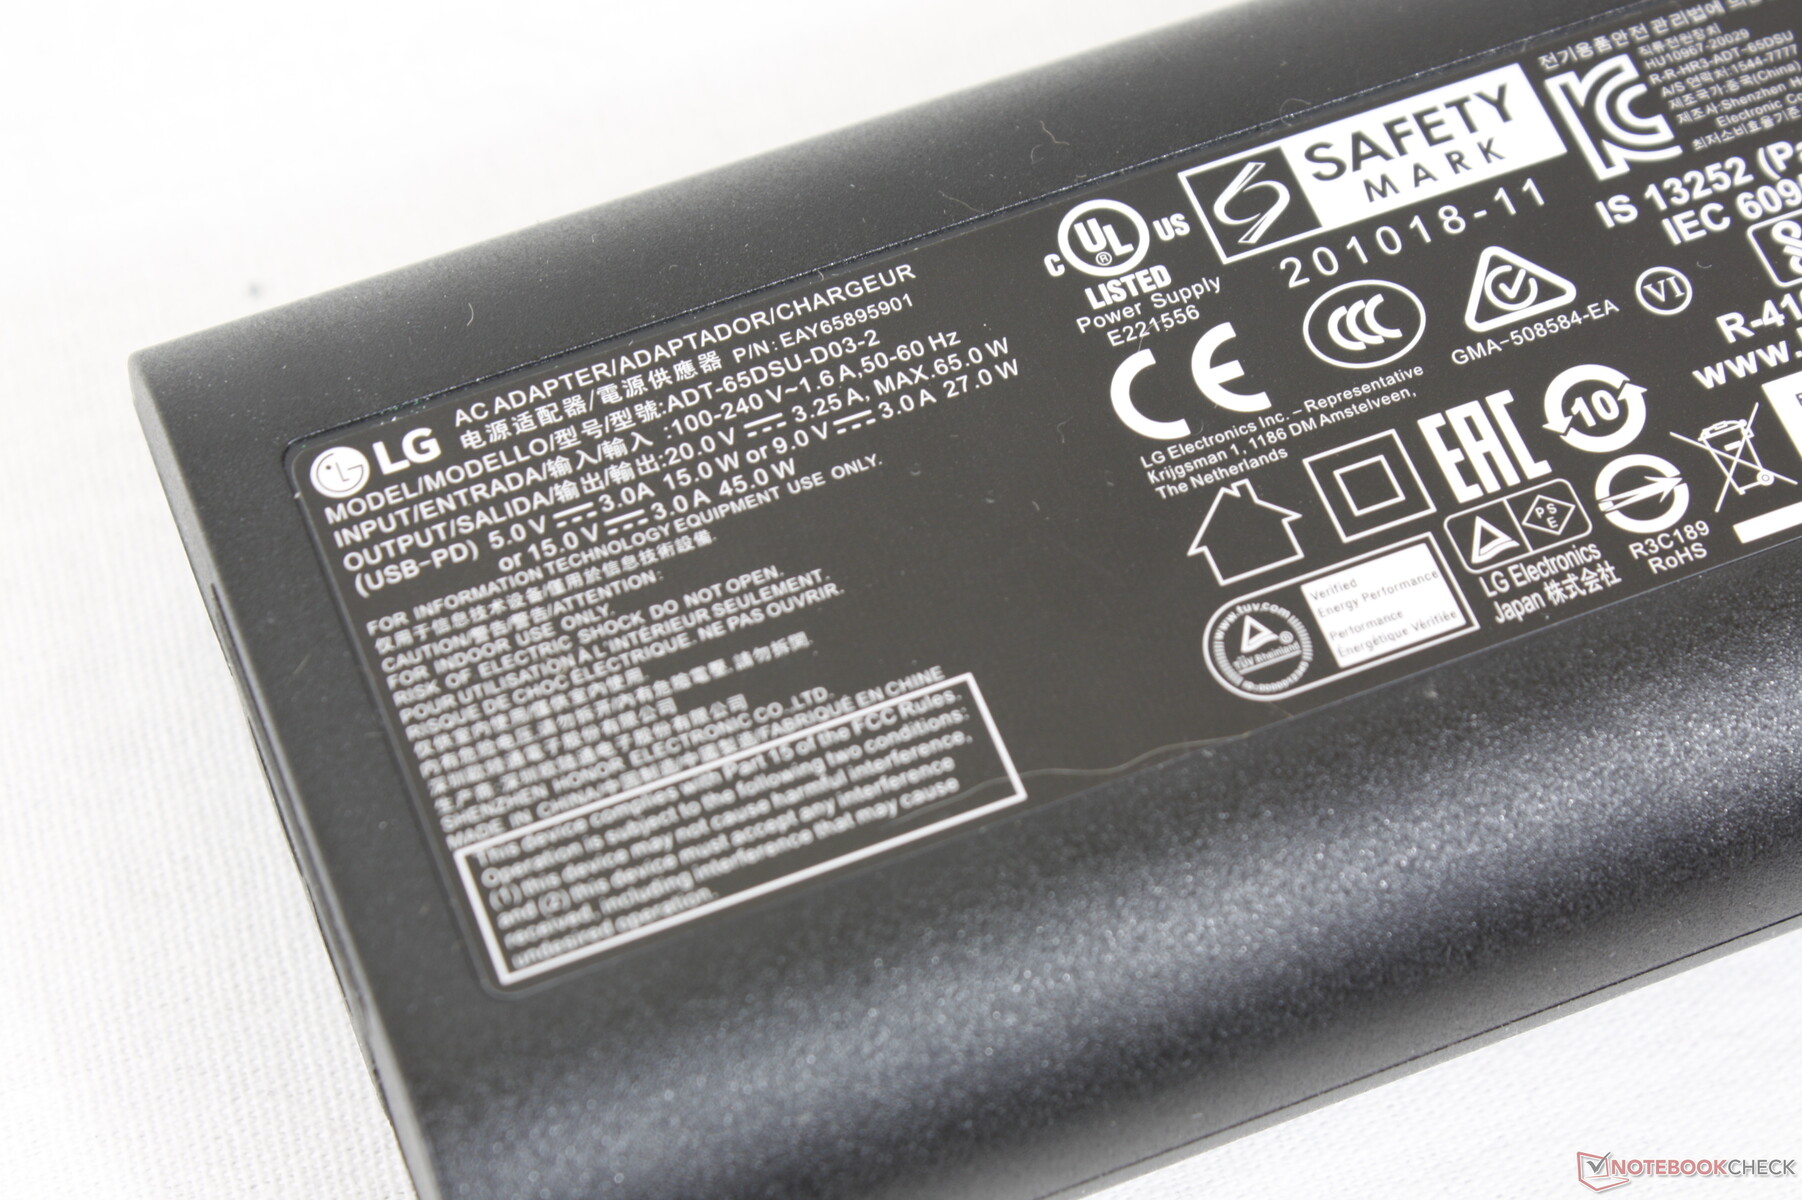
当CPU处于100%的利用率时,我们能够从小型(约9.8 x 6 x 2.7厘米)65瓦的USB-C交流适配器上记录到66瓦的最大临时功耗。
| Off / Standby | |
| Idle | |
| Load |
|
Key:
min: | |
| LG Gram 14T90P i5-1135G7, Iris Xe G7 80EUs, Samsung SSD PM981a MZVLB512HBJQ, IPS, 1900x1200, 14" | Dell XPS 13 9310 2-in-1 i7-1165G7, Iris Xe G7 96EUs, Toshiba BG4 KBG40ZPZ512G, IPS, 1920x1200, 13.4" | Lenovo Yoga 9 14IAP7 82LU0001US i7-1260P, Iris Xe G7 96EUs, Samsung PM9A1 MZVL2512HCJQ, OLED, 2880x1800, 14" | Asus ZenBook Flip 14 UN5401QA-KN085W R7 5800H, Vega 8, Intel SSD 600p SSDPEKKW512G7, OLED, 2880x1800, 14" | HP Spectre x360 14-ea0378ng i7-1165G7, Iris Xe G7 96EUs, Intel Optane Memory H10 with Solid State Storage 32GB + 1TB HBRPEKNX0203AH(L/H), OLED, 3000x2000, 13.5" | MSI Summit E13 Flip Evo A11MT i7-1185G7, Iris Xe G7 96EUs, Phison 1TB SM2801T24GKBB4S-E162, IPS, 1920x1200, 13.4" | LG Gram 14T90N i7-10510U, UHD Graphics 620, Samsung SSD PM981a MZVLB512HBJQ, IPS, 1920x1080, 14" | |
|---|---|---|---|---|---|---|---|
| Power Consumption | 6% | -93% | -57% | -52% | -36% | 10% | |
| Idle Minimum * (Watt) | 2.8 | 2.6 7% | 8 -186% | 6.4 -129% | 6.3 -125% | 4.8 -71% | 2.9 -4% |
| Idle Average * (Watt) | 5.5 | 6.4 -16% | 14 -155% | 9.4 -71% | 11.2 -104% | 8.4 -53% | 5.8 -5% |
| Idle Maximum * (Watt) | 6.4 | 7.7 -20% | 14.4 -125% | 10.7 -67% | 13.3 -108% | 8.6 -34% | 6.2 3% |
| Load Average * (Watt) | 45.4 | 29.9 34% | 59.6 -31% | 52.2 -15% | 32 30% | 47.1 -4% | 32.9 28% |
| Witcher 3 ultra * (Watt) | 34 | 32.2 5% | 53.6 -58% | 53 -56% | 51.6 -52% | ||
| Load Maximum * (Watt) | 65.9 | 47.5 28% | 68.1 -3% | 69 -5% | 35.6 46% | 65.9 -0% | 48.5 26% |
* ... smaller is better
Power Consumption Witcher 3 / Stresstest
Power Consumption external Monitor
电池寿命 - 全天的浏览量
电池容量与老款Gram 14T90N相同,都是72Wh。也许不是巧合,他们的WLAN运行时间也几乎相同,实际浏览时间刚刚超过12小时。很高兴看到电池寿命没有受到影响,即使与第十代Comet Lake-U相比,处理器的性能已经显著提高。
从空电到满电的充电时间非常慢,为2.5小时,而其他大多数超极本的充电时间为1.5小时或更快。
| LG Gram 14T90P i5-1135G7, Iris Xe G7 80EUs, 72 Wh | Dell XPS 13 9310 2-in-1 i7-1165G7, Iris Xe G7 96EUs, 51 Wh | Lenovo Yoga 9 14IAP7 82LU0001US i7-1260P, Iris Xe G7 96EUs, 75 Wh | Asus ZenBook Flip 14 UN5401QA-KN085W R7 5800H, Vega 8, 63 Wh | HP Spectre x360 14-ea0378ng i7-1165G7, Iris Xe G7 96EUs, 66 Wh | MSI Summit E13 Flip Evo A11MT i7-1185G7, Iris Xe G7 96EUs, 70 Wh | LG Gram 14T90N i7-10510U, UHD Graphics 620, 72 Wh | |
|---|---|---|---|---|---|---|---|
| Battery runtime | 18% | -44% | -19% | -12% | -15% | 8% | |
| WiFi v1.3 (h) | 12.1 | 10.7 -12% | 6.8 -44% | 8.7 -28% | 7.8 -36% | 11.2 -7% | 12.5 3% |
| Load (h) | 2.3 | 3.4 48% | 2.1 -9% | 2.6 13% | 1.8 -22% | 2.6 13% | |
| Reader / Idle (h) | 25.4 | 13.4 | 21.1 | 32.8 | |||
| H.264 (h) | 9 | 11.1 |
Pros
Cons
Verdict — The Gram To Get
比平均水平更轻的重量、清晰的16:10 DCI-P3触摸屏和出色的电池寿命都是Gram 14T90P的亮点。它的新设计在不增加任何重量的情况下更加强大,以保持14英寸Gram系列相对于竞争对手的最大优势之一,如更重的联想Yoga 9 14 ,惠普Spectre x360 14 ,或戴尔XPS 13二合一 。机箱的刚性可能稍差,但对于旅行者或学生来说,节省的重量可能值得一试。
格兰14T90P是14英寸格兰系列需要的全面更新。
不幸的是,有一个体面的清单,我们希望看到改进的隐患。充电速度慢,游戏时帧率不稳定,点击板海绵状,显示屏亮度一般,缺乏对Windows Hello的支持,维修困难,铰链硬度一般,所有这些都使一台本来很好的14英寸可折叠机降级。如果LG能在保持低重量的同时解决这些主要缺点,那么Gram 14将很容易与戴尔、联想或惠普的更受欢迎的替代品相提并论。
LG Gram 14T90P
- 05/21/2022 v7 (old)
Allen Ngo
Price comparison

