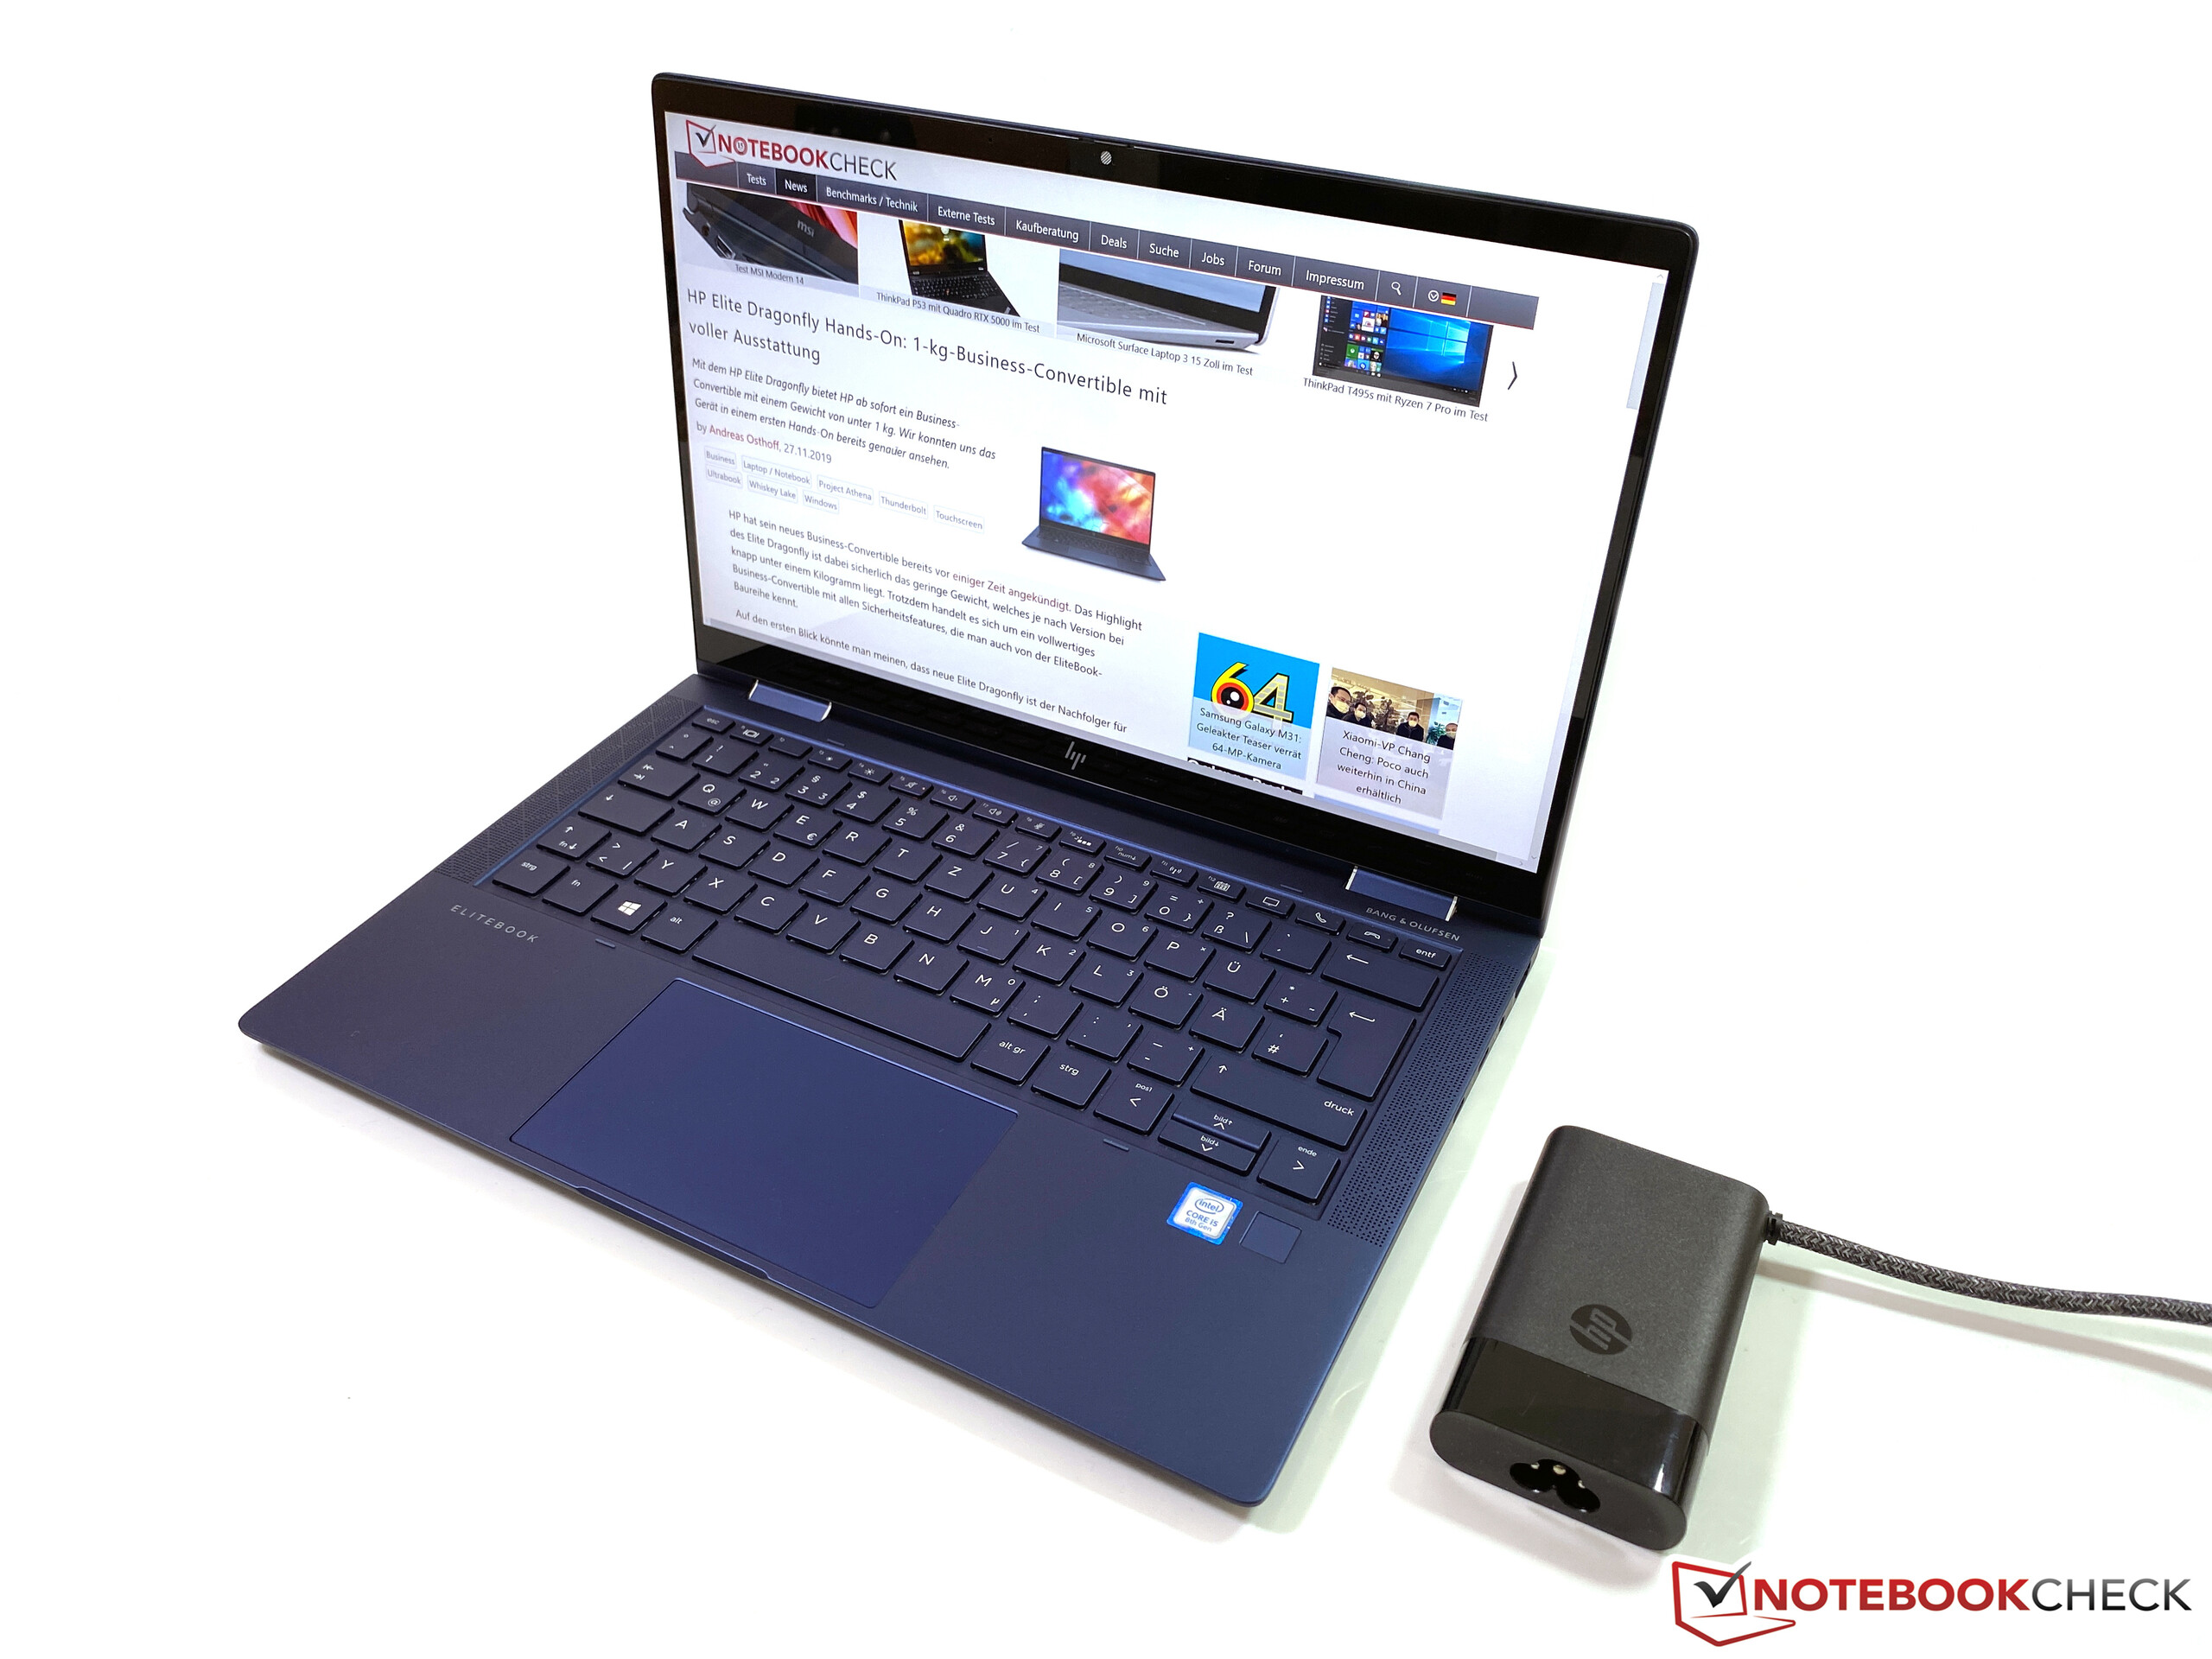
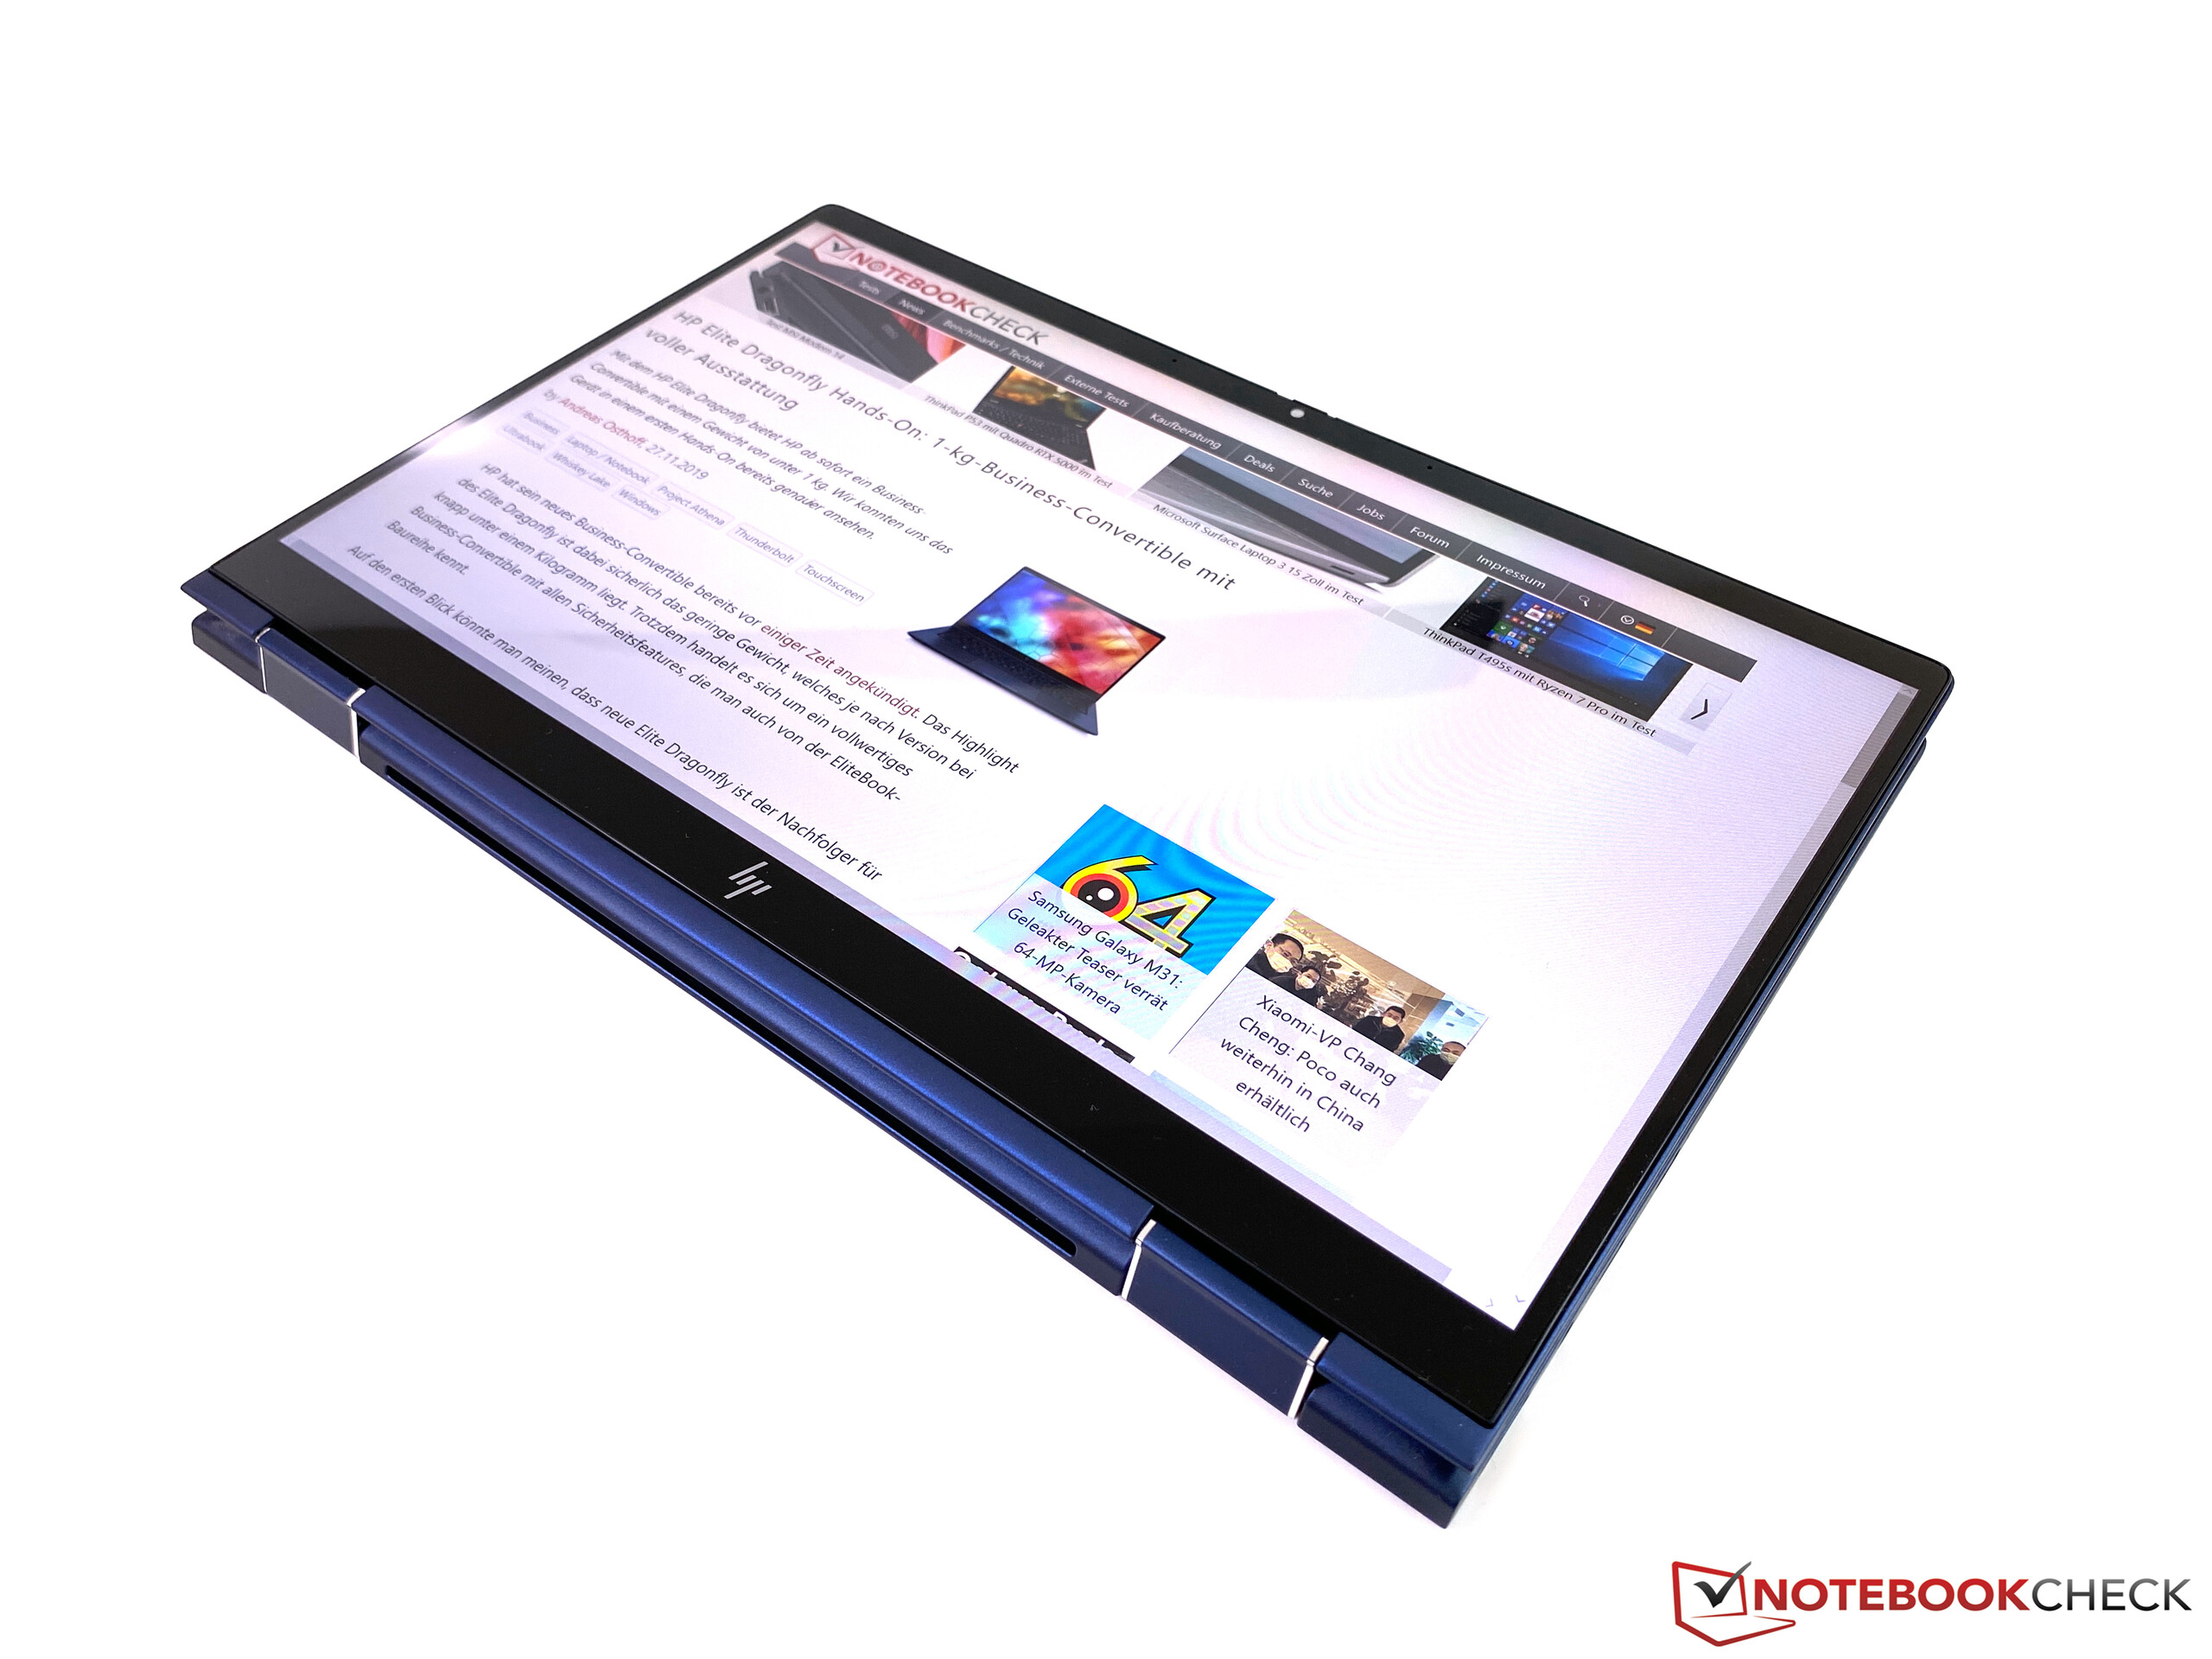
HP Elite Dragonfly Business-Convertible笔记本电脑:这台惠普的翻转本令我们印象深刻
Rating | Date | Model | Weight | Height | Size | Resolution | Price |
|---|---|---|---|---|---|---|---|
| 90.3 % v7 (old) | 06 / 2020 | HP Elite Dragonfly-8MK79EA i5-8265U, UHD Graphics 620 | 1.1 kg | 16.1 mm | 13.30" | 1920x1080 | |
| 88.4 % v7 (old) | 07 / 2020 | HP Spectre x360 13-aw0013dx i7-1065G7, Iris Plus Graphics G7 (Ice Lake 64 EU) | 1.2 kg | 16.9 mm | 13.30" | 1920x1080 | |
| 87.4 % v6 (old) | 08 / 2019 | Lenovo ThinkPad X390 Yoga-20NQS05R00 i7-8565U, UHD Graphics 620 | 1.3 kg | 15.95 mm | 13.30" | 1920x1080 | |
| 86.3 % v7 (old) | 01 / 2020 | Dell XPS 13 7390 2-in-1 Core i7 i7-1065G7, Iris Plus Graphics G7 (Ice Lake 64 EU) | 1.3 kg | 13 mm | 13.40" | 1920x1200 |
| Networking | |
| iperf3 transmit AX12 | |
| HP Elite Dragonfly-8MK79EA | |
| Lenovo ThinkPad X390 Yoga-20NQS05R00 | |
| Dell XPS 13 7390 2-in-1 Core i7 | |
| iperf3 receive AX12 | |
| HP Elite Dragonfly-8MK79EA | |
| Lenovo ThinkPad X390 Yoga-20NQS05R00 | |
| Dell XPS 13 7390 2-in-1 Core i7 | |

")
")
| |||||||||||||||||||||||||
Brightness Distribution: 87 %
Center on Battery: 411 cd/m²
Contrast: 1868:1 (Black: 0.22 cd/m²)
ΔE ColorChecker Calman: 1.8 | ∀{0.5-29.43 Ø4.73}
calibrated: 1
ΔE Greyscale Calman: 2.5 | ∀{0.09-98 Ø4.97}
99.3% sRGB (Argyll 1.6.3 3D)
64.7% AdobeRGB 1998 (Argyll 1.6.3 3D)
70.9% AdobeRGB 1998 (Argyll 3D)
99.4% sRGB (Argyll 3D)
69% Display P3 (Argyll 3D)
Gamma: 2.26
CCT: 6448 K
| HP Elite Dragonfly-8MK79EA AUO5E2D, IPS, 1920x1080, 13.3" | HP Spectre x360 13-aw0013dx AU Optronics AUO5E2D, IPS, 1920x1080, 13.3" | Lenovo ThinkPad X390 Yoga-20NQS05R00 LP133WF7-SPA1, IPS LED, 1920x1080, 13.3" | Dell XPS 13 7390 2-in-1 Core i7 Sharp LQ134N1, IPS, 1920x1200, 13.4" | |
|---|---|---|---|---|
| Display | 0% | -4% | 1% | |
| Display P3 Coverage (%) | 69 | 69.6 1% | 65.2 -6% | 69.9 1% |
| sRGB Coverage (%) | 99.4 | 98.9 -1% | 97 -2% | 99.2 0% |
| AdobeRGB 1998 Coverage (%) | 70.9 | 71.5 1% | 67.3 -5% | 71.5 1% |
| Response Times | -5% | 6% | 18% | |
| Response Time Grey 50% / Grey 80% * (ms) | 60.8 ? | 60.8 ? -0% | 59.2 ? 3% | 47.6 ? 22% |
| Response Time Black / White * (ms) | 33.8 ? | 36.8 ? -9% | 30.8 ? 9% | 29.2 ? 14% |
| PWM Frequency (Hz) | 2500 ? | |||
| Screen | -44% | -56% | -7% | |
| Brightness middle (cd/m²) | 411 | 447.4 9% | 319 -22% | 549.8 34% |
| Brightness (cd/m²) | 388 | 420 8% | 306 -21% | 520 34% |
| Brightness Distribution (%) | 87 | 85 -2% | 90 3% | 86 -1% |
| Black Level * (cd/m²) | 0.22 | 0.31 -41% | 0.15 32% | 0.39 -77% |
| Contrast (:1) | 1868 | 1443 -23% | 2127 14% | 1410 -25% |
| Colorchecker dE 2000 * | 1.8 | 4.23 -135% | 6.1 -239% | 2.12 -18% |
| Colorchecker dE 2000 max. * | 4.1 | 9.34 -128% | 9.7 -137% | 3.66 11% |
| Colorchecker dE 2000 calibrated * | 1 | 1.32 -32% | 1 -0% | 1.37 -37% |
| Greyscale dE 2000 * | 2.5 | 6.1 -144% | 8.6 -244% | 2.6 -4% |
| Gamma | 2.26 97% | 2.11 104% | 2.62 84% | 2.3 96% |
| CCT | 6448 101% | 6136 106% | 6613 98% | 6884 94% |
| Color Space (Percent of AdobeRGB 1998) (%) | 64.7 | 64.8 0% | 61.9 -4% | 65.4 1% |
| Color Space (Percent of sRGB) (%) | 99.3 | 98.9 0% | 96.8 -3% | 99.7 0% |
| Total Average (Program / Settings) | -16% /
-31% | -18% /
-39% | 4% /
-3% |
* ... smaller is better
Display Response Times
| ↔ Response Time Black to White | ||
|---|---|---|
| 33.8 ms ... rise ↗ and fall ↘ combined | ↗ 17.2 ms rise | 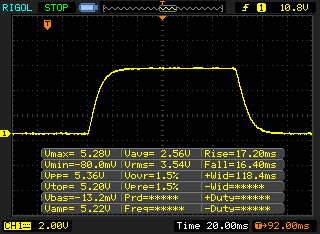 |
| ↘ 16.6 ms fall | ||
| The screen shows slow response rates in our tests and will be unsatisfactory for gamers. In comparison, all tested devices range from 0.1 (minimum) to 240 (maximum) ms. » 90 % of all devices are better. This means that the measured response time is worse than the average of all tested devices (19.9 ms). | ||
| ↔ Response Time 50% Grey to 80% Grey | ||
| 60.8 ms ... rise ↗ and fall ↘ combined | ↗ 30.8 ms rise | 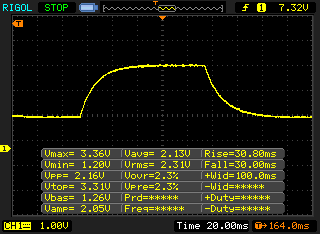 |
| ↘ 30 ms fall | ||
| The screen shows slow response rates in our tests and will be unsatisfactory for gamers. In comparison, all tested devices range from 0.165 (minimum) to 636 (maximum) ms. » 96 % of all devices are better. This means that the measured response time is worse than the average of all tested devices (31.1 ms). | ||
Screen Flickering / PWM (Pulse-Width Modulation)
| Screen flickering / PWM not detected | 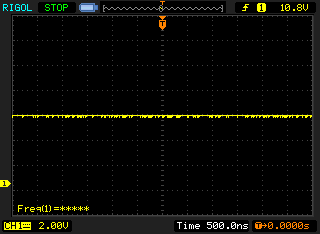 | ||
In comparison: 52 % of all tested devices do not use PWM to dim the display. If PWM was detected, an average of 7794 (minimum: 5 - maximum: 343500) Hz was measured. | |||
| PCMark 8 Home Score Accelerated v2 | 3563 points | |
| PCMark 8 Creative Score Accelerated v2 | 4647 points | |
| PCMark 8 Work Score Accelerated v2 | 4548 points | |
| PCMark 10 Score | 3636 points | |
Help | ||

| 3DMark 11 Performance | 1956 points | |
| 3DMark Ice Storm Standard Score | 57515 points | |
| 3DMark Fire Strike Score | 1091 points | |
| 3DMark Time Spy Score | 417 points | |
Help | ||
| low | med. | high | ultra | |
|---|---|---|---|---|
| BioShock Infinite (2013) | 55.6 | 32.3 | 27.7 | 9.5 |
| The Witcher 3 (2015) | 17.1 | |||
| Dota 2 Reborn (2015) | 66.4 | 40.2 | 18.7 | 16.9 |
| X-Plane 11.11 (2018) | 11.7 | 9.84 | 9.25 |
Noise level
| Idle |
| 29.5 / 30 / 30.3 dB(A) |
| Load |
| 31.6 / 31.6 dB(A) |
 | ||
30 dB silent 40 dB(A) audible 50 dB(A) loud |
||
min: | ||
| HP Elite Dragonfly-8MK79EA UHD Graphics 620, i5-8265U, Intel Optane Memory H10 with Solid State Storage 32GB + 512GB HBRPEKNX0202A(L/H) | HP Spectre x360 13-aw0013dx Iris Plus Graphics G7 (Ice Lake 64 EU), i7-1065G7, Intel Optane Memory H10 with Solid State Storage 32GB + 512GB HBRPEKNX0202A(L/H) | Lenovo ThinkPad X390 Yoga-20NQS05R00 UHD Graphics 620, i7-8565U, Intel SSD Pro 7600p SSDPEKKF512G8L | Dell XPS 13 7390 2-in-1 Core i7 Iris Plus Graphics G7 (Ice Lake 64 EU), i7-1065G7, Toshiba BG4 KBG40ZPZ512G | |
|---|---|---|---|---|
| Noise | 3% | -2% | -2% | |
| off / environment * (dB) | 29.5 | 28.5 3% | 29.2 1% | 28.1 5% |
| Idle Minimum * (dB) | 29.5 | 28.5 3% | 29.2 1% | 28.1 5% |
| Idle Average * (dB) | 30 | 28.5 5% | 29.2 3% | 28.1 6% |
| Idle Maximum * (dB) | 30.3 | 28.5 6% | 29.2 4% | 28.1 7% |
| Load Average * (dB) | 31.6 | 28.5 10% | 35 -11% | 31.7 -0% |
| Load Maximum * (dB) | 31.6 | 35.3 -12% | 35 -11% | 43.4 -37% |
| Witcher 3 ultra * (dB) | 35.3 | 43.4 |
* ... smaller is better
(±) The maximum temperature on the upper side is 41.1 °C / 106 F, compared to the average of 35.4 °C / 96 F, ranging from 19.6 to 60 °C for the class Convertible.
(-) The bottom heats up to a maximum of 47.5 °C / 118 F, compared to the average of 36.9 °C / 98 F
(+) In idle usage, the average temperature for the upper side is 25.1 °C / 77 F, compared to the device average of 30.3 °C / 87 F.
(+) The palmrests and touchpad are cooler than skin temperature with a maximum of 30.4 °C / 86.7 F and are therefore cool to the touch.
(-) The average temperature of the palmrest area of similar devices was 28 °C / 82.4 F (-2.4 °C / -4.3 F).
HP Elite Dragonfly-8MK79EA audio analysis
(+) | speakers can play relatively loud (84.1 dB)
Bass 100 - 315 Hz
(±) | reduced bass - on average 7.8% lower than median
(±) | linearity of bass is average (9.6% delta to prev. frequency)
Mids 400 - 2000 Hz
(+) | balanced mids - only 4% away from median
(+) | mids are linear (4.5% delta to prev. frequency)
Highs 2 - 16 kHz
(±) | higher highs - on average 5.8% higher than median
(±) | linearity of highs is average (7.1% delta to prev. frequency)
Overall 100 - 16.000 Hz
(+) | overall sound is linear (14.1% difference to median)
Compared to same class
» 20% of all tested devices in this class were better, 4% similar, 76% worse
» The best had a delta of 6%, average was 20%, worst was 57%
Compared to all devices tested
» 17% of all tested devices were better, 4% similar, 80% worse
» The best had a delta of 4%, average was 24%, worst was 134%
Dell XPS 13 7390 2-in-1 Core i7 audio analysis
(±) | speaker loudness is average but good (80.7 dB)
Bass 100 - 315 Hz
(±) | reduced bass - on average 7.8% lower than median
(±) | linearity of bass is average (12.5% delta to prev. frequency)
Mids 400 - 2000 Hz
(+) | balanced mids - only 4.5% away from median
(+) | mids are linear (6.2% delta to prev. frequency)
Highs 2 - 16 kHz
(+) | balanced highs - only 3.4% away from median
(±) | linearity of highs is average (10.5% delta to prev. frequency)
Overall 100 - 16.000 Hz
(+) | overall sound is linear (14.8% difference to median)
Compared to same class
» 23% of all tested devices in this class were better, 4% similar, 72% worse
» The best had a delta of 6%, average was 20%, worst was 57%
Compared to all devices tested
» 20% of all tested devices were better, 4% similar, 76% worse
» The best had a delta of 4%, average was 24%, worst was 134%
| Off / Standby | |
| Idle | |
| Load |
|
Key:
min: | |
| HP Elite Dragonfly-8MK79EA i5-8265U, UHD Graphics 620, Intel Optane Memory H10 with Solid State Storage 32GB + 512GB HBRPEKNX0202A(L/H), IPS, 1920x1080, 13.3" | HP Spectre x360 13-aw0013dx i7-1065G7, Iris Plus Graphics G7 (Ice Lake 64 EU), Intel Optane Memory H10 with Solid State Storage 32GB + 512GB HBRPEKNX0202A(L/H), IPS, 1920x1080, 13.3" | Lenovo ThinkPad X390 Yoga-20NQS05R00 i7-8565U, UHD Graphics 620, Intel SSD Pro 7600p SSDPEKKF512G8L, IPS LED, 1920x1080, 13.3" | Dell XPS 13 7390 2-in-1 Core i7 i7-1065G7, Iris Plus Graphics G7 (Ice Lake 64 EU), Toshiba BG4 KBG40ZPZ512G, IPS, 1920x1200, 13.4" | Average Intel UHD Graphics 620 | Average of class Convertible | |
|---|---|---|---|---|---|---|
| Power Consumption | -9% | -20% | 1% | -11% | -29% | |
| Idle Minimum * (Watt) | 3.5 | 3.9 -11% | 3.46 1% | 2.6 26% | 3.81 ? -9% | 4.29 ? -23% |
| Idle Average * (Watt) | 5.1 | 6.3 -24% | 5.88 -15% | 5.3 -4% | 6.94 ? -36% | 7.08 ? -39% |
| Idle Maximum * (Watt) | 8.1 | 6.8 16% | 9.12 -13% | 7 14% | 8.75 ? -8% | 8.68 ? -7% |
| Load Average * (Watt) | 35.6 | 32.6 8% | 45.6 -28% | 43.1 -21% | 35 ? 2% | 44 ? -24% |
| Load Maximum * (Watt) | 44.7 | 59 -32% | 65.9 -47% | 49 -10% | 47.5 ? -6% | 67.3 ? -51% |
| Witcher 3 ultra * (Watt) | 25.6 | 43.1 |
* ... smaller is better
| HP Elite Dragonfly-8MK79EA i5-8265U, UHD Graphics 620, 56.2 Wh | HP Spectre x360 13-aw0013dx i7-1065G7, Iris Plus Graphics G7 (Ice Lake 64 EU), 60 Wh | Lenovo ThinkPad X390 Yoga-20NQS05R00 i7-8565U, UHD Graphics 620, 50 Wh | Dell XPS 13 7390 2-in-1 Core i7 i7-1065G7, Iris Plus Graphics G7 (Ice Lake 64 EU), 51 Wh | Average of class Convertible | |
|---|---|---|---|---|---|
| Battery runtime | -3% | -27% | -11% | 3% | |
| H.264 (h) | 12 | 10 -17% | 15.3 ? 28% | ||
| WiFi v1.3 (h) | 10.1 | 9.9 -2% | 8.2 -19% | 9 -11% | 11.9 ? 18% |
| Load (h) | 2.8 | 2.7 -4% | 1.5 -46% | 1.779 ? -36% | |
| Reader / Idle (h) | 37.1 | 27.7 ? |
Pros
Cons
Verdict – Elite Dragonfly is a very good Business Convertible
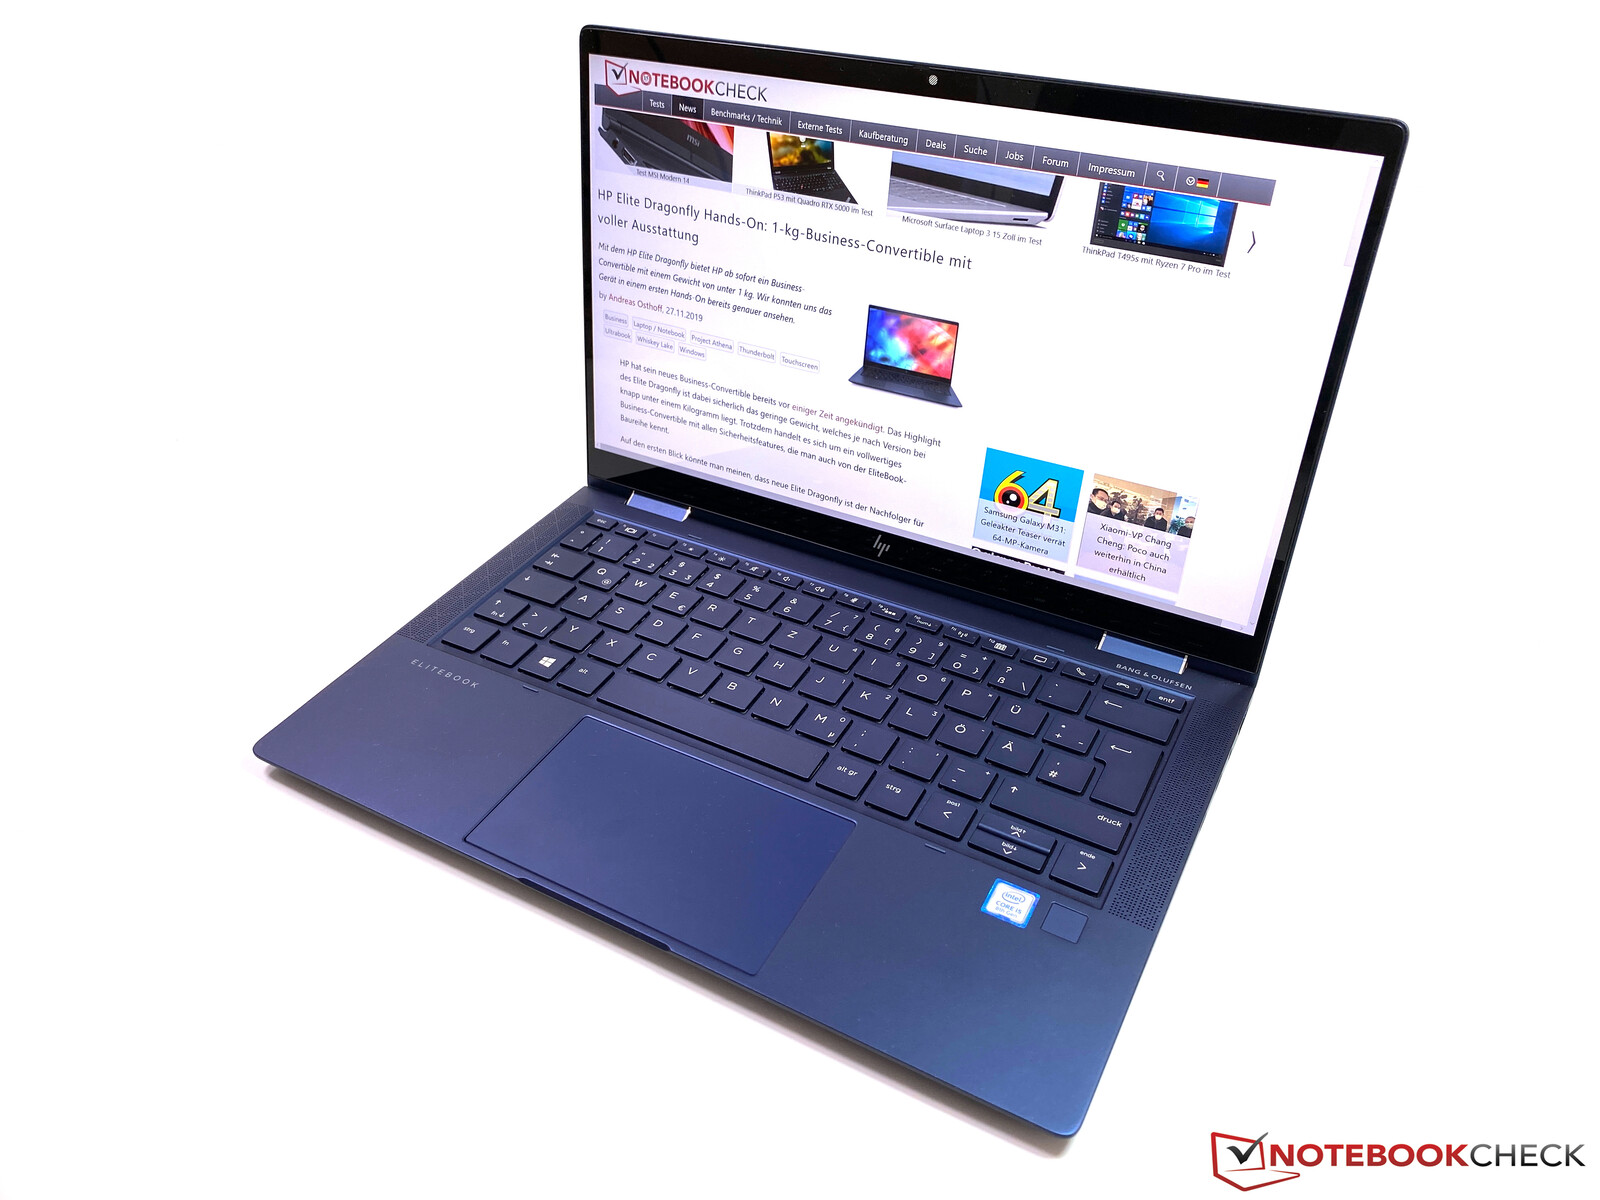
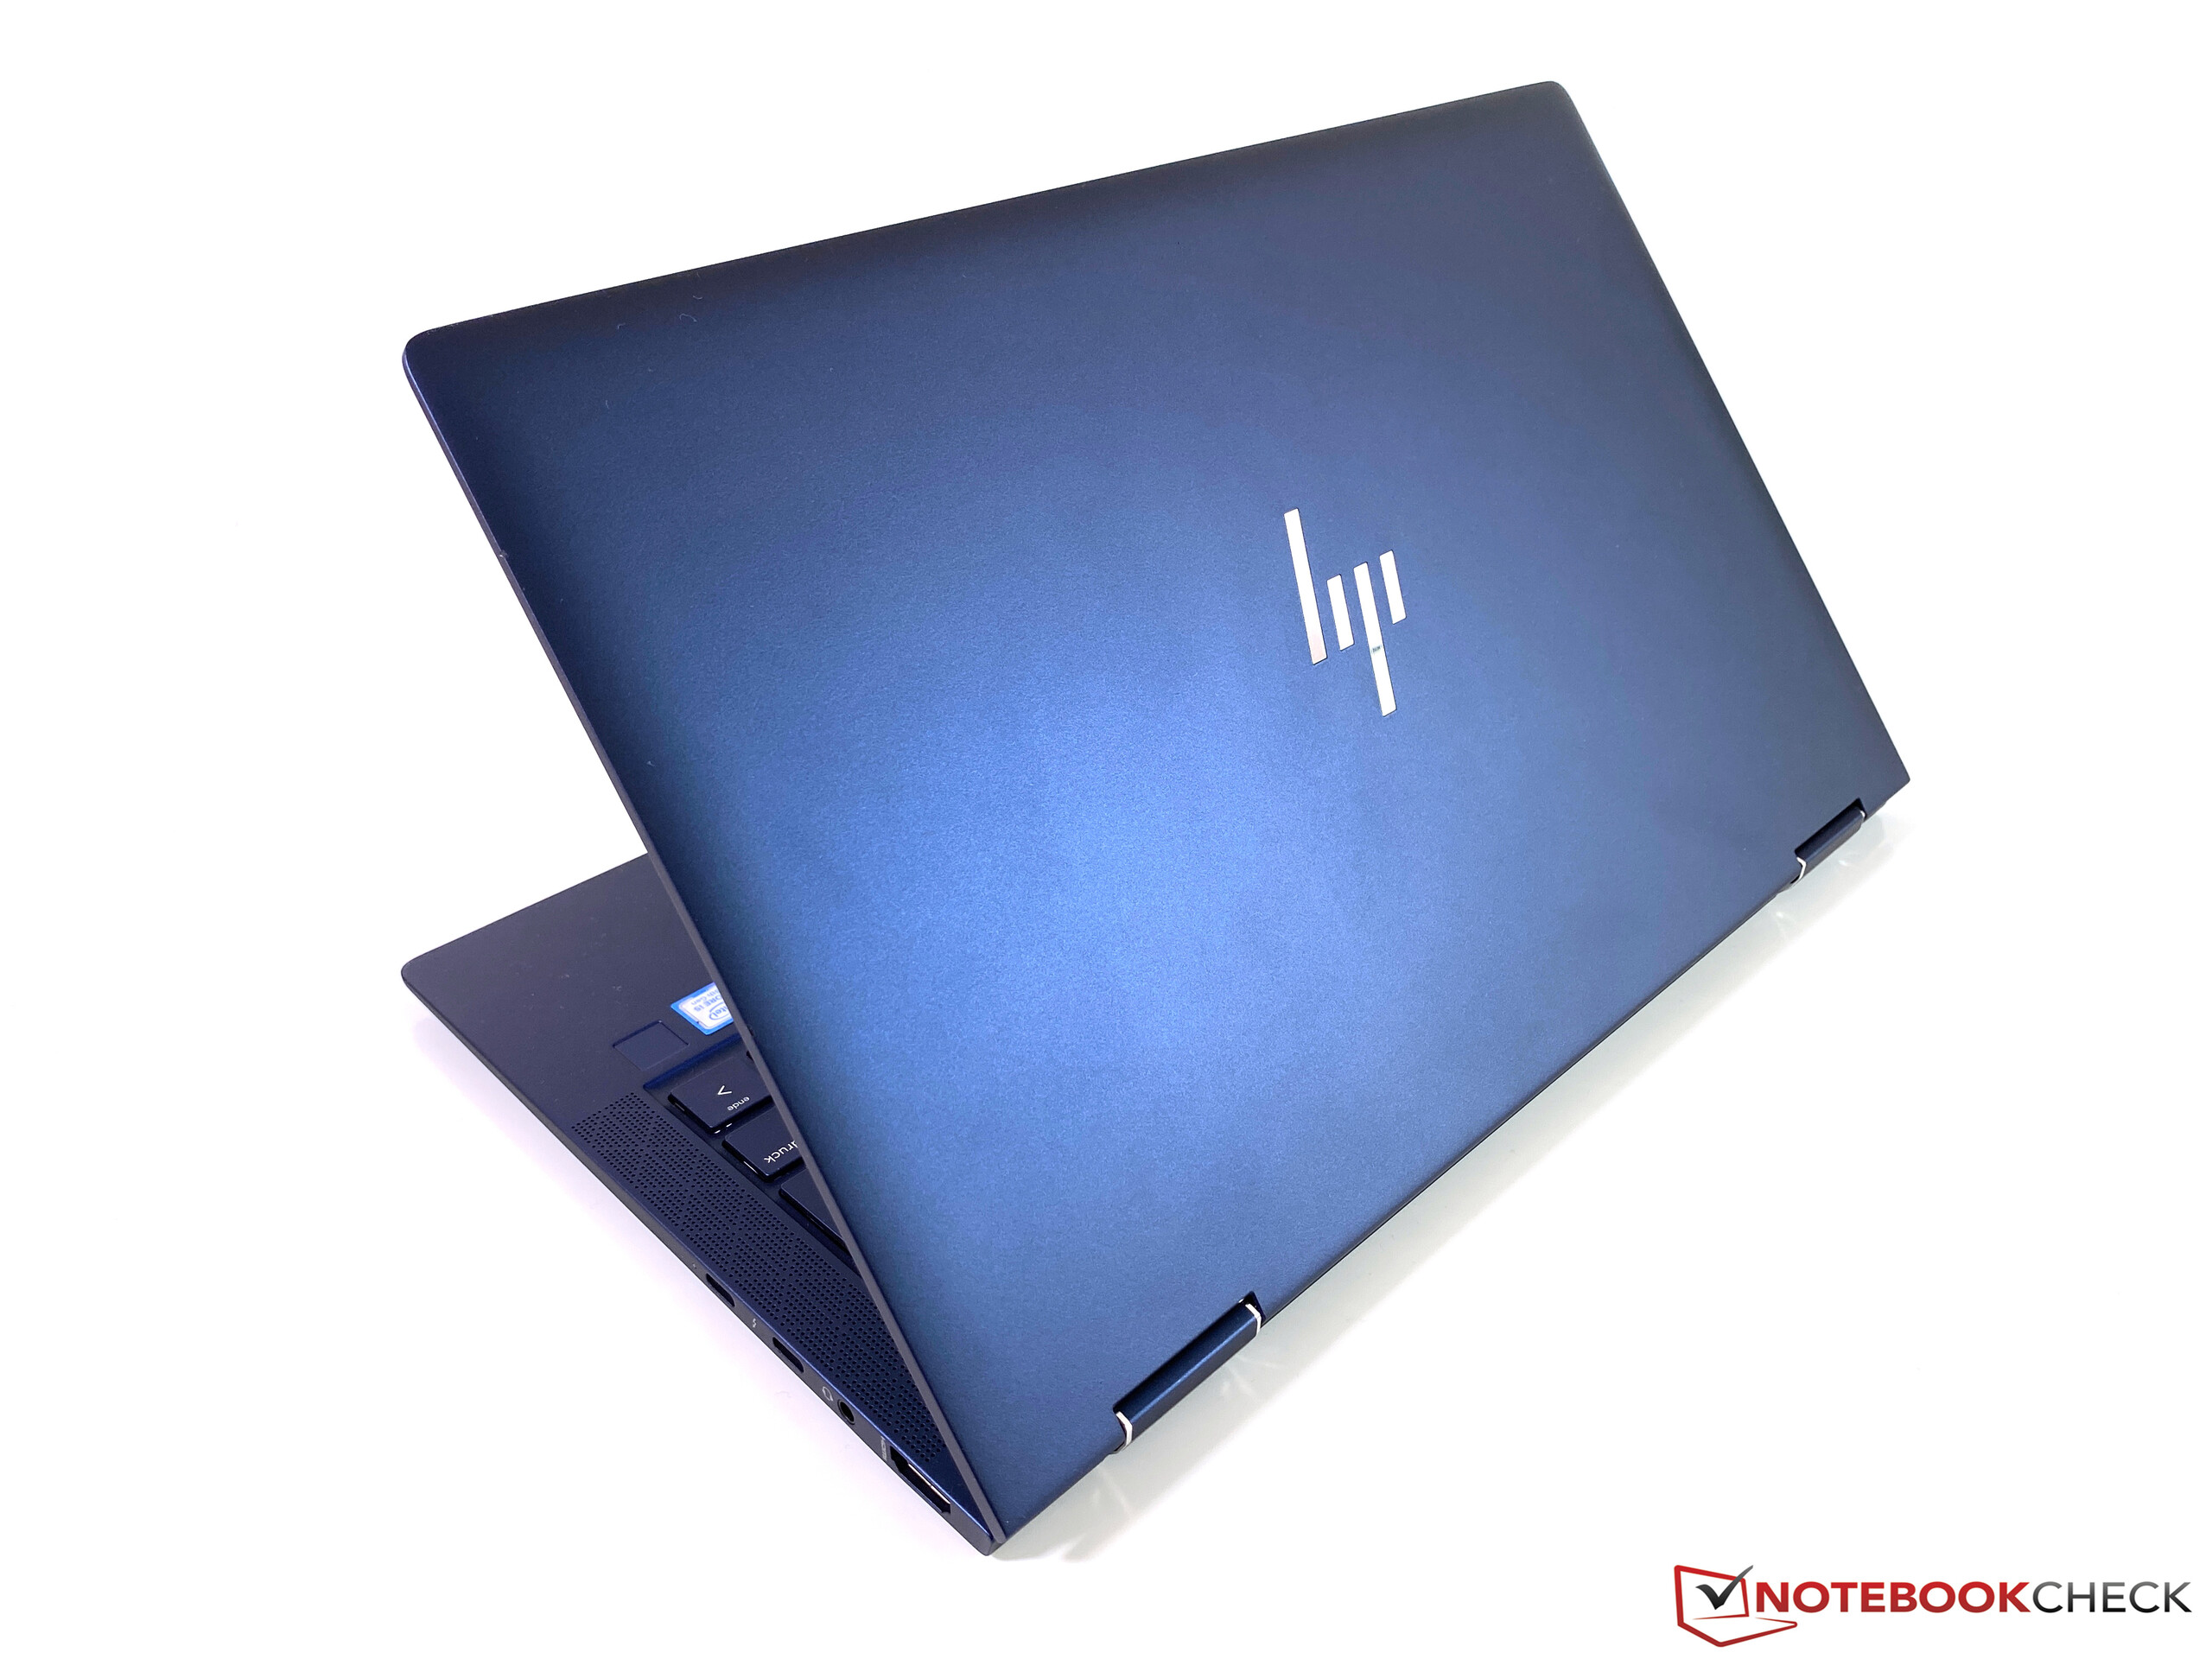
Elite Dragonfly是真正的EliteBook吗?经过全面审查,我们可以肯定的回答“是”。您将获得高质量,坚固的机身,全面的安全功能以及熟悉的服务选项,包括备件的长期可用性。从出色的输入设备, LTE的快速通信模块和较长的续航时间来看,HP的高级二合一还可以在许多其他方面说服买家。但是,后者是为带有较大电池的型号保留的,这将重量增加到超过1千克。不过,我们认为这是一个很好的妥协。
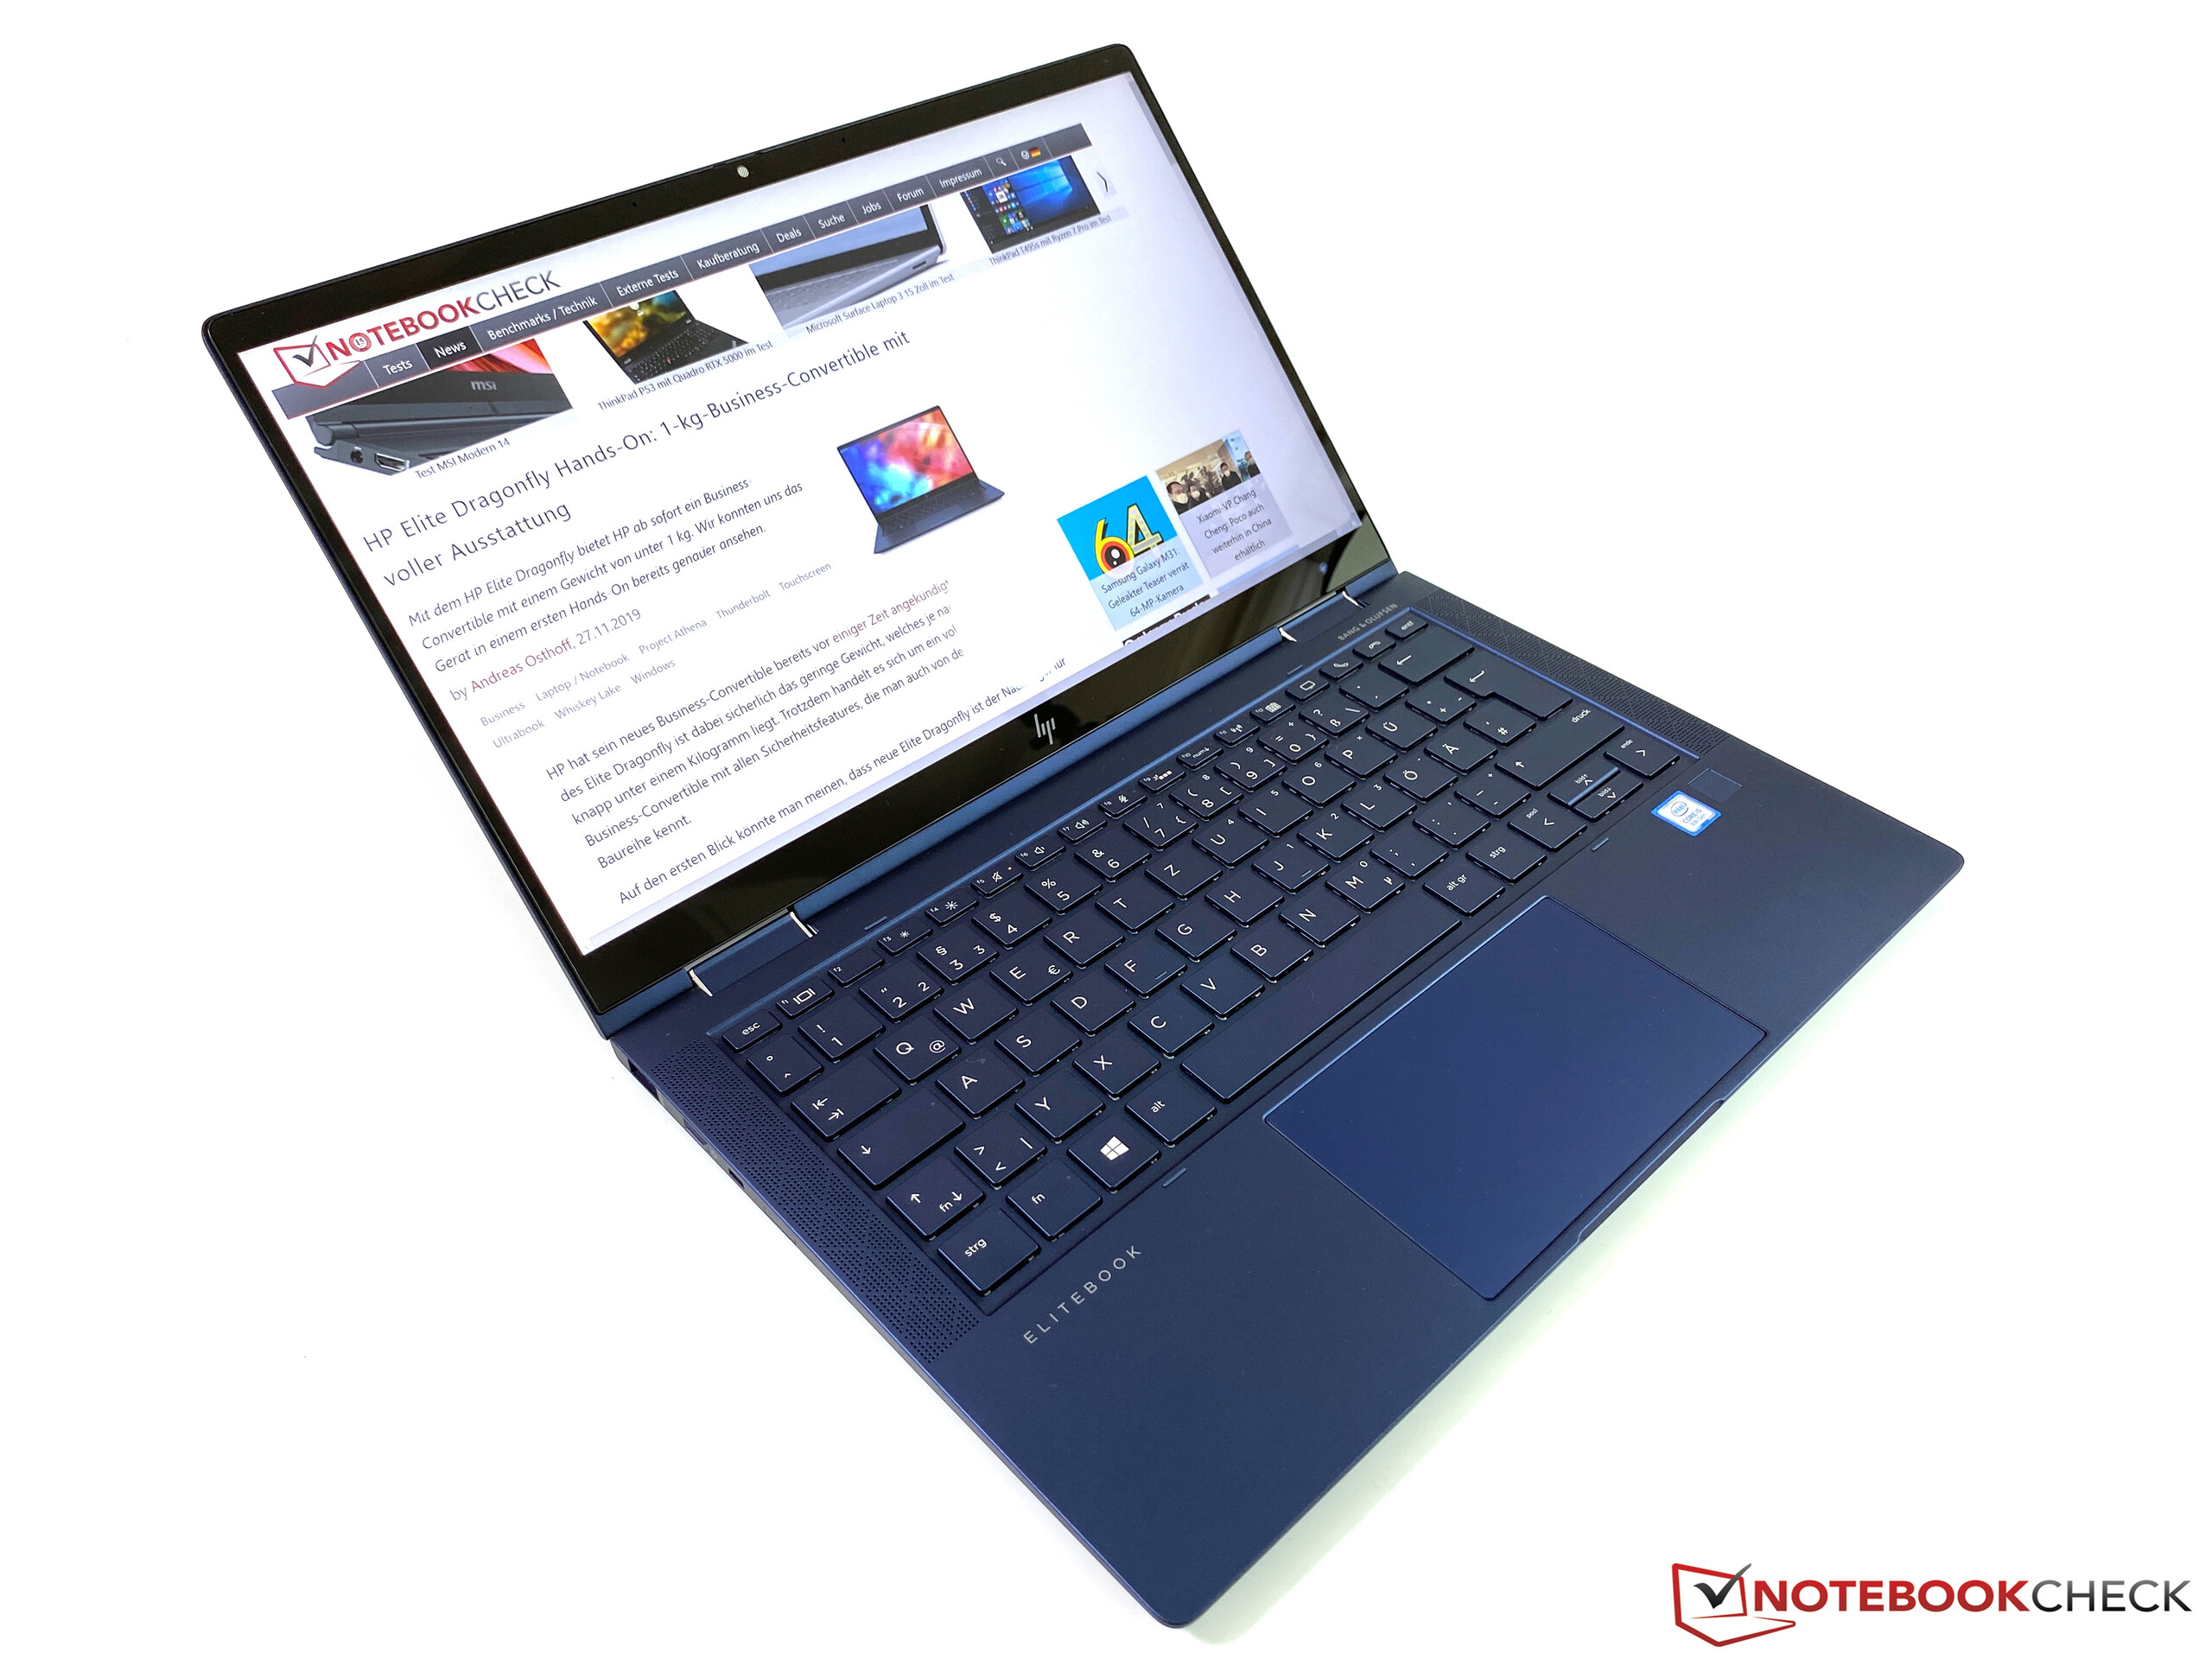
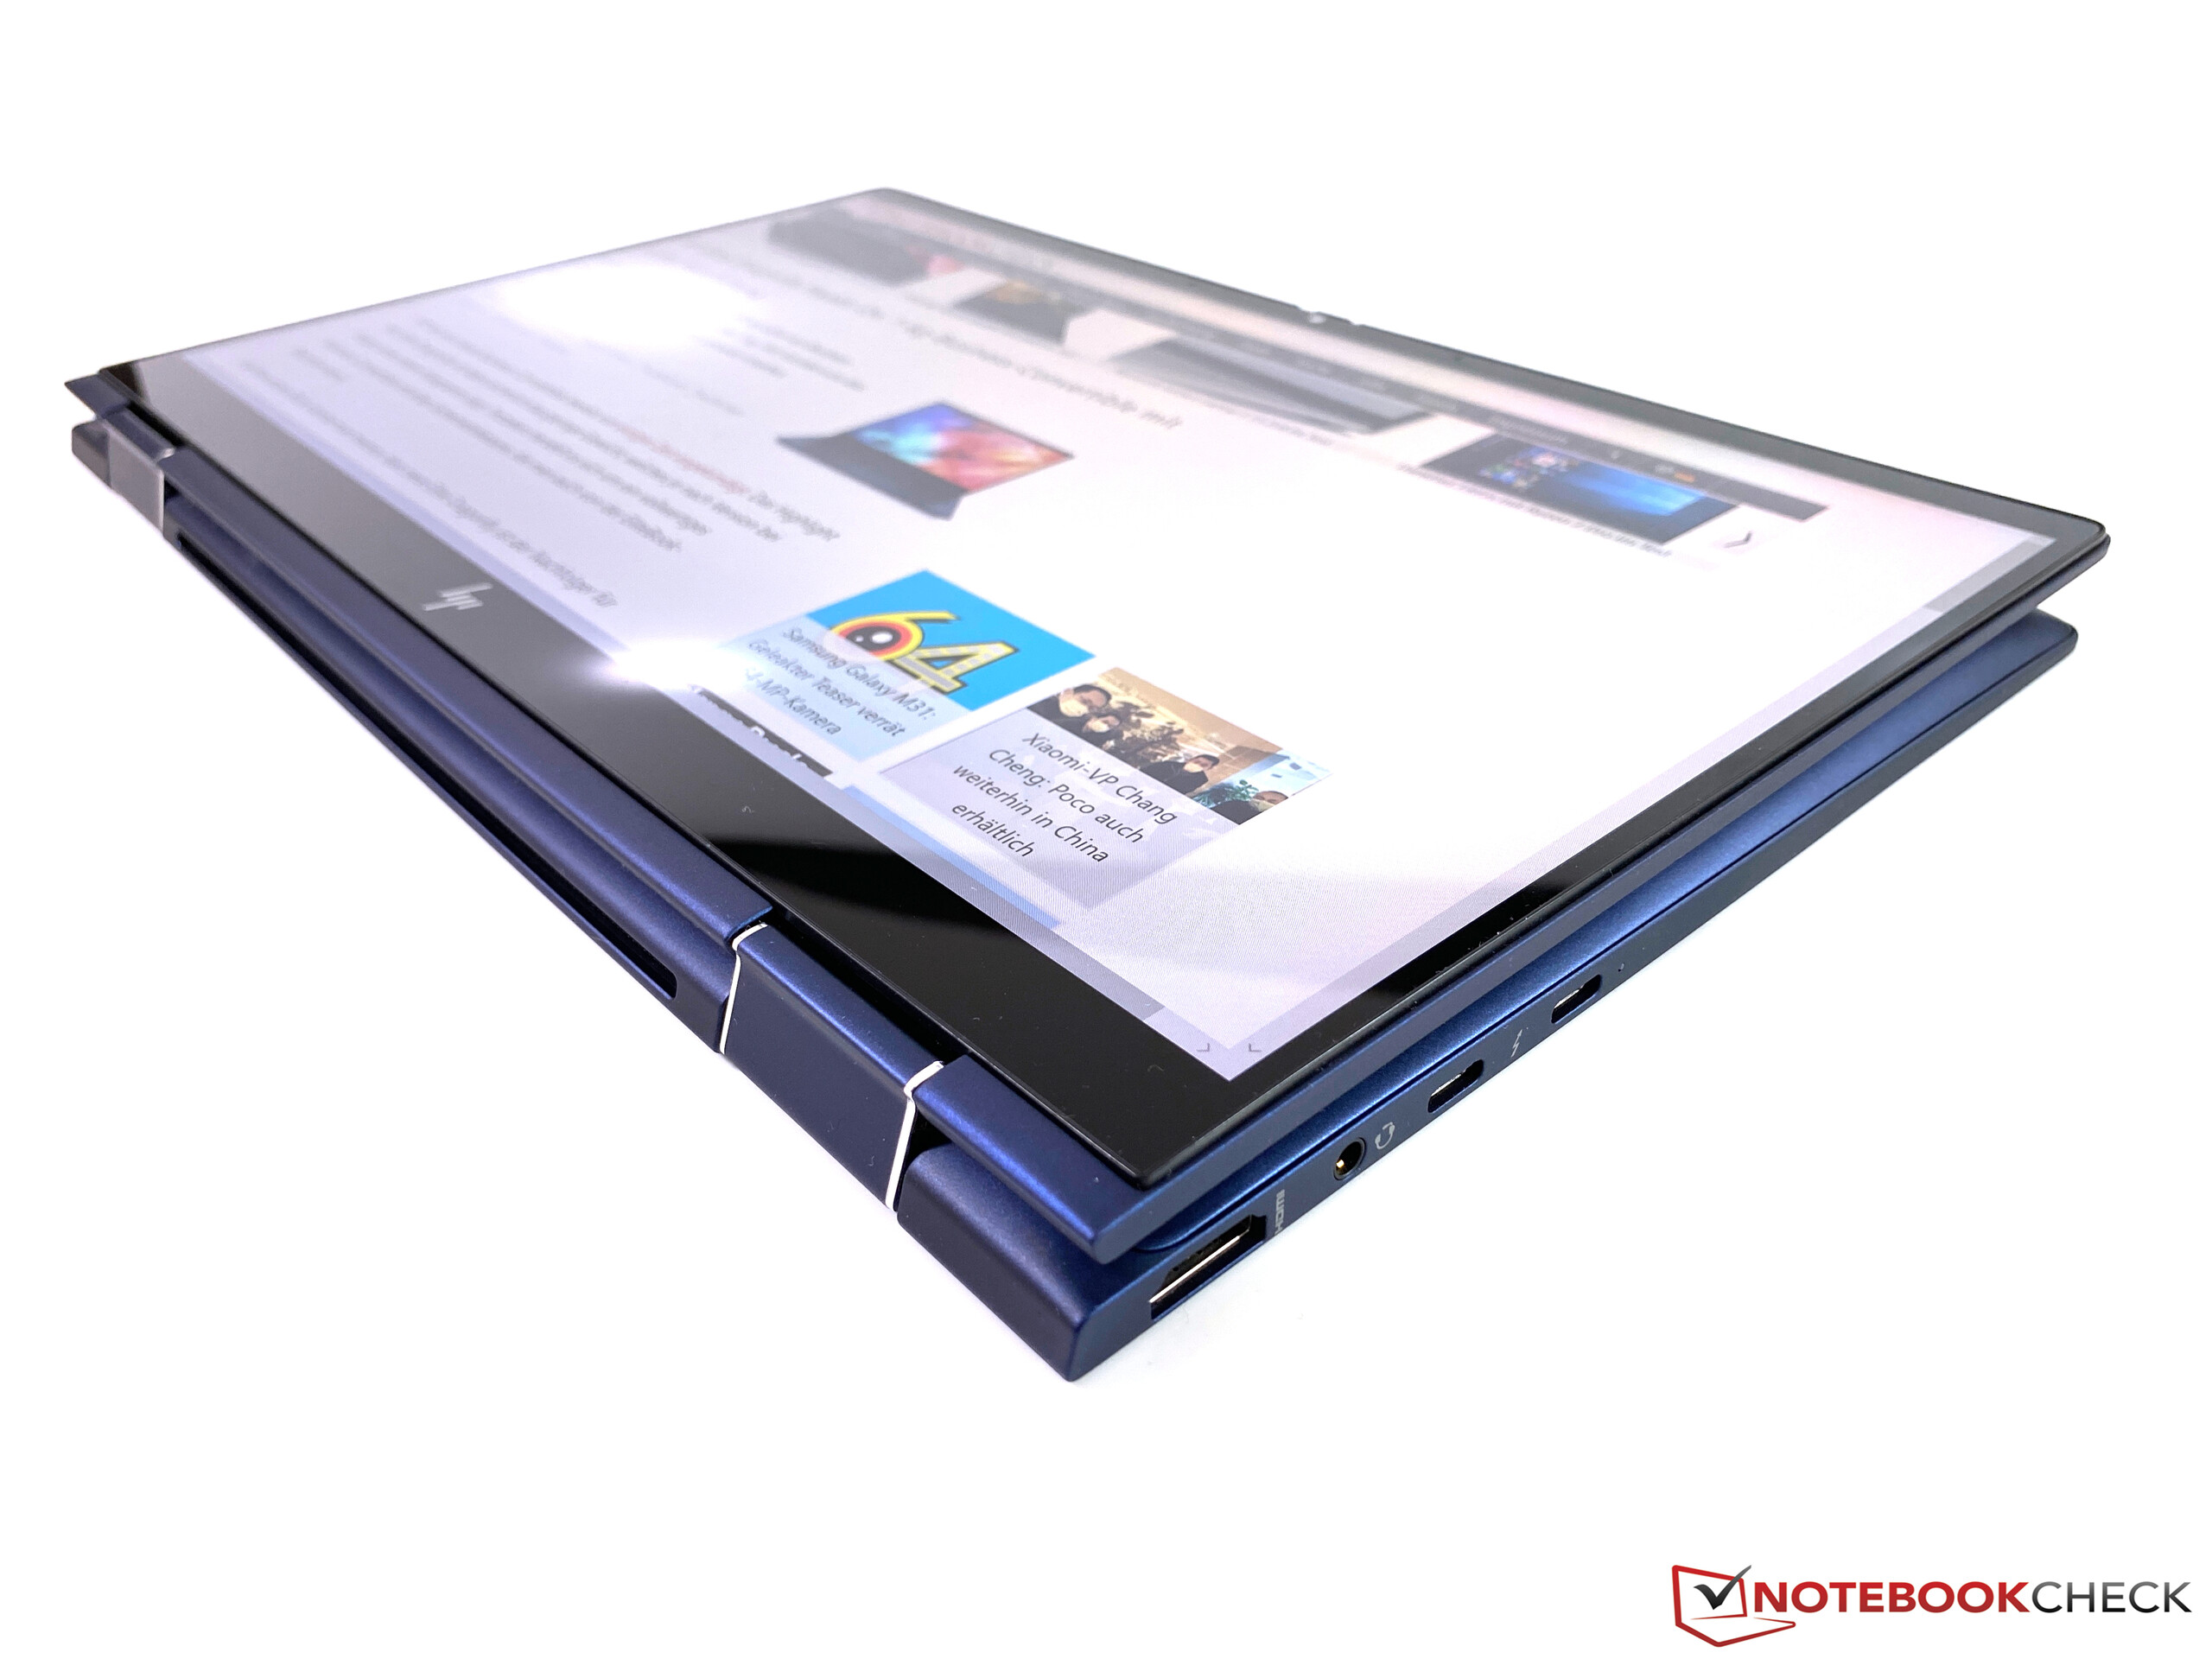
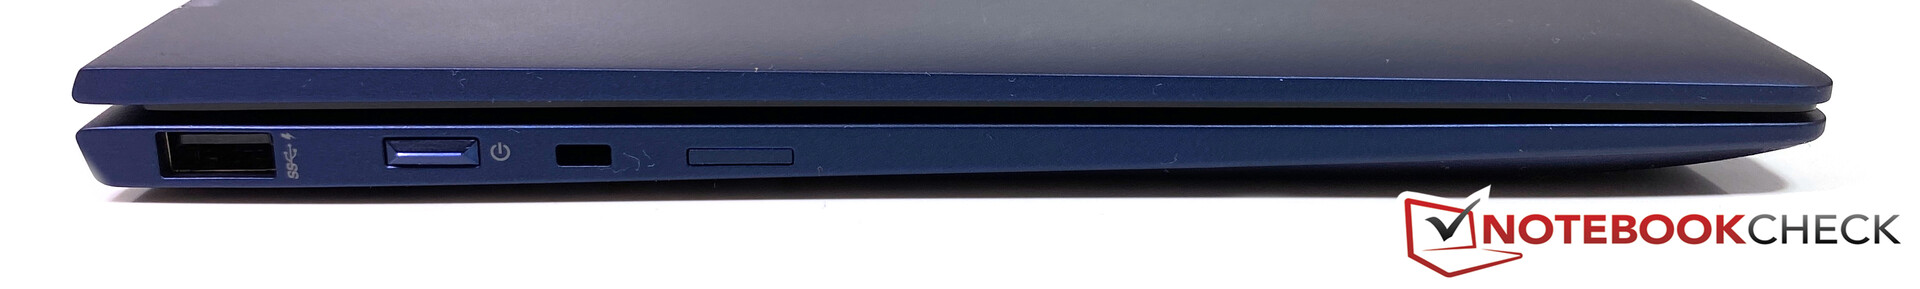
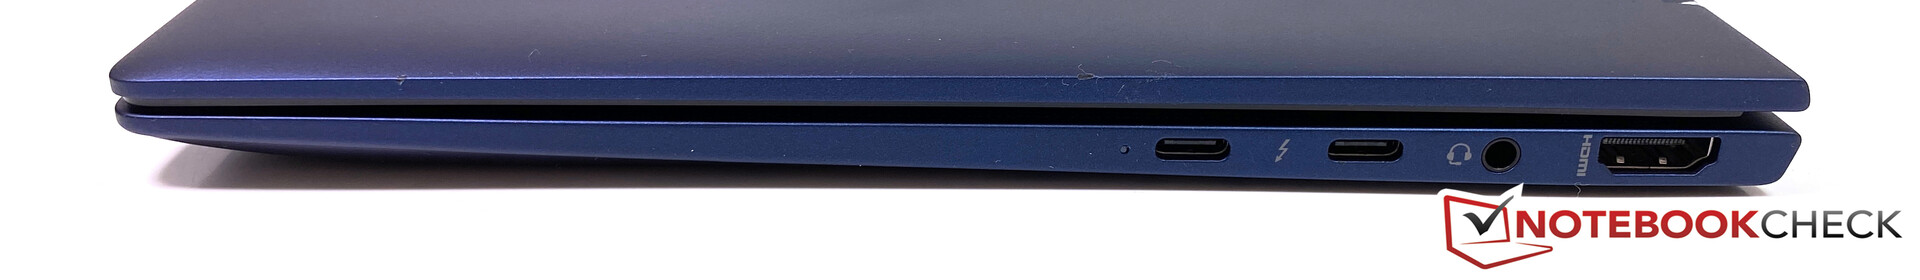
接口方面也没有太多批评,因为除了USB-C连接器之外,您还获得了常规的USB A型端口以及全尺寸HDMI输出。我们仍然认为,有两种方法可以优化端口状况:布局(USB-C朝后,理想的情况是在两侧)和SD读取器,至少能支持microSD卡。
HP Elite Dragonfly是一款非常出色的商务二合一。肯定有一些缺点,但是它们并不是特别要紧。因此,如果您正在寻找商务二合一,我们建议购买Elite Dragonfly。
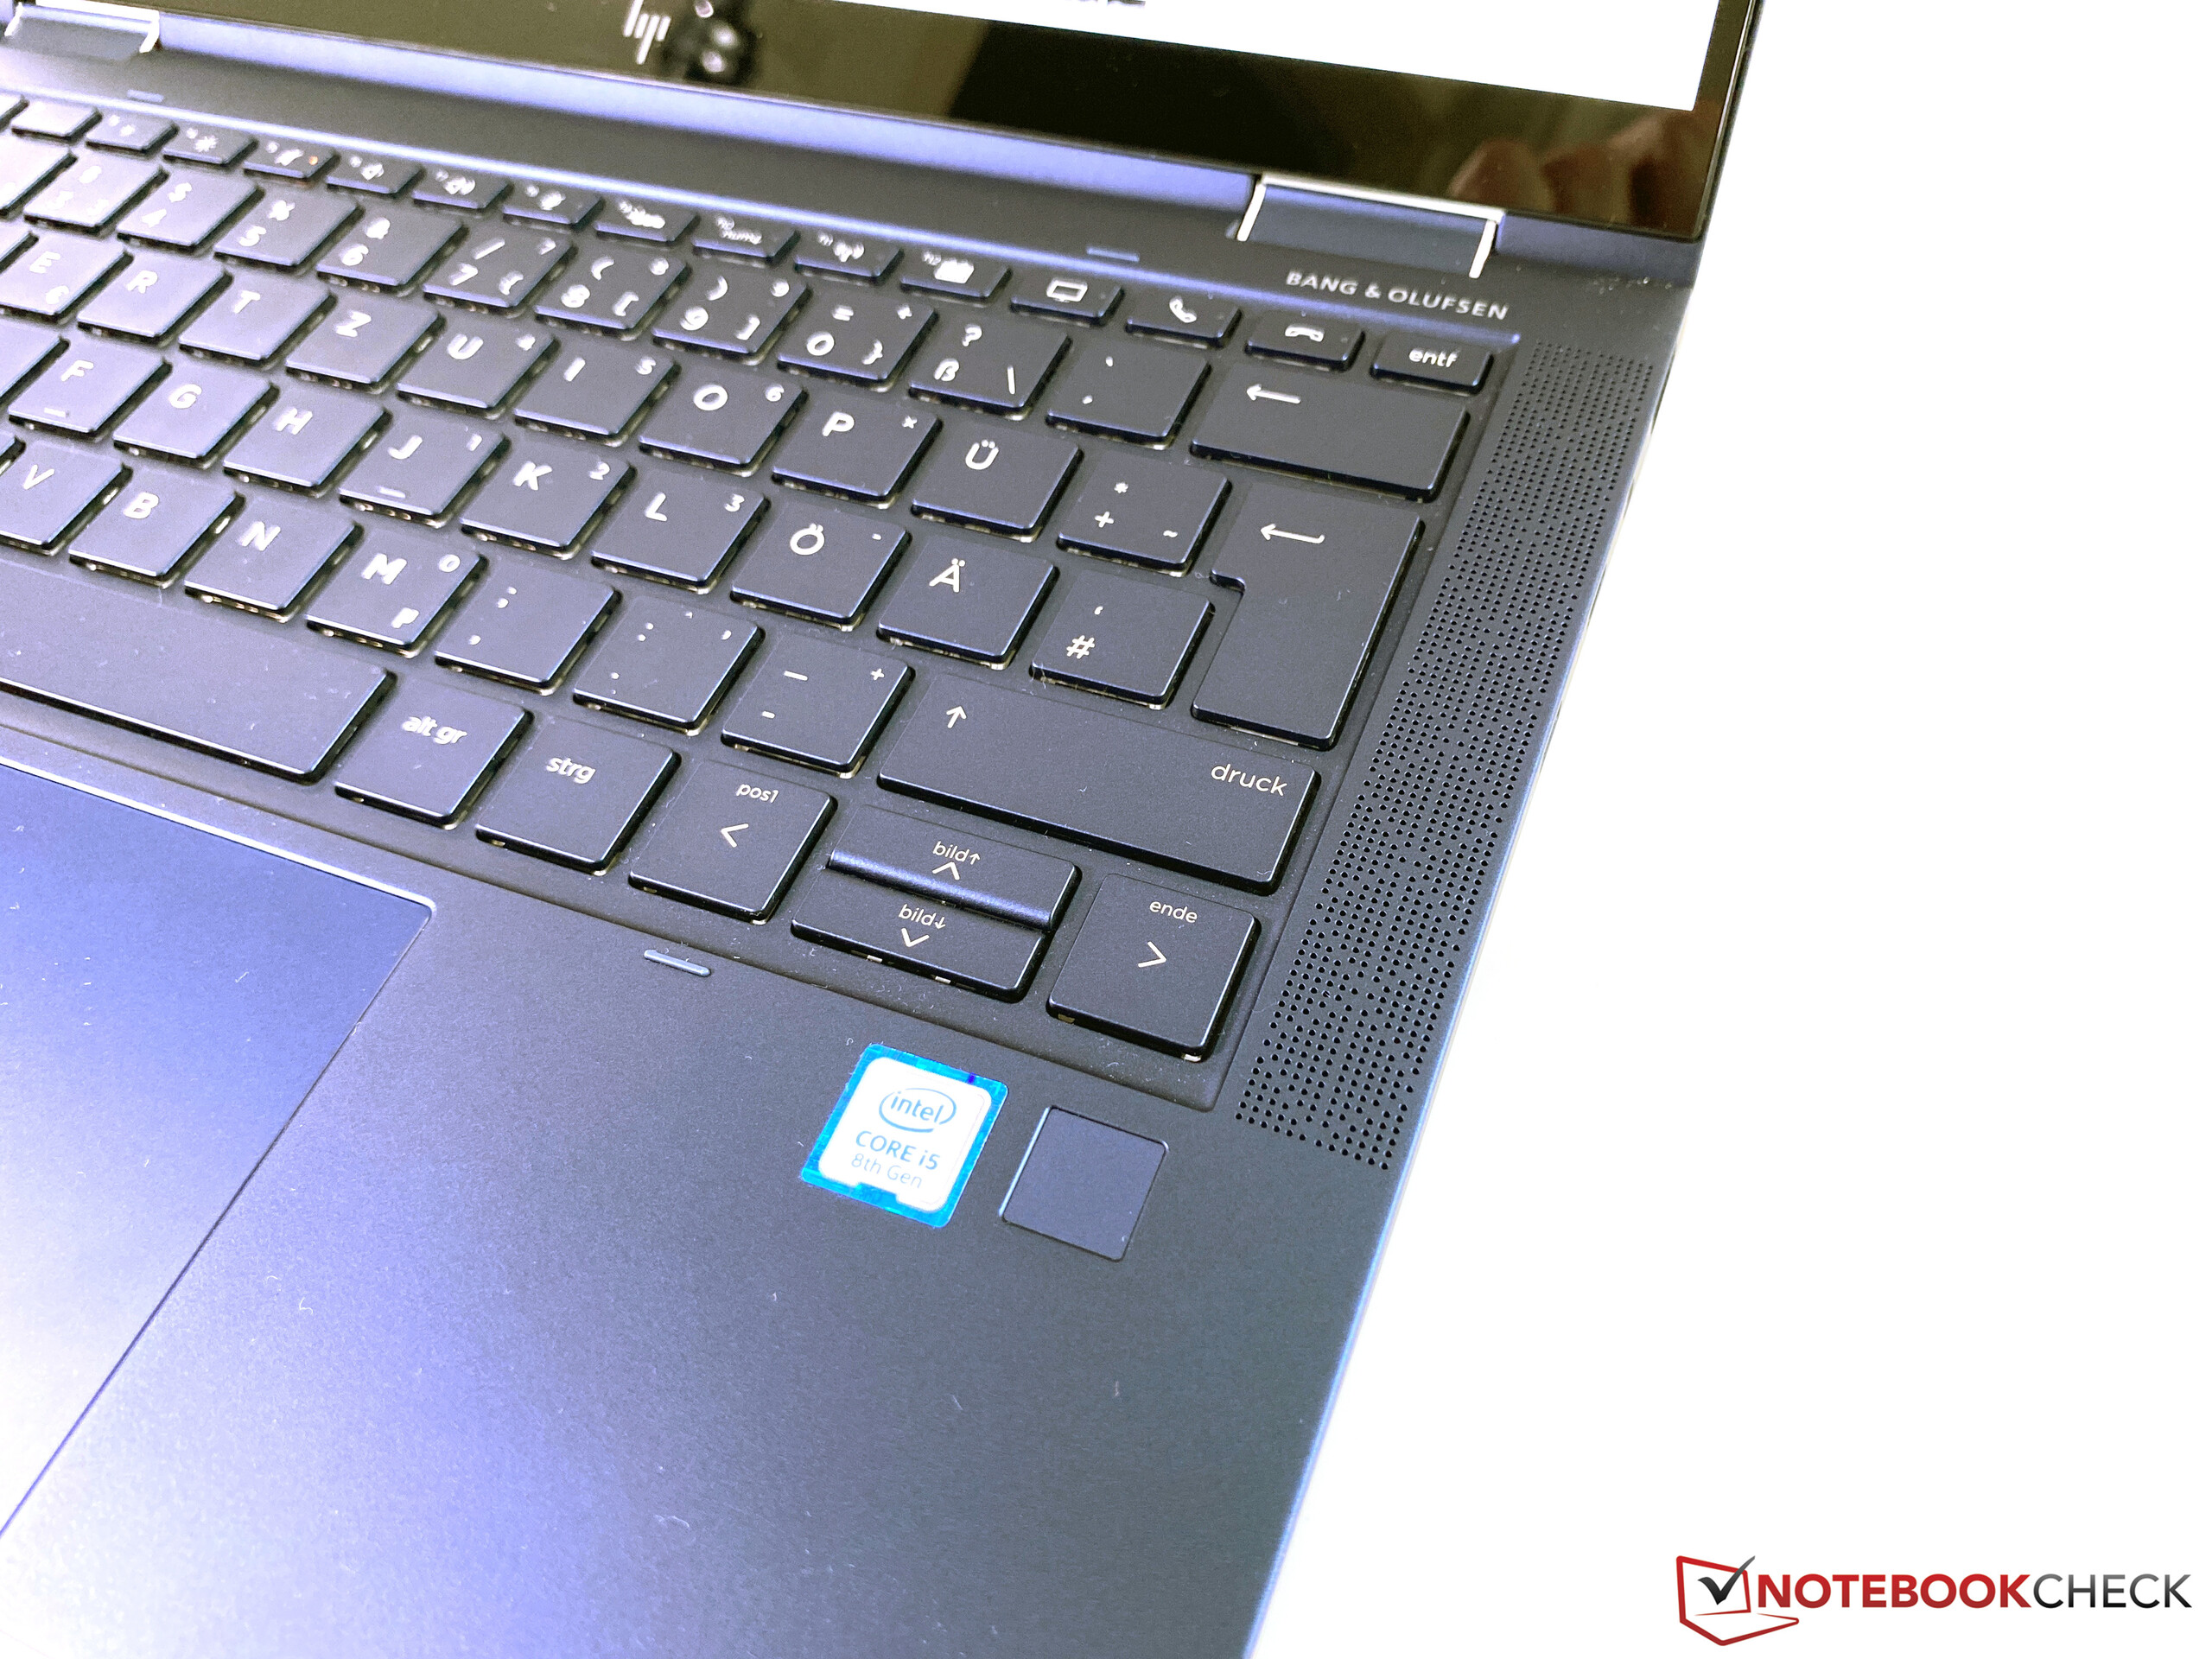
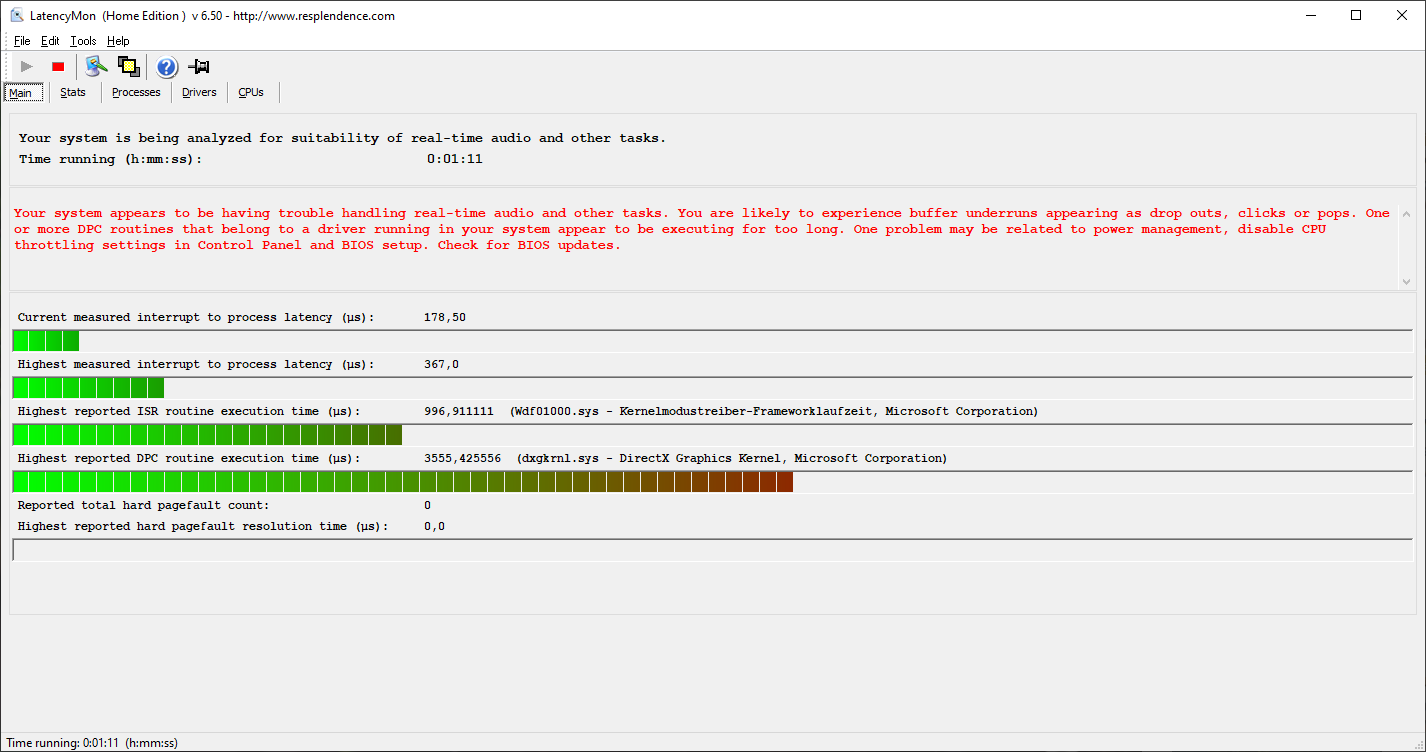
还有其他缺点,包括处理器的TDP配置非常保守。几秒钟后,性能就会降低,但这仍然足以满足一般的办公任务。如果您需要大量的CPU性能,则应该考虑更好的设备。尽管我们认为风扇对负载的反应过快,但风扇却非常安静。
我们的建议主要考虑使用Core i5,标准1080p触摸屏和更大电池的配置。您可以使用较小的电池减轻重量,但我们希望在此类移动设备上使用更长的续航时间。这也是可选4K屏幕的问题,因为它将消耗更多电量。我们对标准的1080p触摸屏也很满意,只有响应时间慢(您会习惯的)和反光才是缺点。
HP Elite Dragonfly-8MK79EA
- 04/03/2020 v7 (old)
Andreas Osthoff
Price comparison

