傲睿士 X7 DT v6 笔记本电脑简短评测
| SD Card Reader | |
| average JPG Copy Test (av. of 3 runs) | |
| MSI GT73VR 6RF | |
| Aorus X7 DT v6 | |
| Aorus X7 v6 | |
| HP Omen 17-w110ng | |
| Asus Strix GL502VS-FY032T | |
| maximum AS SSD Seq Read Test (1GB) | |
| MSI GT73VR 6RF | |
| Aorus X7 DT v6 | |
| HP Omen 17-w110ng | |
| Aorus X7 v6 | |
| Asus Strix GL502VS-FY032T | |
| |||||||||||||||||||||||||
Brightness Distribution: 80 %
Center on Battery: 339.5 cd/m²
Contrast: 754:1 (Black: 0.45 cd/m²)
ΔE ColorChecker Calman: 6.88 | ∀{0.5-29.43 Ø4.71}
ΔE Greyscale Calman: 6.57 | ∀{0.09-98 Ø4.96}
82% sRGB (Argyll 1.6.3 3D)
54% AdobeRGB 1998 (Argyll 1.6.3 3D)
60.1% AdobeRGB 1998 (Argyll 3D)
82.8% sRGB (Argyll 3D)
59.6% Display P3 (Argyll 3D)
Gamma: 2.04
CCT: 8608 K
| Aorus X7 DT v6 AUO1096, TN LED, 17.3", 2560x1440 | Aorus X7 v6 B173QTN01.0 (AUO1096), TN LED, 17.3", 2560x1440 | Asus Strix GL502VS-FY032T LG Philips LP156WF6-SPB6 (LGD046F), IPS, 15.6", 1920x1080 | HP Omen 17-w110ng LG Philips LGD046E, IPS, 17.3", 1920x1080 | MSI GT73VR 6RF IPS, 17.3", 3840x2160 | |
|---|---|---|---|---|---|
| Display | 2% | 3% | 5% | 11% | |
| Display P3 Coverage (%) | 59.6 | 60.9 2% | 64.5 8% | 66.6 12% | 63.6 7% |
| sRGB Coverage (%) | 82.8 | 84.2 2% | 83.1 0% | 84.1 2% | 95.8 16% |
| AdobeRGB 1998 Coverage (%) | 60.1 | 61.2 2% | 60.8 1% | 61.5 2% | 65.7 9% |
| Response Times | -10% | -75% | -77% | -92% | |
| Response Time Grey 50% / Grey 80% * (ms) | 21.6 ? | 31 ? -44% | 38 ? -76% | 37 ? -71% | 33.6 ? -56% |
| Response Time Black / White * (ms) | 13.2 ? | 10 ? 24% | 23 ? -74% | 24 ? -82% | 30 ? -127% |
| PWM Frequency (Hz) | 59.5 | ||||
| Screen | -5% | 13% | 21% | 13% | |
| Brightness middle (cd/m²) | 339.5 | 343 1% | 315 -7% | 362 7% | 334.8 -1% |
| Brightness (cd/m²) | 309 | 312 1% | 290 -6% | 342 11% | 316 2% |
| Brightness Distribution (%) | 80 | 80 0% | 85 6% | 87 9% | 87 9% |
| Black Level * (cd/m²) | 0.45 | 0.5 -11% | 0.32 29% | 0.31 31% | 0.422 6% |
| Contrast (:1) | 754 | 686 -9% | 984 31% | 1168 55% | 793 5% |
| Colorchecker dE 2000 * | 6.88 | 7.33 -7% | 4.88 29% | 4.5 35% | 4.11 40% |
| Colorchecker dE 2000 max. * | 9.99 | 10.79 -8% | 8.88 11% | 9.31 7% | 7.8 22% |
| Greyscale dE 2000 * | 6.57 | 7.6 -16% | 4.17 37% | 3.48 47% | 5.74 13% |
| Gamma | 2.04 108% | 2.19 100% | 2.53 87% | 2.23 99% | 2.3 96% |
| CCT | 8608 76% | 9024 72% | 6683 97% | 6144 106% | 5987 109% |
| Color Space (Percent of AdobeRGB 1998) (%) | 54 | 55 2% | 55 2% | 55 2% | 60.5 12% |
| Color Space (Percent of sRGB) (%) | 82 | 84 2% | 83 1% | 84 2% | 96 17% |
| Total Average (Program / Settings) | -4% /
-4% | -20% /
-1% | -17% /
5% | -23% /
-2% |
* ... smaller is better
Display Response Times
| ↔ Response Time Black to White | ||
|---|---|---|
| 13.2 ms ... rise ↗ and fall ↘ combined | ↗ 4.4 ms rise | 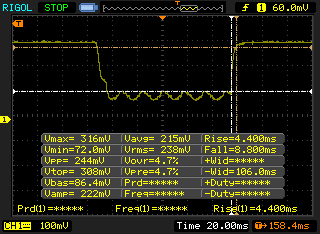 |
| ↘ 8.8 ms fall | ||
| The screen shows good response rates in our tests, but may be too slow for competitive gamers. In comparison, all tested devices range from 0.1 (minimum) to 240 (maximum) ms. » 34 % of all devices are better. This means that the measured response time is better than the average of all tested devices (19.8 ms). | ||
| ↔ Response Time 50% Grey to 80% Grey | ||
| 21.6 ms ... rise ↗ and fall ↘ combined | ↗ 12.4 ms rise | 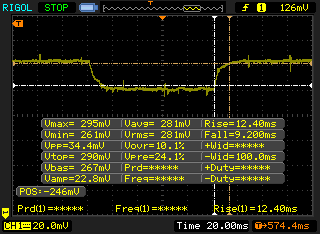 |
| ↘ 9.2 ms fall | ||
| The screen shows good response rates in our tests, but may be too slow for competitive gamers. In comparison, all tested devices range from 0.165 (minimum) to 636 (maximum) ms. » 33 % of all devices are better. This means that the measured response time is better than the average of all tested devices (31 ms). | ||
Screen Flickering / PWM (Pulse-Width Modulation)
| Screen flickering / PWM detected | 59.5 Hz | 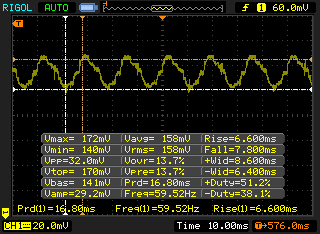 | |
The display backlight flickers at 59.5 Hz (worst case, e.g., utilizing PWM) . The frequency of 59.5 Hz is very low, so the flickering may cause eyestrain and headaches after extended use. In comparison: 52 % of all tested devices do not use PWM to dim the display. If PWM was detected, an average of 7754 (minimum: 5 - maximum: 343500) Hz was measured. | |||
| Cinebench R11.5 | |
| CPU Single 64Bit | |
| Aorus X7 DT v6 | |
| MSI GT73VR 6RF | |
| Eurocom Sky X7E2 | |
| HP Omen 17-w110ng | |
| Asus Strix GL502VS-FY032T | |
| CPU Multi 64Bit | |
| MSI GT73VR 6RF | |
| Aorus X7 DT v6 | |
| Eurocom Sky X7E2 | |
| HP Omen 17-w110ng | |
| Asus Strix GL502VS-FY032T | |
| Cinebench R15 | |
| CPU Single 64Bit | |
| Aorus X7 DT v6 | |
| MSI GT73VR 6RF | |
| Eurocom Sky X7E2 | |
| HP Omen 17-w110ng | |
| Asus Strix GL502VS-FY032T | |
| CPU Multi 64Bit | |
| Eurocom Sky X7E2 | |
| MSI GT73VR 6RF | |
| Aorus X7 DT v6 | |
| HP Omen 17-w110ng | |
| Asus Strix GL502VS-FY032T | |
| wPrime 2.10 - 1024m | |
| Aorus X7 DT v6 | |
| Eurocom Sky X7E2 | |
| Super Pi Mod 1.5 XS 32M - 32M | |
| Aorus X7 DT v6 | |
| Eurocom Sky X7E2 | |
* ... smaller is better
| PCMark 8 | |
| Home Score Accelerated v2 | |
| Aorus X7 DT v6 | |
| HP Omen 17-w110ng | |
| Asus Strix GL502VS-FY032T | |
| Eurocom Sky X7E2 | |
| MSI GT73VR 6RF | |
| Work Score Accelerated v2 | |
| HP Omen 17-w110ng | |
| Aorus X7 DT v6 | |
| Asus Strix GL502VS-FY032T | |
| Eurocom Sky X7E2 | |
| MSI GT73VR 6RF | |
| Creative Score Accelerated v2 | |
| Eurocom Sky X7E2 | |
| Aorus X7 DT v6 | |
| MSI GT73VR 6RF | |
| HP Omen 17-w110ng | |
| PCMark 8 Home Score Accelerated v2 | 5096 points | |
| PCMark 8 Creative Score Accelerated v2 | 8478 points | |
| PCMark 8 Work Score Accelerated v2 | 5353 points | |
Help | ||
| Aorus X7 DT v6 Samsung SM951 MZVPV512HDGL m.2 PCI-e | Asus Strix GL502VS-FY032T SanDisk SD8SNAT256G1002 | HP Omen 17-w110ng Samsung PM951 NVMe MZVLV256 | MSI GT73VR 6RF 2x SanDisk X400 1TB M.2 SD8SN8U1T001122 (RAID 0) | Eurocom Sky X7E2 Samsung SM951 MZVPV512HDGL m.2 PCI-e | |
|---|---|---|---|---|---|
| CrystalDiskMark 3.0 | -67% | -38% | -37% | -1% | |
| Read Seq (MB/s) | 1829 | 485.4 -73% | 1156 -37% | 914 -50% | 1673 -9% |
| Write Seq (MB/s) | 1588 | 312.4 -80% | 294.9 -81% | 916 -42% | 1576 -1% |
| Read 512 (MB/s) | 1064 | 294.8 -72% | 616 -42% | 698 -34% | 1180 11% |
| Write 512 (MB/s) | 1507 | 287.8 -81% | 294.7 -80% | 916 -39% | 1561 4% |
| Read 4k (MB/s) | 52.9 | 21.44 -59% | 42.7 -19% | 31.37 -41% | 51.5 -3% |
| Write 4k (MB/s) | 161.1 | 75.7 -53% | 153.3 -5% | 65.7 -59% | 144 -11% |
| Read 4k QD32 (MB/s) | 676 | 149.4 -78% | 600 -11% | 425 -37% | 694 3% |
| Write 4k QD32 (MB/s) | 419.1 | 256.3 -39% | 295.3 -30% | 441.8 5% | 422.1 1% |

| 3DMark 11 | |
| 1280x720 Performance GPU | |
| Eurocom Sky X7E2 | |
| MSI GT73VR 6RF | |
| Aorus X7 DT v6 | |
| Aorus X7 v6 | |
| Asus Strix GL502VS-FY032T | |
| HP Omen 17-w110ng | |
| 1280x720 Performance Combined | |
| Aorus X7 DT v6 | |
| Eurocom Sky X7E2 | |
| Aorus X7 v6 | |
| MSI GT73VR 6RF | |
| Asus Strix GL502VS-FY032T | |
| HP Omen 17-w110ng | |
| 3DMark | |
| 1280x720 Cloud Gate Standard Graphics | |
| Eurocom Sky X7E2 | |
| Aorus X7 DT v6 | |
| MSI GT73VR 6RF | |
| Aorus X7 v6 | |
| HP Omen 17-w110ng | |
| Asus Strix GL502VS-FY032T | |
| 1920x1080 Fire Strike Graphics | |
| Aorus X7 DT v6 | |
| Eurocom Sky X7E2 | |
| MSI GT73VR 6RF | |
| Aorus X7 v6 | |
| Asus Strix GL502VS-FY032T | |
| HP Omen 17-w110ng | |
| Fire Strike Extreme Graphics | |
| Aorus X7 DT v6 | |
| Eurocom Sky X7E2 | |
| MSI GT73VR 6RF | |
| HP Omen 17-w110ng | |
| 1920x1080 Ice Storm Extreme Graphics | |
| Eurocom Sky X7E2 | |
| Aorus X7 DT v6 | |
| MSI GT73VR 6RF | |
| HP Omen 17-w110ng | |
| 3DMark 06 Standard Score | 34143 points | |
| 3DMark 11 Performance | 19769 points | |
| 3DMark Ice Storm Standard Score | 169818 points | |
| 3DMark Cloud Gate Standard Score | 31695 points | |
| 3DMark Fire Strike Score | 16908 points | |
| 3DMark Fire Strike Extreme Score | 9557 points | |
Help | ||
| Sleeping Dogs - 1920x1080 Extreme Preset AA:Extreme (sort by value) | |
| Aorus X7 DT v6 | |
| Eurocom Sky X7E2 | |
| BioShock Infinite - 1920x1080 Ultra Preset, DX11 (DDOF) (sort by value) | |
| Aorus X7 DT v6 | |
| HP Omen 17-w110ng | |
| Eurocom Sky X7E2 | |
| Metro: Last Light - 1920x1080 Very High (DX11) AF:16x (sort by value) | |
| Aorus X7 DT v6 | |
| Eurocom Sky X7E2 | |
| Thief - 1920x1080 Very High Preset AA:FXAA & High SS AF:8x (sort by value) | |
| Aorus X7 DT v6 | |
| Eurocom Sky X7E2 | |
| Batman: Arkham Knight - 1920x1080 High / On AA:SM AF:16x (sort by value) | |
| Aorus X7 DT v6 | |
| Eurocom Sky X7E2 | |
| Fallout 4 - 1920x1080 Ultra Preset AA:T AF:16x (sort by value) | |
| Aorus X7 DT v6 | |
| Eurocom Sky X7E2 | |
| Rise of the Tomb Raider - 1920x1080 Very High Preset AA:FX AF:16x (sort by value) | |
| Aorus X7 DT v6 | |
| Aorus X7 v6 | |
| Asus Strix GL502VS-FY032T | |
| HP Omen 17-w110ng | |
| Eurocom Sky X7E2 | |
| Doom - 1920x1080 Ultra Preset AA:SM (sort by value) | |
| Aorus X7 DT v6 | |
| Aorus X7 v6 | |
| Asus Strix GL502VS-FY032T | |
| HP Omen 17-w110ng | |
| Eurocom Sky X7E2 | |
| Mafia 2 - 1920x1080 high AA:0x AF:16x (sort by value) | |
| Aorus X7 DT v6 | |
| low | med. | high | ultra | |
|---|---|---|---|---|
| Mafia 2 (2010) | 214.6 | |||
| Sleeping Dogs (2012) | 140.6 | |||
| BioShock Infinite (2013) | 164.7 | |||
| Metro: Last Light (2013) | 130 | |||
| Thief (2014) | 125 | |||
| Batman: Arkham Knight (2015) | 141 | |||
| Fallout 4 (2015) | 124 | |||
| Rise of the Tomb Raider (2016) | 118 | |||
| Doom (2016) | 153 |
Noise level
| Idle |
| 32.2 / 35.2 / 35.2 dB(A) |
| Load |
| 51.7 / 55.7 dB(A) |
 | ||
30 dB silent 40 dB(A) audible 50 dB(A) loud |
||
min: | ||
| Aorus X7 DT v6 GeForce GTX 1080 Mobile, 6820HK, Samsung SM951 MZVPV512HDGL m.2 PCI-e | Aorus X7 v6 GeForce GTX 1070 Mobile, 6820HK, Toshiba NVMe THNSN5512GPU7 | Asus Strix GL502VS-FY032T GeForce GTX 1070 Mobile, 6700HQ, SanDisk SD8SNAT256G1002 | HP Omen 17-w110ng GeForce GTX 1070 Mobile, 6700HQ, Samsung PM951 NVMe MZVLV256 | MSI GT73VR 6RF GeForce GTX 1080 Mobile, 6820HK, 2x SanDisk X400 1TB M.2 SD8SN8U1T001122 (RAID 0) | |
|---|---|---|---|---|---|
| Noise | 0% | 6% | 3% | -1% | |
| off / environment * (dB) | 28.6 | 30 -5% | 30 -5% | 30 -5% | 29.2 -2% |
| Idle Minimum * (dB) | 32.2 | 33 -2% | 32 1% | 33 -2% | 32 1% |
| Idle Average * (dB) | 35.2 | 35 1% | 33 6% | 34 3% | 32 9% |
| Idle Maximum * (dB) | 35.2 | 40 -14% | 34 3% | 35 1% | 35 1% |
| Load Average * (dB) | 51.7 | 43 17% | 39 25% | 45 13% | 50 3% |
| Load Maximum * (dB) | 55.7 | 54 3% | 51 8% | 52 7% | 64 -15% |
* ... smaller is better
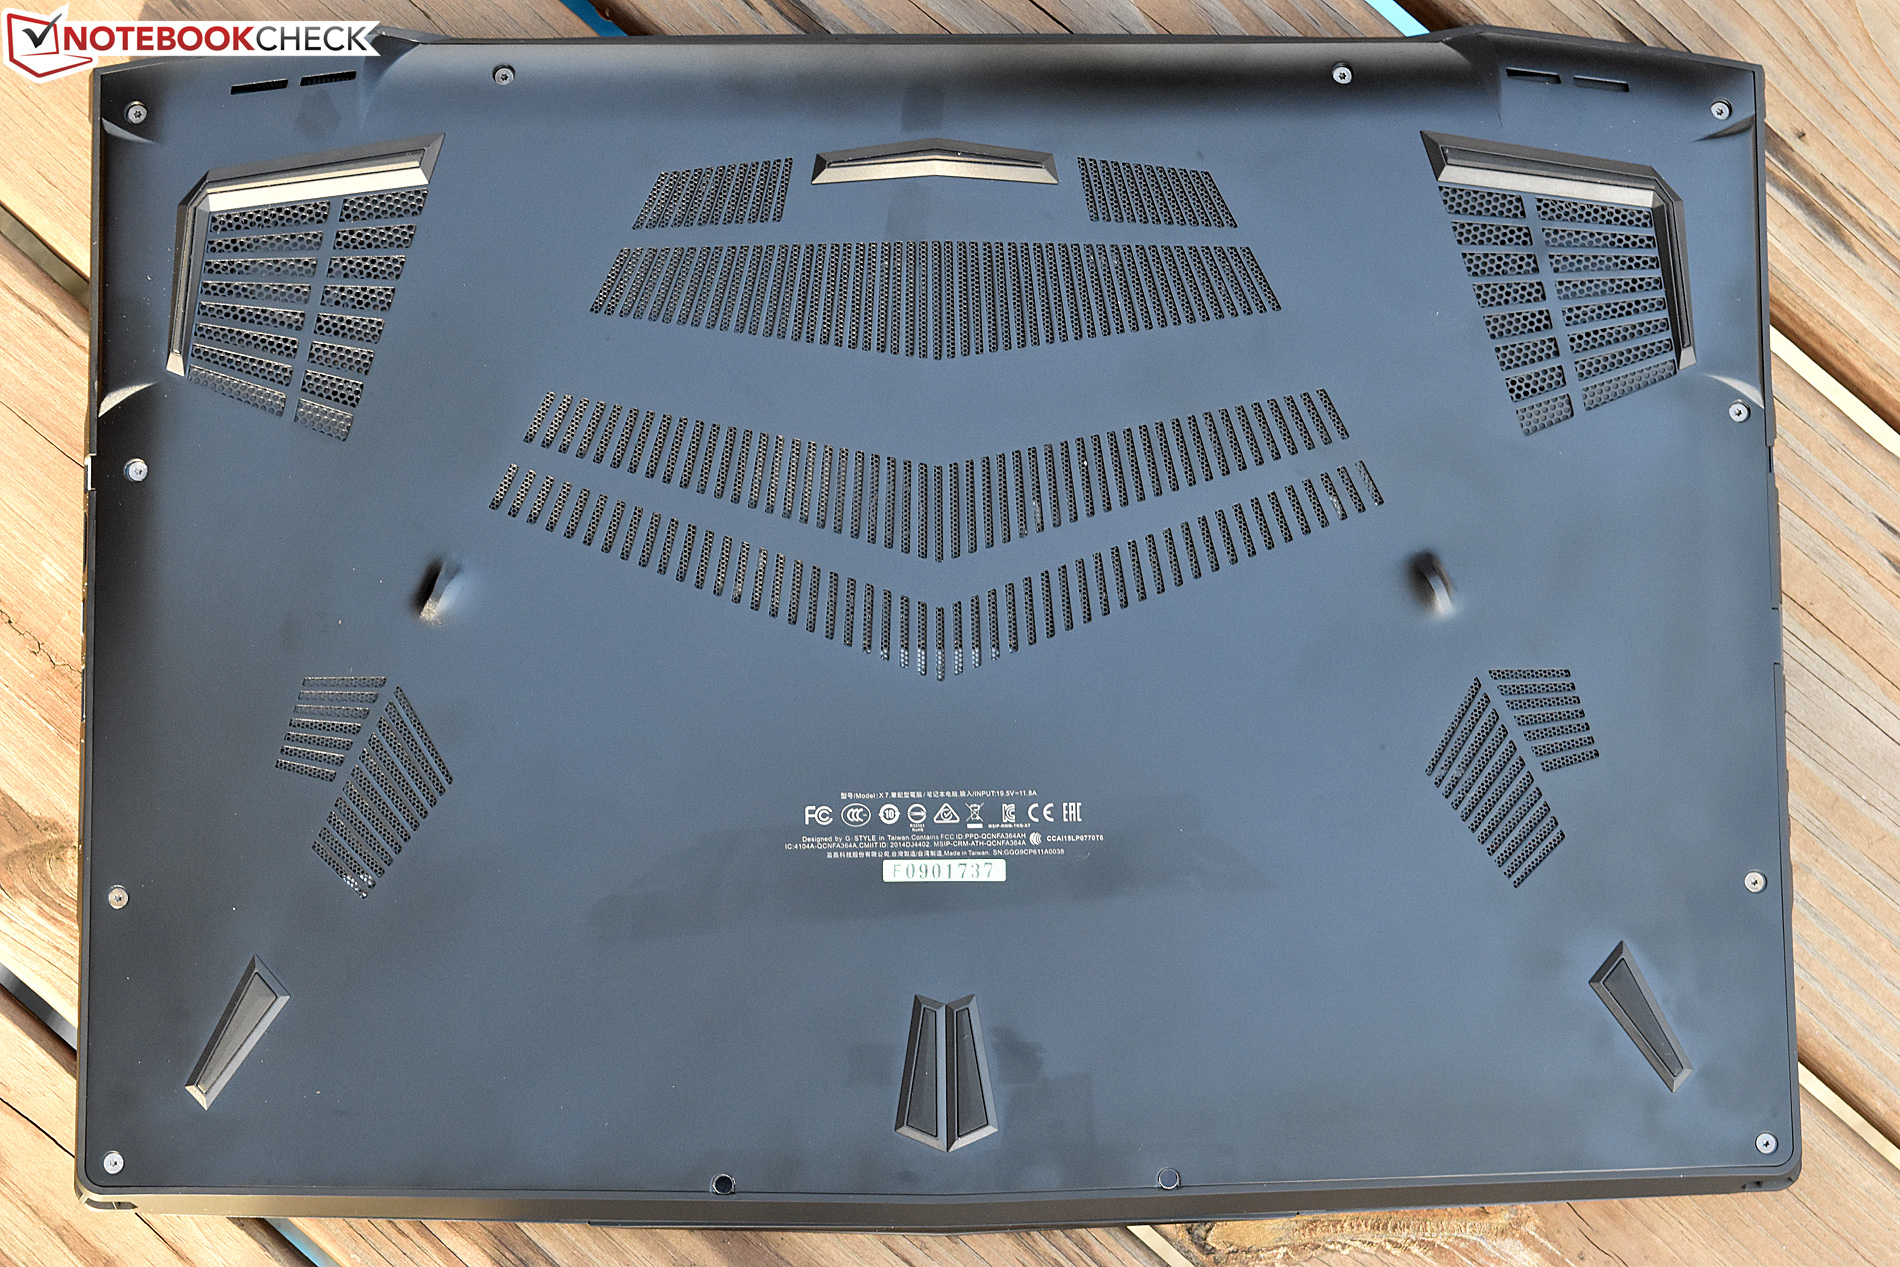
(-) The maximum temperature on the upper side is 45.4 °C / 114 F, compared to the average of 40.4 °C / 105 F, ranging from 21.2 to 68.8 °C for the class Gaming.
(-) The bottom heats up to a maximum of 58.2 °C / 137 F, compared to the average of 43.2 °C / 110 F
(+) In idle usage, the average temperature for the upper side is 25.9 °C / 79 F, compared to the device average of 33.9 °C / 93 F.
(+) The palmrests and touchpad are cooler than skin temperature with a maximum of 30.8 °C / 87.4 F and are therefore cool to the touch.
(±) The average temperature of the palmrest area of similar devices was 28.8 °C / 83.8 F (-2 °C / -3.6 F).
Aorus X7 DT v6 audio analysis
(±) | speaker loudness is average but good (72.3 dB)
Bass 100 - 315 Hz
(±) | reduced bass - on average 8.8% lower than median
(±) | linearity of bass is average (12.5% delta to prev. frequency)
Mids 400 - 2000 Hz
(+) | balanced mids - only 2.3% away from median
(±) | linearity of mids is average (9.5% delta to prev. frequency)
Highs 2 - 16 kHz
(±) | higher highs - on average 5.1% higher than median
(±) | linearity of highs is average (9.6% delta to prev. frequency)
Overall 100 - 16.000 Hz
(±) | linearity of overall sound is average (22.3% difference to median)
Compared to same class
» 80% of all tested devices in this class were better, 6% similar, 14% worse
» The best had a delta of 6%, average was 18%, worst was 132%
Compared to all devices tested
» 65% of all tested devices were better, 6% similar, 29% worse
» The best had a delta of 4%, average was 23%, worst was 134%
HP Omen 17-w110ng audio analysis
(+) | speakers can play relatively loud (85 dB)
Bass 100 - 315 Hz
(-) | nearly no bass - on average 22.3% lower than median
(±) | linearity of bass is average (13.2% delta to prev. frequency)
Mids 400 - 2000 Hz
(+) | balanced mids - only 2.7% away from median
(+) | mids are linear (4.9% delta to prev. frequency)
Highs 2 - 16 kHz
(±) | higher highs - on average 5.9% higher than median
(+) | highs are linear (5.3% delta to prev. frequency)
Overall 100 - 16.000 Hz
(±) | linearity of overall sound is average (18.5% difference to median)
Compared to same class
» 60% of all tested devices in this class were better, 8% similar, 32% worse
» The best had a delta of 6%, average was 18%, worst was 132%
Compared to all devices tested
» 42% of all tested devices were better, 8% similar, 51% worse
» The best had a delta of 4%, average was 23%, worst was 134%
| Off / Standby | |
| Idle | |
| Load |
|
Key:
min: | |
| Aorus X7 DT v6 6820HK, GeForce GTX 1080 Mobile, Samsung SM951 MZVPV512HDGL m.2 PCI-e, TN LED, 2560x1440, 17.3" | Aorus X7 v6 6820HK, GeForce GTX 1070 Mobile, Toshiba NVMe THNSN5512GPU7, TN LED, 2560x1440, 17.3" | Asus Strix GL502VS-FY032T 6700HQ, GeForce GTX 1070 Mobile, SanDisk SD8SNAT256G1002, IPS, 1920x1080, 15.6" | HP Omen 17-w110ng 6700HQ, GeForce GTX 1070 Mobile, Samsung PM951 NVMe MZVLV256, IPS, 1920x1080, 17.3" | MSI GT73VR 6RF 6820HK, GeForce GTX 1080 Mobile, 2x SanDisk X400 1TB M.2 SD8SN8U1T001122 (RAID 0), IPS, 3840x2160, 17.3" | |
|---|---|---|---|---|---|
| Power Consumption | 10% | 33% | 31% | -2% | |
| Idle Minimum * (Watt) | 31.5 | 29 8% | 20 37% | 19 40% | 28.9 8% |
| Idle Average * (Watt) | 33.9 | 31 9% | 24 29% | 25 26% | 30.6 10% |
| Idle Maximum * (Watt) | 34.6 | 38 -10% | 29 16% | 31 10% | 33.1 4% |
| Load Average * (Watt) | 205.6 | 111 46% | 86 58% | 90 56% | 224.4 -9% |
| Load Maximum * (Watt) | 250.8 | 253 -1% | 183 27% | 193 23% | 302.6 -21% |
* ... smaller is better
| Aorus X7 DT v6 6820HK, GeForce GTX 1080 Mobile, 94 Wh | Aorus X7 v6 6820HK, GeForce GTX 1070 Mobile, 94 Wh | Asus Strix GL502VS-FY032T 6700HQ, GeForce GTX 1070 Mobile, 62 Wh | HP Omen 17-w110ng 6700HQ, GeForce GTX 1070 Mobile, 95 Wh | MSI GT73VR 6RF 6820HK, GeForce GTX 1080 Mobile, 75.2 Wh | |
|---|---|---|---|---|---|
| Battery runtime | 25% | 13% | 77% | 26% | |
| Reader / Idle (h) | 3 | 4.1 37% | 7.2 140% | 5.1 70% | |
| WiFi v1.3 (h) | 2.4 | 3 25% | 3.3 38% | 4.1 71% | 3.3 38% |
| Load (h) | 1.6 | 1 -37% | 1.9 19% | 1.1 -31% |
Pros
Cons
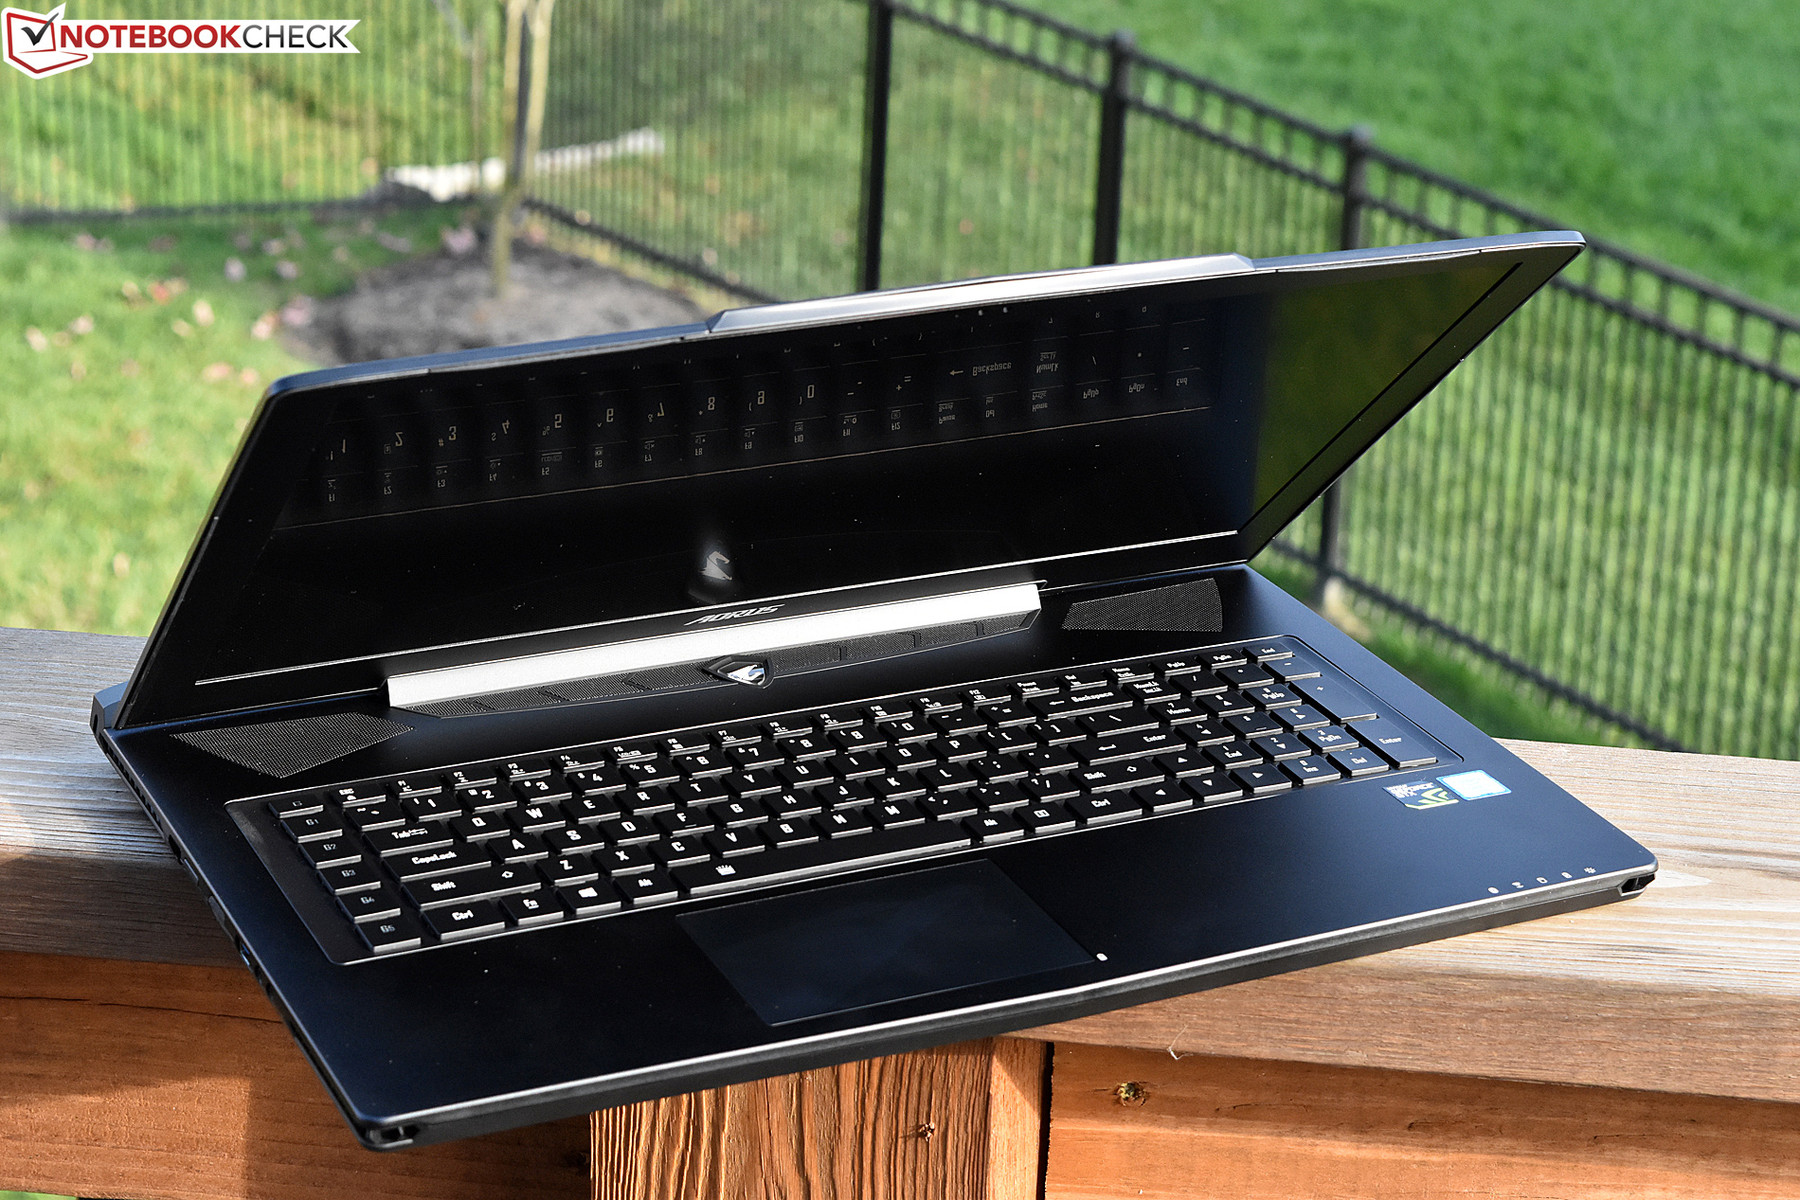
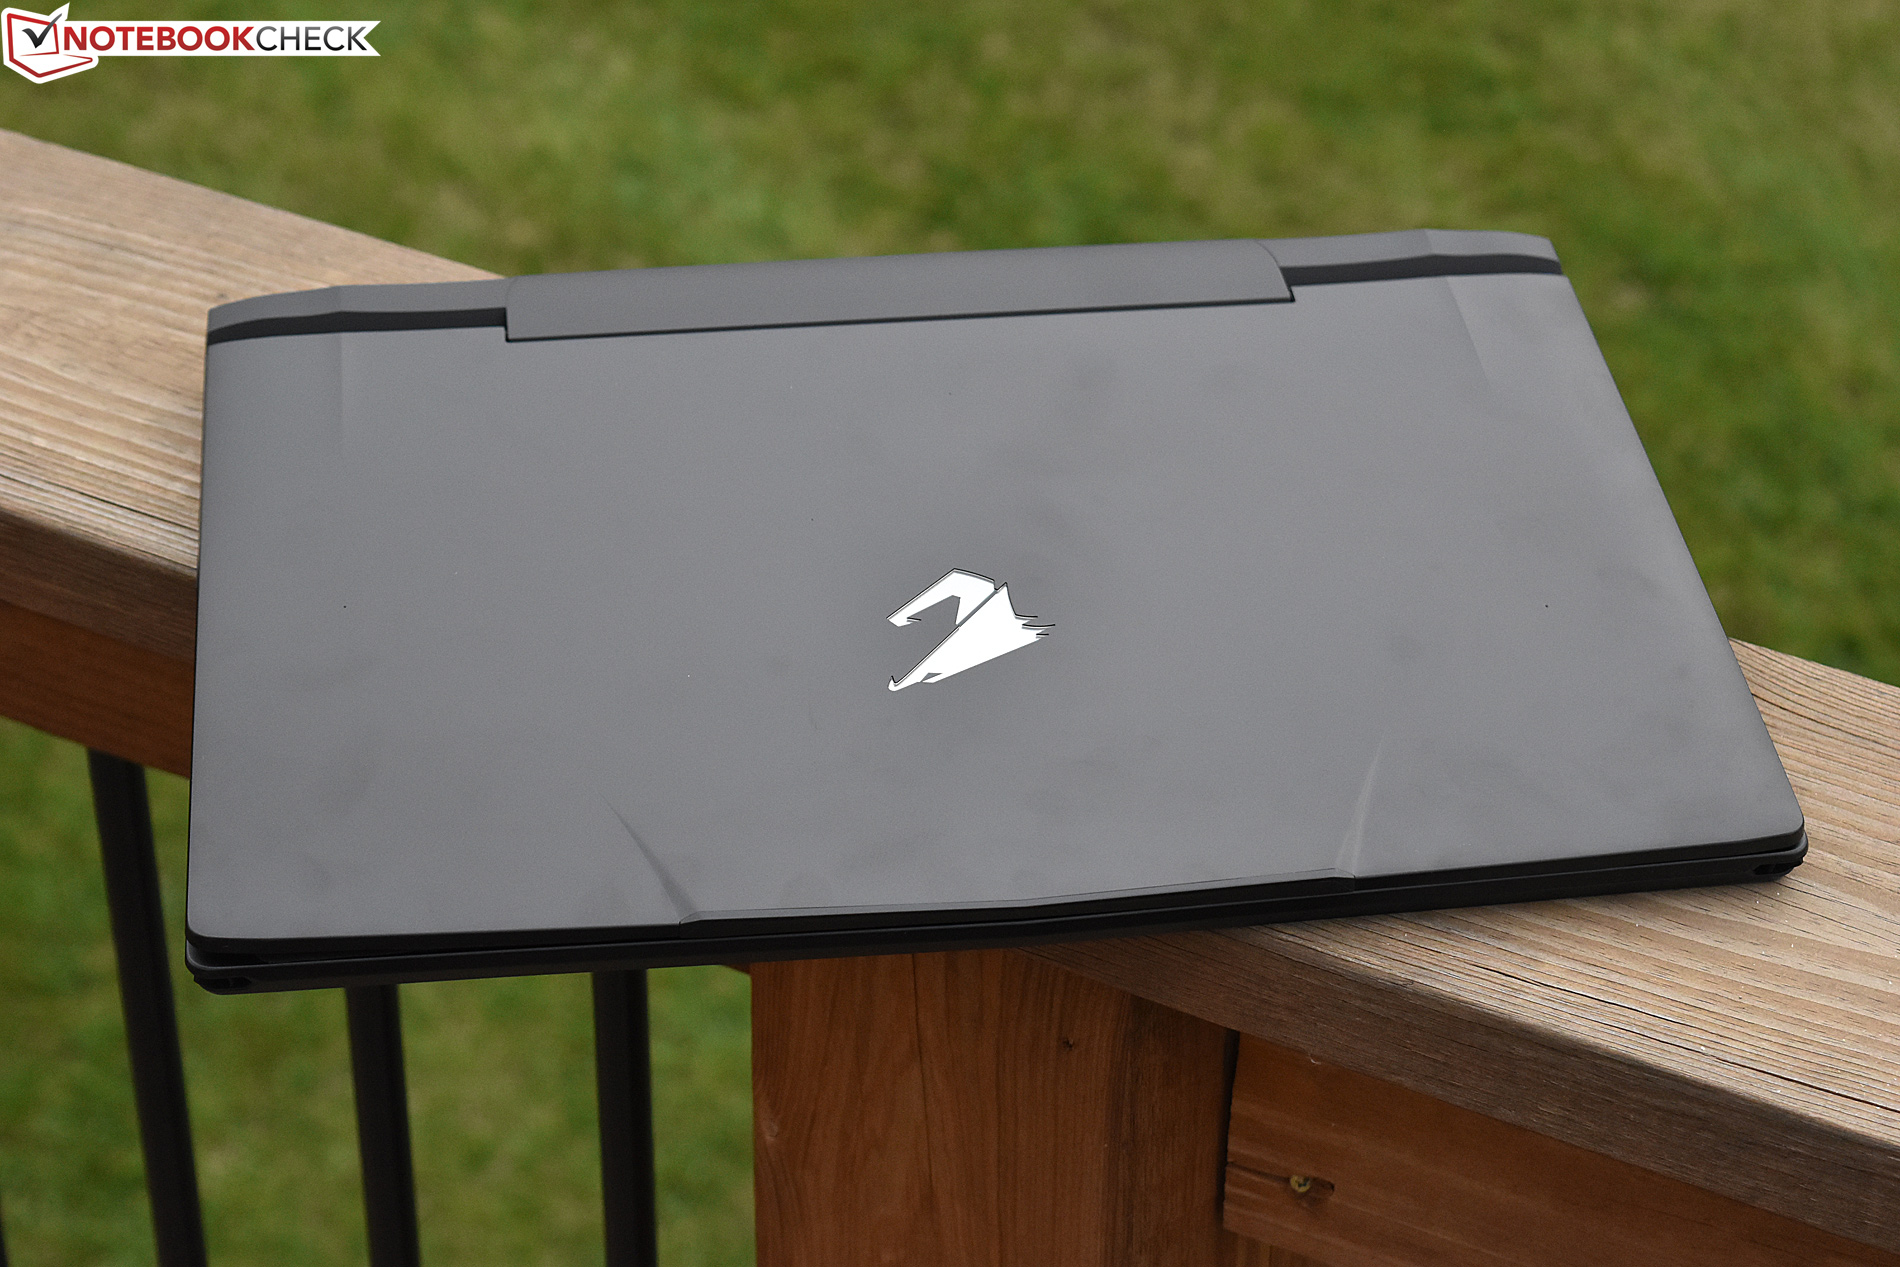
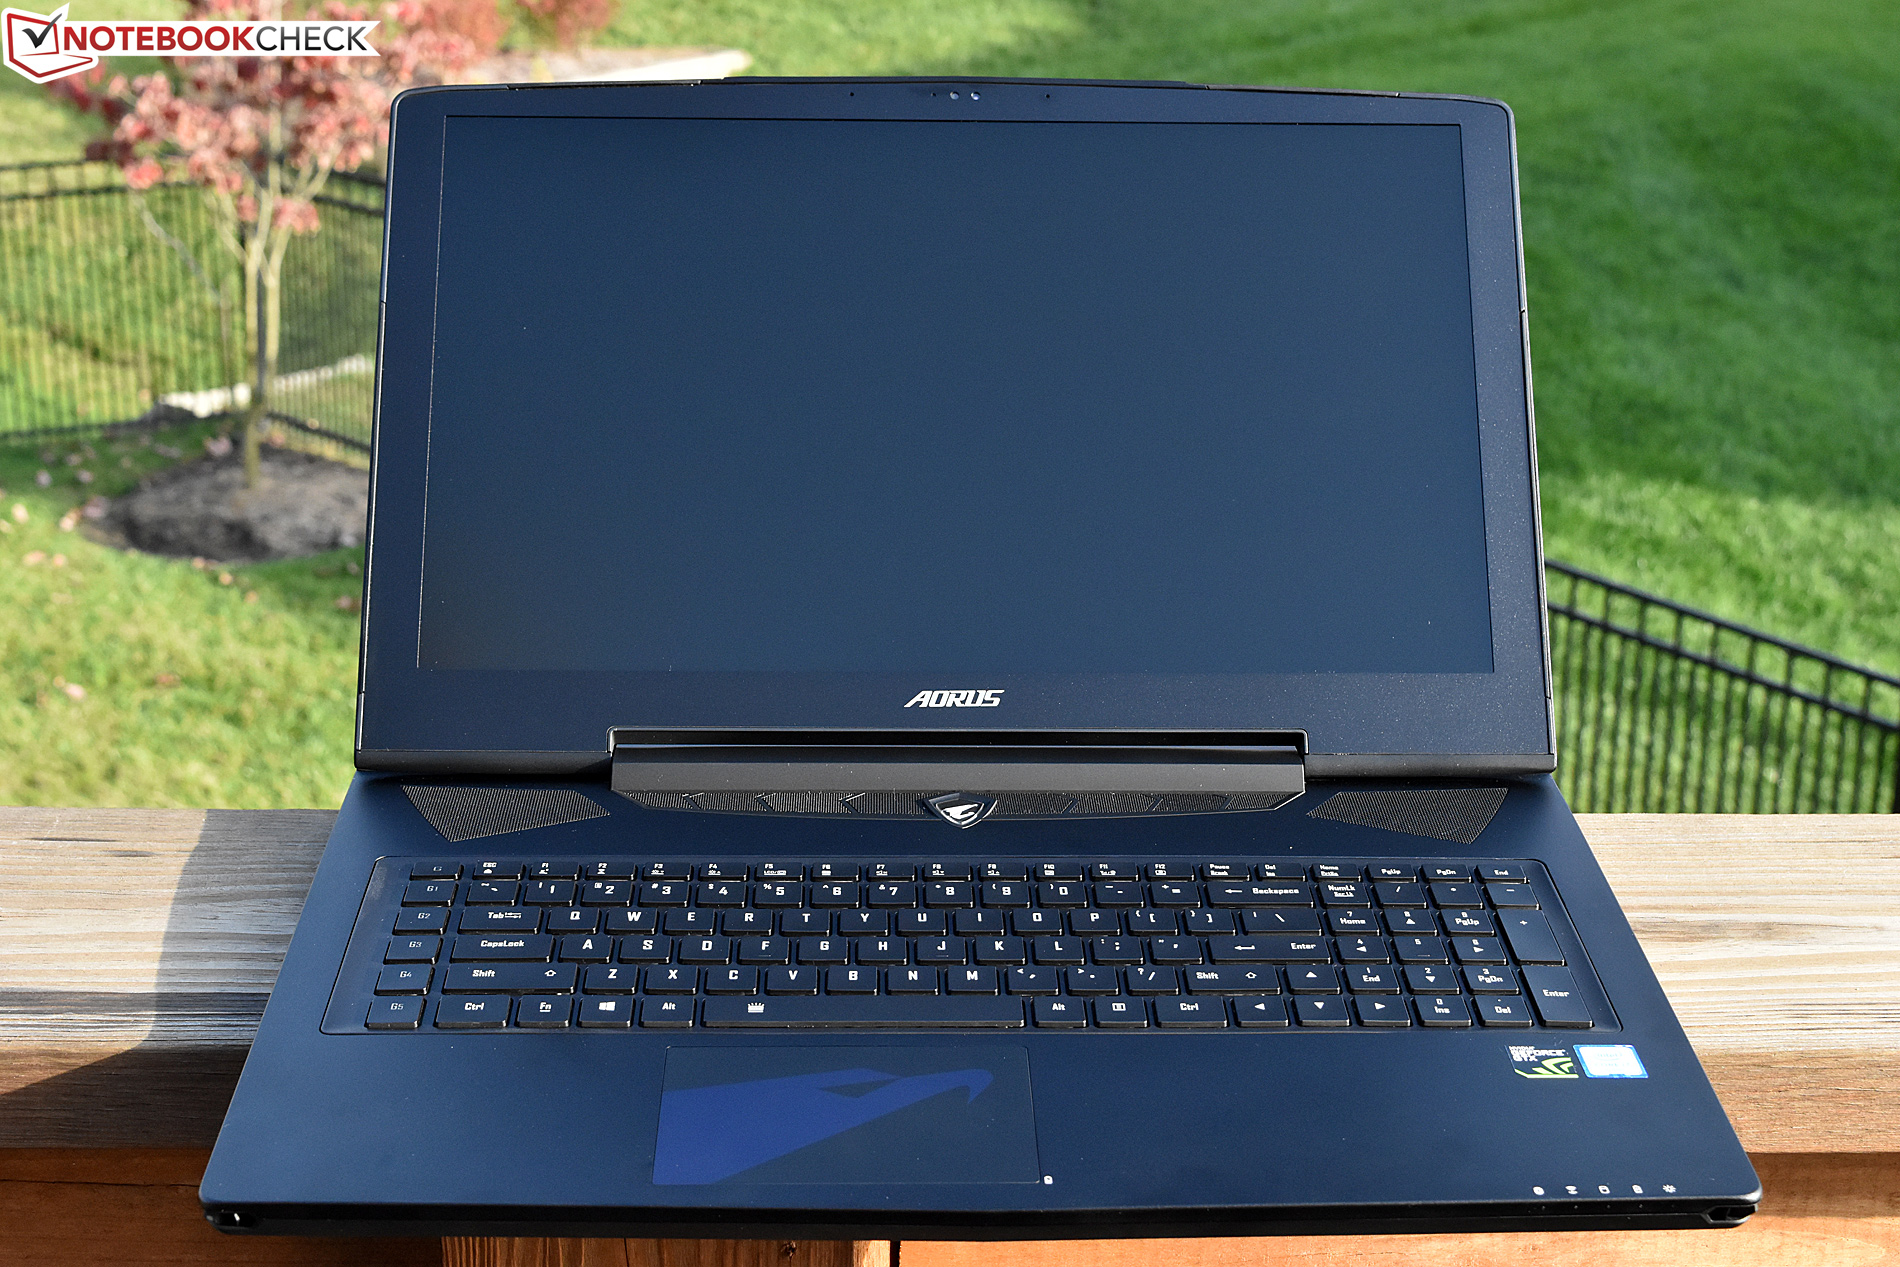
傲睿士X7 DT v6是Notebookcheck目前为止测试过最强劲的游戏本之一,而它相比竞争机型也轻盈许多。归功于英伟达GeForce GTX 1080结合未锁频酷睿i7-6820HK的组合,再加上技嘉的出色集成管理软件,傲睿士X7 DT v6可以轻松地在开机时就进入超频。同时,由于搭配了高效创新的散热系统,它在测试中得到了超高的分数:一部分达到了我们的数据库中前所未有的新高度。
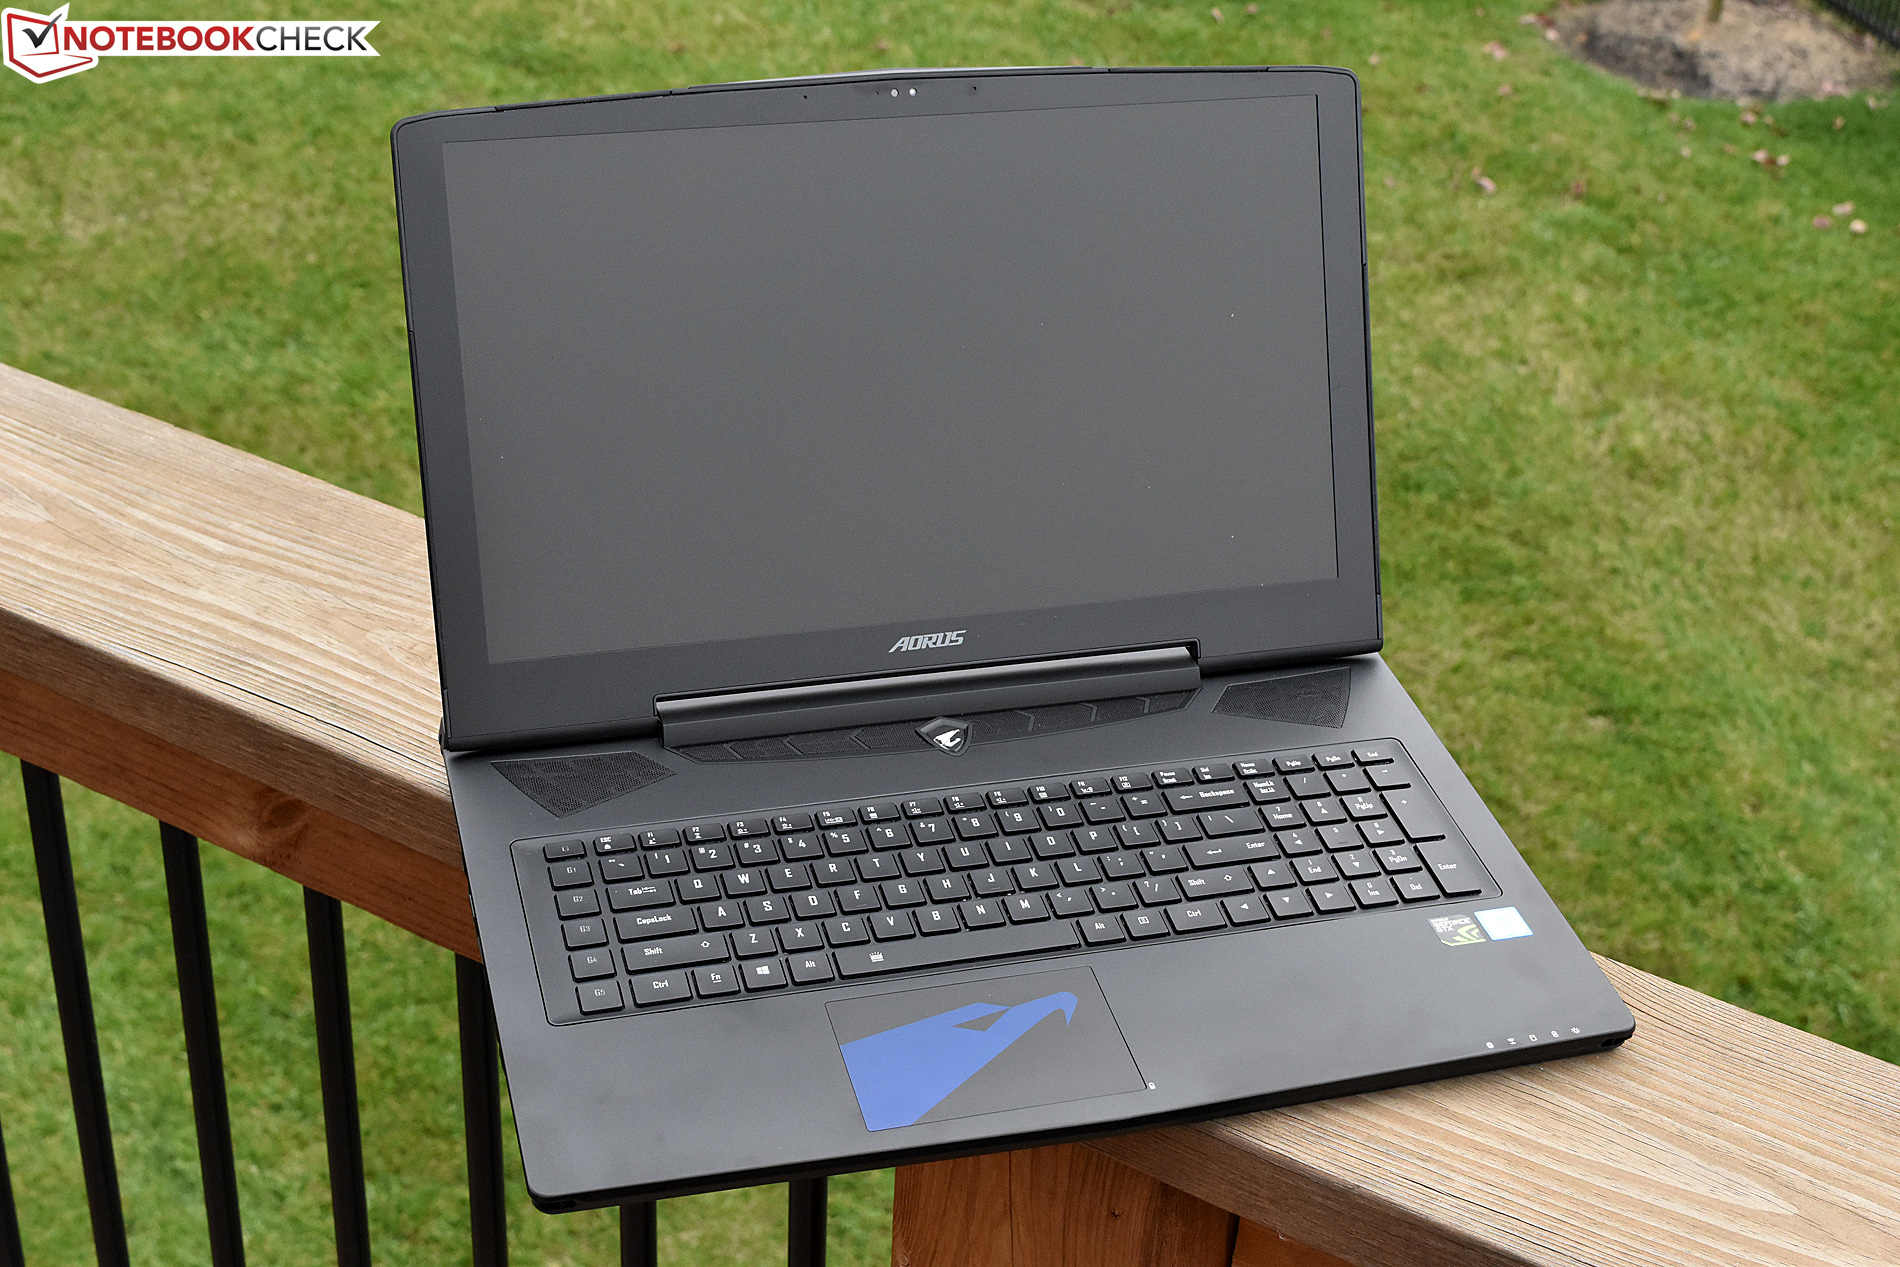
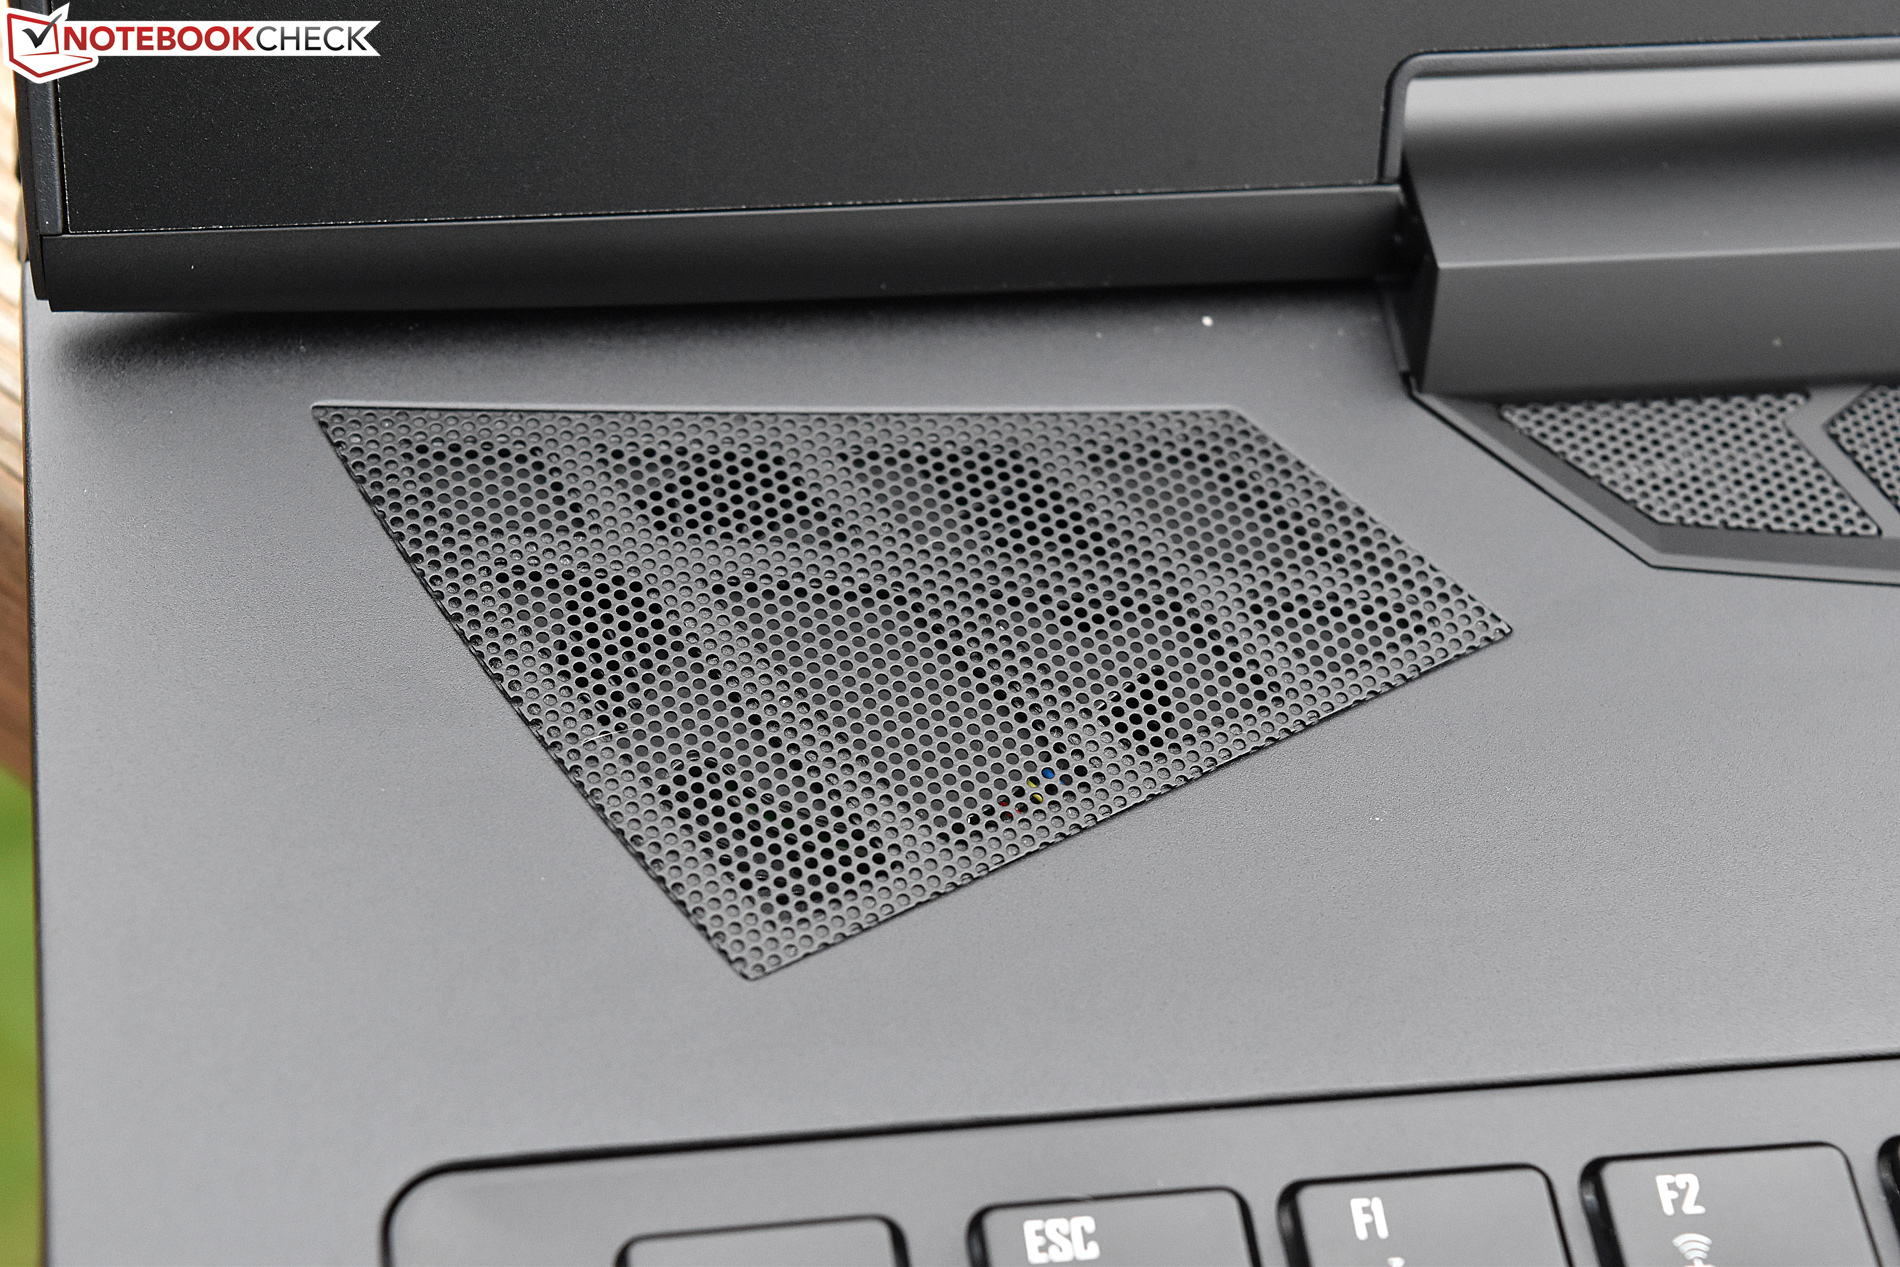
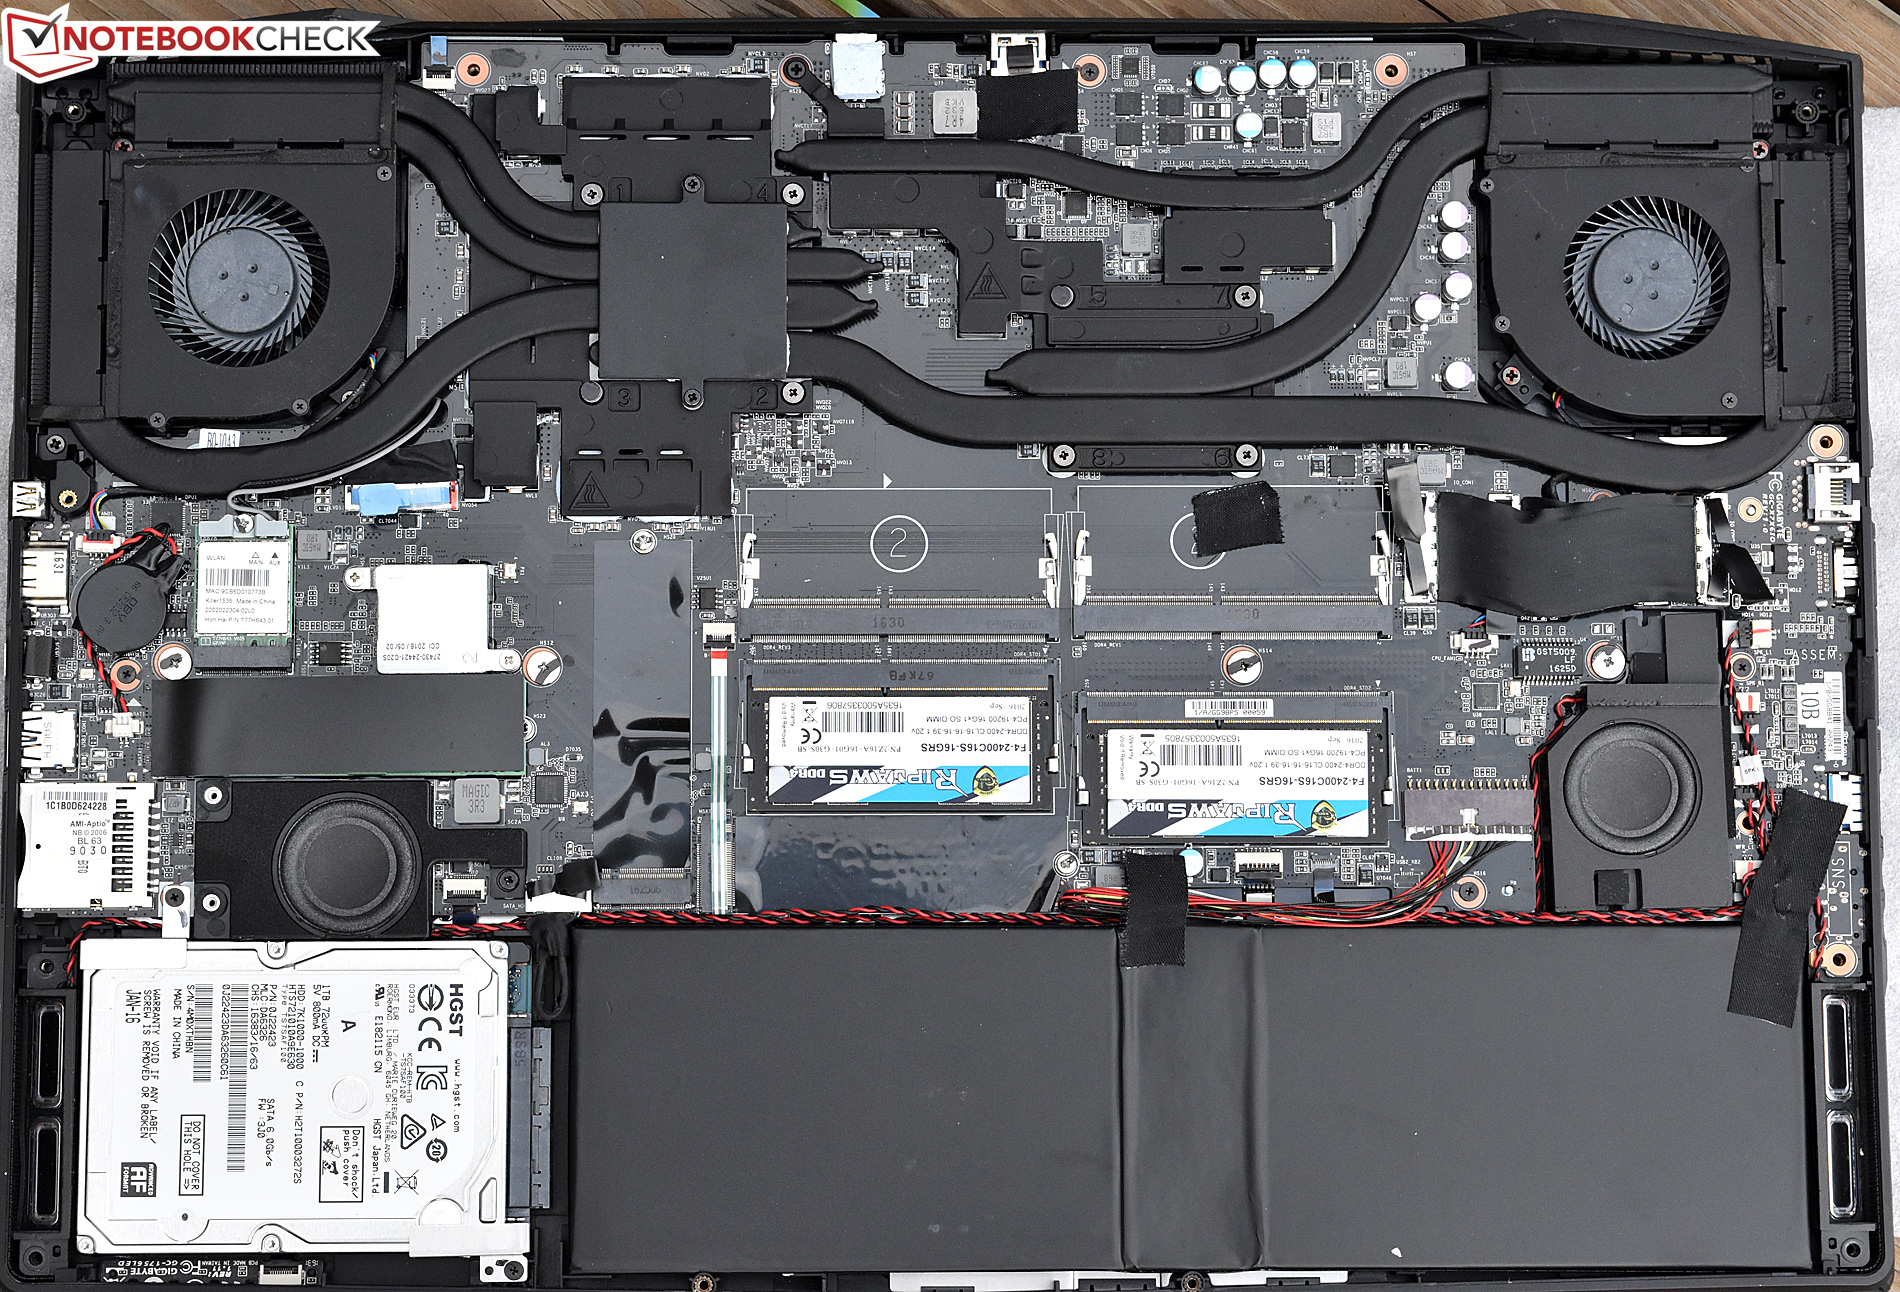
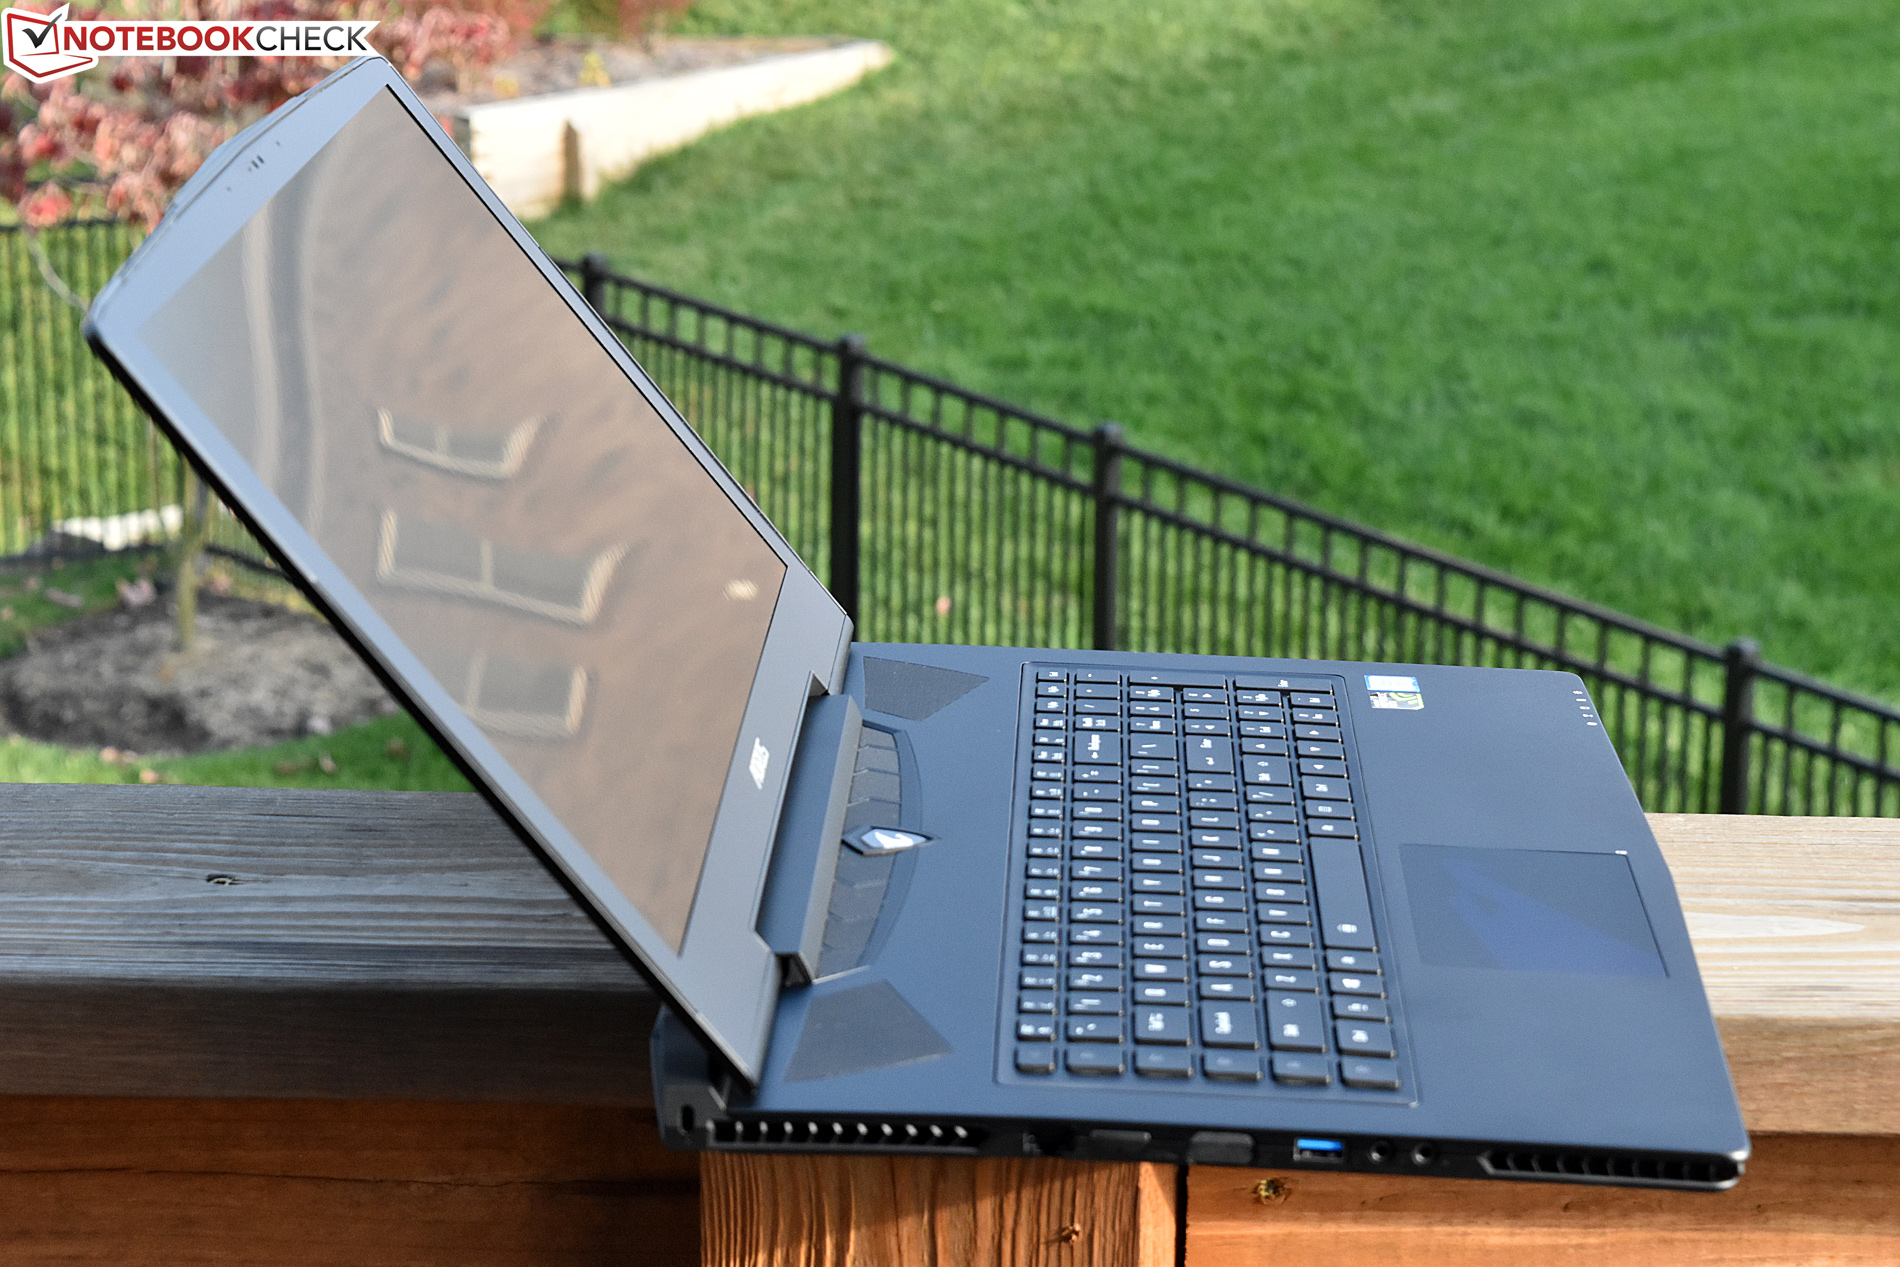
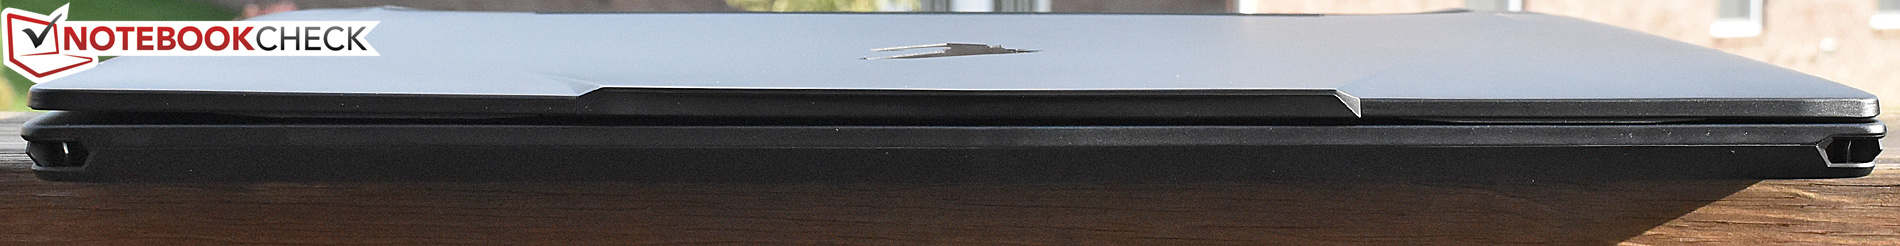
它仅凭3.25千克重、30毫米厚的镁合金机身就做到了这一切。X7可以运行你打开的任何游戏,大部分都可以使用最高设定和屏幕的原声分辨率(1440p)。而它的屏幕也是整机的亮点之一,尽管它采用了TN技术,可视角度和色彩准确度一般,但提供了很高的响应速度和120赫兹刷新率,这可以完美匹配显卡带来的高帧率。在这方面最大的问题可能是很多用户会发现的屏幕上的横线,不过这只会在静止情况下出现,在显示电影或游戏等动态内容时则难以察觉。因为这个问题并不严重,X7也适合作为视频编辑的移动工作站。
它的输入设备、工艺品质和机身稳定性也十分出色,相比其他傲睿士产品线中的设备,它就像是一个得到整体升级的产品。它的缺点基本都是一些小细节,或难以避免的情况:它的扬声器较差,使用音效管理工具会让这略有改善。它在负载下也十分吵——不过用户可以通过技嘉的Command&Control软件直接控制它的噪音性能比。最后,由于功耗较高且不支持可切换显卡,它的续航时间很短——不过在购买这类机型时需要考虑电池续航的用户,我们建议重新考虑一下对设备的期待和侧重点。
长话短说,它是目前我们测试过最优秀的游戏本之一。如果你能够接受它的价码的话,应该不会对它失望。
注:本文是基于完整评测的缩减版本,阅读完整的英文评测,请点击这里。
Aorus X7 DT v6
- 12/05/2016 v6 (old)
Steve Schardein
Price comparison
