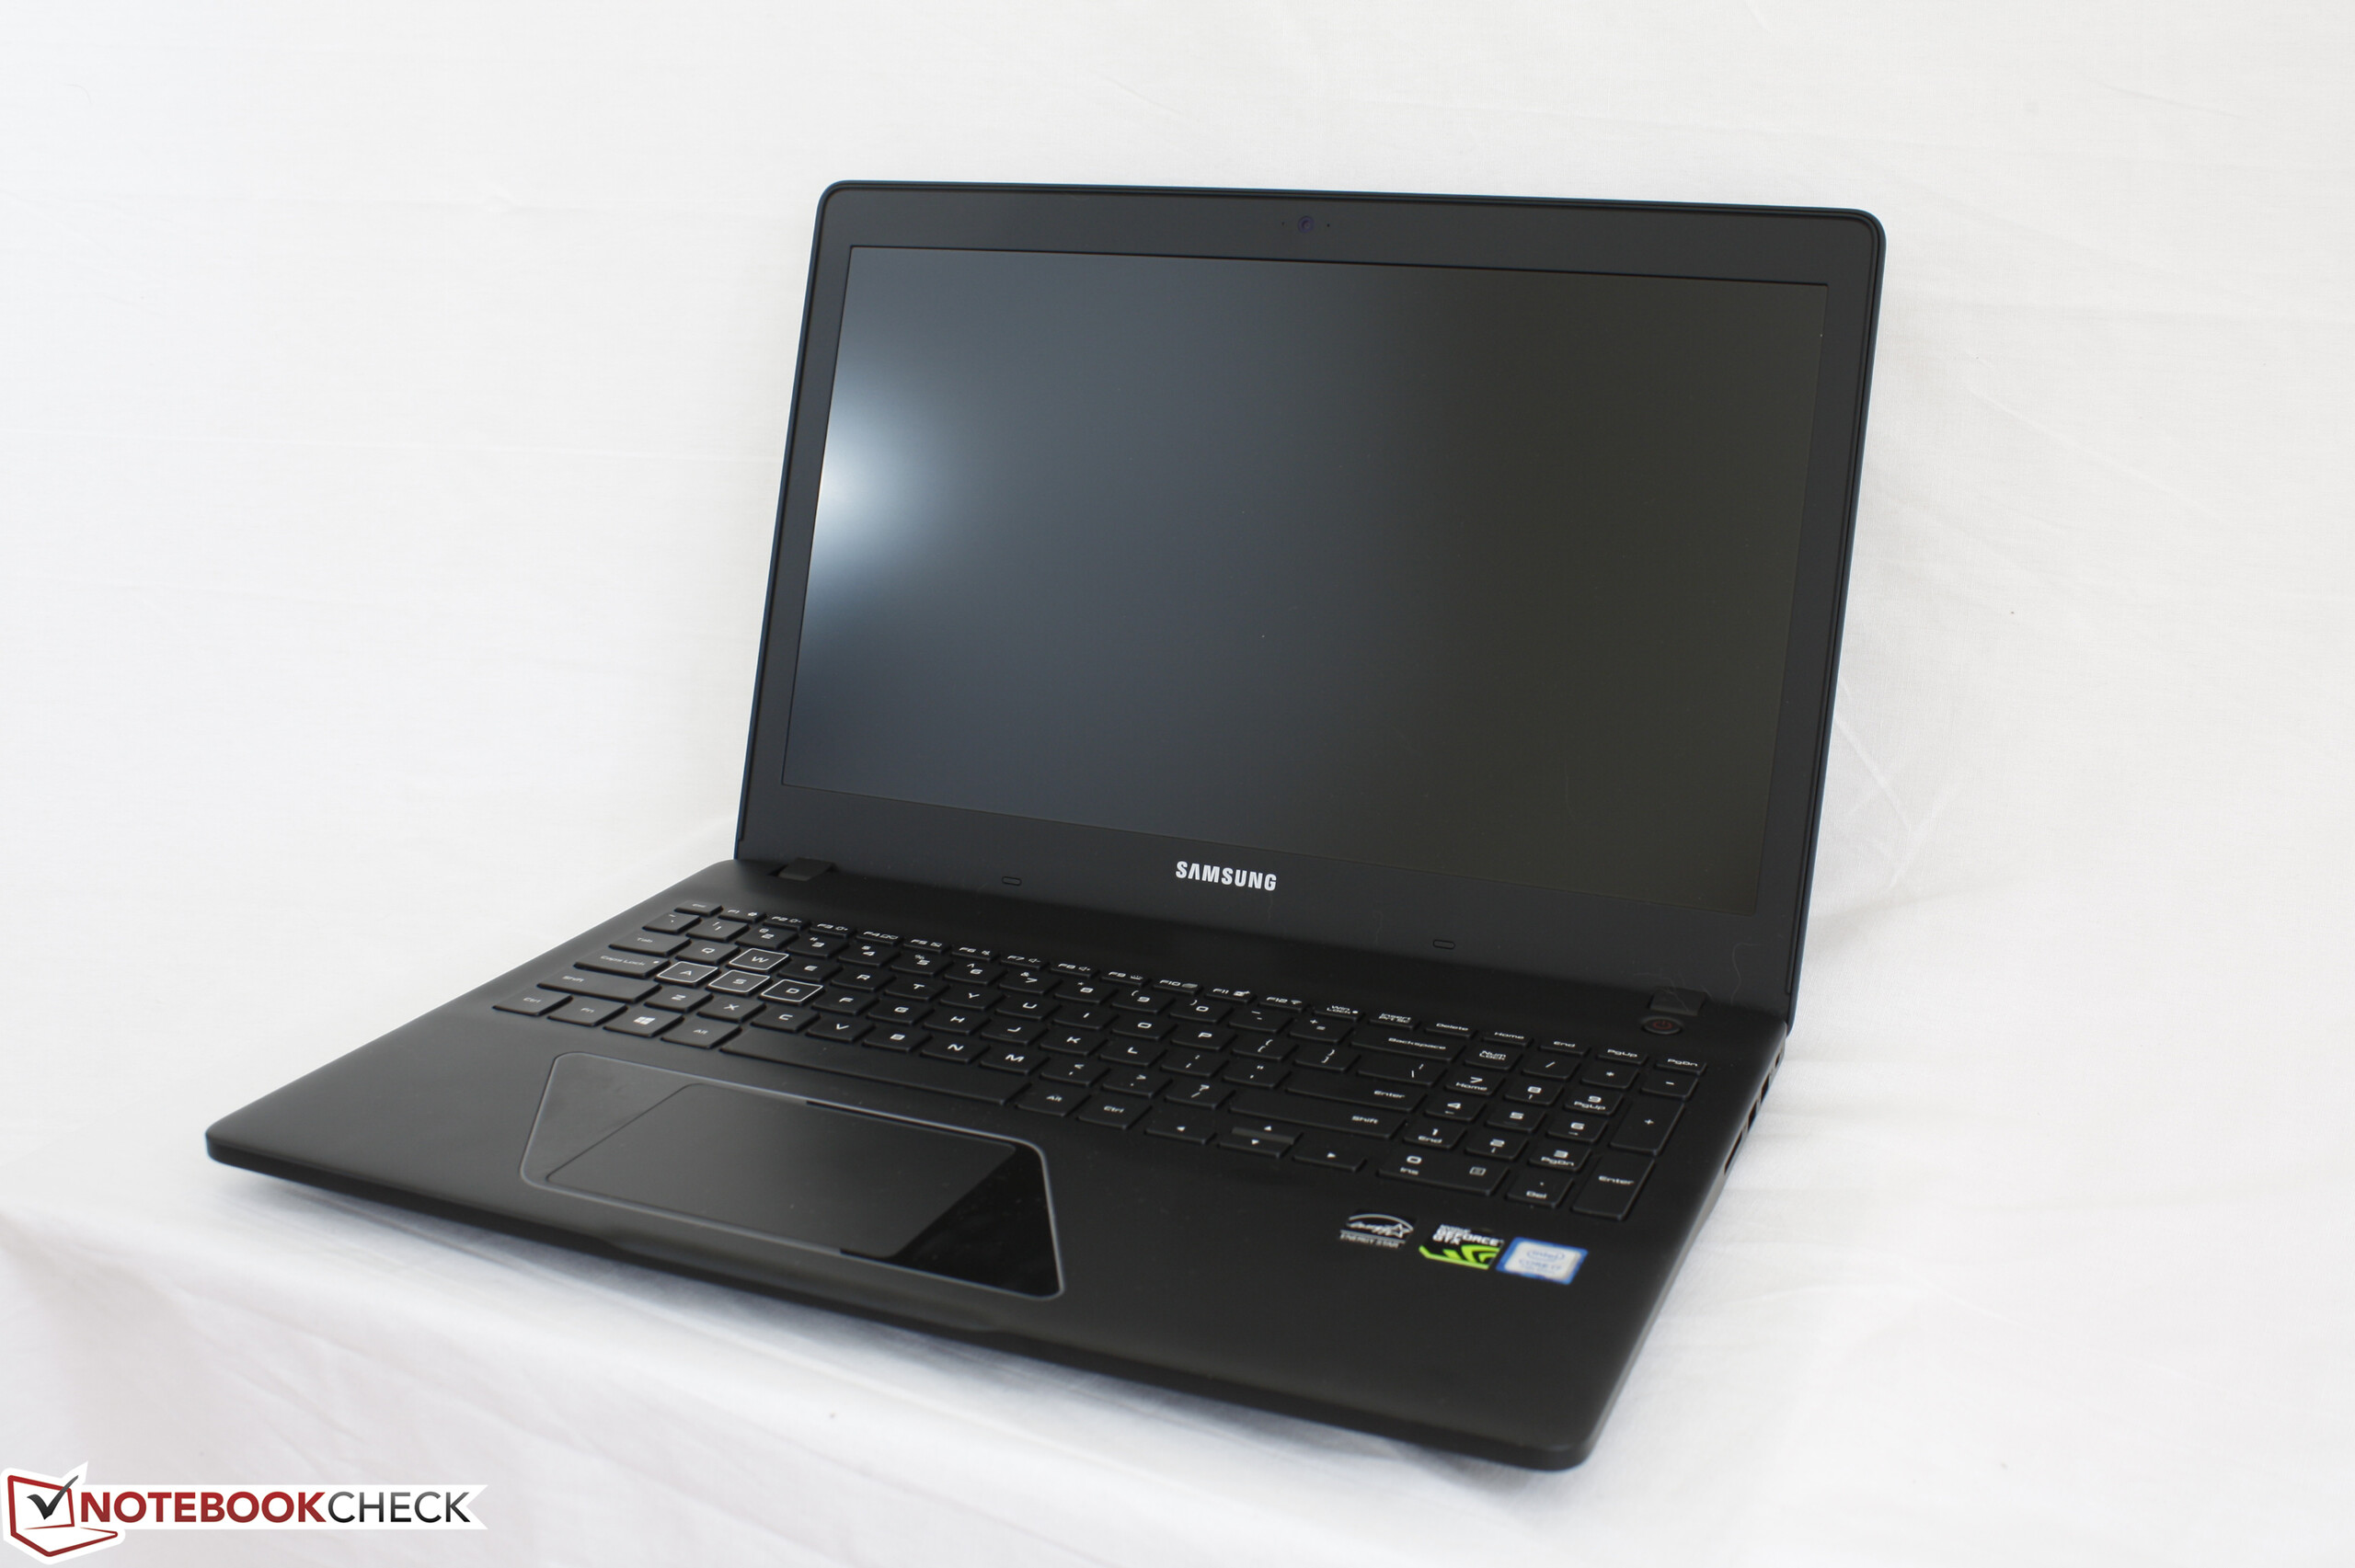
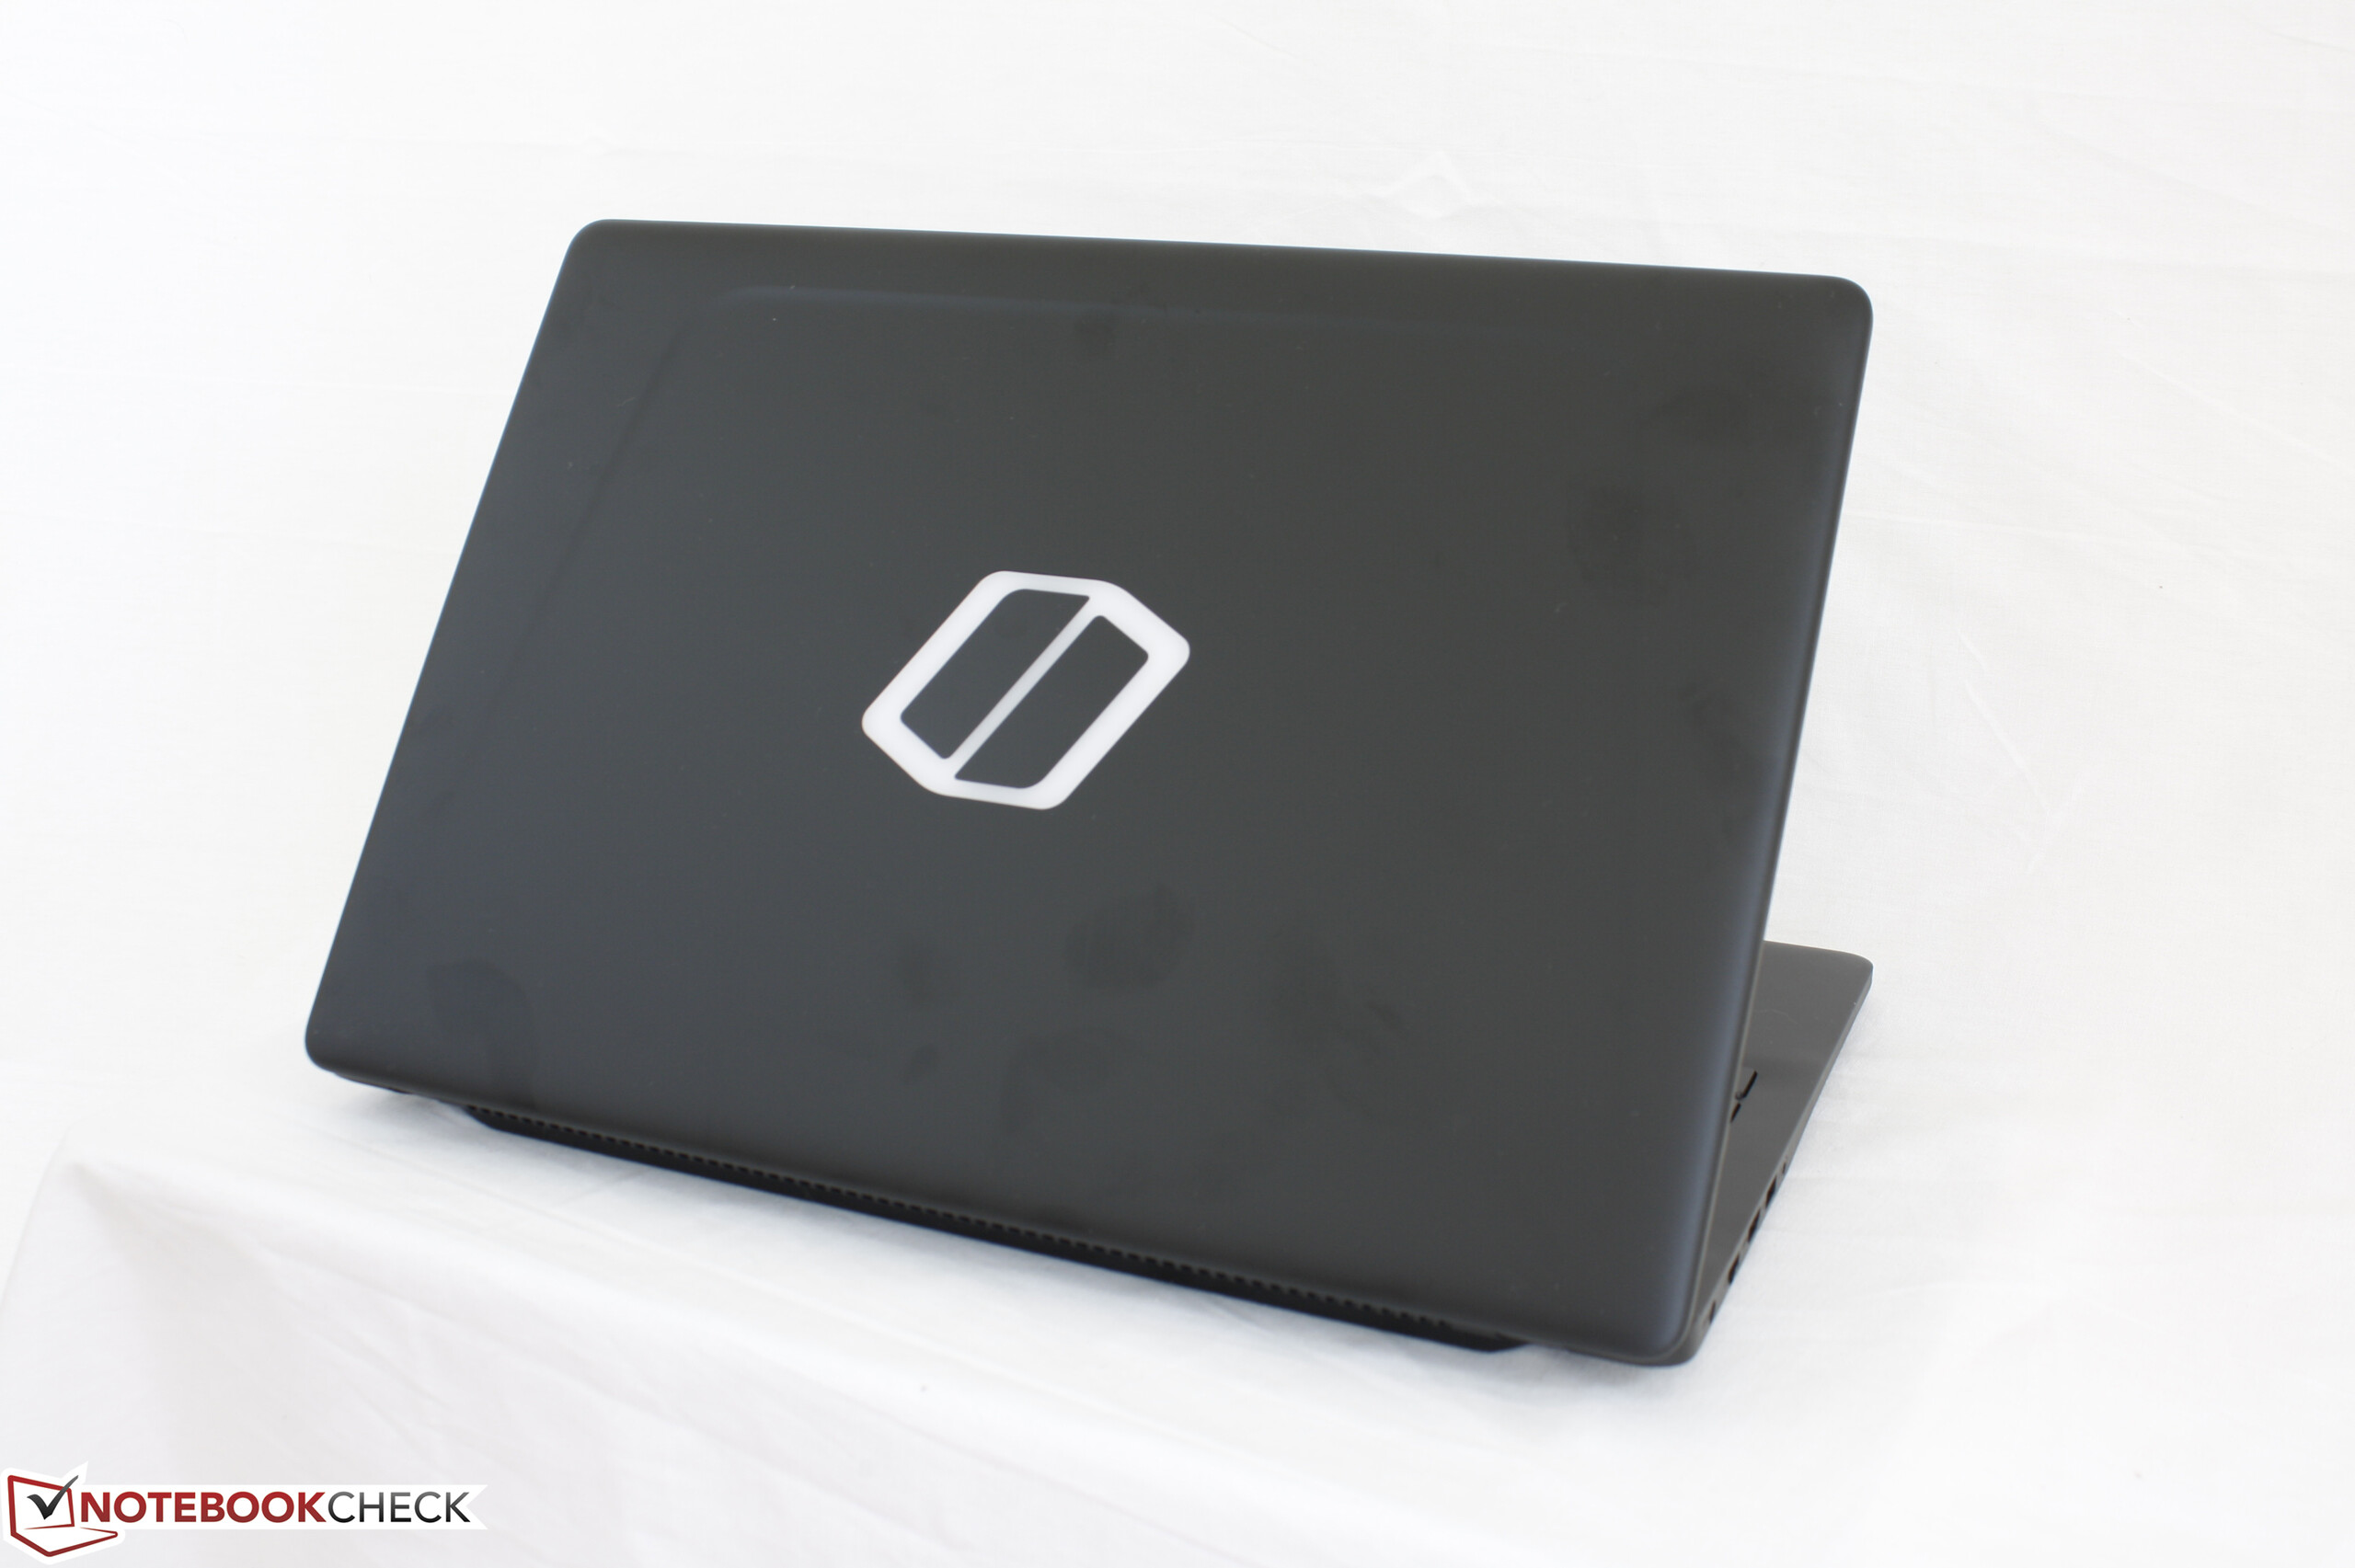
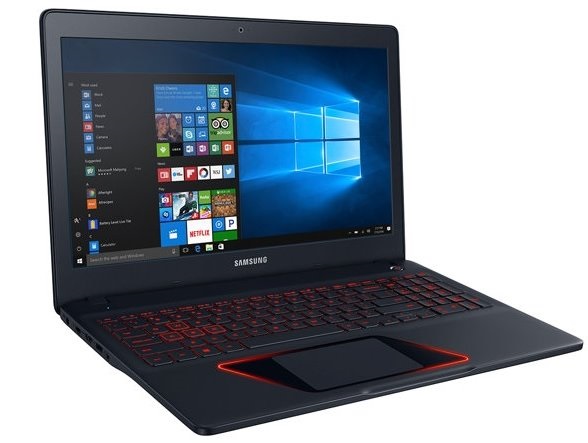
三星 Odyssey NP800G5M (7700HQ, 全高清, GTX 1050) 笔记本电脑简短评测
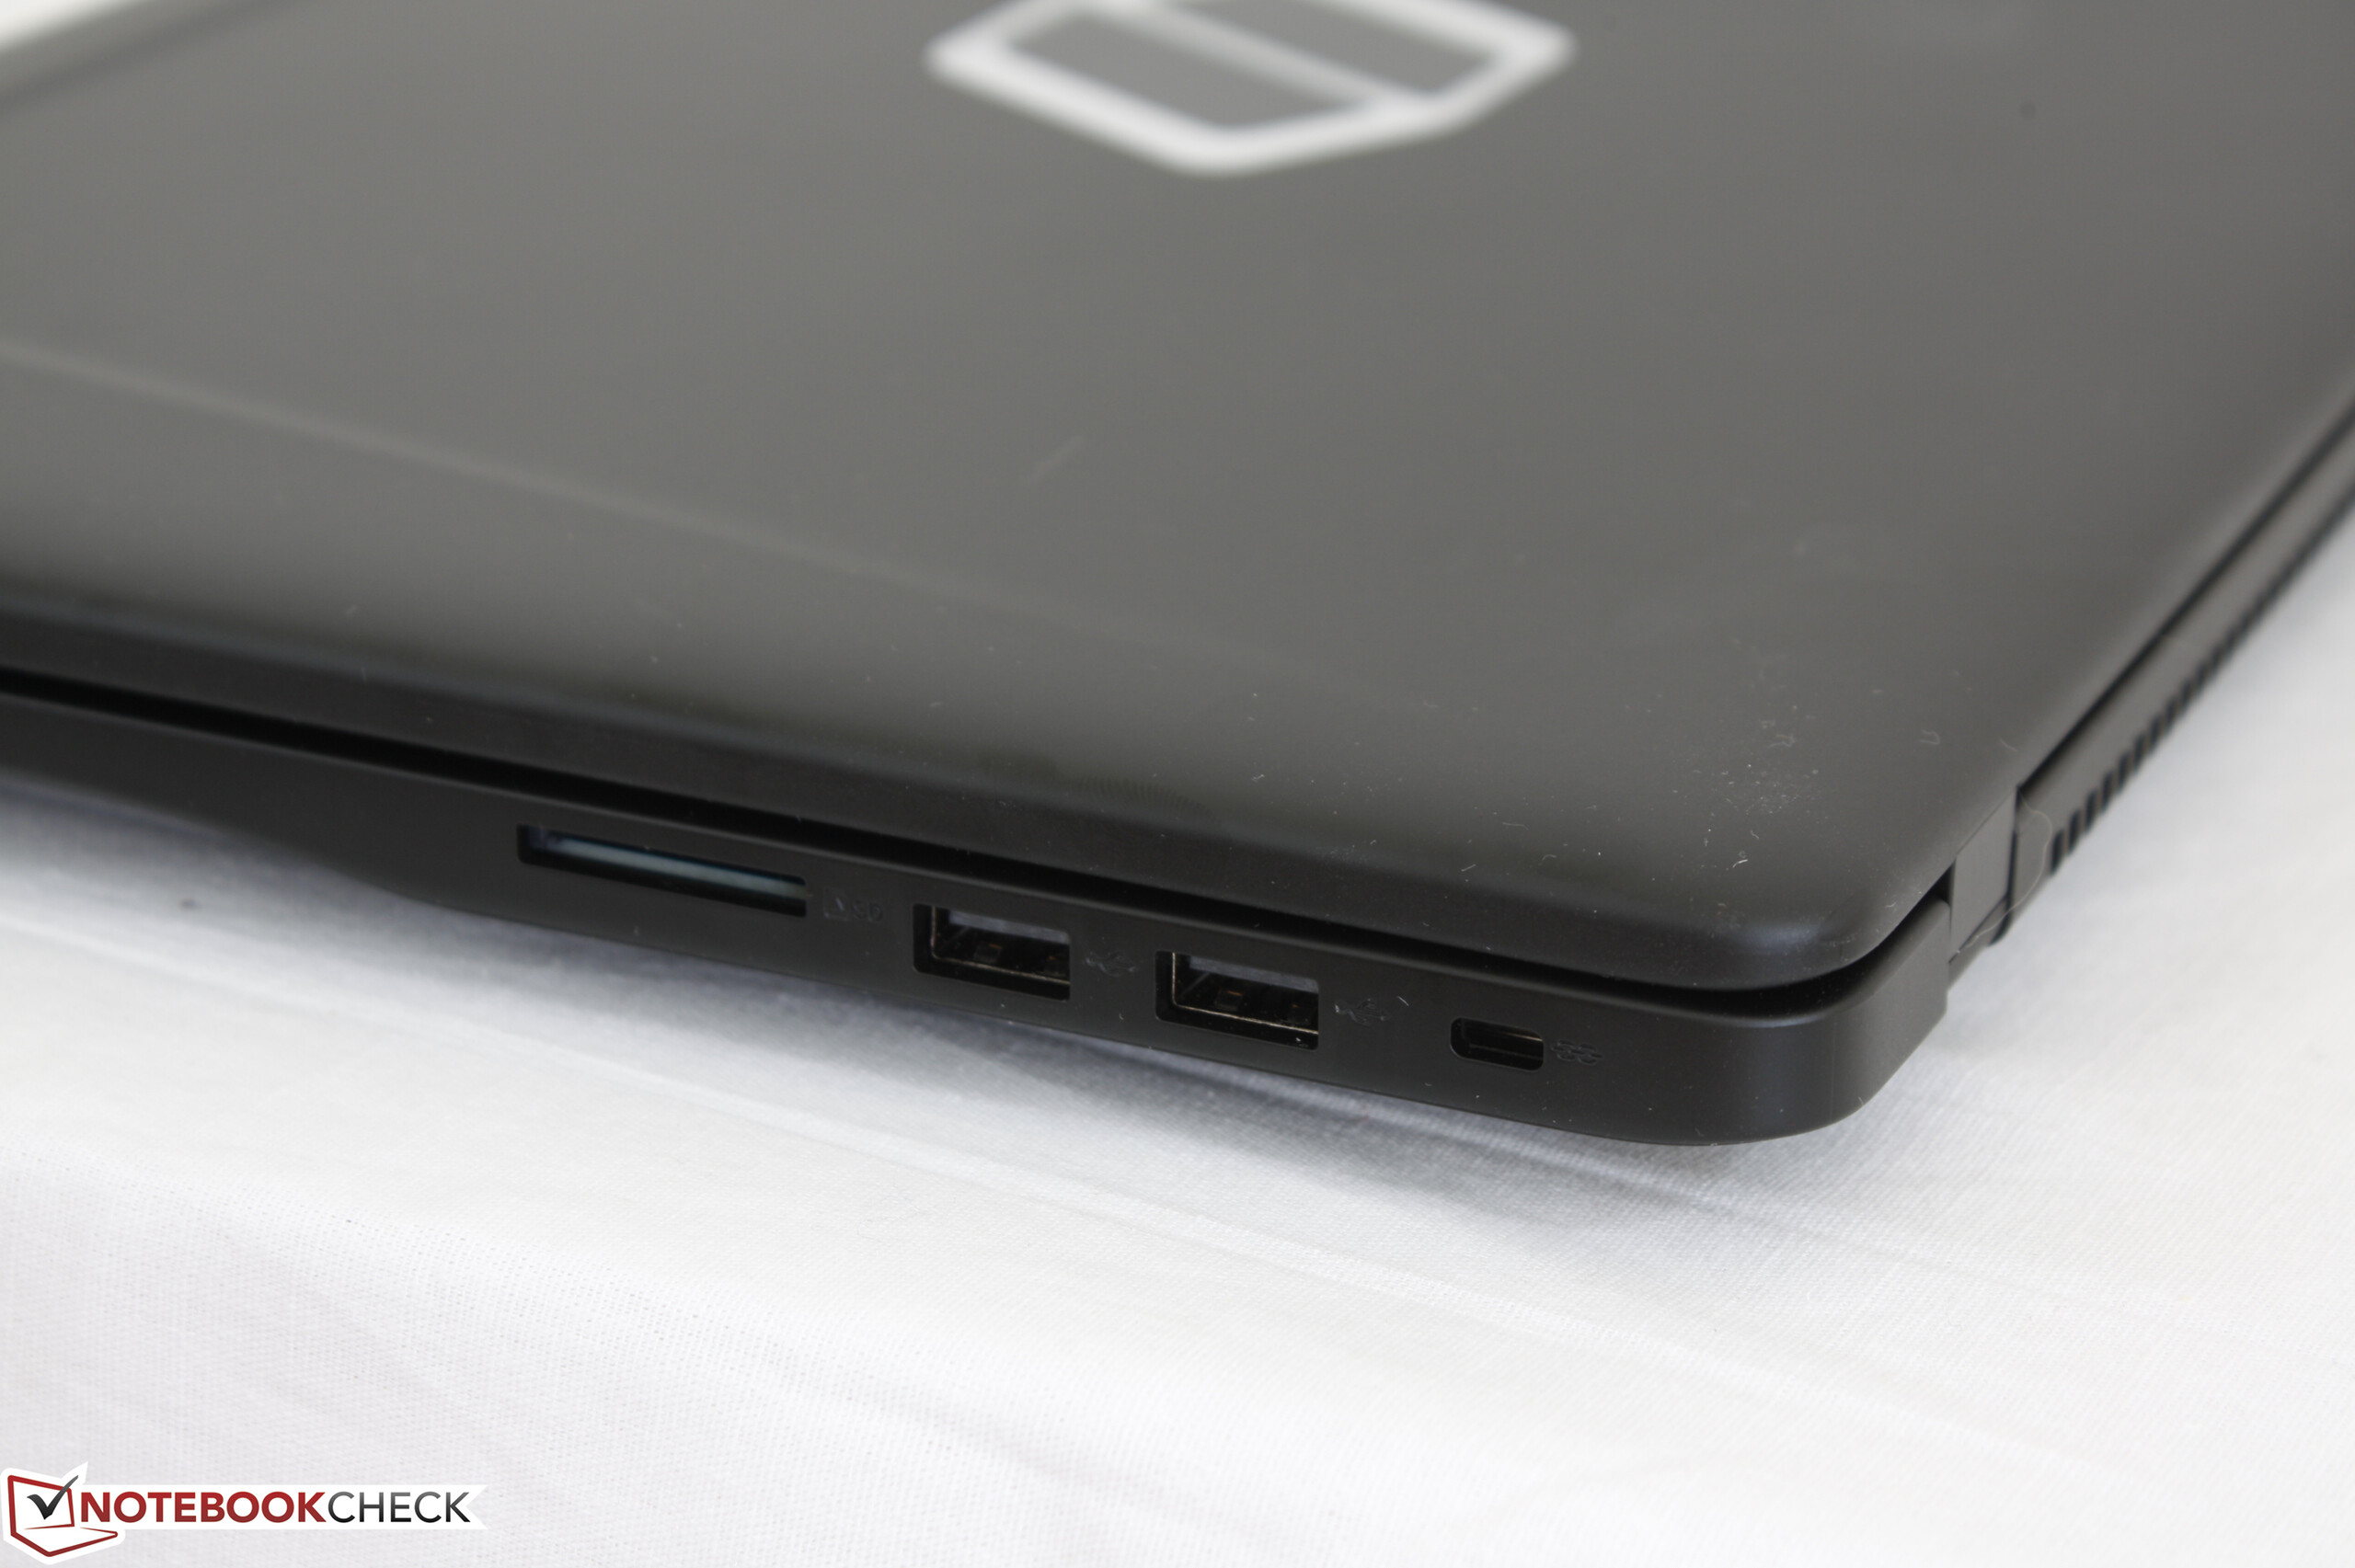
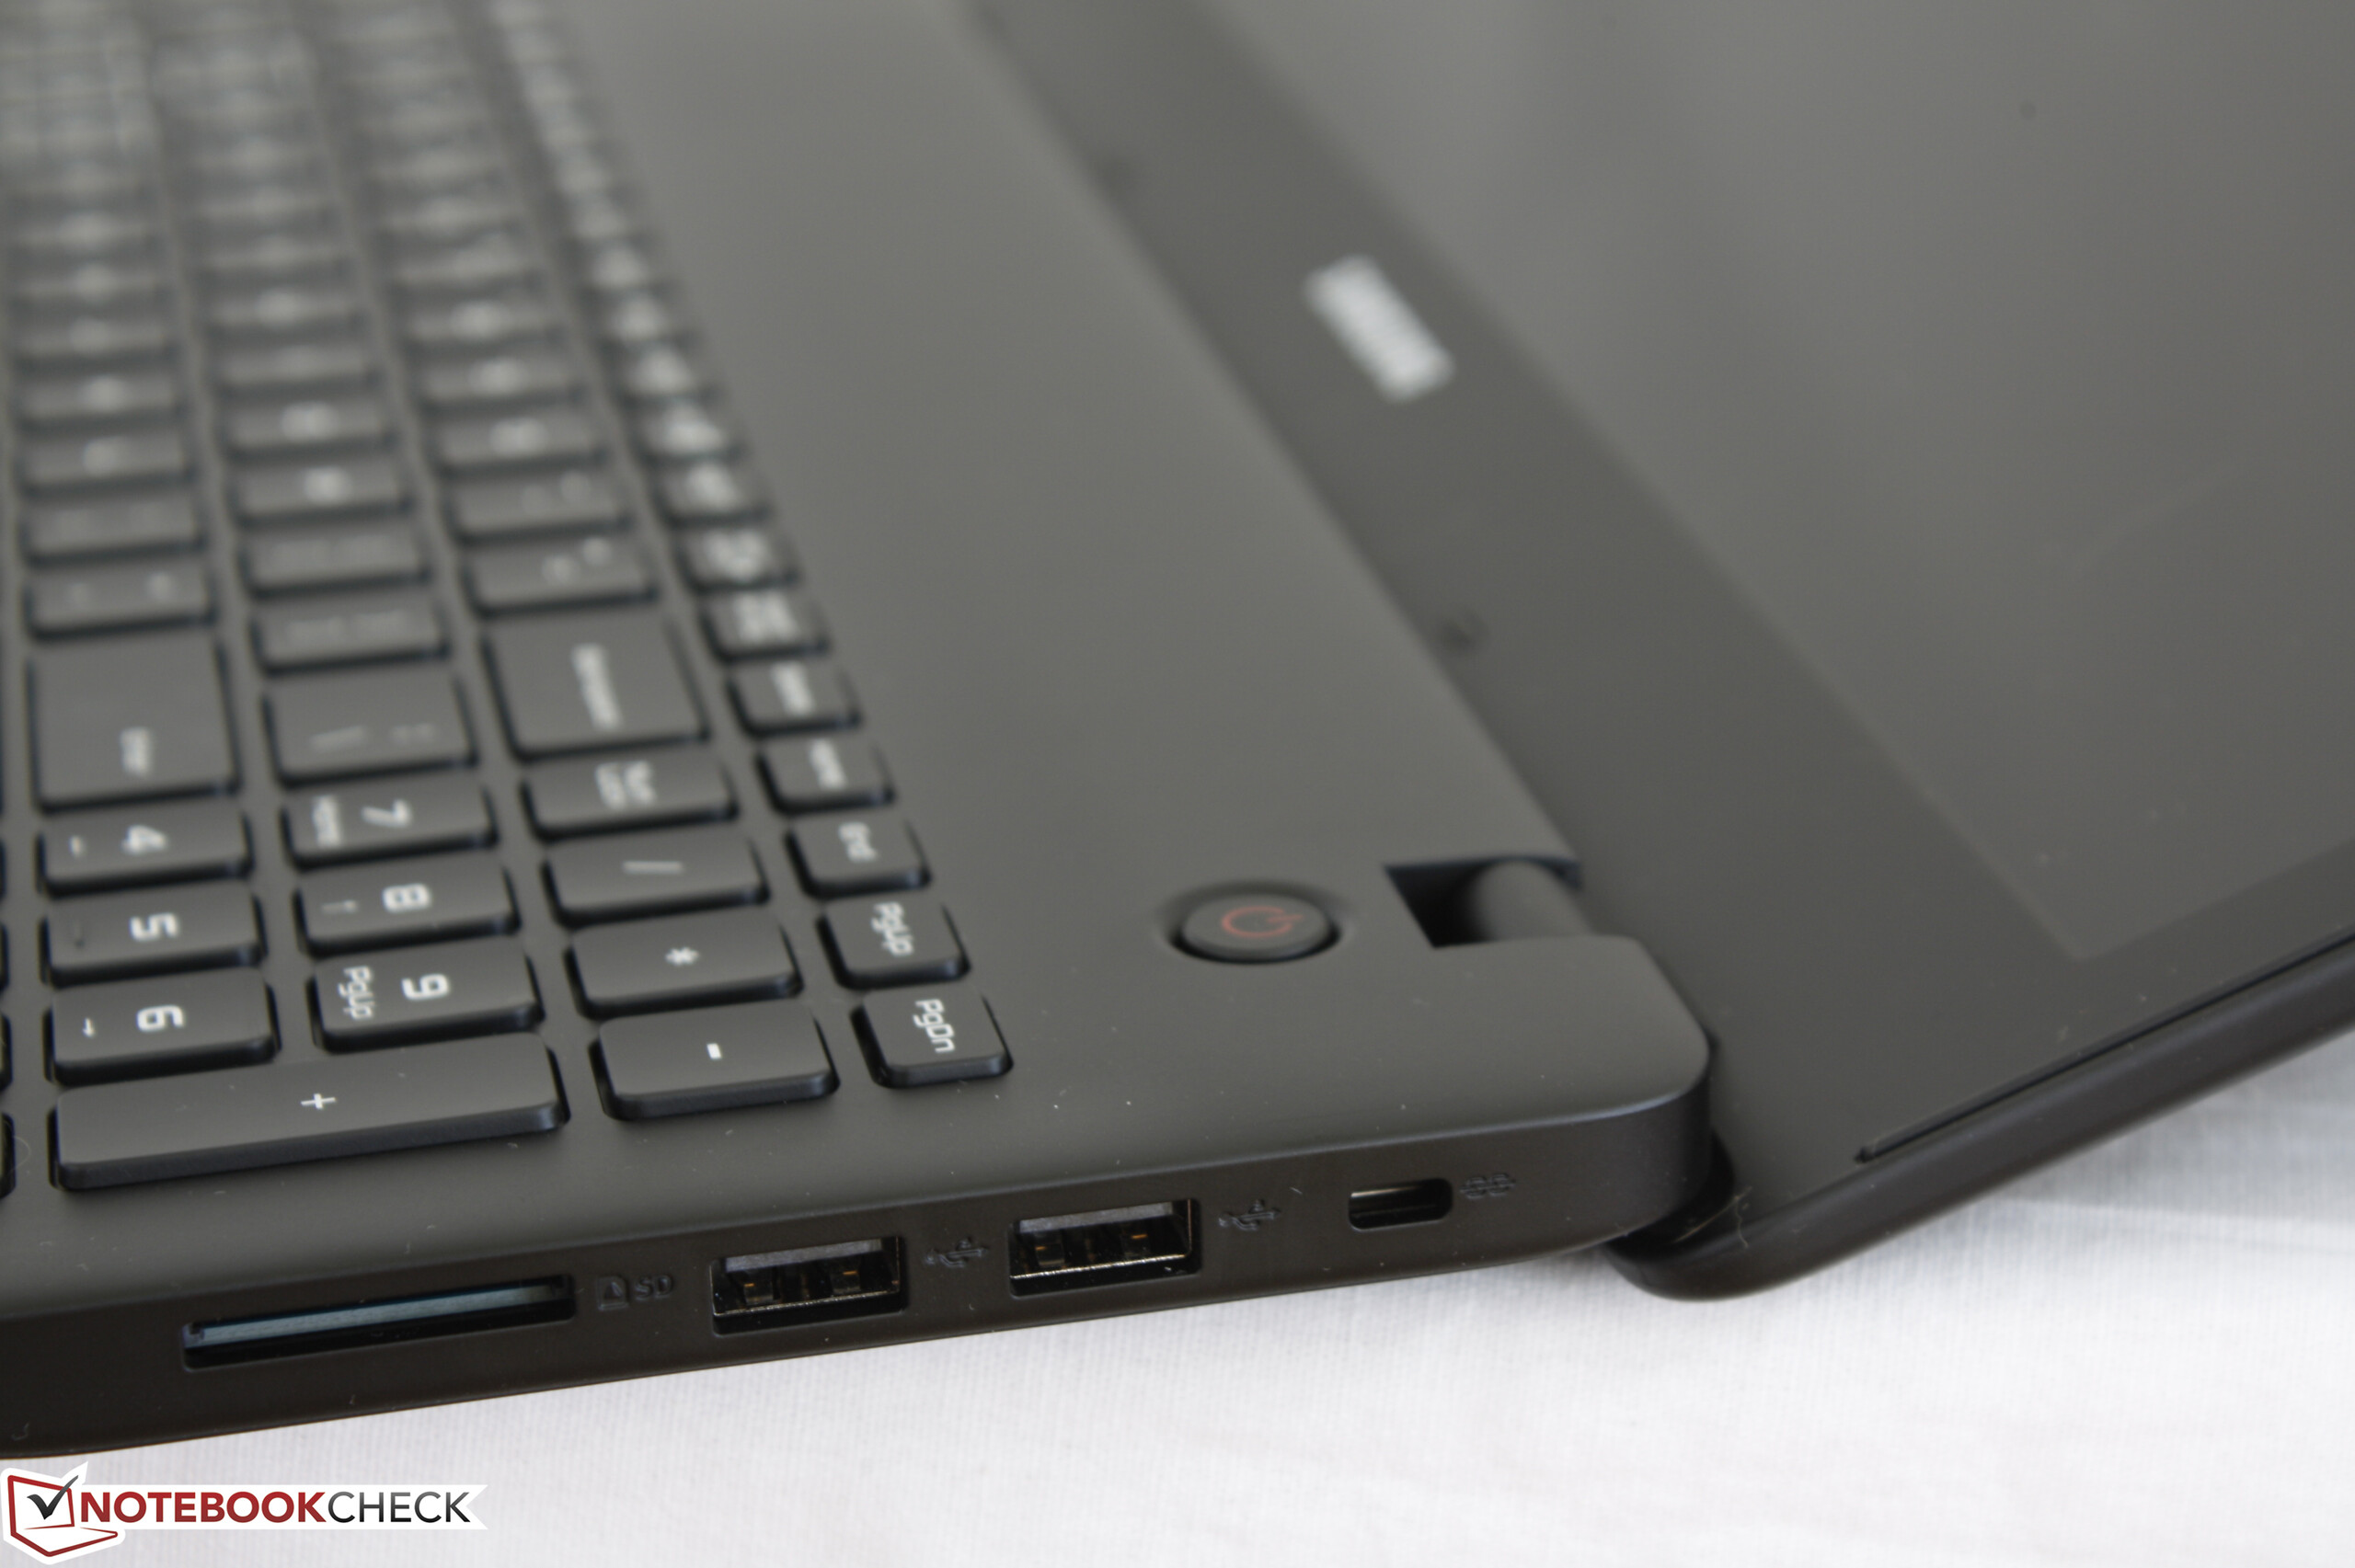

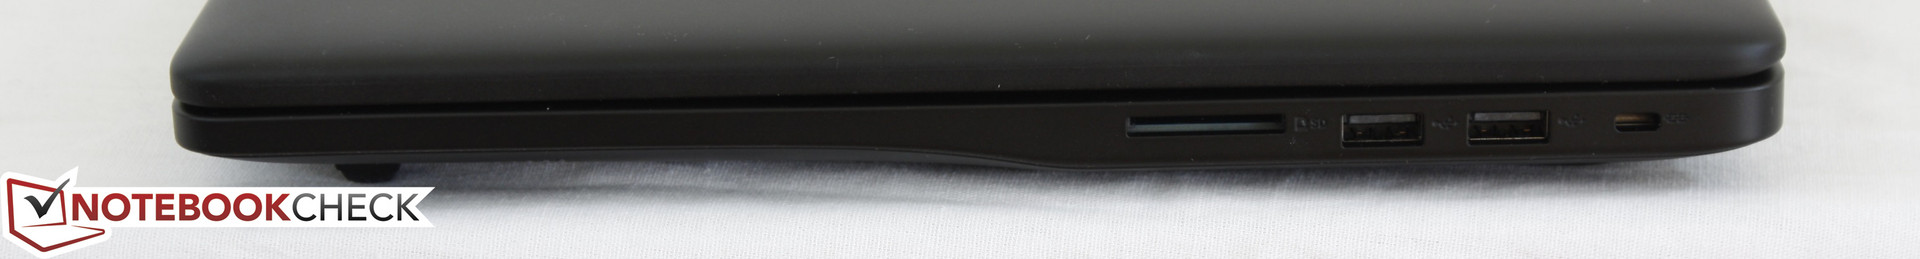


| SD Card Reader | |
| average JPG Copy Test (av. of 3 runs) | |
| Dell XPS 15 9560 (i7-7700HQ, UHD) | |
| Asus FX502VM-AS73 | |
| Samsung Odyssey NP800G5M-X01US | |
| maximum AS SSD Seq Read Test (1GB) | |
| Dell XPS 15 9560 (i7-7700HQ, UHD) | |
| Asus FX502VM-AS73 | |
| Samsung Odyssey NP800G5M-X01US | |
| Networking | |
| iperf3 transmit AX12 | |
| HP Pavilion 15t-bc200 X7P44AV | |
| Asus FX502VM-AS73 | |
| Samsung Odyssey NP800G5M-X01US | |
| iperf3 receive AX12 | |
| HP Pavilion 15t-bc200 X7P44AV | |
| Asus FX502VM-AS73 | |
| Samsung Odyssey NP800G5M-X01US | |
| |||||||||||||||||||||||||
Brightness Distribution: 90 %
Center on Battery: 255.9 cd/m²
Contrast: 533:1 (Black: 0.48 cd/m²)
ΔE ColorChecker Calman: 5.9 | ∀{0.5-29.43 Ø4.71}
ΔE Greyscale Calman: 5.6 | ∀{0.09-98 Ø4.96}
70.1% sRGB (Argyll 1.6.3 3D)
44.8% AdobeRGB 1998 (Argyll 1.6.3 3D)
48.71% AdobeRGB 1998 (Argyll 3D)
70.4% sRGB (Argyll 3D)
47.11% Display P3 (Argyll 3D)
Gamma: 2.21
CCT: 7250 K
| Samsung Odyssey NP800G5M-X01US IPS, 15.6", 1920x1080 | Asus FX502VM-AS73 TN LED, 15.6", 1920x1080 | HP Pavilion 15t-bc200 X7P44AV LGD04D4, , 15.6", 3840x2160 | Dell XPS 15 2017 9560 (7300HQ, Full-HD) Sharp SHP1453 LQ156M1, LED IGZO IPS InfinityEdge, 15.6", 1920x1080 | Gigabyte P55W v7 LG Philips LP156WF6 (LGD046F), IPS, 15.6", 1920x1080 | Apple MacBook Pro 15 2016 (2.9 GHz, 460) Apple APPA030, IPS, 15.4", 2880x1800 | |
|---|---|---|---|---|---|---|
| Display | -19% | 34% | 44% | 25% | 77% | |
| Display P3 Coverage (%) | 47.11 | 38.28 -19% | 63 34% | 68.9 46% | 63.5 35% | 99 110% |
| sRGB Coverage (%) | 70.4 | 56.9 -19% | 94.4 34% | 98.9 40% | 82 16% | 100 42% |
| AdobeRGB 1998 Coverage (%) | 48.71 | 39.47 -19% | 64.8 33% | 70.9 46% | 59.9 23% | 87.3 79% |
| Response Times | 30% | 24% | -48% | 16% | -43% | |
| Response Time Grey 50% / Grey 80% * (ms) | 38.8 ? | 28.4 ? 27% | 30.4 ? 22% | 54 ? -39% | 37 ? 5% | 46 ? -19% |
| Response Time Black / White * (ms) | 33.6 ? | 22.4 ? 33% | 24.8 ? 26% | 52.4 ? -56% | 25 ? 26% | 56 ? -67% |
| PWM Frequency (Hz) | 19230 ? | 119000 ? | ||||
| Screen | -8% | 15% | 46% | 28% | 61% | |
| Brightness middle (cd/m²) | 255.9 | 209.5 -18% | 259 1% | 400 56% | 287 12% | 420 64% |
| Brightness (cd/m²) | 249 | 205 -18% | 255 2% | 392 57% | 289 16% | 401 61% |
| Brightness Distribution (%) | 90 | 92 2% | 87 -3% | 89 -1% | 87 -3% | 90 0% |
| Black Level * (cd/m²) | 0.48 | 0.69 -44% | 0.51 -6% | 0.26 46% | 0.29 40% | 0.3 37% |
| Contrast (:1) | 533 | 304 -43% | 508 -5% | 1538 189% | 990 86% | 1400 163% |
| Colorchecker dE 2000 * | 5.9 | 4.7 20% | 3.9 34% | 4.9 17% | 4.92 17% | 3.33 44% |
| Colorchecker dE 2000 max. * | 18.9 | 19.7 -4% | 6.9 63% | 11 42% | 11 42% | 5.11 73% |
| Greyscale dE 2000 * | 5.6 | 1.8 68% | 4.5 20% | 7.2 -29% | 3.66 35% | 2.73 51% |
| Gamma | 2.21 100% | 2.23 99% | 2.43 91% | 2.11 104% | 2.32 95% | 2.48 89% |
| CCT | 7250 90% | 6975 93% | 7257 90% | 6911 94% | 6482 100% | 6457 101% |
| Color Space (Percent of AdobeRGB 1998) (%) | 44.8 | 36.2 -19% | 59.5 33% | 64.2 43% | 54 21% | 78.09 74% |
| Color Space (Percent of sRGB) (%) | 70.1 | 56.6 -19% | 98.9 41% | 82 17% | 99.97 43% | |
| Total Average (Program / Settings) | 1% /
-5% | 24% /
21% | 14% /
33% | 23% /
26% | 32% /
50% |
* ... smaller is better
Display Response Times
| ↔ Response Time Black to White | ||
|---|---|---|
| 33.6 ms ... rise ↗ and fall ↘ combined | ↗ 18.8 ms rise | 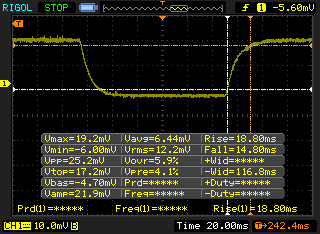 |
| ↘ 14.8 ms fall | ||
| The screen shows slow response rates in our tests and will be unsatisfactory for gamers. In comparison, all tested devices range from 0.1 (minimum) to 240 (maximum) ms. » 90 % of all devices are better. This means that the measured response time is worse than the average of all tested devices (19.8 ms). | ||
| ↔ Response Time 50% Grey to 80% Grey | ||
| 38.8 ms ... rise ↗ and fall ↘ combined | ↗ 20.8 ms rise | 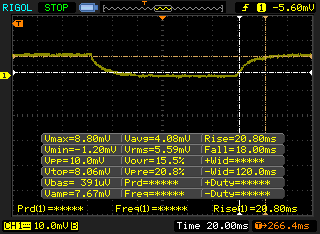 |
| ↘ 18 ms fall | ||
| The screen shows slow response rates in our tests and will be unsatisfactory for gamers. In comparison, all tested devices range from 0.165 (minimum) to 636 (maximum) ms. » 58 % of all devices are better. This means that the measured response time is worse than the average of all tested devices (31 ms). | ||
Screen Flickering / PWM (Pulse-Width Modulation)
| Screen flickering / PWM detected | 19230 Hz | ≤ 99 % brightness setting | 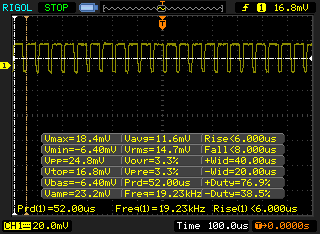 |
The display backlight flickers at 19230 Hz (worst case, e.g., utilizing PWM) Flickering detected at a brightness setting of 99 % and below. There should be no flickering or PWM above this brightness setting. The frequency of 19230 Hz is quite high, so most users sensitive to PWM should not notice any flickering. In comparison: 52 % of all tested devices do not use PWM to dim the display. If PWM was detected, an average of 7757 (minimum: 5 - maximum: 343500) Hz was measured. | |||
| Cinebench R10 | |
| Rendering Multiple CPUs 32Bit | |
| Eurocom Tornado F5 | |
| Samsung Odyssey NP800G5M-X01US | |
| MSI GS63VR 7RF-228US | |
| MSI GT80 Titan SLI | |
| Asus GL702VM-GC102D | |
| Rendering Single 32Bit | |
| Eurocom Tornado F5 | |
| Samsung Odyssey NP800G5M-X01US | |
| MSI GS63VR 7RF-228US | |
| MSI GT80 Titan SLI | |
| Asus GL702VM-GC102D | |
| wPrime 2.10 - 1024m | |
| MSI GS63VR 7RF-228US | |
| Samsung Odyssey NP800G5M-X01US | |
| Eurocom Tornado F5 | |
* ... smaller is better
| PCMark 8 | |
| Home Score Accelerated v2 | |
| Asus FX502VM-AS73 | |
| Gigabyte P55W v7 | |
| Samsung Odyssey NP800G5M-X01US | |
| Asus ROG Strix GL553VD-DS71 | |
| Dell XPS 15 2017 9560 (7300HQ, Full-HD) | |
| Work Score Accelerated v2 | |
| Gigabyte P55W v7 | |
| Samsung Odyssey NP800G5M-X01US | |
| Dell XPS 15 2017 9560 (7300HQ, Full-HD) | |
| Asus ROG Strix GL553VD-DS71 | |
| Asus FX502VM-AS73 | |
| Creative Score Accelerated v2 | |
| Asus FX502VM-AS73 | |
| Samsung Odyssey NP800G5M-X01US | |
| Asus ROG Strix GL553VD-DS71 | |
| PCMark 8 Home Score Accelerated v2 | 4001 points | |
| PCMark 8 Creative Score Accelerated v2 | 5362 points | |
| PCMark 8 Work Score Accelerated v2 | 5305 points | |
Help | ||
| Samsung Odyssey NP800G5M-X01US Samsung PM961 NVMe MZVLW128HEGR | Asus FX502VM-AS73 SK Hynix HFS256G39TND-N210A | HP Pavilion 15t-bc200 X7P44AV Intel SSD 600p SSDPEKKW256G7 | Asus ROG Strix GL553VD-DS71 HGST Travelstar 7K1000 HTS721010A9E630 | Dell XPS 15 9560 (i7-7700HQ, UHD) Lite-On CX2-8B512-Q11 | |
|---|---|---|---|---|---|
| CrystalDiskMark 3.0 | -46% | 19% | -93% | 94% | |
| Read Seq (MB/s) | 1518 | 503 -67% | 1115 -27% | 93.5 -94% | 1684 11% |
| Write Seq (MB/s) | 798 | 138.2 -83% | 311 -61% | 89.6 -89% | 1106 39% |
| Read 512 (MB/s) | 460.5 | 343.5 -25% | 706 53% | 39.06 -92% | 977 112% |
| Write 512 (MB/s) | 195.8 | 137.8 -30% | 472.3 141% | 51.1 -74% | 1119 472% |
| Read 4k (MB/s) | 47.16 | 29.36 -38% | 31.97 -32% | 0.57 -99% | 45.14 -4% |
| Write 4k (MB/s) | 143.1 | 70.9 -50% | 135.1 -6% | 1.05 -99% | 134.1 -6% |
| Read 4k QD32 (MB/s) | 521 | 369.9 -29% | 288.3 -45% | 1.06 -100% | 509 -2% |
| Write 4k QD32 (MB/s) | 176.4 | 99.7 -43% | 405.5 130% | 1.04 -99% | 398.1 126% |

| 3DMark | |
| 1920x1080 Fire Strike Graphics | |
| MSI GS63VR 7RF-228US | |
| Acer Aspire VX5-591G-75C4 VX15 | |
| Asus Strix GL502VT-DS74 | |
| Zotac GeForce GTX 1050 2GB | |
| Asus ROG Strix GL553VD-DS71 | |
| Samsung Odyssey NP800G5M-X01US | |
| Gigabyte P55K v5 | |
| Asus Zenbook UX510UW-CN044T | |
| MSI PX60 6QD | |
| Fire Strike Extreme Graphics | |
| MSI GS63VR 7RF-228US | |
| Asus Strix GL502VT-DS74 | |
| Zotac GeForce GTX 1050 2GB | |
| Asus ROG Strix GL553VD-DS71 | |
| Samsung Odyssey NP800G5M-X01US | |
| Gigabyte P55K v5 | |
| Asus Zenbook UX510UW-CN044T | |
| 1280x720 Cloud Gate Standard Graphics | |
| Asus Strix GL502VT-DS74 | |
| Acer Aspire VX5-591G-75C4 VX15 | |
| Zotac GeForce GTX 1050 2GB | |
| Samsung Odyssey NP800G5M-X01US | |
| Asus ROG Strix GL553VD-DS71 | |
| Gigabyte P55K v5 | |
| MSI GS63VR 7RF-228US | |
| Asus Zenbook UX510UW-CN044T | |
| MSI PX60 6QD | |
| 3DMark 11 Performance | 7872 points | |
| 3DMark Ice Storm Standard Score | 84774 points | |
| 3DMark Cloud Gate Standard Score | 20291 points | |
| 3DMark Fire Strike Score | 5455 points | |
| 3DMark Fire Strike Extreme Score | 2678 points | |
Help | ||
| low | med. | high | ultra | |
|---|---|---|---|---|
| BioShock Infinite (2013) | 63.6 | |||
| Metro: Last Light (2013) | 78 | 43.8 | ||
| Thief (2014) | 73 | 40.4 | ||
| The Witcher 3 (2015) | 43 | 20.8 | ||
| Batman: Arkham Knight (2015) | 91 | 79 | 47 | 25 |
| Dota 2 Reborn (2015) | 115 | |||
| Fallout 4 (2015) | 41.5 | 34.2 | ||
| Rise of the Tomb Raider (2016) | 70.1 | 38.7 | 33.4 | |
| Ashes of the Singularity (2016) | 54.7 | 34.1 | 29.6 | |
| Doom (2016) | 47.5 | 43.5 | ||
| Overwatch (2016) | 95.3 | 54.2 |
Noise level
| Idle |
| 28.1 / 29.1 / 29.1 dB(A) |
| HDD |
| 29.1 dB(A) |
| Load |
| 49.2 / 49.2 dB(A) |
 | ||
30 dB silent 40 dB(A) audible 50 dB(A) loud |
||
min: | ||
| Samsung Odyssey NP800G5M-X01US GeForce GTX 1050 Mobile, i7-7700HQ, Samsung PM961 NVMe MZVLW128HEGR | Asus FX502VM-AS73 GeForce GTX 1060 Mobile, i7-7700HQ, SK Hynix HFS256G39TND-N210A | HP Pavilion 15t-bc200 X7P44AV GeForce GTX 1050 Mobile, i7-7700HQ, Intel SSD 600p SSDPEKKW256G7 | Dell XPS 15 9560 (i7-7700HQ, UHD) GeForce GTX 1050 Mobile, i7-7700HQ, Lite-On CX2-8B512-Q11 | Gigabyte P55W v7 GeForce GTX 1060 Mobile, i7-7700HQ, Liteonit CV3-8D256 | Apple MacBook Pro 15 2016 (2.9 GHz, 460) Radeon Pro 460, 6920HQ, Apple SSD SM1024L | |
|---|---|---|---|---|---|---|
| Noise | -4% | -3% | -1% | -7% | 3% | |
| off / environment * (dB) | 28.1 | 28.7 -2% | 28.9 -3% | 28.4 -1% | 30 -7% | 29 -3% |
| Idle Minimum * (dB) | 28.1 | 30.6 -9% | 32.3 -15% | 29 -3% | 33 -17% | 30.3 -8% |
| Idle Average * (dB) | 29.1 | 30.6 -5% | 32.3 -11% | 29 -0% | 34 -17% | 30.3 -4% |
| Idle Maximum * (dB) | 29.1 | 31 -7% | 32.3 -11% | 32.2 -11% | 35 -20% | 30.3 -4% |
| Load Average * (dB) | 49.2 | 46.2 6% | 43.2 12% | 47.1 4% | 39 21% | 35.1 29% |
| Load Maximum * (dB) | 49.2 | 52.3 -6% | 45.2 8% | 47.1 4% | 50 -2% | 46 7% |
| Witcher 3 ultra * (dB) | 52 |
* ... smaller is better
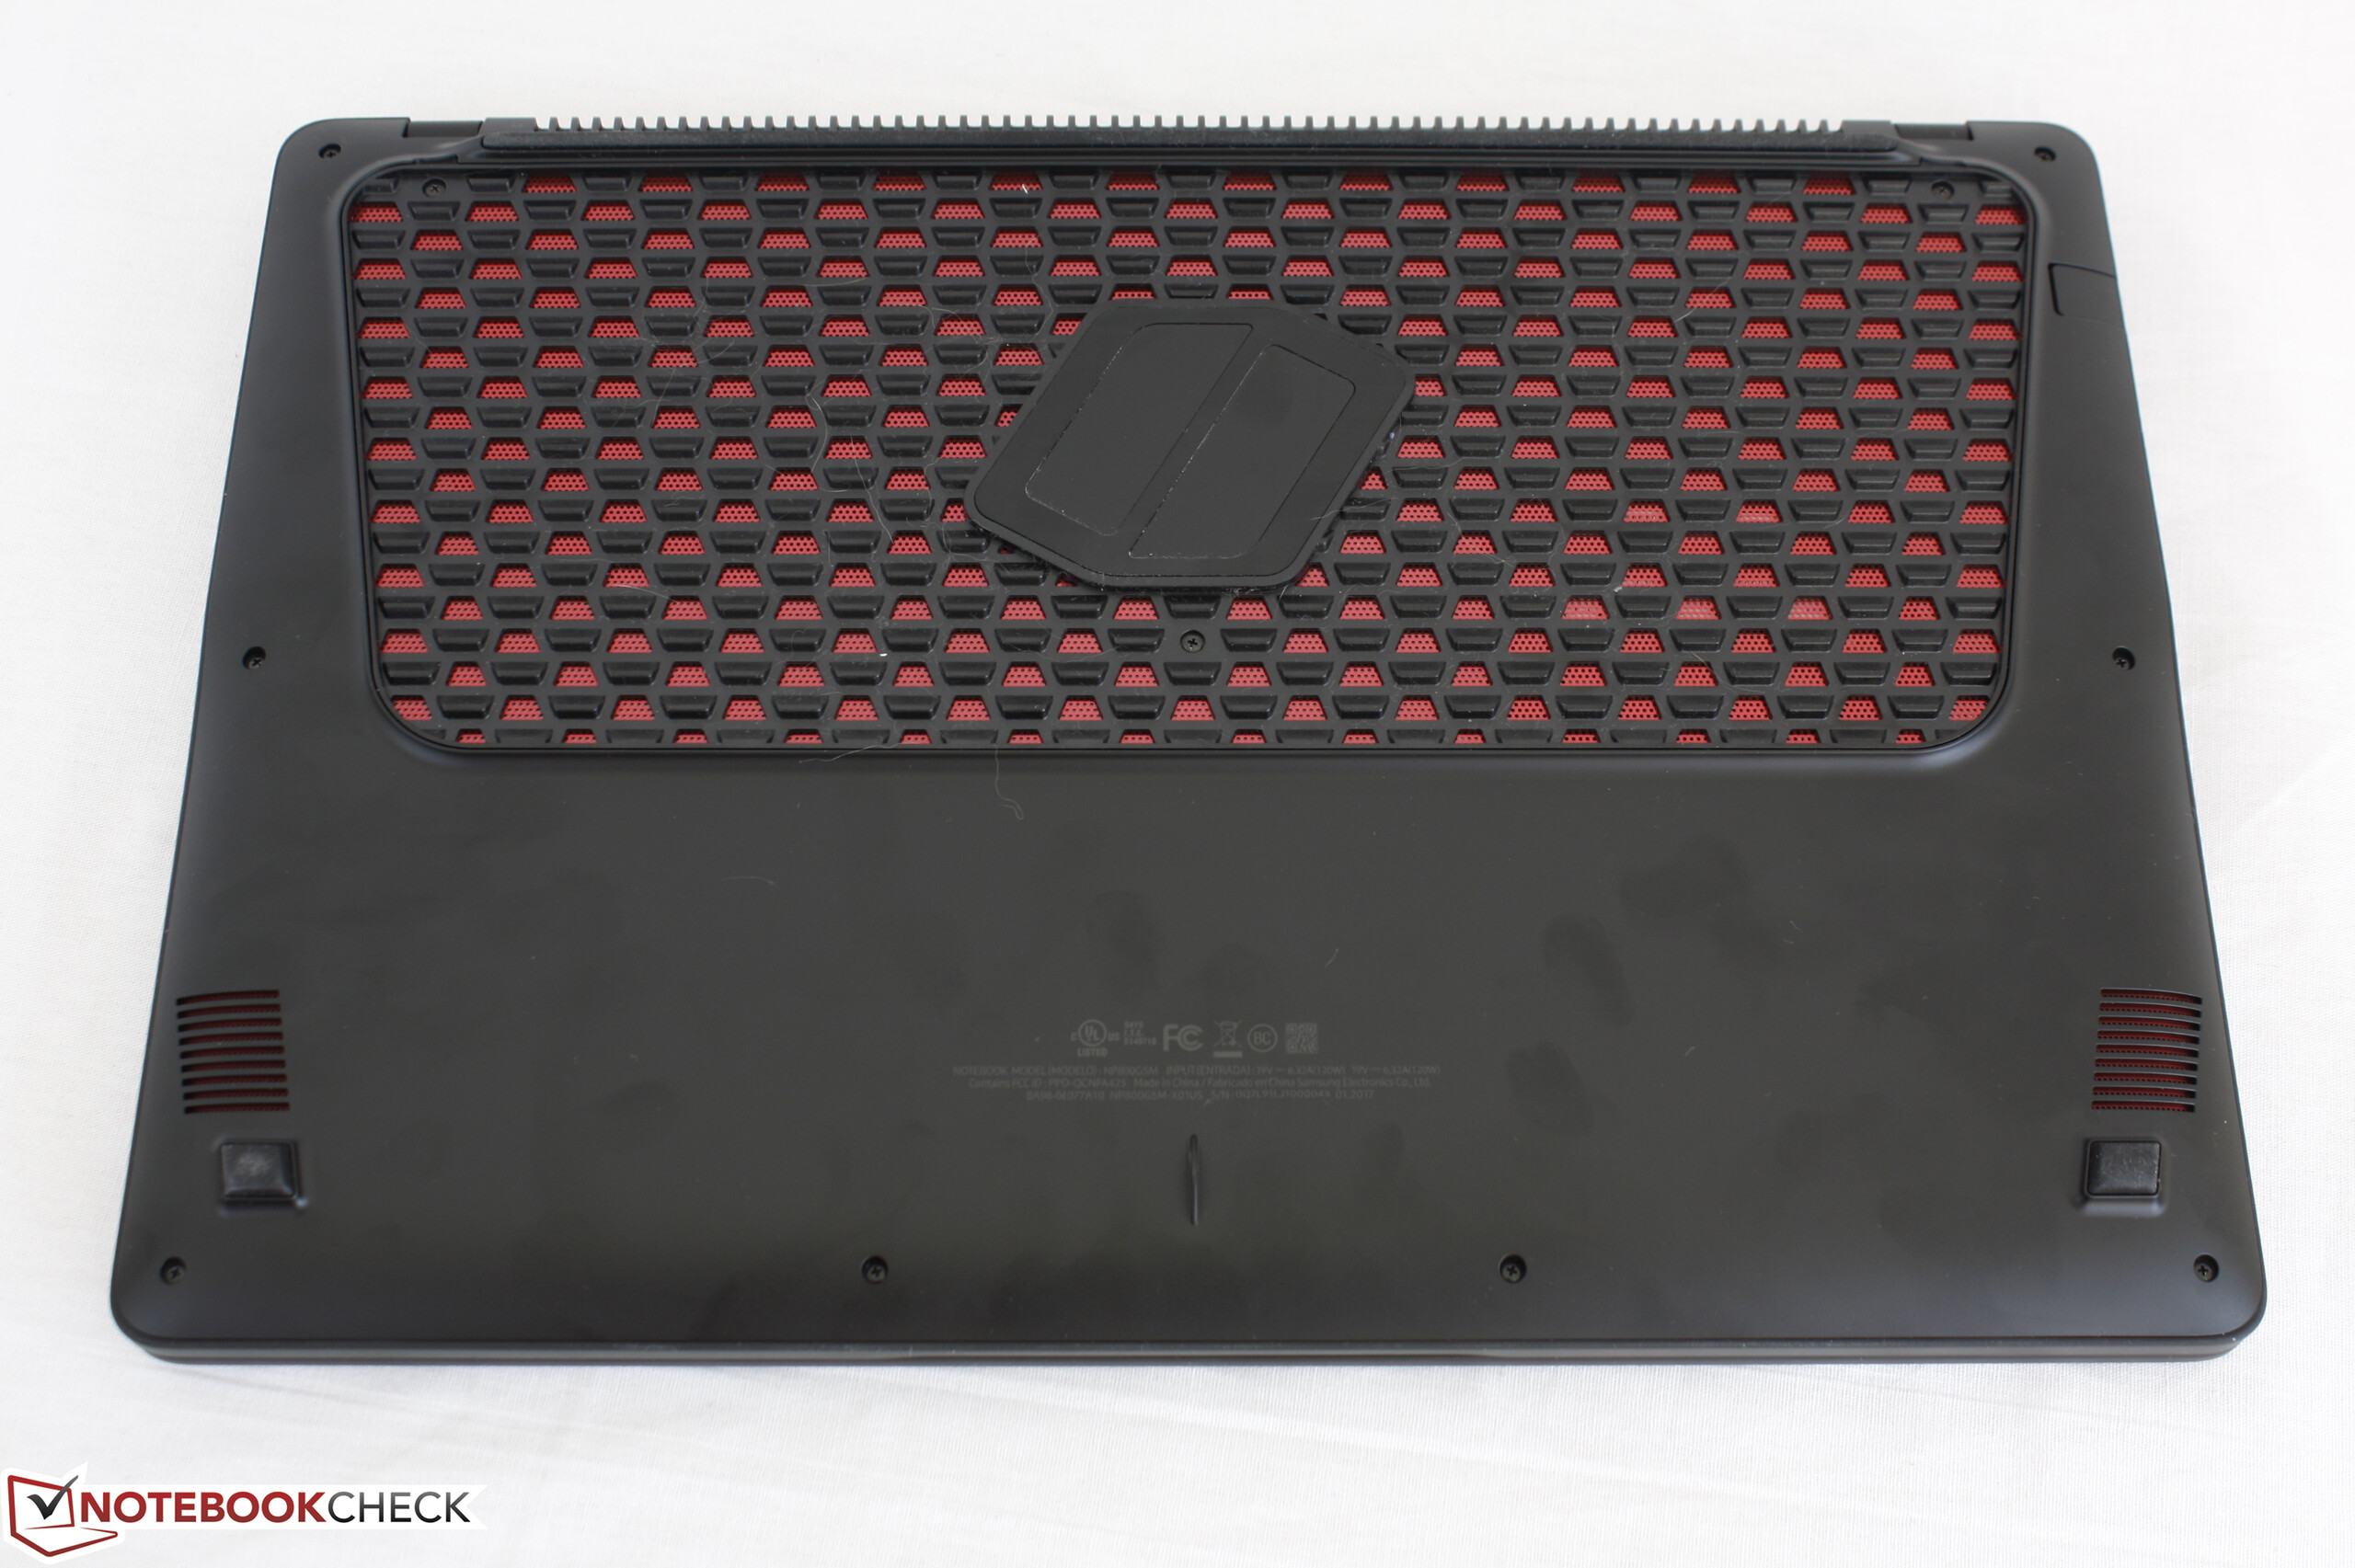
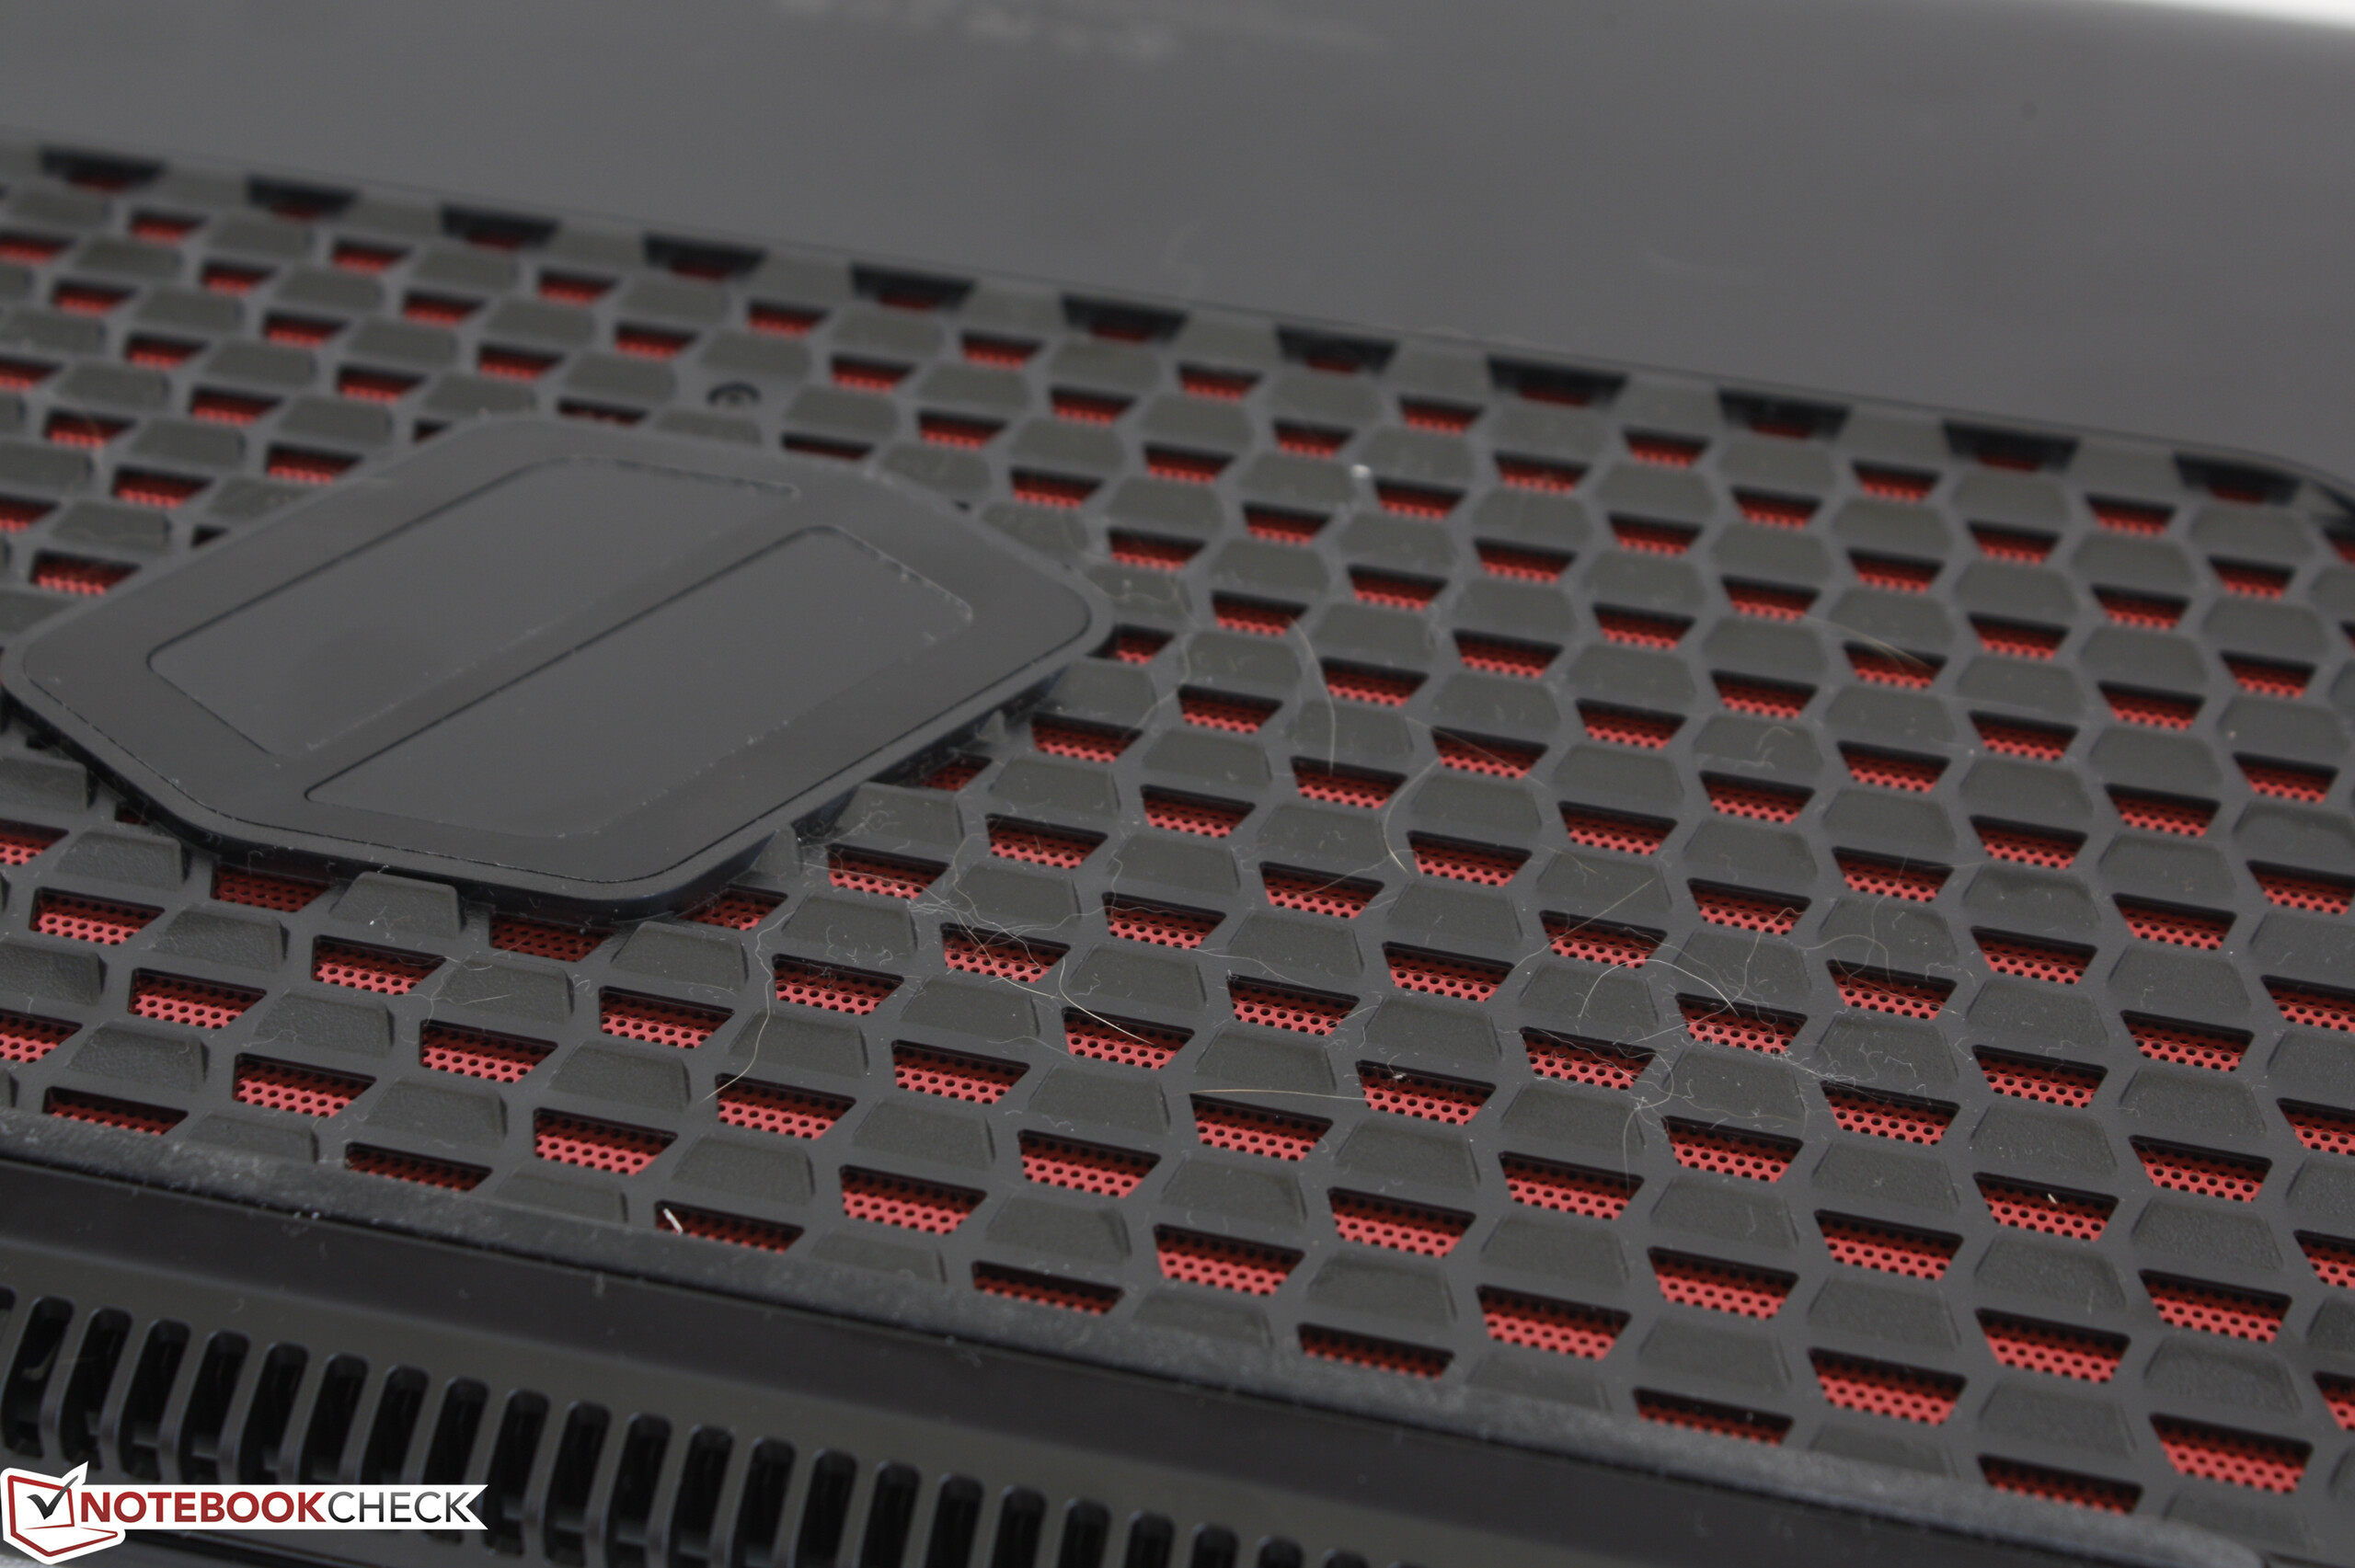
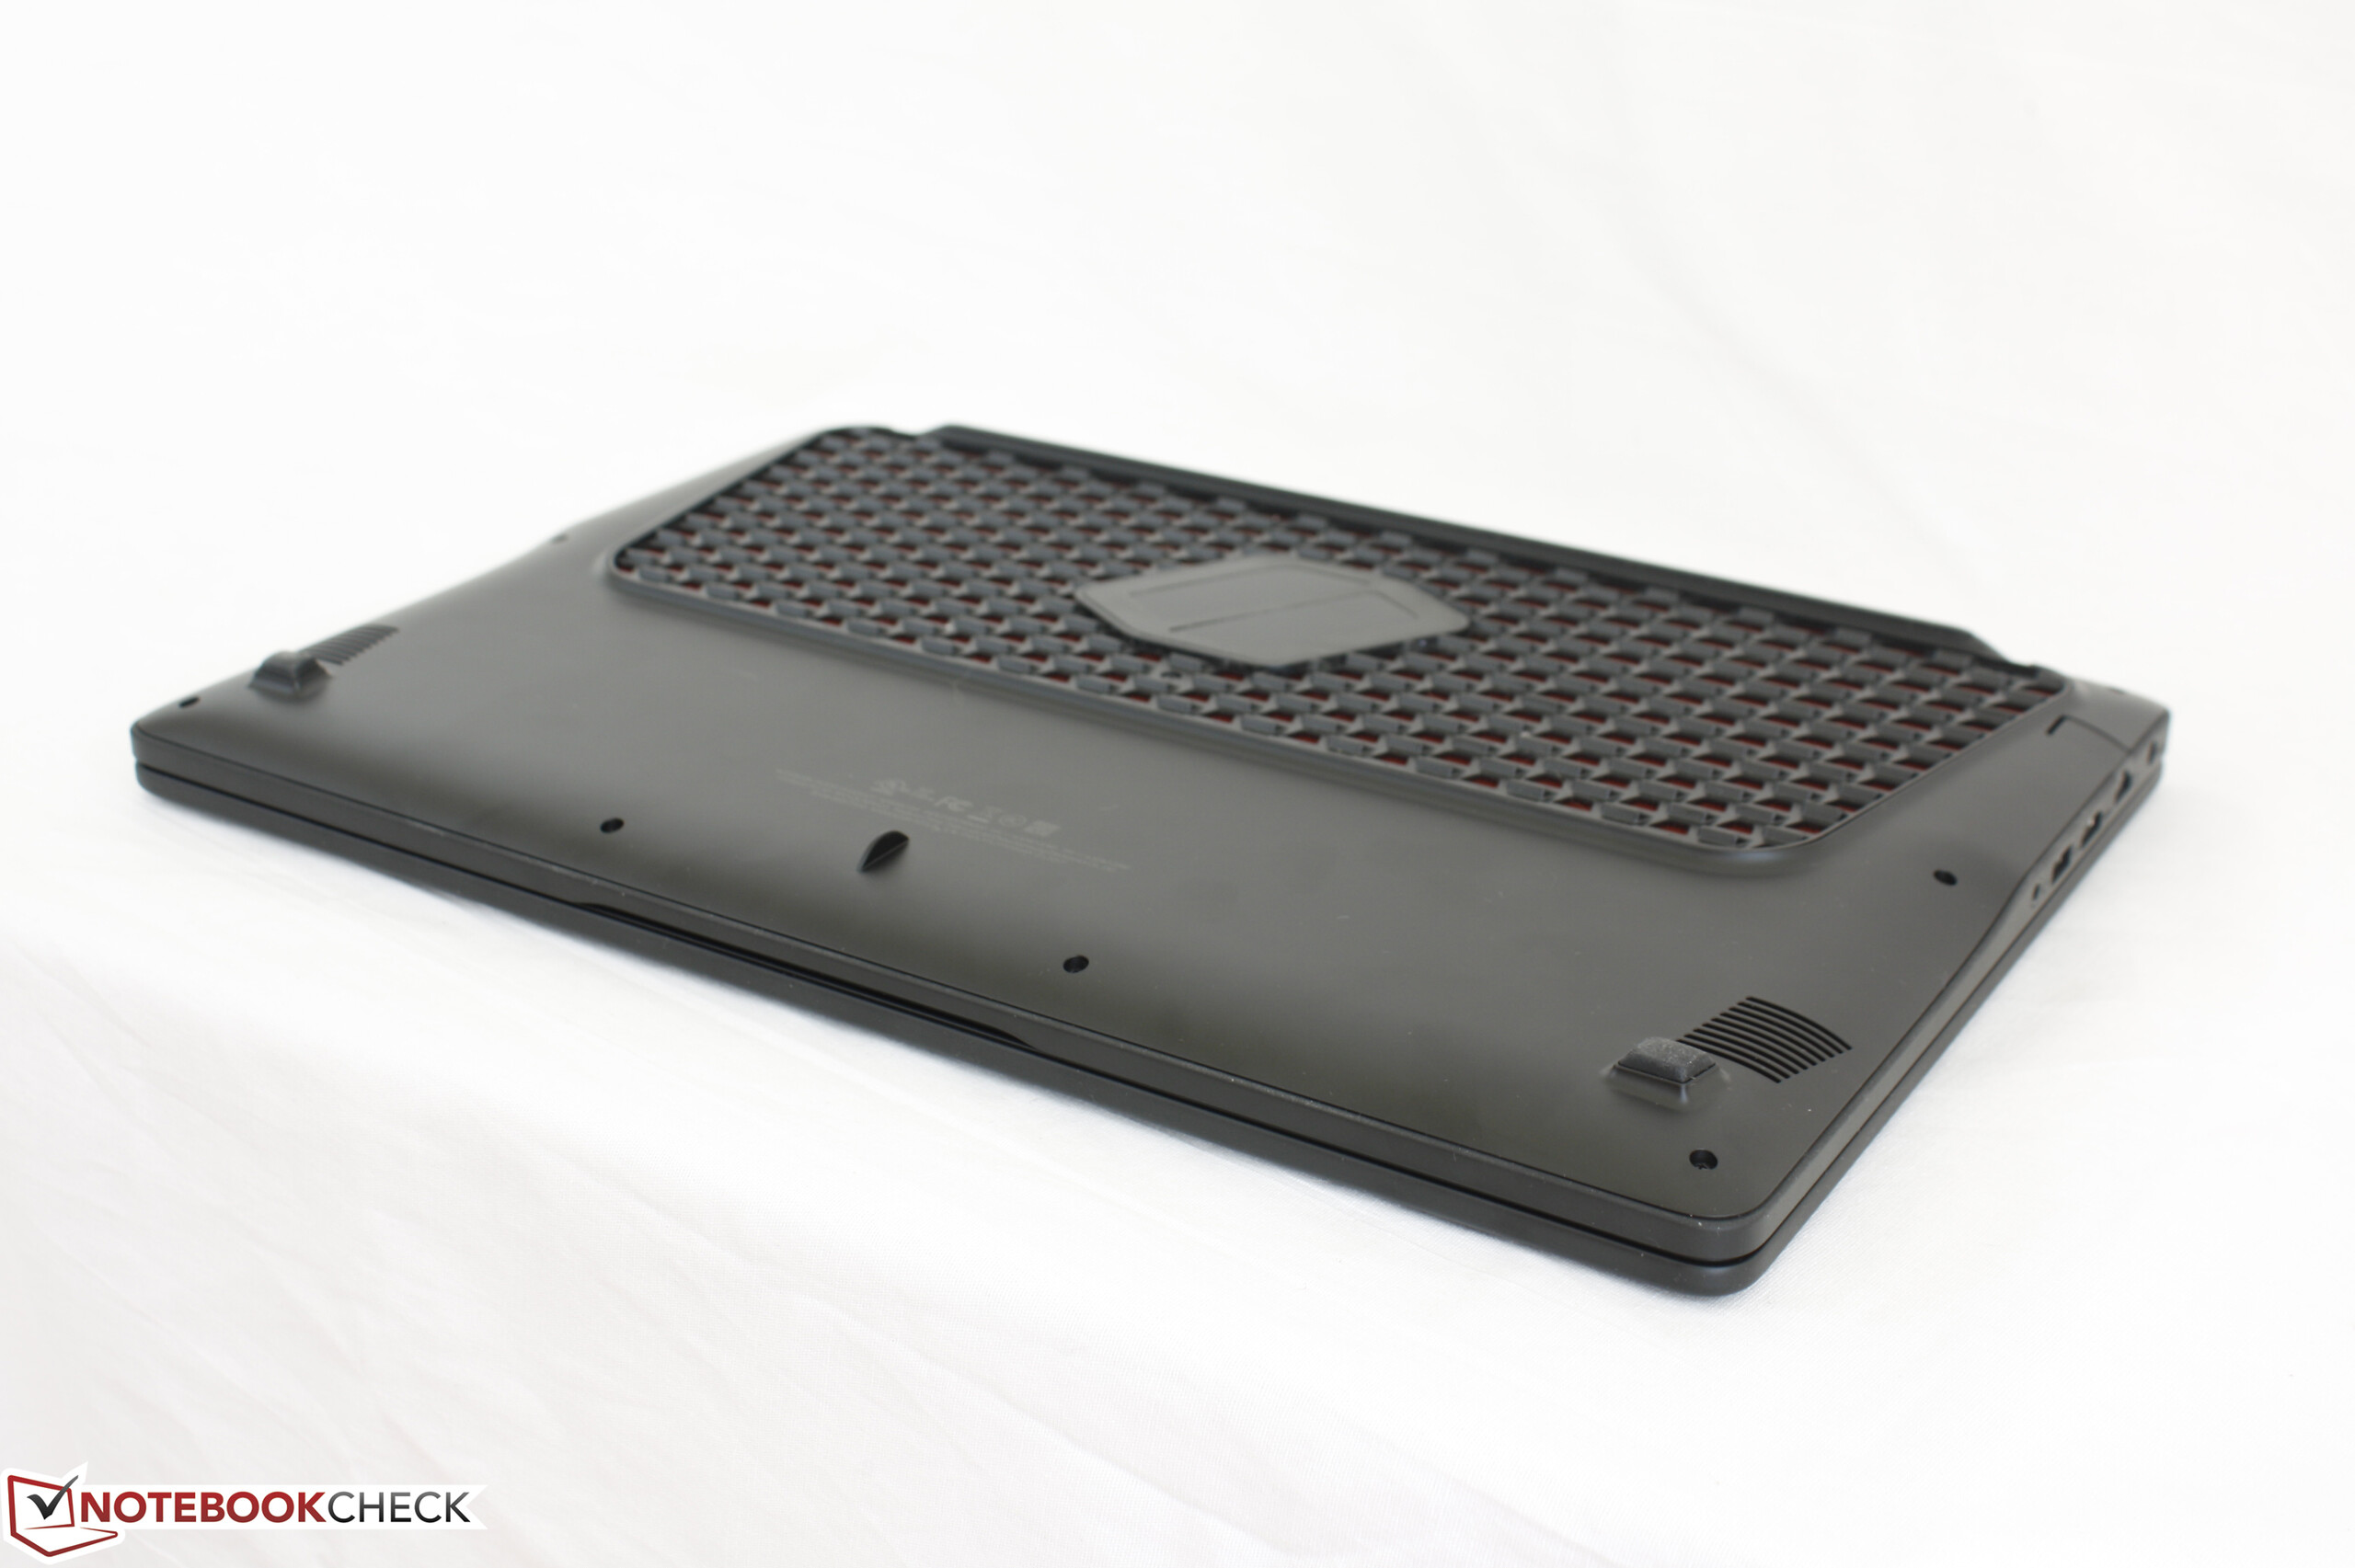
(-) The maximum temperature on the upper side is 58.4 °C / 137 F, compared to the average of 40.4 °C / 105 F, ranging from 21.2 to 68.8 °C for the class Gaming.
(-) The bottom heats up to a maximum of 54.2 °C / 130 F, compared to the average of 43.2 °C / 110 F
(+) In idle usage, the average temperature for the upper side is 25.4 °C / 78 F, compared to the device average of 33.9 °C / 93 F.
(±) Playing The Witcher 3, the average temperature for the upper side is 33.8 °C / 93 F, compared to the device average of 33.9 °C / 93 F.
(+) The palmrests and touchpad are cooler than skin temperature with a maximum of 27 °C / 80.6 F and are therefore cool to the touch.
(±) The average temperature of the palmrest area of similar devices was 28.8 °C / 83.8 F (+1.8 °C / 3.2 F).
Samsung Odyssey NP800G5M-X01US audio analysis
(-) | not very loud speakers (63.1 dB)
Bass 100 - 315 Hz
(-) | nearly no bass - on average 15.2% lower than median
(±) | linearity of bass is average (13.7% delta to prev. frequency)
Mids 400 - 2000 Hz
(+) | balanced mids - only 2% away from median
(±) | linearity of mids is average (10.1% delta to prev. frequency)
Highs 2 - 16 kHz
(±) | higher highs - on average 8.4% higher than median
(±) | linearity of highs is average (11.5% delta to prev. frequency)
Overall 100 - 16.000 Hz
(-) | overall sound is not linear (37.2% difference to median)
Compared to same class
» 99% of all tested devices in this class were better, 0% similar, 1% worse
» The best had a delta of 6%, average was 18%, worst was 132%
Compared to all devices tested
» 94% of all tested devices were better, 1% similar, 5% worse
» The best had a delta of 4%, average was 23%, worst was 134%
Apple MacBook 12 (Early 2016) 1.1 GHz audio analysis
(+) | speakers can play relatively loud (83.6 dB)
Bass 100 - 315 Hz
(±) | reduced bass - on average 11.3% lower than median
(±) | linearity of bass is average (14.2% delta to prev. frequency)
Mids 400 - 2000 Hz
(+) | balanced mids - only 2.4% away from median
(+) | mids are linear (5.5% delta to prev. frequency)
Highs 2 - 16 kHz
(+) | balanced highs - only 2% away from median
(+) | highs are linear (4.5% delta to prev. frequency)
Overall 100 - 16.000 Hz
(+) | overall sound is linear (10.2% difference to median)
Compared to same class
» 7% of all tested devices in this class were better, 2% similar, 90% worse
» The best had a delta of 5%, average was 18%, worst was 53%
Compared to all devices tested
» 5% of all tested devices were better, 1% similar, 94% worse
» The best had a delta of 4%, average was 23%, worst was 134%
| Off / Standby | |
| Idle | |
| Load |
|
Key:
min: | |
| Samsung Odyssey NP800G5M-X01US | Asus FX502VM-AS73 | Dell XPS 15 2017 9560 (7300HQ, Full-HD) | Asus ROG Strix GL553VD-DS71 | Gigabyte P55W v7 | Apple MacBook Pro 15 2016 (2.9 GHz, 460) | |
|---|---|---|---|---|---|---|
| Power Consumption | -57% | 0% | -12% | -28% | 14% | |
| Idle Minimum * (Watt) | 6.7 | 14.9 -122% | 6.6 1% | 7.7 -15% | 8 -19% | 3 55% |
| Idle Average * (Watt) | 8.9 | 15.1 -70% | 9 -1% | 11.7 -31% | 13 -46% | 9.9 -11% |
| Idle Maximum * (Watt) | 10.8 | 15.2 -41% | 10.7 1% | 12 -11% | 18 -67% | 12.5 -16% |
| Load Average * (Watt) | 81.8 | 105.8 -29% | 77.5 5% | 80.5 2% | 76 7% | 70.6 14% |
| Witcher 3 ultra * (Watt) | 92.2 | |||||
| Load Maximum * (Watt) | 122.7 | 148.8 -21% | 130 -6% | 128.4 -5% | 143 -17% | 90.8 26% |
* ... smaller is better
| Samsung Odyssey NP800G5M-X01US i7-7700HQ, GeForce GTX 1050 Mobile, 43 Wh | Asus FX502VM-AS73 i7-7700HQ, GeForce GTX 1060 Mobile, 64 Wh | Dell XPS 15 2017 9560 (7300HQ, Full-HD) i5-7300HQ, GeForce GTX 1050 Mobile, 56 Wh | Asus ROG Strix GL553VD-DS71 i7-7700HQ, GeForce GTX 1050 Mobile, 48 Wh | Gigabyte P55W v7 i7-7700HQ, GeForce GTX 1060 Mobile, 63 Wh | Apple MacBook Pro 15 2016 (2.9 GHz, 460) 6920HQ, Radeon Pro 460, 76 Wh | |
|---|---|---|---|---|---|---|
| Battery runtime | -17% | 9% | -20% | 28% | 52% | |
| Reader / Idle (h) | 10.2 | 6.1 -40% | 9.4 -8% | 7.3 -28% | 13.2 29% | |
| WiFi v1.3 (h) | 4.4 | 4.6 5% | 5.6 27% | 4.6 5% | 5.8 32% | 10.3 134% |
| Load (h) | 1.3 | 1.1 -15% | 1.4 8% | 0.8 -38% | 1.6 23% | 0.9 -31% |
Pros
Cons
Verdict
我们队Odyssey这台笔记本电脑的第一印象是,它是一个混合体。一方面,该机作为一款游戏本:可以在处理器和显卡没有节流的情况下,可以保持可接受的温度运行游戏。另一方面,它所维持高涡轮加速时钟频率,是轻薄笔记本的弱项。所以,该机的表现还算不错。
在其可靠的表现之外,Odyssey也有特的问题。最值得注意的一点是,即便是作为游戏笔记本,它游戏时的风扇噪音也太大。 对于近50分贝噪声,与之匹配应该是更强大的显卡才对,如GTX 1070或GTX 1080,而不是GTX 1050。为了让用户平衡噪音和核心温度,从而获得更愉快游戏体验,手动控制风扇还有很长的路要走。
对该笔记本电脑打量的时间越长,就会发越多偷工减料的地方。SD读卡器缓慢,能力只达到基础水平,显存减半,电池容量小,对比度和颜色都不如更贵的替代品。过热的WASD键也是一个奇怪的设计:就像汽车制造商将永远不会设计出不舒服的发热方向盘,游戏笔记本不应该有让人不舒服的发烫WASD按键。
具有相同处理器和显卡的惠普Pavilion 15t零售价在1100美元至1200美元之间,与我们配置的Odyssey一样。虽然三星在核心功能方面表现优异,但在其他方面,它只是平庸水准,并不足以超越其他GTX 1050笔记本电脑。
三星的第一台游戏本Odyssey终于带来了......然而它平庸缺少亮点。处理器和显卡性能都非常好,不节流,但风扇噪音很大。
Samsung Odyssey NP800G5M-X01US
- 04/24/2017 v6 (old)
Allen Ngo
Price comparison
