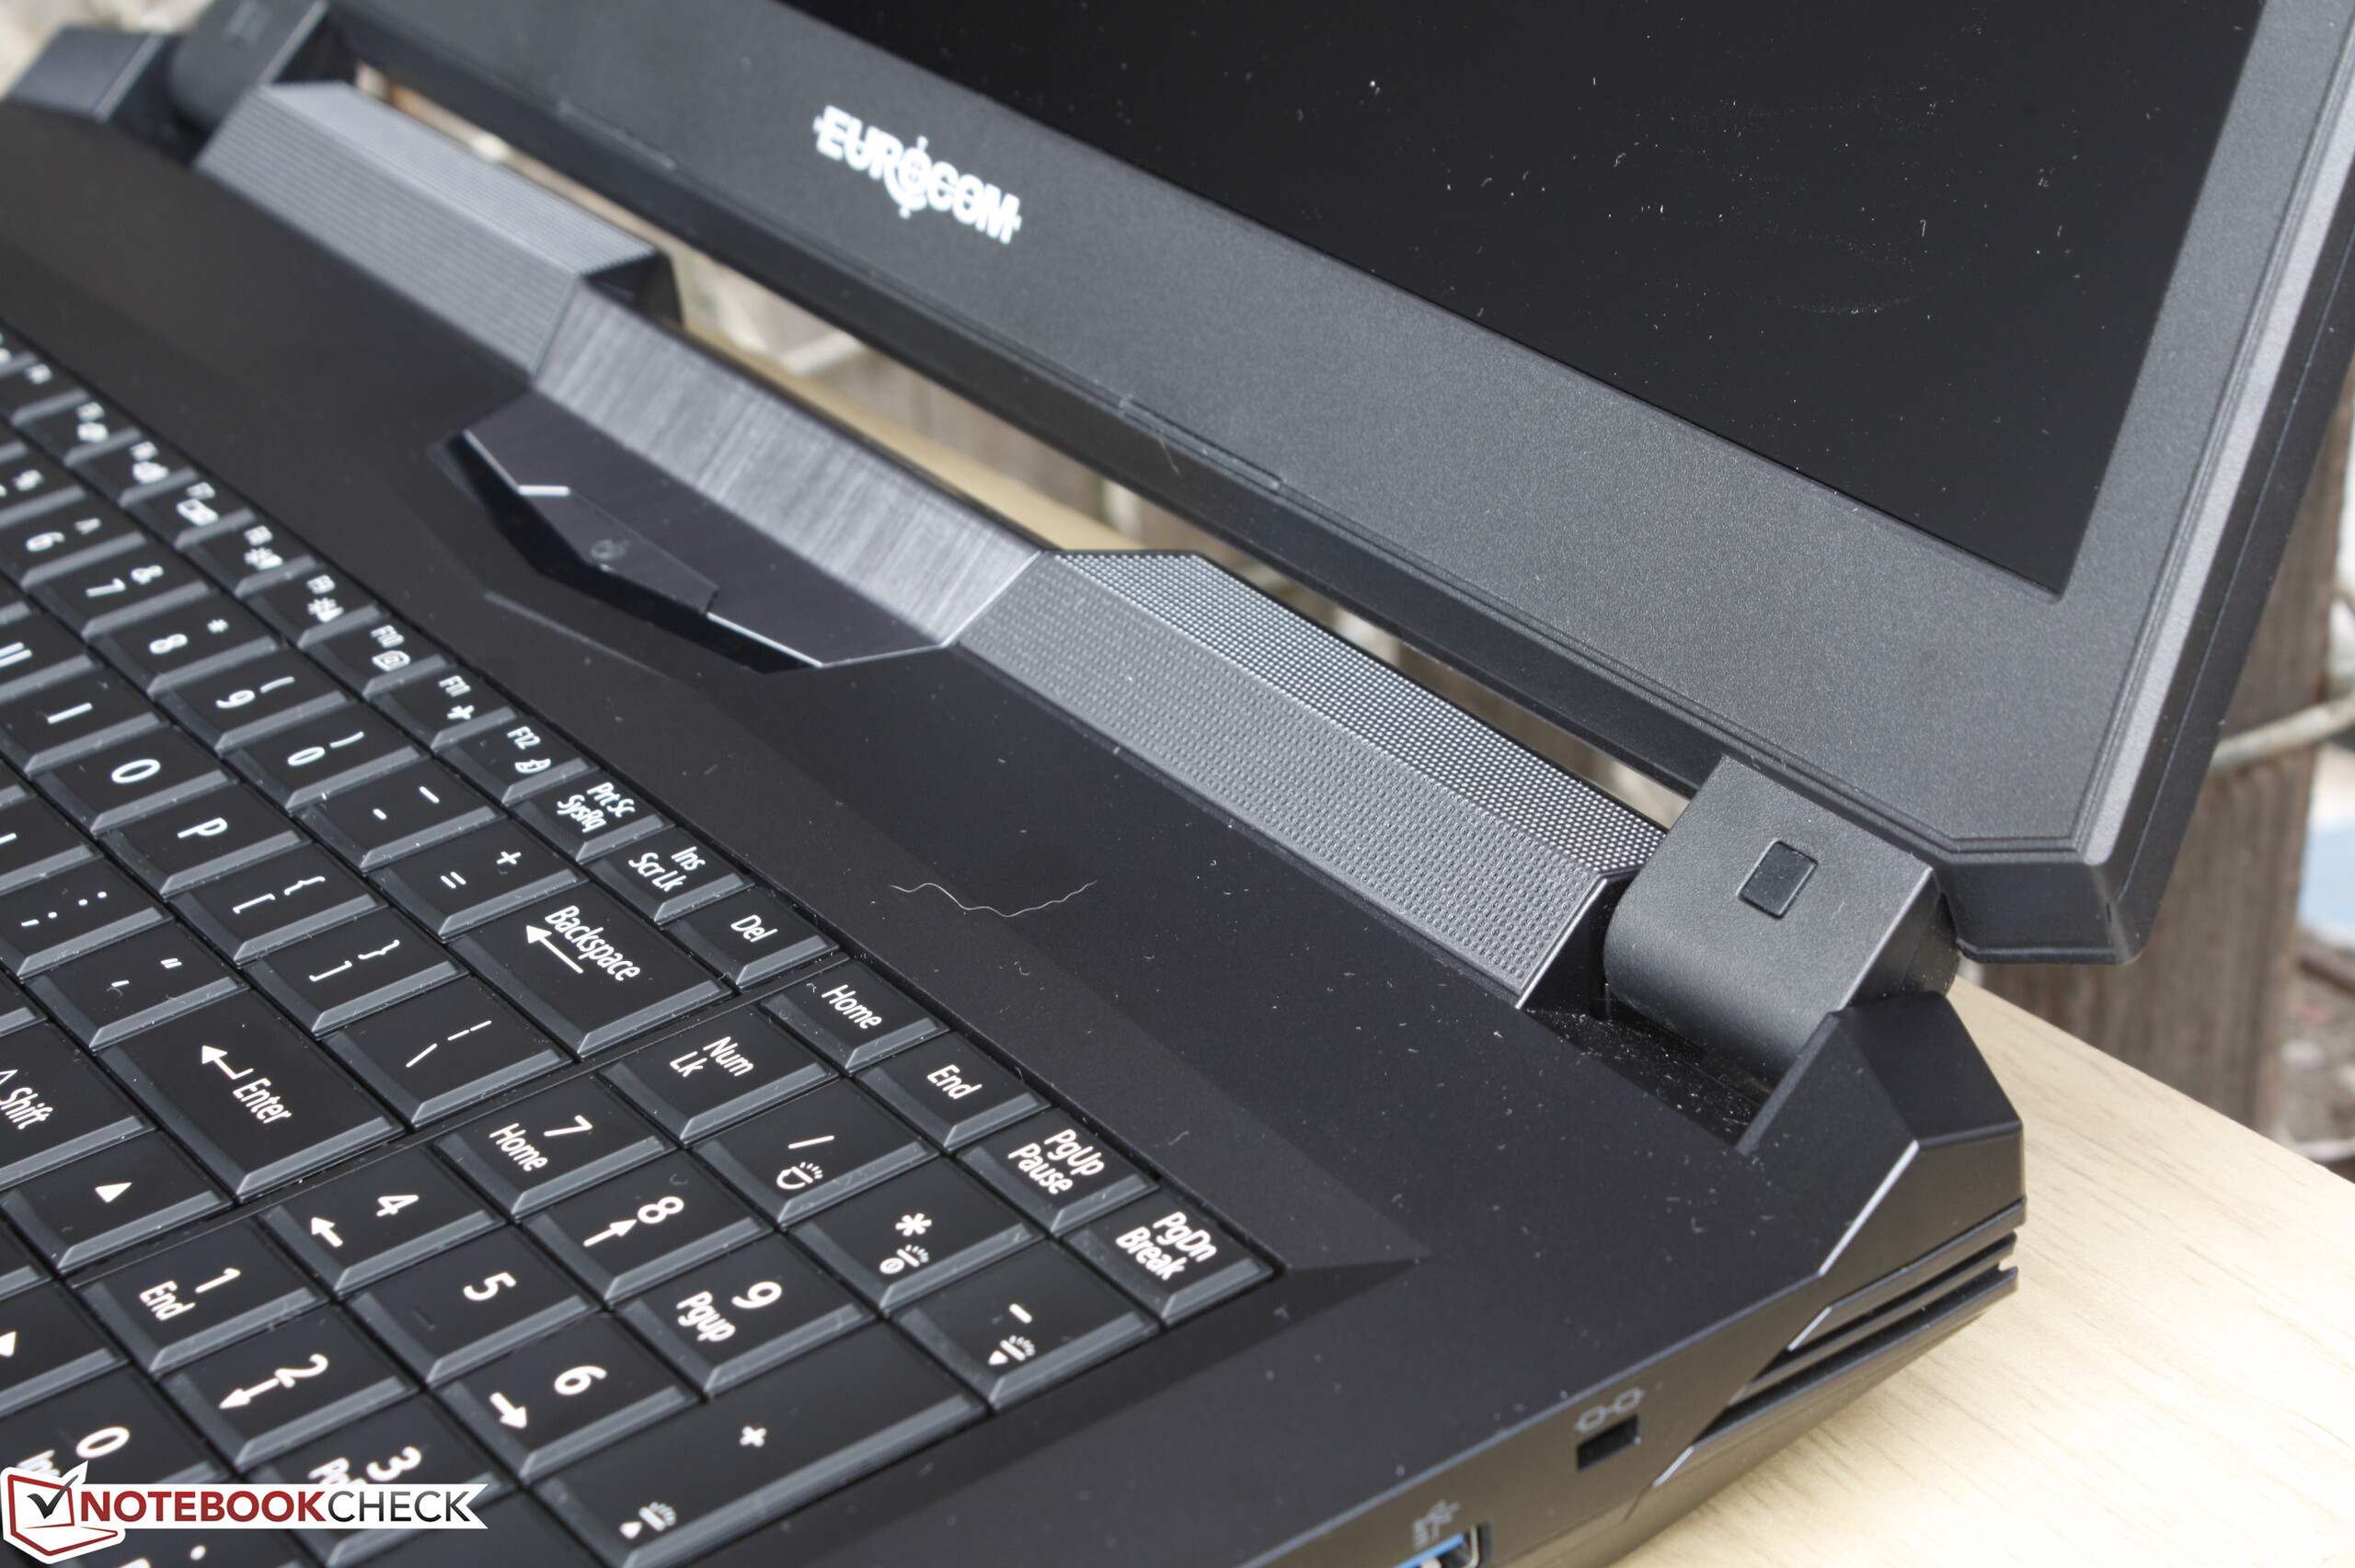
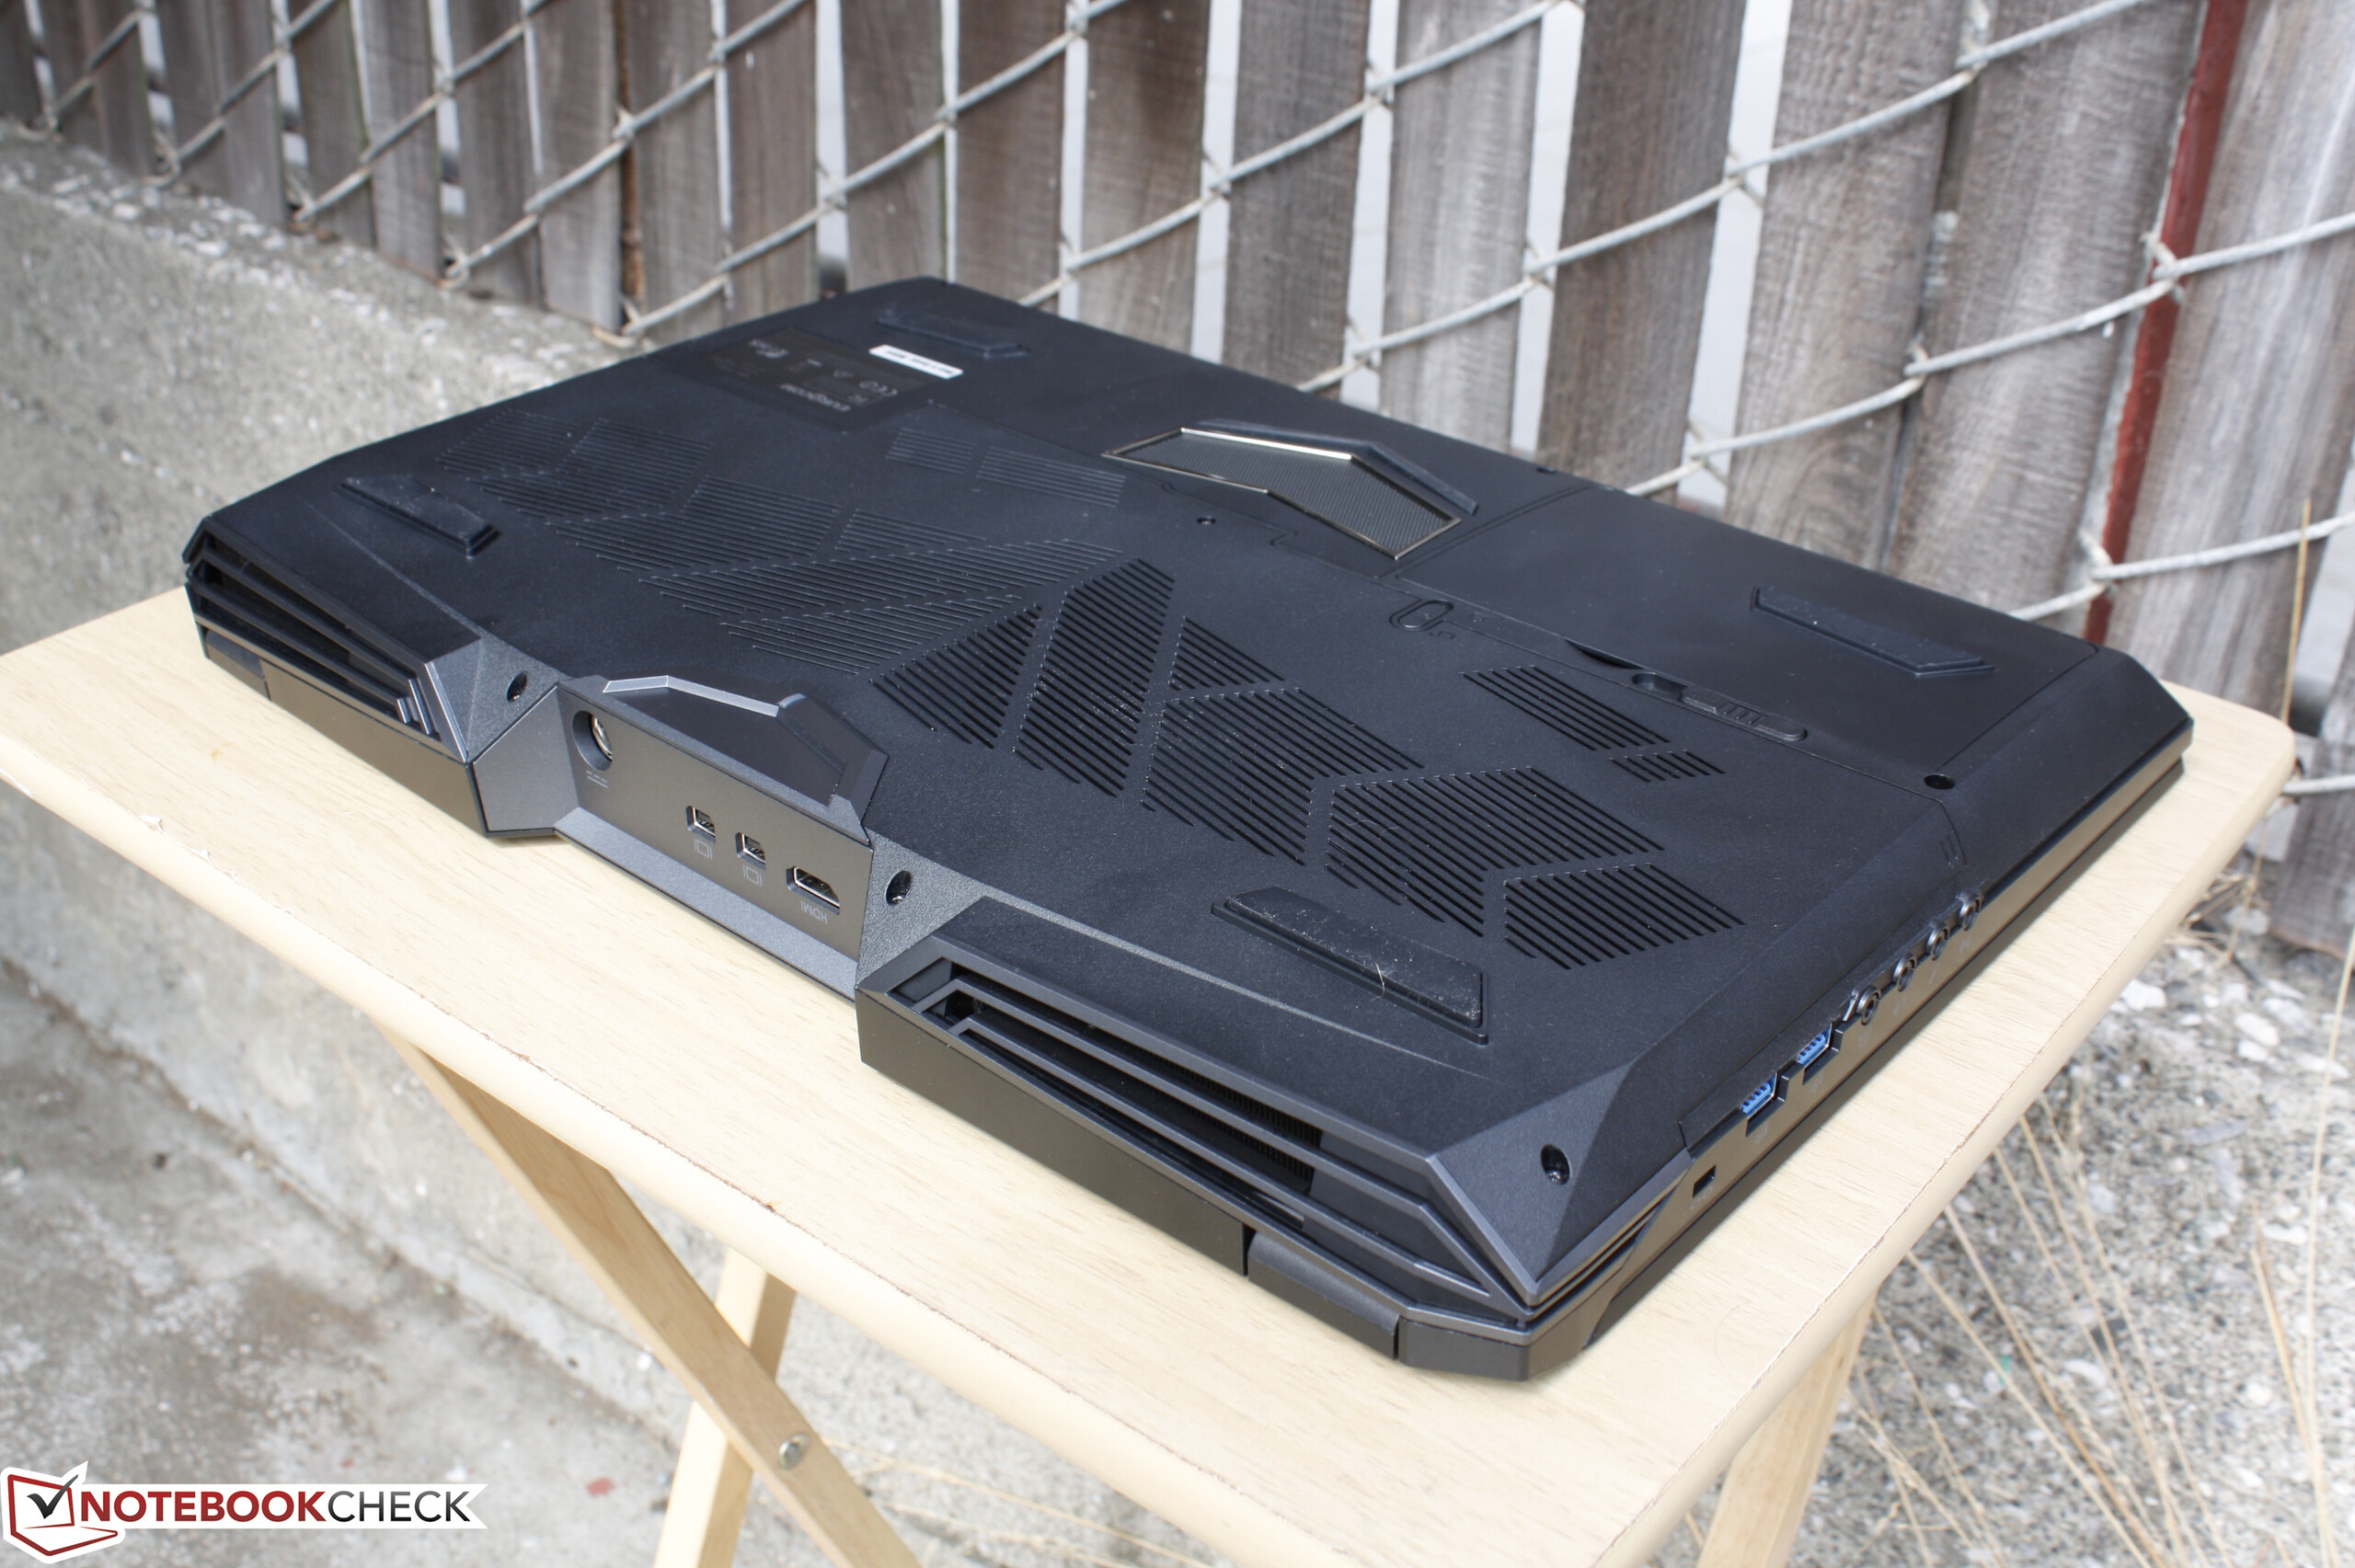
Eurocom Sky X7E2 (Clevo P775DM3) 笔记本电脑简短评测


| SD Card Reader | |
| average JPG Copy Test (av. of 3 runs) | |
| Asus G701VO-CS74K | |
| Eurocom Sky X7E2 | |
| MSI GT73VR-6RE16SR451 | |
| maximum AS SSD Seq Read Test (1GB) | |
| Eurocom Sky X7E2 | |
| Asus G701VO-CS74K | |
| MSI GT73VR-6RE16SR451 | |
| Networking | |
| iperf Server (receive) TCP 1 m 512KB | |
| Eurocom Sky X7E2 | |
| Lenovo IdeaPad Y900 | |
| Asus G701VO-CS74K | |
| iperf Client (transmit) TCP 1 m 512KB | |
| Eurocom Sky X7E2 | |
| Lenovo IdeaPad Y900 | |
| Asus G701VO-CS74K | |
| |||||||||||||||||||||||||
Brightness Distribution: 87 %
Center on Battery: 332.6 cd/m²
Contrast: 1059:1 (Black: 0.314 cd/m²)
ΔE ColorChecker Calman: 5.94 | ∀{0.5-29.43 Ø4.71}
ΔE Greyscale Calman: 6.27 | ∀{0.09-98 Ø4.96}
100% sRGB (Argyll 1.6.3 3D)
91% AdobeRGB 1998 (Argyll 1.6.3 3D)
99.2% AdobeRGB 1998 (Argyll 3D)
100% sRGB (Argyll 3D)
86.6% Display P3 (Argyll 3D)
Gamma: 2.2
CCT: 6704 K
| Eurocom Sky X7E2 IPS, 17.3", 3840x2160 | MSI GT73VR-6RE16SR451 N173HHE-G32 (CMN1747), TN, 17.3", 1920x1080 | Asus G701VO-CS74K IPS, 17.3", 1920x1080 | Lenovo IdeaPad Y900 17.3", 1920x1080 | Alienware 17 R3 (A17-9935) CV69H_173WF4 (LGD0459), IPS, 17.3", 1920x1080 | |
|---|---|---|---|---|---|
| Display | -3% | -23% | -24% | -26% | |
| Display P3 Coverage (%) | 86.6 | 91.2 5% | 68.8 -21% | 67.4 -22% | 66.9 -23% |
| sRGB Coverage (%) | 100 | 100 0% | 87.7 -12% | 86.3 -14% | 83.9 -16% |
| AdobeRGB 1998 Coverage (%) | 99.2 | 84.9 -14% | 64.1 -35% | 63.2 -36% | 61.4 -38% |
| Response Times | 38% | -15% | -23% | -13% | |
| Response Time Grey 50% / Grey 80% * (ms) | 28 ? | 26 ? 7% | 29.2 ? -4% | 34.8 ? -24% | 33 ? -18% |
| Response Time Black / White * (ms) | 21.2 ? | 6.8 ? 68% | 26.4 ? -25% | 25.6 ? -21% | 23 ? -8% |
| PWM Frequency (Hz) | |||||
| Screen | -18% | 1% | -2% | -7% | |
| Brightness middle (cd/m²) | 332.6 | 314 -6% | 368.1 11% | 344.9 4% | 360 8% |
| Brightness (cd/m²) | 329 | 294 -11% | 349 6% | 329 0% | 336 2% |
| Brightness Distribution (%) | 87 | 89 2% | 86 -1% | 86 -1% | 90 3% |
| Black Level * (cd/m²) | 0.314 | 0.23 27% | 0.365 -16% | 0.349 -11% | 0.44 -40% |
| Contrast (:1) | 1059 | 1365 29% | 1008 -5% | 988 -7% | 818 -23% |
| Colorchecker dE 2000 * | 5.94 | 9.74 -64% | 4.16 30% | 4.49 24% | 4.76 20% |
| Colorchecker dE 2000 max. * | 8.6 | 15.71 -83% | 8.7 -1% | 8.72 -1% | 10.8 -26% |
| Greyscale dE 2000 * | 6.27 | 9.58 -53% | 3.86 38% | 4.63 26% | 3.69 41% |
| Gamma | 2.2 100% | 2.5 88% | 2.19 100% | 2.11 104% | 2.24 98% |
| CCT | 6704 97% | 11854 55% | 6892 94% | 6905 94% | 6091 107% |
| Color Space (Percent of AdobeRGB 1998) (%) | 91 | 76 -16% | 57.6 -37% | 56.7 -38% | 55 -40% |
| Color Space (Percent of sRGB) (%) | 100 | 100 0% | 87.6 -12% | 86.4 -14% | 84 -16% |
| Total Average (Program / Settings) | 6% /
-7% | -12% /
-6% | -16% /
-9% | -15% /
-12% |
* ... smaller is better
Display Response Times
| ↔ Response Time Black to White | ||
|---|---|---|
| 21.2 ms ... rise ↗ and fall ↘ combined | ↗ 5.2 ms rise | 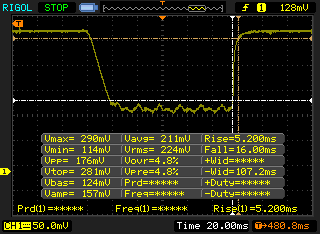 |
| ↘ 16 ms fall | ||
| The screen shows good response rates in our tests, but may be too slow for competitive gamers. In comparison, all tested devices range from 0.1 (minimum) to 240 (maximum) ms. » 48 % of all devices are better. This means that the measured response time is similar to the average of all tested devices (19.8 ms). | ||
| ↔ Response Time 50% Grey to 80% Grey | ||
| 28 ms ... rise ↗ and fall ↘ combined | ↗ 10 ms rise | 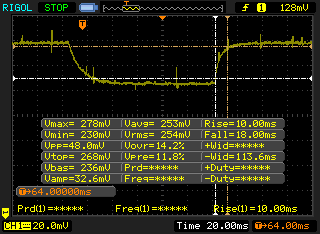 |
| ↘ 18 ms fall | ||
| The screen shows relatively slow response rates in our tests and may be too slow for gamers. In comparison, all tested devices range from 0.165 (minimum) to 636 (maximum) ms. » 38 % of all devices are better. This means that the measured response time is similar to the average of all tested devices (31 ms). | ||
Screen Flickering / PWM (Pulse-Width Modulation)
| Screen flickering / PWM not detected | 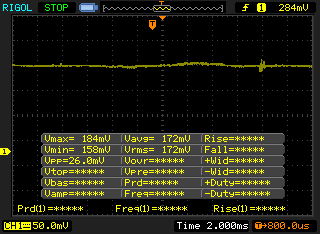 | ||
In comparison: 52 % of all tested devices do not use PWM to dim the display. If PWM was detected, an average of 7754 (minimum: 5 - maximum: 343500) Hz was measured. | |||
| Cinebench R15 | |
| CPU Single 64Bit | |
| DogHouse Systems Mobius SS | |
| Eurocom Sky X7E2 | |
| MSI GE62 2QC-468XPL | |
| MSI GT72VR 6RD-063US | |
| EVGA SC17 | |
| Asus GL550JK-CN391H | |
| CPU Multi 64Bit | |
| Eurocom Sky X7E2 | |
| DogHouse Systems Mobius SS | |
| MSI GE62 2QC-468XPL | |
| EVGA SC17 | |
| MSI GT72VR 6RD-063US | |
| Asus GL550JK-CN391H | |
| Cinebench R11.5 | |
| CPU Single 64Bit | |
| DogHouse Systems Mobius SS | |
| EVGA SC17 | |
| Eurocom Sky X7E2 | |
| MSI GE62 2QC-468XPL | |
| MSI GT72VR 6RD-063US | |
| Asus GL550JK-CN391H | |
| CPU Multi 64Bit | |
| DogHouse Systems Mobius SS | |
| Eurocom Sky X7E2 | |
| MSI GE62 2QC-468XPL | |
| EVGA SC17 | |
| MSI GT72VR 6RD-063US | |
| Asus GL550JK-CN391H | |
| Cinebench R10 | |
| Rendering Multiple CPUs 32Bit | |
| DogHouse Systems Mobius SS | |
| Eurocom Sky X7E2 | |
| MSI GE62 2QC-468XPL | |
| EVGA SC17 | |
| MSI GT72VR 6RD-063US | |
| Rendering Single 32Bit | |
| DogHouse Systems Mobius SS | |
| Eurocom Sky X7E2 | |
| EVGA SC17 | |
| MSI GE62 2QC-468XPL | |
| MSI GT72VR 6RD-063US | |
| wPrime 2.10 - 1024m | |
| MSI GT72VR 6RD-063US | |
| EVGA SC17 | |
| MSI GE62 2QC-468XPL | |
| Eurocom Sky X7E2 | |
| DogHouse Systems Mobius SS | |
| Super Pi Mod 1.5 XS 32M - 32M | |
| MSI GT72VR 6RD-063US | |
| MSI GE62 2QC-468XPL | |
| EVGA SC17 | |
| DogHouse Systems Mobius SS | |
| Eurocom Sky X7E2 | |
* ... smaller is better
| PCMark 8 | |
| Home Score Accelerated v2 | |
| Asus G701VO-CS74K | |
| MSI GT73VR-6RE16SR451 | |
| Lenovo IdeaPad Y900 | |
| Eurocom Sky X7E2 | |
| Work Score Accelerated v2 | |
| Asus G701VO-CS74K | |
| Lenovo IdeaPad Y900 | |
| MSI GT73VR-6RE16SR451 | |
| Eurocom Sky X7E2 | |
| Creative Score Accelerated v2 | |
| Eurocom Sky X7E2 | |
| Asus G701VO-CS74K | |
| Lenovo IdeaPad Y900 | |
| PCMark 8 Home Score Accelerated v2 | 4579 points | |
| PCMark 8 Creative Score Accelerated v2 | 8576 points | |
| PCMark 8 Work Score Accelerated v2 | 4816 points | |
Help | ||
| Eurocom Sky X7E2 Samsung SM951 MZVPV512HDGL m.2 PCI-e | MSI GT73VR-6RE16SR451 2x Samsung SM951 MZVPV256HDGL (RAID 0) | Asus G701VO-CS74K 2x Samsung SM951 MZVPV512HDGL (RAID 0) | Lenovo IdeaPad Y900 Samsung SM951 MZVPV256 m.2 | MSI GT72VR 6RD-063US SanDisk SD8SN8U1T001122 | |
|---|---|---|---|---|---|
| CrystalDiskMark 3.0 | 35% | 22% | -15% | -62% | |
| Read Seq (MB/s) | 1673 | 3285 96% | 3067 83% | 1559 -7% | 469.8 -72% |
| Write Seq (MB/s) | 1576 | 2560 62% | 2434 54% | 1254 -20% | 435.2 -72% |
| Read 512 (MB/s) | 1180 | 1775 50% | 1582 34% | 850 -28% | 312.6 -74% |
| Write 512 (MB/s) | 1561 | 2327 49% | 2255 44% | 1228 -21% | 367.3 -76% |
| Read 4k (MB/s) | 51.5 | 52.2 1% | 47.25 -8% | 49.32 -4% | 28.21 -45% |
| Write 4k (MB/s) | 144 | 153.1 6% | 110.7 -23% | 140.3 -3% | 59 -59% |
| Read 4k QD32 (MB/s) | 694 | 627 -10% | 584 -16% | 539 -22% | 339.7 -51% |
| Write 4k QD32 (MB/s) | 422.1 | 527 25% | 463.3 10% | 345.3 -18% | 225.6 -47% |

| 3DMark | |
| 1920x1080 Fire Strike Graphics | |
| Eurocom Sky X7E2 | |
| Nvidia GeForce GTX 1080 Founders Edition | |
| MSI GT80-2QES32SR311BW | |
| MSI GT73VR-6RE16SR451 | |
| Asus G701VO-CS74K | |
| MSI GT72VR 6RD-063US | |
| Asus Strix GL502VY-DS71 | |
| 3840x2160 Fire Strike Ultra Graphics | |
| Eurocom Sky X7E2 | |
| Nvidia GeForce GTX 1080 Founders Edition | |
| MSI GT73VR-6RE16SR451 | |
| Asus G701VO-CS74K | |
| MSI GT72VR 6RD-063US | |
| Asus Strix GL502VY-DS71 | |
| Fire Strike Extreme Graphics | |
| Eurocom Sky X7E2 | |
| Nvidia GeForce GTX 1080 Founders Edition | |
| Asus G701VO-CS74K | |
| MSI GT72VR 6RD-063US | |
| Asus Strix GL502VY-DS71 | |
| 3DMark 11 | |
| 1280x720 Performance GPU | |
| Nvidia GeForce GTX 1080 Founders Edition | |
| Eurocom Sky X7E2 | |
| MSI GT73VR-6RE16SR451 | |
| MSI GT80-2QES32SR311BW | |
| Asus G701VO-CS74K | |
| MSI GT72VR 6RD-063US | |
| Asus Strix GL502VY-DS71 | |
| 1280x720 Performance Combined | |
| Nvidia GeForce GTX 1080 Founders Edition | |
| Eurocom Sky X7E2 | |
| MSI GT80-2QES32SR311BW | |
| MSI GT73VR-6RE16SR451 | |
| Asus G701VO-CS74K | |
| Asus Strix GL502VY-DS71 | |
| MSI GT72VR 6RD-063US | |
| 3DMark 11 Performance | 19921 points | |
| 3DMark Ice Storm Standard Score | 181296 points | |
| 3DMark Cloud Gate Standard Score | 30410 points | |
| 3DMark Fire Strike Score | 17160 points | |
| 3DMark Fire Strike Extreme Score | 9473 points | |
Help | ||
| Rise of the Tomb Raider - 3840x2160 High Preset AA:FX AF:4x | |
| Eurocom Sky X7E2 | |
| Nvidia GeForce GTX 1080 Founders Edition | |
| Nvidia GeForce GTX 1080 Founders Edition | |
| Nvidia GeForce GTX 1070 Founders Edition | |
| Nvidia GeForce GTX 1060 Founders Edition 6 GB | |
| Nvidia GeForce GTX 1060 Founders Edition 6 GB | |
| Fallout 4 - 3840x2160 High Preset AA:T AF:16x | |
| Eurocom Sky X7E2 | |
| Nvidia GeForce GTX 1080 Founders Edition | |
| Nvidia GeForce GTX 1070 Founders Edition | |
| Nvidia GeForce GTX 1060 Founders Edition 6 GB | |
| Doom - 3840x2160 High Preset AA:FX | |
| Eurocom Sky X7E2 | |
| Nvidia GeForce GTX 1080 Founders Edition | |
| Nvidia GeForce GTX 1070 Founders Edition | |
| Nvidia GeForce GTX 1060 Founders Edition 6 GB | |
| Overwatch - 3840x2160 High (Render Scale 100 %) AA:SM AF:4x | |
| Eurocom Sky X7E2 | |
| Nvidia GeForce GTX 1080 Founders Edition | |
| Nvidia GeForce GTX 1070 Founders Edition | |
| Nvidia GeForce GTX 1060 Founders Edition 6 GB | |
| Batman: Arkham Knight - 3840x2160 High / On (Interactive Smoke & Paper Debris Off) AA:SM AF:8x | |
| Eurocom Sky X7E2 | |
| Nvidia GeForce GTX 1060 Founders Edition 6 GB | |
| low | med. | high | ultra | 4K | |
|---|---|---|---|---|---|
| Sleeping Dogs (2012) | 147.8 | ||||
| Guild Wars 2 (2012) | 83 | ||||
| BioShock Infinite (2013) | 168.7 | ||||
| Metro: Last Light (2013) | 131.6 | ||||
| Thief (2014) | 125.5 | ||||
| Batman: Arkham Knight (2015) | 105 | 58 | |||
| Metal Gear Solid V (2015) | 60 | 60 | |||
| Fallout 4 (2015) | 133.7 | 54.6 | |||
| Rise of the Tomb Raider (2016) | 119.4 | 51.9 | |||
| Doom (2016) | 144.2 | 65.1 | |||
| Overwatch (2016) | 203.2 | 109.7 |
Noise level
| Idle |
| 28.9 / 30.6 / 35.7 dB(A) |
| Load |
| 49 / 55 dB(A) |
 | ||
30 dB silent 40 dB(A) audible 50 dB(A) loud |
||
min: | ||
| Eurocom Sky X7E2 GeForce GTX 1080 Mobile, 6700K, Samsung SM951 MZVPV512HDGL m.2 PCI-e | MSI GT73VR-6RE16SR451 GeForce GTX 1070 Mobile, 6820HK, 2x Samsung SM951 MZVPV256HDGL (RAID 0) | Asus G701VO-CS74K GeForce GTX 980 (Laptop), 6820HK, 2x Samsung SM951 MZVPV512HDGL (RAID 0) | Lenovo IdeaPad Y900 GeForce GTX 980M, 6820HK, Samsung SM951 MZVPV256 m.2 | MSI GT72VR 6RD-063US GeForce GTX 1060 Mobile, 6700HQ, SanDisk SD8SN8U1T001122 | |
|---|---|---|---|---|---|
| Noise | 3% | 4% | -3% | 6% | |
| off / environment * (dB) | 28.9 | 30 -4% | 29.1 -1% | 28.8 -0% | 28.6 1% |
| Idle Minimum * (dB) | 28.9 | 32 -11% | 29.1 -1% | 29.4 -2% | 30.8 -7% |
| Idle Average * (dB) | 30.6 | 33 -8% | 31.9 -4% | 32.4 -6% | 30.8 -1% |
| Idle Maximum * (dB) | 35.7 | 35 2% | 31.9 11% | 48 -34% | 32 10% |
| Load Average * (dB) | 49 | 35 29% | 46 6% | 42.5 13% | 37.2 24% |
| Load Maximum * (dB) | 55 | 49 11% | 47.5 14% | 48.5 12% | 51.5 6% |
* ... smaller is better
(-) The maximum temperature on the upper side is 53.8 °C / 129 F, compared to the average of 40.4 °C / 105 F, ranging from 21.2 to 68.8 °C for the class Gaming.
(-) The bottom heats up to a maximum of 57.6 °C / 136 F, compared to the average of 43.2 °C / 110 F
(+) In idle usage, the average temperature for the upper side is 29.1 °C / 84 F, compared to the device average of 33.9 °C / 93 F.
(+) The palmrests and touchpad are reaching skin temperature as a maximum (33.8 °C / 92.8 F) and are therefore not hot.
(-) The average temperature of the palmrest area of similar devices was 28.8 °C / 83.8 F (-5 °C / -9 F).
Eurocom Sky X7E2 audio analysis
(-) | not very loud speakers (69.6 dB)
Bass 100 - 315 Hz
(±) | reduced bass - on average 7% lower than median
(±) | linearity of bass is average (14.7% delta to prev. frequency)
Mids 400 - 2000 Hz
(+) | balanced mids - only 1.7% away from median
(+) | mids are linear (6.6% delta to prev. frequency)
Highs 2 - 16 kHz
(+) | balanced highs - only 3.5% away from median
(+) | highs are linear (6.6% delta to prev. frequency)
Overall 100 - 16.000 Hz
(±) | linearity of overall sound is average (16.4% difference to median)
Compared to same class
» 42% of all tested devices in this class were better, 6% similar, 52% worse
» The best had a delta of 6%, average was 18%, worst was 132%
Compared to all devices tested
» 27% of all tested devices were better, 6% similar, 67% worse
» The best had a delta of 4%, average was 23%, worst was 134%
Apple MacBook 12 (Early 2016) 1.1 GHz audio analysis
(+) | speakers can play relatively loud (83.6 dB)
Bass 100 - 315 Hz
(±) | reduced bass - on average 11.3% lower than median
(±) | linearity of bass is average (14.2% delta to prev. frequency)
Mids 400 - 2000 Hz
(+) | balanced mids - only 2.4% away from median
(+) | mids are linear (5.5% delta to prev. frequency)
Highs 2 - 16 kHz
(+) | balanced highs - only 2% away from median
(+) | highs are linear (4.5% delta to prev. frequency)
Overall 100 - 16.000 Hz
(+) | overall sound is linear (10.2% difference to median)
Compared to same class
» 7% of all tested devices in this class were better, 2% similar, 90% worse
» The best had a delta of 5%, average was 18%, worst was 53%
Compared to all devices tested
» 5% of all tested devices were better, 1% similar, 94% worse
» The best had a delta of 4%, average was 23%, worst was 134%
| Off / Standby | |
| Idle | |
| Load |
|
Key:
min: | |
| Eurocom Sky X7E2 6700K, GeForce GTX 1080 Mobile, Samsung SM951 MZVPV512HDGL m.2 PCI-e, IPS, 3840x2160, 17.3" | MSI GT73VR-6RE16SR451 6820HK, GeForce GTX 1070 Mobile, 2x Samsung SM951 MZVPV256HDGL (RAID 0), TN, 1920x1080, 17.3" | Asus G701VO-CS74K 6820HK, GeForce GTX 980 (Laptop), 2x Samsung SM951 MZVPV512HDGL (RAID 0), IPS, 1920x1080, 17.3" | Lenovo IdeaPad Y900 6820HK, GeForce GTX 980M, Samsung SM951 MZVPV256 m.2, , 1920x1080, 17.3" | MSI GT80S 6QF 6820HK, GeForce GTX 980 SLI (Laptop), 2x Samsung SM951 MZVPV256HDGL (RAID 0), Super PLS, 1920x1080, 18.4" | |
|---|---|---|---|---|---|
| Power Consumption | 26% | 30% | 39% | -17% | |
| Idle Minimum * (Watt) | 34.3 | 31 10% | 28.2 18% | 24.3 29% | 44 -28% |
| Idle Average * (Watt) | 42.9 | 35 18% | 32 25% | 29.6 31% | 53 -24% |
| Idle Maximum * (Watt) | 43.5 | 40 8% | 32.6 25% | 29.9 31% | 62 -43% |
| Load Average * (Watt) | 258 | 106 59% | 162.2 37% | 110.1 57% | 163 37% |
| Load Maximum * (Watt) | 329.8 | 218 34% | 173.5 47% | 171.4 48% | 411 -25% |
* ... smaller is better
| Eurocom Sky X7E2 6700K, GeForce GTX 1080 Mobile, 89 Wh | MSI GT73VR-6RE16SR451 6820HK, GeForce GTX 1070 Mobile, 75.2 Wh | Asus G701VO-CS74K 6820HK, GeForce GTX 980 (Laptop), 93 Wh | Lenovo IdeaPad Y900 6820HK, GeForce GTX 980M, 90 Wh | MSI GT72VR 6RD-063US 6700HQ, GeForce GTX 1060 Mobile, 83 Wh | |
|---|---|---|---|---|---|
| Battery runtime | 65% | 60% | 119% | 89% | |
| Reader / Idle (h) | 2.3 | 4.8 109% | 4 74% | 5.8 152% | 5.4 135% |
| WiFi v1.3 (h) | 1.7 | 3.4 100% | 3.4 100% | 4.1 141% | 3.7 118% |
| Load (h) | 1.4 | 1.2 -14% | 1.5 7% | 2.3 64% | 1.6 14% |
Pros
Cons
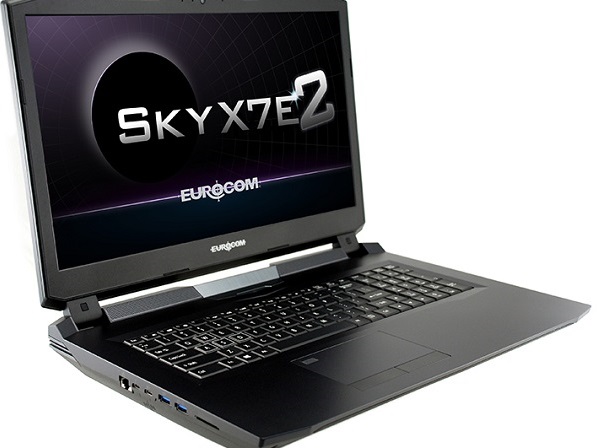
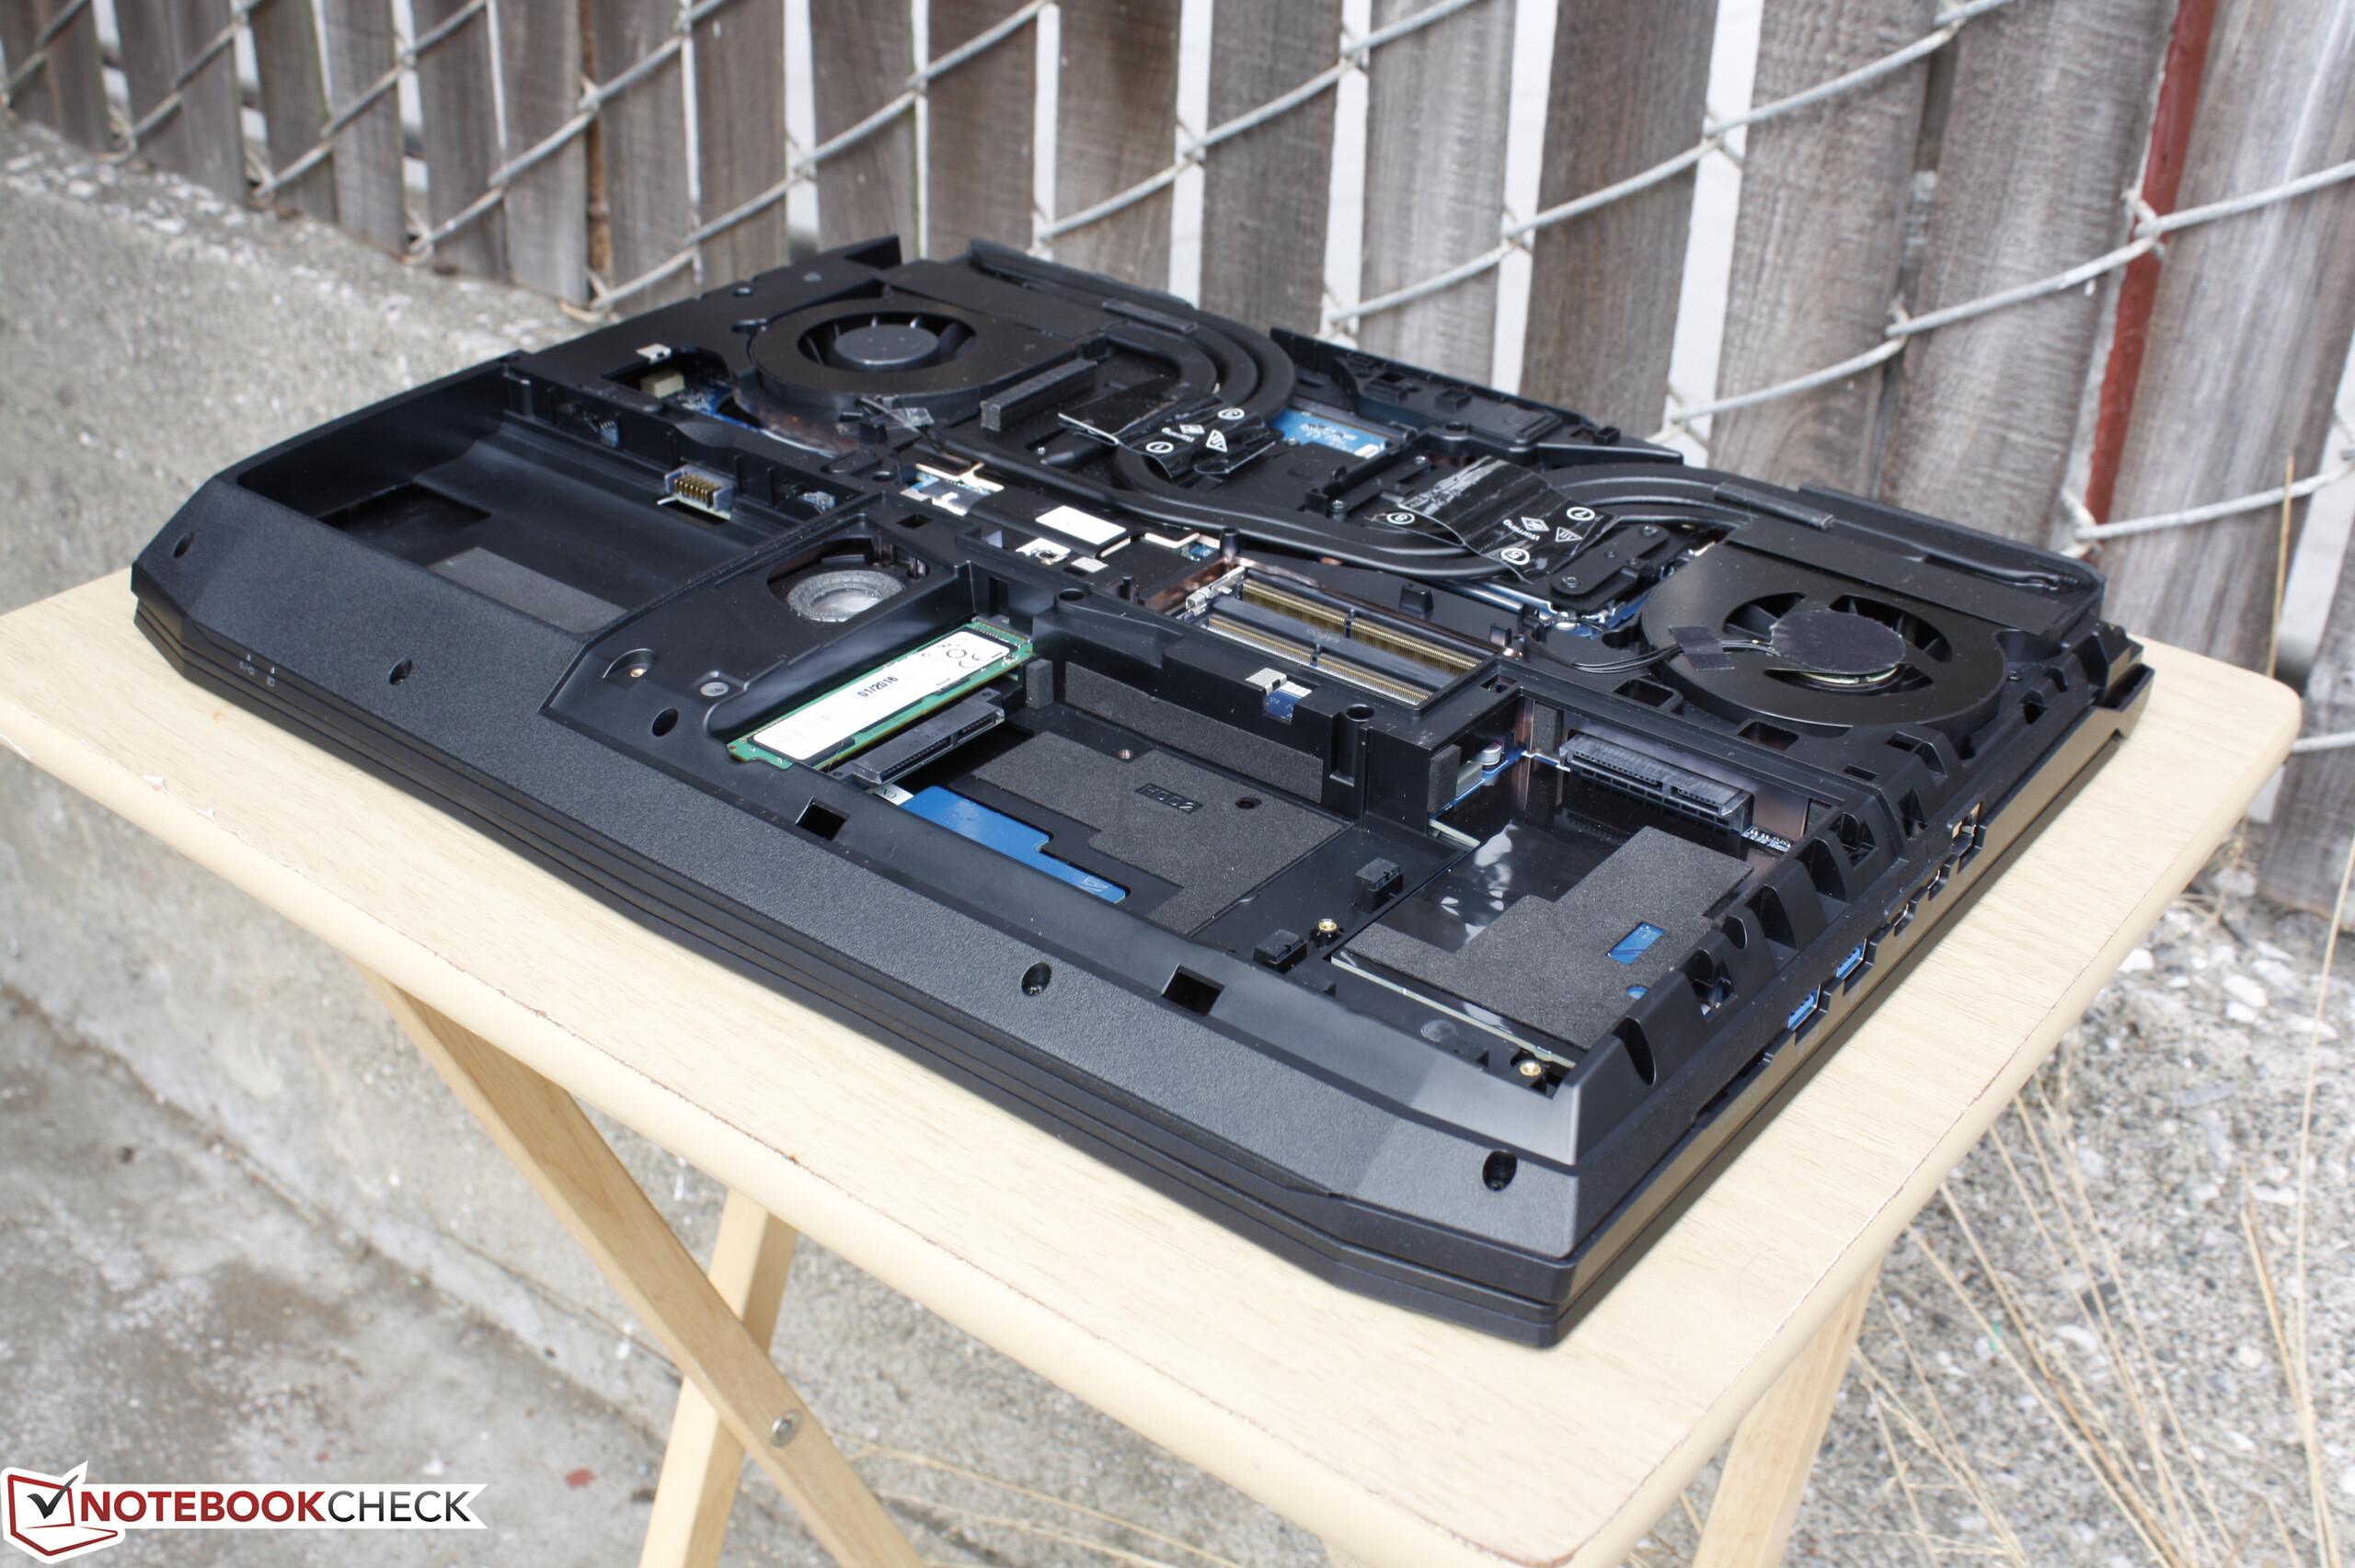
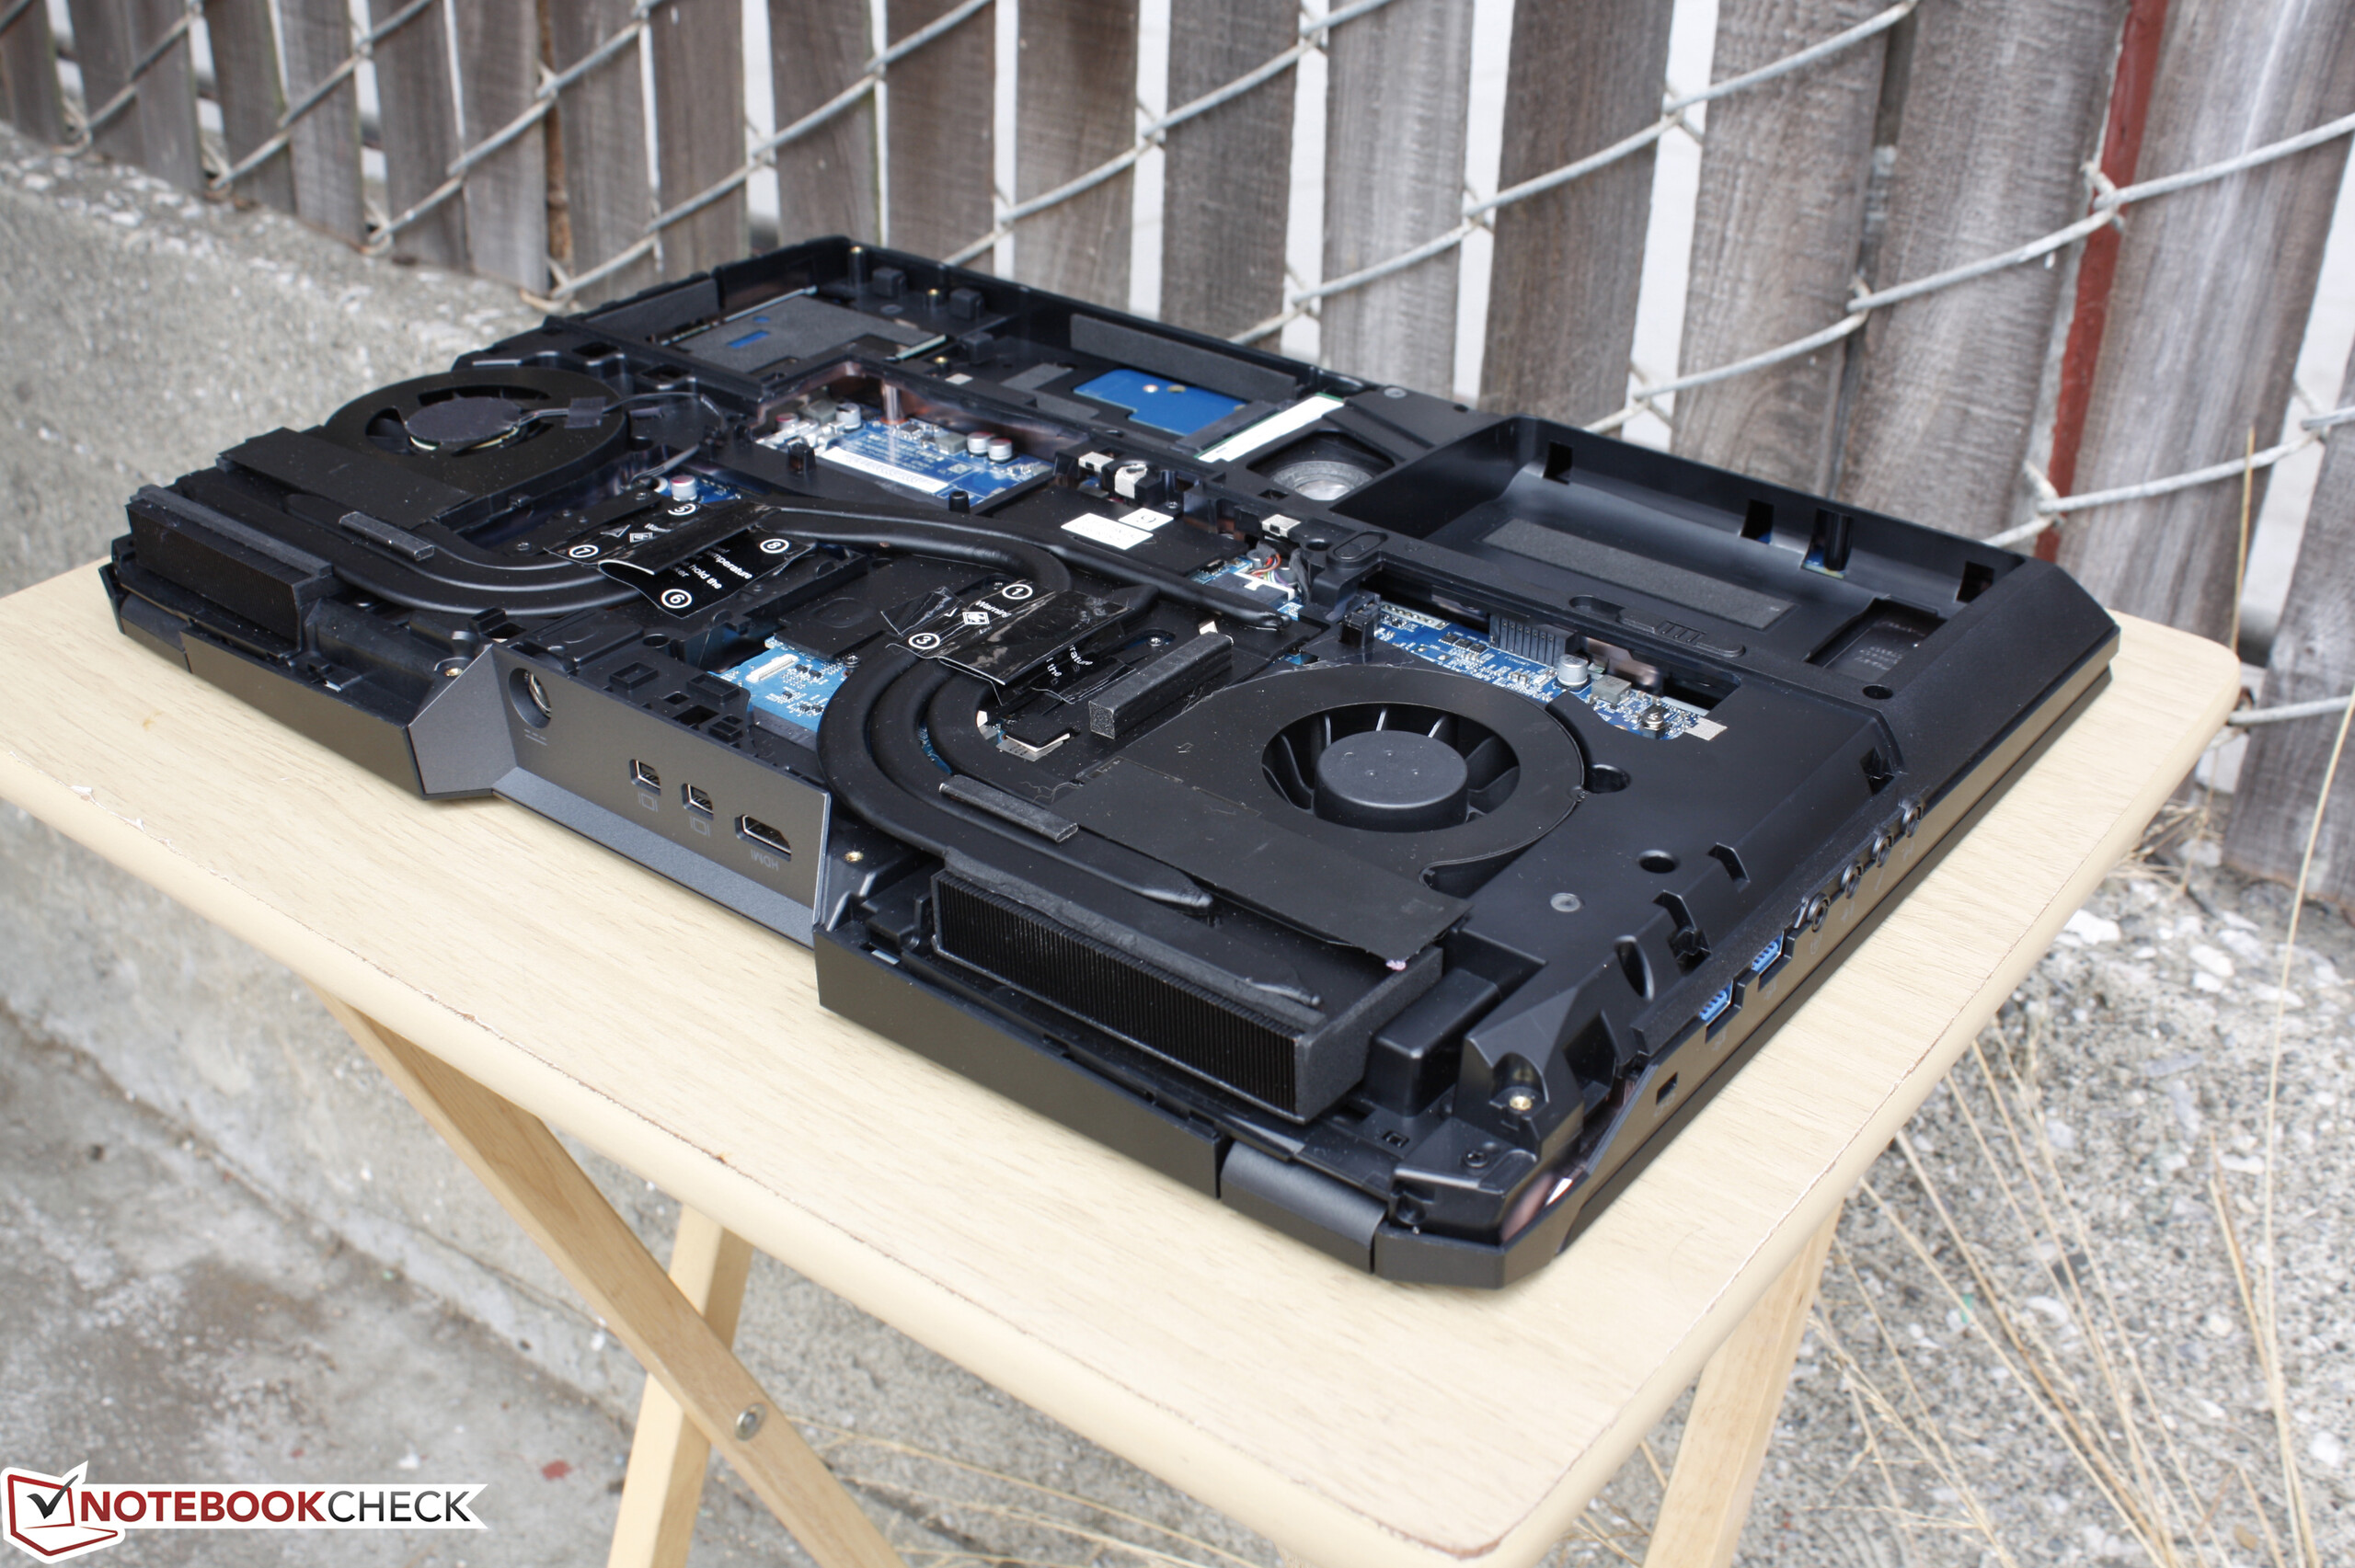
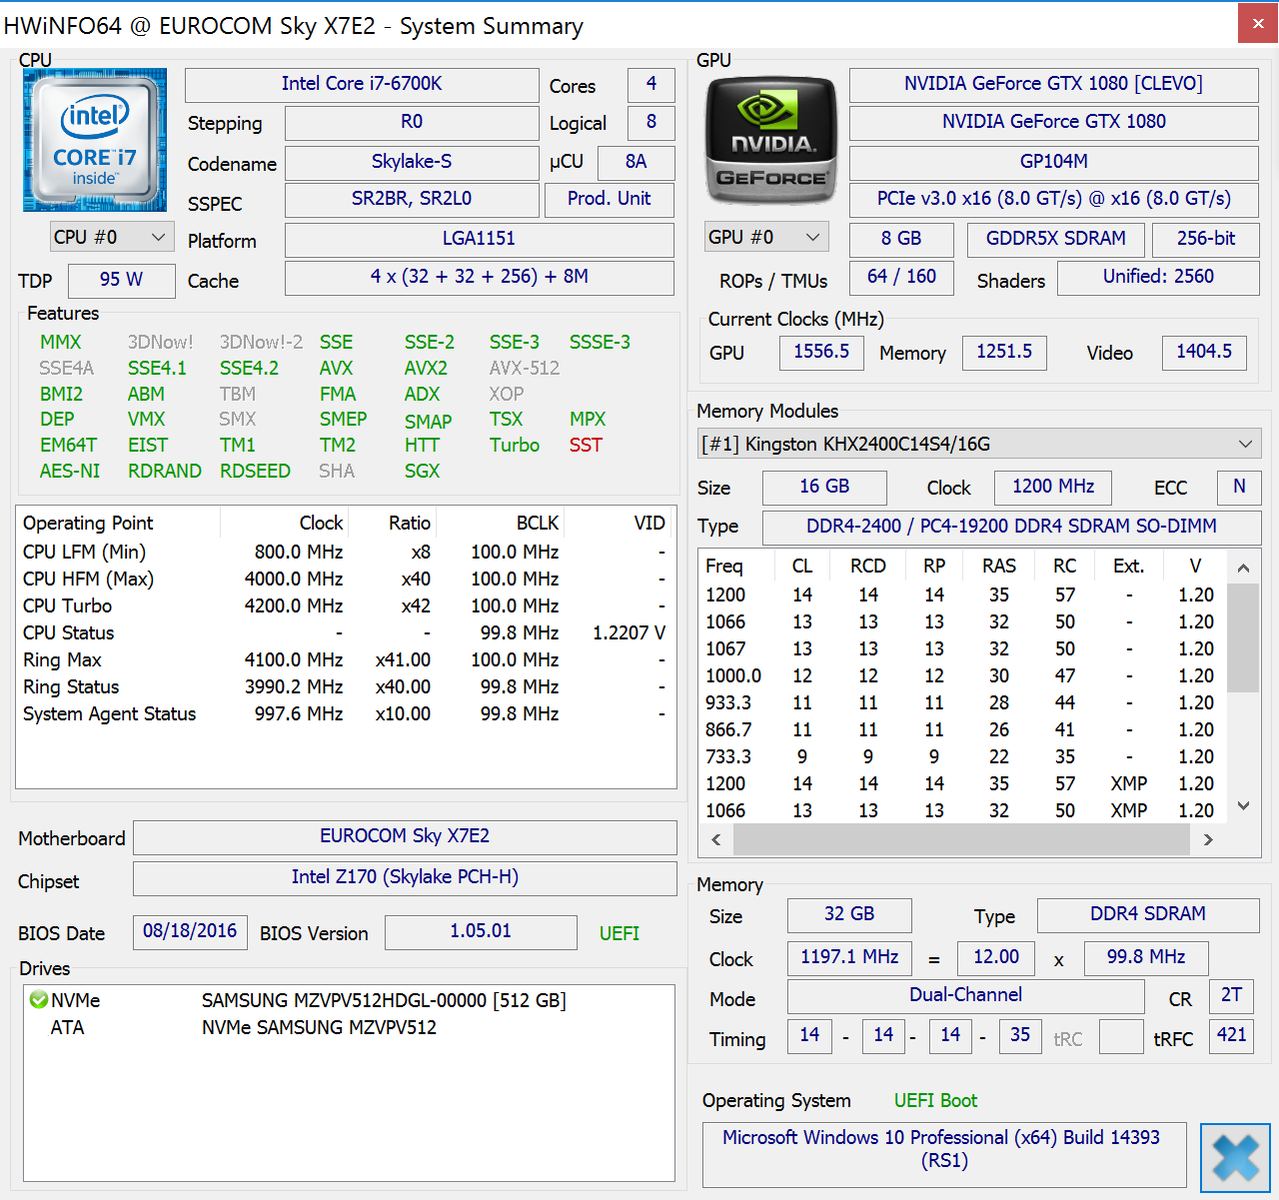
酷睿i7-6700K和GTX 1080是目前消费市场上最强大的处理器和显卡,通常其他游戏本厂商不会把它们同时放入一台笔记本电脑中。LGA 1151插槽和MXM 3.0插槽都是蓝天准系统相比其他竞争对手的优势,我们配置的处理器和显卡对P775DM3机身可能有些难以掌控。不管如何调整,它在游戏中的核心温度都会超过90度,这可能会让绝大部分游戏玩家不安。即使用户对高温度无动于衷,它相比其他配置较弱的17寸机型仍然噪音更大。较高的功耗让它会达到330瓦电源适配器的功率极限,这意味着这个配置受到了P775DM3机身的限制。
幸运的是,它的处理器和显卡在游戏中都没有我们预期中的严重降频问题。这让Sky X7E2成为了除GTX 10系SLI设置系统外最强大的17寸游戏本。它极致的硬件配置需要用户忍受高噪音和高发热量,因此考虑降低配置可能对于这个准系统机身来说是更加合理的选择。
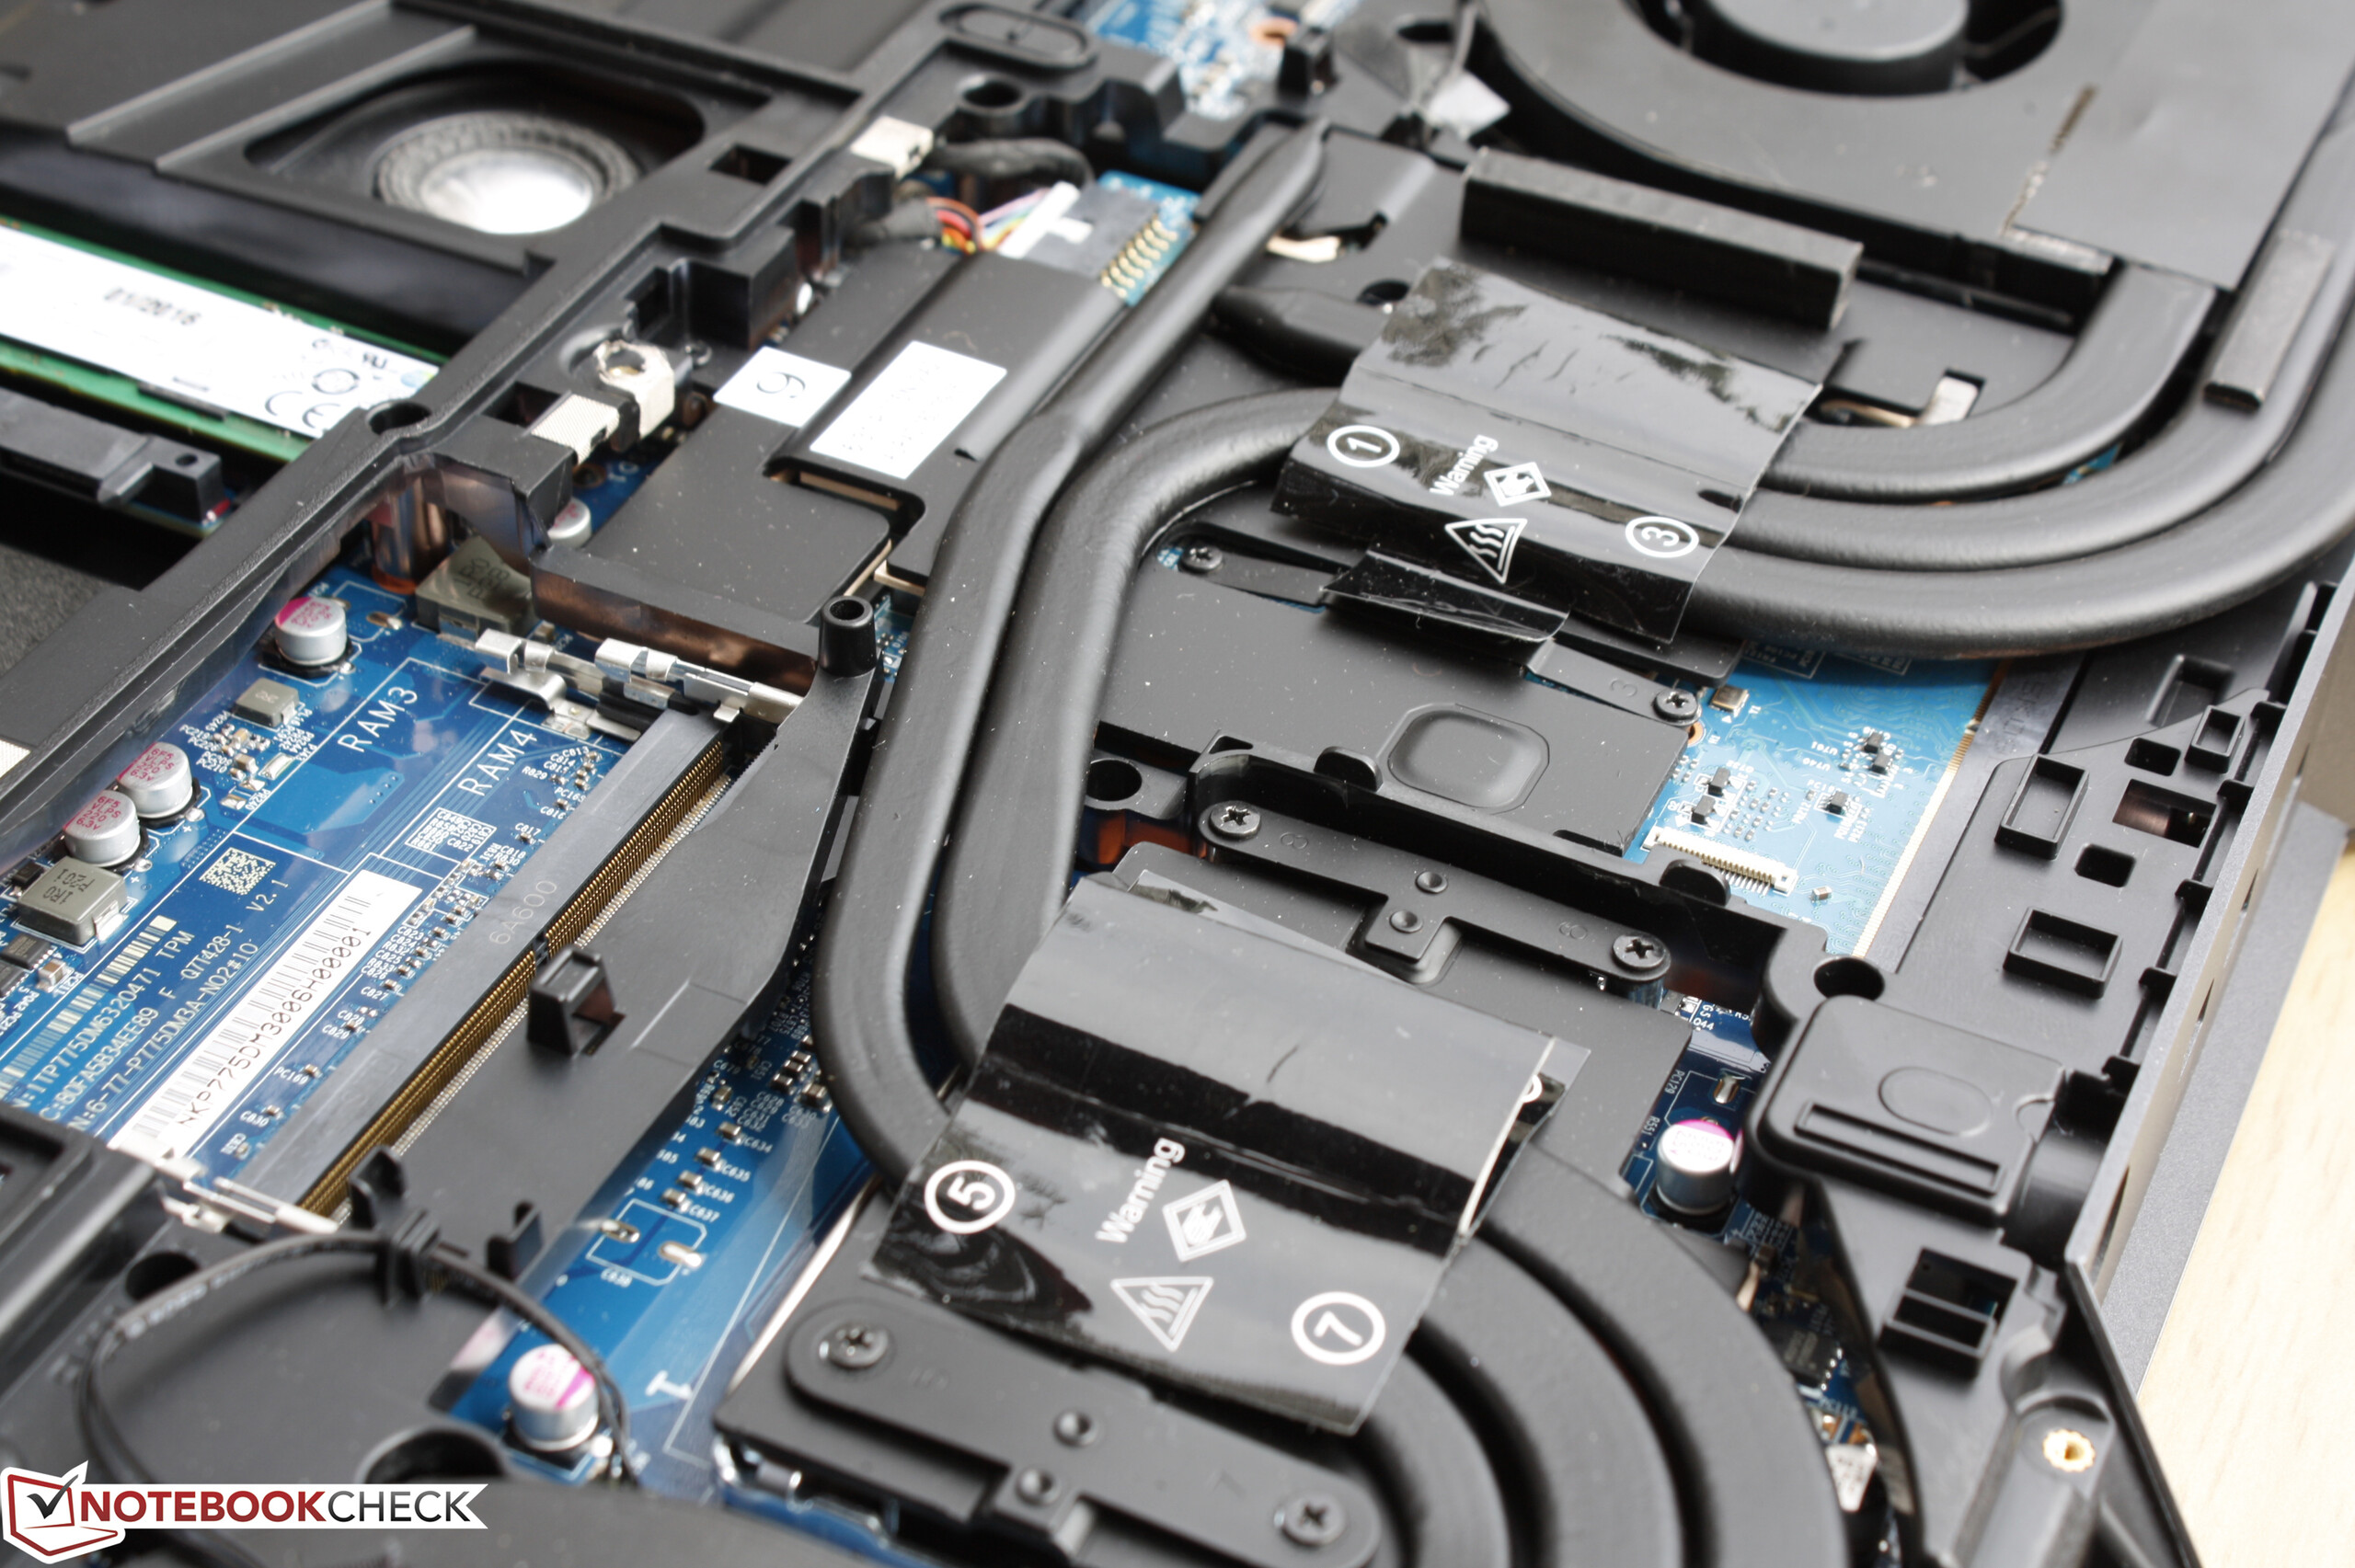
在游戏中它的温度和风扇噪音都达到了让人难以忍受的程度。如果你对此无所畏惧的话,Sky X7E2能够提供这个尺寸笔记本电脑中最强大的游戏性能。除此之外,我们建议用户考虑散热系统更高效的Sky DLX7或微星GT73VR。
注:本文是基于完整评测的缩减版本,阅读完整的英文评测,请点击这里。
Eurocom Sky X7E2
- 10/03/2016 v5.1 (old)
Allen Ngo
Price comparison
