外星人 17 R4 (7820HK, 准高清, GTX 1080) 笔记本电脑简短评测
| Networking | |
| iperf3 transmit AX12 | |
| Alienware 17 R4 | |
| MSI GT62VR 7RE-223 | |
| Dell XPS 15 9560 (i7-7700HQ, UHD) | |
| iperf3 receive AX12 | |
| MSI GT62VR 7RE-223 | |
| Dell XPS 15 9560 (i7-7700HQ, UHD) | |
| Alienware 17 R4 | |
| |||||||||||||||||||||||||
Brightness Distribution: 86 %
Center on Battery: 402.3 cd/m²
Contrast: 649:1 (Black: 0.62 cd/m²)
ΔE ColorChecker Calman: 5.6 | ∀{0.5-29.43 Ø4.71}
ΔE Greyscale Calman: 4.7 | ∀{0.09-98 Ø4.96}
82.2% sRGB (Argyll 1.6.3 3D)
53.7% AdobeRGB 1998 (Argyll 1.6.3 3D)
60.5% AdobeRGB 1998 (Argyll 3D)
82.9% sRGB (Argyll 3D)
61.2% Display P3 (Argyll 3D)
Gamma: 2.14
CCT: 7519 K
| Alienware 17 R4 TN LED, 17.3", 2560x1440 | Alienware 17 R3 (A17-9935) CV69H_173WF4 (LGD0459), IPS, 17.3", 1920x1080 | MSI GT73VR 7RF-296 N173HHE-G32 (CMN1747), TN LED, 17.3", 1920x1080 | Acer Predator 17 X GX-792-76DL LP173WF4-SPF5 (LGD056D), IPS, 17.3", 1920x1080 | Aorus X7 DT v6 AUO1096, TN LED, 17.3", 2560x1440 | |
|---|---|---|---|---|---|
| Display | 4% | 36% | 3% | -1% | |
| Display P3 Coverage (%) | 61.2 | 66.9 9% | 90.6 48% | 66 8% | 59.6 -3% |
| sRGB Coverage (%) | 82.9 | 83.9 1% | 99.9 21% | 83.7 1% | 82.8 0% |
| AdobeRGB 1998 Coverage (%) | 60.5 | 61.4 1% | 84.7 40% | 61.2 1% | 60.1 -1% |
| Response Times | -45% | 29% | -85% | 13% | |
| Response Time Grey 50% / Grey 80% * (ms) | 30 ? | 33 ? -10% | 26 ? 13% | 45 ? -50% | 21.6 ? 28% |
| Response Time Black / White * (ms) | 12.8 ? | 23 ? -80% | 7 ? 45% | 28 ? -119% | 13.2 ? -3% |
| PWM Frequency (Hz) | 59.5 | ||||
| Screen | 7% | -9% | 16% | -6% | |
| Brightness middle (cd/m²) | 402.3 | 360 -11% | 307 -24% | 380 -6% | 339.5 -16% |
| Brightness (cd/m²) | 372 | 336 -10% | 284 -24% | 362 -3% | 309 -17% |
| Brightness Distribution (%) | 86 | 90 5% | 85 -1% | 91 6% | 80 -7% |
| Black Level * (cd/m²) | 0.62 | 0.44 29% | 0.25 60% | 0.37 40% | 0.45 27% |
| Contrast (:1) | 649 | 818 26% | 1228 89% | 1027 58% | 754 16% |
| Colorchecker dE 2000 * | 5.6 | 4.76 15% | 9.65 -72% | 4.12 26% | 6.88 -23% |
| Colorchecker dE 2000 max. * | 9.8 | 10.8 -10% | 16.36 -67% | 8.19 16% | 9.99 -2% |
| Greyscale dE 2000 * | 4.7 | 3.69 21% | 10.07 -114% | 3.95 16% | 6.57 -40% |
| Gamma | 2.14 103% | 2.24 98% | 2.12 104% | 2.47 89% | 2.04 108% |
| CCT | 7519 86% | 6091 107% | 12145 54% | 6539 99% | 8608 76% |
| Color Space (Percent of AdobeRGB 1998) (%) | 53.7 | 55 2% | 75 40% | 55 2% | 54 1% |
| Color Space (Percent of sRGB) (%) | 82.2 | 84 2% | 100 22% | 84 2% | 82 0% |
| Total Average (Program / Settings) | -11% /
-1% | 19% /
5% | -22% /
-0% | 2% /
-3% |
* ... smaller is better
Display Response Times
| ↔ Response Time Black to White | ||
|---|---|---|
| 12.8 ms ... rise ↗ and fall ↘ combined | ↗ 10.8 ms rise | 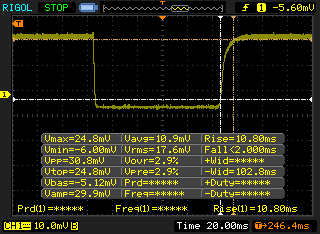 |
| ↘ 2 ms fall | ||
| The screen shows good response rates in our tests, but may be too slow for competitive gamers. In comparison, all tested devices range from 0.1 (minimum) to 240 (maximum) ms. » 33 % of all devices are better. This means that the measured response time is better than the average of all tested devices (19.8 ms). | ||
| ↔ Response Time 50% Grey to 80% Grey | ||
| 30 ms ... rise ↗ and fall ↘ combined | ↗ 18.8 ms rise | 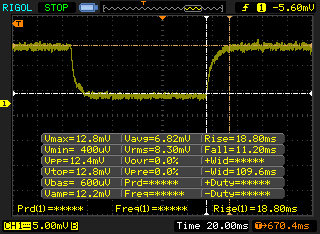 |
| ↘ 11.2 ms fall | ||
| The screen shows slow response rates in our tests and will be unsatisfactory for gamers. In comparison, all tested devices range from 0.165 (minimum) to 636 (maximum) ms. » 40 % of all devices are better. This means that the measured response time is similar to the average of all tested devices (31 ms). | ||
Screen Flickering / PWM (Pulse-Width Modulation)
| Screen flickering / PWM not detected |  | ||
In comparison: 52 % of all tested devices do not use PWM to dim the display. If PWM was detected, an average of 7757 (minimum: 5 - maximum: 343500) Hz was measured. | |||

| wPrime 2.10 - 1024m | |
| Apple MacBook Pro 15 2016 (2.7 GHz, 455) | |
| EVGA SC17 GTX 1070 | |
| Samsung Odyssey NP800G5M-X01US | |
| Eurocom Sky X7E2 | |
| Alienware 17 R4 | |
| Eurocom Tornado F5 | |
* ... smaller is better
| PCMark 8 | |
| Home Score Accelerated v2 | |
| Aorus X7 DT v6 | |
| Alienware 17 R4 | |
| Eurocom Tornado F5 Killer Edition | |
| Work Score Accelerated v2 | |
| Aorus X7 DT v6 | |
| Alienware 17 R4 | |
| Eurocom Tornado F5 Killer Edition | |
| Creative Score Accelerated v2 | |
| Aorus X7 DT v6 | |
| Eurocom Tornado F5 Killer Edition | |
| Alienware 17 R4 | |
| PCMark 8 Home Score Accelerated v2 | 5064 points | |
| PCMark 8 Creative Score Accelerated v2 | 8272 points | |
| PCMark 8 Work Score Accelerated v2 | 5088 points | |
Help | ||
| Alienware 17 R4 SK Hynix PC300 NVMe 512 GB | Alienware 17 R3 (A17-9935) Samsung PM951 NVMe 512 GB | MSI GT73VR 7RF-296 2x Samsung SM951 MZVPV256HDGL (RAID 0) | Acer Predator 17 X GX-792-76DL Toshiba NVMe THNSN5512GPU7 | Aorus X7 DT v6 Samsung SM951 MZVPV512HDGL m.2 PCI-e | |
|---|---|---|---|---|---|
| CrystalDiskMark 3.0 | -20% | 100% | 30% | 43% | |
| Read Seq (MB/s) | 1277 | 1263 -1% | 3219 152% | 1494 17% | 1829 43% |
| Write Seq (MB/s) | 786 | 587 -25% | 2572 227% | 1371 74% | 1588 102% |
| Read 512 (MB/s) | 894 | 569 -36% | 1776 99% | 898 0% | 1064 19% |
| Write 512 (MB/s) | 659 | 265.2 -60% | 2445 271% | 1273 93% | 1507 129% |
| Read 4k (MB/s) | 38.11 | 42.59 12% | 51.1 34% | 43.82 15% | 52.9 39% |
| Write 4k (MB/s) | 128.5 | 140.6 9% | 141.3 10% | 161.6 26% | 161.1 25% |
| Read 4k QD32 (MB/s) | 628 | 610 -3% | 658 5% | 669 7% | 676 8% |
| Write 4k QD32 (MB/s) | 531 | 232.8 -56% | 554 4% | 552 4% | 419.1 -21% |

| 3DMark | |
| 1920x1080 Fire Strike Graphics | |
| Nvidia GeForce GTX 1080 Ti Founders Edition | |
| MSI Gaming X GeForce GTX 1080 Desktop PC | |
| Alienware 17 R4 | |
| Eurocom Tornado F5 Killer Edition | |
| Asus Strix GL702VSK | |
| Asus Strix GTX 980 Ti Desktop PC | |
| Asus G701VO-CS74K | |
| MSI GS63VR 7RF-228US | |
| Fire Strike Extreme Graphics | |
| Alienware 17 R4 | |
| Eurocom Tornado F5 Killer Edition | |
| Asus Strix GL702VSK | |
| Asus Strix GTX 980 Ti Desktop PC | |
| Asus G701VO-CS74K | |
| MSI GS63VR 7RF-228US | |
| 3840x2160 Fire Strike Ultra Graphics | |
| Nvidia GeForce GTX 1080 Ti Founders Edition | |
| Alienware 17 R4 | |
| Eurocom Tornado F5 Killer Edition | |
| Asus Strix GTX 980 Ti Desktop PC | |
| Asus G701VO-CS74K | |
| MSI GS63VR 7RF-228US | |
| 3DMark 11 | |
| 1280x720 Performance GPU | |
| Nvidia GeForce GTX 1080 Ti Founders Edition | |
| MSI Gaming X GeForce GTX 1080 Desktop PC | |
| Eurocom Tornado F5 Killer Edition | |
| Alienware 17 R4 | |
| Asus Strix GTX 980 Ti Desktop PC | |
| Asus Strix GL702VSK | |
| Asus G701VO-CS74K | |
| MSI GS63VR 7RF-228US | |
| 1280x720 Performance Combined | |
| Nvidia GeForce GTX 1080 Ti Founders Edition | |
| Asus Strix GTX 980 Ti Desktop PC | |
| MSI Gaming X GeForce GTX 1080 Desktop PC | |
| Alienware 17 R4 | |
| Asus G701VO-CS74K | |
| MSI GS63VR 7RF-228US | |
| Eurocom Tornado F5 Killer Edition | |
| Asus Strix GL702VSK | |
| Rise of the Tomb Raider - 1920x1080 Very High Preset AA:FX AF:16x | |
| Nvidia GeForce GTX 1080 Ti Founders Edition | |
| Alienware 17 R4 | |
| Eurocom Tornado F5 Killer Edition | |
| Nvidia GeForce GTX 1080 Founders Edition | |
| Nvidia GeForce GTX 1080 Founders Edition | |
| Nvidia GeForce GTX 1080 Founders Edition | |
| Asus Strix GL702VSK | |
| Asus Strix GTX 980 Ti Desktop PC | |
| MSI GS63VR 7RF-228US | |
| Asus G701VO-CS74K | |
| BioShock Infinite - 1920x1080 Ultra Preset, DX11 (DDOF) | |
| Nvidia GeForce GTX 1080 Ti Founders Edition | |
| Nvidia GeForce GTX 1080 Founders Edition | |
| Alienware 17 R4 | |
| Asus Strix GTX 980 Ti Desktop PC | |
| Eurocom Tornado F5 Killer Edition | |
| Asus Strix GL702VSK | |
| Asus G701VO-CS74K | |
| MSI GS63VR 7RF-228US | |
| Metro: Last Light - 1920x1080 Very High (DX11) AF:16x | |
| Nvidia GeForce GTX 1080 Ti Founders Edition | |
| Nvidia GeForce GTX 1080 Founders Edition | |
| Alienware 17 R4 | |
| Asus Strix GTX 980 Ti Desktop PC | |
| Eurocom Tornado F5 Killer Edition | |
| Asus Strix GL702VSK | |
| Asus G701VO-CS74K | |
| MSI GS63VR 7RF-228US | |
| Thief - 1920x1080 Very High Preset AA:FXAA & High SS AF:8x | |
| Eurocom Tornado F5 Killer Edition | |
| Alienware 17 R4 | |
| Asus Strix GL702VSK | |
| MSI GS63VR 7RF-228US | |
| Asus G701VO-CS74K | |
| The Witcher 3 - 1920x1080 Ultra Graphics & Postprocessing (HBAO+) | |
| Nvidia GeForce GTX 1080 Ti Founders Edition | |
| Alienware 17 R4 | |
| Nvidia GeForce GTX 1080 Founders Edition | |
| Eurocom Tornado F5 Killer Edition | |
| Asus Strix GTX 980 Ti Desktop PC | |
| Asus Strix GL702VSK | |
| MSI GS63VR 7RF-228US | |
| Batman: Arkham Knight - 1920x1080 High / On AA:SM AF:16x | |
| Alienware 17 R4 | |
| Eurocom Tornado F5 Killer Edition | |
| Asus G701VO-CS74K | |
| MSI GS63VR 7RF-228US | |
| Fallout 4 - 1920x1080 Ultra Preset AA:T AF:16x | |
| Nvidia GeForce GTX 1080 Ti Founders Edition | |
| Nvidia GeForce GTX 1080 Founders Edition | |
| Alienware 17 R4 | |
| Asus Strix GTX 980 Ti Desktop PC | |
| Asus Strix GL702VSK | |
| Asus G701VO-CS74K | |
| MSI GS63VR 7RF-228US | |
| Ashes of the Singularity - 1920x1080 high | |
| Nvidia GeForce GTX 1080 Ti Founders Edition | |
| Asus Strix GTX 980 Ti Desktop PC | |
| Alienware 17 R4 | |
| Eurocom Tornado F5 Killer Edition | |
| Asus Strix GL702VSK | |
| Doom - 1920x1080 Ultra Preset AA:SM | |
| Nvidia GeForce GTX 1080 Ti Founders Edition | |
| Nvidia GeForce GTX 1080 Ti Founders Edition | |
| Alienware 17 R4 | |
| Nvidia GeForce GTX 1080 Founders Edition | |
| Asus Strix GTX 980 Ti Desktop PC | |
| Asus Strix GL702VSK | |
| MSI GS63VR 7RF-228US | |
| Asus G701VO-CS74K | |
| Overwatch - 1920x1080 Epic (Render Scale 100 %) AA:SM AF:16x | |
| Nvidia GeForce GTX 1080 Ti Founders Edition | |
| Nvidia GeForce GTX 1080 Founders Edition | |
| Alienware 17 R4 | |
| Asus Strix GTX 980 Ti Desktop PC | |
| Asus G701VO-CS74K | |
| MSI GS63VR 7RF-228US | |
| Mafia 3 - 1920x1080 High Preset | |
| Eurocom Tornado F5 Killer Edition | |
| Nvidia GeForce GTX 1080 Ti Founders Edition | |
| Alienware 17 R4 | |
| Nvidia GeForce GTX 1080 Founders Edition | |
| Asus Strix GL702VSK | |
| Asus Strix GTX 980 Ti Desktop PC | |
| MSI GS63VR 7RF-228US | |
| 3DMark 11 Performance | 19125 points | |
| 3DMark Ice Storm Standard Score | 171837 points | |
| 3DMark Cloud Gate Standard Score | 32871 points | |
| 3DMark Fire Strike Score | 16931 points | |
| 3DMark Fire Strike Extreme Score | 9422 points | |
Help | ||
| low | med. | high | ultra | |
|---|---|---|---|---|
| BioShock Infinite (2013) | 162.9 | |||
| Metro: Last Light (2013) | 132.2 | |||
| Thief (2014) | 107.2 | |||
| The Witcher 3 (2015) | 78.1 | |||
| Batman: Arkham Knight (2015) | 93 | |||
| Metal Gear Solid V (2015) | 60 | |||
| Dota 2 Reborn (2015) | 119.9 | |||
| Fallout 4 (2015) | 120.7 | |||
| Rise of the Tomb Raider (2016) | 118.3 | |||
| Ashes of the Singularity (2016) | 66.5 | |||
| Doom (2016) | 140.1 | |||
| Overwatch (2016) | 188 | |||
| Mafia 3 (2016) | 72.5 |
Noise level
| Idle |
| 35.6 / 35.6 / 35.7 dB(A) |
| HDD |
| 35.7 dB(A) |
| Load |
| 50.2 / 50.2 dB(A) |
 | ||
30 dB silent 40 dB(A) audible 50 dB(A) loud |
||
min: | ||
| Alienware 17 R4 GeForce GTX 1080 Mobile, i7-7820HK, SK Hynix PC300 NVMe 512 GB | Alienware 17 R3 (A17-9935) GeForce GTX 980M, 6700HQ, Samsung PM951 NVMe 512 GB | MSI GT72VR 7RE-433 GeForce GTX 1070 Mobile, i7-7700HQ, Kingston RBU-SNS8152S3256GG5 | MSI GT73VR 7RF-296 GeForce GTX 1080 Mobile, i7-7820HK, 2x Samsung SM951 MZVPV256HDGL (RAID 0) | Acer Predator 17 X GX-792-76DL GeForce GTX 1080 Mobile, i7-7820HK, Toshiba NVMe THNSN5512GPU7 | Aorus X7 DT v6 GeForce GTX 1080 Mobile, 6820HK, Samsung SM951 MZVPV512HDGL m.2 PCI-e | |
|---|---|---|---|---|---|---|
| Noise | 8% | 5% | 1% | 3% | -1% | |
| off / environment * (dB) | 28.2 | 30 -6% | 31 -10% | 30 -6% | 30 -6% | 28.6 -1% |
| Idle Minimum * (dB) | 35.6 | 31 13% | 34 4% | 34 4% | 33 7% | 32.2 10% |
| Idle Average * (dB) | 35.6 | 32 10% | 35 2% | 35 2% | 35 2% | 35.2 1% |
| Idle Maximum * (dB) | 35.7 | 33 8% | 37 -4% | 37 -4% | 37 -4% | 35.2 1% |
| Load Average * (dB) | 50.2 | 38 24% | 37 26% | 39 22% | 40 20% | 51.7 -3% |
| Witcher 3 ultra * (dB) | 50.2 | |||||
| Load Maximum * (dB) | 50.2 | 50 -0% | 44 12% | 56 -12% | 50 -0% | 55.7 -11% |
* ... smaller is better
(-) The maximum temperature on the upper side is 49.6 °C / 121 F, compared to the average of 40.4 °C / 105 F, ranging from 21.2 to 68.8 °C for the class Gaming.
(-) The bottom heats up to a maximum of 56 °C / 133 F, compared to the average of 43.2 °C / 110 F
(+) In idle usage, the average temperature for the upper side is 27.5 °C / 82 F, compared to the device average of 33.9 °C / 93 F.
(±) Playing The Witcher 3, the average temperature for the upper side is 37.2 °C / 99 F, compared to the device average of 33.9 °C / 93 F.
(+) The palmrests and touchpad are cooler than skin temperature with a maximum of 27.4 °C / 81.3 F and are therefore cool to the touch.
(±) The average temperature of the palmrest area of similar devices was 28.8 °C / 83.8 F (+1.4 °C / 2.5 F).
Alienware 17 R4 audio analysis
(±) | speaker loudness is average but good (75 dB)
Bass 100 - 315 Hz
(-) | nearly no bass - on average 15.3% lower than median
(±) | linearity of bass is average (9.6% delta to prev. frequency)
Mids 400 - 2000 Hz
(±) | higher mids - on average 5.5% higher than median
(±) | linearity of mids is average (8.9% delta to prev. frequency)
Highs 2 - 16 kHz
(±) | higher highs - on average 5.1% higher than median
(±) | linearity of highs is average (9.7% delta to prev. frequency)
Overall 100 - 16.000 Hz
(±) | linearity of overall sound is average (22.4% difference to median)
Compared to same class
» 80% of all tested devices in this class were better, 6% similar, 14% worse
» The best had a delta of 6%, average was 18%, worst was 132%
Compared to all devices tested
» 66% of all tested devices were better, 6% similar, 29% worse
» The best had a delta of 4%, average was 23%, worst was 134%
Apple MacBook 12 (Early 2016) 1.1 GHz audio analysis
(+) | speakers can play relatively loud (83.6 dB)
Bass 100 - 315 Hz
(±) | reduced bass - on average 11.3% lower than median
(±) | linearity of bass is average (14.2% delta to prev. frequency)
Mids 400 - 2000 Hz
(+) | balanced mids - only 2.4% away from median
(+) | mids are linear (5.5% delta to prev. frequency)
Highs 2 - 16 kHz
(+) | balanced highs - only 2% away from median
(+) | highs are linear (4.5% delta to prev. frequency)
Overall 100 - 16.000 Hz
(+) | overall sound is linear (10.2% difference to median)
Compared to same class
» 7% of all tested devices in this class were better, 2% similar, 90% worse
» The best had a delta of 5%, average was 18%, worst was 53%
Compared to all devices tested
» 5% of all tested devices were better, 1% similar, 94% worse
» The best had a delta of 4%, average was 23%, worst was 134%
| Off / Standby | |
| Idle | |
| Load |
|
Key:
min: | |
| Alienware 17 R4 i7-7820HK, GeForce GTX 1080 Mobile, SK Hynix PC300 NVMe 512 GB, TN LED, 2560x1440, 17.3" | Alienware 17 R3 (A17-9935) 6700HQ, GeForce GTX 980M, Samsung PM951 NVMe 512 GB, IPS, 1920x1080, 17.3" | MSI GT73VR 7RF-296 i7-7820HK, GeForce GTX 1080 Mobile, 2x Samsung SM951 MZVPV256HDGL (RAID 0), TN LED, 1920x1080, 17.3" | Acer Predator 17 X GX-792-76DL i7-7820HK, GeForce GTX 1080 Mobile, Toshiba NVMe THNSN5512GPU7, IPS, 1920x1080, 17.3" | Aorus X7 DT v6 6820HK, GeForce GTX 1080 Mobile, Samsung SM951 MZVPV512HDGL m.2 PCI-e, TN LED, 2560x1440, 17.3" | |
|---|---|---|---|---|---|
| Power Consumption | 41% | 7% | 12% | -5% | |
| Idle Minimum * (Watt) | 37.5 | 12 68% | 29 23% | 27 28% | 31.5 16% |
| Idle Average * (Watt) | 37.6 | 18 52% | 35 7% | 32 15% | 33.9 10% |
| Idle Maximum * (Watt) | 37.6 | 26 31% | 40 -6% | 41 -9% | 34.6 8% |
| Load Average * (Watt) | 122.4 | 95 22% | 94 23% | 102 17% | 205.6 -68% |
| Witcher 3 ultra * (Watt) | 180.3 | ||||
| Load Maximum * (Watt) | 277.4 | 188 32% | 315 -14% | 248 11% | 250.8 10% |
* ... smaller is better
| Alienware 17 R4 i7-7820HK, GeForce GTX 1080 Mobile, 99 Wh | Alienware 17 R3 (A17-9935) 6700HQ, GeForce GTX 980M, 92 Wh | MSI GT73VR 7RF-296 i7-7820HK, GeForce GTX 1080 Mobile, 75.2 Wh | Acer Predator 17 X GX-792-76DL i7-7820HK, GeForce GTX 1080 Mobile, 88.8 Wh | Aorus X7 DT v6 6820HK, GeForce GTX 1080 Mobile, 94 Wh | |
|---|---|---|---|---|---|
| Battery runtime | 124% | -10% | 26% | -7% | |
| Reader / Idle (h) | 4.6 | 12.6 174% | 5.2 13% | 3 -35% | |
| WiFi v1.3 (h) | 3 | 7.4 147% | 2.7 -10% | 4.2 40% | 2.4 -20% |
| Load (h) | 1.2 | 1.8 50% | 1.5 25% | 1.6 33% |
Pros
Cons
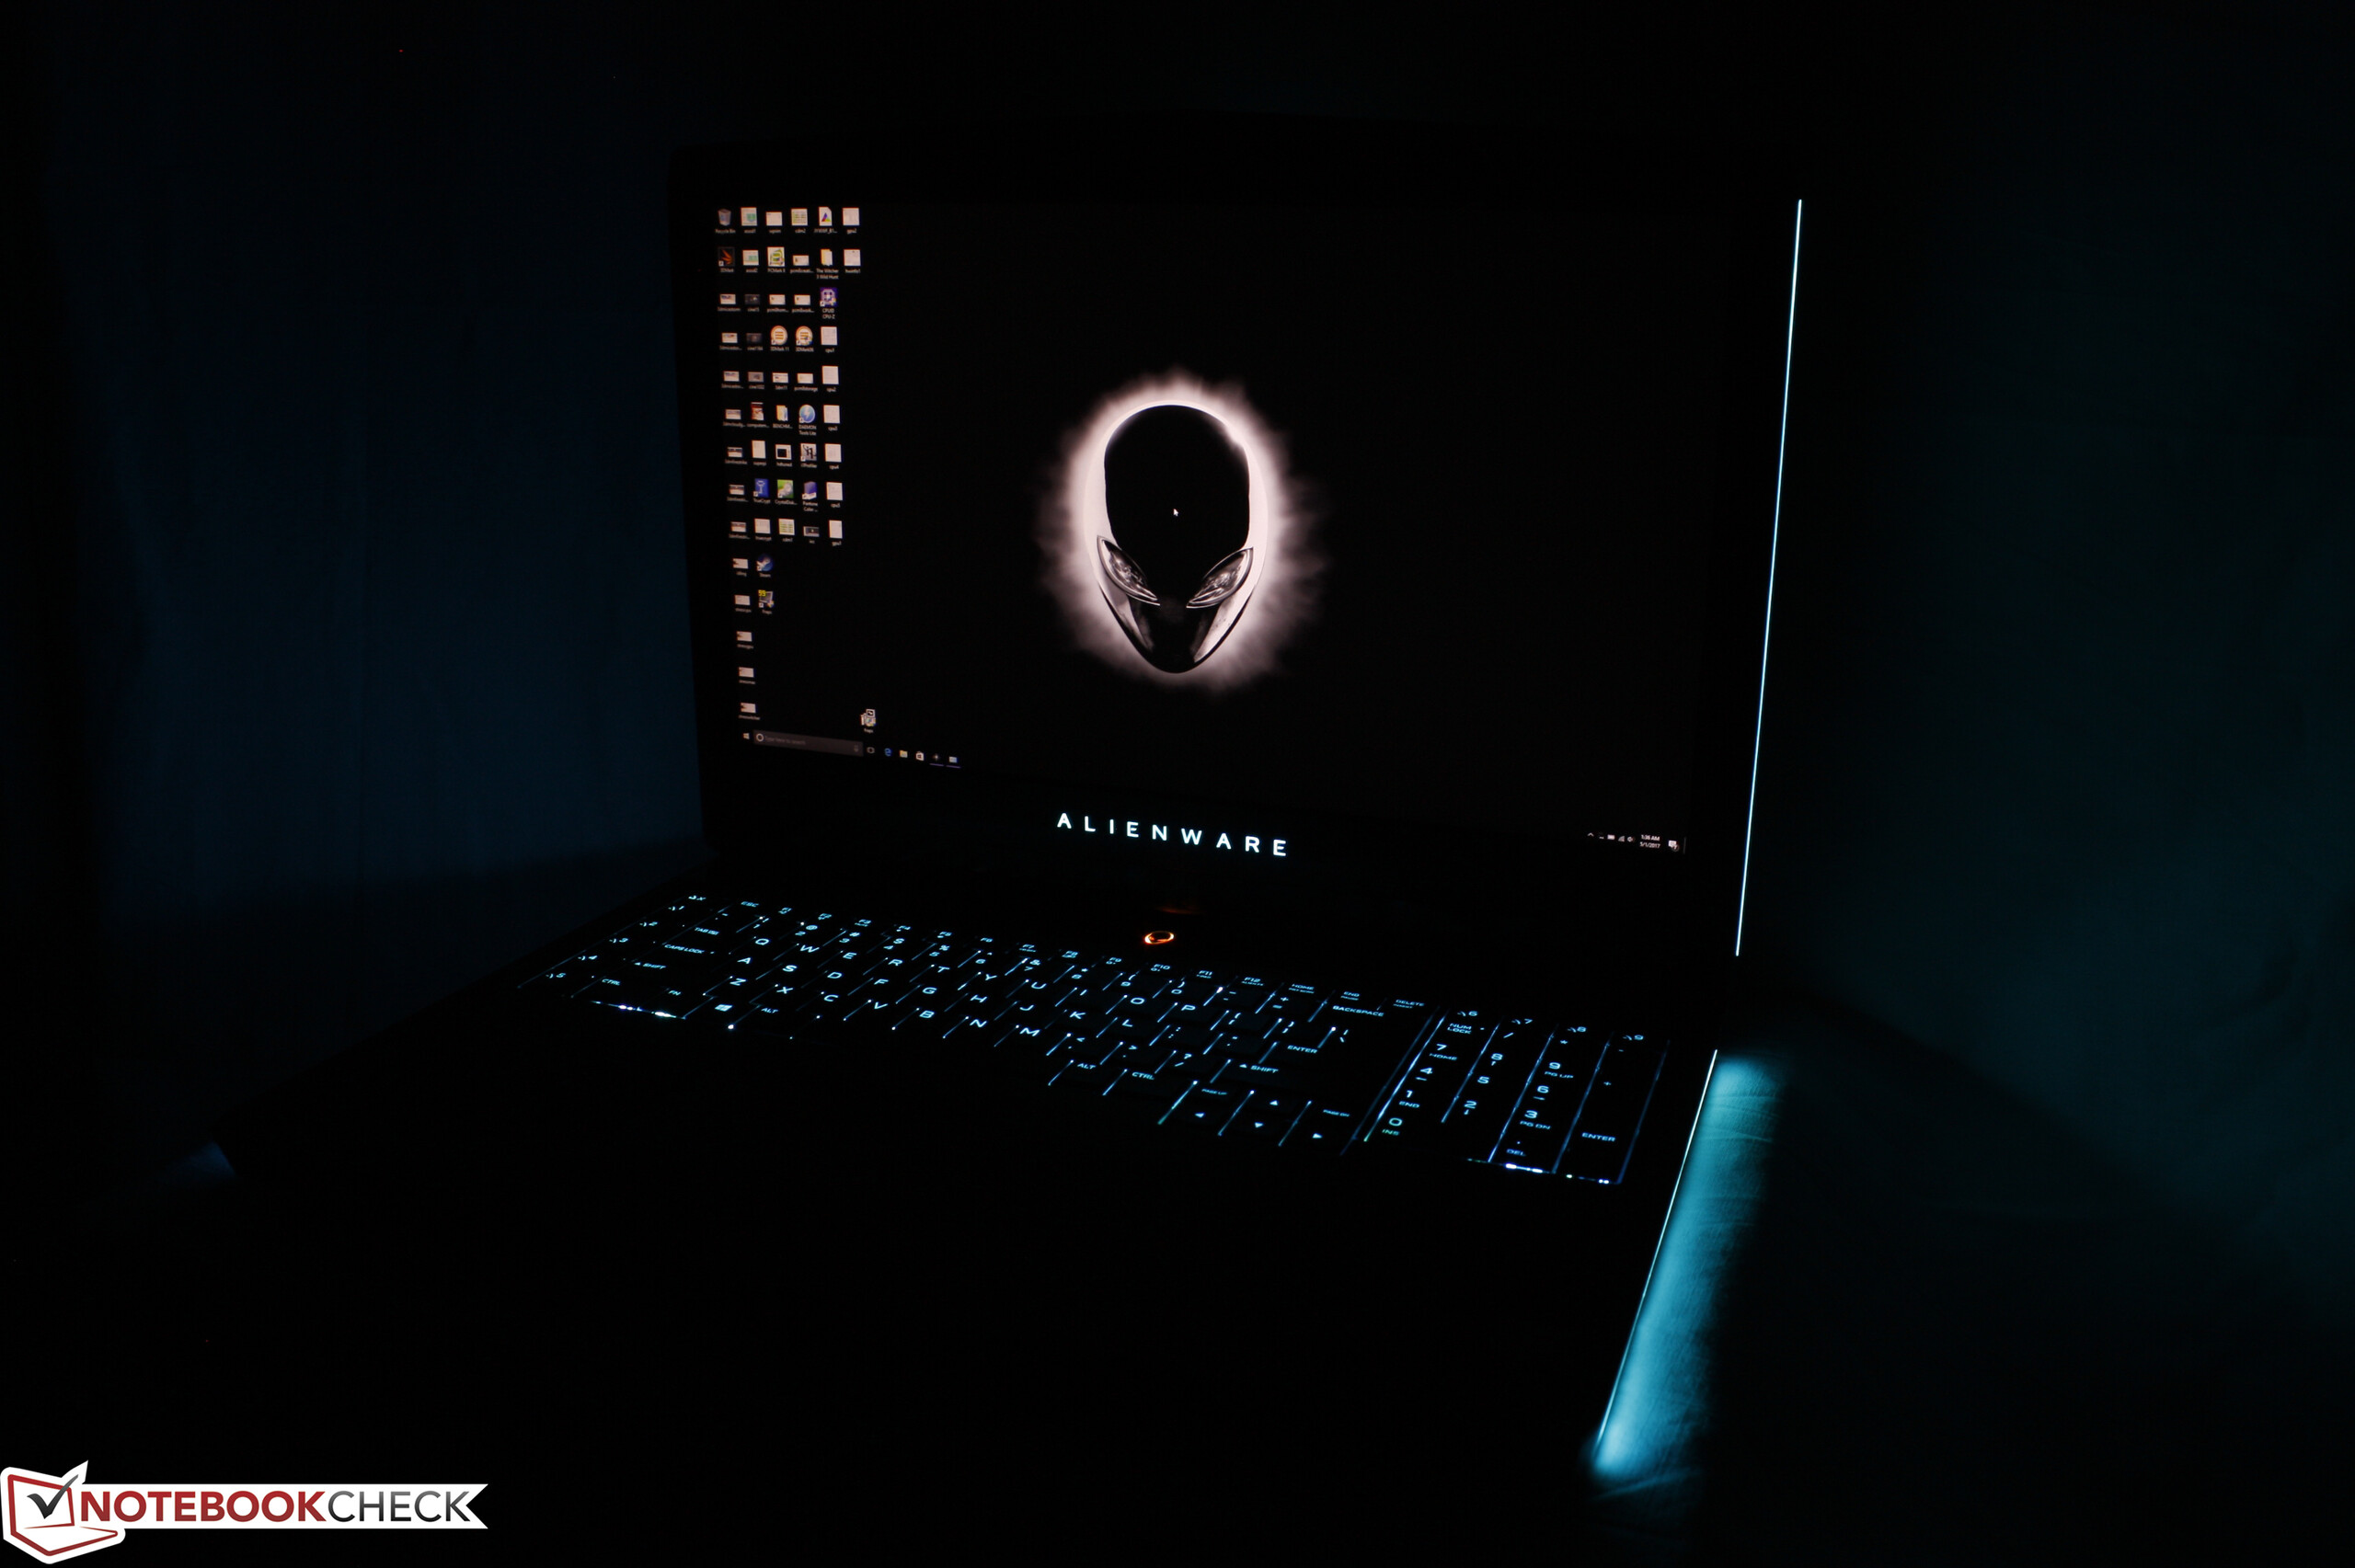
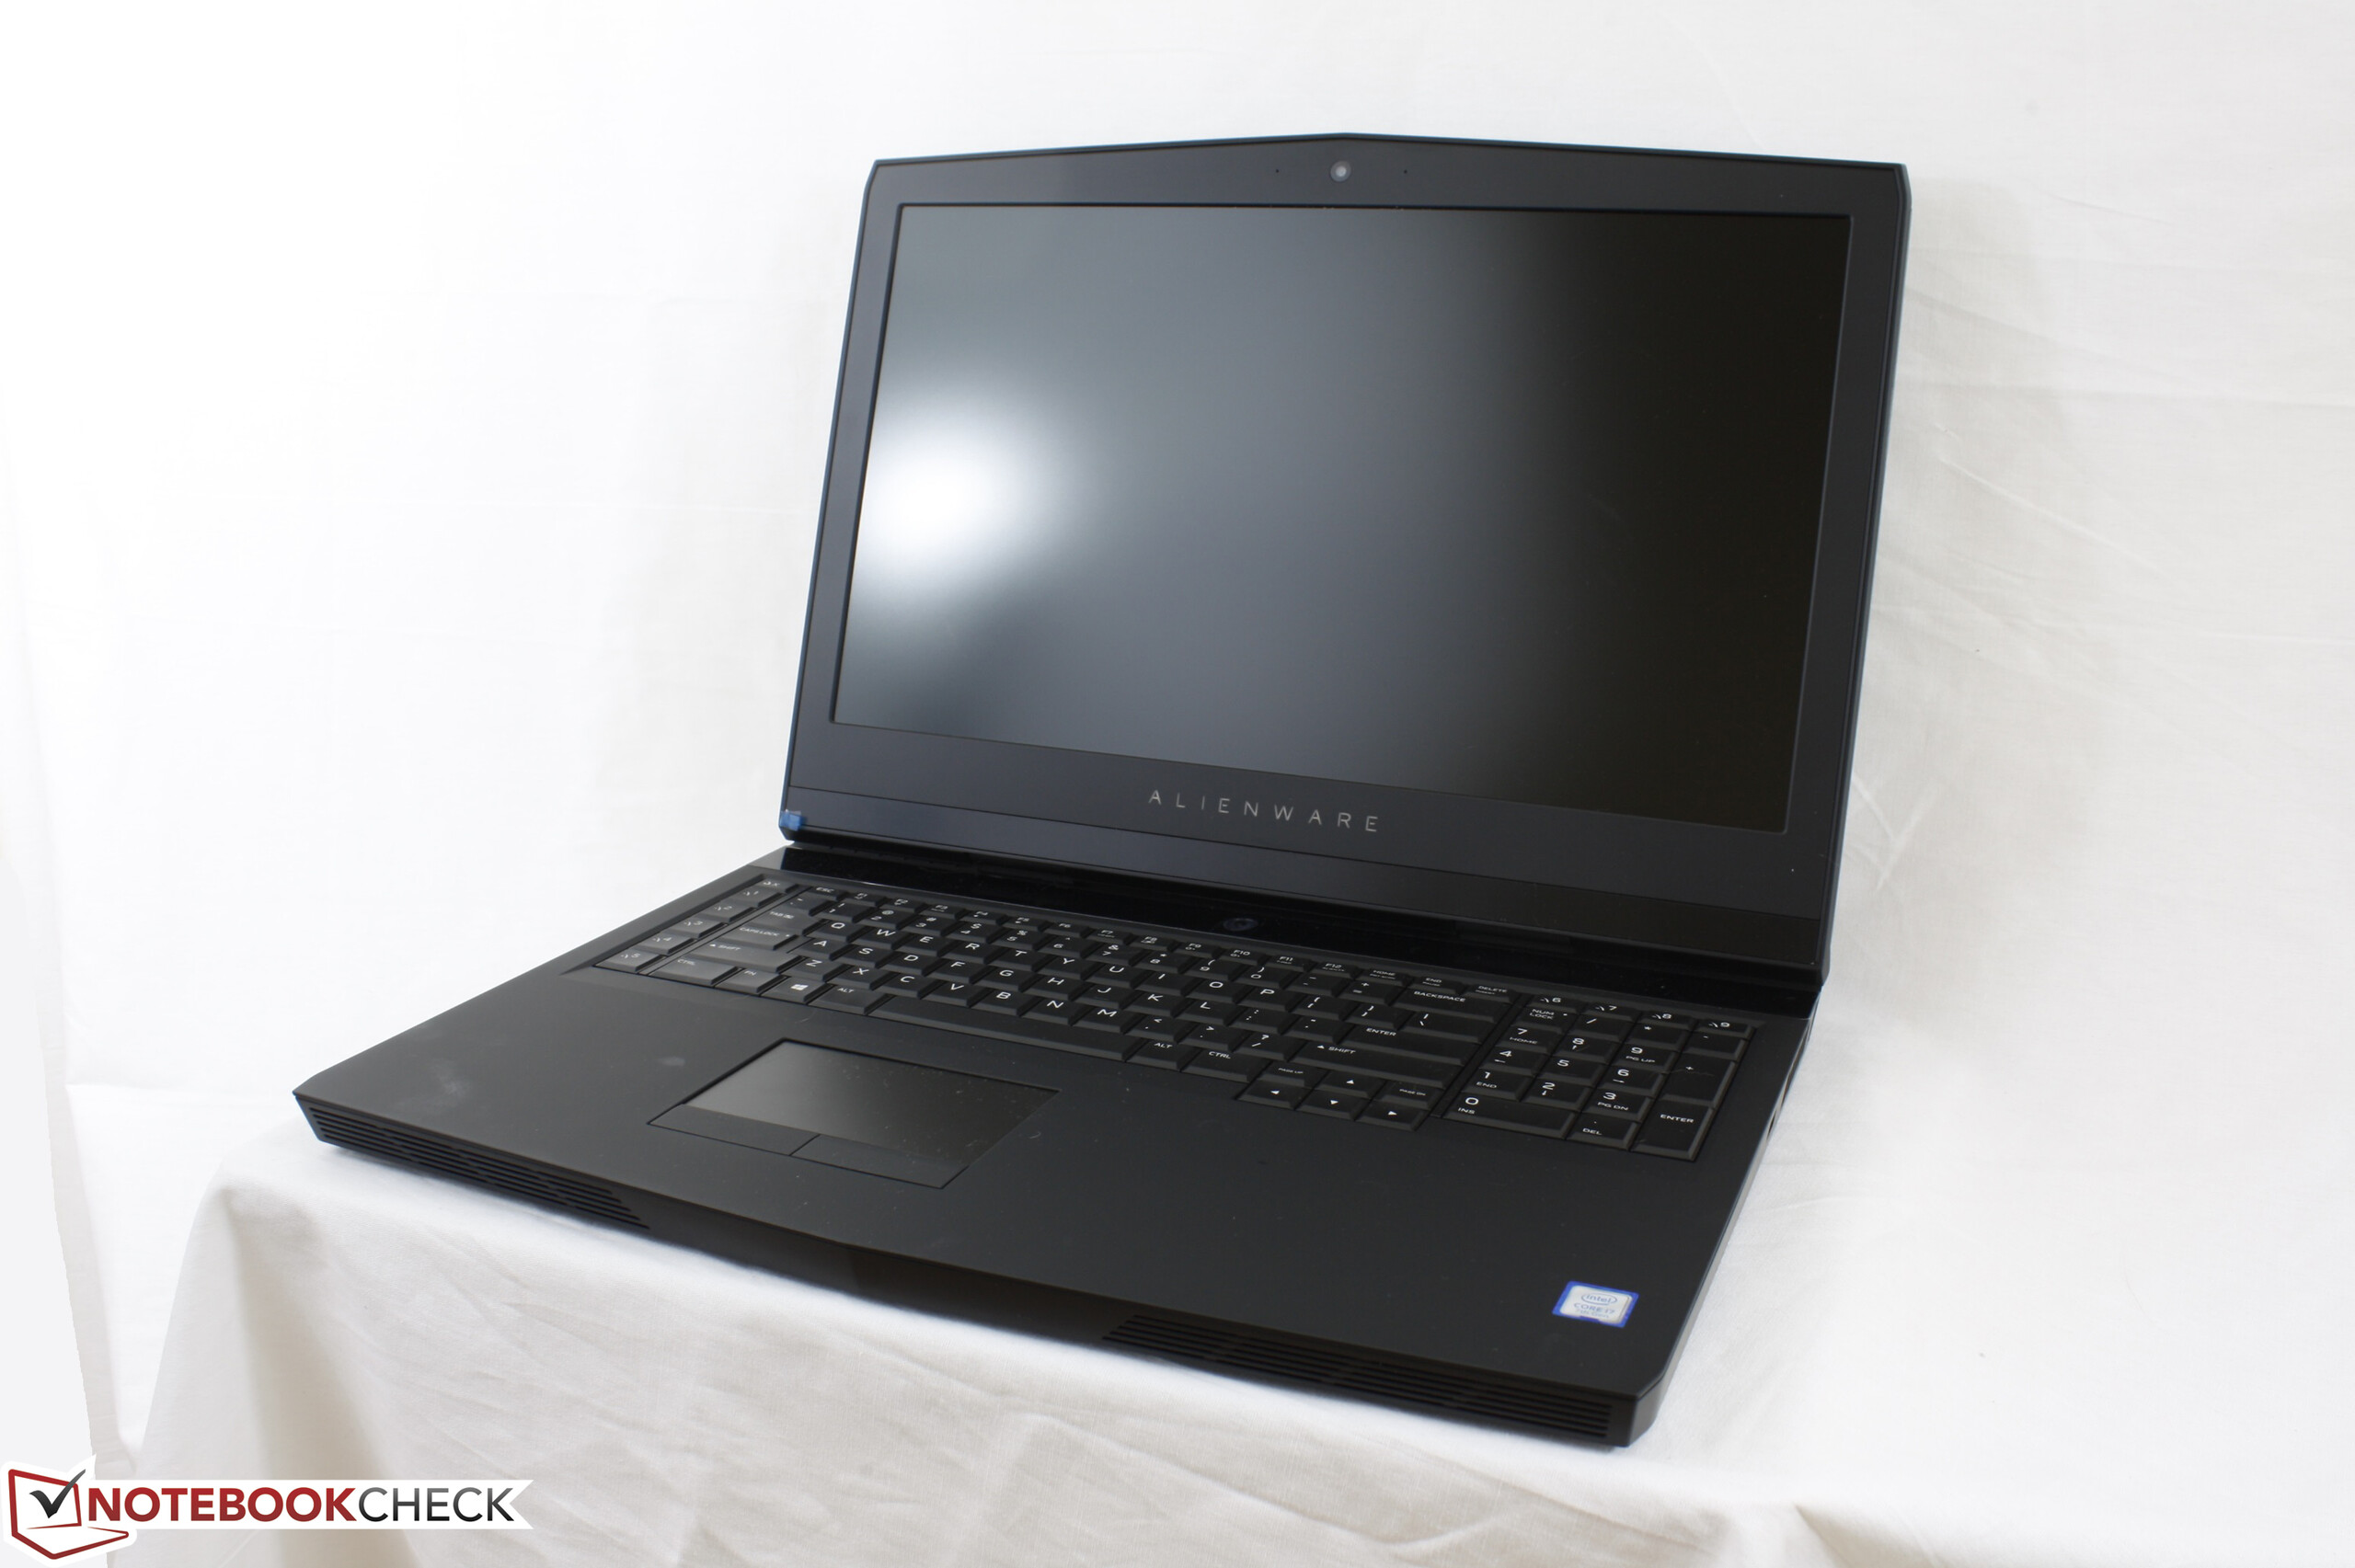
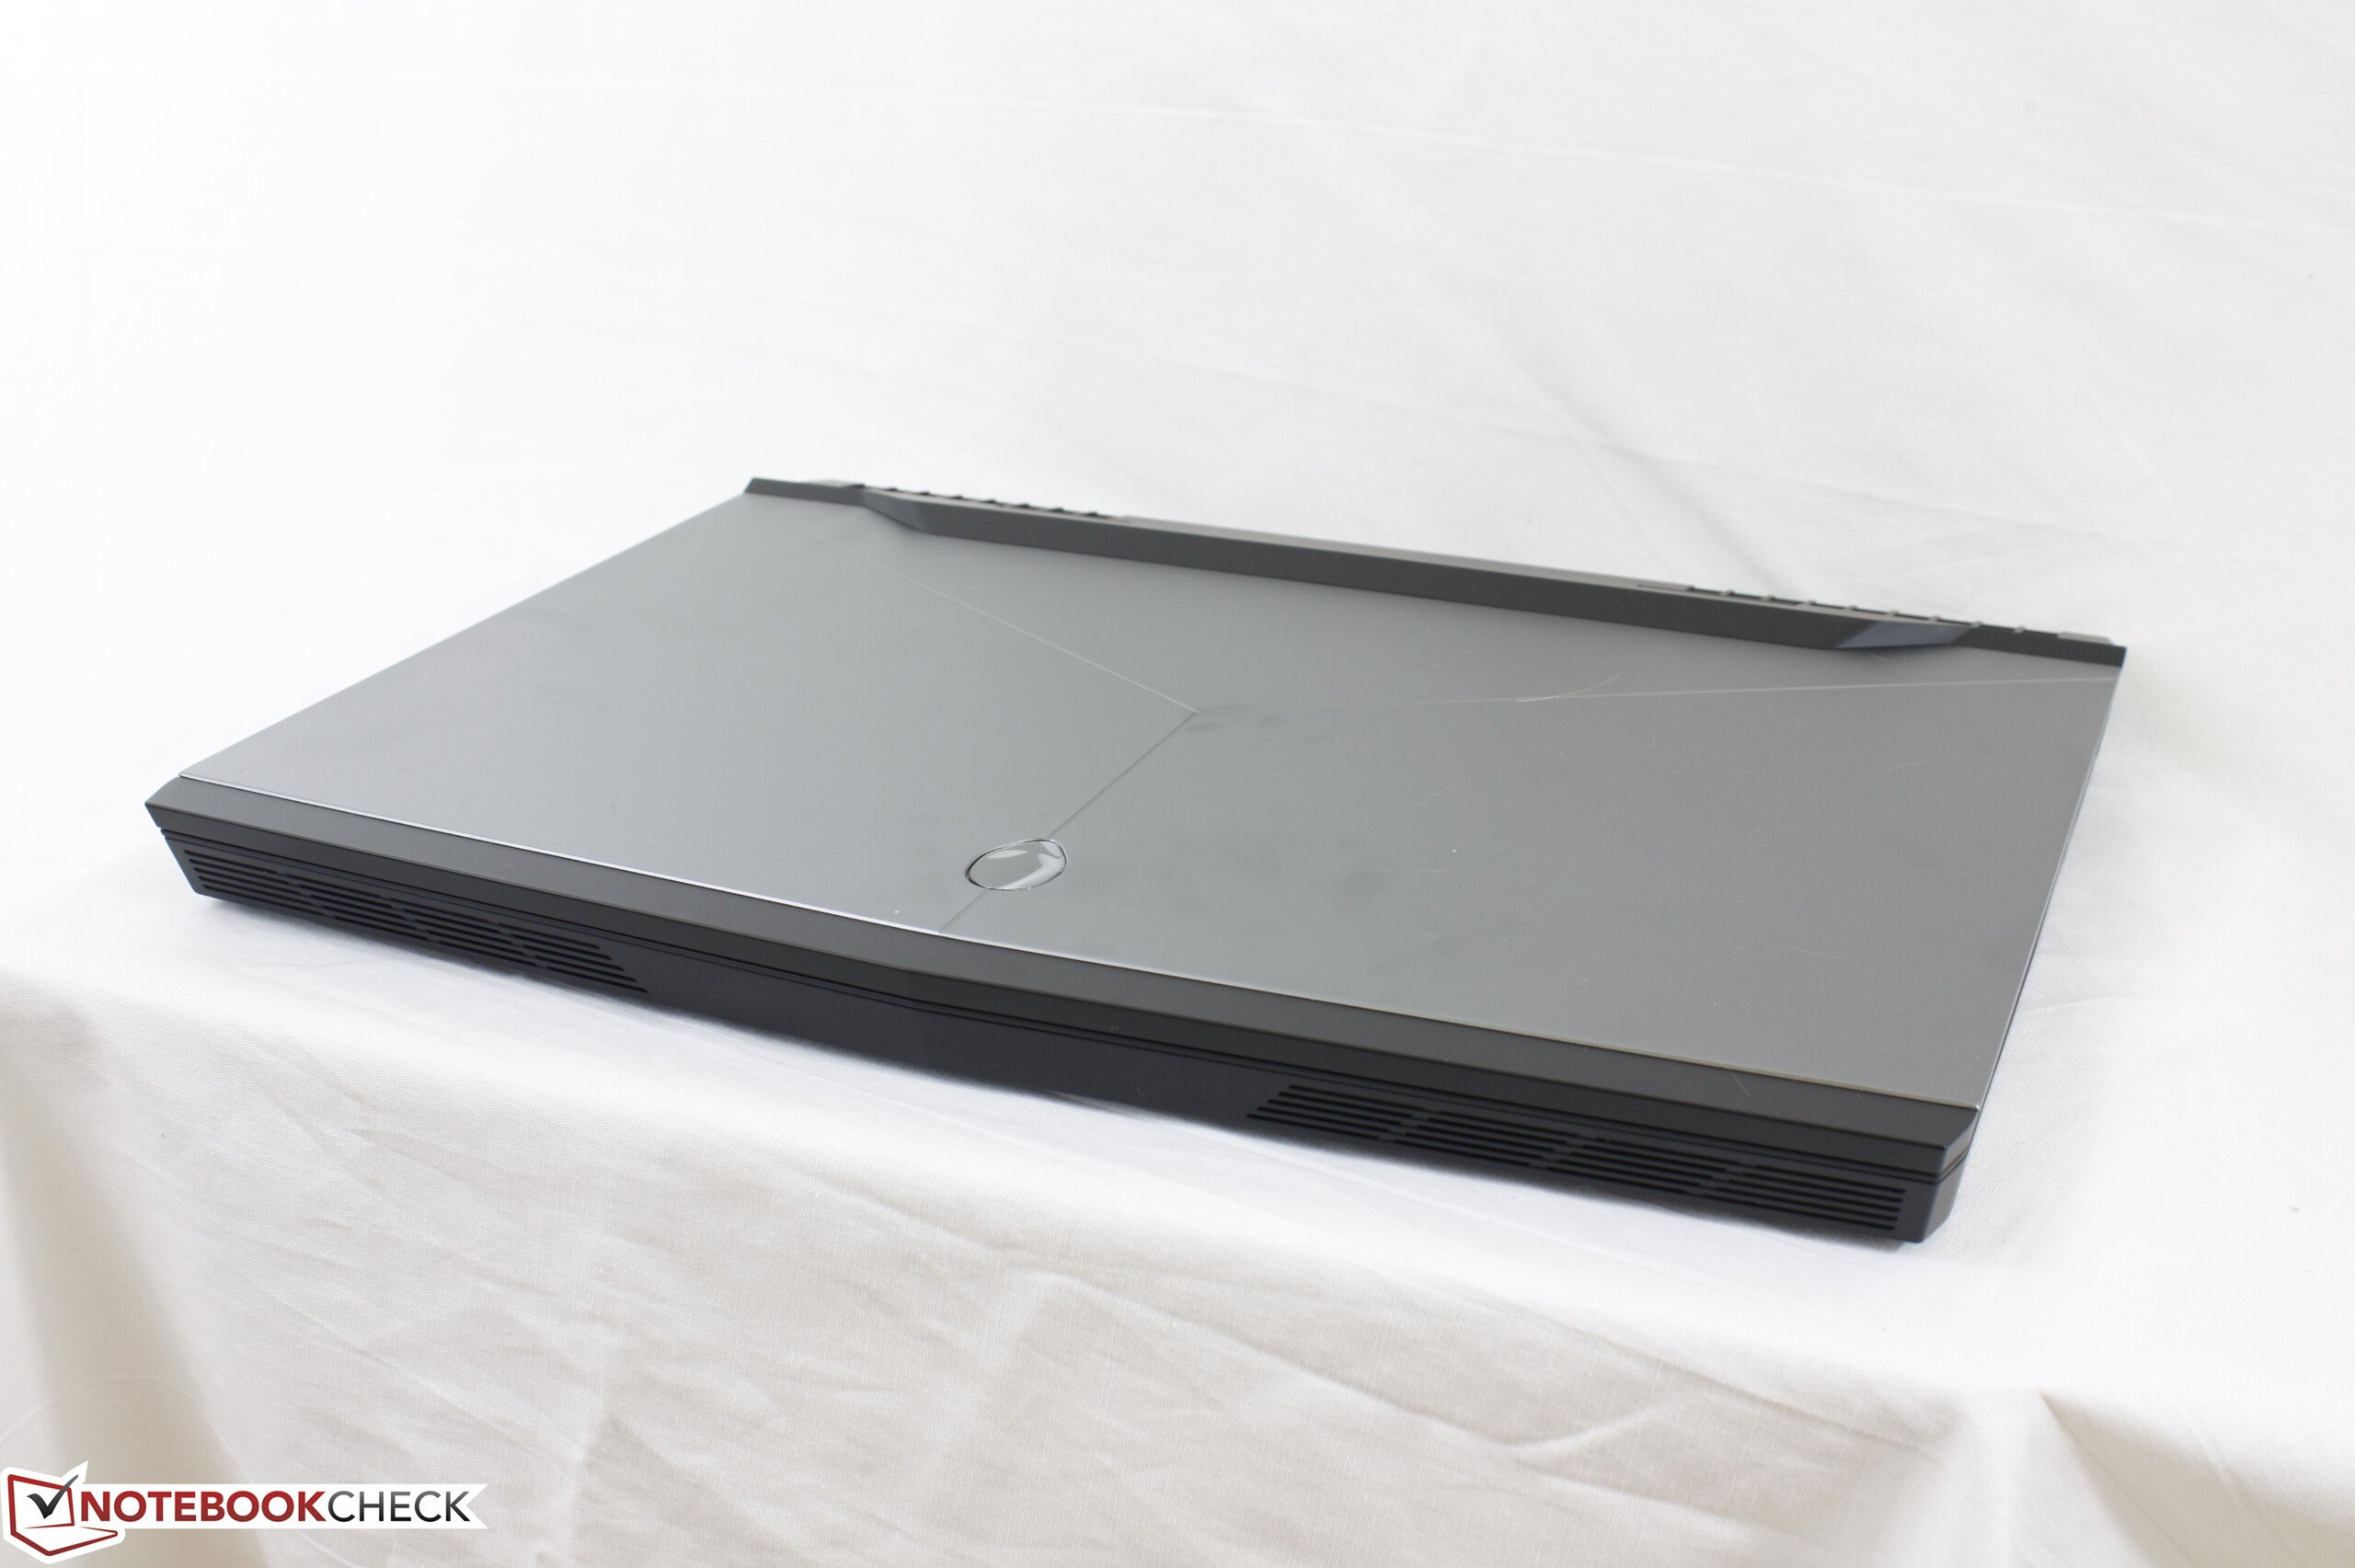
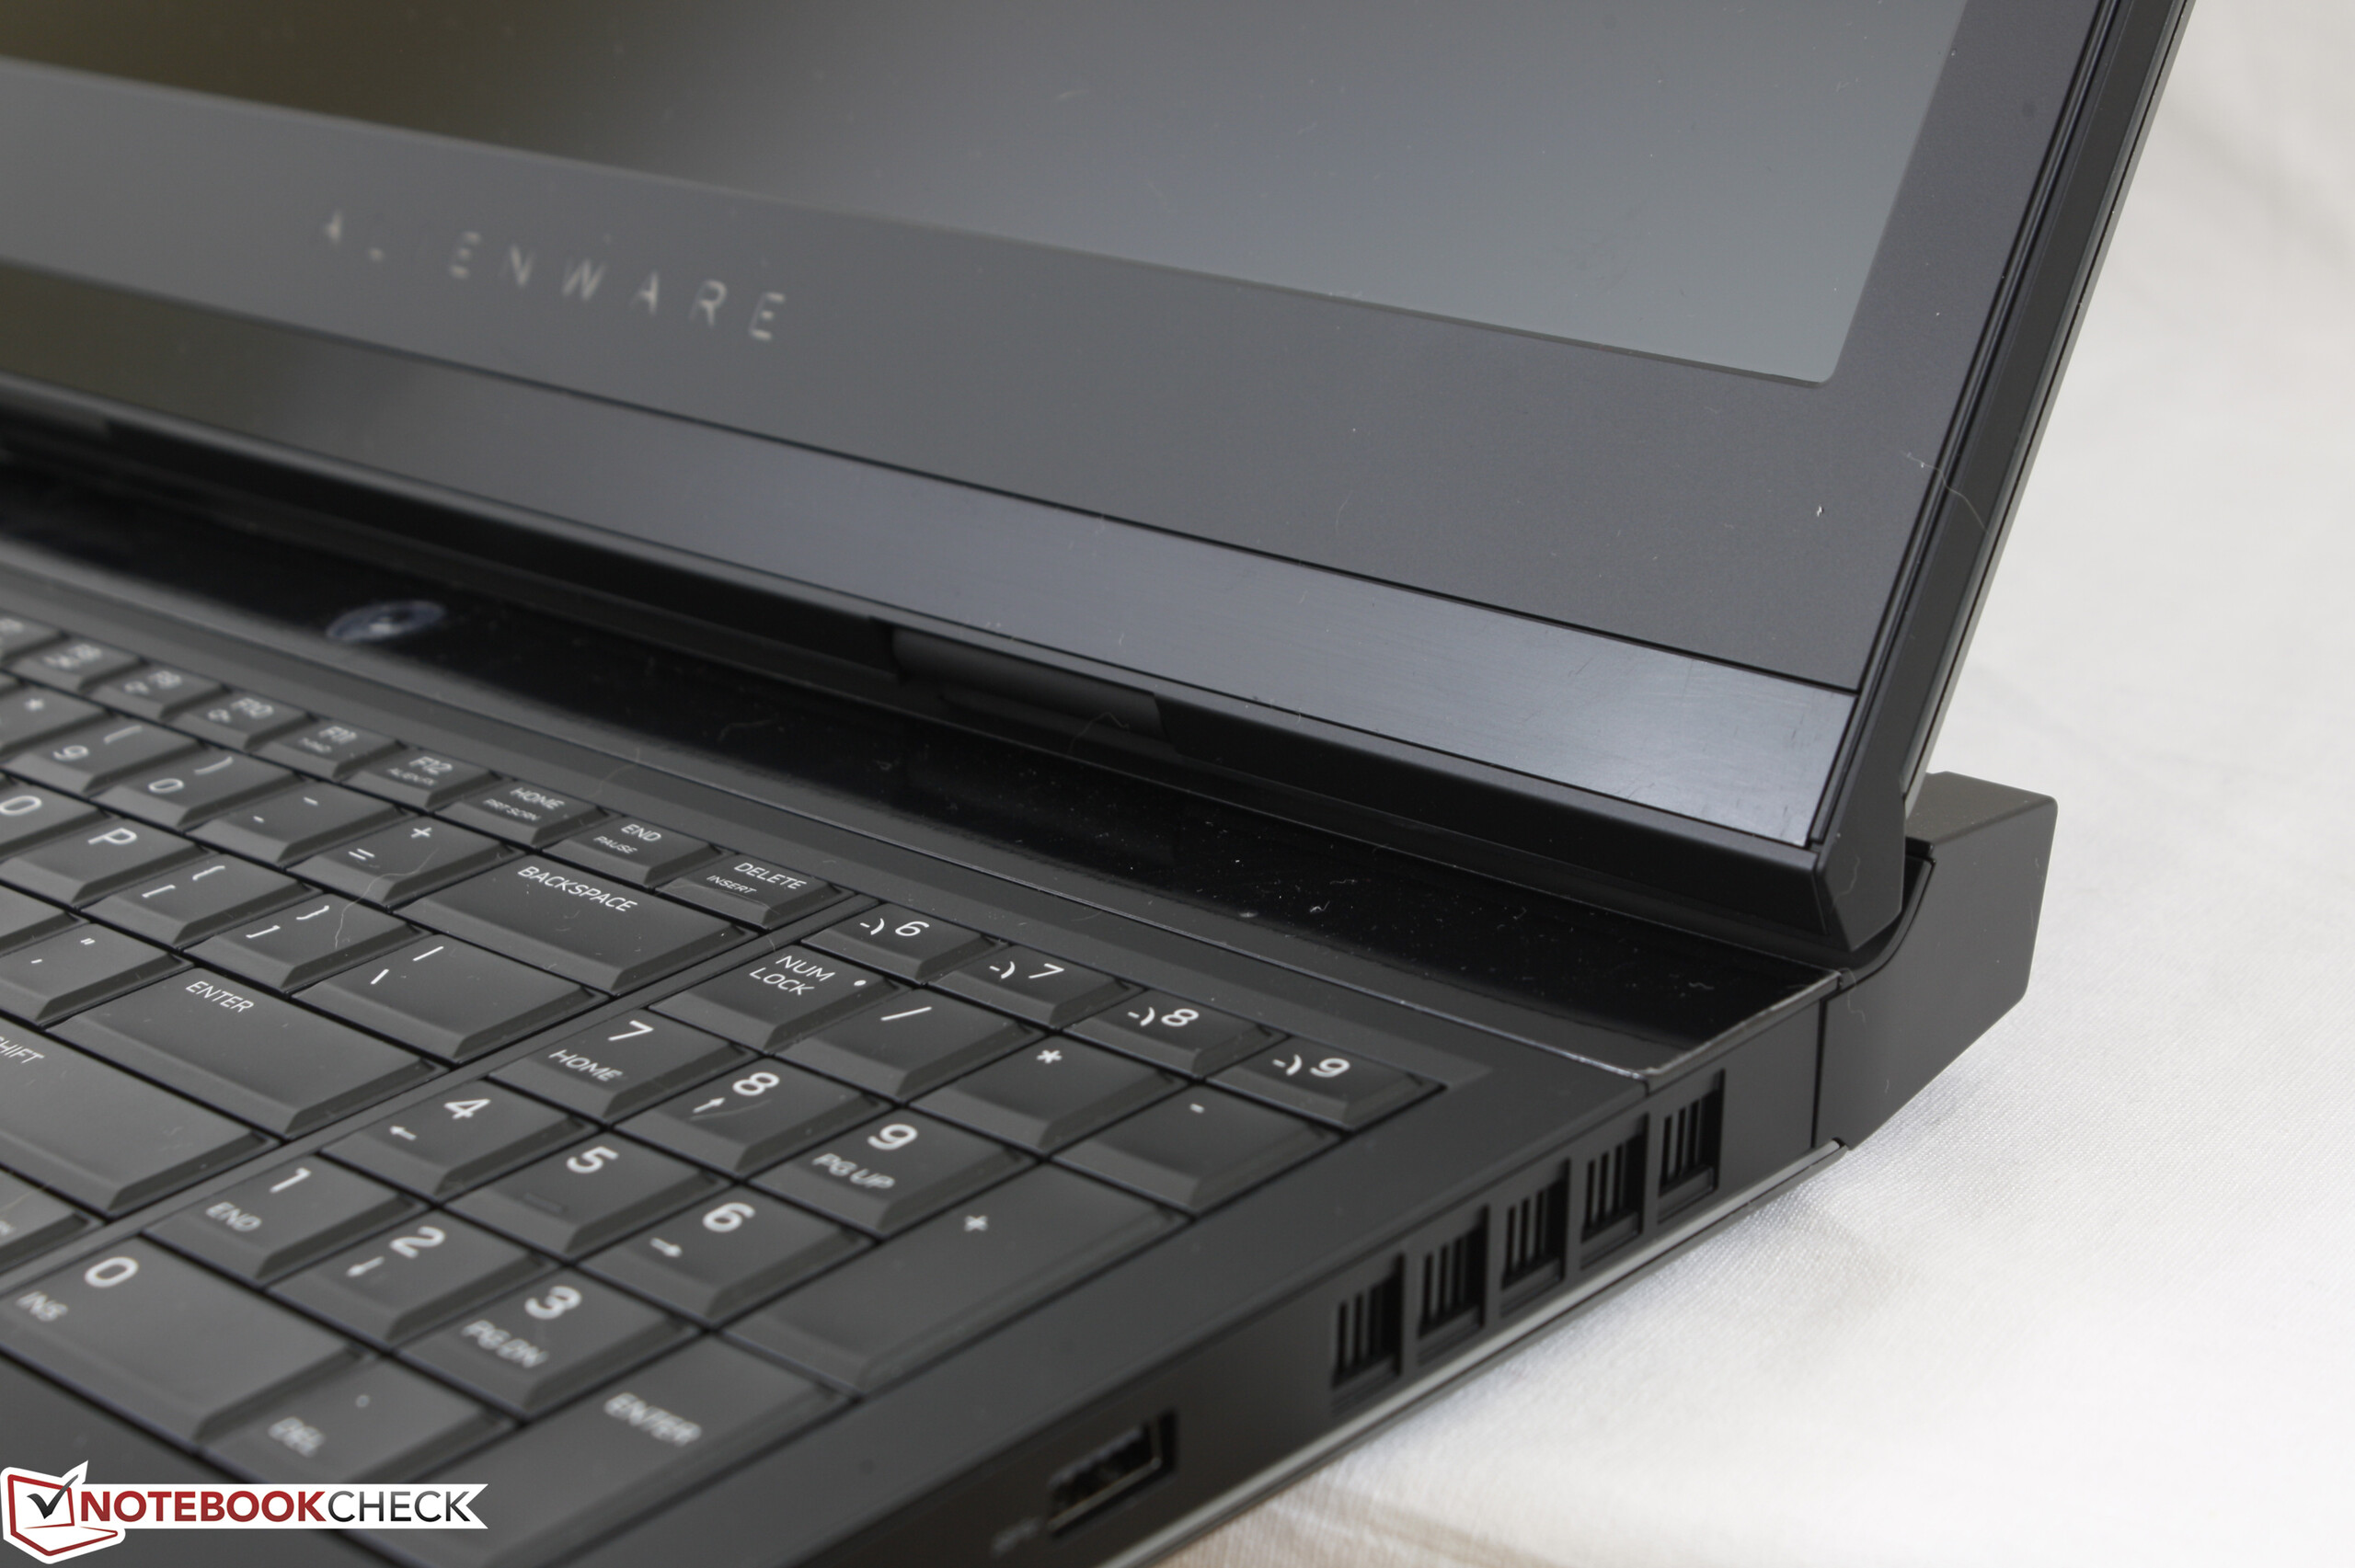
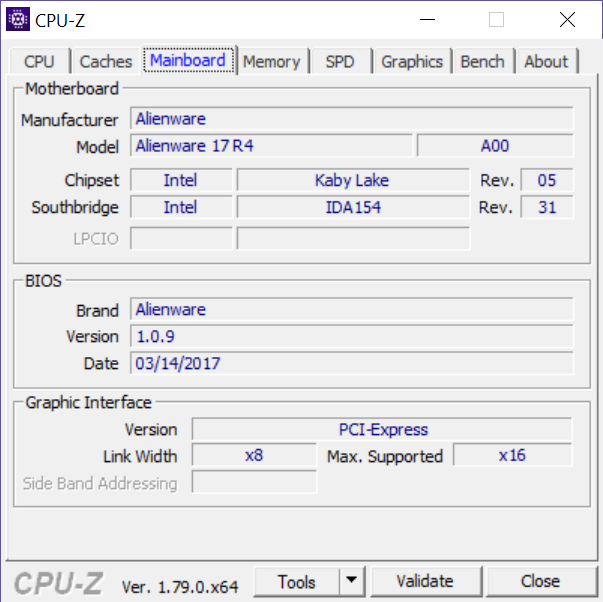
外星人 17系列的质量标准很高,在最新的这次迭代也没有让人失望。一台优秀的笔记本,不仅仅是取决于处理器和显卡的配置,还包括能强化了核心硬件的骨架与设计。在这个层面上,与17英寸的Aorus或先前的微星 GT72对比,我们更倾向于推荐最新的外星人。
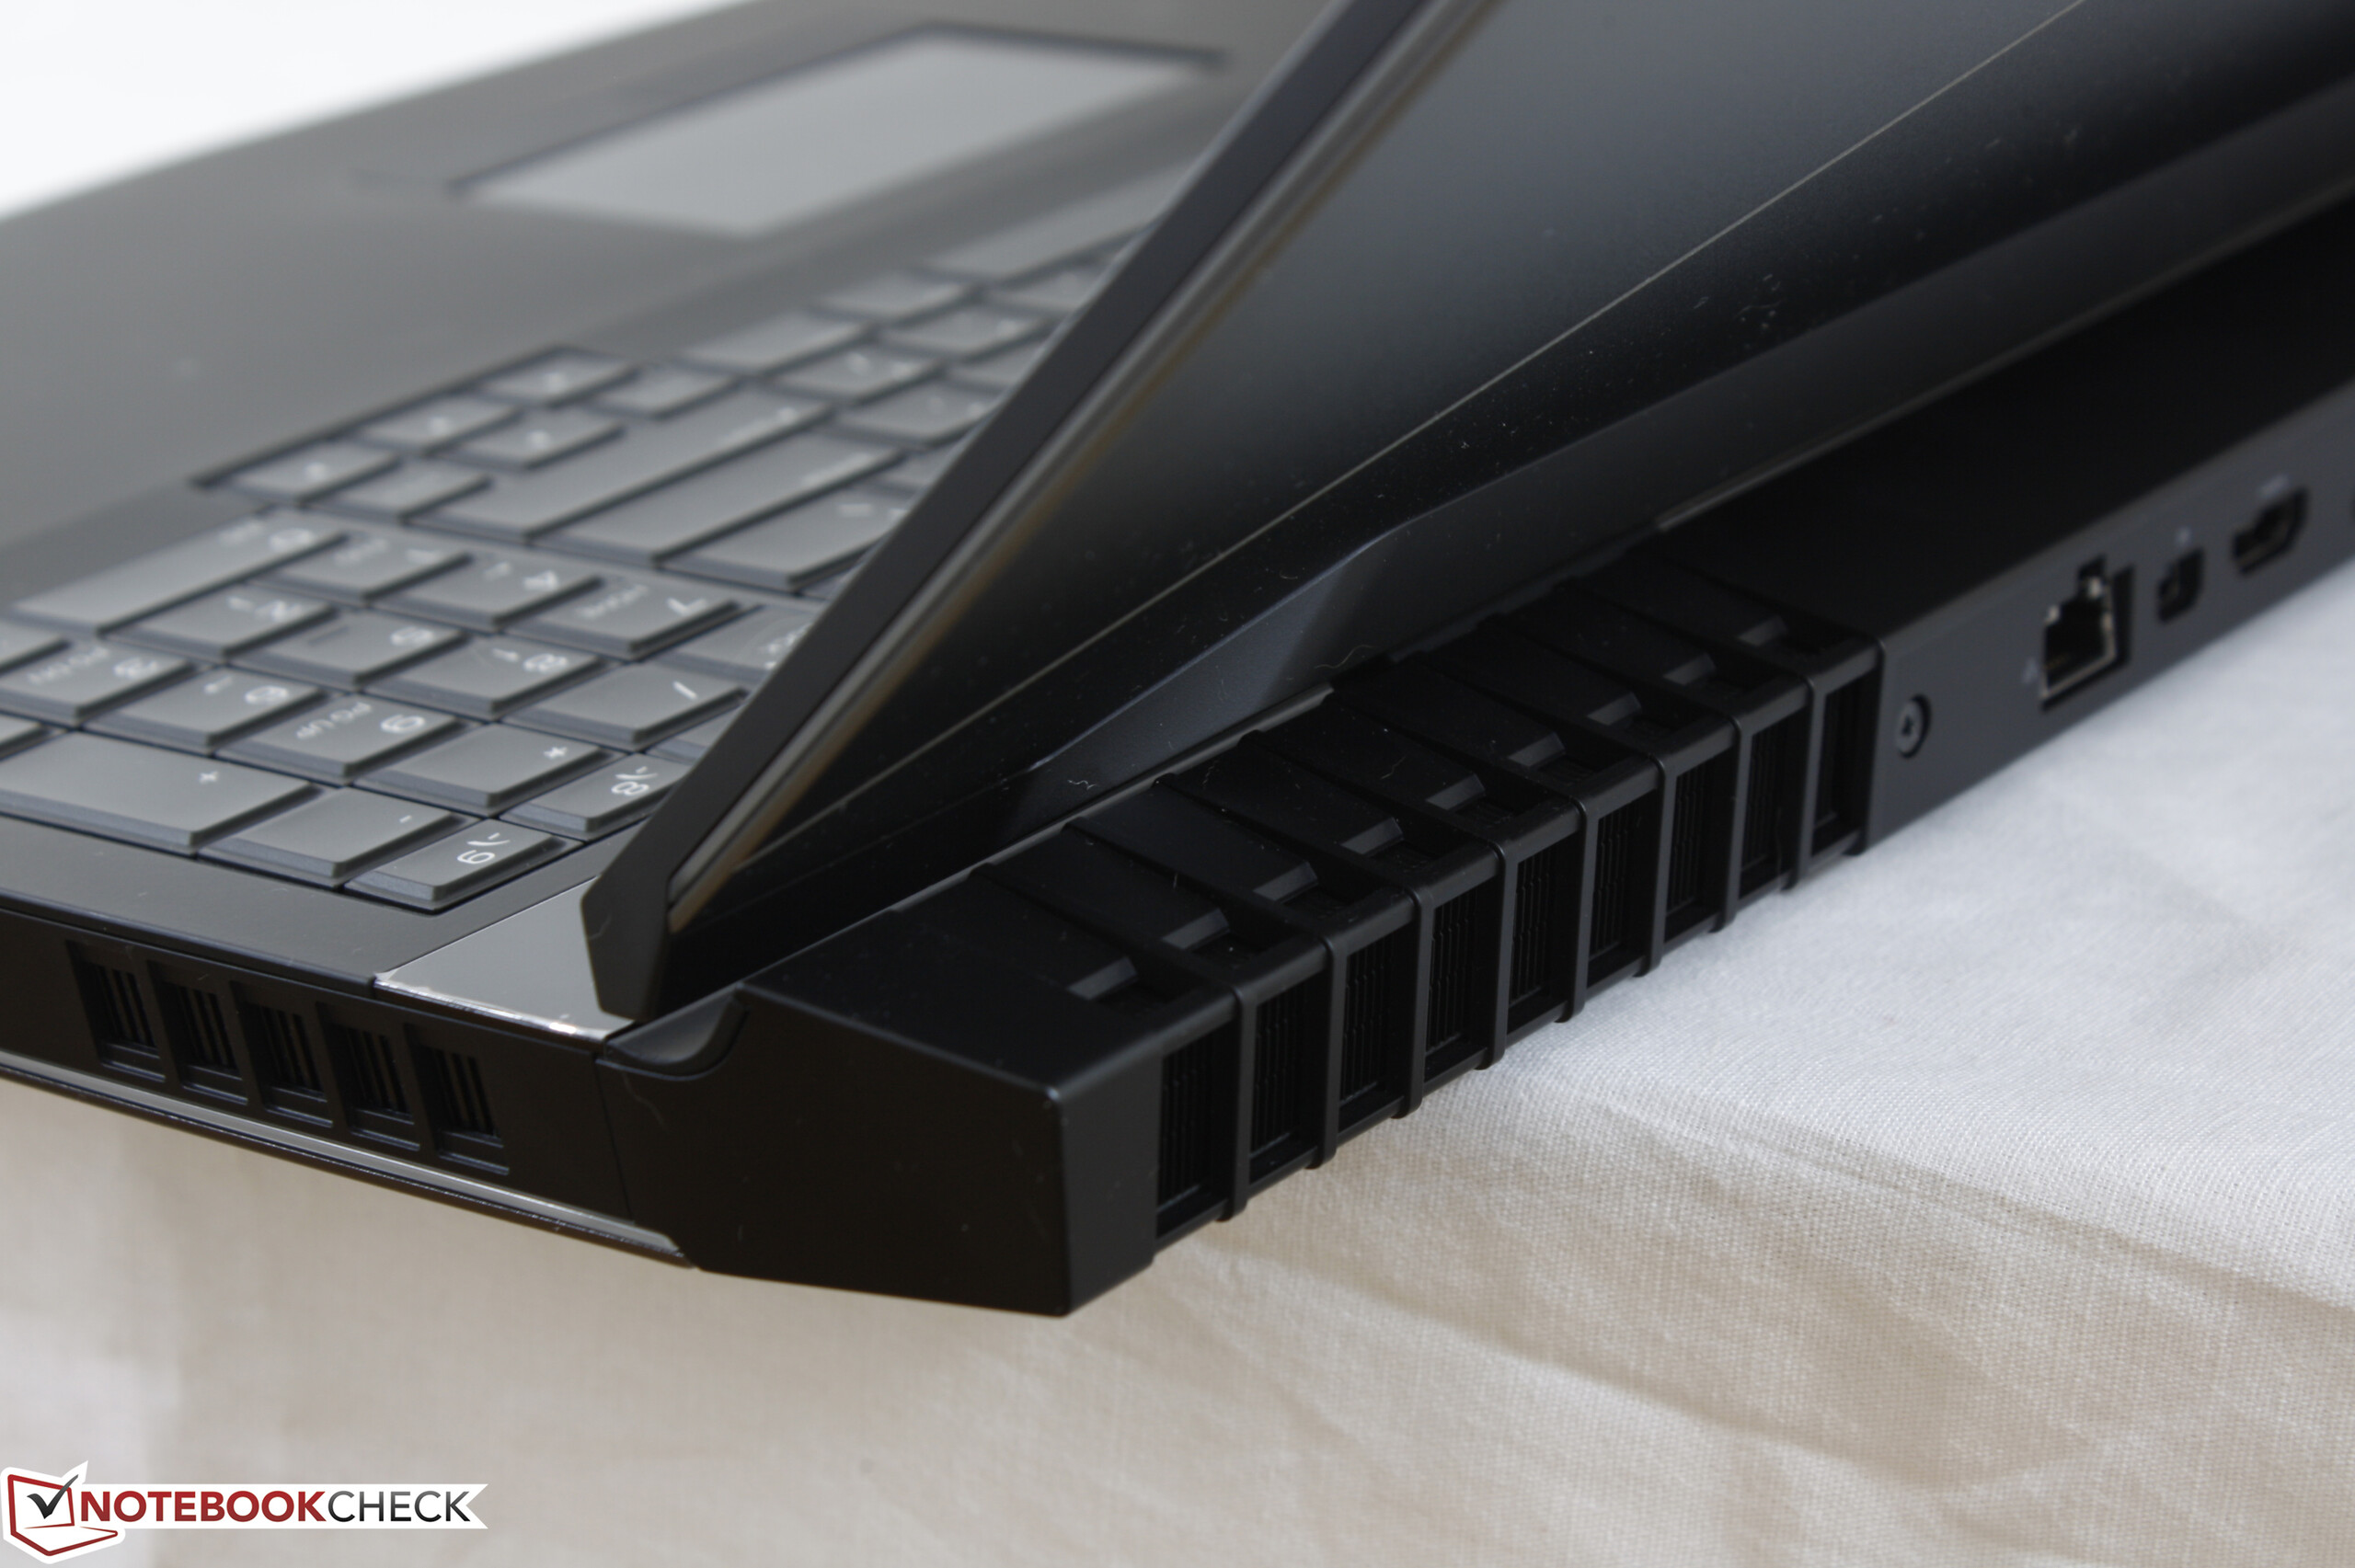
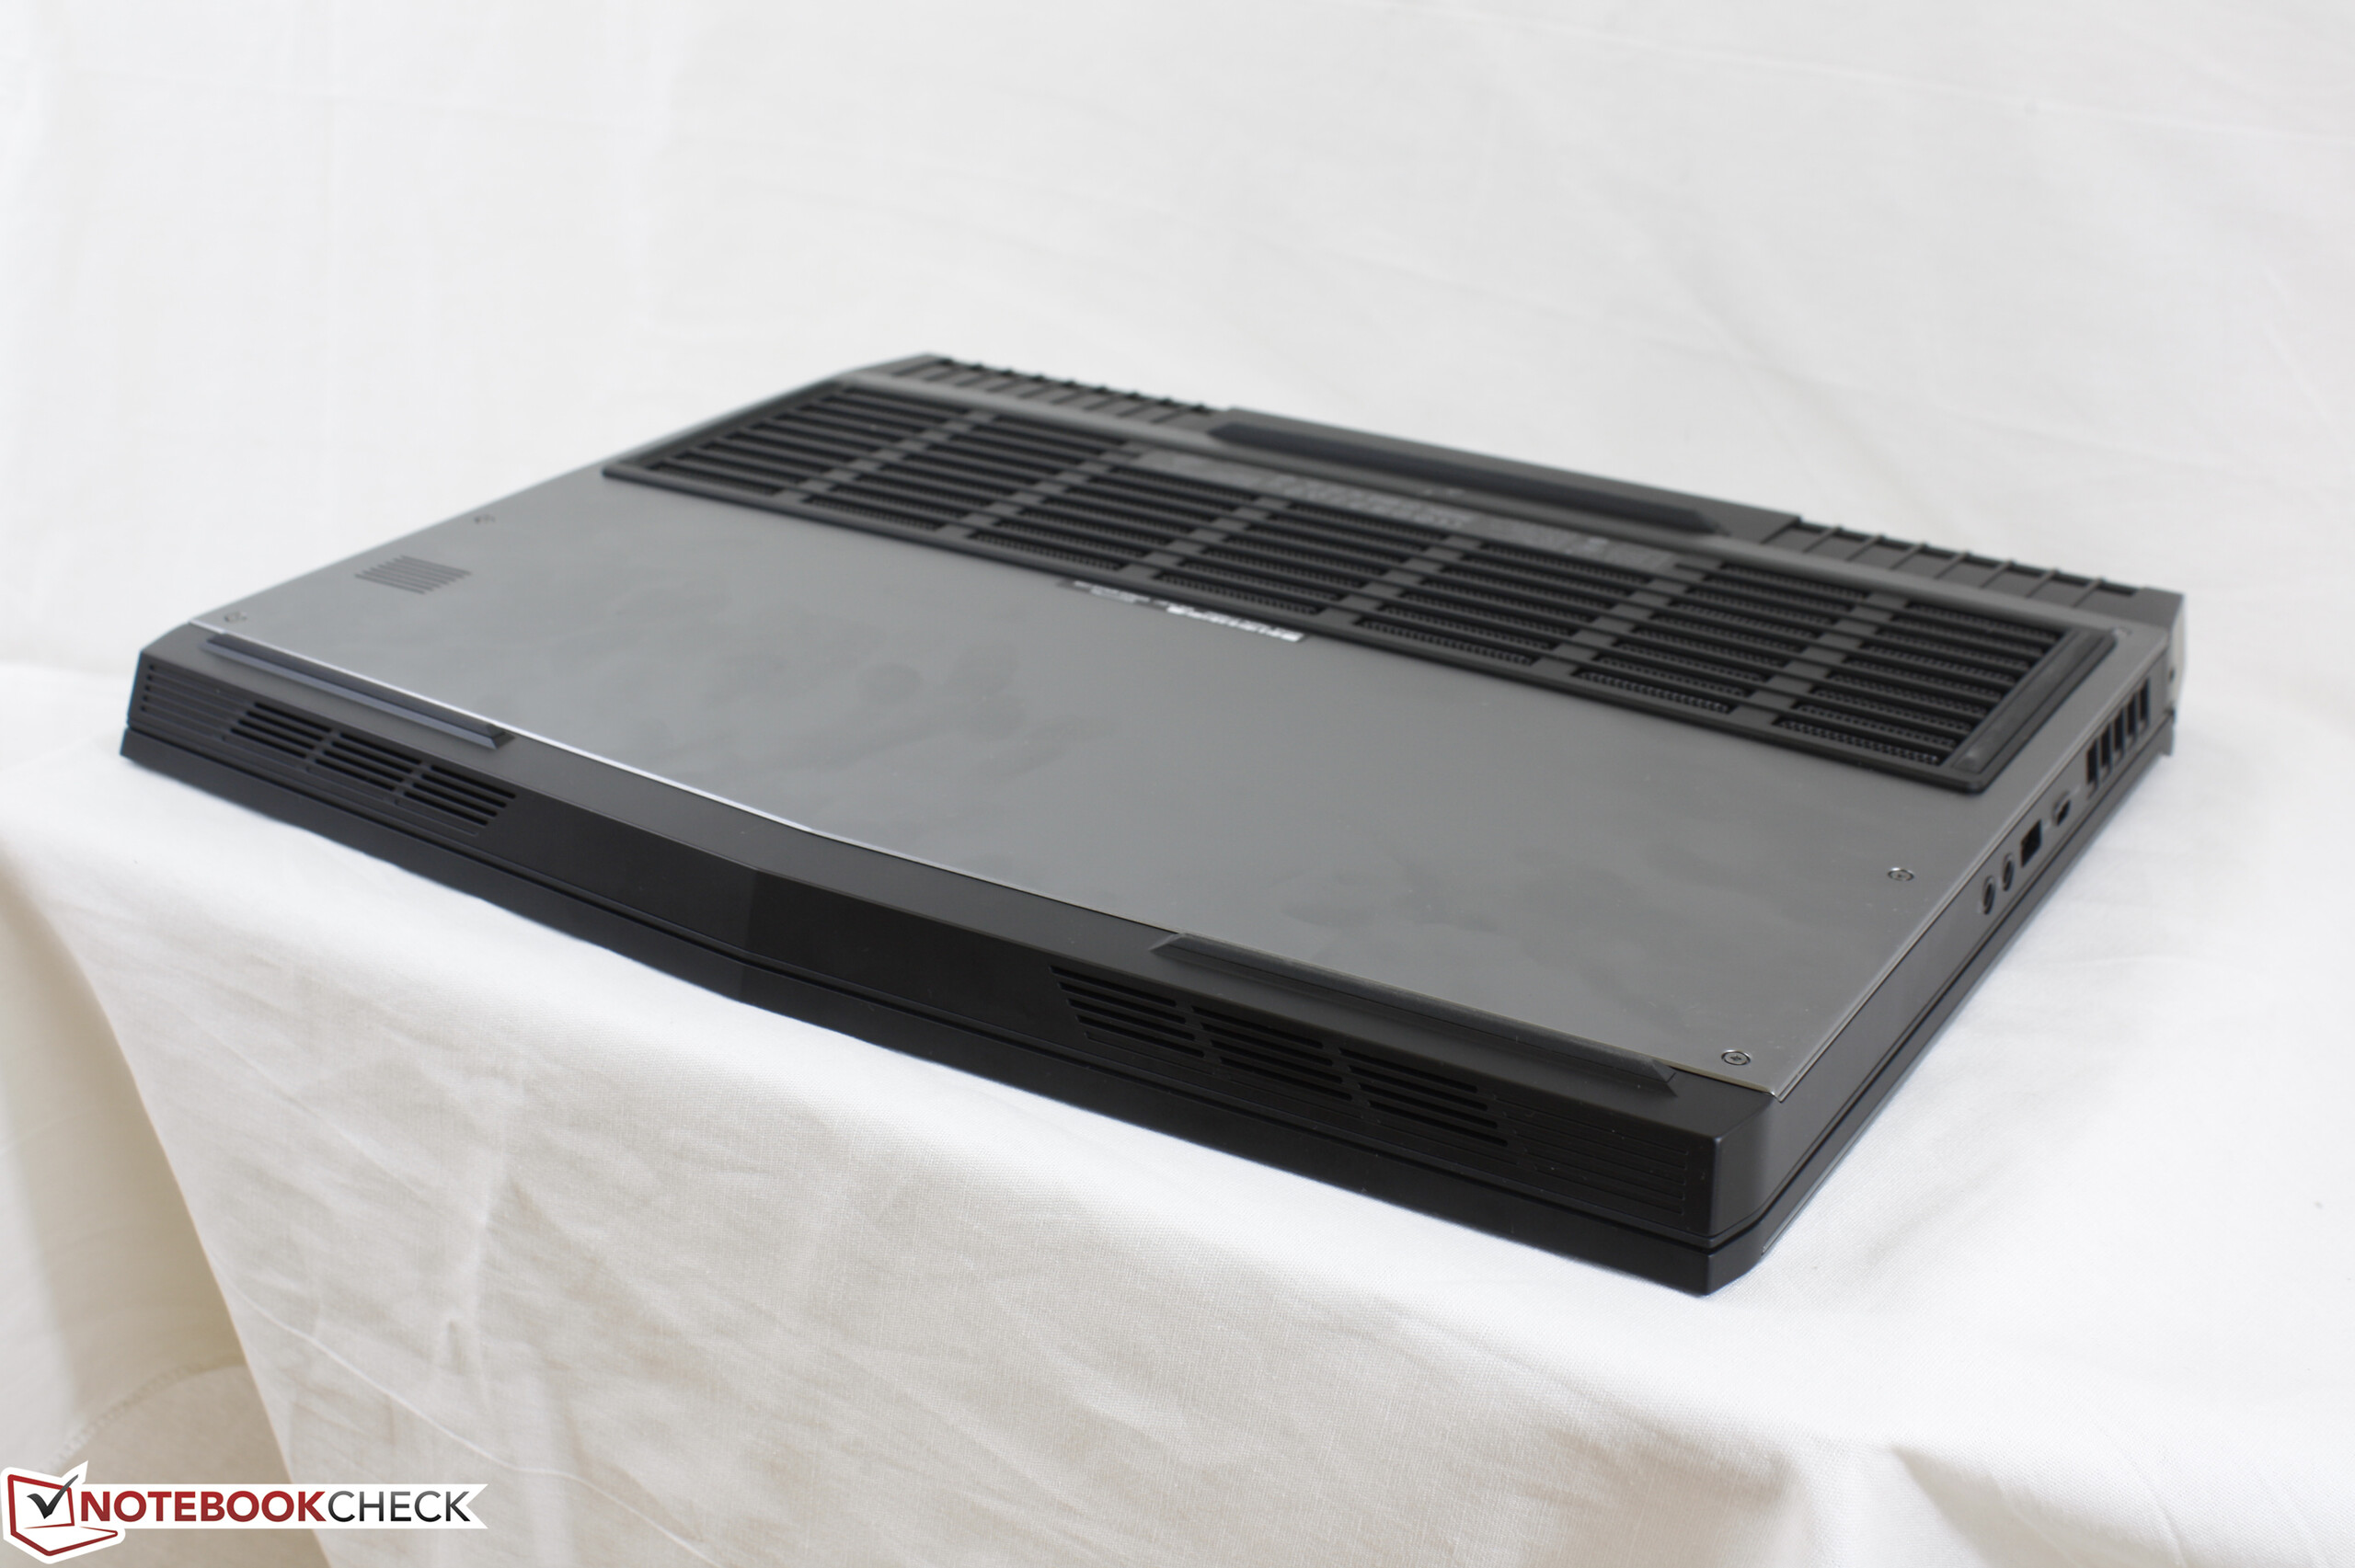
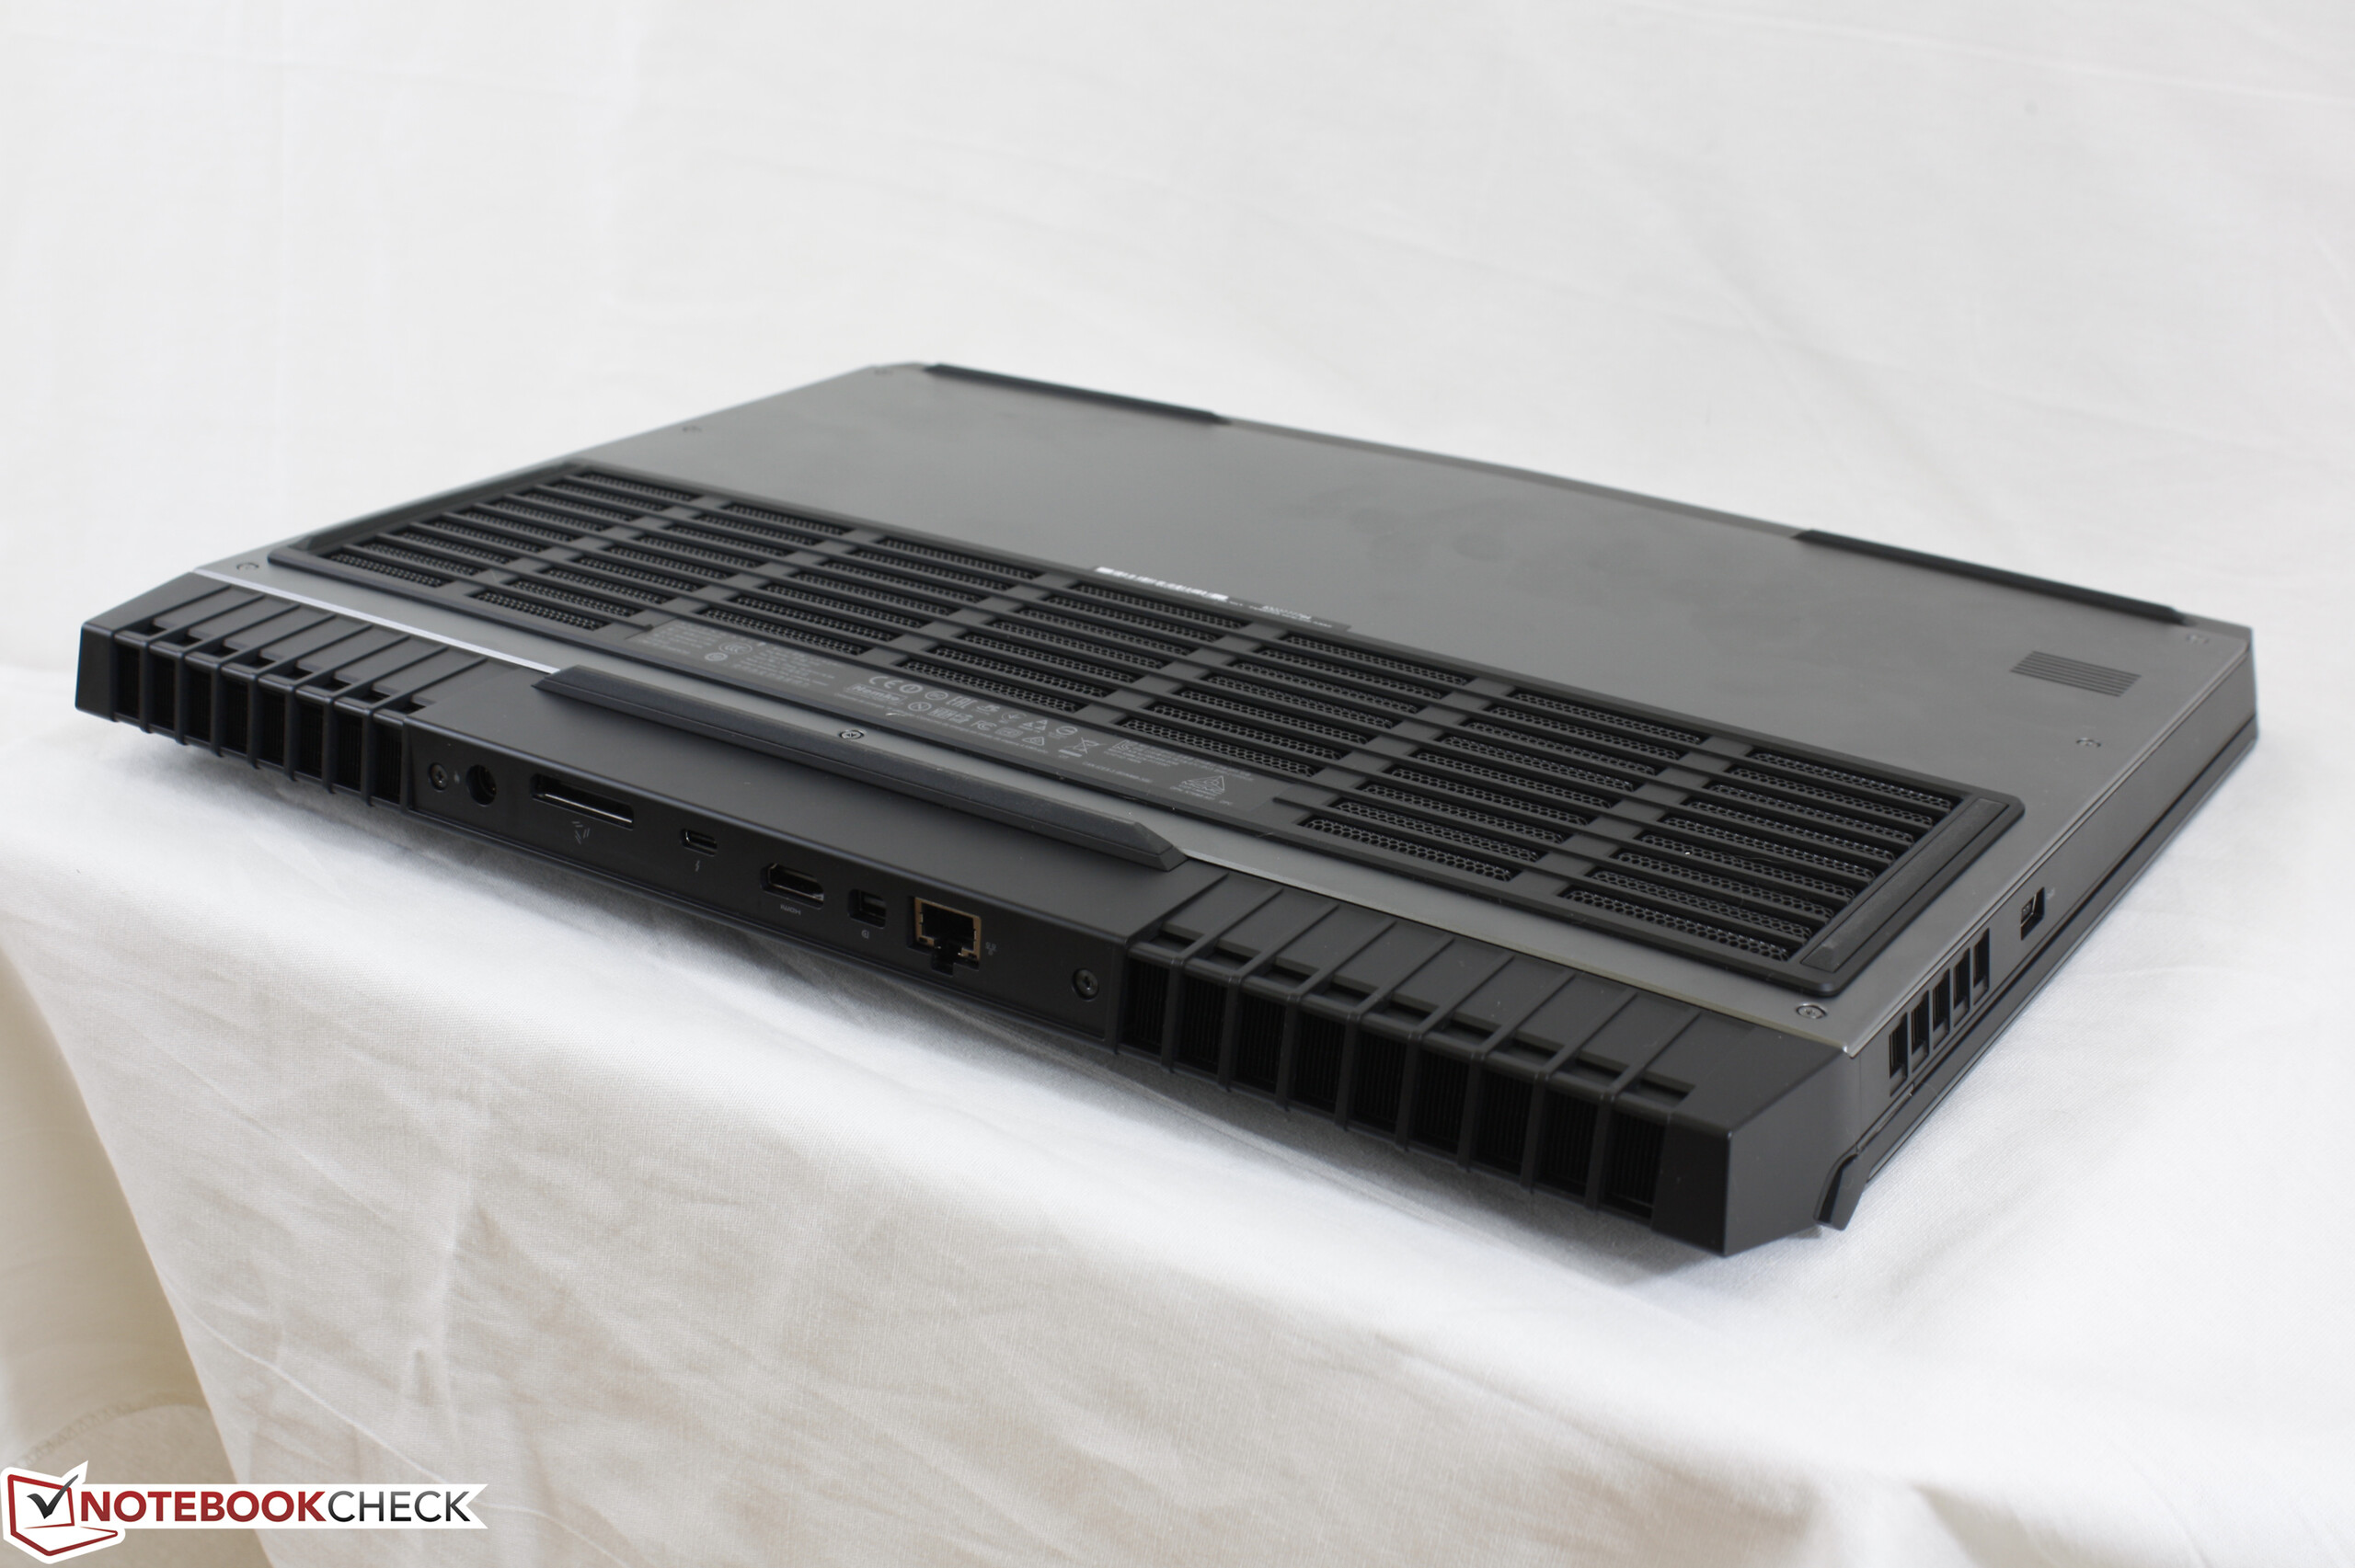
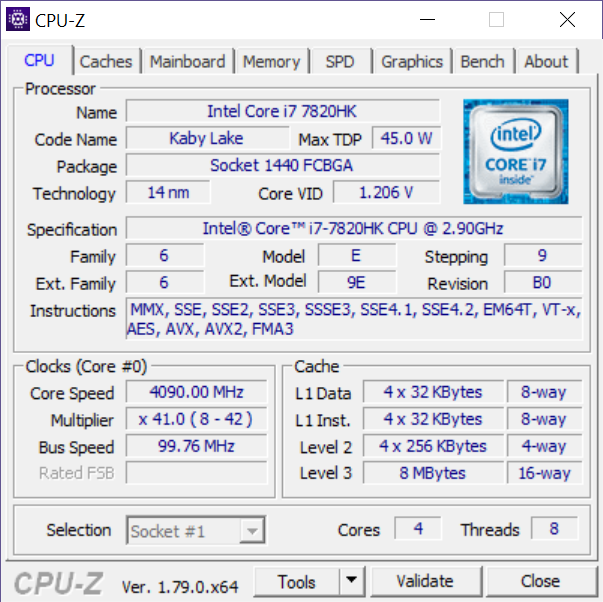
在测试高端配置级别电脑,我们会看到一些问题。我们的特殊测试单元配备了当前17 R4上最快的处理器和显卡,而该机只能以提高时钟速率来运行这些处理器。是的,即使在极端负载的情况下,处理器和显卡也不会节流,但是,游戏状态下,尽管长时间工作时的风扇声音50分贝,但是该机核心温度仍然会达到90摄氏度以上。拥有更多发热解决方案的游戏本(如微星 GT73VR或宏碁 Predator 17 X)在温度或噪音方面做得更好。
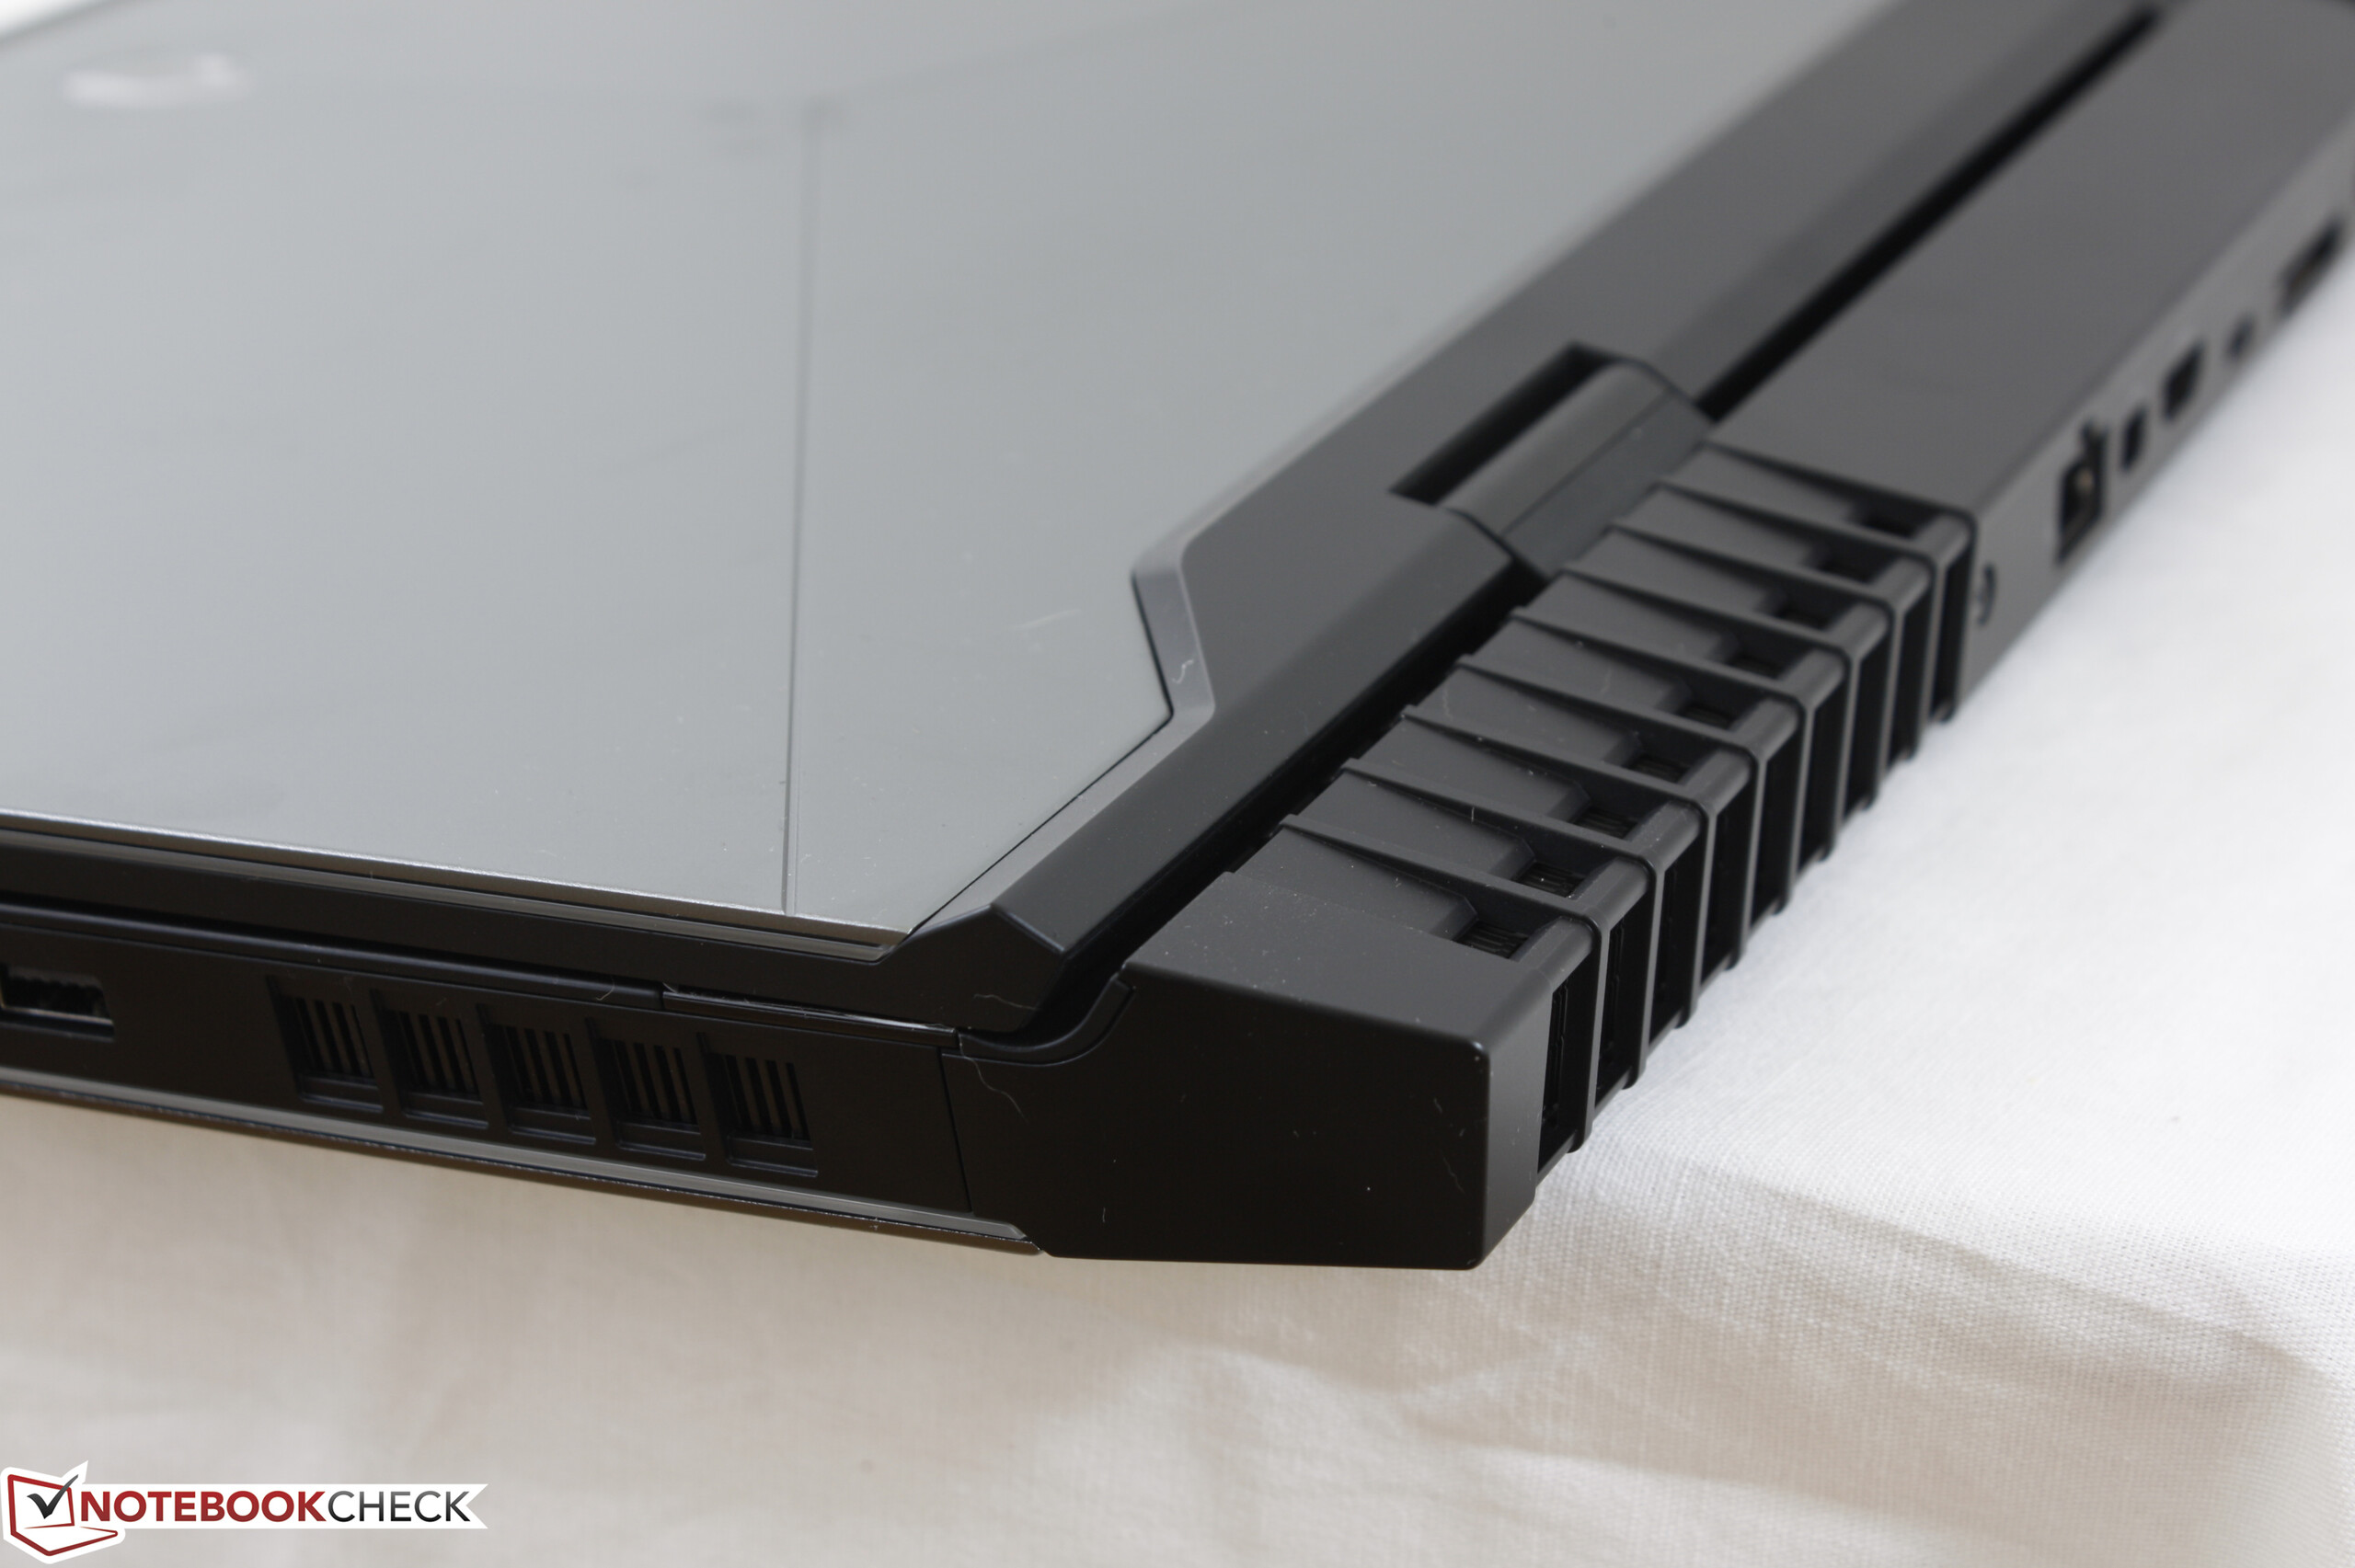
上述发现,以及外接显卡端口的存在,使得购买相对低端的配备GTX 1050 Ti或GTX 1060显卡的17 R4更为合理。很有可能,这些显卡性能的显着降低,能让风扇变安静,温度变低,运行时间变长。然后,可能要求更快速的图形处理能力的用户可以简单地使用外接显卡功能来实现。这是外星人系列对大多数竞争对手的一个致胜法宝。全面性能下降是值得的,因为换取了17 R4系列的大显示器。
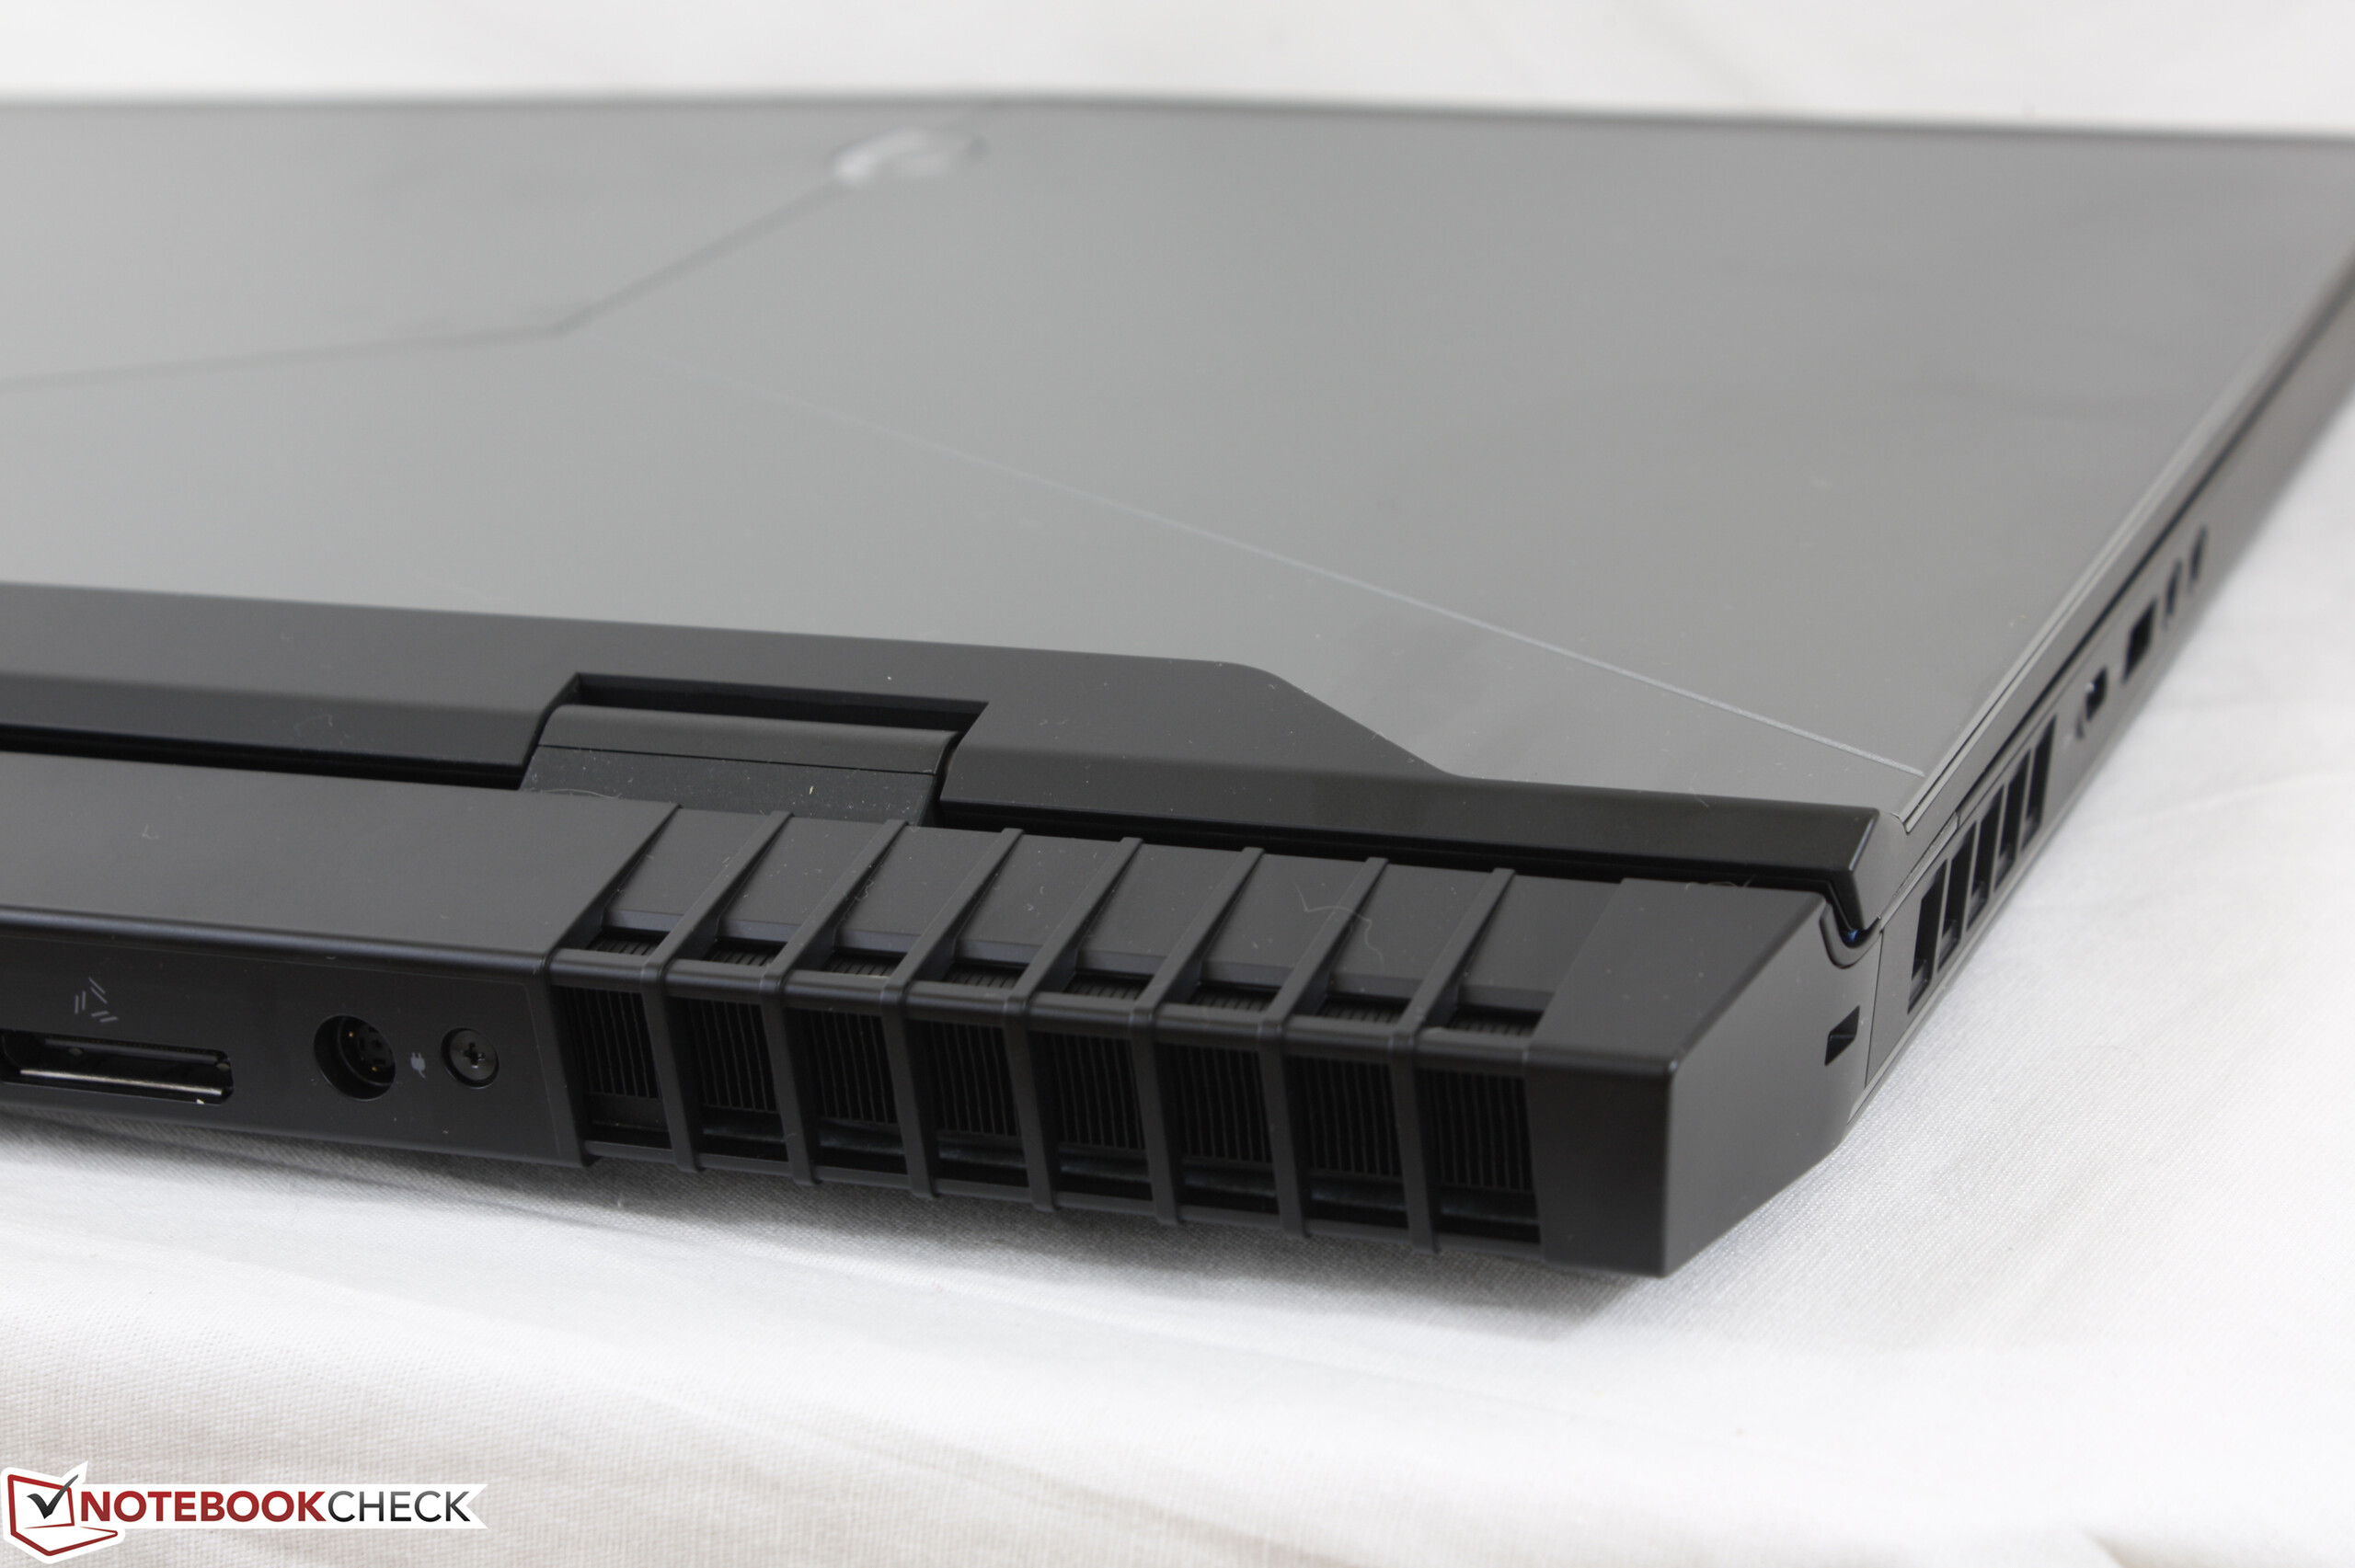
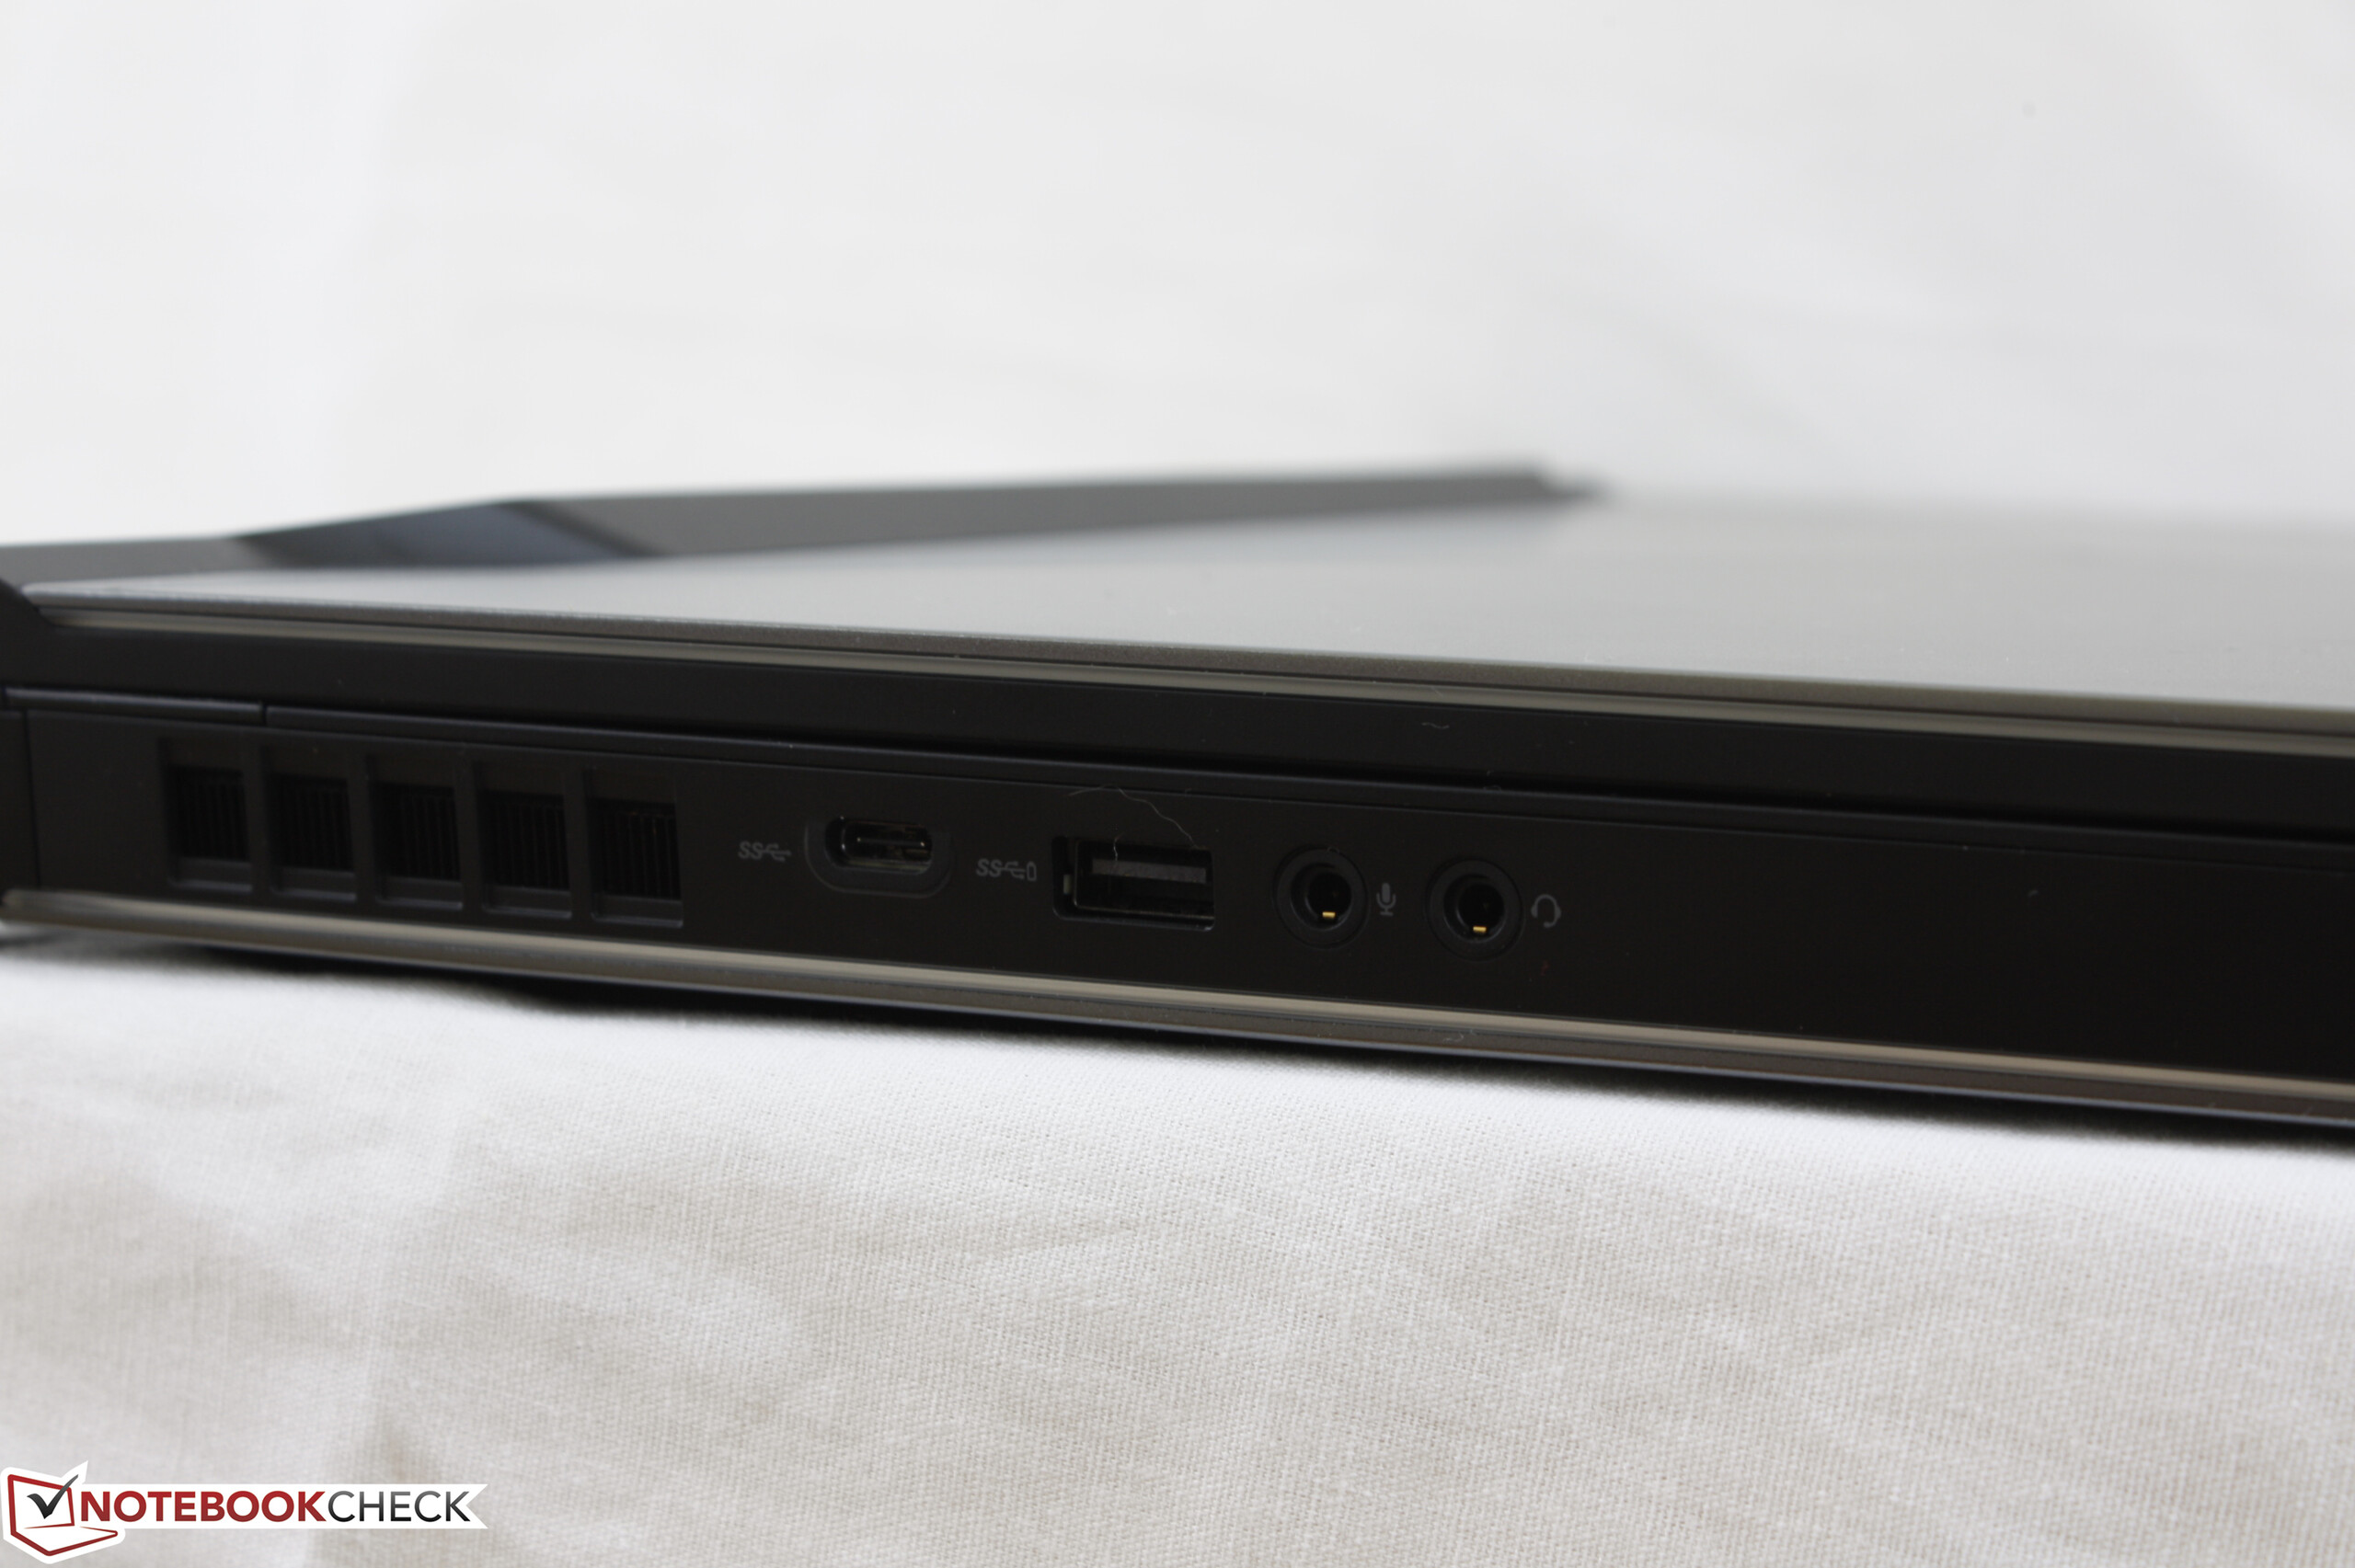
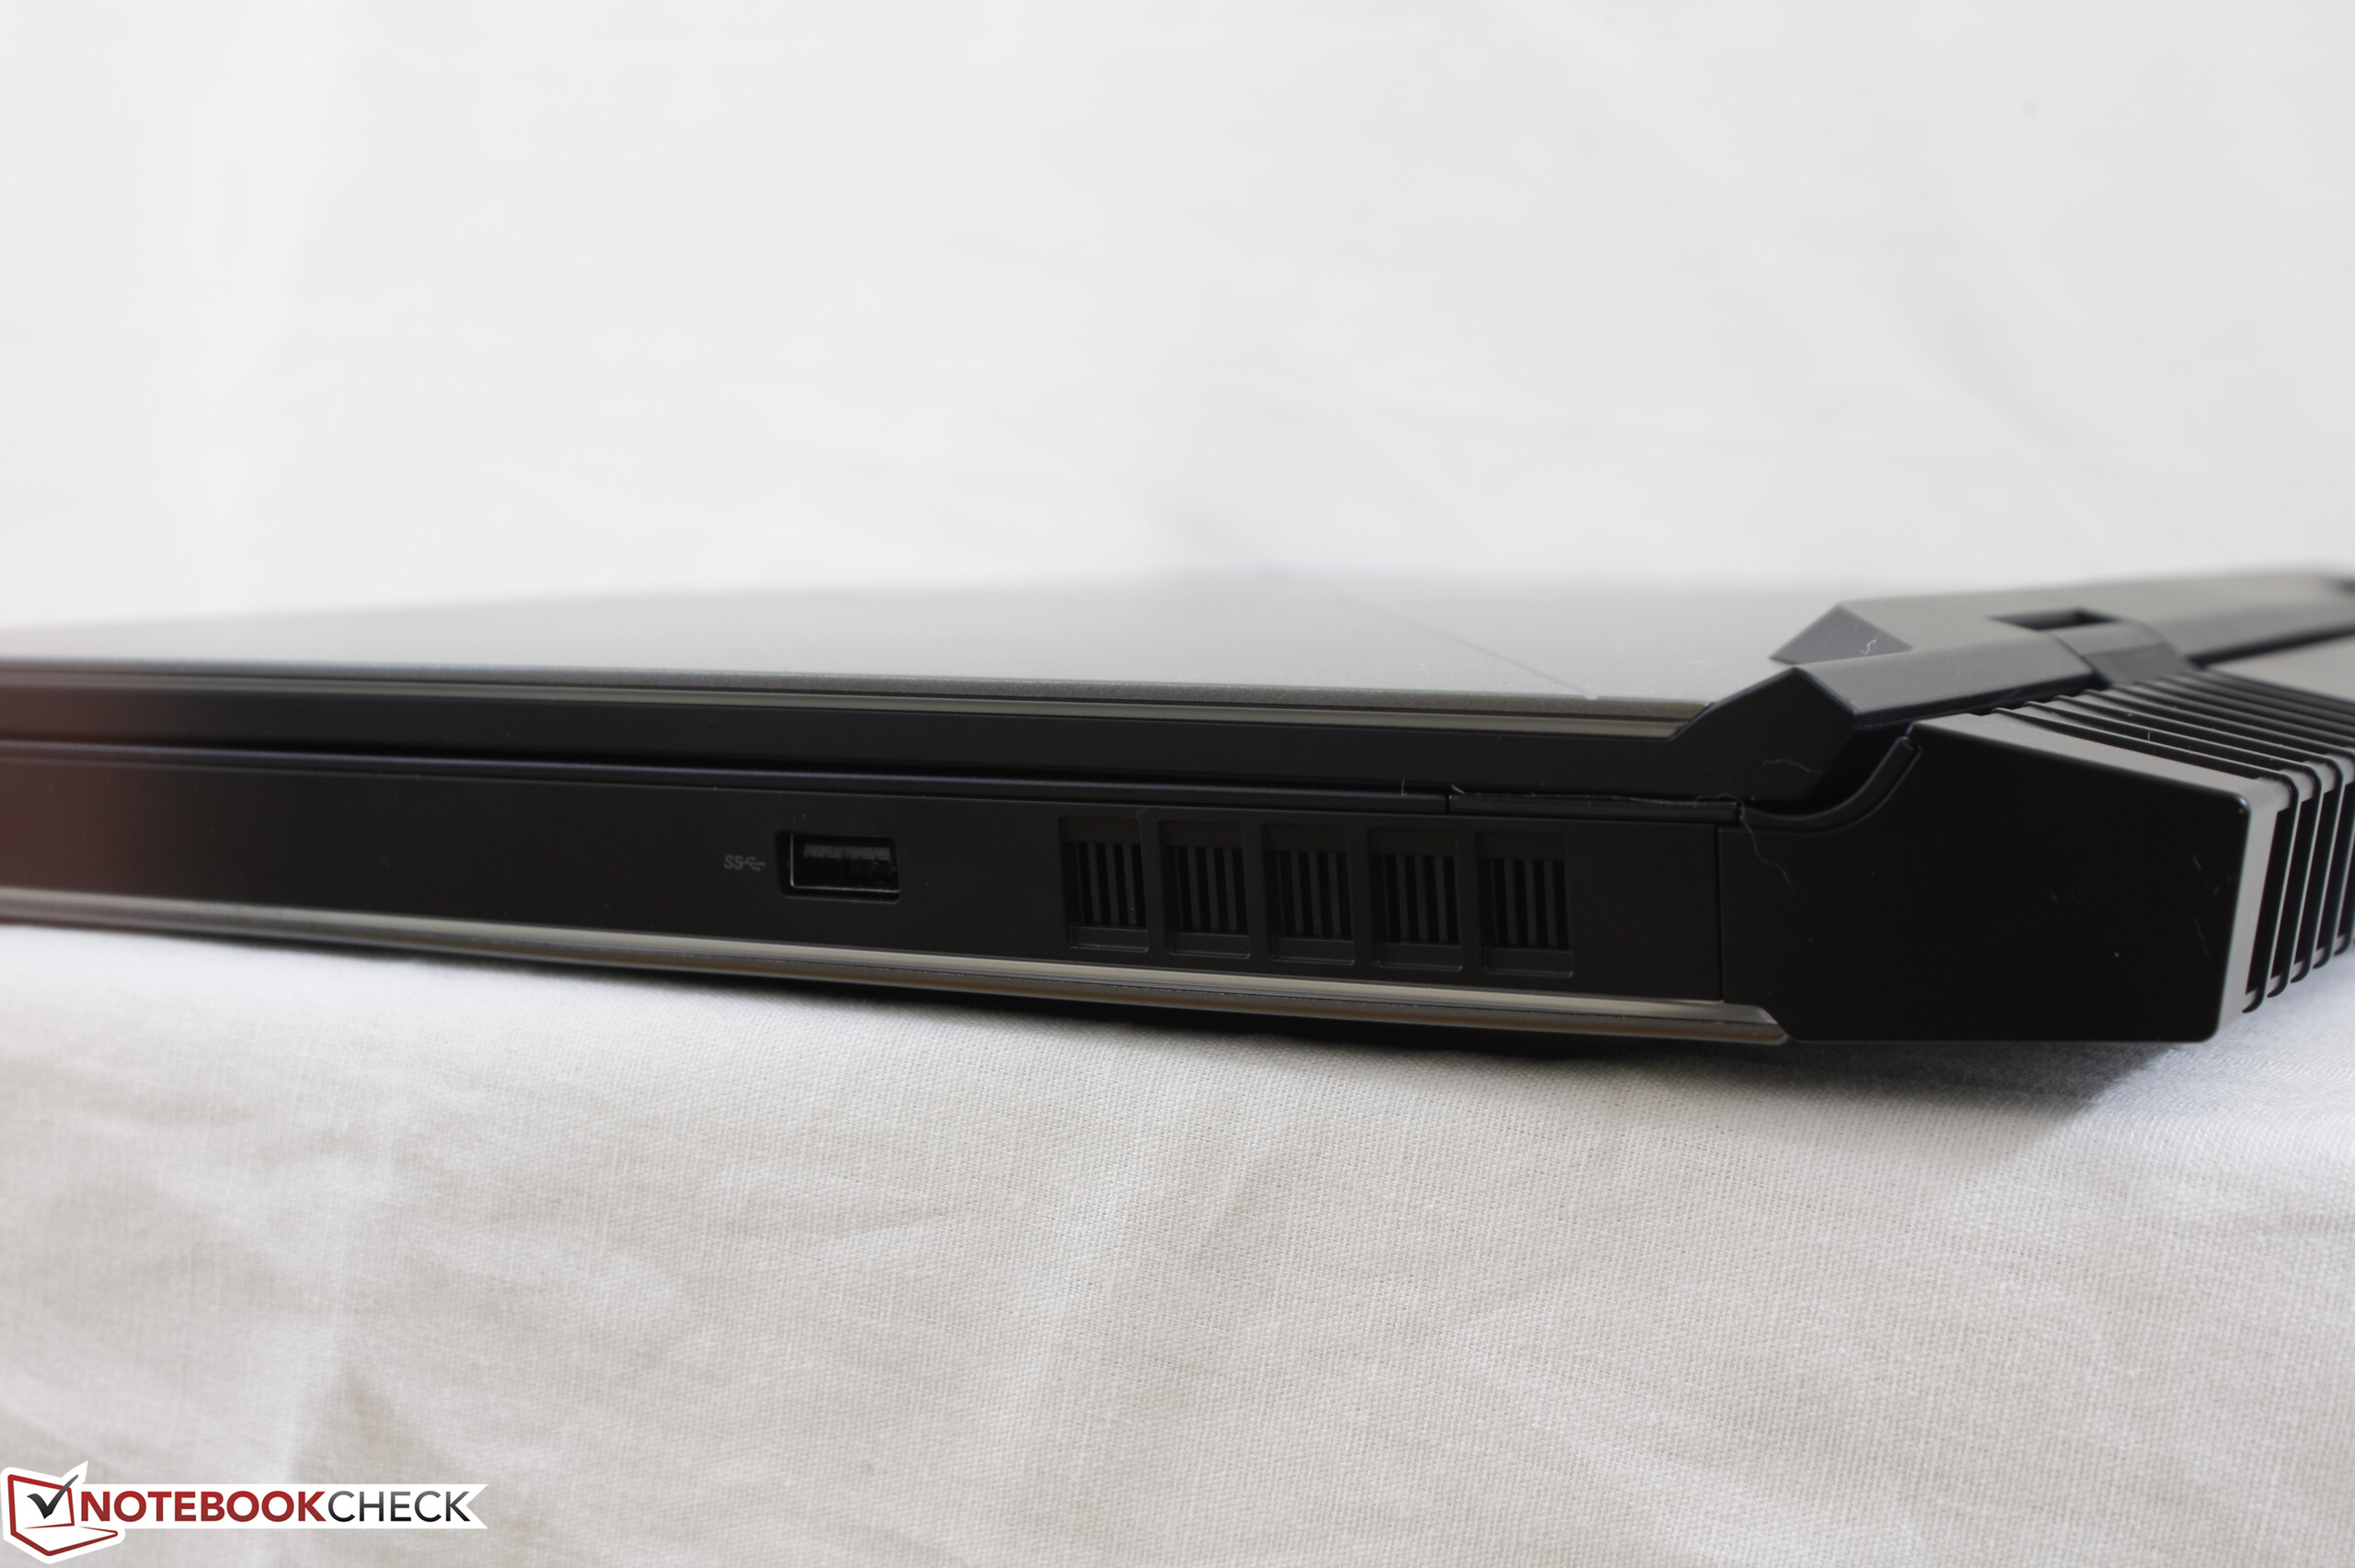
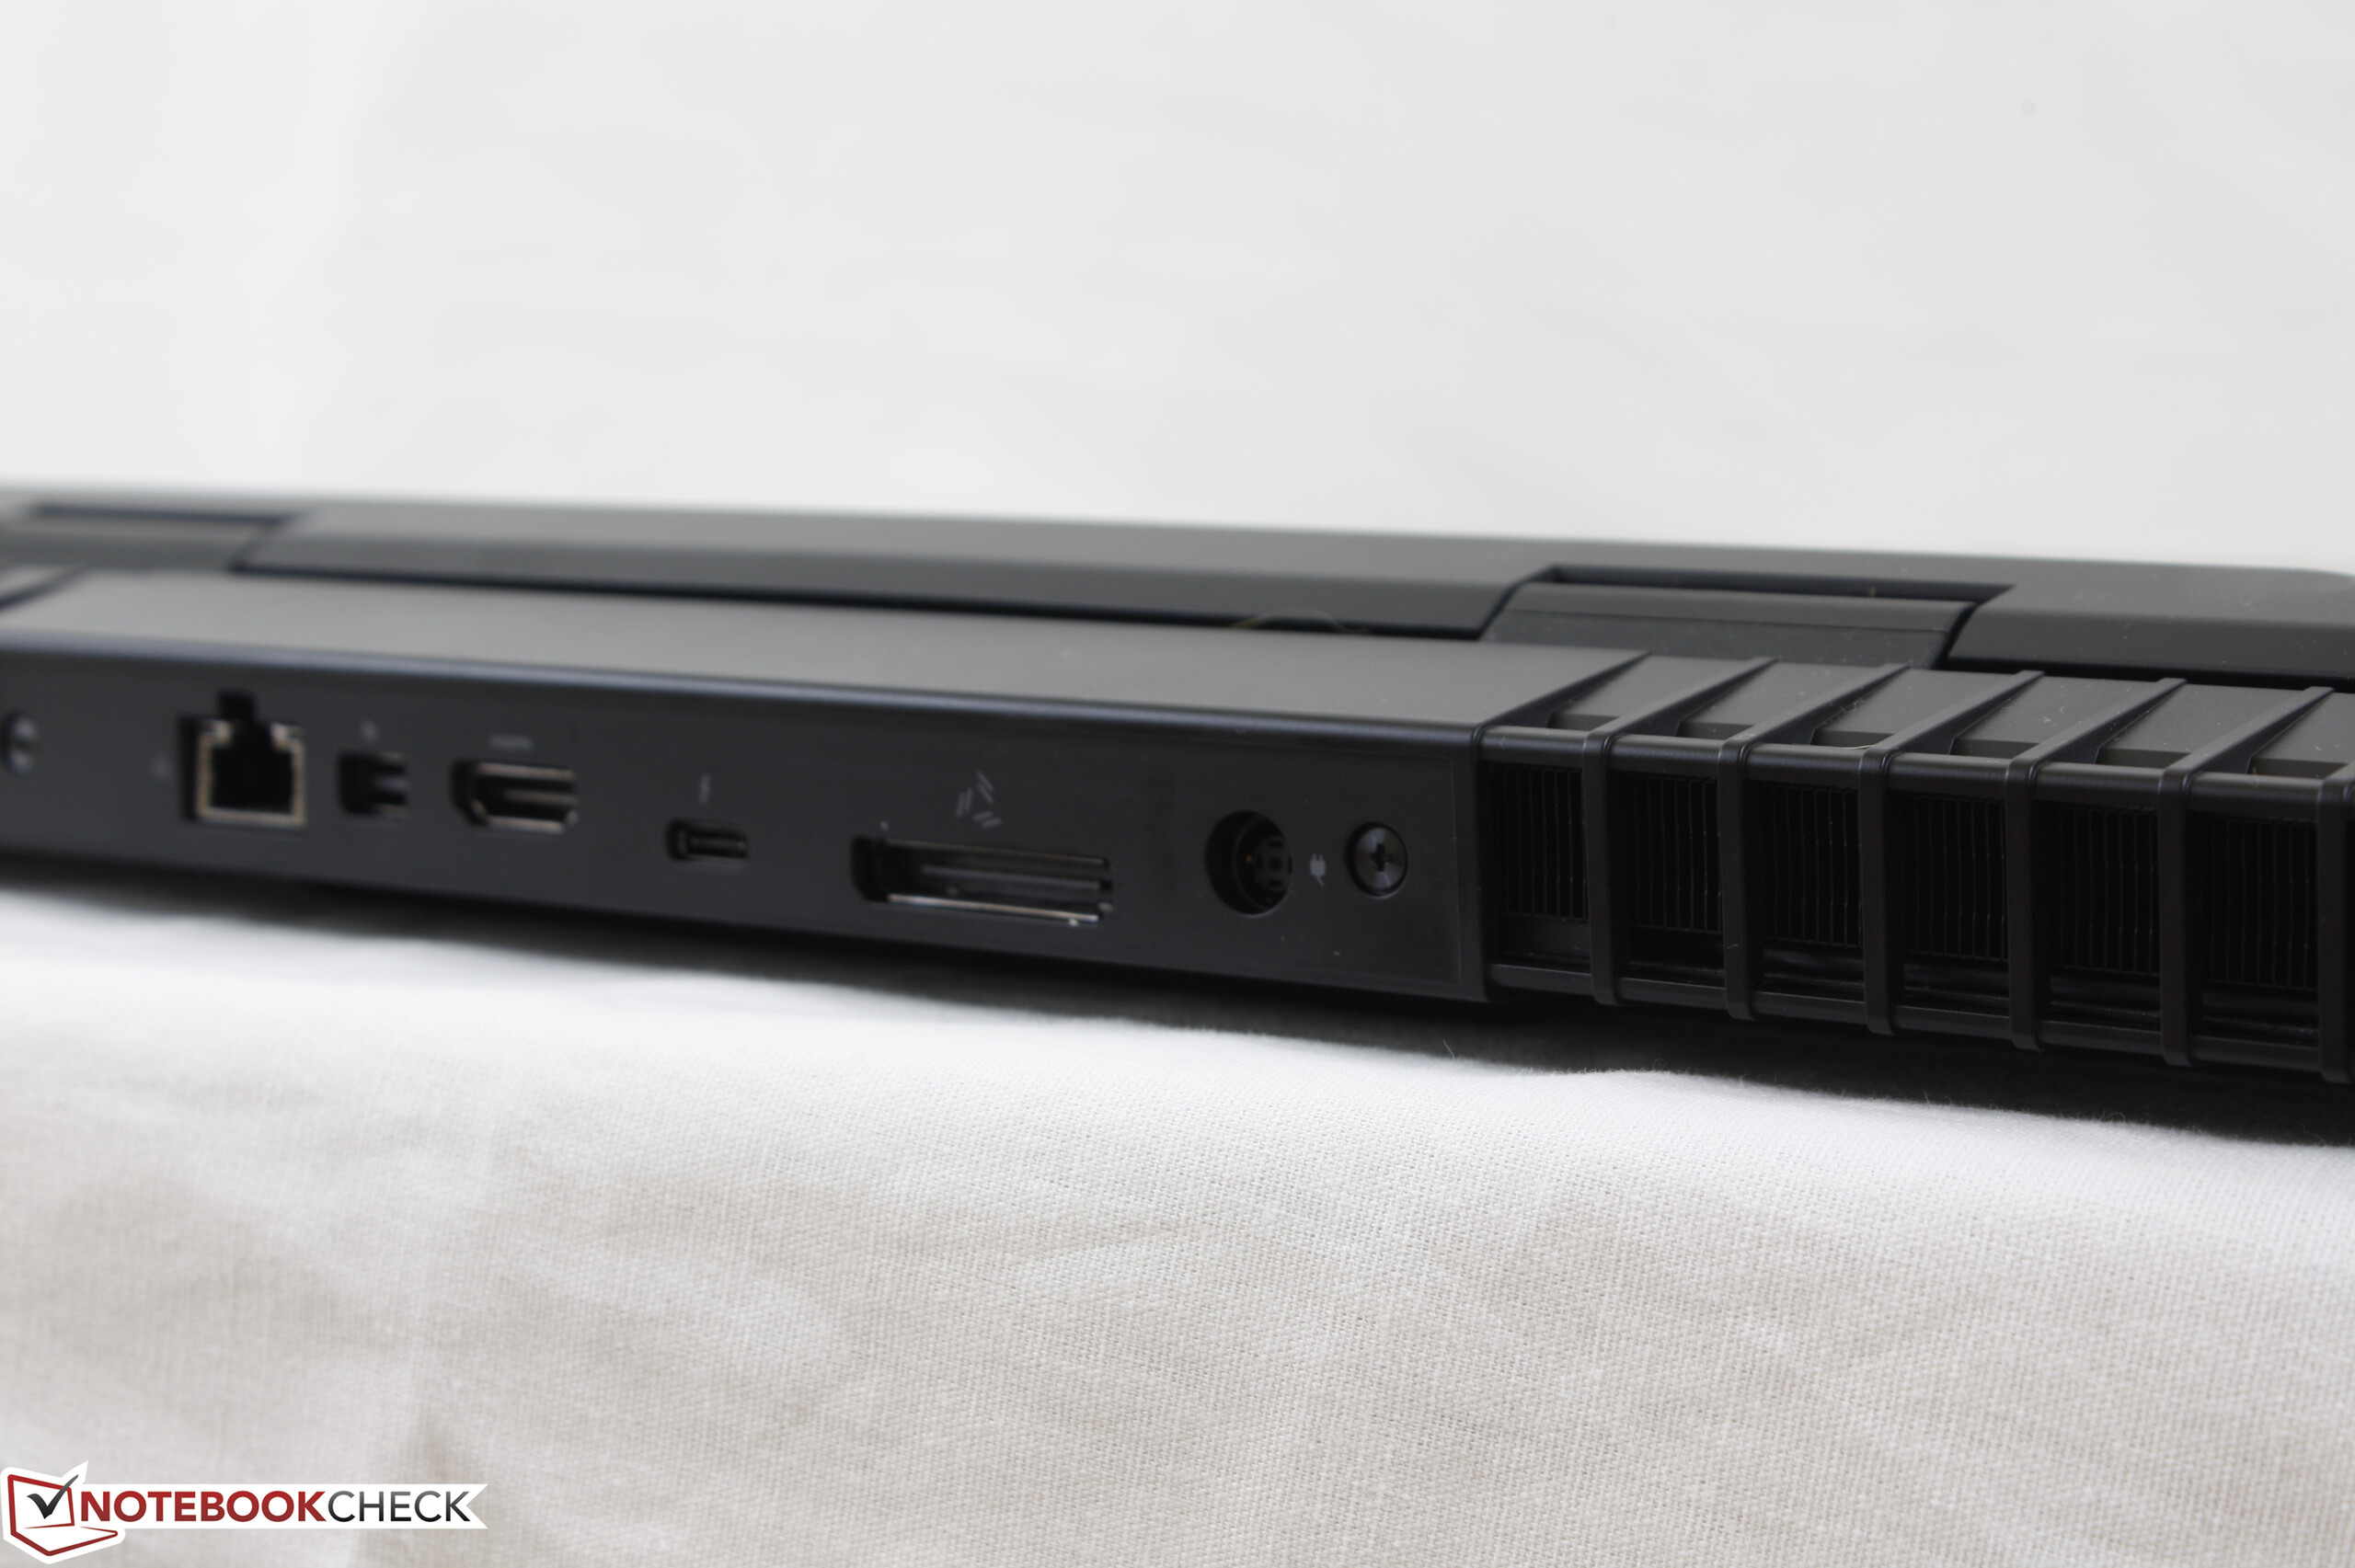
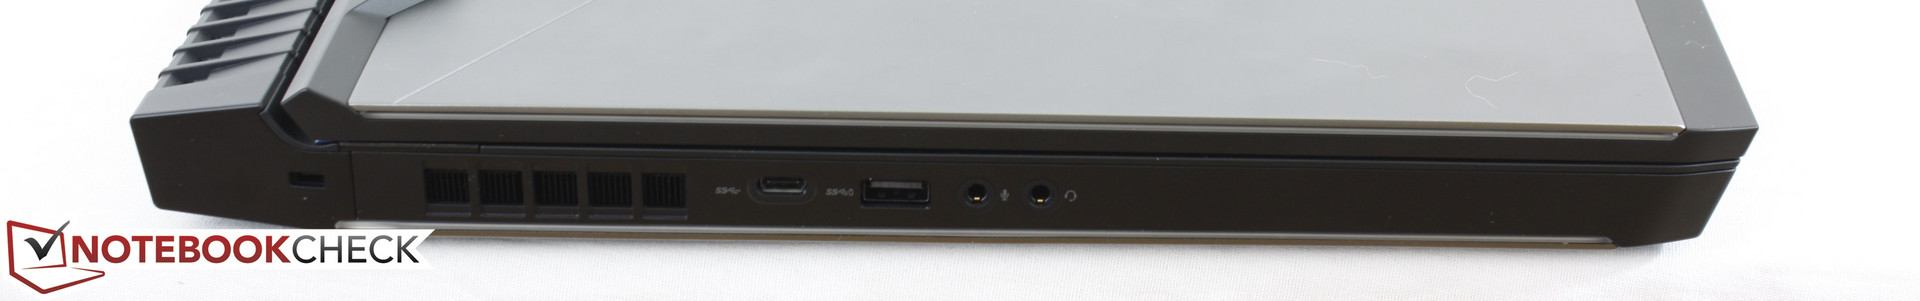
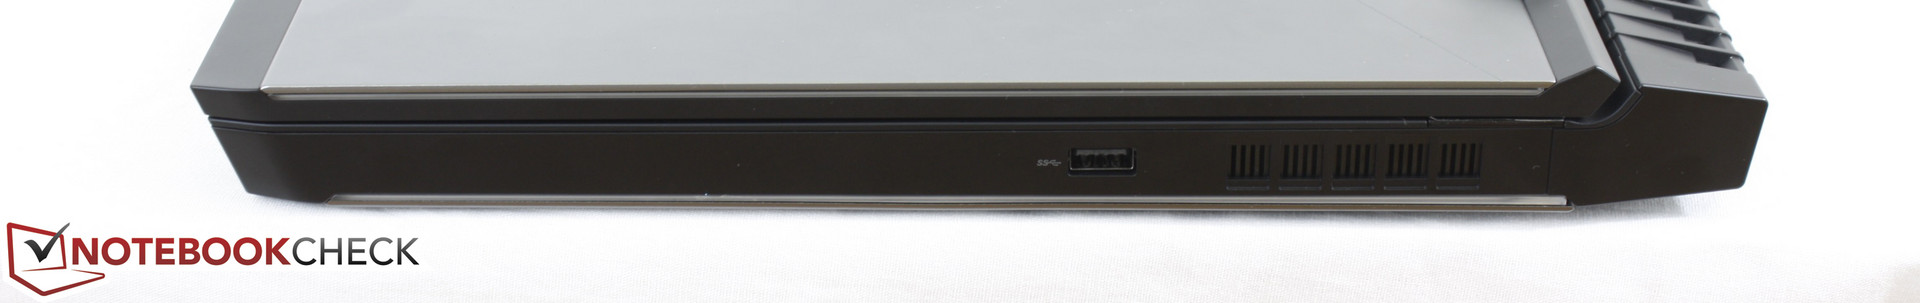
除了这些问题,还有少数可以抱怨的地方。很多功能没有实现,比如说小键盘的彩色背光。更多的USB A型接口以及集成的SD读卡器。尽管它们的遗漏不是什么大问题。对外接显卡功能感兴趣的游戏玩家可以购买入门级的机型。而那些想要使用GTX 1080 GPU配置的用户,还不如选购其他更安静(更厚)的机子。
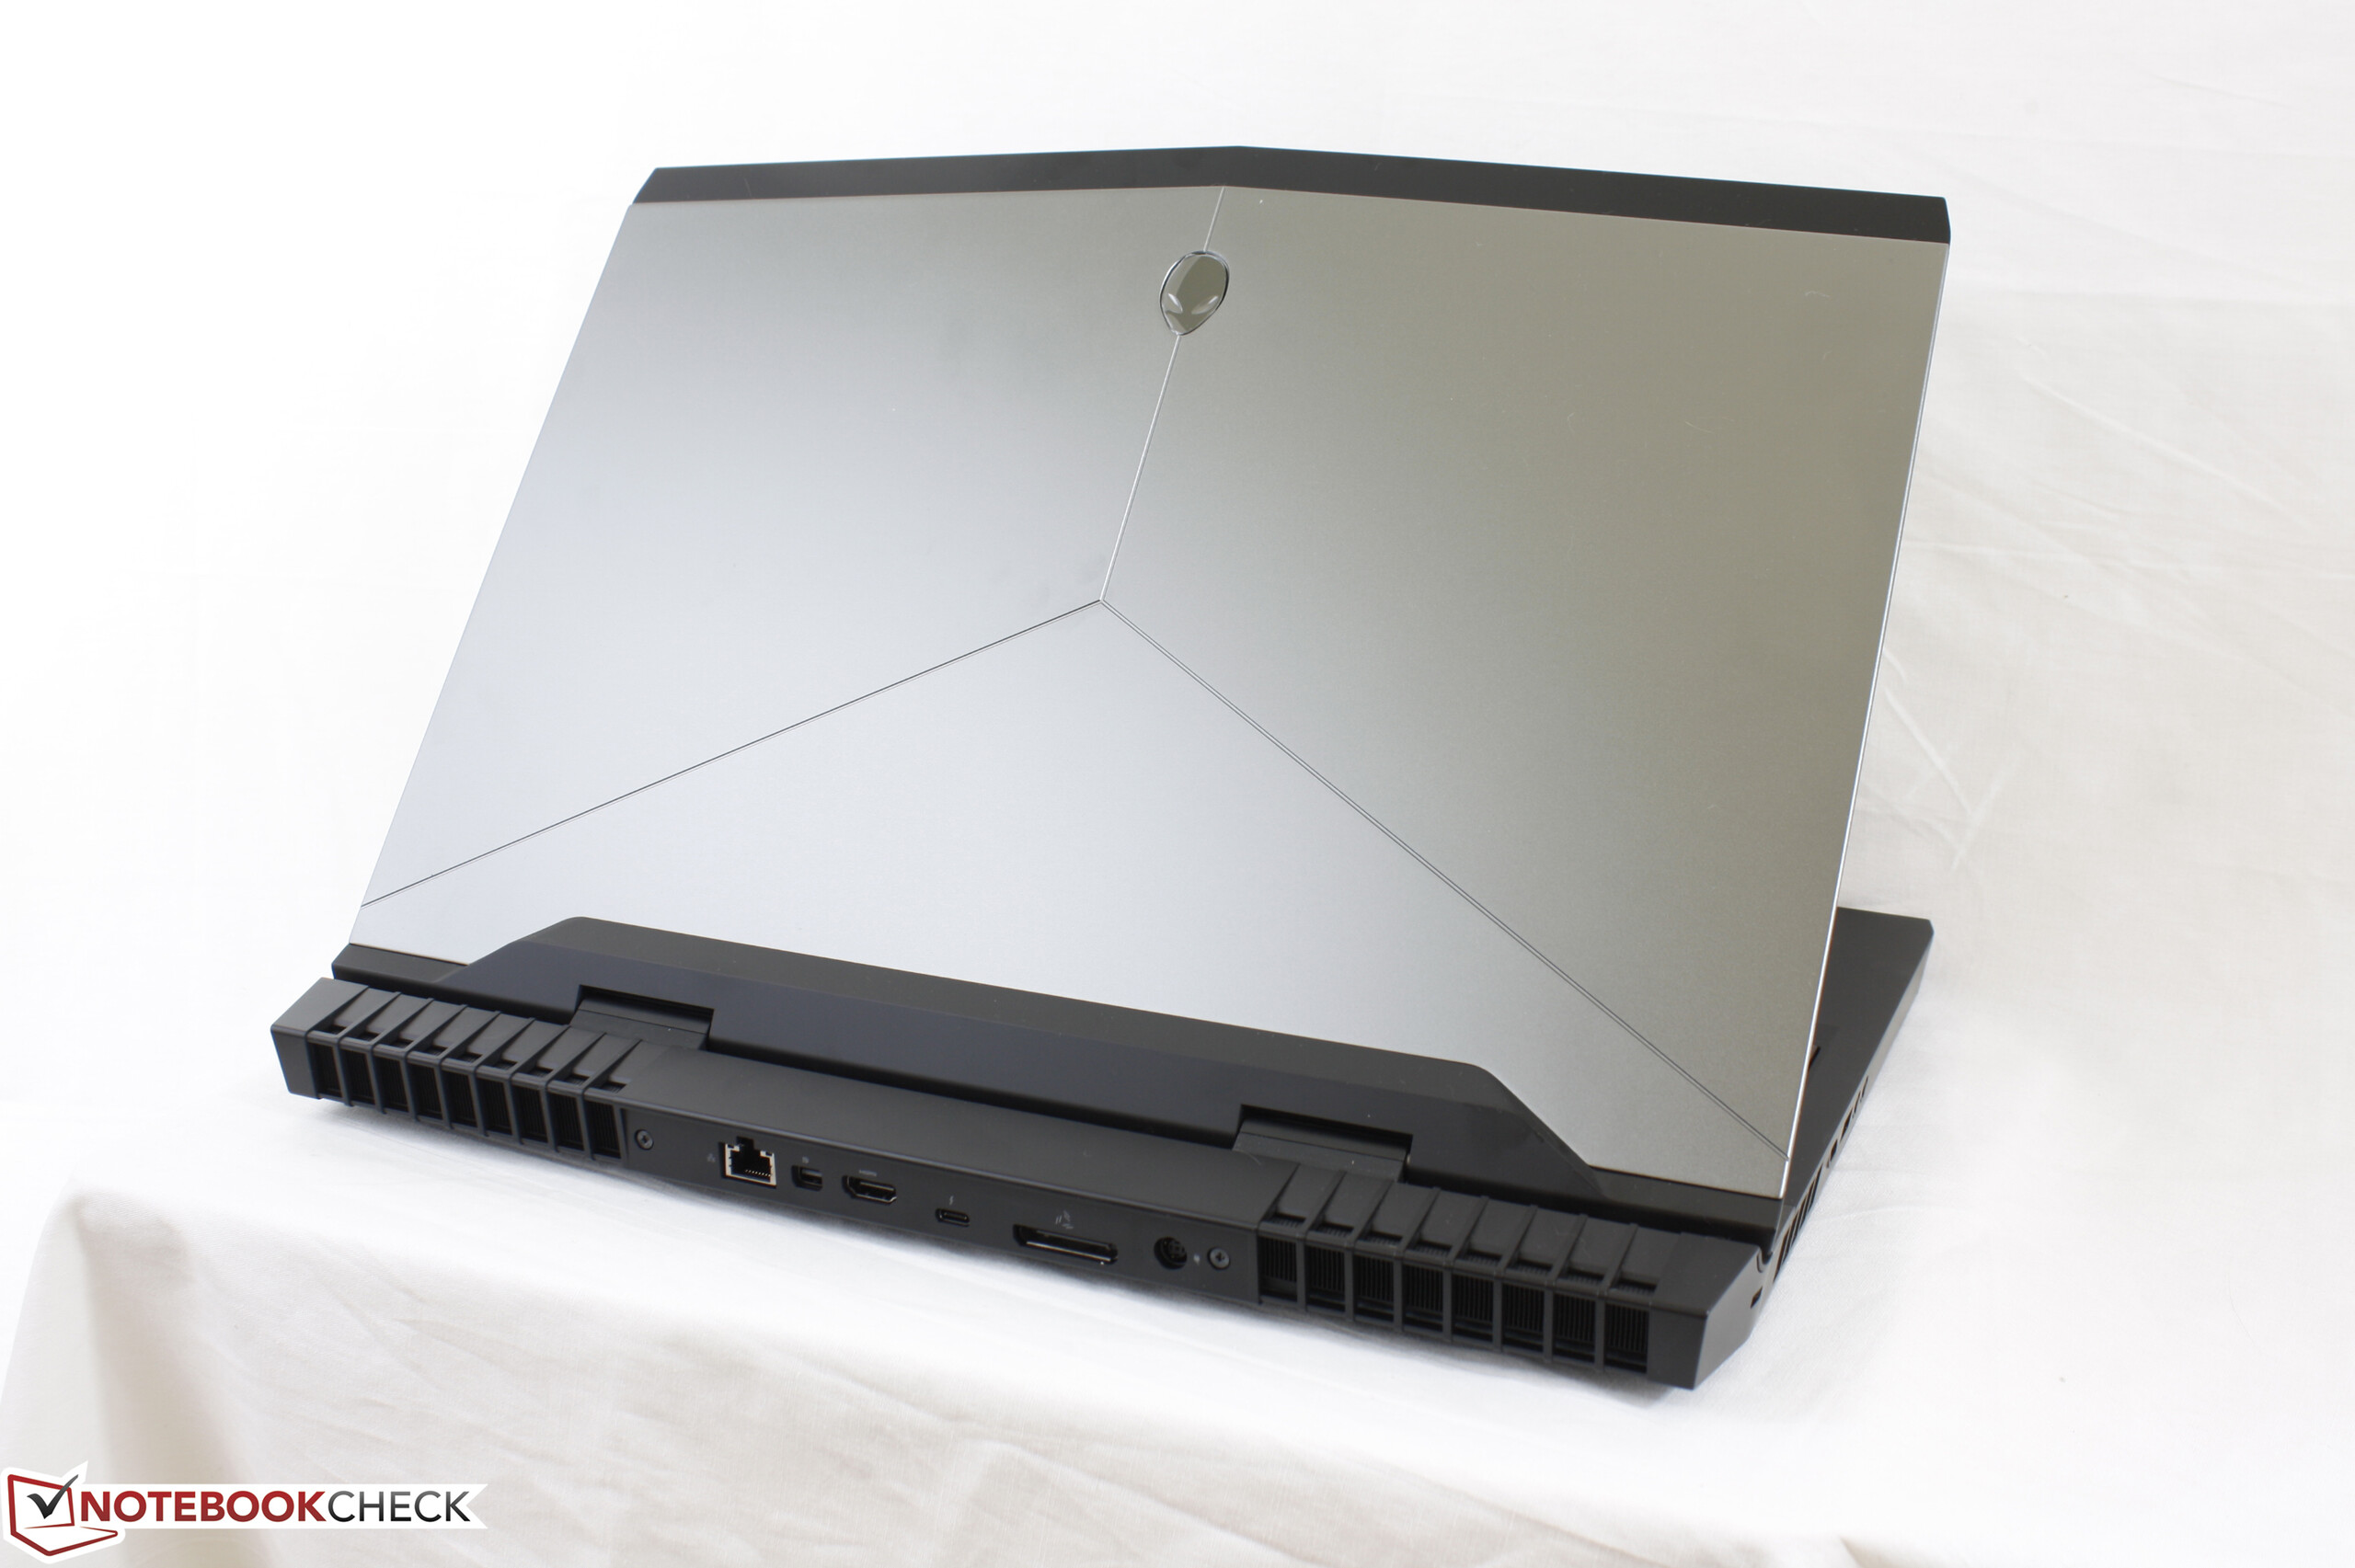
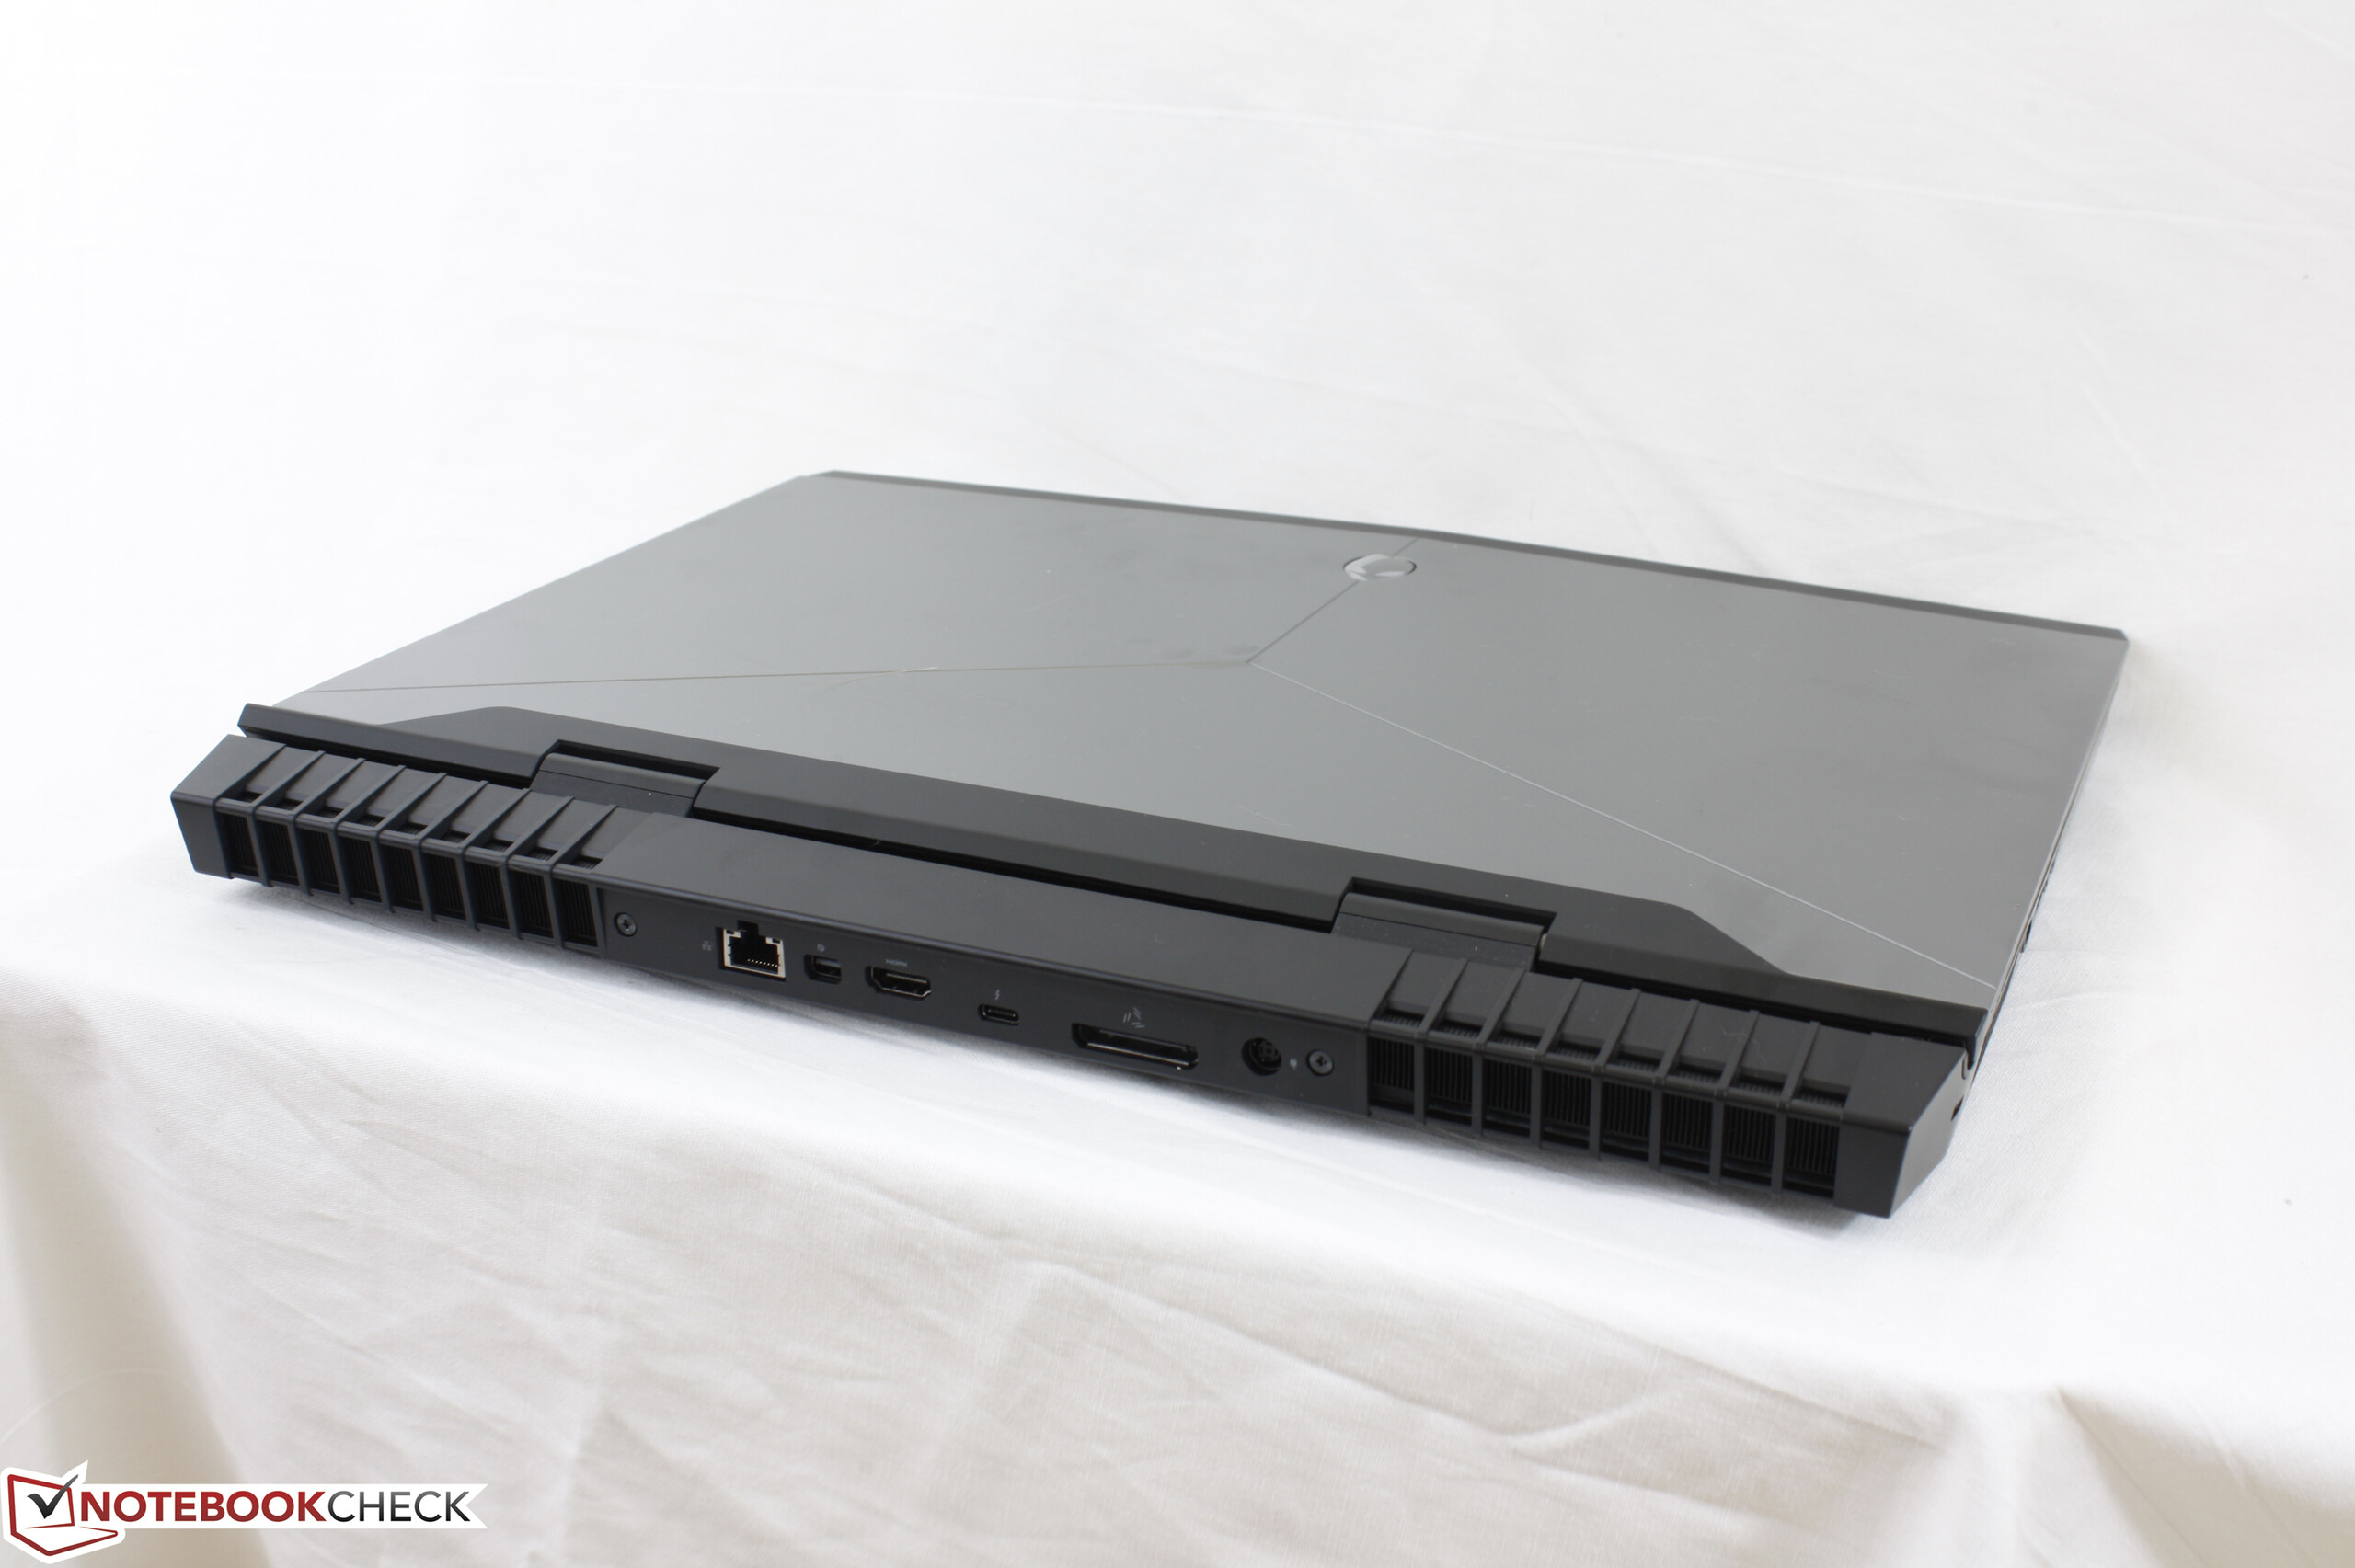
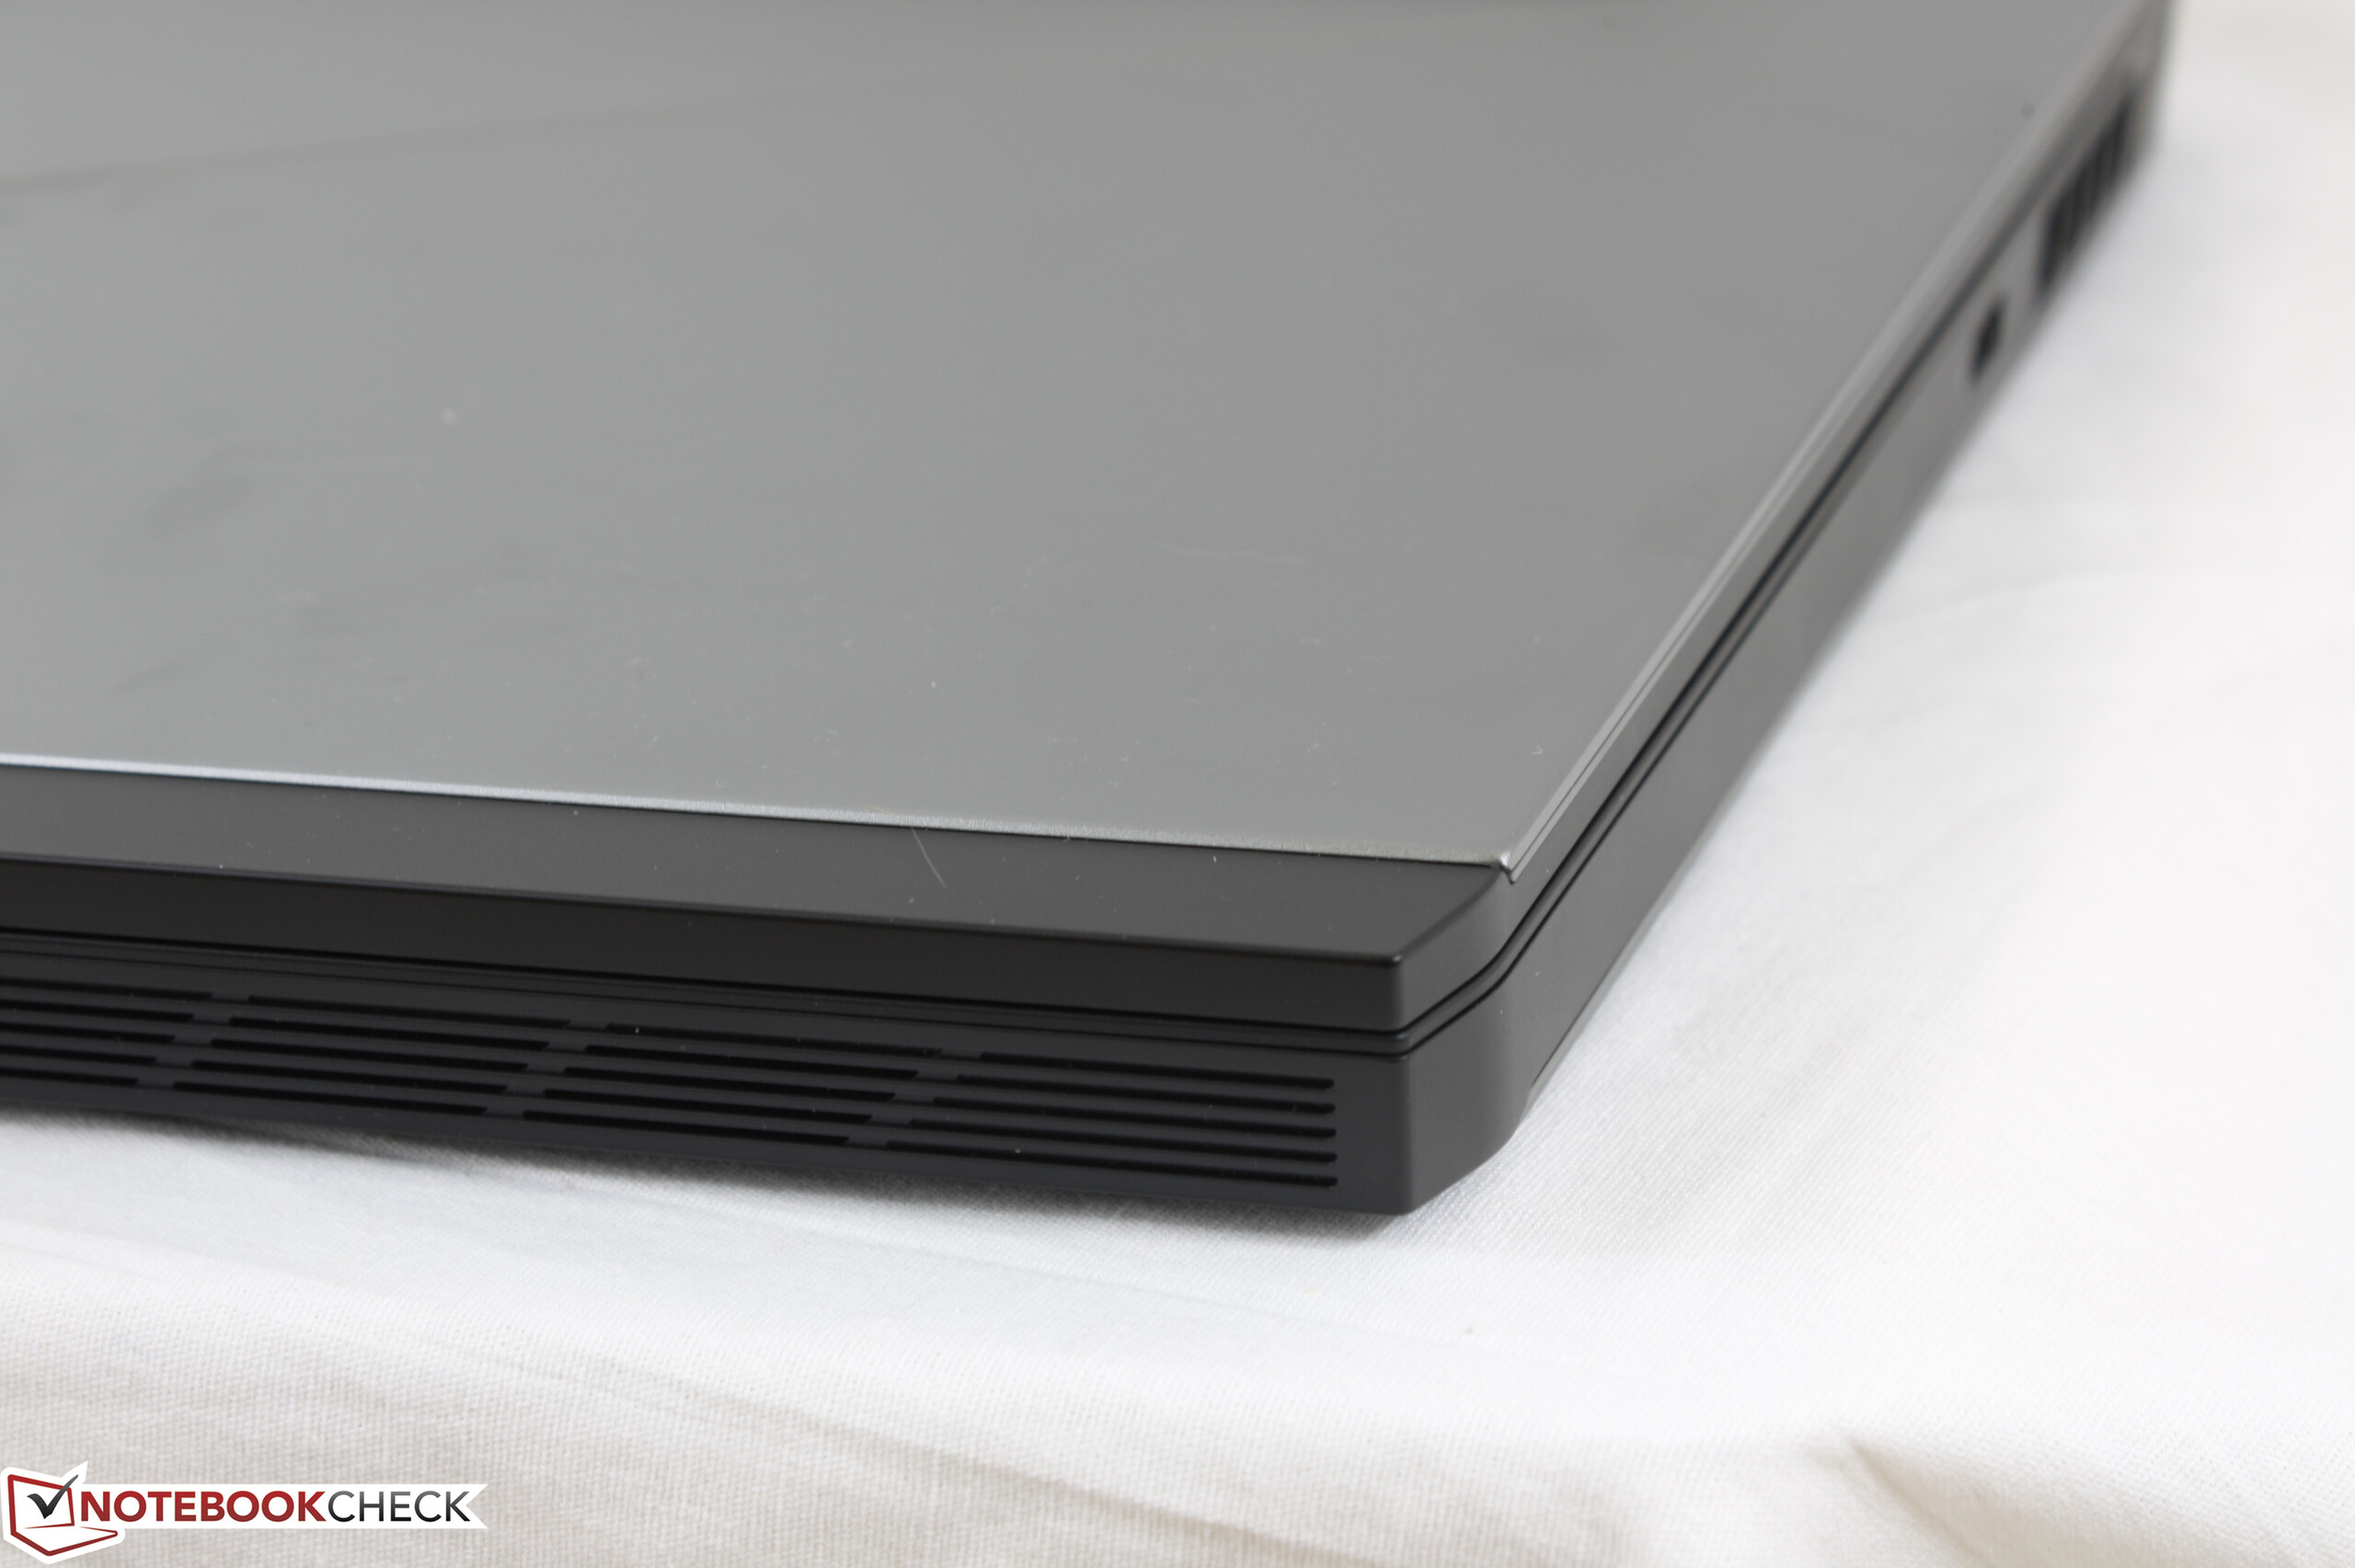
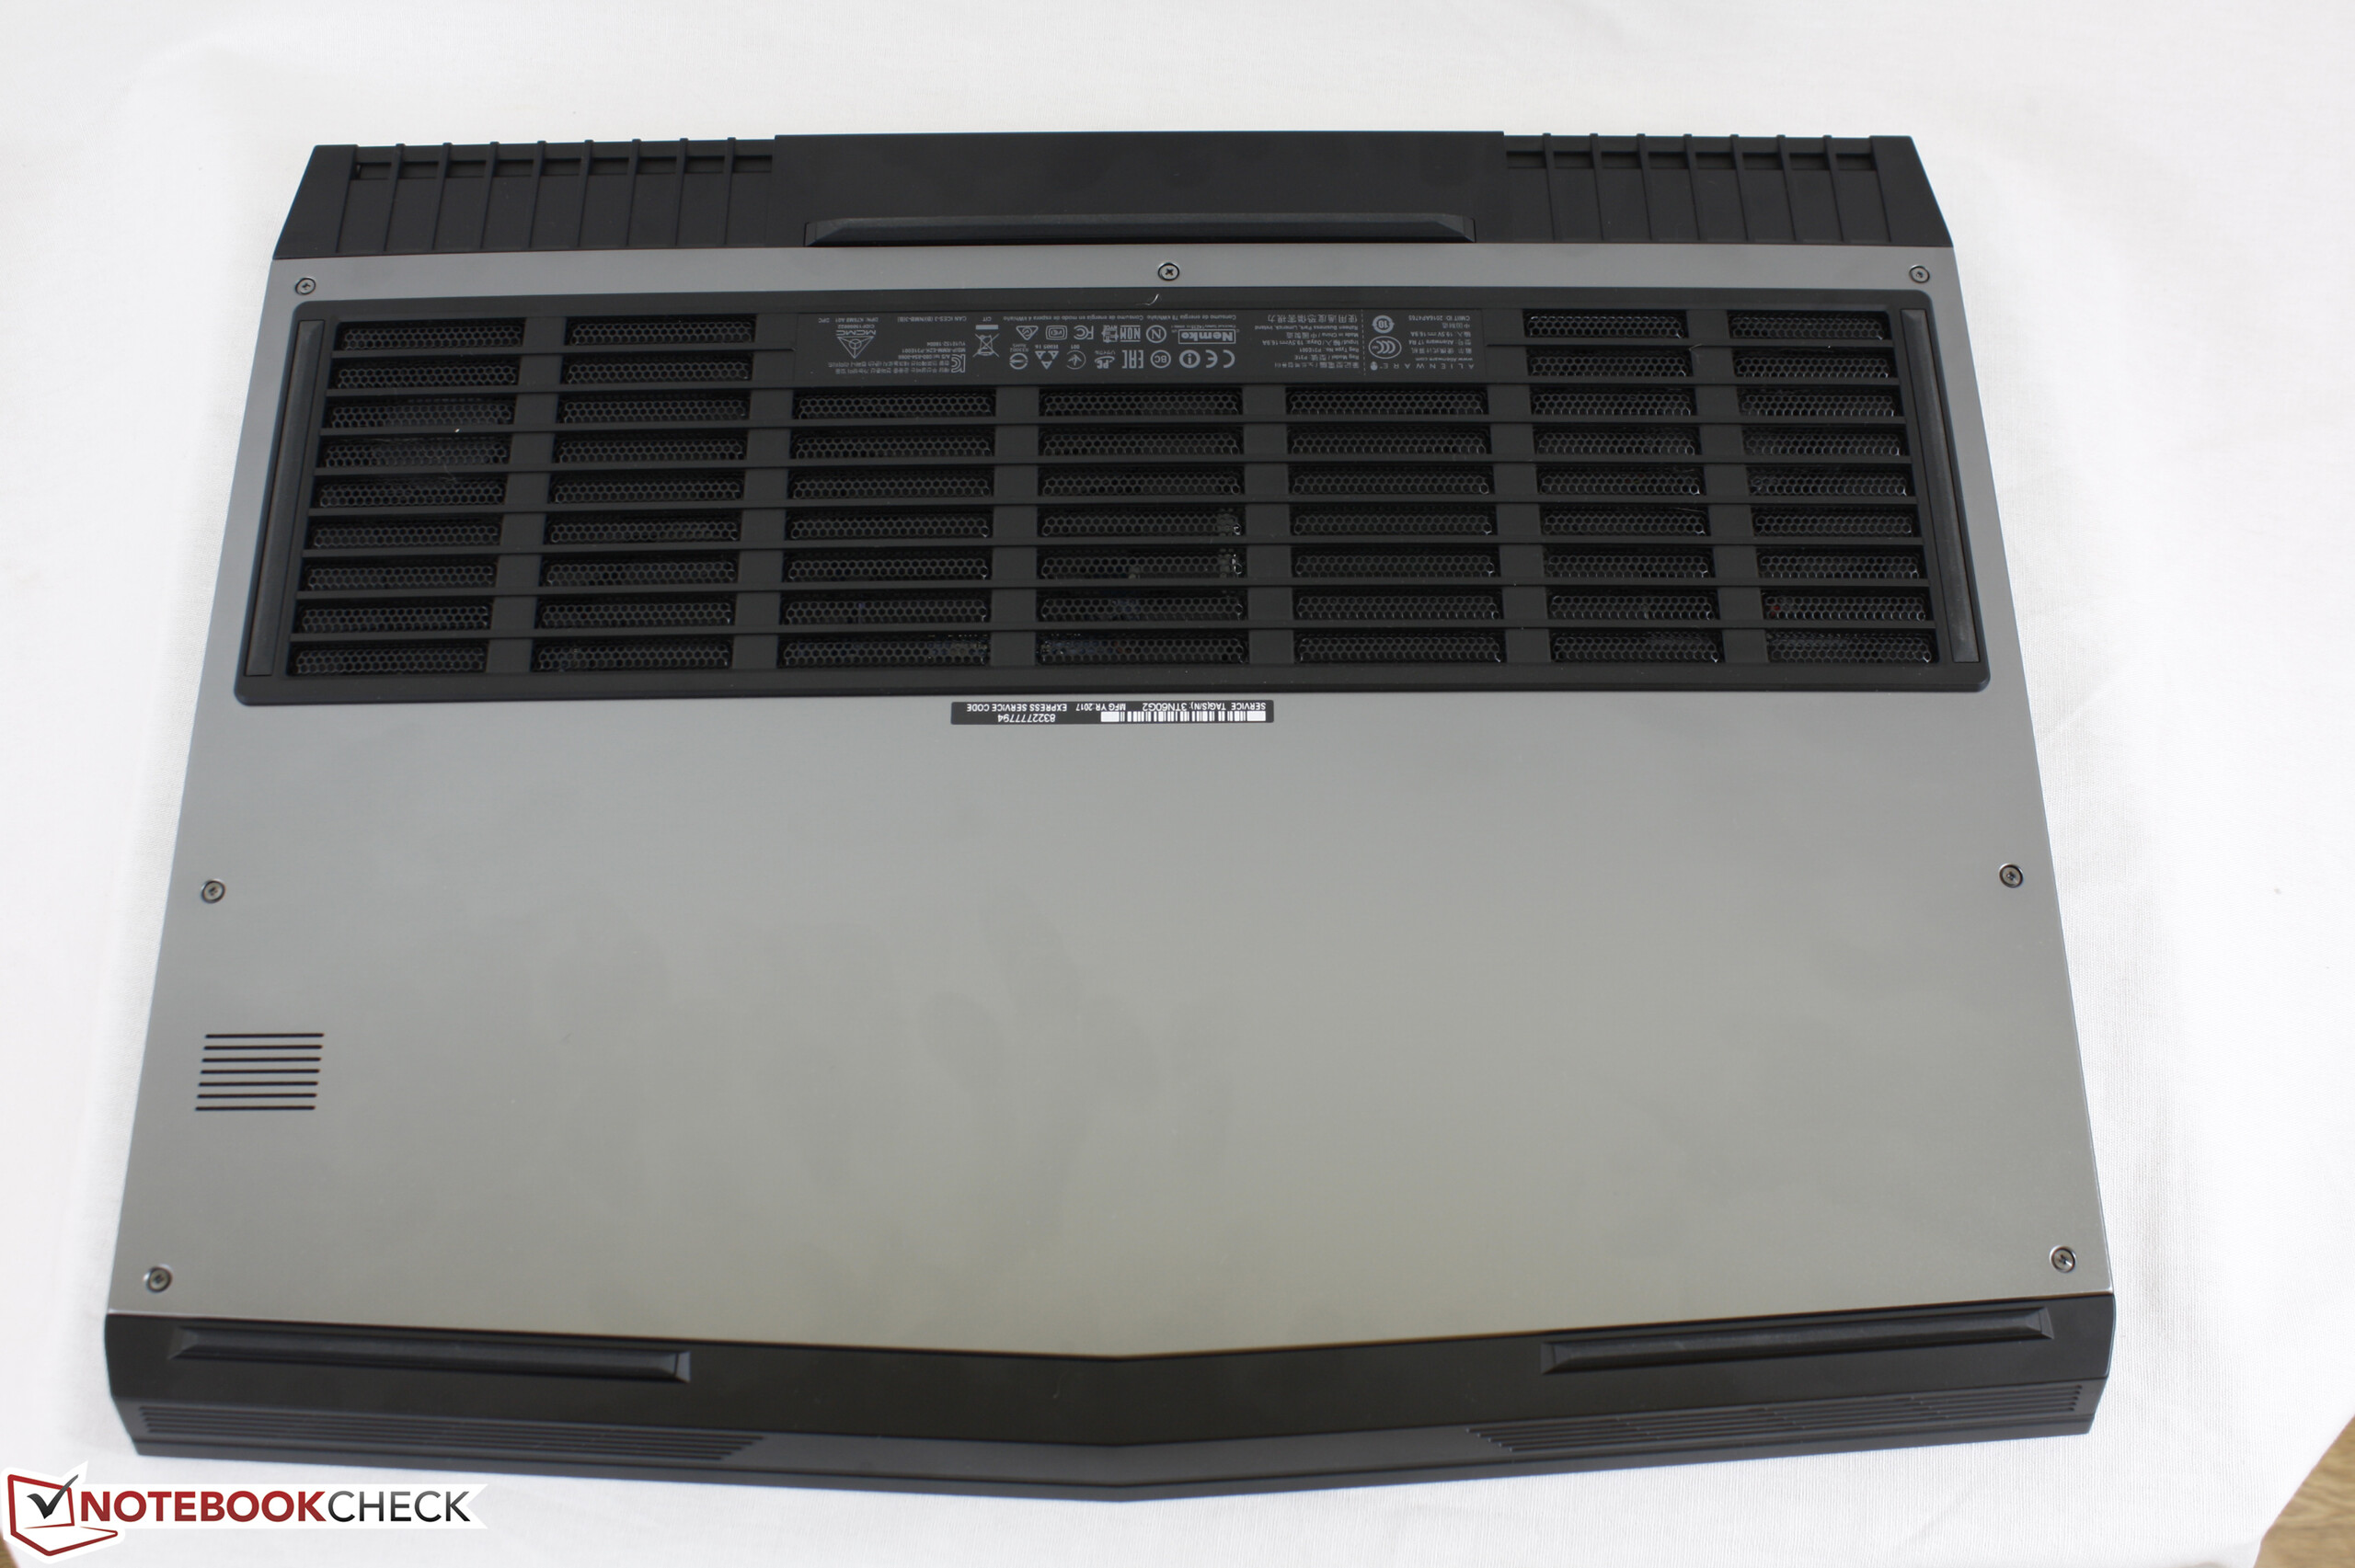
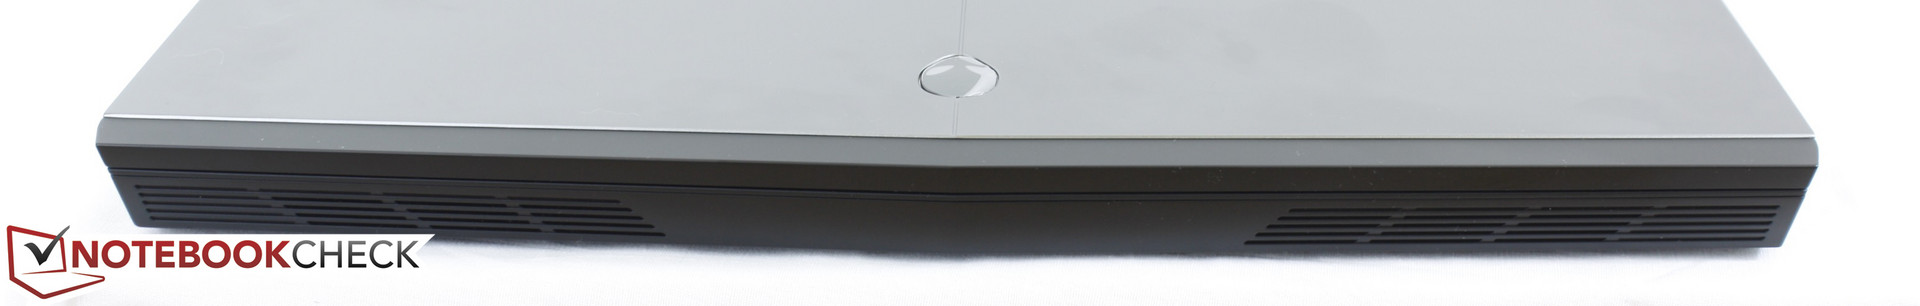
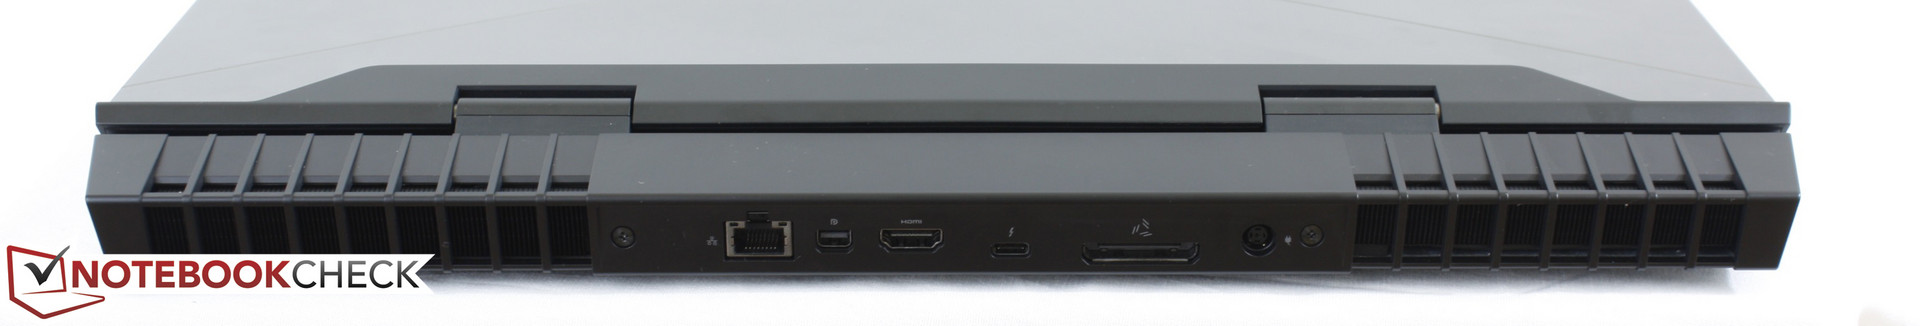
新的底盘设计精美,触感优秀。请注意,GTX 1080到达了笔记本电脑冷却能力的极限。
注:本文是基于完整评测的缩减版本,阅读完整的英文评测,请点击这里。
Alienware 17 R4
- 05/03/2017 v6 (old)
Allen Ngo
Price comparison
