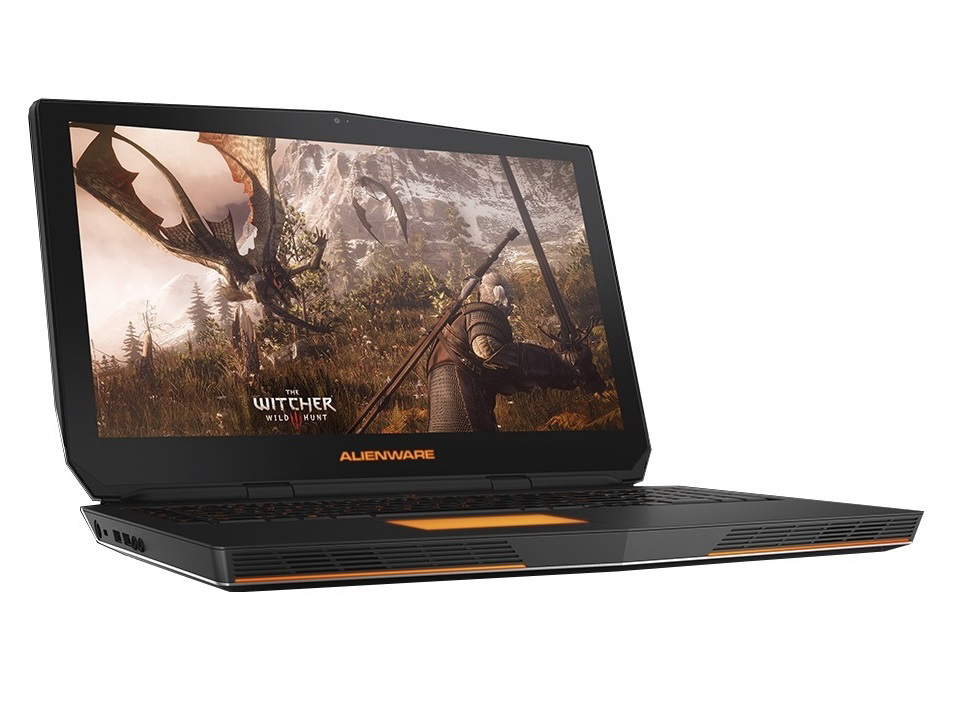
Alienware 17 R2 笔记本电脑简短评测
Alienware 17 R2 (17 Series)
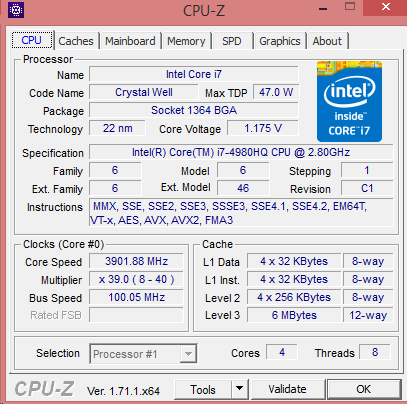
Processor
Intel Core i7-4980HQ 4c/8t 4 x 2.8 - 4 GHz, Haswell
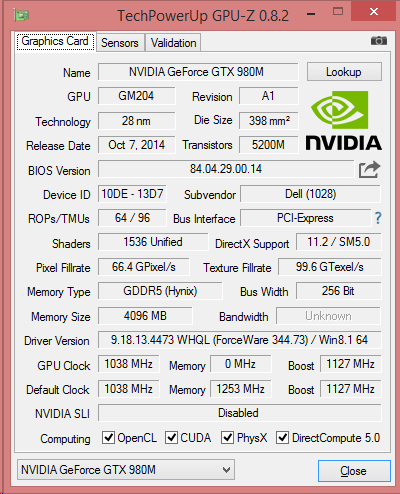
Graphics adapter
NVIDIA GeForce GTX 980M - 4 GB VRAM, Core: 1038 MHz, RAM: 5000 MHz, GDDR5, ForceWare 344.73, Nvidia Optimus
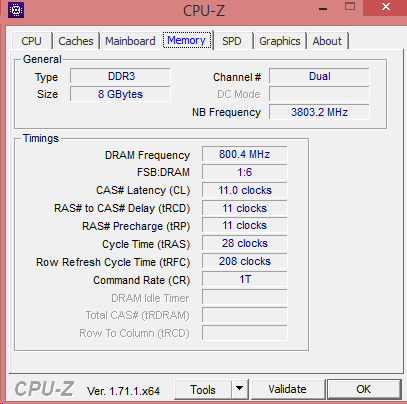
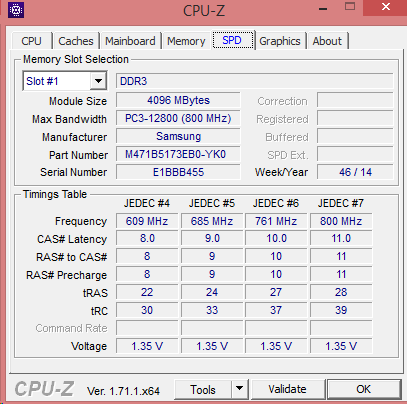
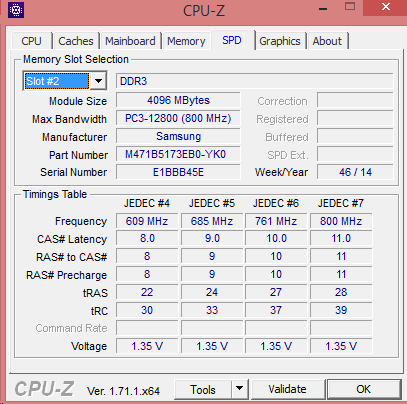
Memory
8 GB
, DDR 1600 MHz, 双通道, 2 内存槽, 均已占用
Display
17.30 inch 16:9, 1920 x 1080 pixel, LG Philips LGD0459 / 173WF4 (Dell P/N: CV69H), IPS, glossy: no
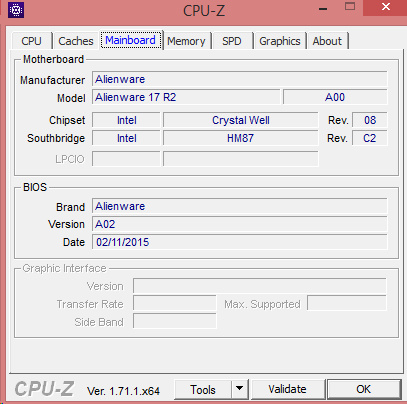
Mainboard
Intel HM87 (Lynx Point)
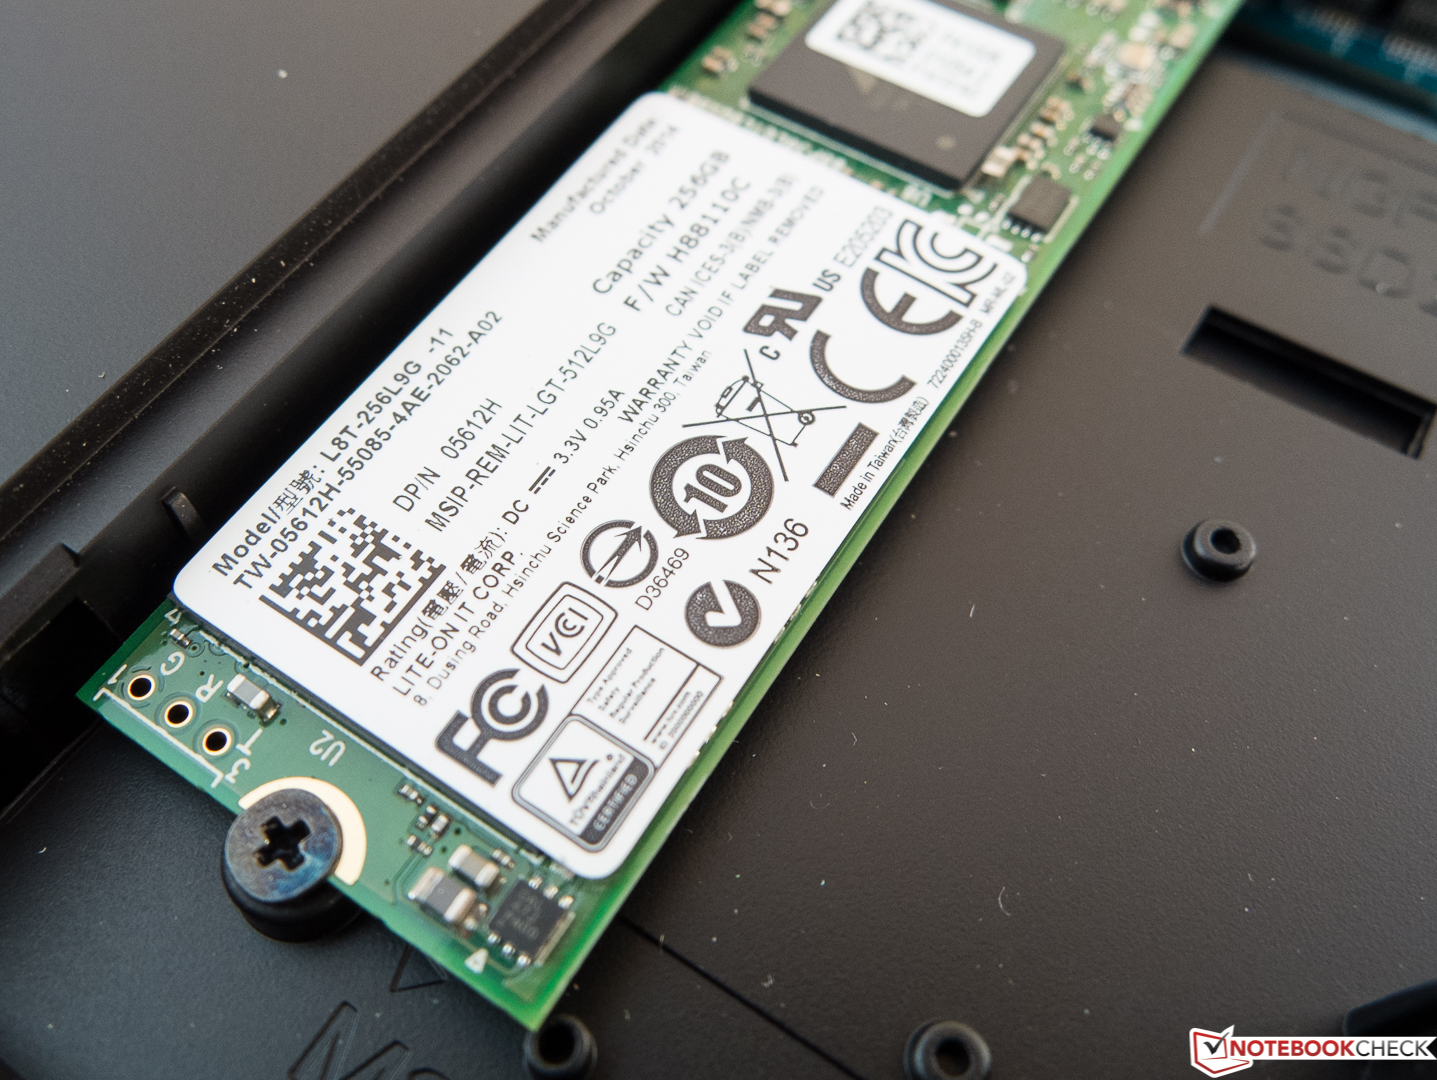
Storage
Lite-On IT L8T-256L9G, 256 GB
, M.2 + 1 x Seagate ST1000LM024 HN-M101MBB 1 TB @ 5400 rpm
Weight
3.68 kg, Power Supply: 646 g
Price
2308 Euro
Note: The manufacturer may use components from different suppliers including display panels, drives or memory sticks with similar specifications.

| |||||||||||||||||||||||||
LG Philips LGD0459 / 173WF4 (Dell P/N: CV69H) tested with X-Rite i1Pro 2
Maximum: 331 cd/m² (Nits) Average: 306.6 cd/m²Brightness Distribution: 84 %
Center on Battery: 331 cd/m²
Contrast: 1103:1 (Black: 0.3 cd/m²)
ΔE ColorChecker Calman: 4.88 | ∀{0.5-29.43 Ø4.72}
ΔE Greyscale Calman: 3.63 | ∀{0.09-98 Ø4.97}
84.2% sRGB (Argyll 1.6.3 3D)
55% AdobeRGB 1998 (Argyll 1.6.3 3D)
61.6% AdobeRGB 1998 (Argyll 3D)
84.3% sRGB (Argyll 3D)
66.6% Display P3 (Argyll 3D)
Gamma: 2.17
CCT: 6325 K
| Alienware 17 R2 GeForce GTX 980M, 4980HQ, Lite-On IT L8T-256L9G | Asus G751JY-T7009H GeForce GTX 980M, 4710HQ, Samsung SSD XP941 MZHPU256HCGL | One K73-5N GeForce GTX 980M, 4790K, Samsung SSD 840 EVO 500GB | Alienware 17 (GTX 880M) GeForce GTX 880M, 4700MQ, WDC Scorpio Blue WD10JPVX-75JC3T0 | |
|---|---|---|---|---|
| Display | 1% | -2% | 3% | |
| Display P3 Coverage (%) | 66.6 | 66.4 0% | 61 -8% | 67.1 1% |
| sRGB Coverage (%) | 84.3 | 85.3 1% | 85 1% | 87.8 4% |
| AdobeRGB 1998 Coverage (%) | 61.6 | 62.1 1% | 62.2 1% | 64.2 4% |
| Screen | -6% | -40% | -46% | |
| Brightness middle (cd/m²) | 331 | 329 -1% | 321 -3% | 302 -9% |
| Brightness (cd/m²) | 307 | 326 6% | 308 0% | 284 -7% |
| Brightness Distribution (%) | 84 | 93 11% | 86 2% | 90 7% |
| Black Level * (cd/m²) | 0.3 | 0.47 -57% | 0.31 -3% | 0.49 -63% |
| Contrast (:1) | 1103 | 700 -37% | 1035 -6% | 616 -44% |
| Colorchecker dE 2000 * | 4.88 | 3.95 19% | 10.3 -111% | 9.31 -91% |
| Greyscale dE 2000 * | 3.63 | 3.36 7% | 10.64 -193% | 9.63 -165% |
| Gamma | 2.17 101% | 2.46 89% | 2.74 80% | 2.13 103% |
| CCT | 6325 103% | 5961 109% | 13108 50% | 10778 60% |
| Color Space (Percent of AdobeRGB 1998) (%) | 55 | 56 2% | 54 -2% | 57 4% |
| Color Space (Percent of sRGB) (%) | 84.2 | |||
| Total Average (Program / Settings) | -3% /
-4% | -21% /
-29% | -22% /
-33% |
* ... smaller is better
| Cinebench R15 | |
| CPU Multi 64Bit (sort by value) | |
| Alienware 17 R2 | |
| Asus G751JY-T7009H | |
| One K73-5N | |
| Alienware 17 (GTX 880M) | |
| CPU Single 64Bit (sort by value) | |
| Alienware 17 R2 | |
| Asus G751JY-T7009H | |
| One K73-5N | |
| Alienware 17 (GTX 880M) | |
| Cinebench R11.5 | |
| CPU Multi 64Bit (sort by value) | |
| Alienware 17 R2 | |
| Asus G751JY-T7009H | |
| One K73-5N | |
| Alienware 17 (GTX 880M) | |
| CPU Single 64Bit (sort by value) | |
| Alienware 17 R2 | |
| Asus G751JY-T7009H | |
| One K73-5N | |
| Alienware 17 (GTX 880M) | |
| PCMark 7 | |
| Score (sort by value) | |
| Alienware 17 R2 | |
| Asus G751JY-T7009H | |
| One K73-5N | |
| Alienware 17 (GTX 880M) | |
| Productivity (sort by value) | |
| Alienware 17 R2 | |
| Asus G751JY-T7009H | |
| One K73-5N | |
| Alienware 17 (GTX 880M) | |
| PCMark 8 | |
| Home Score Accelerated v2 (sort by value) | |
| Alienware 17 R2 | |
| Asus G751JY-T7009H | |
| One K73-5N | |
| Alienware 17 (GTX 880M) | |
| Work Score Accelerated v2 (sort by value) | |
| Alienware 17 R2 | |
| Asus G751JY-T7009H | |
| One K73-5N | |
| Alienware 17 (GTX 880M) | |
| PCMark 7 Score | 6622 points | |
| PCMark 8 Home Score Accelerated v2 | 4402 points | |
| PCMark 8 Work Score Accelerated v2 | 5097 points | |
Help | ||
| Alienware 17 R2 | Asus G751JY-T7009H | One K73-5N | Alienware 17 (GTX 880M) | |
|---|---|---|---|---|
| AS SSD | 35% | 18% | ||
| Seq Read (MB/s) | 481.8 | 1104 129% | 515 7% | |
| 4K Read (MB/s) | 29.14 | 28.96 -1% | 42.22 45% | |
| 4K-64 Read (MB/s) | 345.3 | 405.6 17% | 336 -3% | |
| Score Write (Points) | 362 | 342 -6% | 449 24% | |
| CrystalDiskMark 3.0 | 32% | 21% | -46% | |
| Read Seq (MB/s) | 485.9 | 1005 107% | 535 10% | 108.2 -78% |
| Read 4k (MB/s) | 31.76 | 31.54 -1% | 45.46 43% | 20.49 -35% |
| Read 4k QD32 (MB/s) | 360.7 | 322.3 -11% | 398.7 11% | 273.7 -24% |
| Total Average (Program / Settings) | 34% /
33% | 20% /
20% | -46% /
-46% |

Lite-On IT L8T-256L9G
Sequential Read:
485.9 MB/s
Sequential Write:
414 MB/s
512K Read:
367.9 MB/s
512K Write:
391.4 MB/s
4K Read:
31.76 MB/s
4K Write:
66.4 MB/s
4K QD32 Read:
360.7 MB/s
4K QD32 Write:
328.2 MB/s
| 3DMark | |
| 1920x1080 Fire Strike Graphics (sort by value) | |
| Alienware 17 R2 | |
| Asus G751JY-T7009H | |
| One K73-5N | |
| Alienware 17 (GTX 880M) | |
| 1280x720 Cloud Gate Standard Graphics (sort by value) | |
| Alienware 17 R2 | |
| Asus G751JY-T7009H | |
| One K73-5N | |
| Alienware 17 (GTX 880M) | |
| 3DMark 11 - 1280x720 Performance GPU (sort by value) | |
| Alienware 17 R2 | |
| Asus G751JY-T7009H | |
| One K73-5N | |
| Alienware 17 (GTX 880M) | |
| 3DMark 11 Performance | 11122 points | |
| 3DMark Cloud Gate Standard Score | 19882 points | |
| 3DMark Fire Strike Score | 8185 points | |
Help | ||
Dragon Age: Inquisition | GRID: Autosport | Thief | Company of Heroes 2 | Crysis 3 | BioShock Infinite | Tomb Raider
| Dragon Age: Inquisition | |
| 1920x1080 Ultra Graphics Quality AA:2x MS (sort by value) | |
| Alienware 17 R2 | |
| Asus G751JY-T7009H | |
| One K73-5N | |
| 1920x1080 High Graphics Quality (sort by value) | |
| Alienware 17 R2 | |
| Asus G751JY-T7009H | |
| One K73-5N | |
| GRID: Autosport | |
| 1920x1080 Ultra Preset AA:4x MS (sort by value) | |
| Alienware 17 R2 | |
| Asus G751JY-T7009H | |
| 1920x1080 High Preset (sort by value) | |
| Alienware 17 R2 | |
| Asus G751JY-T7009H | |
| Thief | |
| 1920x1080 Very High Preset AA:FXAA & High SS AF:8x (sort by value) | |
| Alienware 17 R2 | |
| Asus G751JY-T7009H | |
| Alienware 17 (GTX 880M) | |
| 1366x768 High Preset AA:FXAA & Low SS AF:4x (sort by value) | |
| Alienware 17 R2 | |
| Asus G751JY-T7009H | |
| Alienware 17 (GTX 880M) | |
| Company of Heroes 2 | |
| 1920x1080 Maximum / Higher / High AA:High (sort by value) | |
| Alienware 17 R2 | |
| Asus G751JY-T7009H | |
| 1366x768 High AA:Medium (sort by value) | |
| Alienware 17 R2 | |
| Asus G751JY-T7009H | |
| Crysis 3 | |
| 1920x1080 Very High Preset AA:2xSM AF:16x (sort by value) | |
| Alienware 17 R2 | |
| Asus G751JY-T7009H | |
| 1366x768 High Preset AA:FX AF:16x (sort by value) | |
| Alienware 17 R2 | |
| Asus G751JY-T7009H | |
| BioShock Infinite | |
| 1920x1080 Ultra Preset, DX11 (DDOF) (sort by value) | |
| Alienware 17 R2 | |
| Asus G751JY-T7009H | |
| Alienware 17 (GTX 880M) | |
| 1366x768 High Preset (sort by value) | |
| Alienware 17 R2 | |
| Asus G751JY-T7009H | |
| Alienware 17 (GTX 880M) | |
| Tomb Raider | |
| 1920x1080 Ultra Preset AA:FX AF:16x (sort by value) | |
| Alienware 17 R2 | |
| Asus G751JY-T7009H | |
| Alienware 17 (GTX 880M) | |
| 1366x768 High Preset AA:FX AF:8x (sort by value) | |
| Alienware 17 R2 | |
| Asus G751JY-T7009H | |
| Alienware 17 (GTX 880M) | |
| low | med. | high | ultra | |
|---|---|---|---|---|
| Crysis 3 (2013) | 98.8 | 42.4 | ||
| Tomb Raider (2013) | 241.3 | 100.4 | ||
| BioShock Infinite (2013) | 185.8 | 91.2 | ||
| Company of Heroes 2 (2013) | 77.3 | 36.9 | ||
| Thief (2014) | 90.9 | 56.7 | ||
| GRID: Autosport (2014) | 160 | 105.5 | ||
| Risen 3: Titan Lords (2014) | 34.9 | 35.1 | 44.4 | |
| Ryse: Son of Rome (2014) | 62.1 | 58.6 | 56.6 | |
| Dragon Age: Inquisition (2014) | 62.3 | 46.1 | ||
| Battlefield Hardline (2015) | 98.9 | 65.4 |
Noise level
| Idle |
| 29.4 / 30.8 / 35 dB(A) |
| HDD |
| 31.2 dB(A) |
| DVD |
| 0 / dB(A) |
| Load |
| 43.4 / 51.6 dB(A) |
 | ||
30 dB silent 40 dB(A) audible 50 dB(A) loud |
||
min: | ||
(-) The average temperature for the upper side under maximal load is 40.9 °C / 106 F, compared to the average of 33.9 °C / 93 F for the devices in the class Gaming.
(-) The maximum temperature on the upper side is 50.8 °C / 123 F, compared to the average of 40.4 °C / 105 F, ranging from 21.2 to 68.8 °C for the class Gaming.
(-) The bottom heats up to a maximum of 48.7 °C / 120 F, compared to the average of 43.2 °C / 110 F
(+) In idle usage, the average temperature for the upper side is 28.1 °C / 83 F, compared to the device average of 33.9 °C / 93 F.
(+) The palmrests and touchpad are cooler than skin temperature with a maximum of 30.6 °C / 87.1 F and are therefore cool to the touch.
(±) The average temperature of the palmrest area of similar devices was 28.8 °C / 83.8 F (-1.8 °C / -3.3 F).
| Alienware 17 R2 GeForce GTX 980M, 4980HQ, Lite-On IT L8T-256L9G | Asus G751JY-T7009H GeForce GTX 980M, 4710HQ, Samsung SSD XP941 MZHPU256HCGL | One K73-5N GeForce GTX 980M, 4790K, Samsung SSD 840 EVO 500GB | |
|---|---|---|---|
| Power Consumption | -48% | -123% | |
| Idle Minimum * (Watt) | 8.9 | 22 -147% | 35.2 -296% |
| Idle Average * (Watt) | 16 | 27 -69% | 41.3 -158% |
| Idle Maximum * (Watt) | 26.6 | 32.6 -23% | 47.3 -78% |
| Load Average * (Watt) | 124 | 93.3 25% | 144.2 -16% |
| Load Maximum * (Watt) | 165.8 | 212.8 -28% | 275.9 -66% |
* ... smaller is better
Power Consumption
| Off / Standby | |
| Idle | |
| Load |
|
Key:
min: | |
| Alienware 17 R2 GeForce GTX 980M, 4980HQ, Lite-On IT L8T-256L9G | Asus G751JY-T7009H GeForce GTX 980M, 4710HQ, Samsung SSD XP941 MZHPU256HCGL | One K73-5N GeForce GTX 980M, 4790K, Samsung SSD 840 EVO 500GB | |
|---|---|---|---|
| Battery runtime | -39% | -48% | |
| Reader / Idle (h) | 12.2 | 4.5 -63% | 2.7 -78% |
| WiFi (h) | 5.8 | 3.7 -36% | |
| Load (h) | 1.7 | 1.4 -18% | 1.4 -18% |
Pros
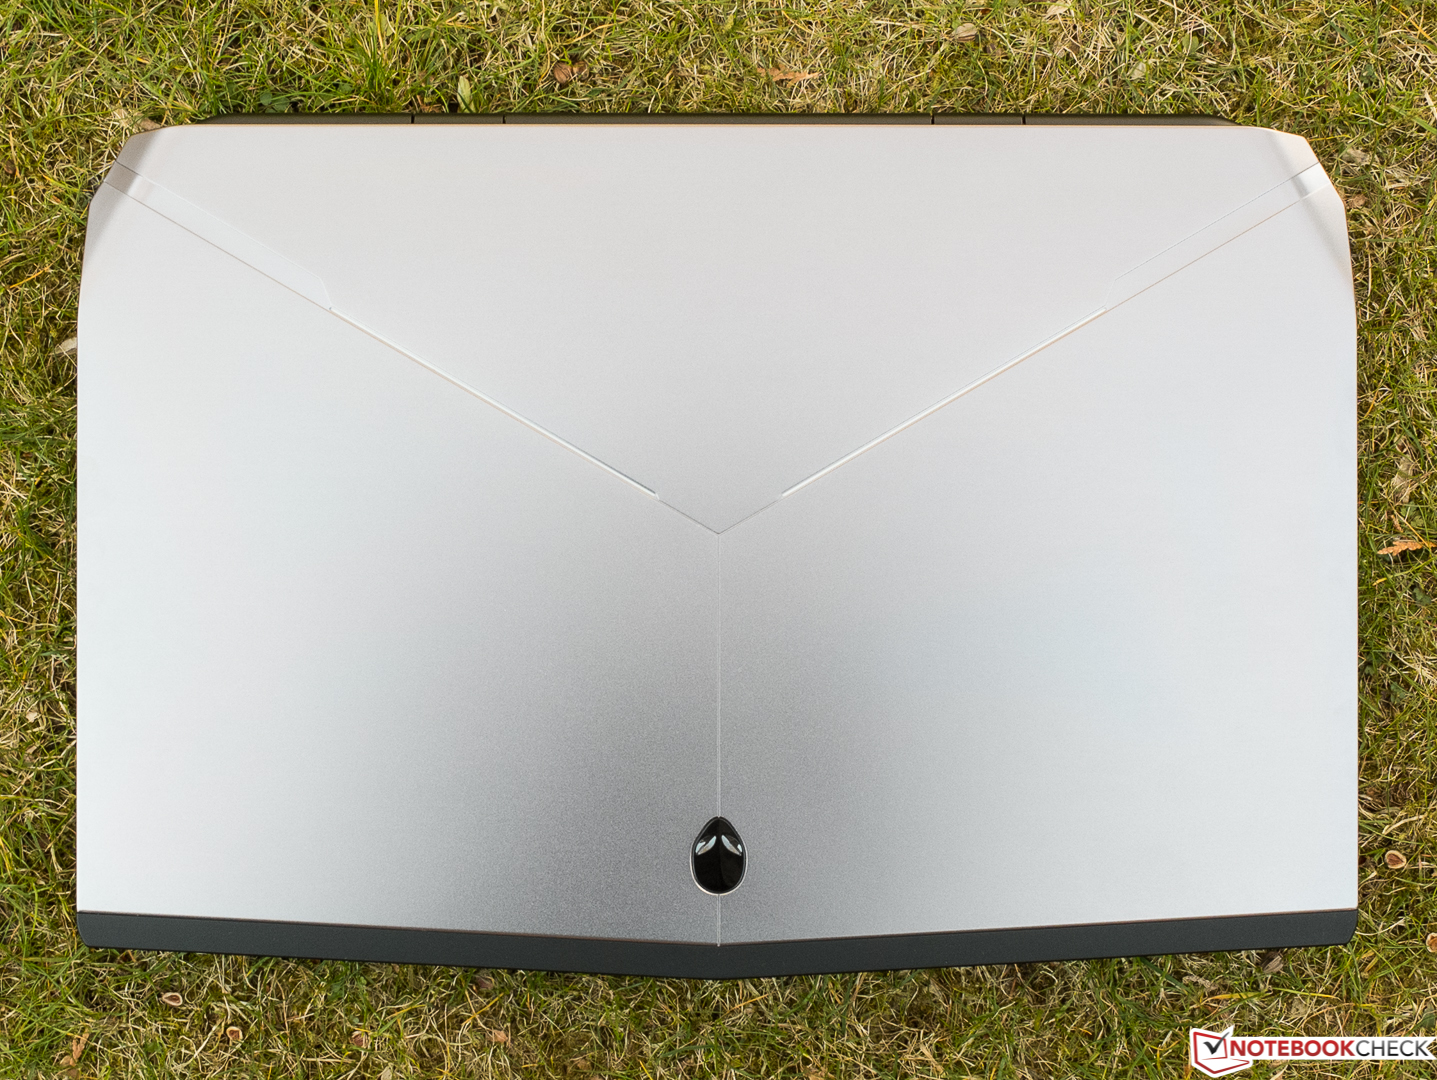
+ 富于表现的设计(个人喜好)
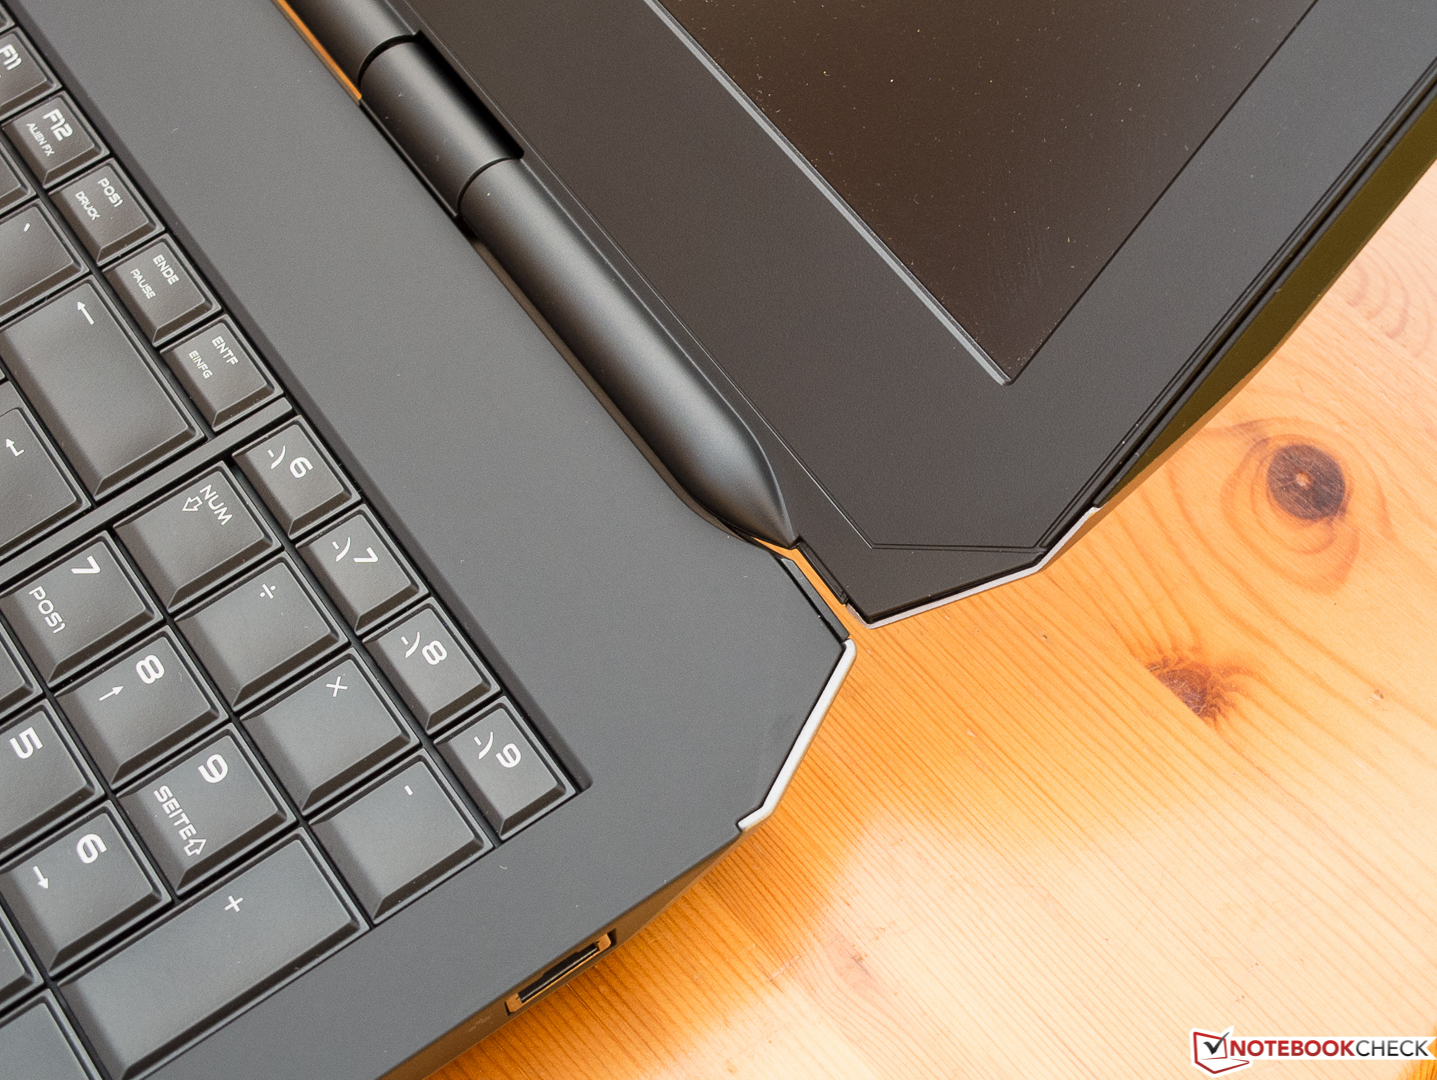
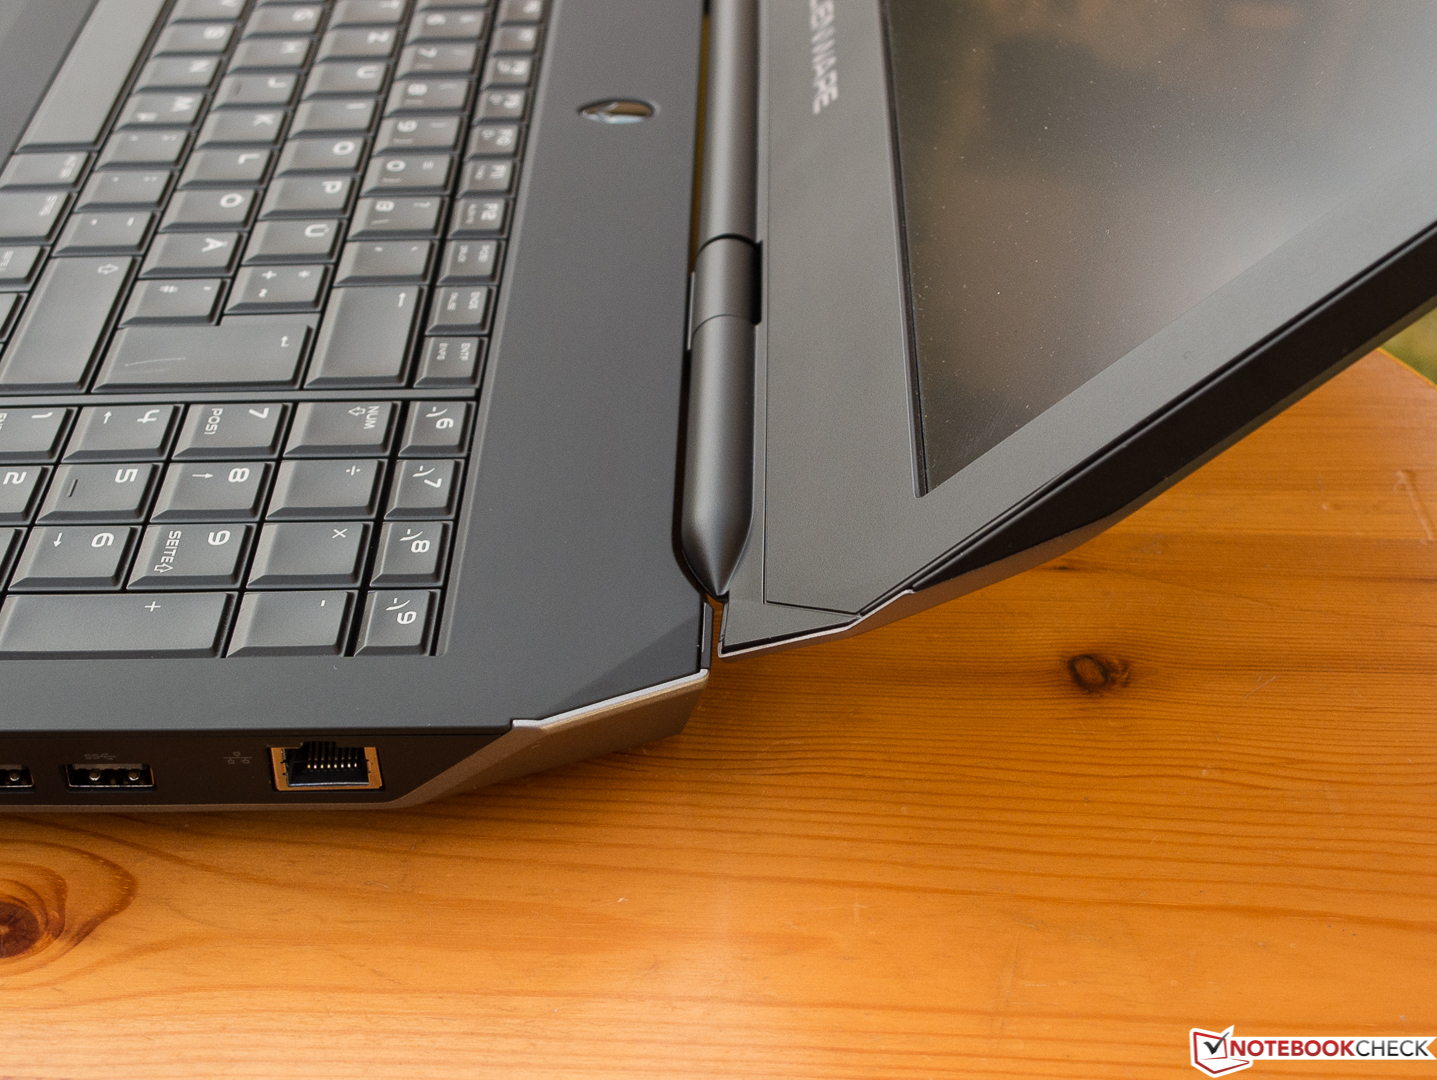
+ 看上去采用了高质量材质
+ 不易沾染指纹
+ 稳定、工艺精良的机身
+ Alienware特有的背光效果
+ 可选图形加速器可以为未来游戏提供性能保证
+ 系统恢复闪盘
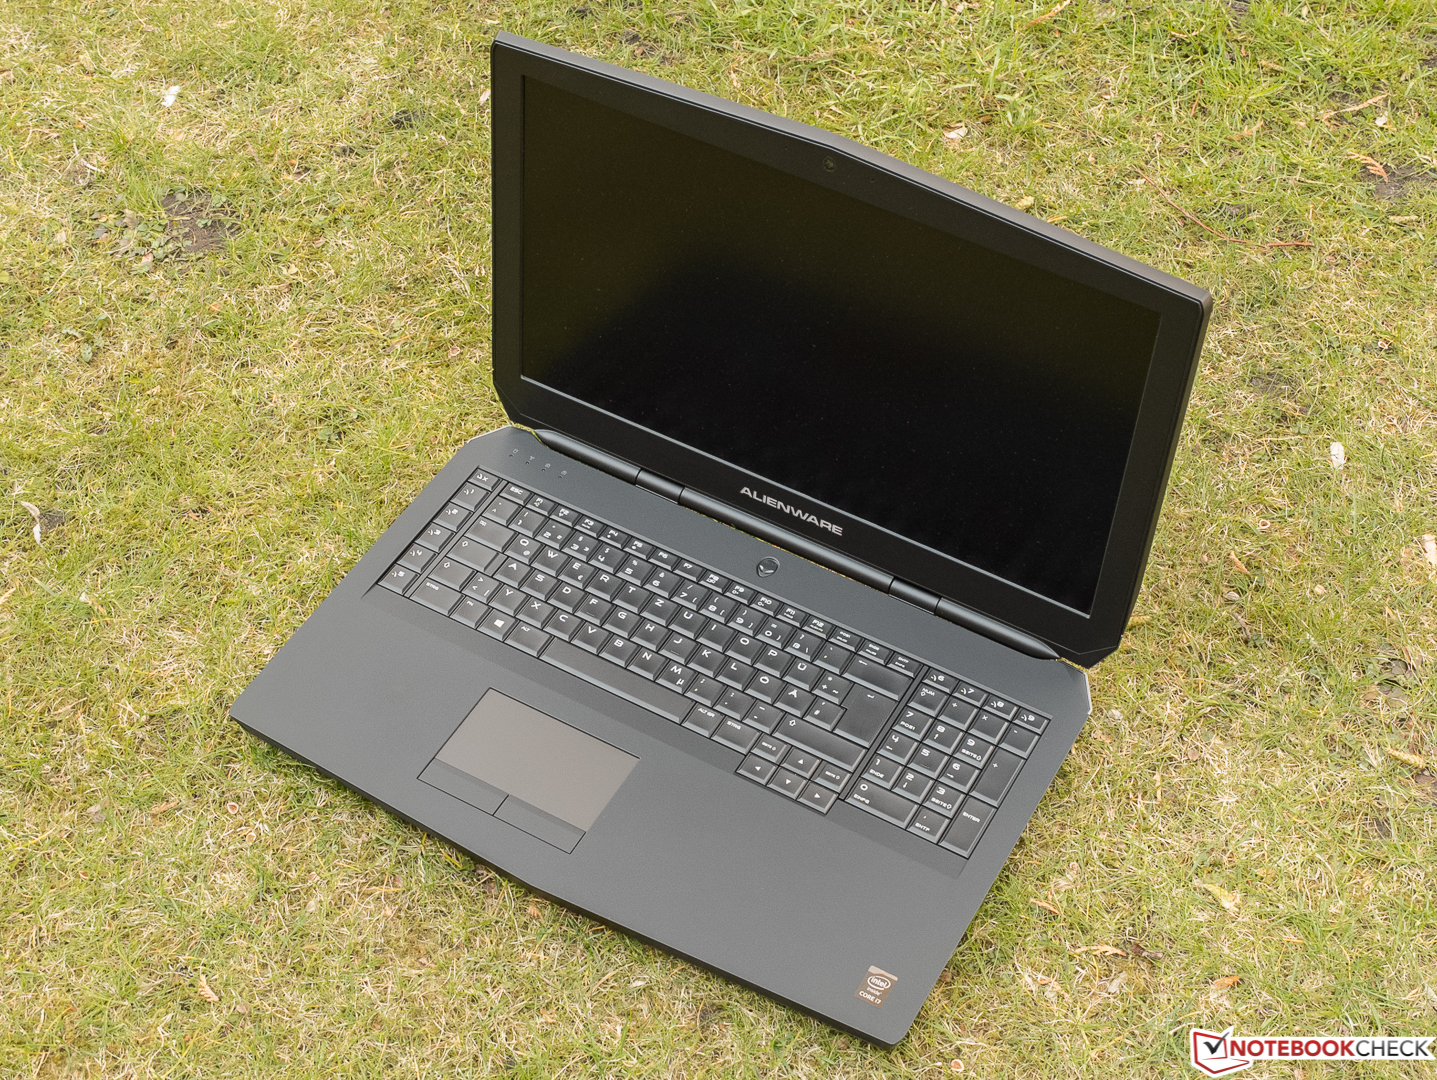
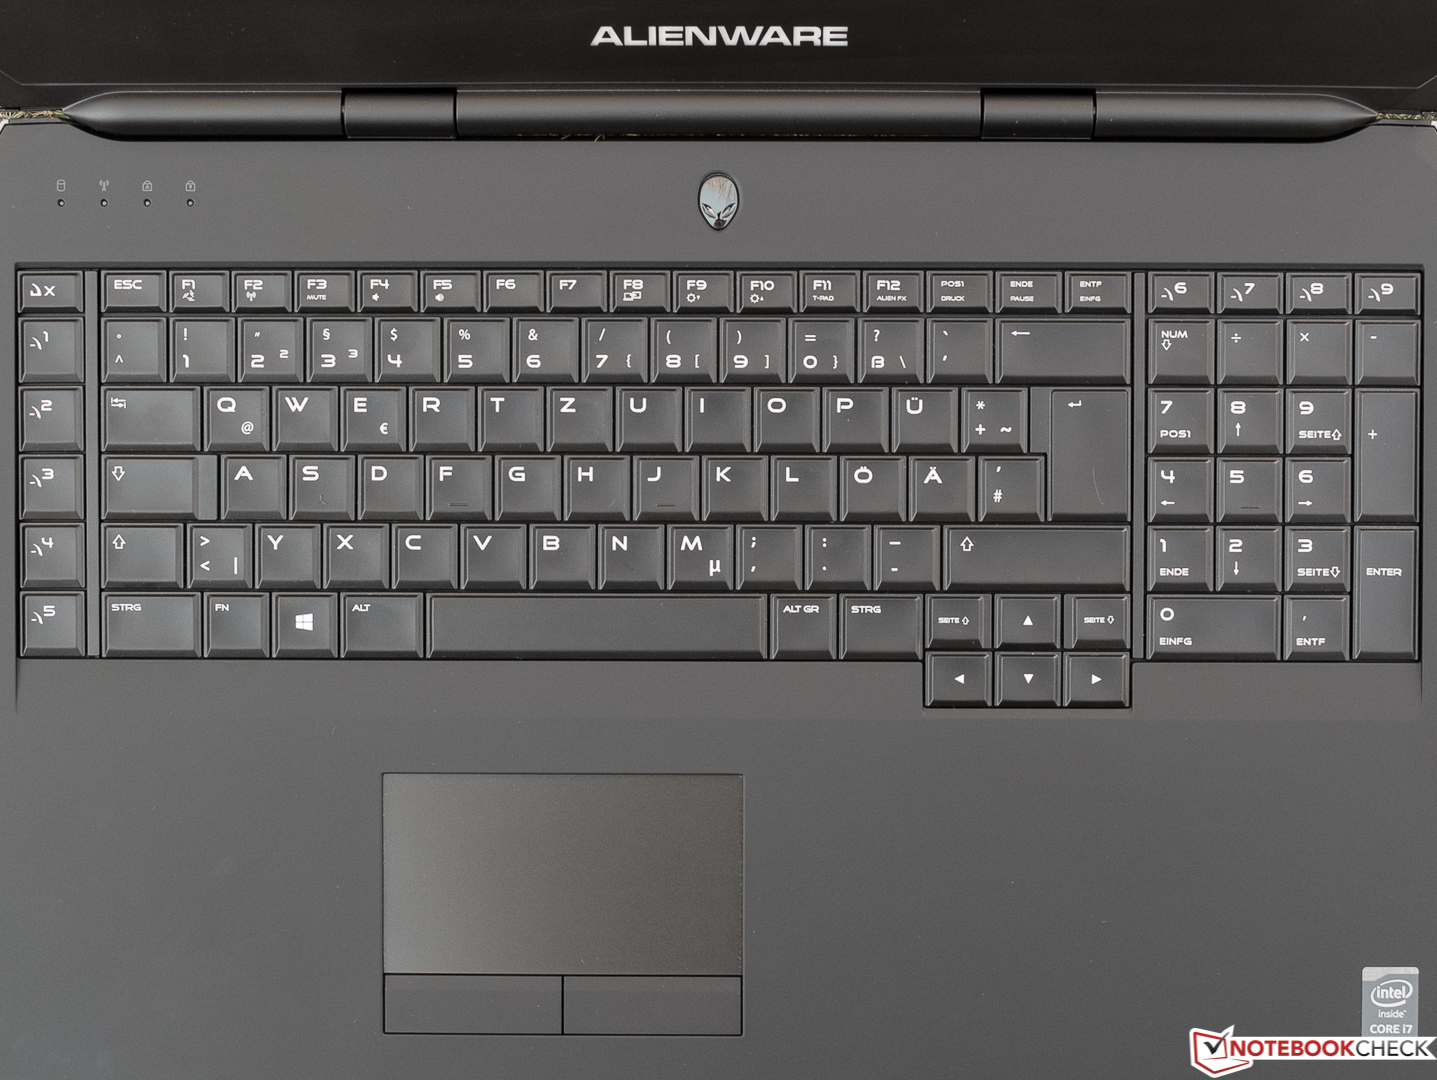
+ 高品质、手感极佳的键盘搭配独特背光(Alien FX)
+ 额外按键,可定义
+ 明亮,高对比度的IPS屏幕
+ 运行流畅
+ 性能足以在高设置下运行所有游戏
+ 搭配低音炮的音响系统效果不错
+ 相对较长的电池续航
Cons
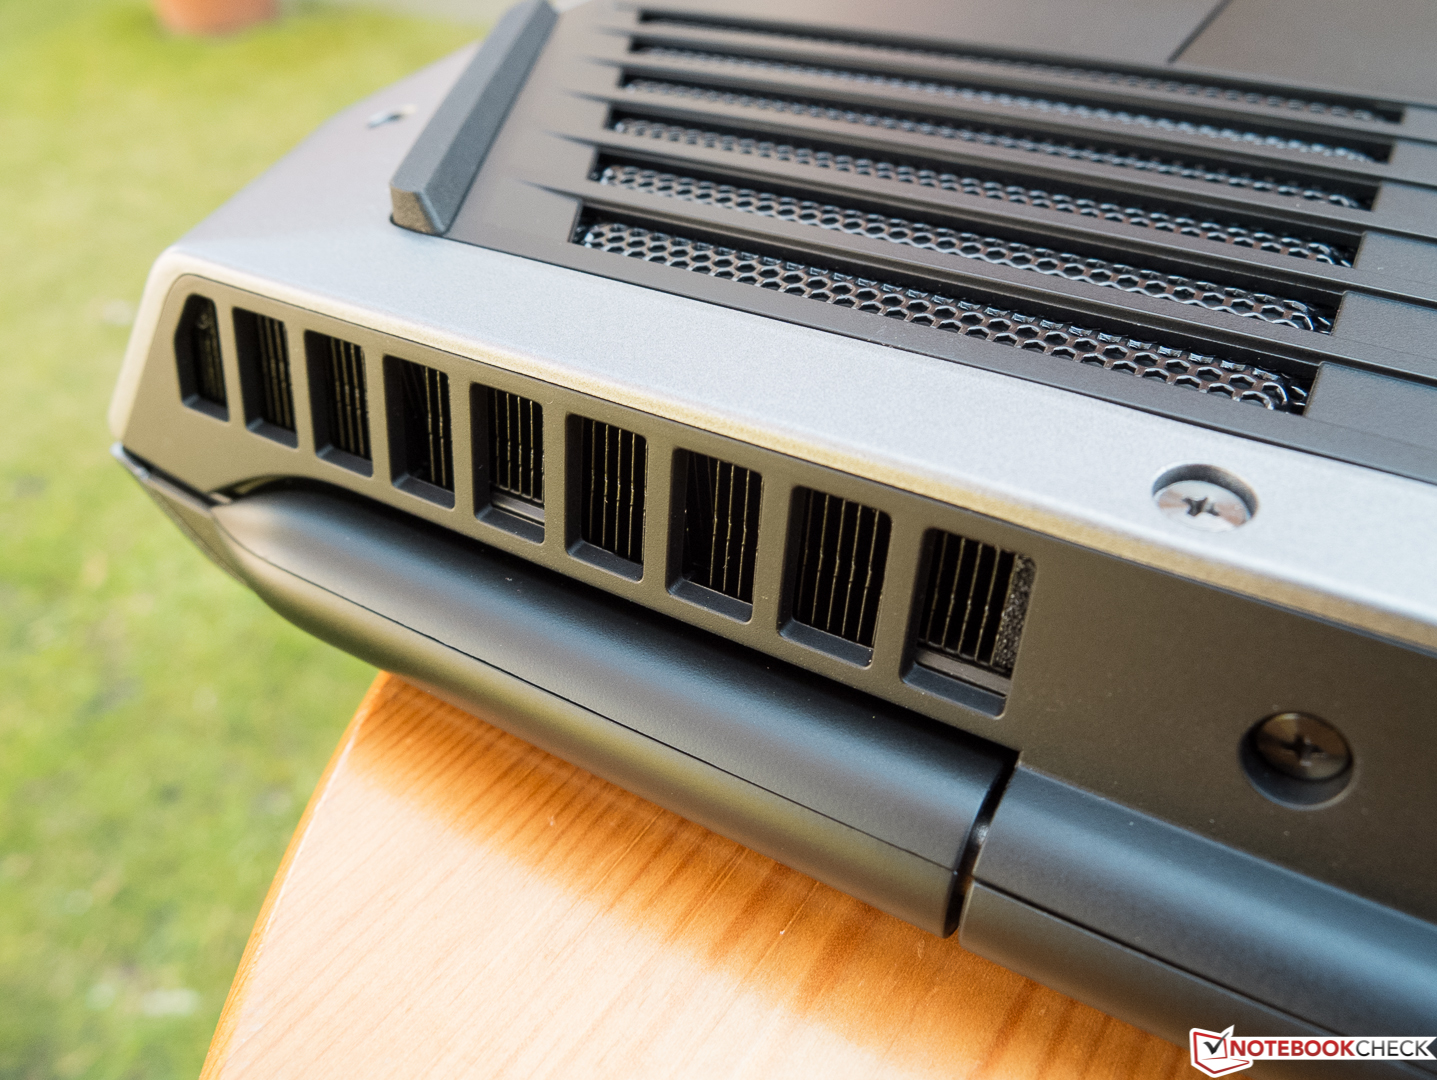
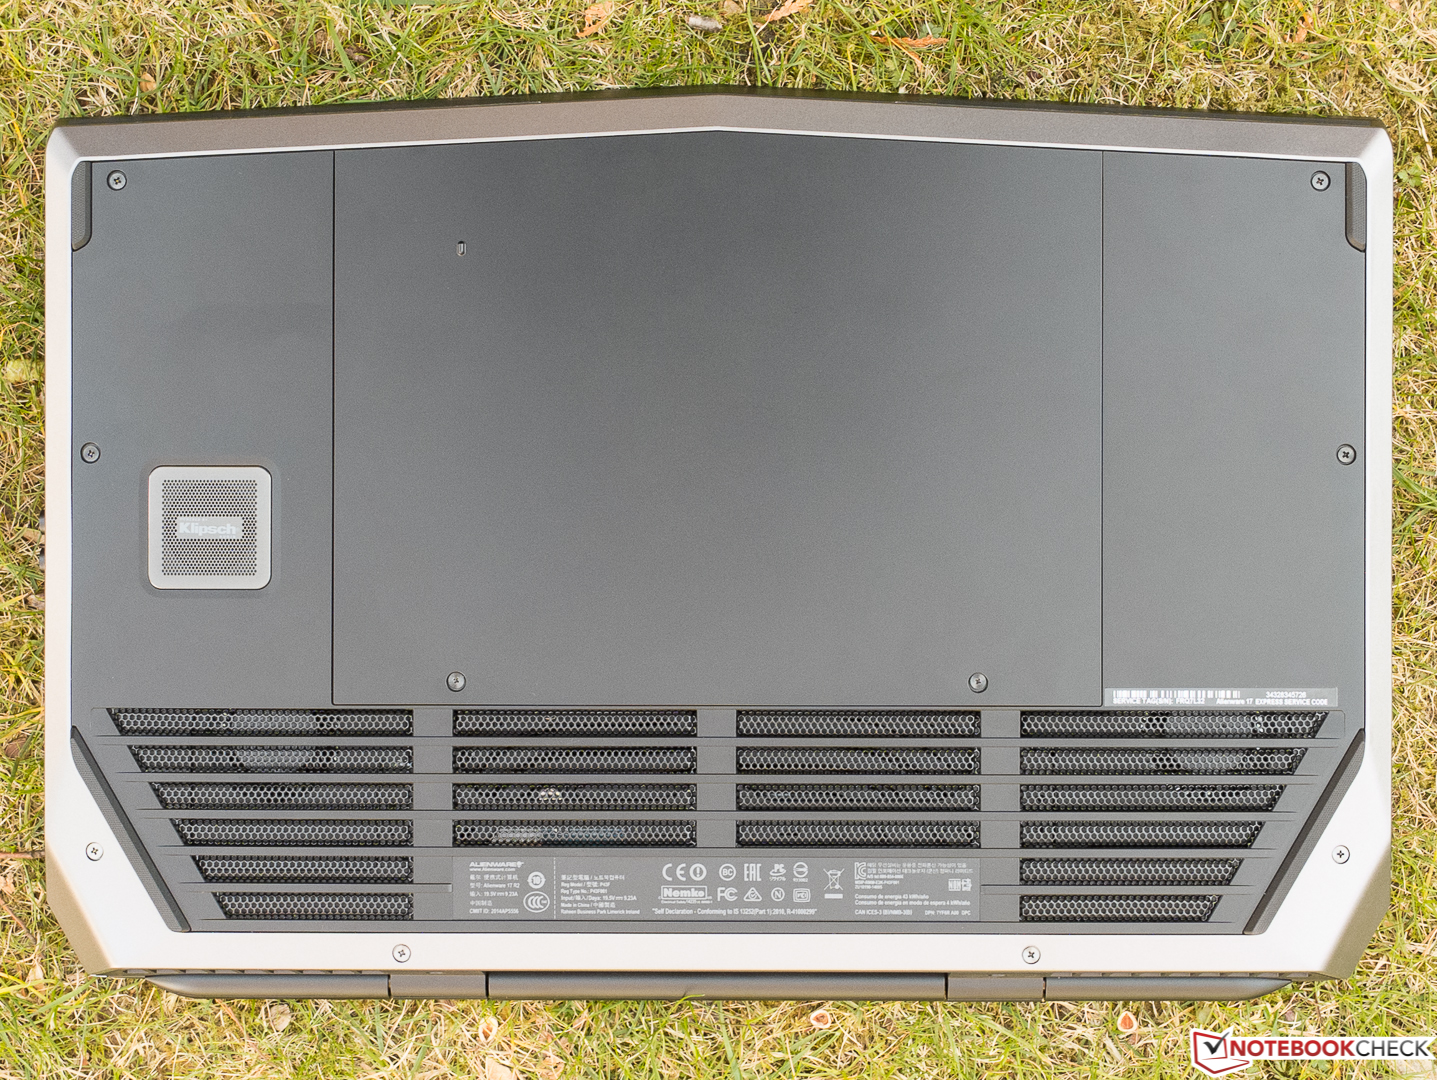
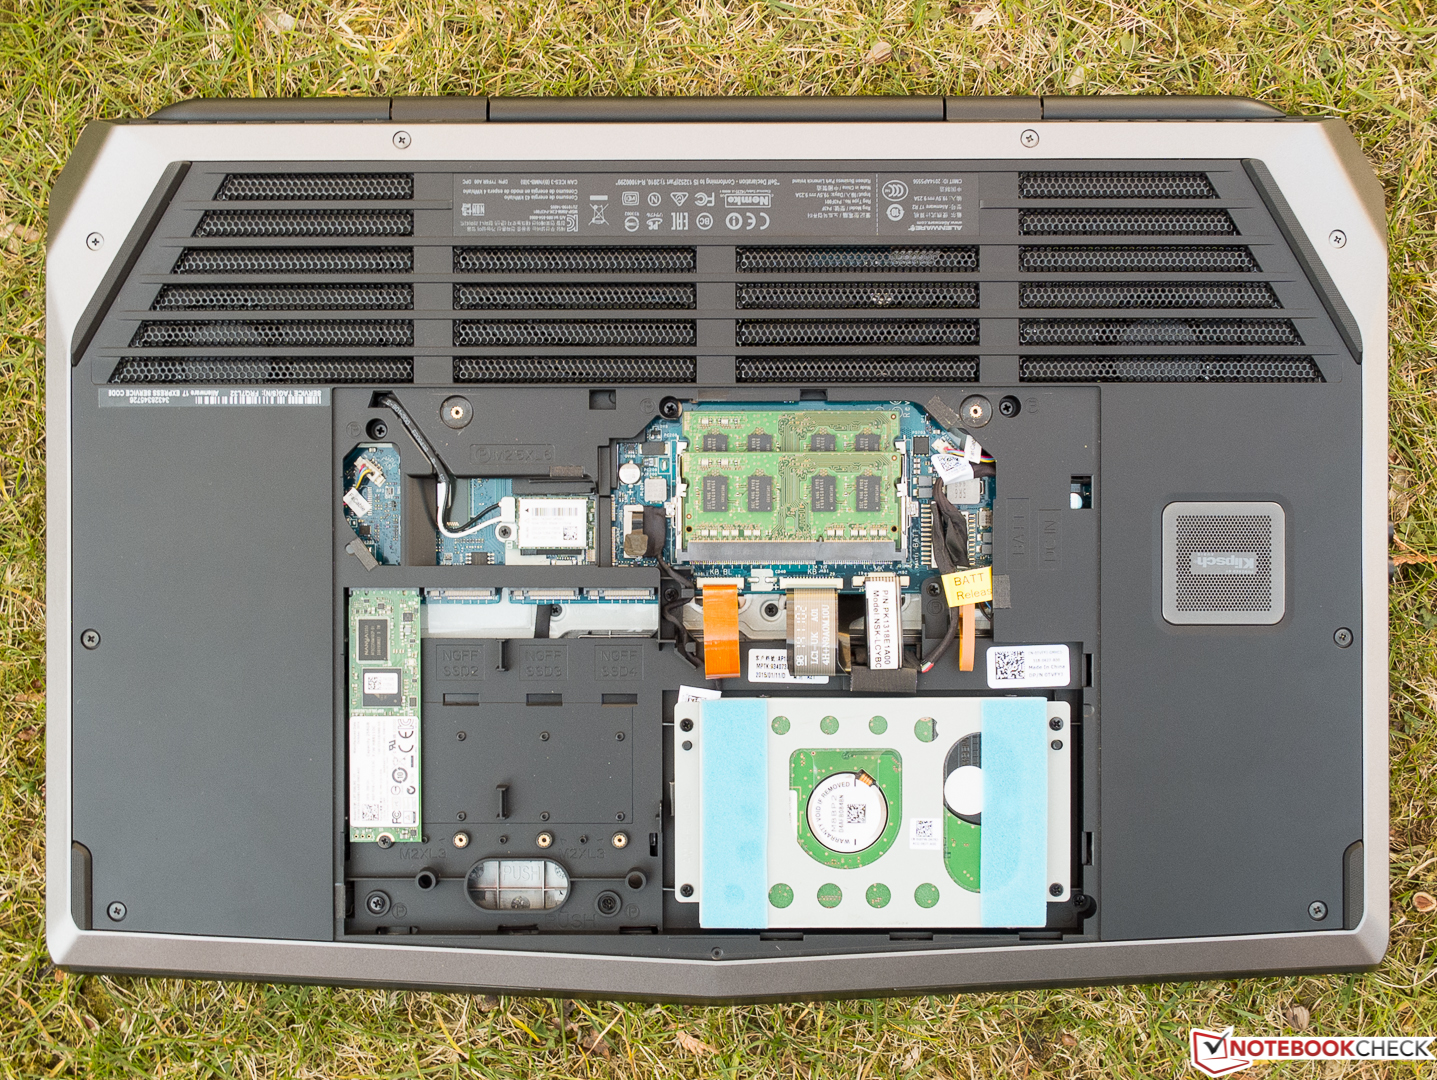
- 无法接触到风扇、电池无法更换
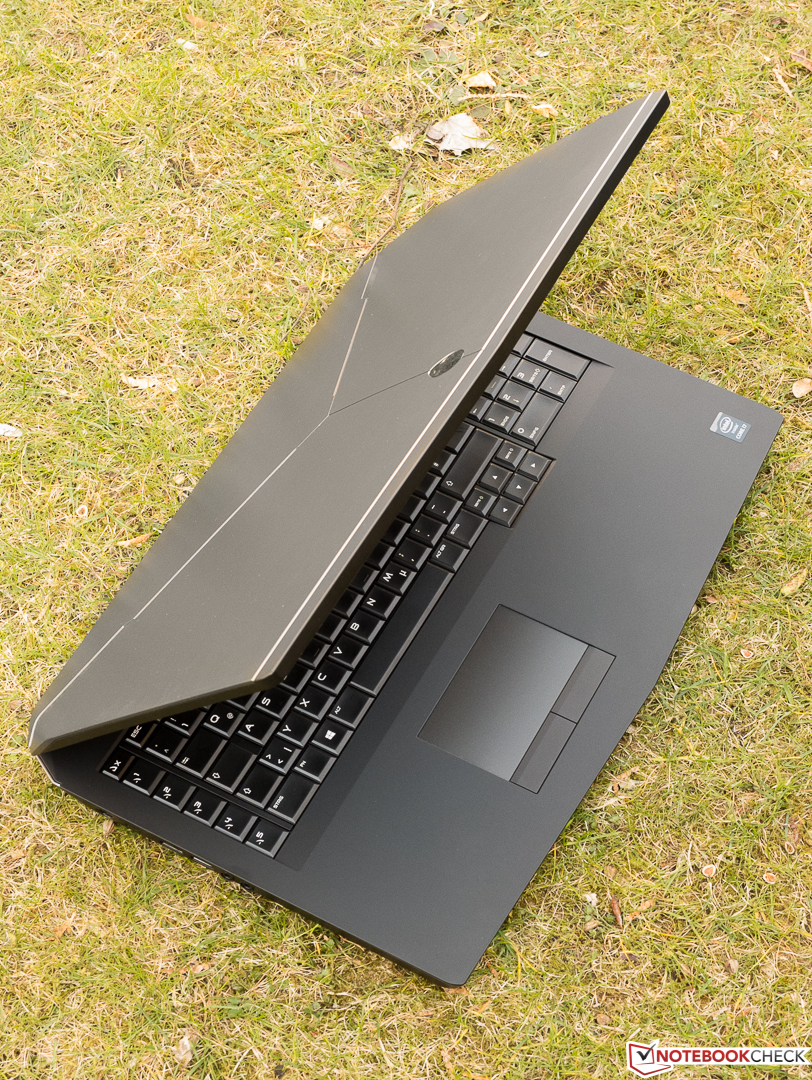
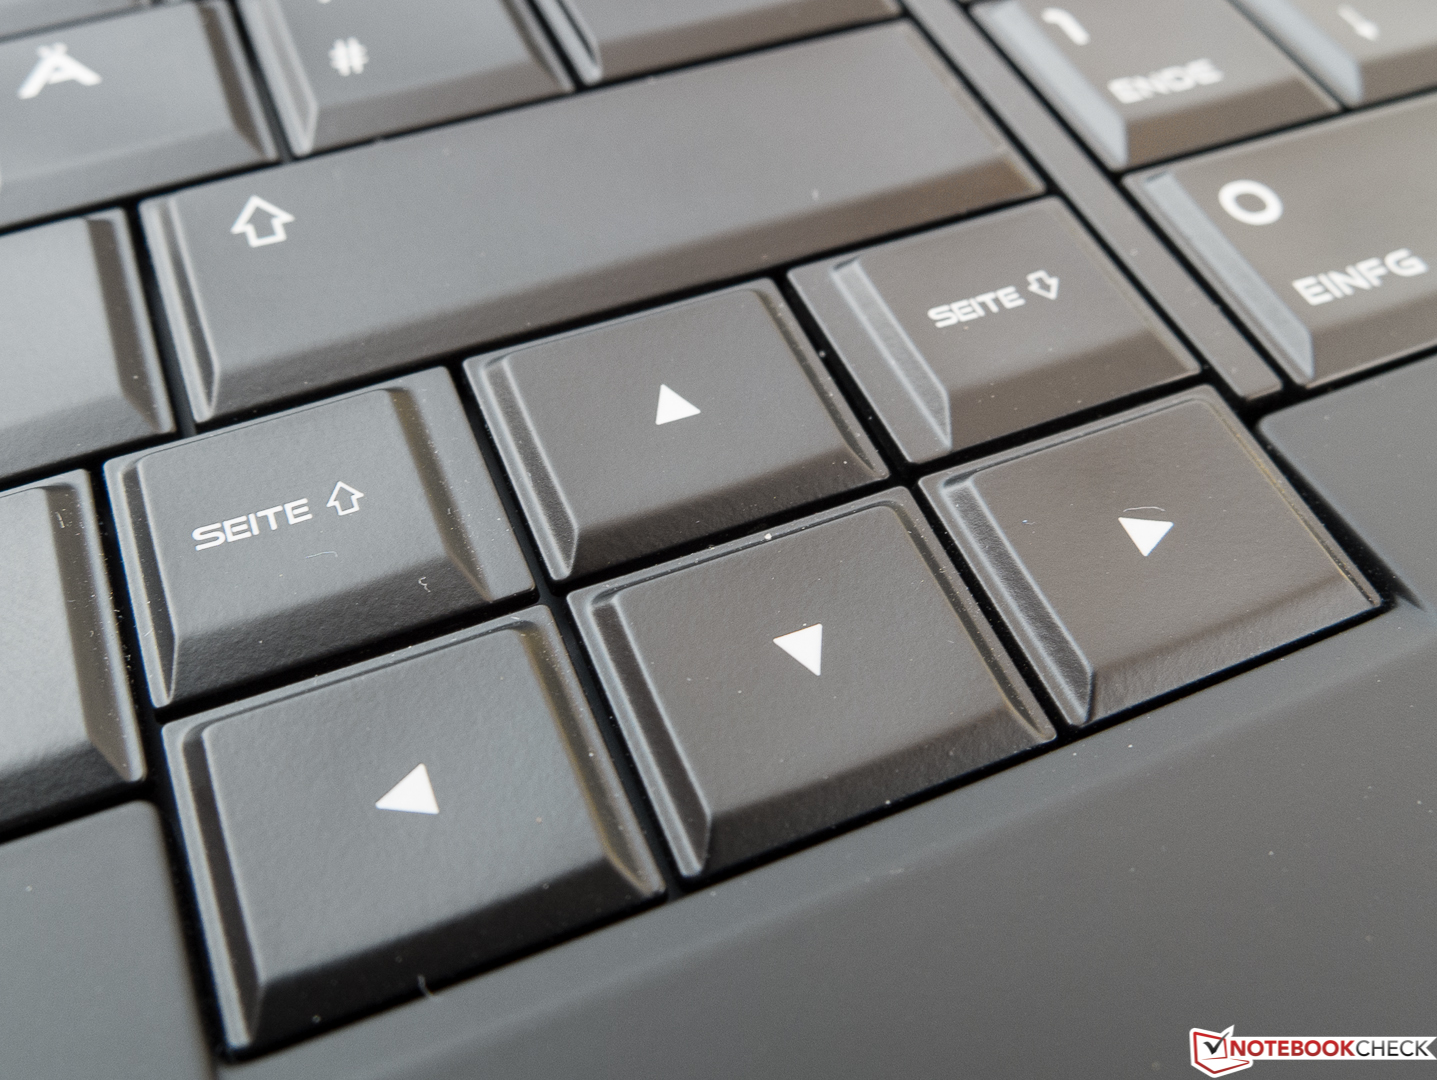
- 不寻常的键盘布局
- 对加速性能的利用度较差
- 显卡在负载下有降频问题
- 在极端情况下很吵
- 在压力测试下:降频问题,时钟频率不规则变化
Alienware相比前作明显缩小了新设备的尺寸,相对则接受了噪音更大的风扇。遗憾的是,由于处理器加速无法完全利用,它的性能受到了一些影响,在压力测试下处理器和显卡都有降频问题。在实际游戏运行中,性能的损失则较小,不过鉴于游戏玩家对科技较为敏感,他们可能会感觉这相比更笨重的华硕G751JY-T7009H算是一个缺点。
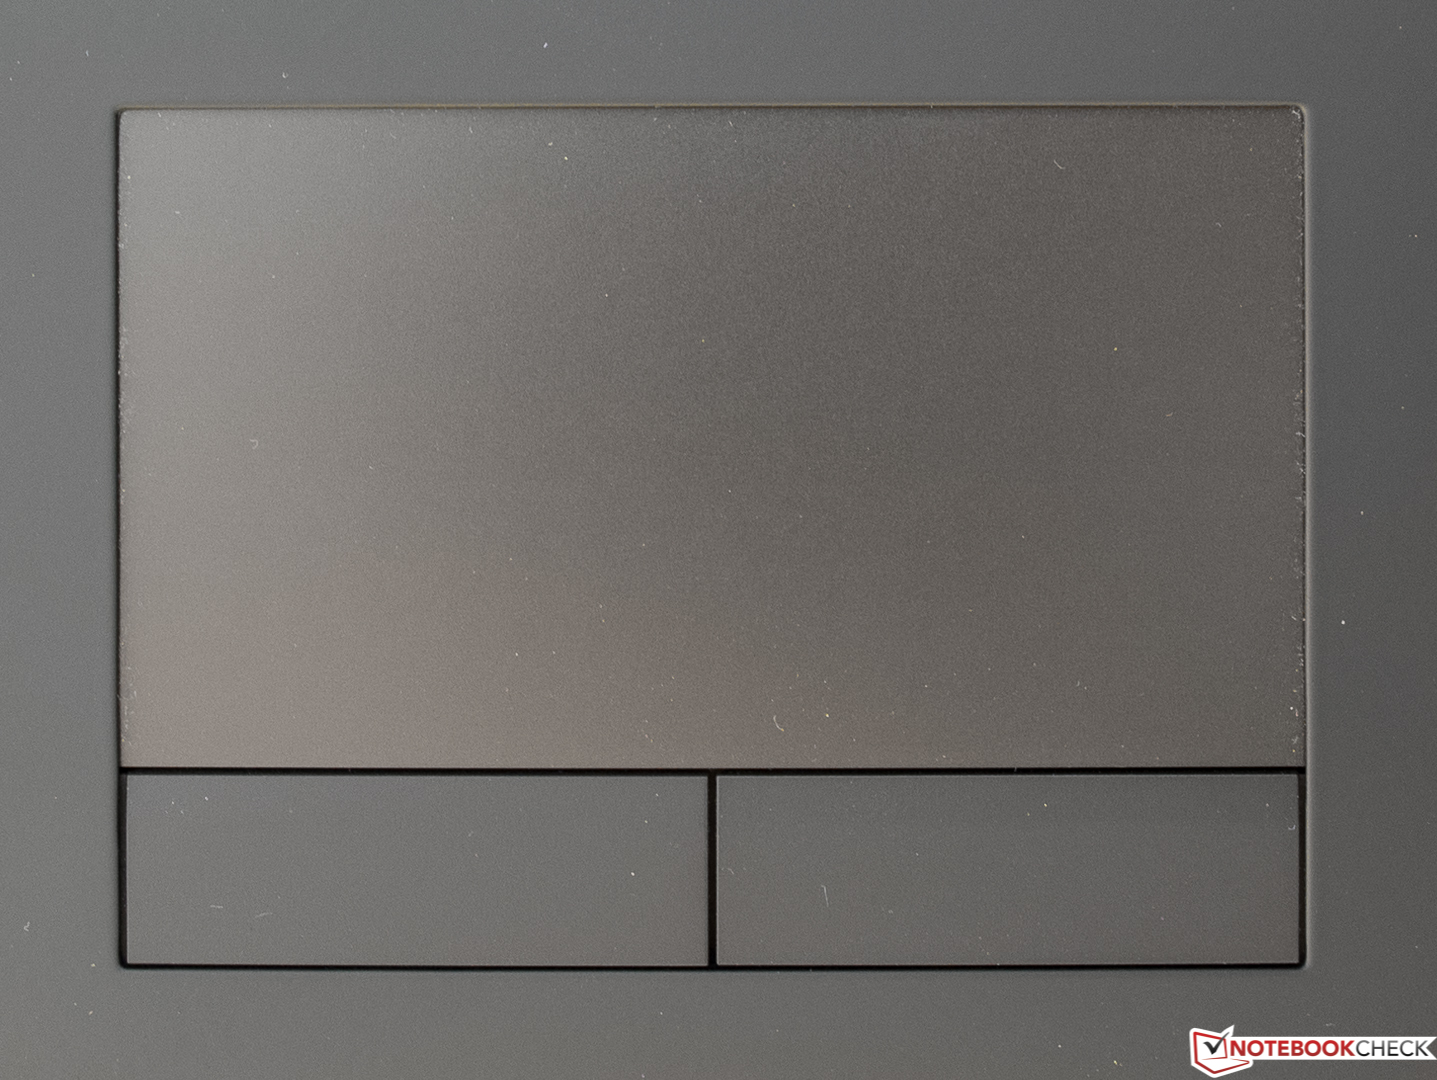
除此之外,Alienware 17 R2就没有什么别的值得抱怨的地方了。它的机身在各个方面都十分优秀,如果电池和风扇更容易维护的话就更好了。我们很喜欢它的键盘,它的触控板相比竞争对手也毫不逊色。其他的优势还有明亮而高对比度的屏幕,音响系统和相对较长的电池续航。最后,生产商还为它预装了几款特别为游戏玩家设计的软件如Killer Network Manager,AlienFX和TactX。这也是Alienware的独特之处之一。
注:本文是基于完整评测的缩减版本,阅读完整的英文评测,请点击这里。
Alienware 17 R2
- 04/09/2015 v4 (old)
Sven Kloevekorn
Gaming - Weighted Average