宏碁 Predator 17 X (7820HK, 全高清, GTX 1080) 笔记本电脑简短评测
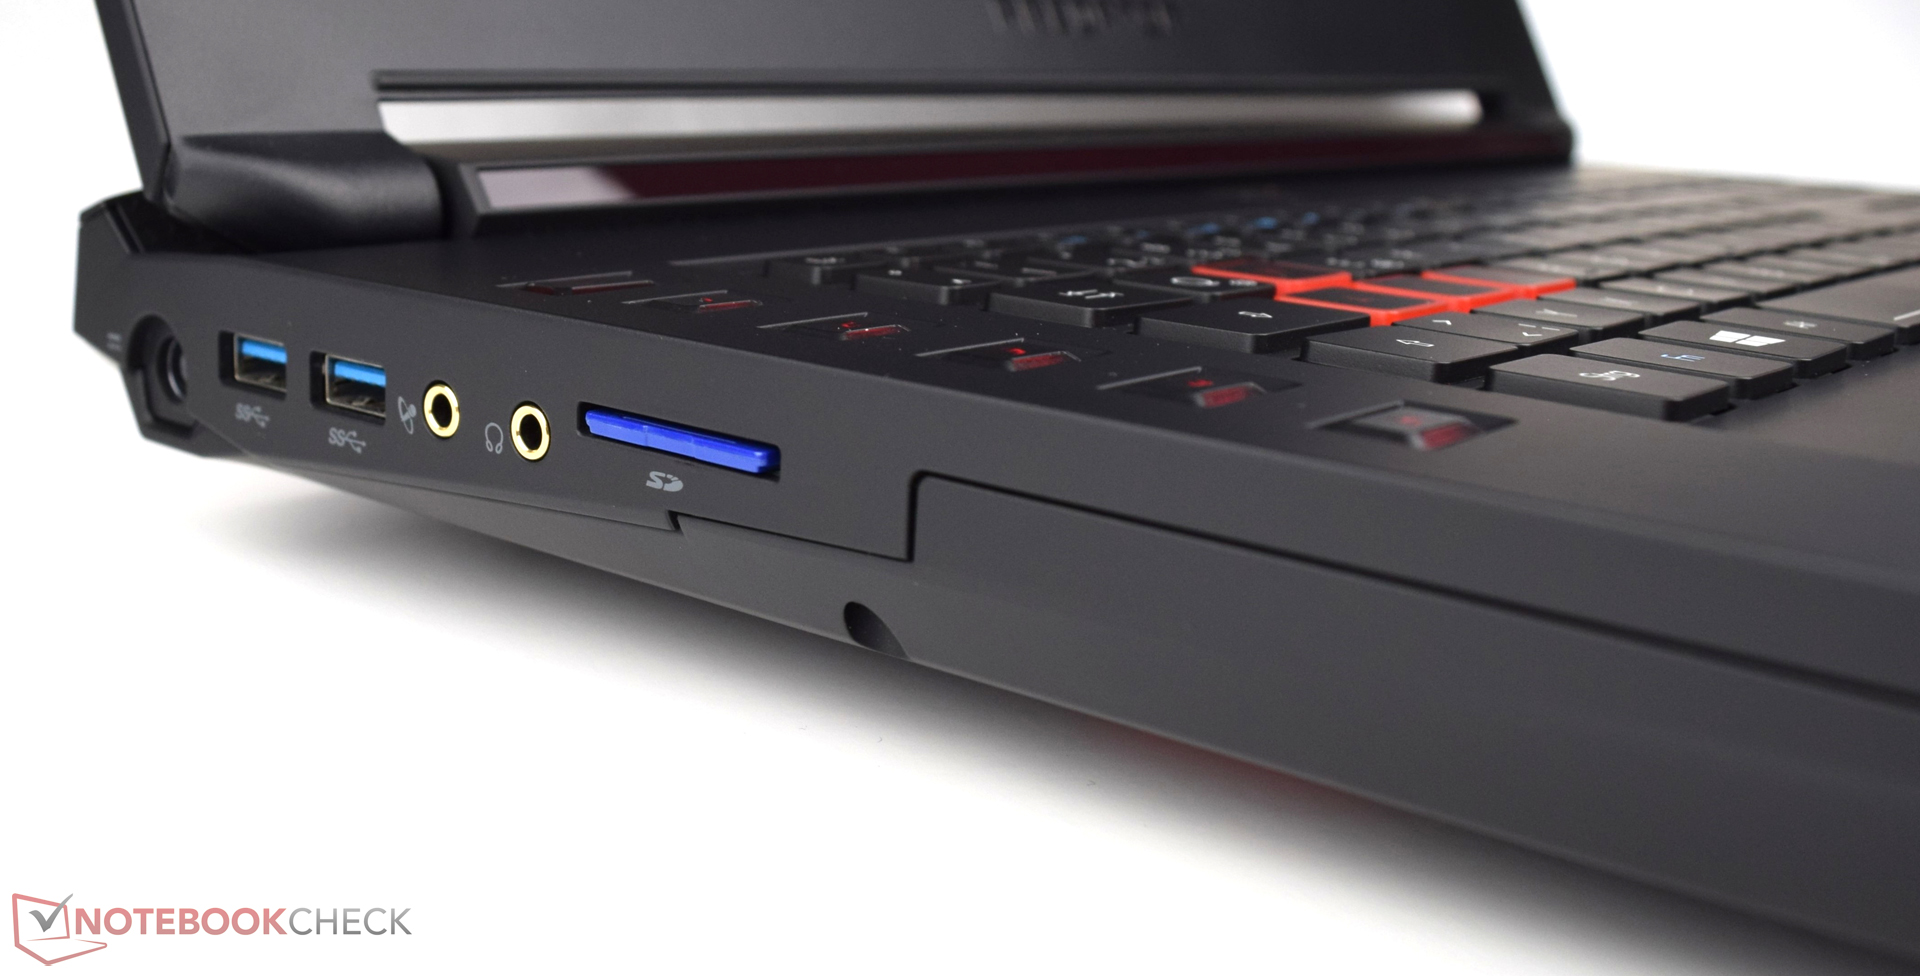
| SD Card Reader | |
| average JPG Copy Test (av. of 3 runs) | |
| Asus G701VIK-BA049T | |
| MSI GT73VR 7RF-296 | |
| MSI GT72VR 7RE-433 | |
| Acer Predator 17 X GX-792-76DL | |
| Acer Predator 17 G9-793-77LG | |
| Aorus X7 v6 | |
| Asus G752VS-XB78K | |
| maximum AS SSD Seq Read Test (1GB) | |
| Asus G701VIK-BA049T | |
| MSI GT73VR 7RF-296 | |
| MSI GT72VR 7RE-433 | |
| Acer Predator 17 X GX-792-76DL | |
| Acer Predator 17 G9-793-77LG | |
| Aorus X7 v6 | |
| Asus G752VS-XB78K | |
| Networking | |
| iperf3 transmit AX12 | |
| Acer Predator 17 X GX-792-76DL | |
| MSI GT73VR 7RF-296 | |
| MSI GT72VR 7RE-433 | |
| Aorus X7 v6 | |
| Asus G701VIK-BA049T | |
| iperf3 receive AX12 | |
| MSI GT73VR 7RF-296 | |
| Acer Predator 17 X GX-792-76DL | |
| Asus G701VIK-BA049T | |
| MSI GT72VR 7RE-433 | |
| Aorus X7 v6 | |

| |||||||||||||||||||||||||
Brightness Distribution: 91 %
Center on Battery: 380 cd/m²
Contrast: 1027:1 (Black: 0.37 cd/m²)
ΔE ColorChecker Calman: 4.12 | ∀{0.5-29.43 Ø4.71}
ΔE Greyscale Calman: 3.95 | ∀{0.09-98 Ø4.96}
84% sRGB (Argyll 1.6.3 3D)
55% AdobeRGB 1998 (Argyll 1.6.3 3D)
61.2% AdobeRGB 1998 (Argyll 3D)
83.7% sRGB (Argyll 3D)
66% Display P3 (Argyll 3D)
Gamma: 2.47
CCT: 6539 K
| Acer Predator 17 X GX-792-76DL LP173WF4-SPF5 (LGD056D), 1920x1080, 17.3" | MSI GT73VR 7RF-296 N173HHE-G32 (CMN1747), 1920x1080, 17.3" | Asus G701VIK-BA049T B173HAN01.1 (AUO119D), 1920x1080, 17.3" | Asus G752VS-XB78K LG Philips LP173WF4-SPF3 (LGD04E8), 1920x1080, 17.3" | MSI GT72VR 7RE-433 Chi Mei N173HHE-G32 (CMN1747), 1920x1080, 17.3" | Aorus X7 v6 B173QTN01.0 (AUO1096), 2560x1440, 17.3" | Acer Predator 17 G9-793-77LG AU Optronics B173ZAN01.0 (AUO109B), 3840x2160, 17.3" | |
|---|---|---|---|---|---|---|---|
| Display | 31% | 5% | 2% | 4% | -2% | 38% | |
| Display P3 Coverage (%) | 66 | 90.6 37% | 68.8 4% | 66.9 1% | 68.3 3% | 60.9 -8% | 86.9 32% |
| sRGB Coverage (%) | 83.7 | 99.9 19% | 87.7 5% | 85.2 2% | 86.7 4% | 84.2 1% | 100 19% |
| AdobeRGB 1998 Coverage (%) | 61.2 | 84.7 38% | 64.1 5% | 62.3 2% | 63.4 4% | 61.2 0% | 99.4 62% |
| Response Times | 59% | 23% | 19% | 56% | 48% | 16% | |
| Response Time Grey 50% / Grey 80% * (ms) | 45 ? | 26 ? 42% | 38 ? 16% | 38 ? 16% | 29 ? 36% | 31 ? 31% | 37 ? 18% |
| Response Time Black / White * (ms) | 28 ? | 7 ? 75% | 20 ? 29% | 22 ? 21% | 7 ? 75% | 10 ? 64% | 24 ? 14% |
| PWM Frequency (Hz) | |||||||
| Screen | -33% | 2% | 3% | -33% | -31% | 13% | |
| Brightness middle (cd/m²) | 380 | 307 -19% | 306 -19% | 328 -14% | 299 -21% | 343 -10% | 336 -12% |
| Brightness (cd/m²) | 362 | 284 -22% | 299 -17% | 317 -12% | 277 -23% | 312 -14% | 320 -12% |
| Brightness Distribution (%) | 91 | 85 -7% | 91 0% | 88 -3% | 87 -4% | 80 -12% | 88 -3% |
| Black Level * (cd/m²) | 0.37 | 0.25 32% | 0.27 27% | 0.3 19% | 0.27 27% | 0.5 -35% | 0.25 32% |
| Contrast (:1) | 1027 | 1228 20% | 1133 10% | 1093 6% | 1107 8% | 686 -33% | 1344 31% |
| Colorchecker dE 2000 * | 4.12 | 9.65 -134% | 3.98 3% | 3.74 9% | 9.65 -134% | 7.33 -78% | 3.61 12% |
| Colorchecker dE 2000 max. * | 8.19 | 16.36 -100% | 7.29 11% | 8.97 -10% | 15.43 -88% | 10.79 -32% | 6.02 26% |
| Greyscale dE 2000 * | 3.95 | 10.07 -155% | 4.15 -5% | 2.67 32% | 9.68 -145% | 7.6 -92% | 4.78 -21% |
| Gamma | 2.47 89% | 2.12 104% | 2.45 90% | 2.41 91% | 1.89 116% | 2.19 100% | 2.32 95% |
| CCT | 6539 99% | 12145 54% | 7386 88% | 6861 95% | 11652 56% | 9024 72% | 6185 105% |
| Color Space (Percent of AdobeRGB 1998) (%) | 55 | 75 36% | 58 5% | 56 2% | 75 36% | 55 0% | 88 60% |
| Color Space (Percent of sRGB) (%) | 84 | 100 19% | 89 6% | 85 1% | 100 19% | 84 0% | 100 19% |
| Total Average (Program / Settings) | 19% /
-8% | 10% /
5% | 8% /
5% | 9% /
-14% | 5% /
-15% | 22% /
18% |
* ... smaller is better
Display Response Times
| ↔ Response Time Black to White | ||
|---|---|---|
| 28 ms ... rise ↗ and fall ↘ combined | ↗ 6 ms rise | 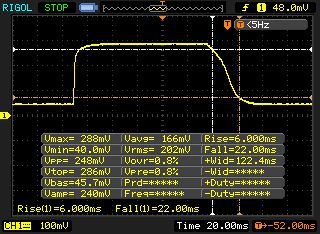 |
| ↘ 22 ms fall | ||
| The screen shows relatively slow response rates in our tests and may be too slow for gamers. In comparison, all tested devices range from 0.1 (minimum) to 240 (maximum) ms. » 71 % of all devices are better. This means that the measured response time is worse than the average of all tested devices (19.8 ms). | ||
| ↔ Response Time 50% Grey to 80% Grey | ||
| 45 ms ... rise ↗ and fall ↘ combined | ↗ 18 ms rise | 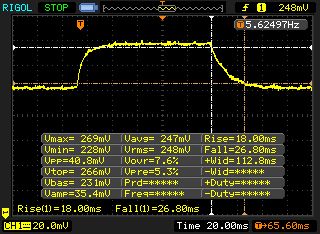 |
| ↘ 27 ms fall | ||
| The screen shows slow response rates in our tests and will be unsatisfactory for gamers. In comparison, all tested devices range from 0.165 (minimum) to 636 (maximum) ms. » 77 % of all devices are better. This means that the measured response time is worse than the average of all tested devices (31 ms). | ||
Screen Flickering / PWM (Pulse-Width Modulation)
| Screen flickering / PWM not detected | 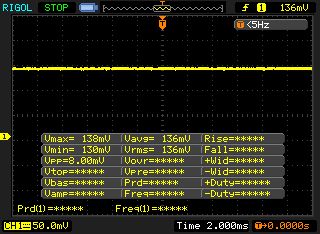 | ||
In comparison: 52 % of all tested devices do not use PWM to dim the display. If PWM was detected, an average of 7757 (minimum: 5 - maximum: 343500) Hz was measured. | |||
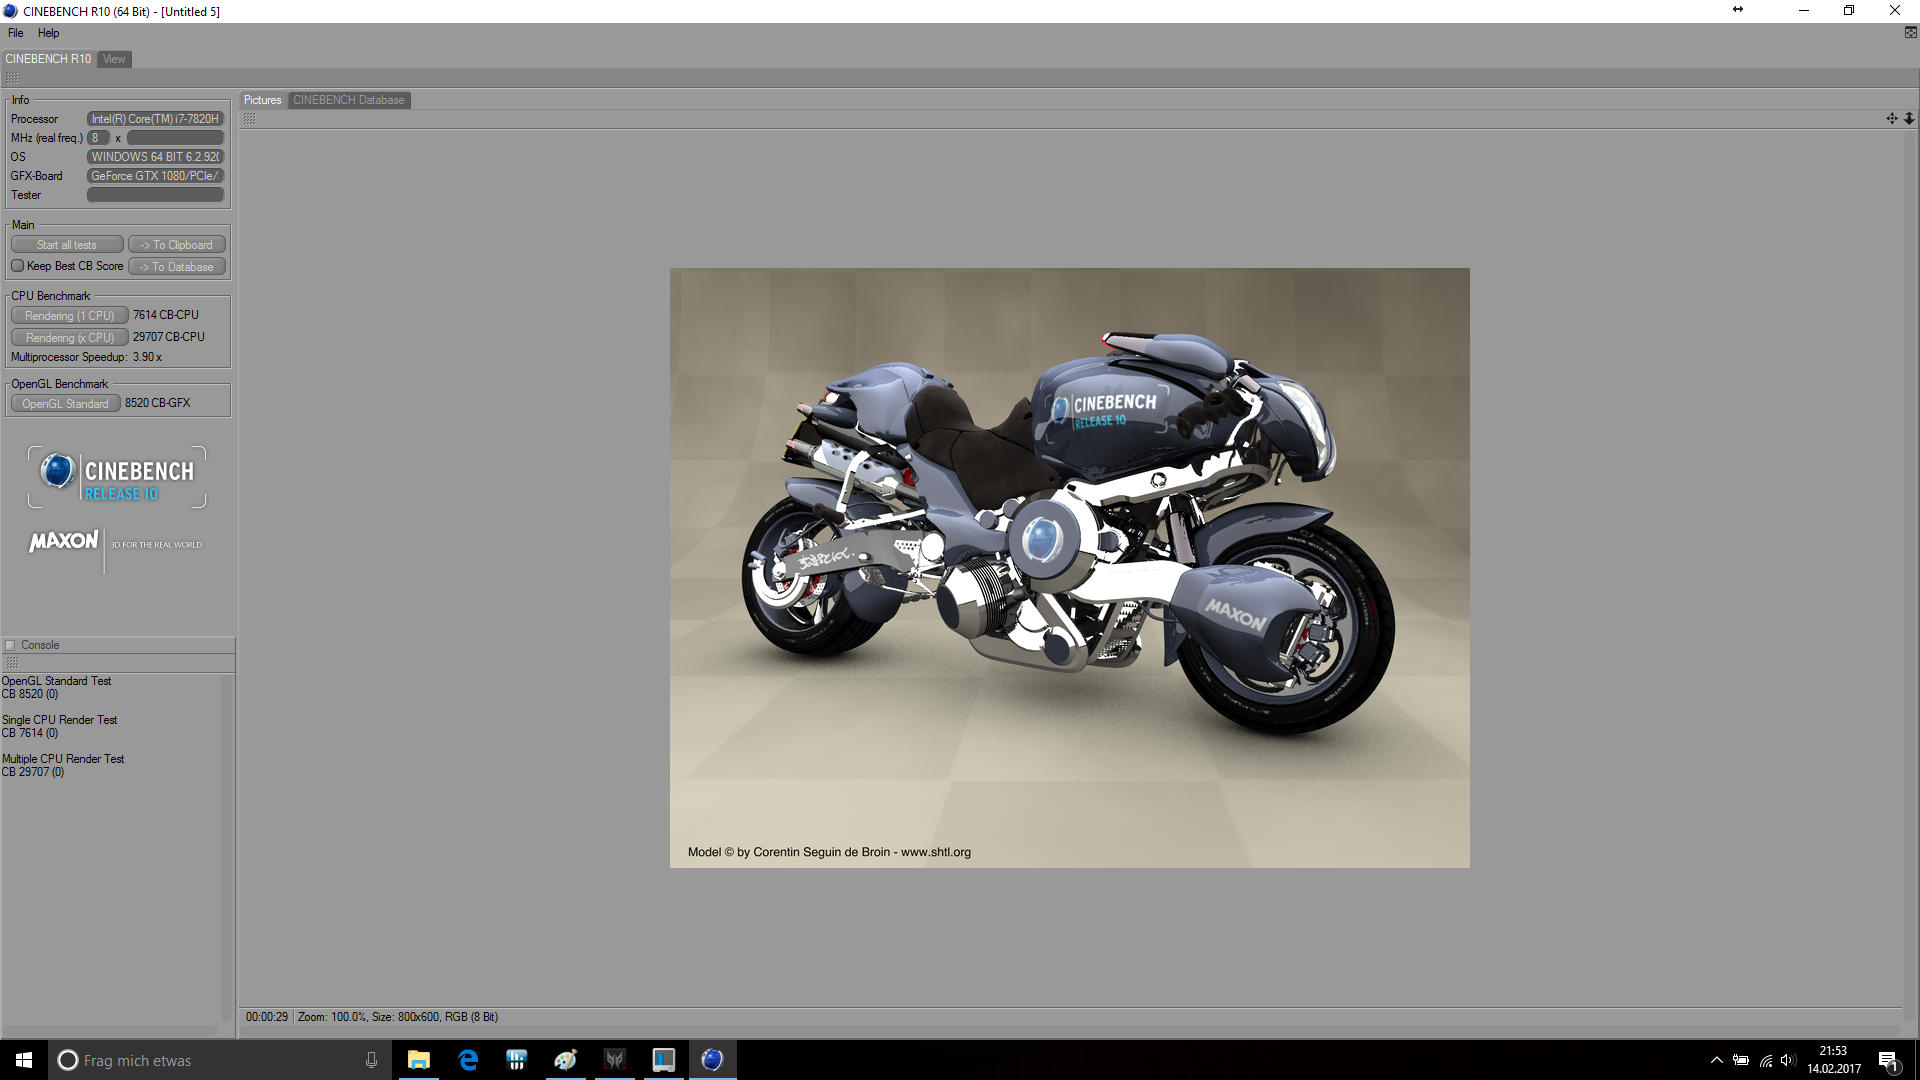
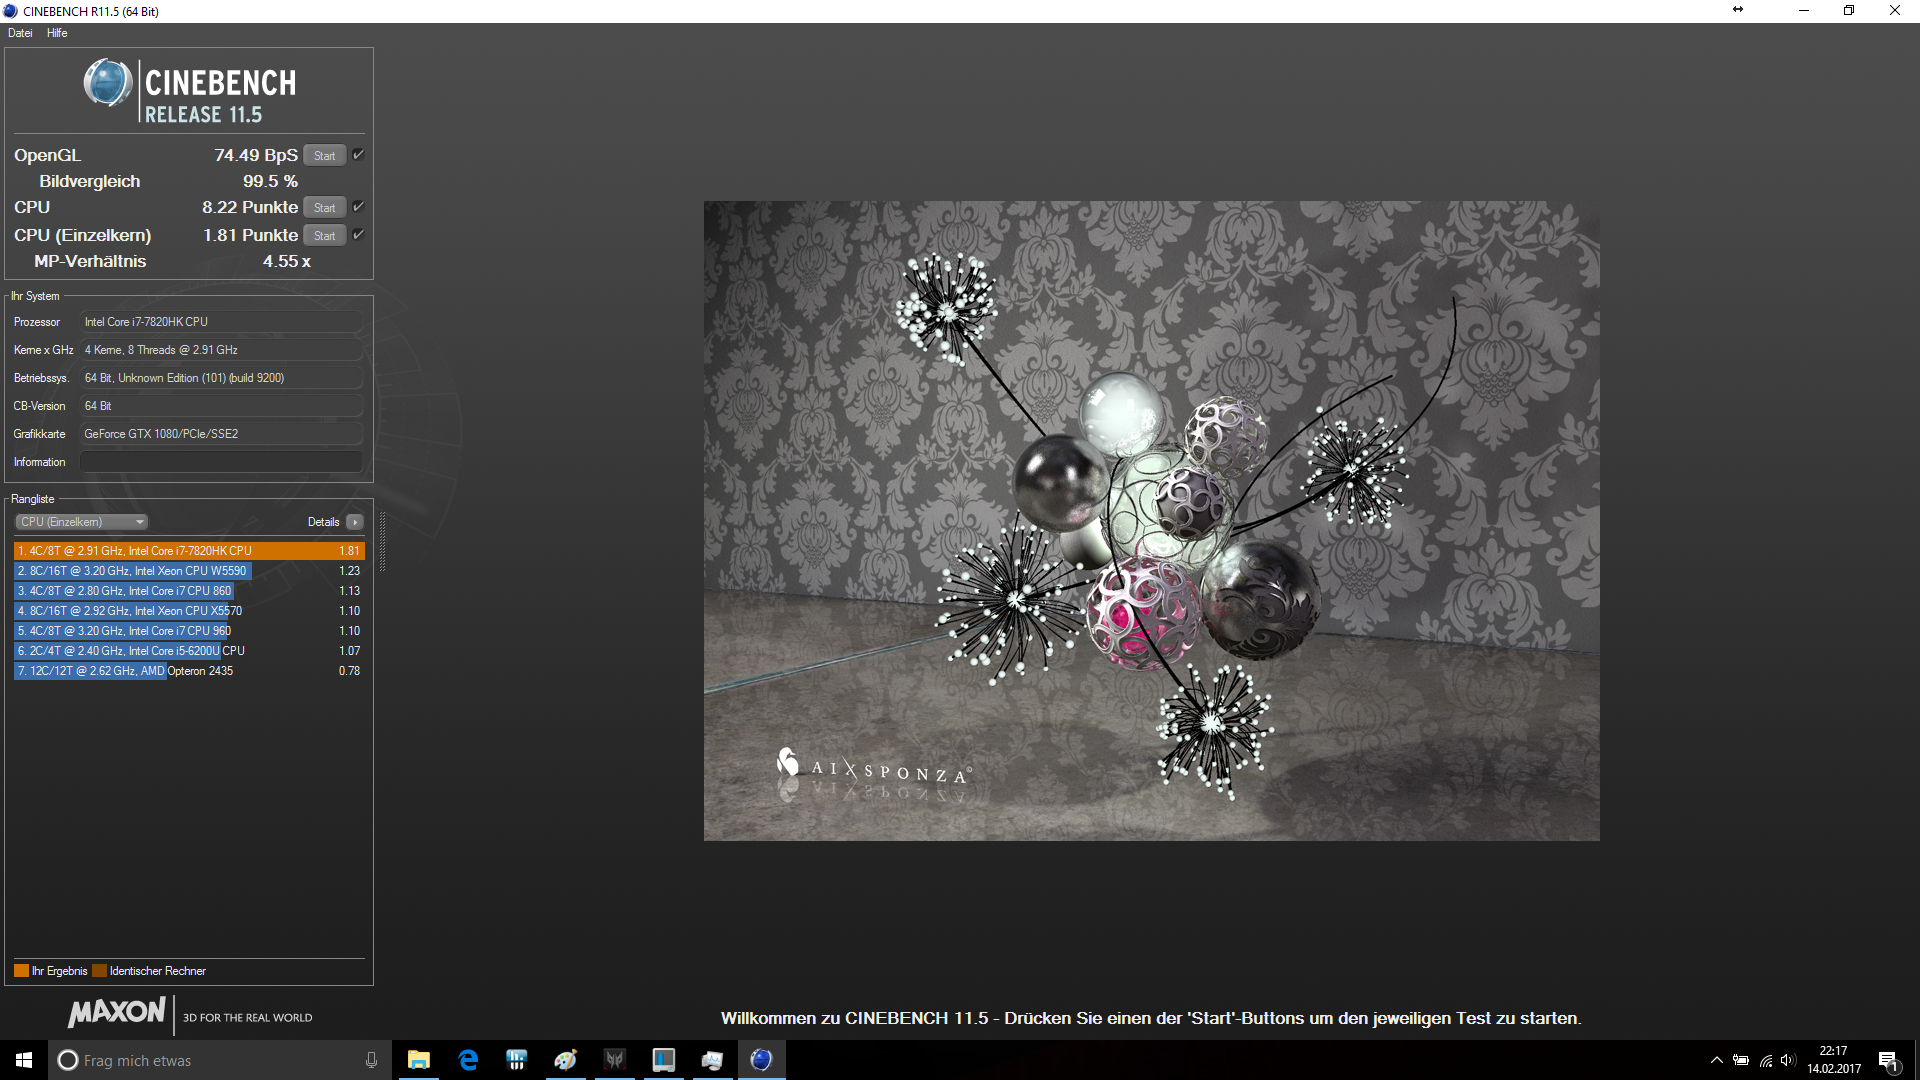
| Cinebench R10 | |
| Rendering Single 32Bit | |
| Acer Predator 17 X GX-792-76DL | |
| Asus G752VS-XB78K | |
| MSI GT72VR 7RE-433 | |
| Rendering Multiple CPUs 32Bit | |
| Acer Predator 17 X GX-792-76DL | |
| Asus G752VS-XB78K | |
| MSI GT72VR 7RE-433 | |
| JetStream 1.1 - 1.1 Total | |
| Acer Predator 17 X GX-792-76DL | |
| MSI GT72VR 7RE-433 | |
| Asus G752VS-XB78K | |
| Octane V2 - Total Score | |
| Acer Predator 17 X GX-792-76DL | |
| MSI GT72VR 7RE-433 | |
| Asus G752VS-XB78K | |
| PCMark 8 | |
| Home Score Accelerated v2 | |
| Acer Predator 17 X GX-792-76DL | |
| Asus G701VIK-BA049T | |
| Asus G752VS-XB78K | |
| MSI GT72VR 7RE-433 | |
| Acer Predator 17 G9-793-77LG | |
| Work Score Accelerated v2 | |
| Acer Predator 17 X GX-792-76DL | |
| Asus G701VIK-BA049T | |
| Asus G752VS-XB78K | |
| MSI GT72VR 7RE-433 | |
| PCMark 7 - Score | |
| Asus G701VIK-BA049T | |
| Acer Predator 17 X GX-792-76DL | |
| MSI GT73VR 7RF-296 | |
| Asus G752VS-XB78K | |
| MSI GT72VR 7RE-433 | |
| Aorus X7 v6 | |
| PCMark Vantage Result | 31085 points | |
| PCMark 7 Score | 7667 points | |
| PCMark 8 Home Score Accelerated v2 | 5975 points | |
| PCMark 8 Creative Score Accelerated v2 | 9309 points | |
| PCMark 8 Work Score Accelerated v2 | 6123 points | |
Help | ||
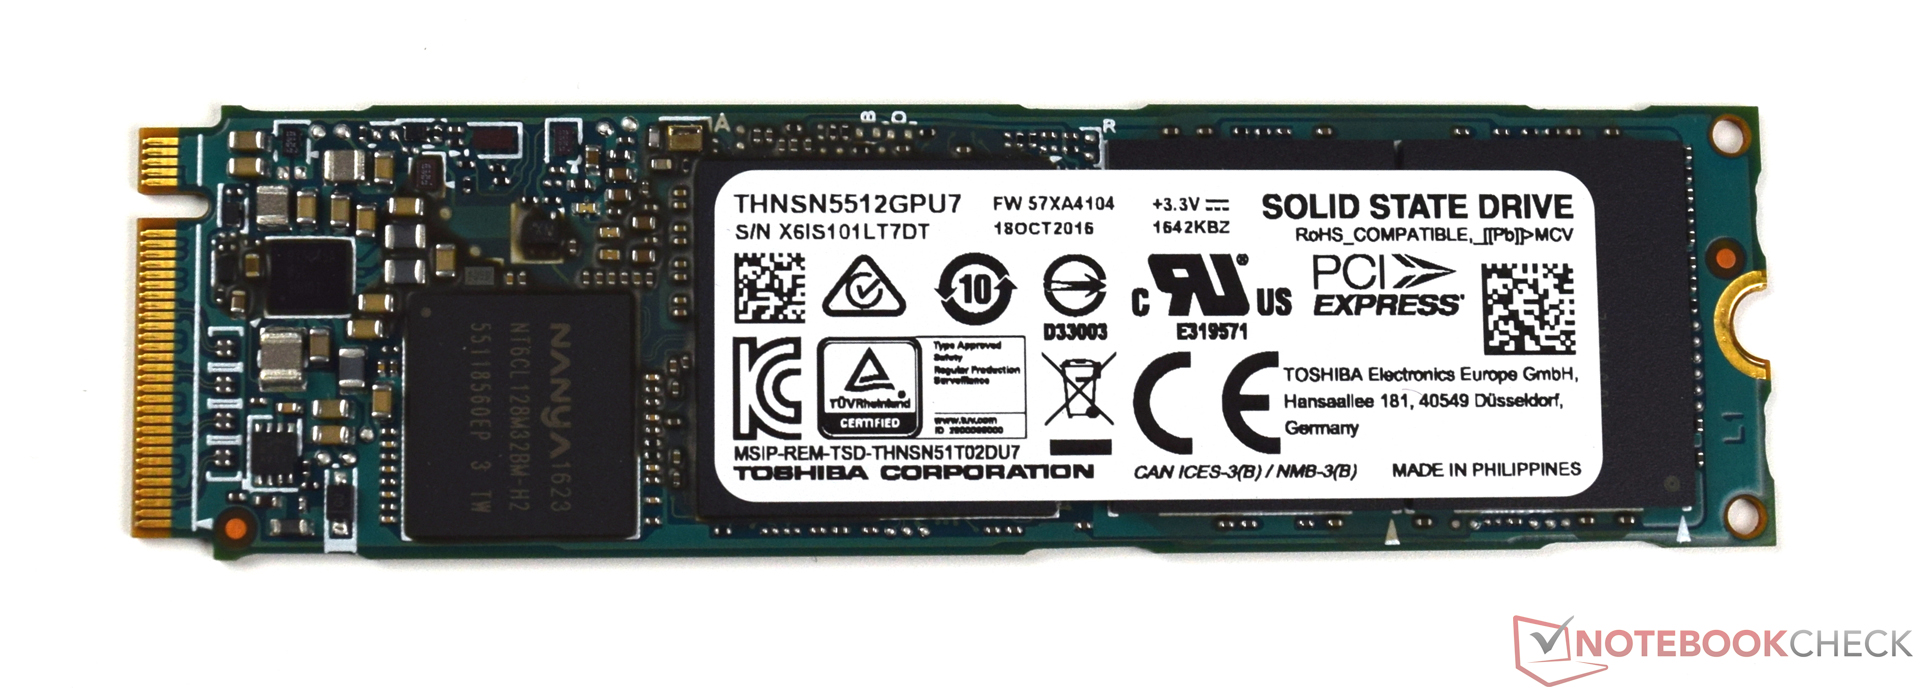
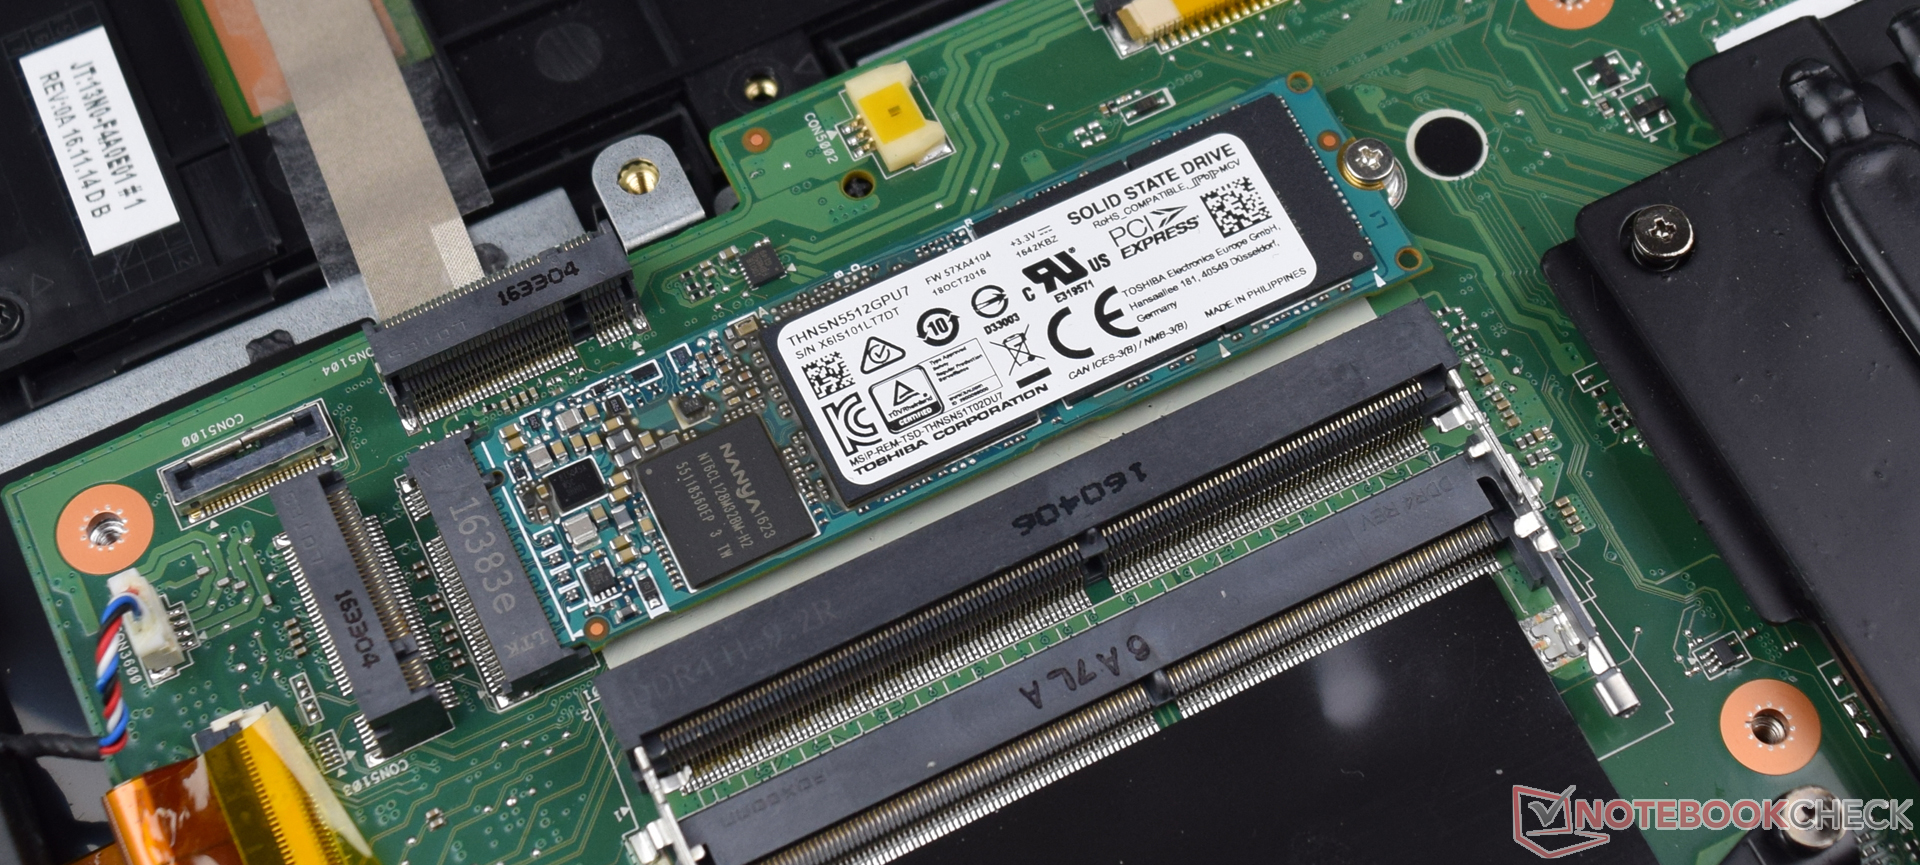
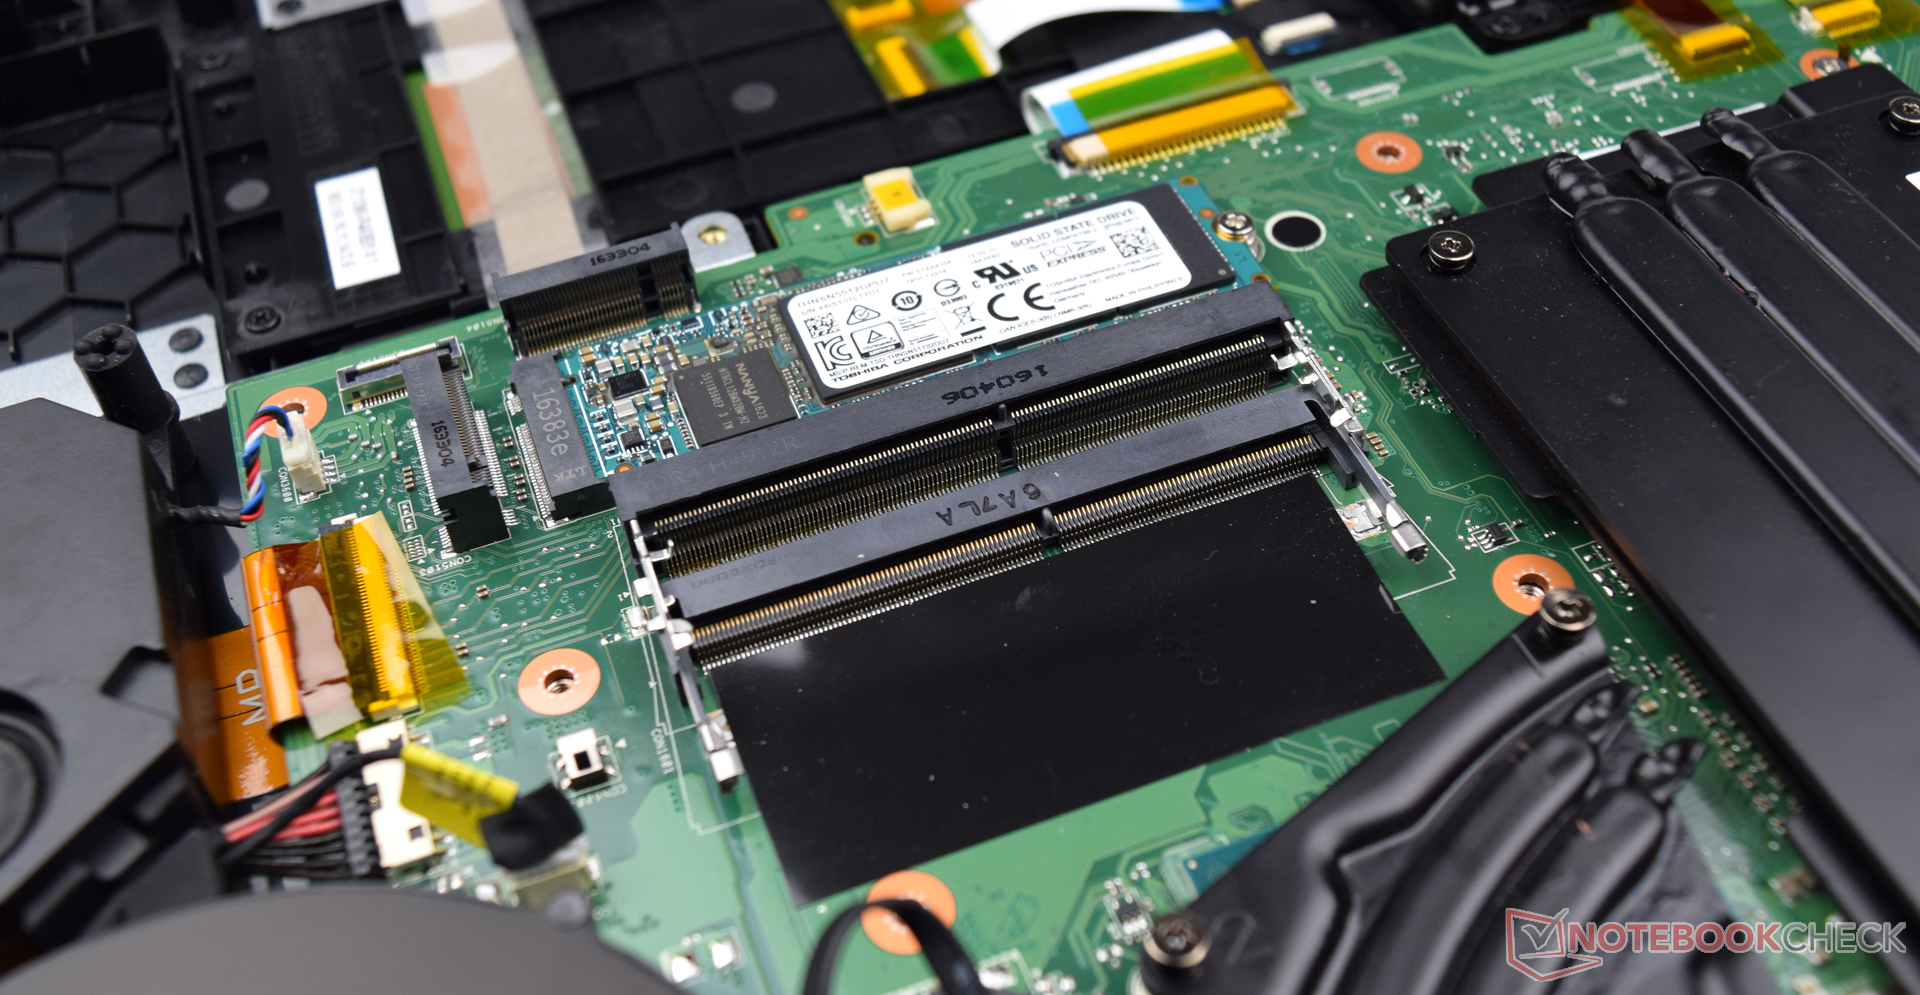
| Acer Predator 17 X GX-792-76DL Toshiba NVMe THNSN5512GPU7 | MSI GT73VR 7RF-296 2x Samsung SM951 MZVPV256HDGL (RAID 0) | Asus G701VIK-BA049T 2x Samsung SM961 MZVPW256HEGL NVMe (RAID 0) | Asus G752VS-XB78K Toshiba NVMe THNSN5512GPU7 | MSI GT72VR 7RE-433 Kingston RBU-SNS8152S3256GG5 | Aorus X7 v6 Toshiba NVMe THNSN5512GPU7 | Acer Predator 17 G9-793-77LG Toshiba NVMe THNSN5256GPU7 | |
|---|---|---|---|---|---|---|---|
| CrystalDiskMark 3.0 | 49% | 55% | 9% | -52% | -1% | ||
| Read Seq (MB/s) | 1494 | 3219 115% | 3487 133% | 1718 15% | 521 -65% | 1499 0% | |
| Write Seq (MB/s) | 1371 | 2572 88% | 2690 96% | 1305 -5% | 311.8 -77% | 1411 3% | |
| Read 512 (MB/s) | 898 | 1776 98% | 1499 67% | 1250 39% | 403.1 -55% | 966 8% | |
| Write 512 (MB/s) | 1273 | 2445 92% | 2493 96% | 1438 13% | 332.3 -74% | 1103 -13% | |
| Read 4k (MB/s) | 43.82 | 51.1 17% | 53.7 23% | 44.42 1% | 33.35 -24% | 44.33 1% | |
| Write 4k (MB/s) | 161.6 | 141.3 -13% | 133.2 -18% | 154.4 -4% | 111.1 -31% | 155.5 -4% | |
| Read 4k QD32 (MB/s) | 669 | 658 -2% | 795 19% | 744 11% | 331.1 -51% | 696 4% | |
| Write 4k QD32 (MB/s) | 552 | 554 0% | 699 27% | 578 5% | 318.3 -42% | 531 -4% |

| 3DMark - 1920x1080 Fire Strike Graphics | |
| Asus G701VIK-BA049T | |
| Acer Predator 17 X GX-792-76DL | |
| MSI GT73VR 7RF-296 | |
| MSI GT72VR 7RE-433 | |
| Aorus X7 v6 | |
| Asus G752VS-XB78K | |
| Acer Predator 17 G9-793-77LG | |
| 3DMark 11 - 1280x720 Performance GPU | |
| Asus G701VIK-BA049T | |
| MSI GT73VR 7RF-296 | |
| Acer Predator 17 X GX-792-76DL | |
| Aorus X7 v6 | |
| MSI GT72VR 7RE-433 | |
| Asus G752VS-XB78K | |
| Acer Predator 17 G9-793-77LG | |
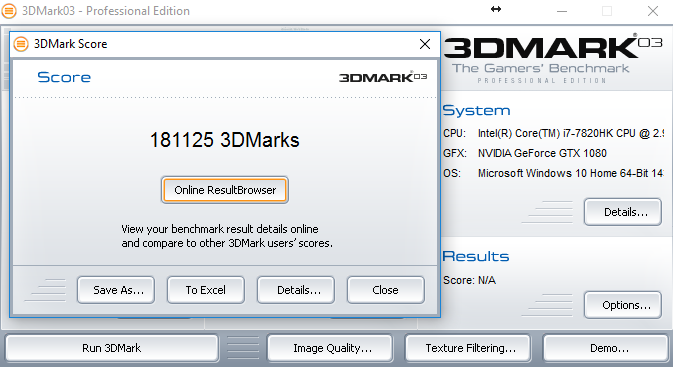
| 3DMark 03 Standard | 181125 points | |
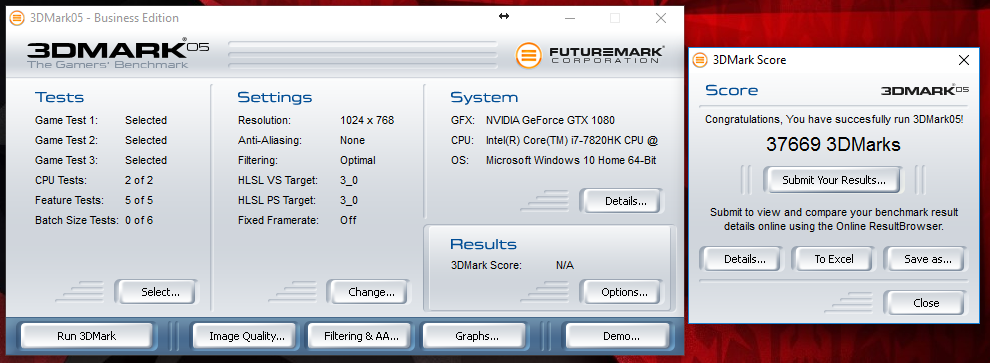
| 3DMark 05 Standard | 37669 points | |
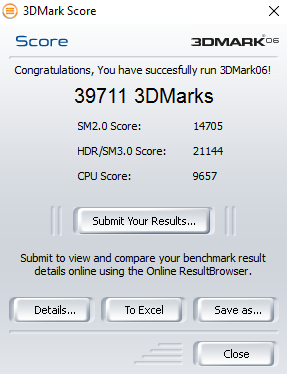
| 3DMark 06 Standard Score | 39711 points | |
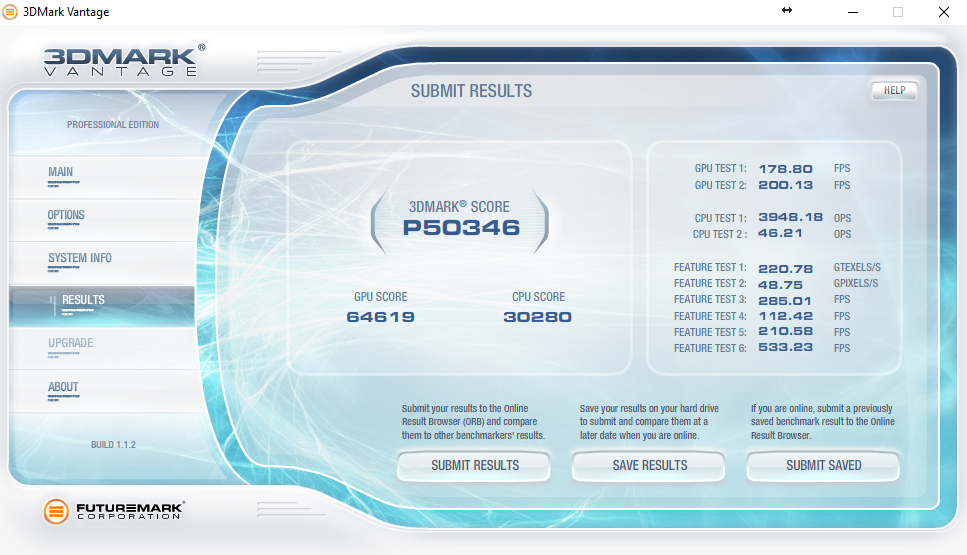
| 3DMark Vantage P Result | 50346 points | |
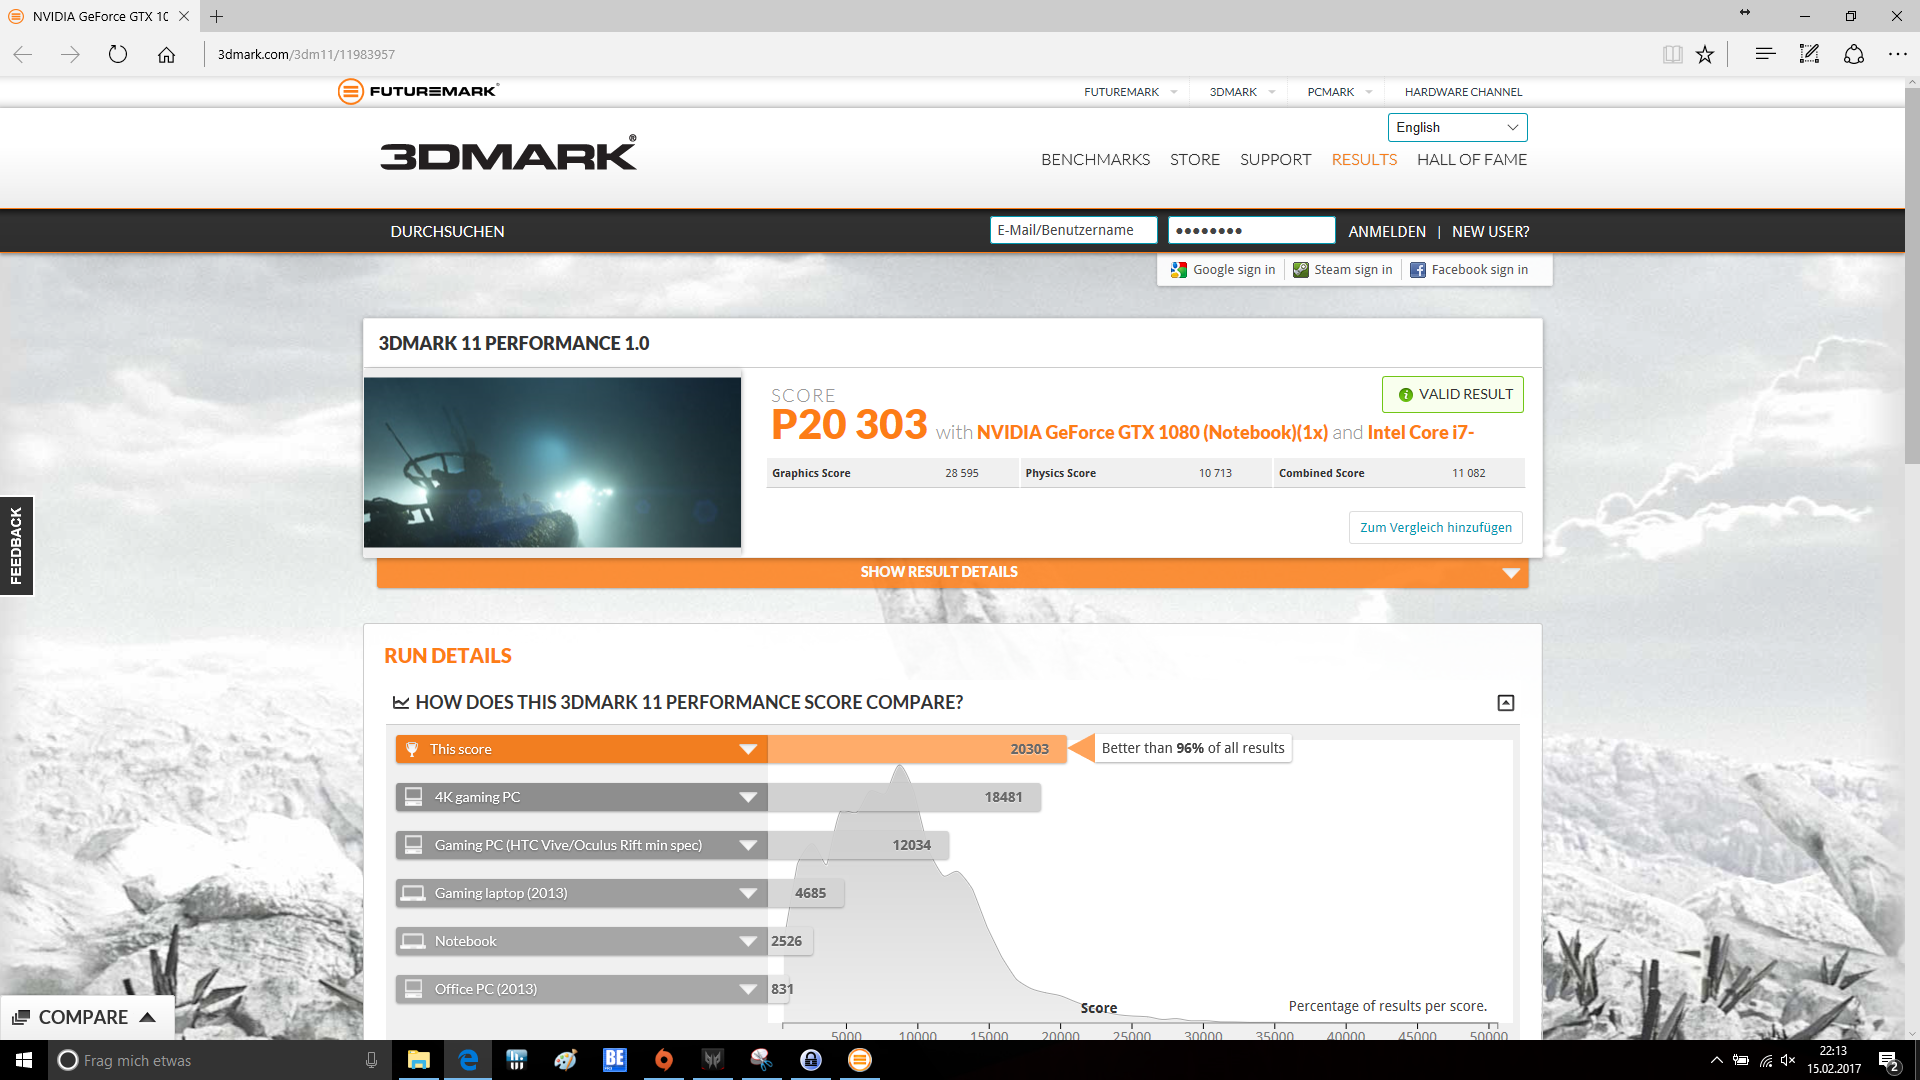
| 3DMark 11 Performance | 20303 points | |
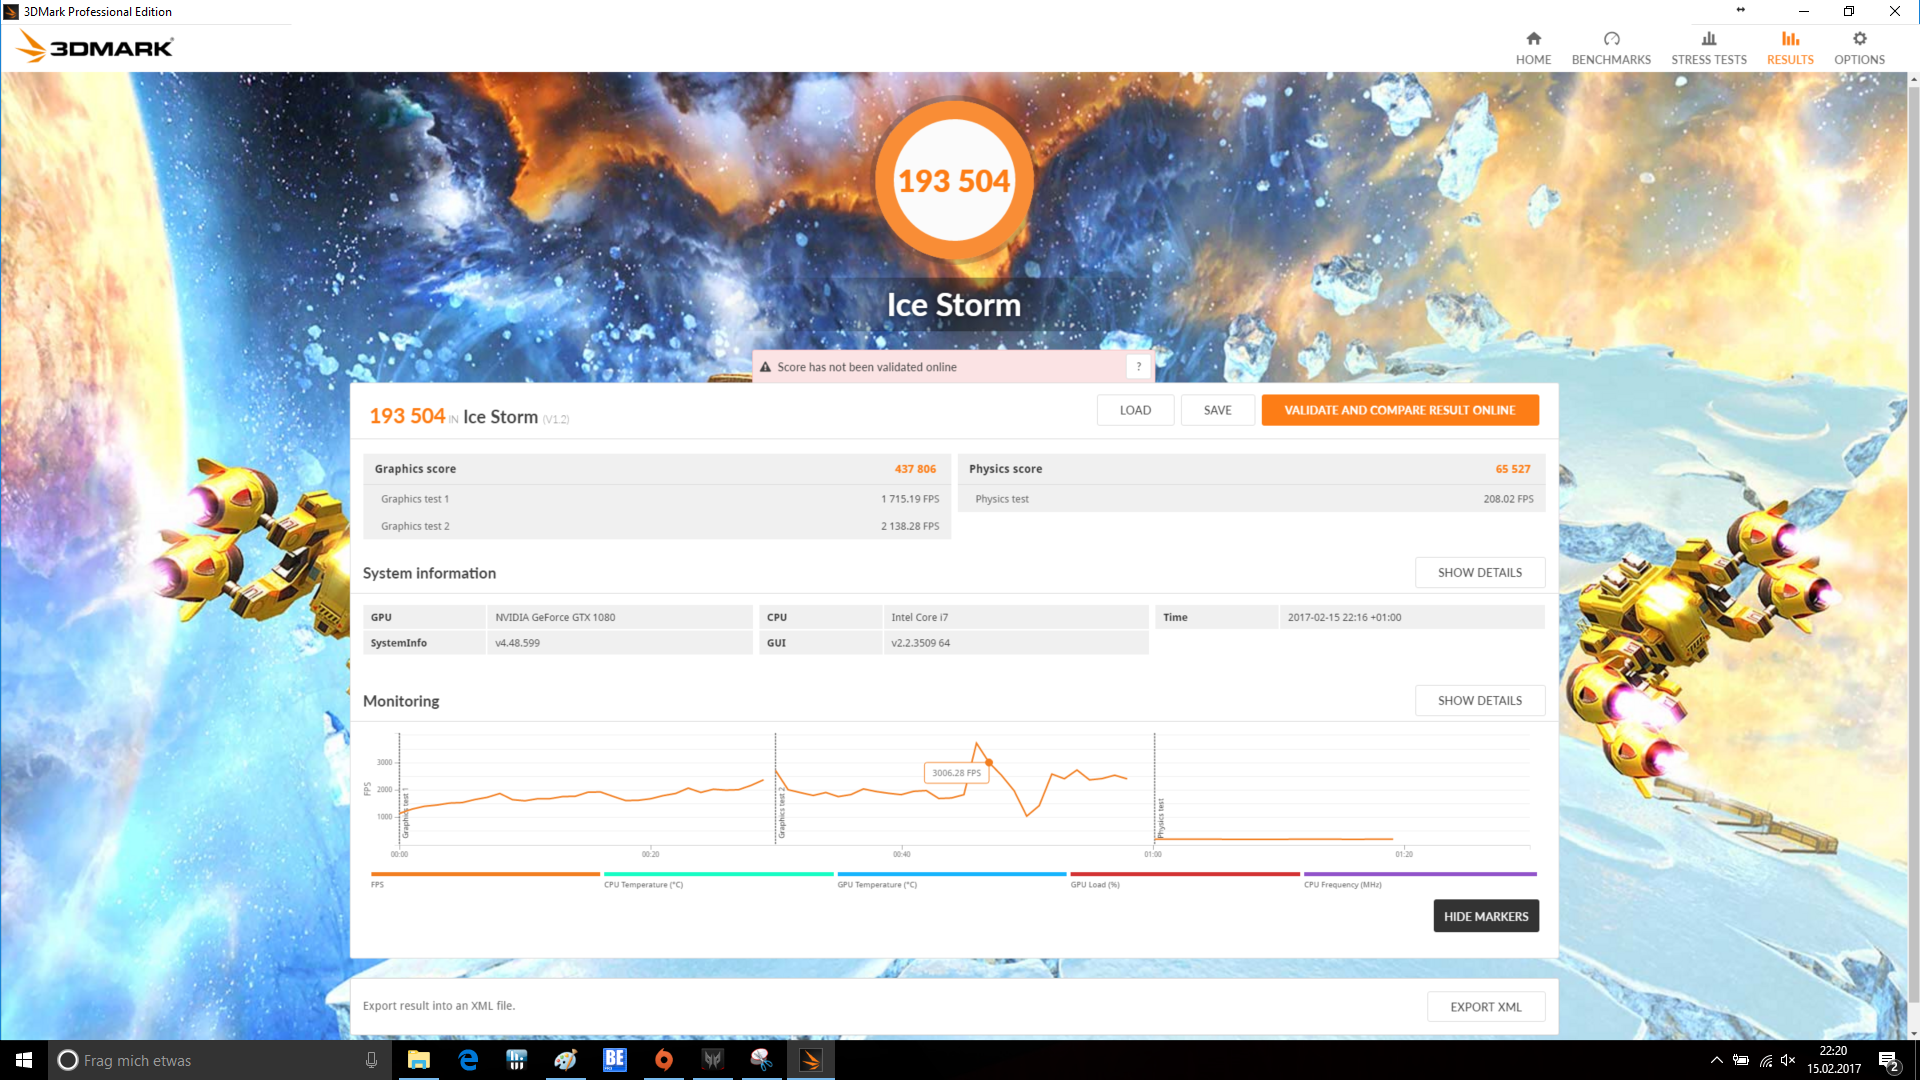
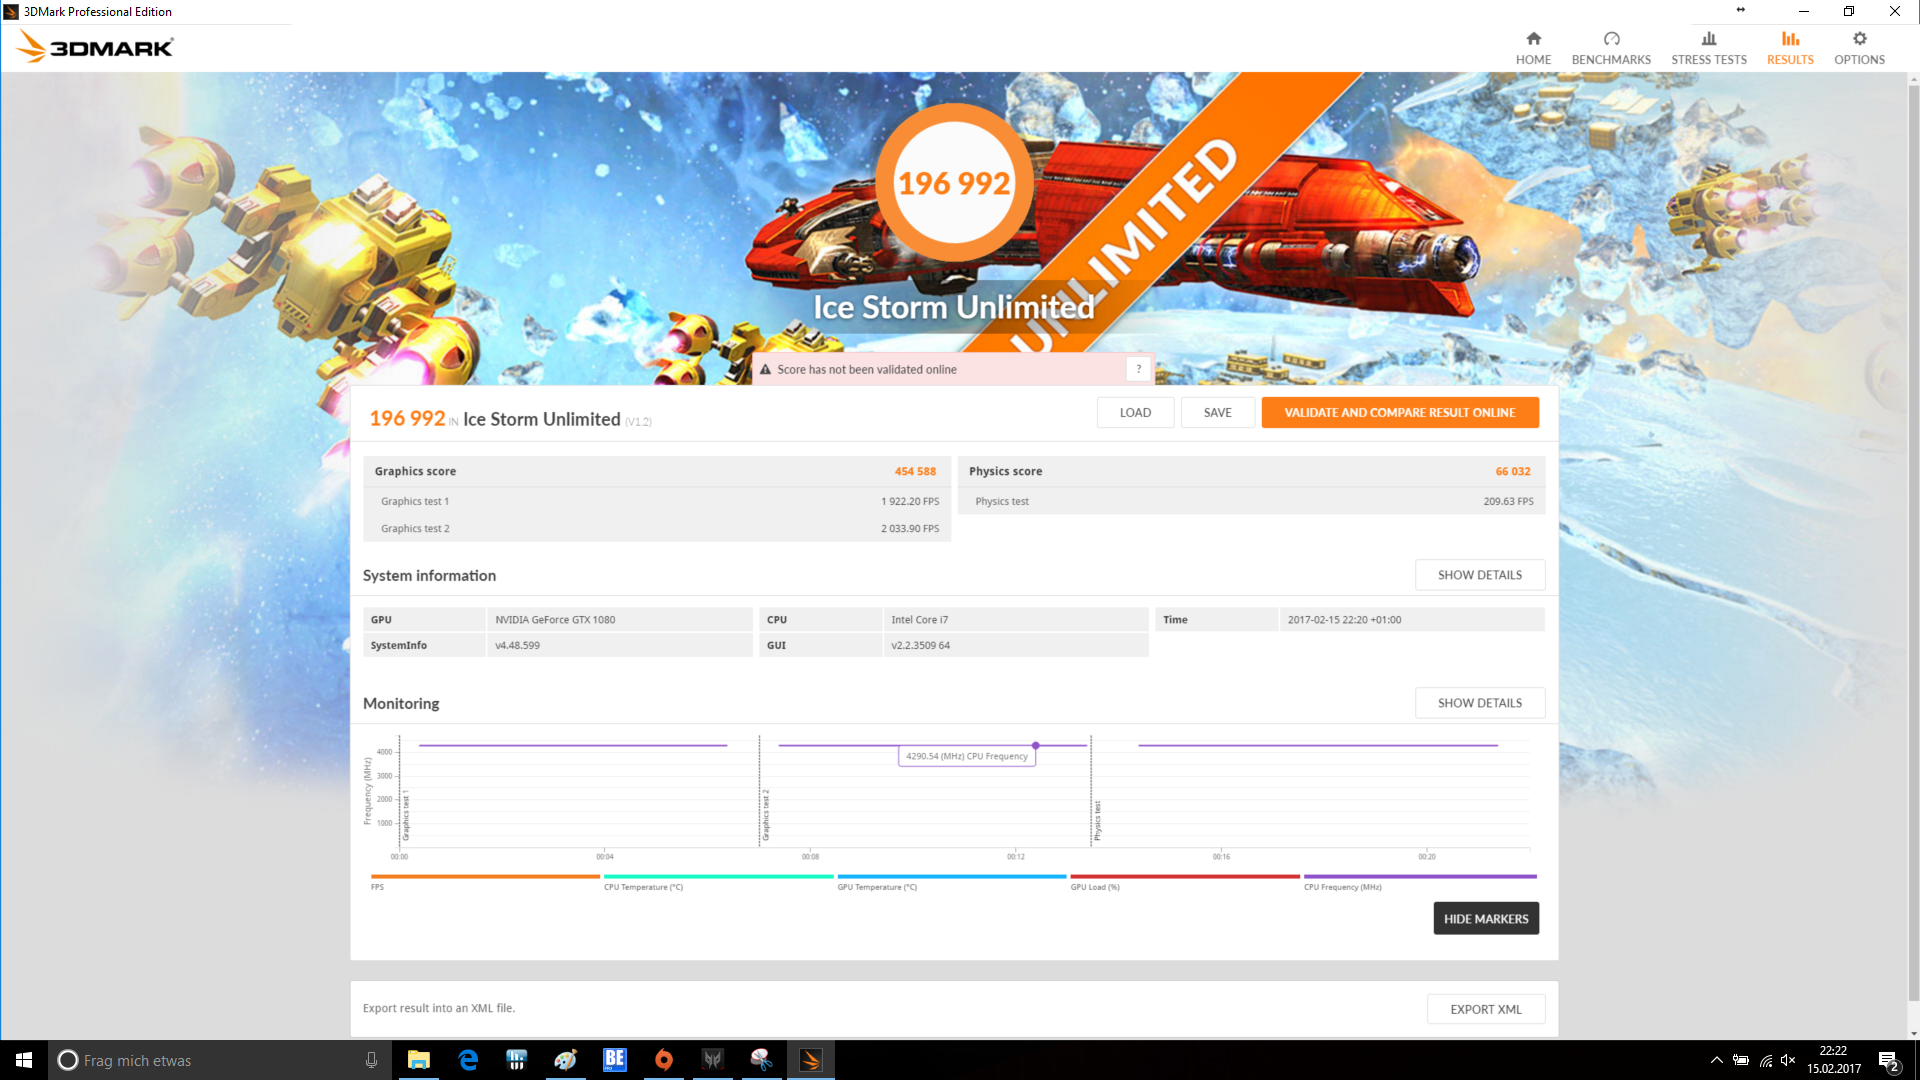
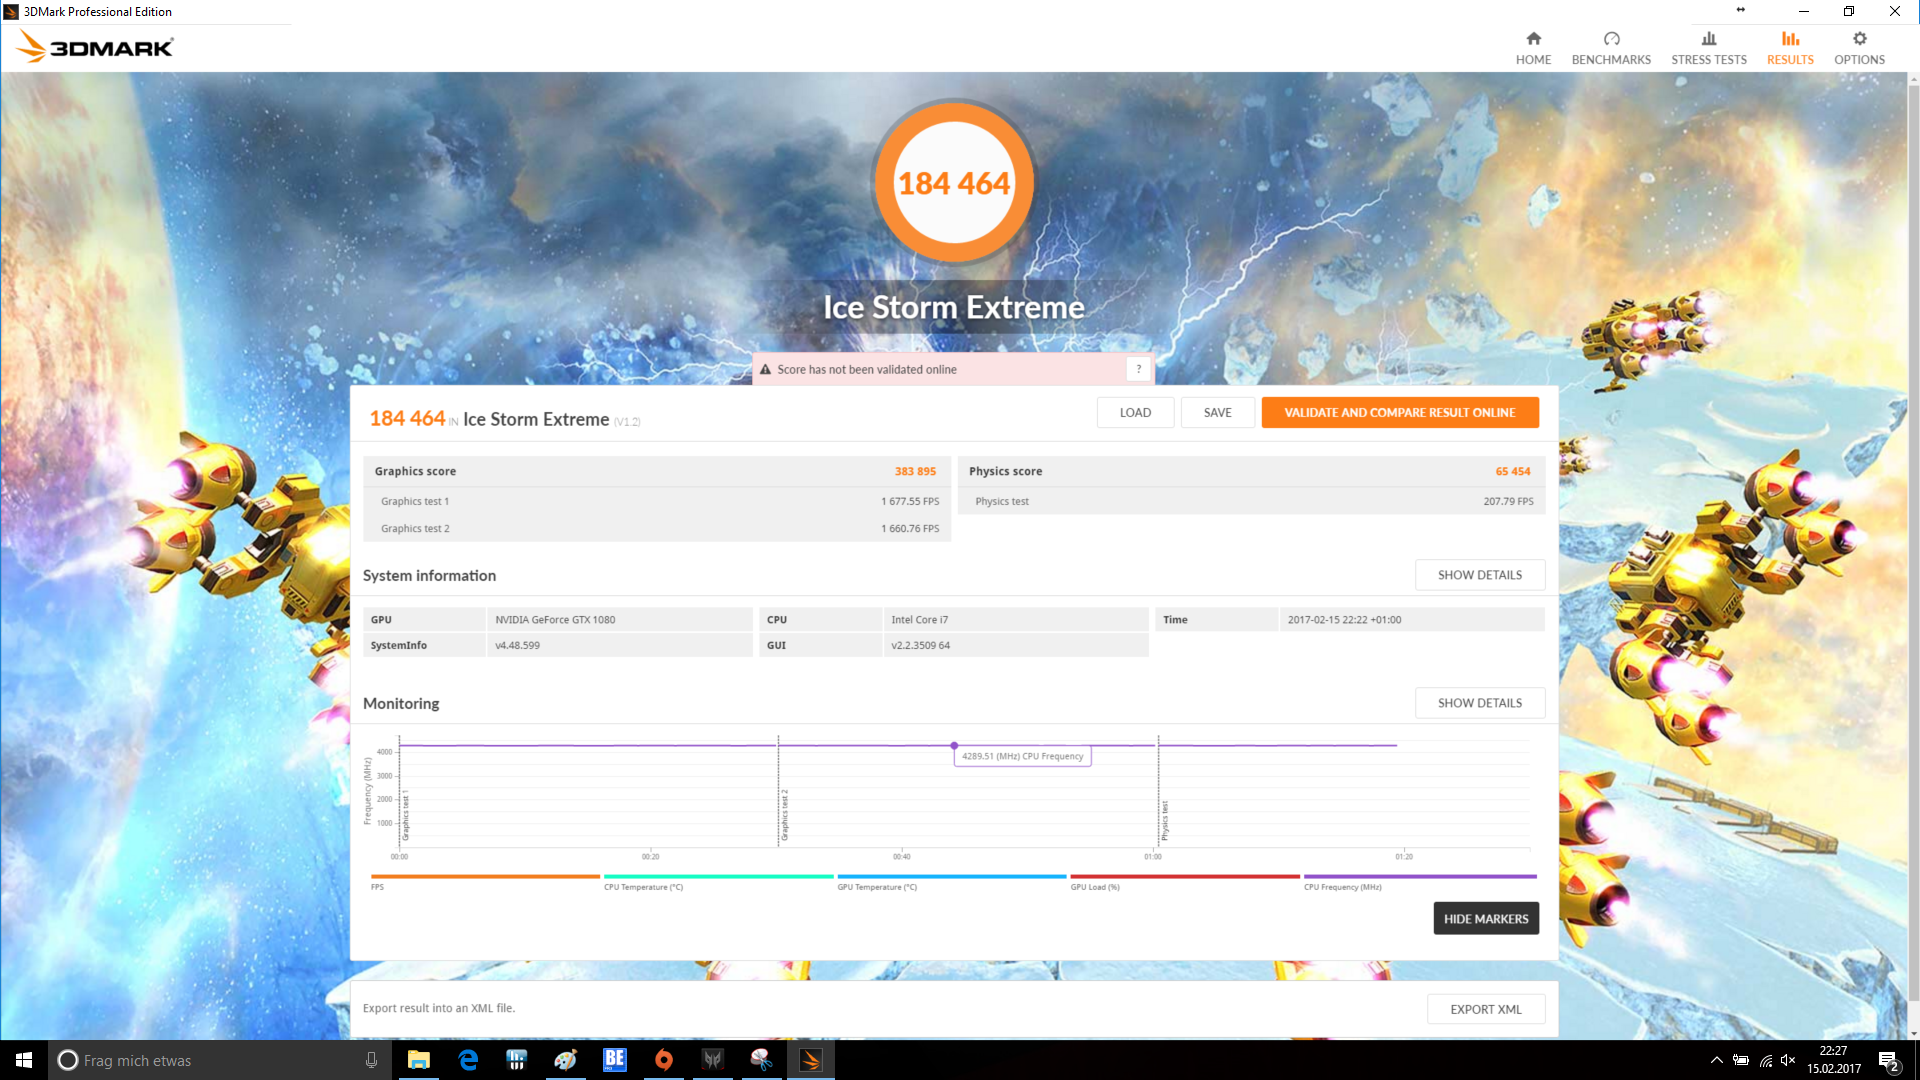
| 3DMark Ice Storm Standard Score | 192504 points | |
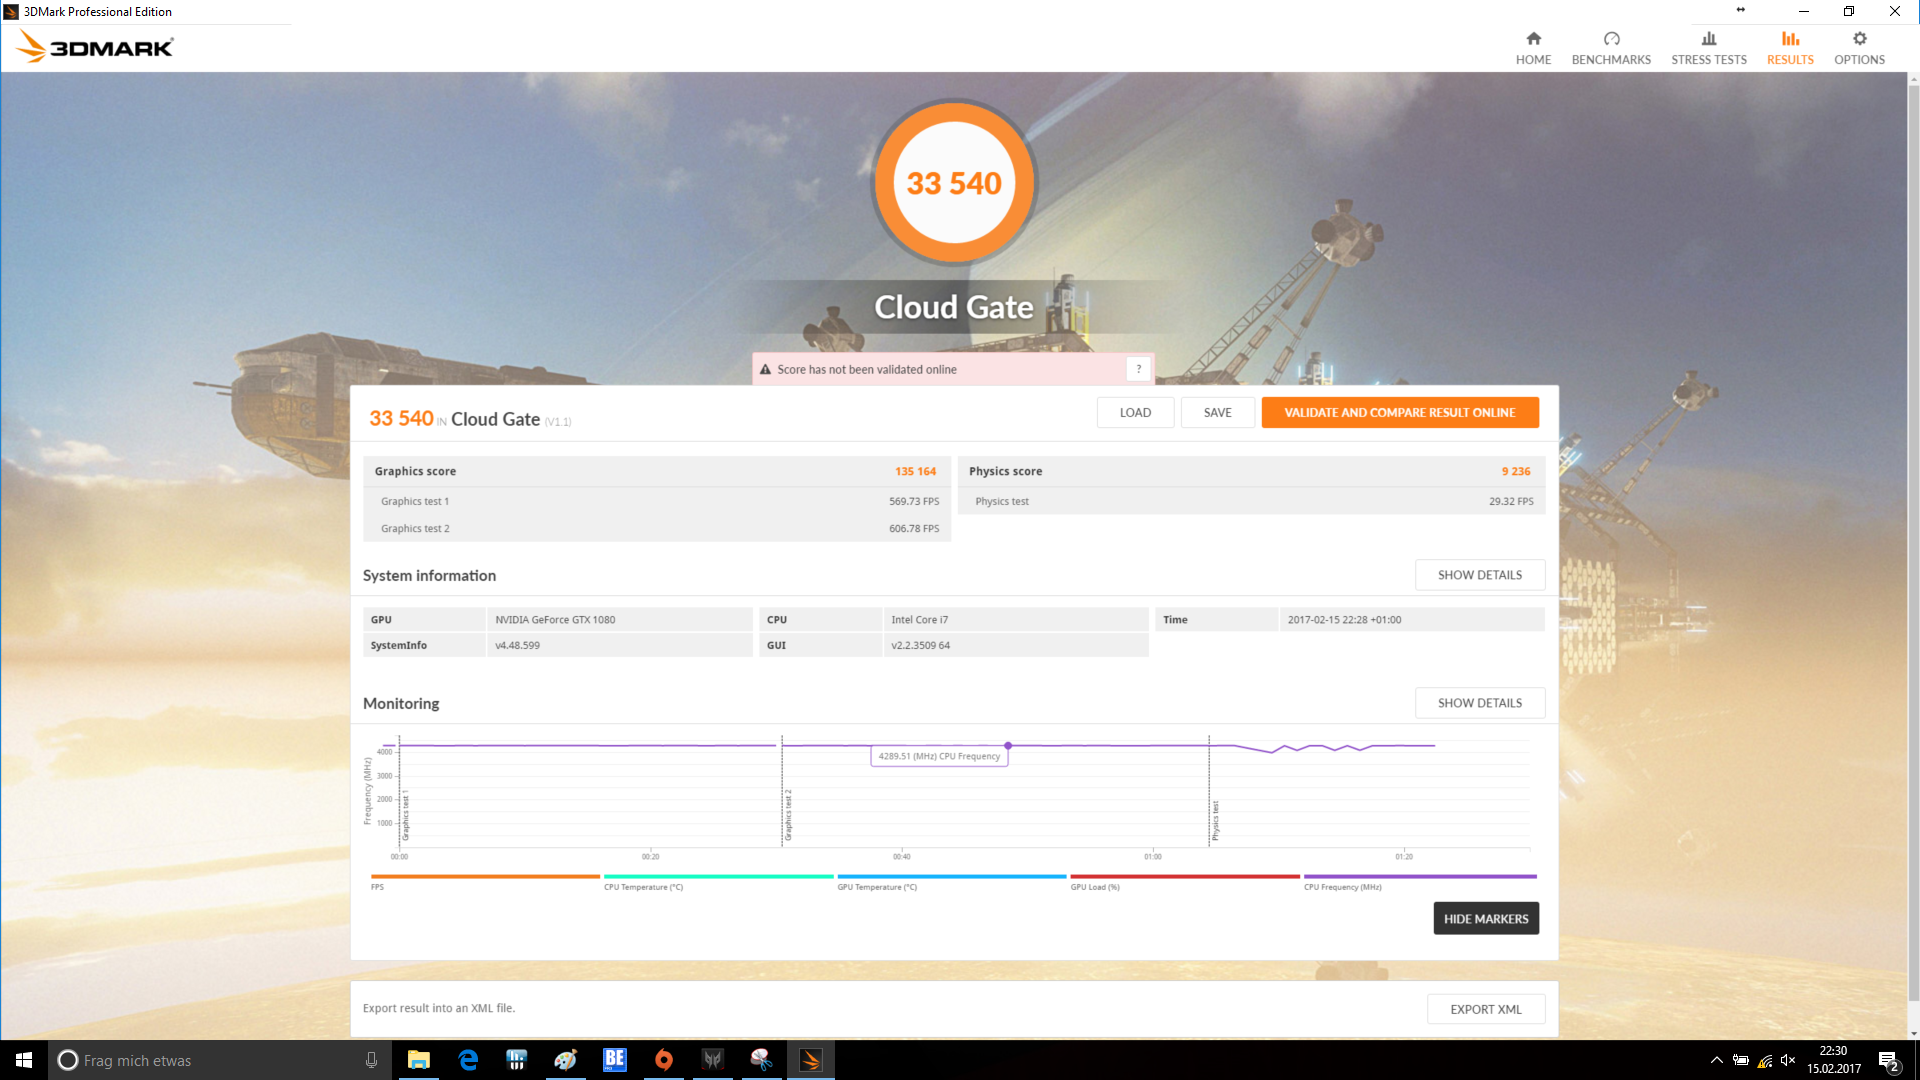
| 3DMark Cloud Gate Standard Score | 33540 points | |
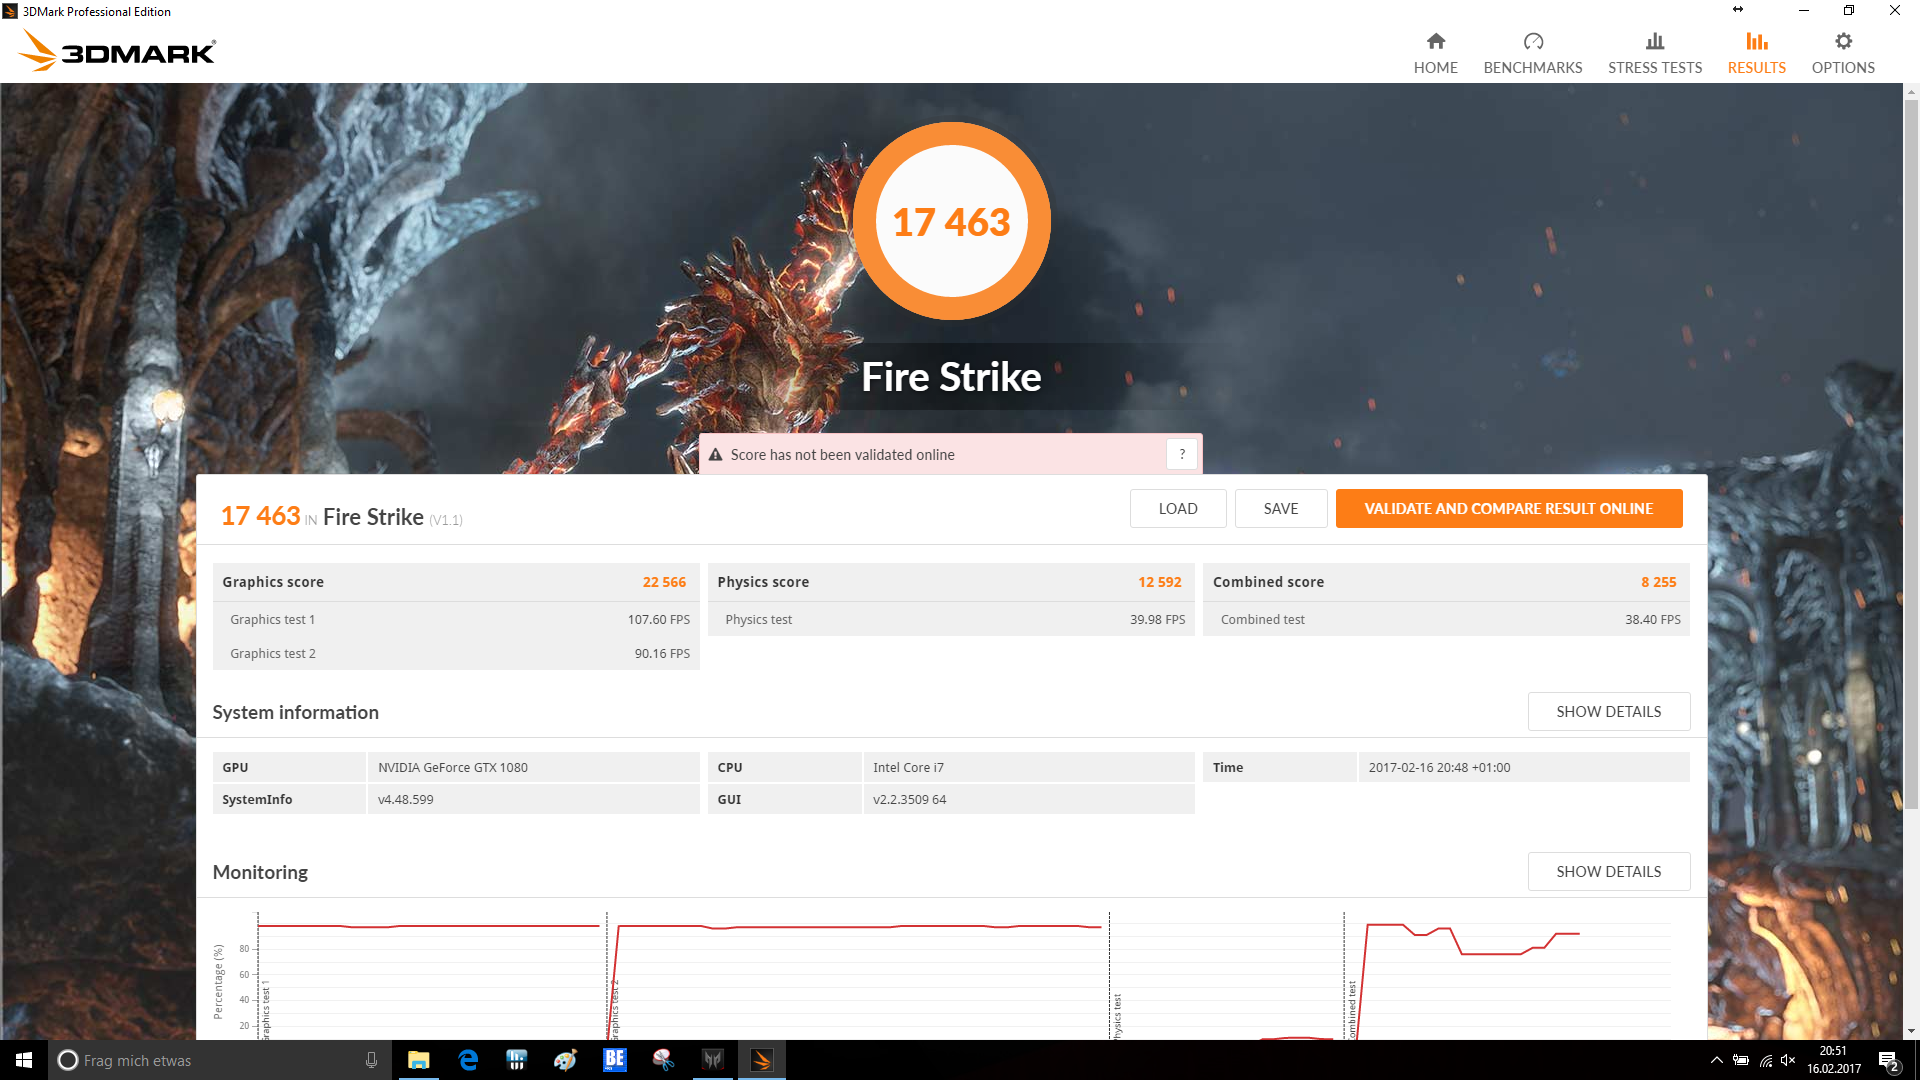
| 3DMark Fire Strike Score | 17463 points | |
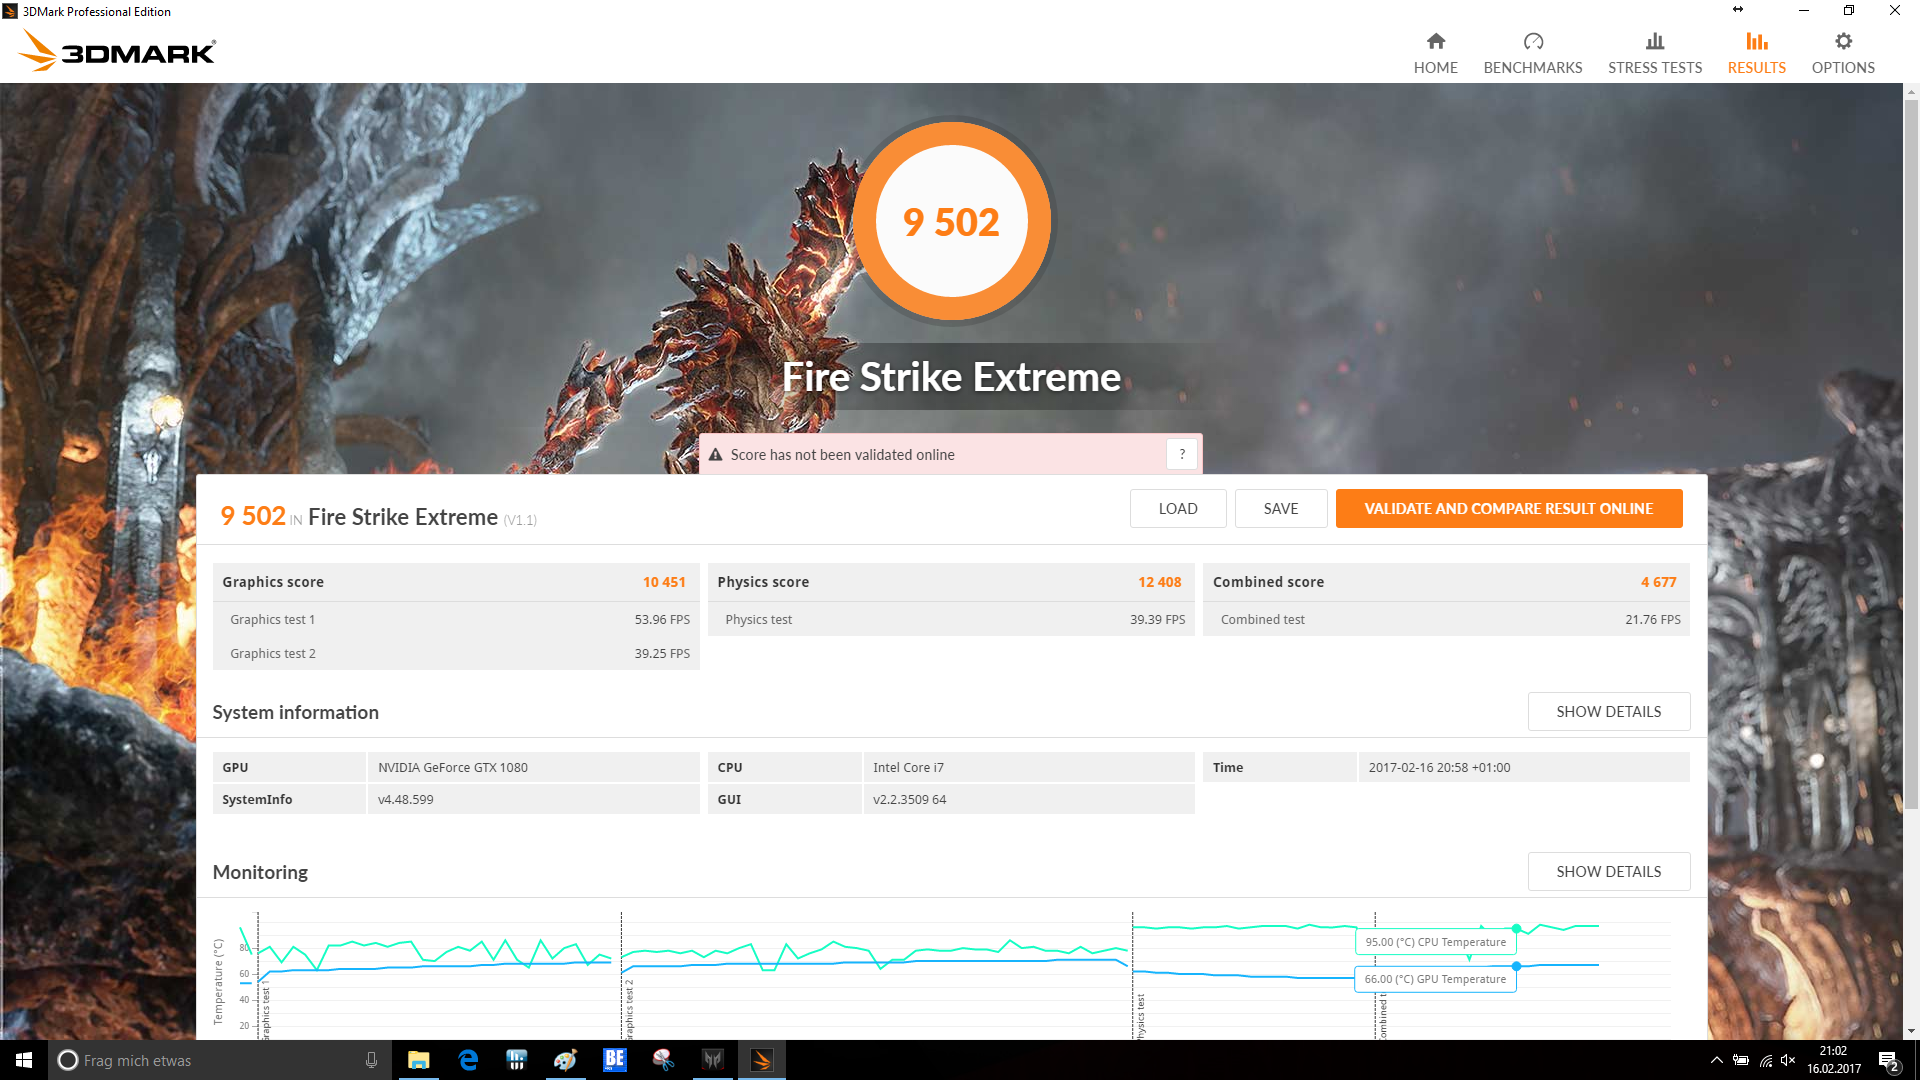
| 3DMark Fire Strike Extreme Score | 9502 points | |
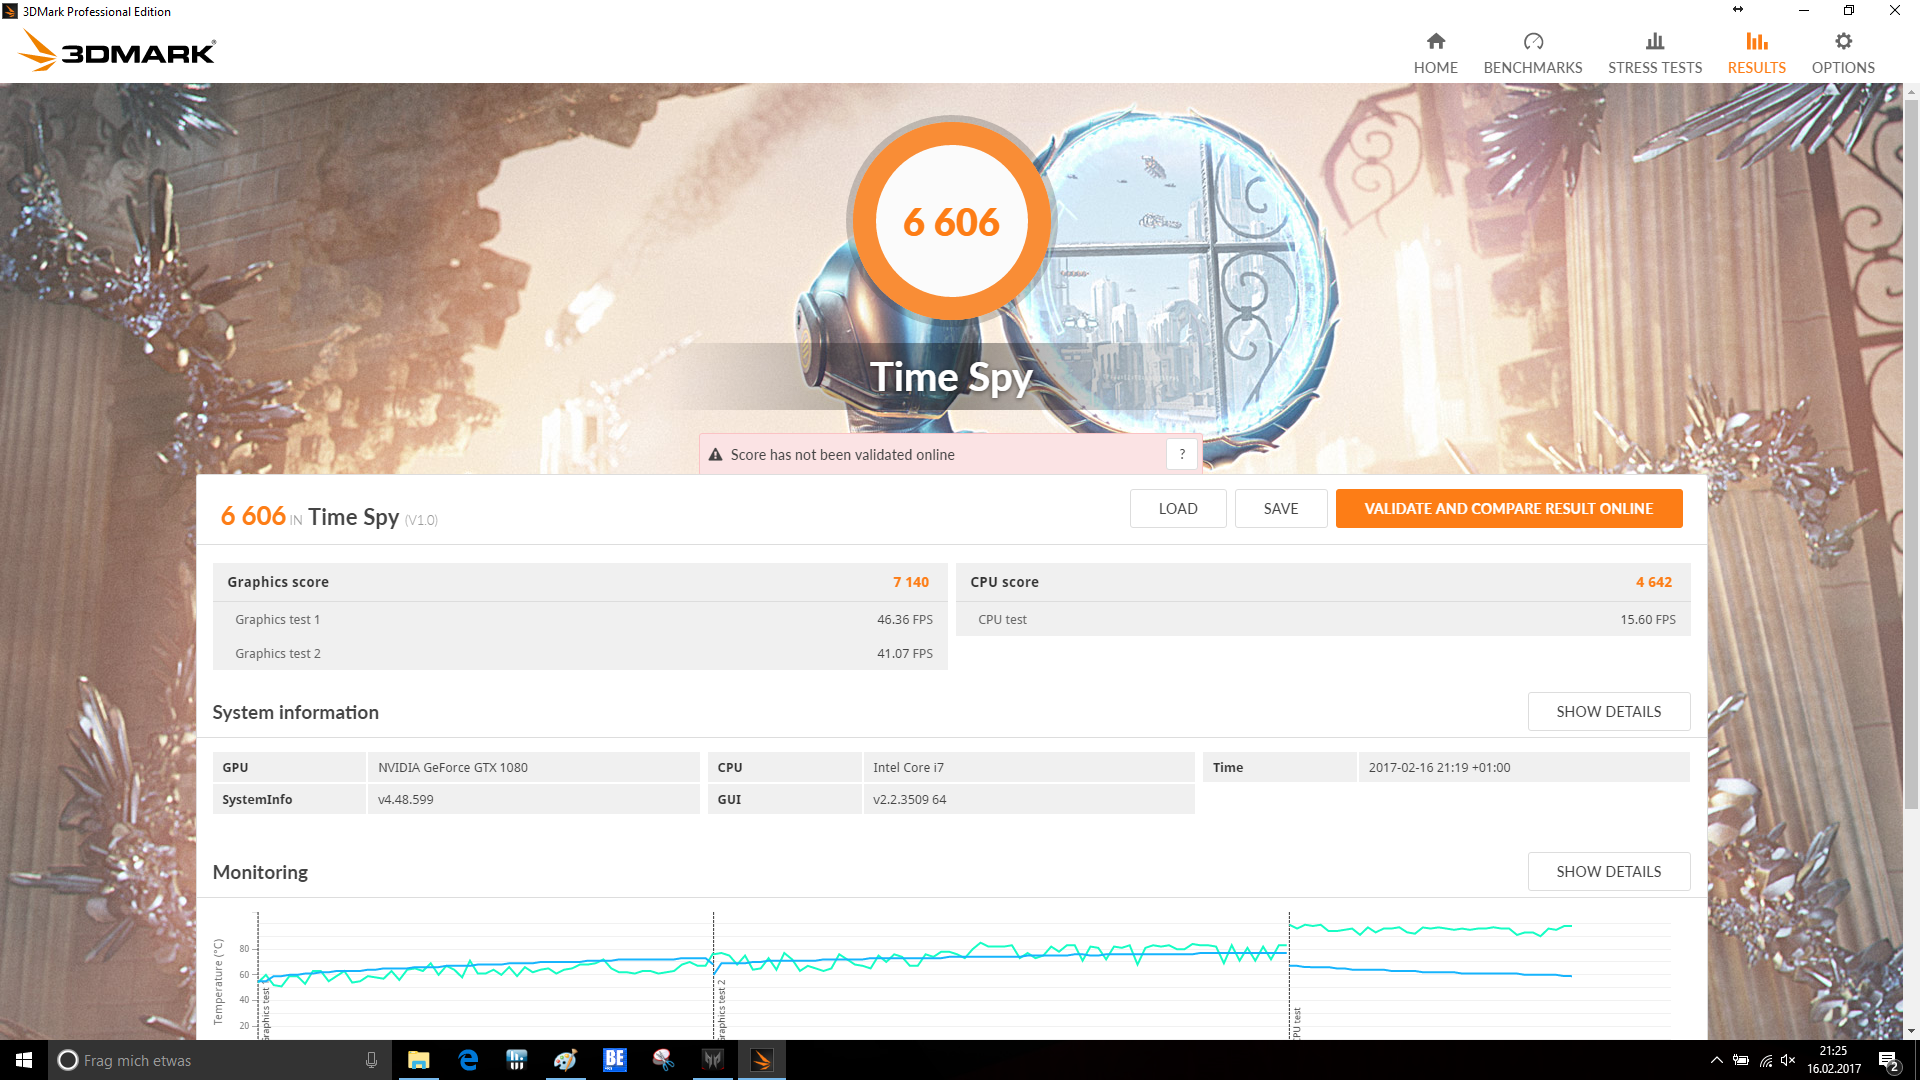
| 3DMark Time Spy Score | 6606 points | |
Help | ||
| low | med. | high | ultra | 4K | |
|---|---|---|---|---|---|
| BioShock Infinite (2013) | 324.3 | 284.5 | 273.7 | 176.8 | |
| GTA V (2015) | 170.8 | 162.5 | 130.3 | 106.8 | 75.7 |
| The Witcher 3 (2015) | 270.8 | 197.5 | 125.8 | 68.5 | 46.8 |
| Rise of the Tomb Raider (2016) | 260.9 | 218.3 | 153.8 | 126.1 | 61.2 |
| Far Cry Primal (2016) | 157 | 138 | 125 | 107 | 49 |
| The Division (2016) | 258.8 | 201.6 | 122.4 | 97.2 | 48.4 |
| Doom (2016) | 179.9 | 170.2 | 149.1 | 147.8 | 70.3 |
| Deus Ex Mankind Divided (2016) | 145.9 | 136.9 | 98.9 | 54.9 | 34.4 |
| Resident Evil 7 (2017) | 462.9 | 353.4 | 269.3 | 234.1 | 78.5 |
| For Honor (2017) | 265.6 | 190.1 | 177.5 | 134.9 | 59.4 |
Noise level
| Idle |
| 33 / 35 / 37 dB(A) |
| HDD |
| 33 dB(A) |
| Load |
| 40 / 50 dB(A) |
 | ||
30 dB silent 40 dB(A) audible 50 dB(A) loud |
||
min: | ||
| Acer Predator 17 X GX-792-76DL i7-7820HK, GeForce GTX 1080 Mobile | MSI GT73VR 7RF-296 i7-7820HK, GeForce GTX 1080 Mobile | Asus G701VIK-BA049T i7-7820HK, GeForce GTX 1080 Mobile | Asus G752VS-XB78K 6820HK, GeForce GTX 1070 Mobile | MSI GT72VR 7RE-433 i7-7700HQ, GeForce GTX 1070 Mobile | Aorus X7 v6 6820HK, GeForce GTX 1070 Mobile | Acer Predator 17 G9-793-77LG 6700HQ, GeForce GTX 1070 Mobile | |
|---|---|---|---|---|---|---|---|
| Noise | -2% | -1% | 5% | 2% | -4% | -3% | |
| off / environment * (dB) | 30 | 30 -0% | 30 -0% | 30 -0% | 31 -3% | 30 -0% | 31 -3% |
| Idle Minimum * (dB) | 33 | 34 -3% | 30 9% | 31 6% | 34 -3% | 33 -0% | 33 -0% |
| Idle Average * (dB) | 35 | 35 -0% | 31 11% | 32 9% | 35 -0% | 35 -0% | 34 3% |
| Idle Maximum * (dB) | 37 | 37 -0% | 36 3% | 33 11% | 37 -0% | 40 -8% | 40 -8% |
| Load Average * (dB) | 40 | 39 2% | 47 -18% | 40 -0% | 37 7% | 43 -8% | 44 -10% |
| Load Maximum * (dB) | 50 | 56 -12% | 56 -12% | 47 6% | 44 12% | 54 -8% | 50 -0% |
* ... smaller is better

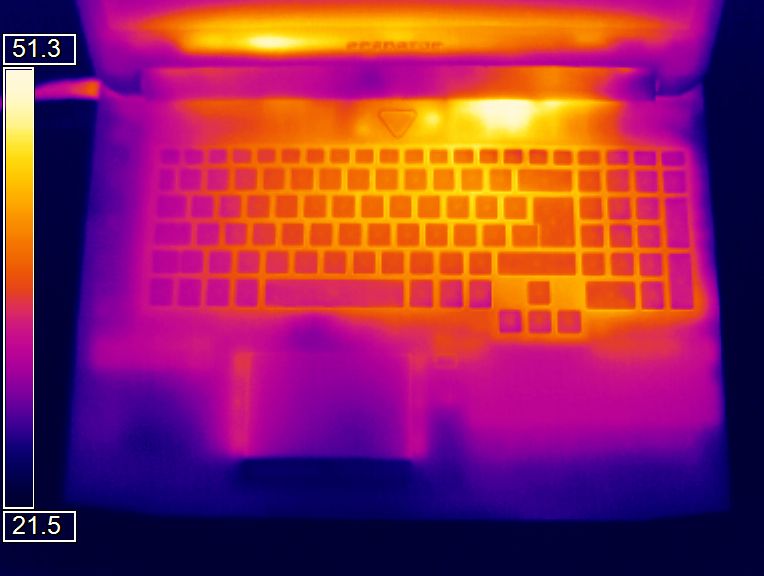
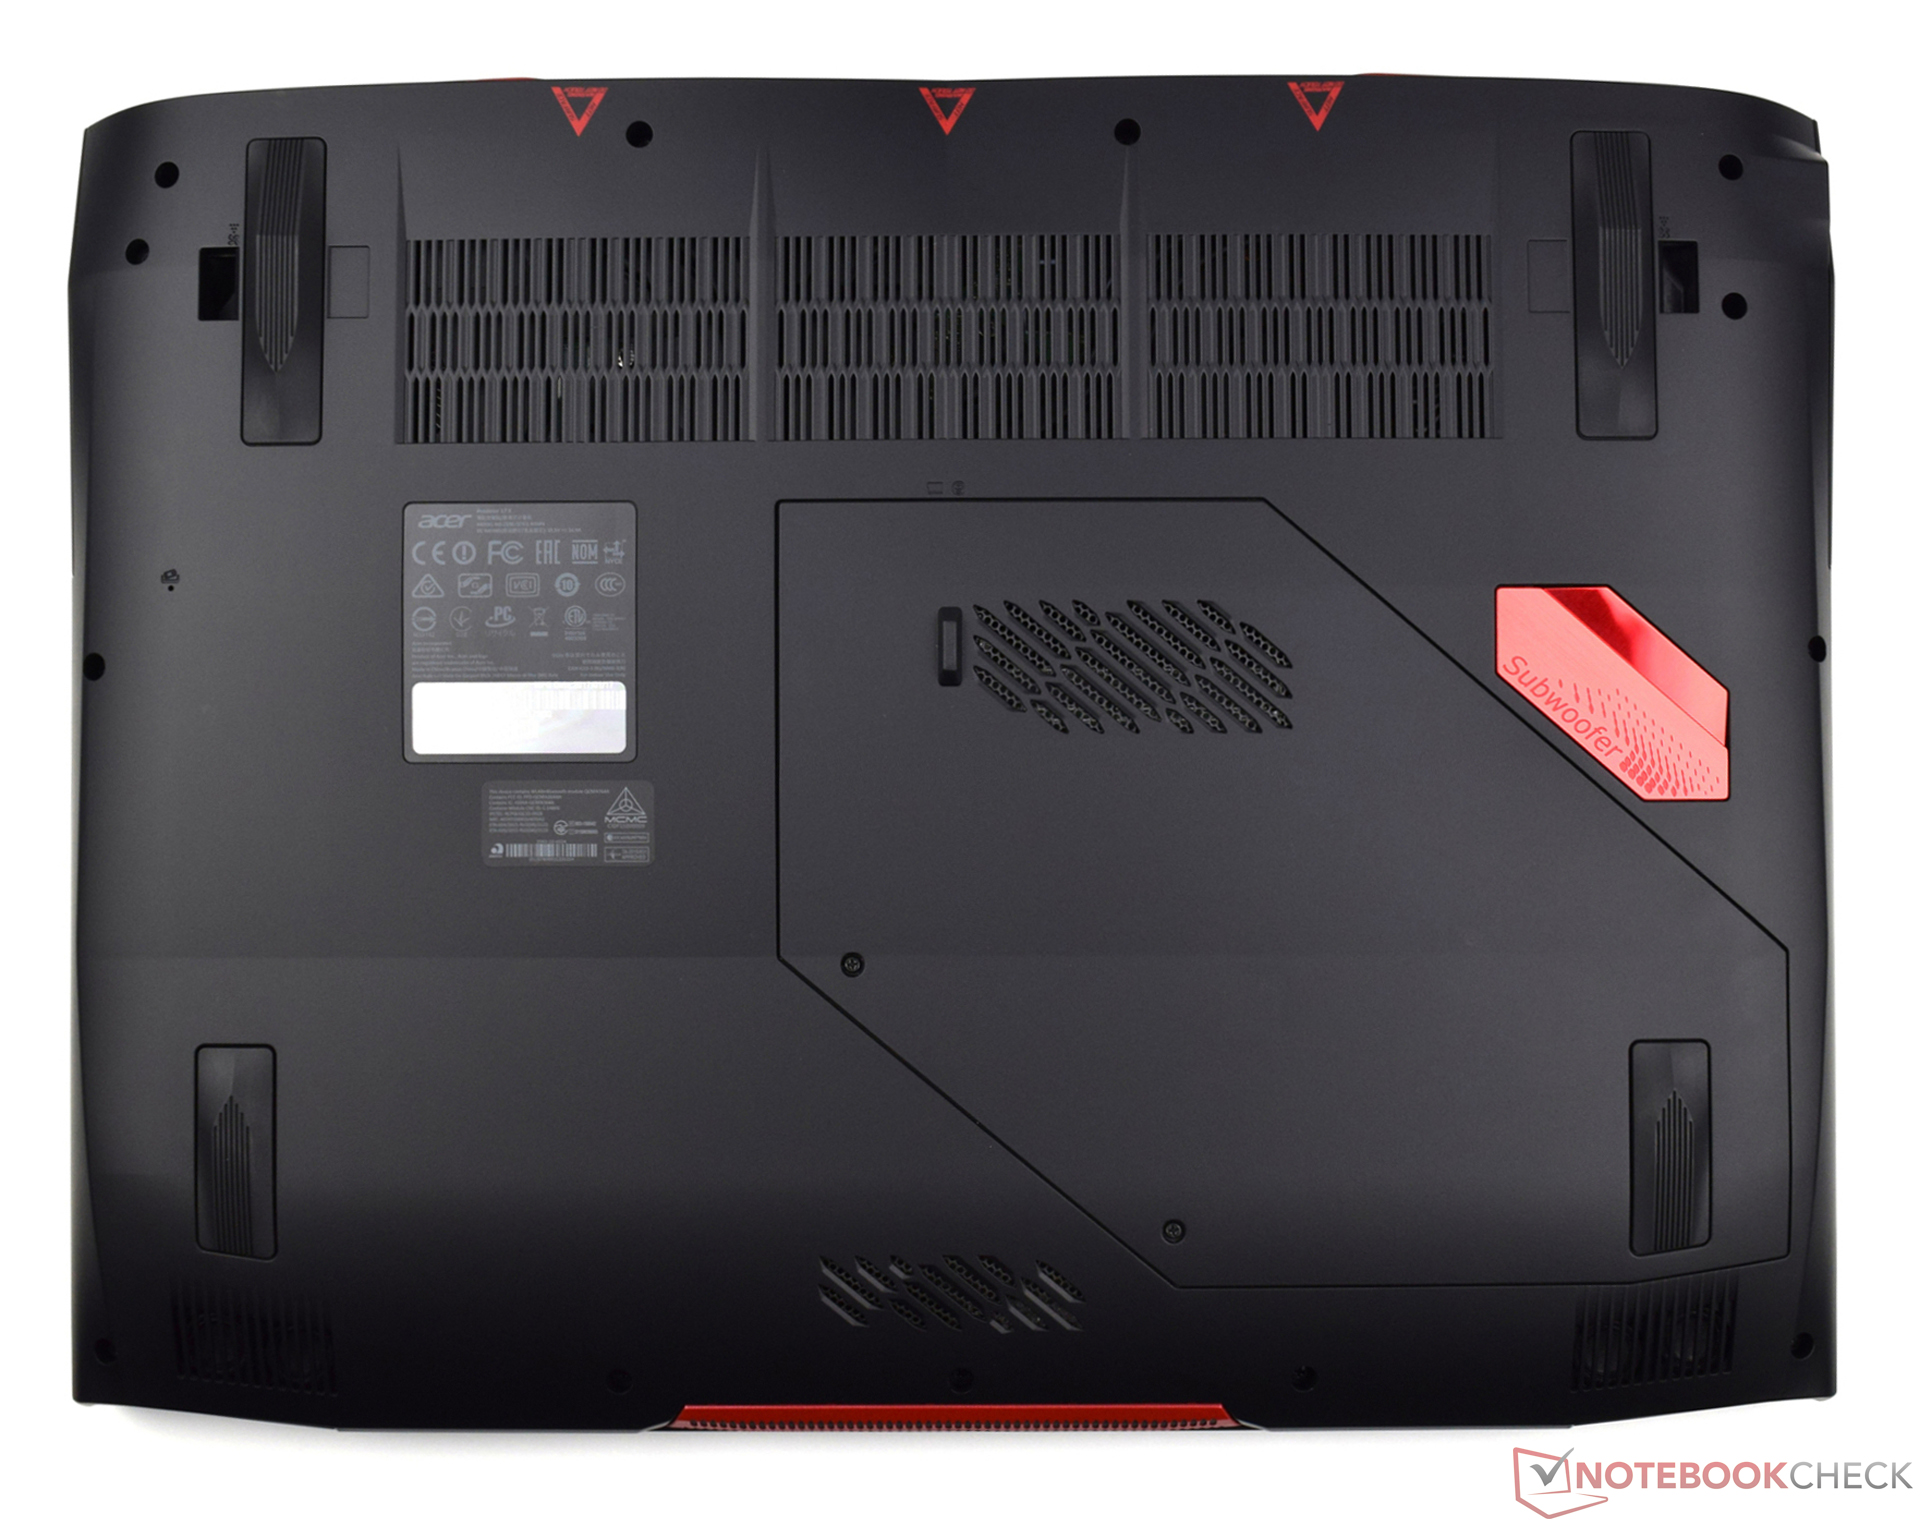
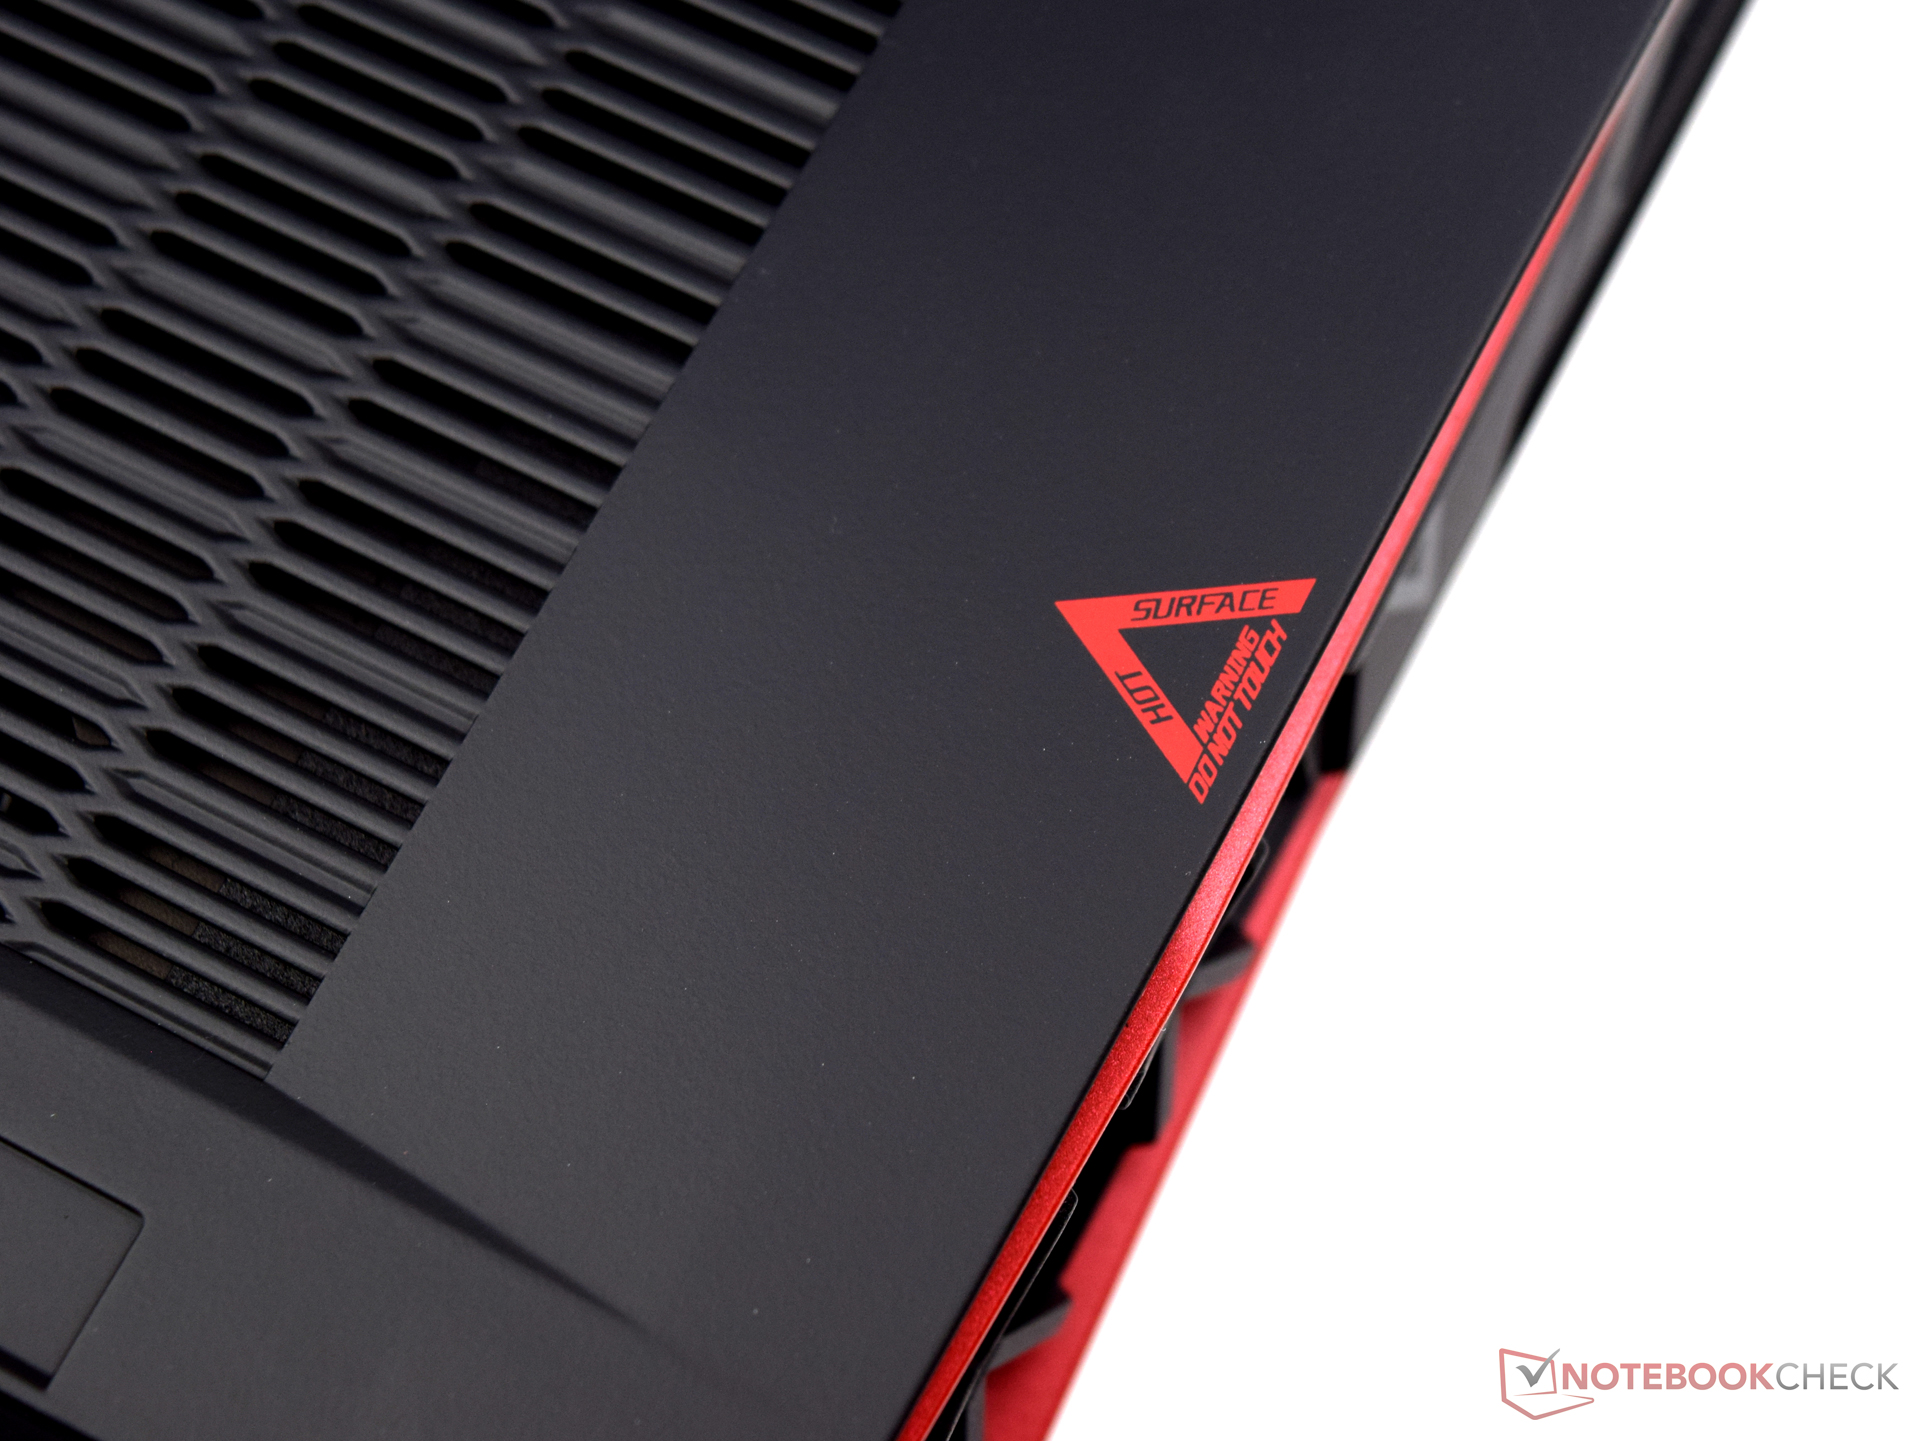
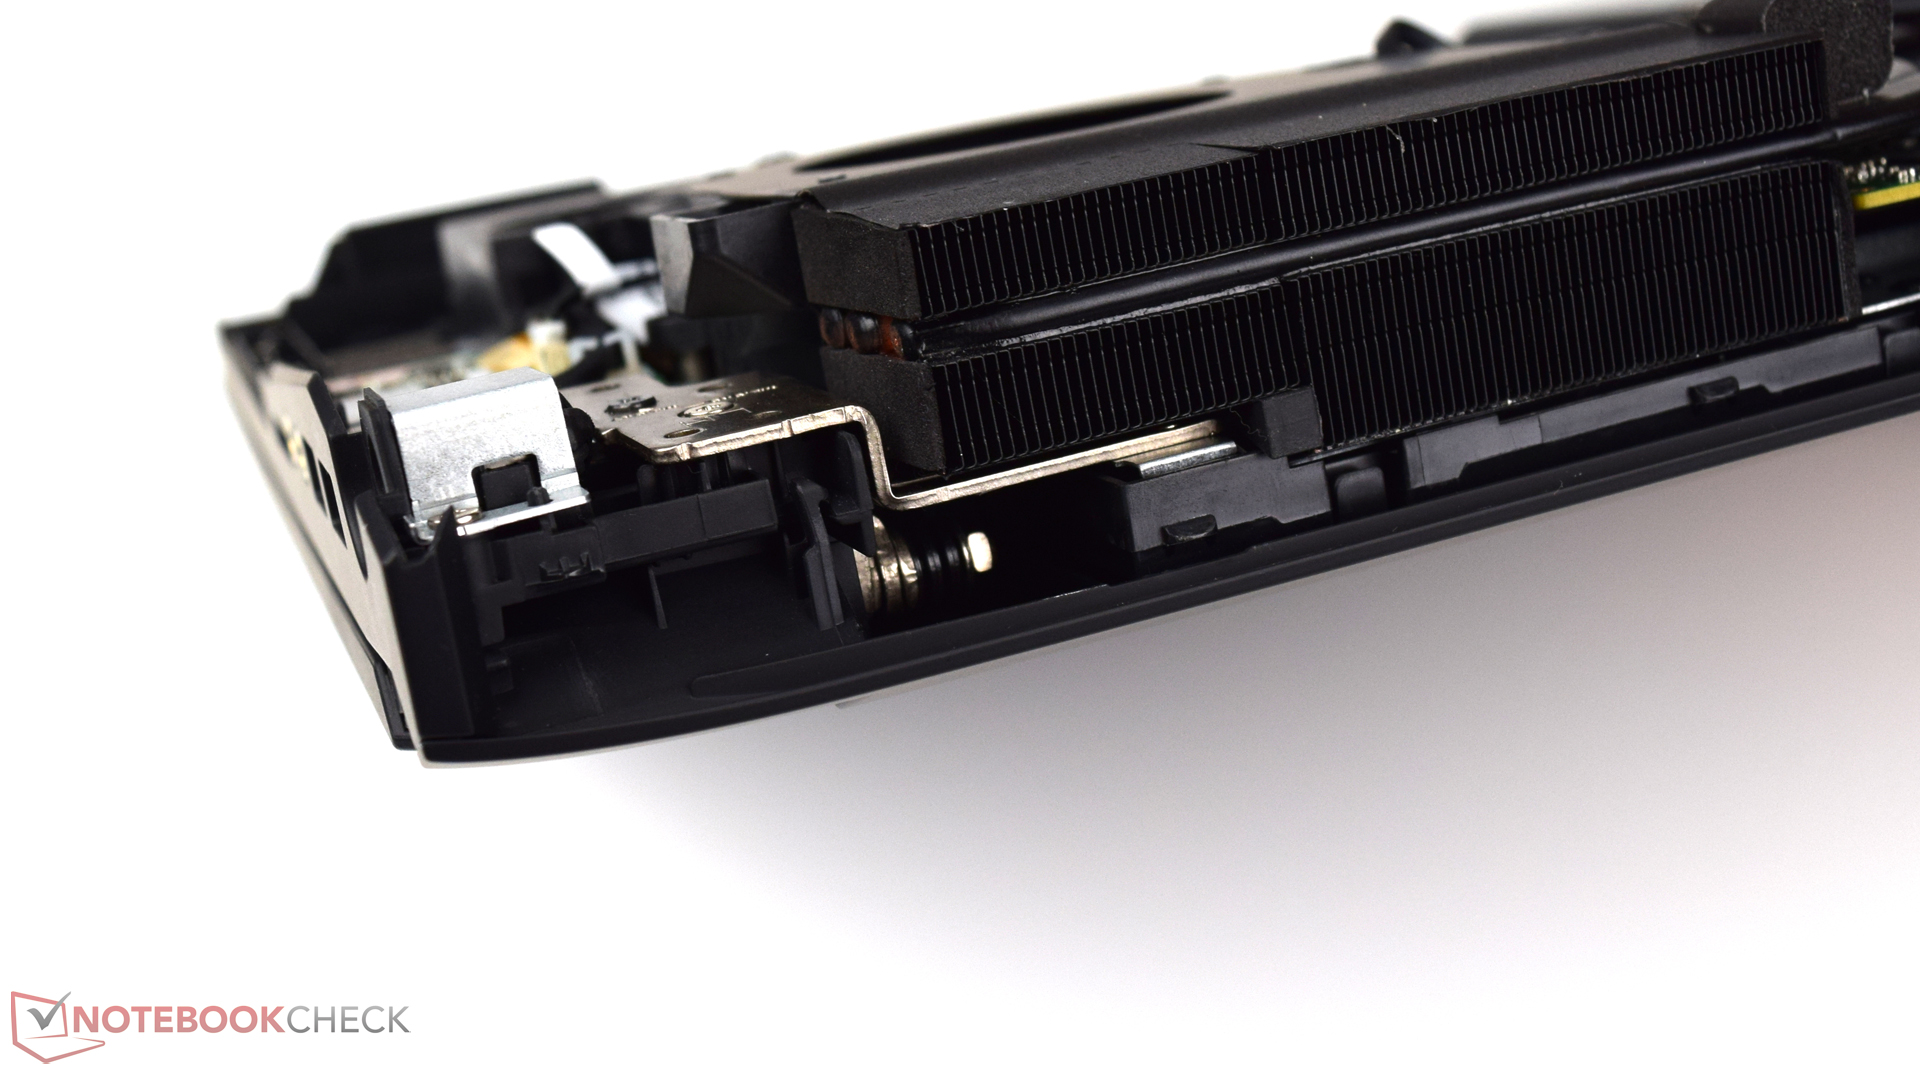
(±) The maximum temperature on the upper side is 44.2 °C / 112 F, compared to the average of 40.4 °C / 105 F, ranging from 21.2 to 68.8 °C for the class Gaming.
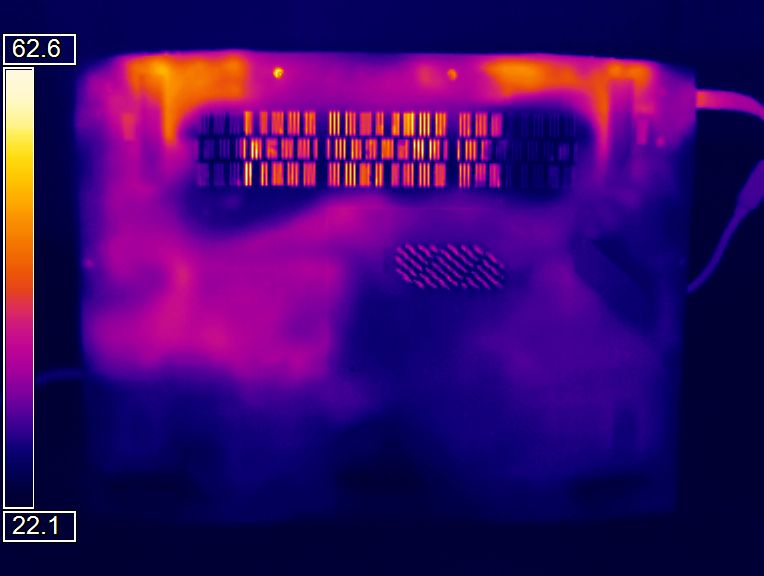
(±) The bottom heats up to a maximum of 43 °C / 109 F, compared to the average of 43.2 °C / 110 F
(+) In idle usage, the average temperature for the upper side is 29.9 °C / 86 F, compared to the device average of 33.9 °C / 93 F.
(+) The palmrests and touchpad are cooler than skin temperature with a maximum of 31.9 °C / 89.4 F and are therefore cool to the touch.
(-) The average temperature of the palmrest area of similar devices was 28.8 °C / 83.8 F (-3.1 °C / -5.6 F).
| Acer Predator 17 X GX-792-76DL i7-7820HK, GeForce GTX 1080 Mobile | MSI GT73VR 7RF-296 i7-7820HK, GeForce GTX 1080 Mobile | Asus G701VIK-BA049T i7-7820HK, GeForce GTX 1080 Mobile | Asus G752VS-XB78K 6820HK, GeForce GTX 1070 Mobile | MSI GT72VR 7RE-433 i7-7700HQ, GeForce GTX 1070 Mobile | Aorus X7 v6 6820HK, GeForce GTX 1070 Mobile | Acer Predator 17 G9-793-77LG 6700HQ, GeForce GTX 1070 Mobile | |
|---|---|---|---|---|---|---|---|
| Heat | 8% | 0% | 5% | 8% | -3% | 3% | |
| Maximum Upper Side * (°C) | 44.2 | 39.8 10% | 50.9 -15% | 42.9 3% | 41.5 6% | 47.5 -7% | 42.6 4% |
| Maximum Bottom * (°C) | 43 | 47.8 -11% | 44.6 -4% | 41.5 3% | 50.6 -18% | 54.5 -27% | 44.9 -4% |
| Idle Upper Side * (°C) | 32.4 | 27.1 16% | 29.9 8% | 31.6 2% | 26.4 19% | 28.6 12% | 33.1 -2% |
| Idle Bottom * (°C) | 32.8 | 27.4 16% | 28.8 12% | 29.5 10% | 25.4 23% | 28.8 12% | 28.9 12% |
* ... smaller is better
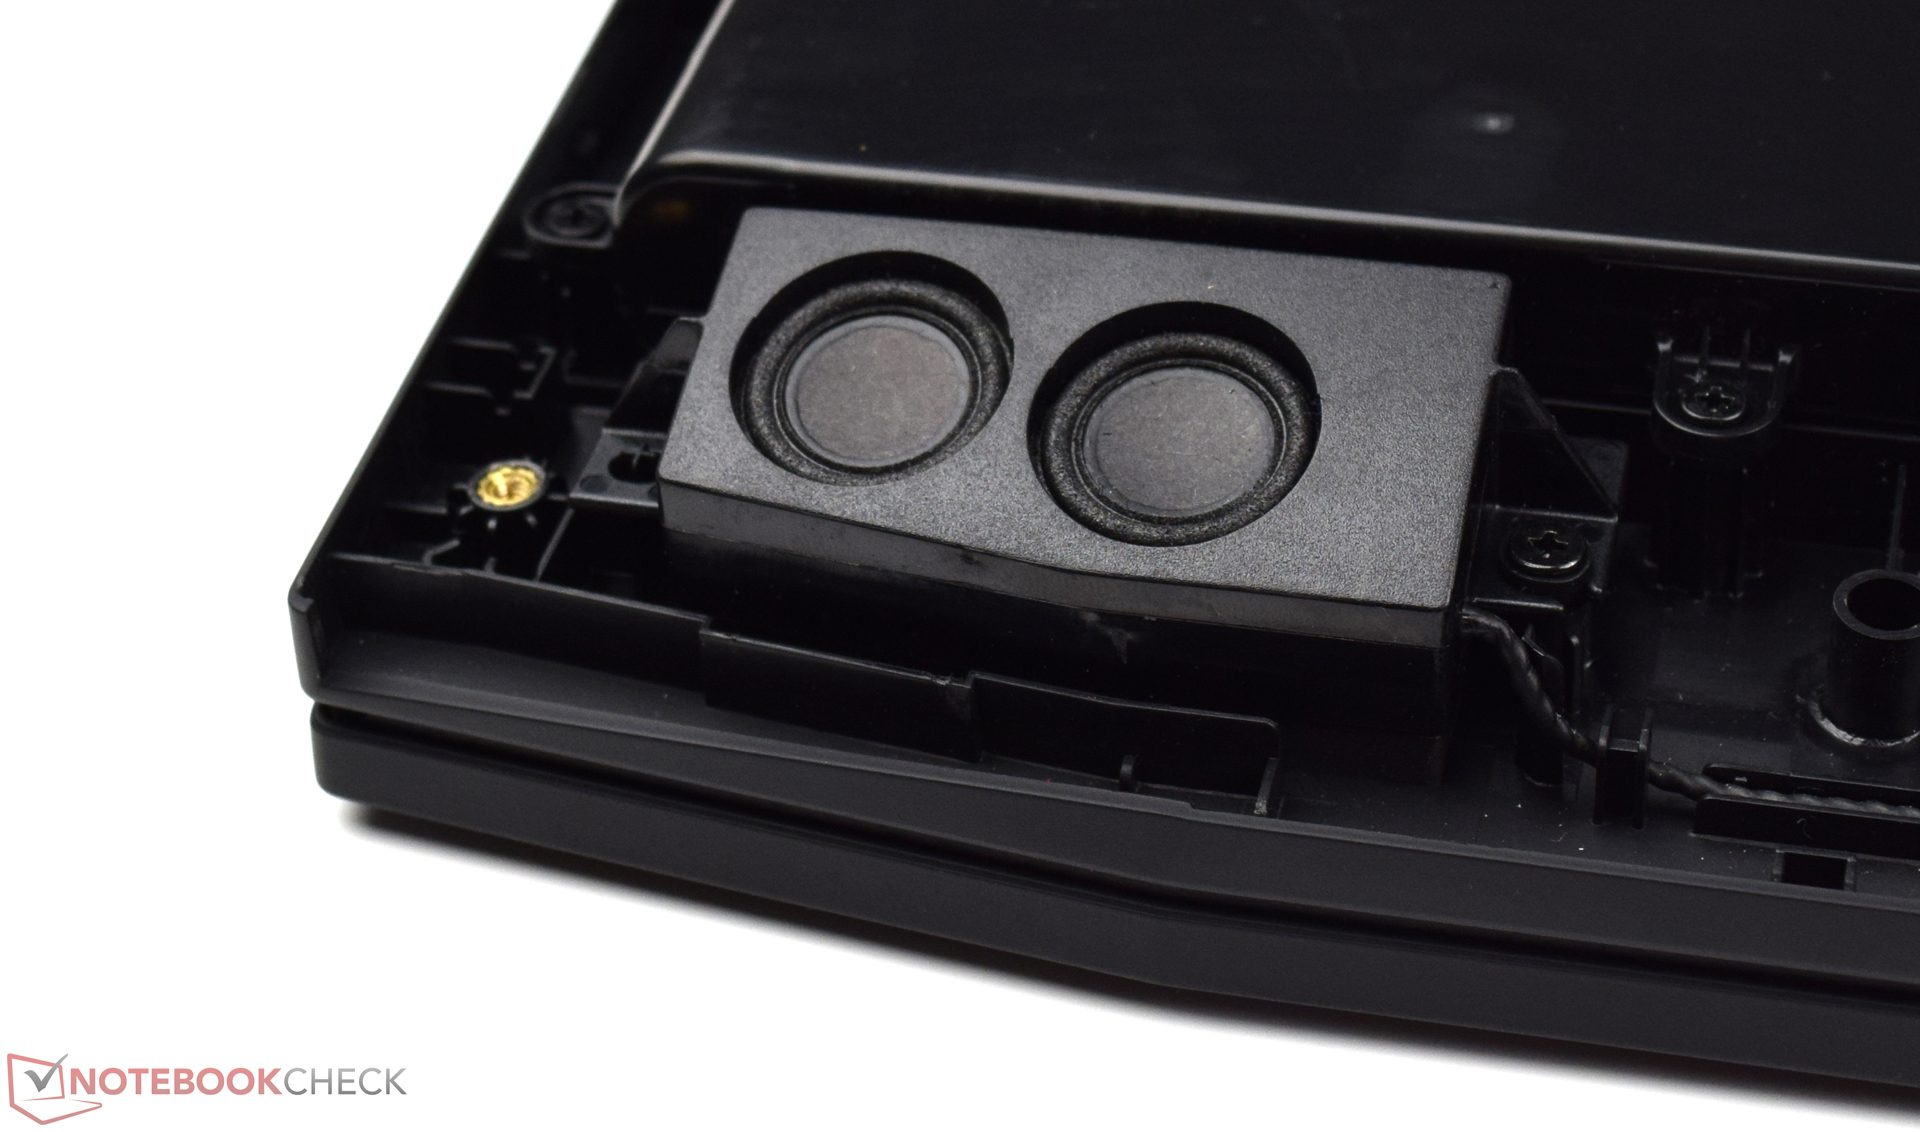
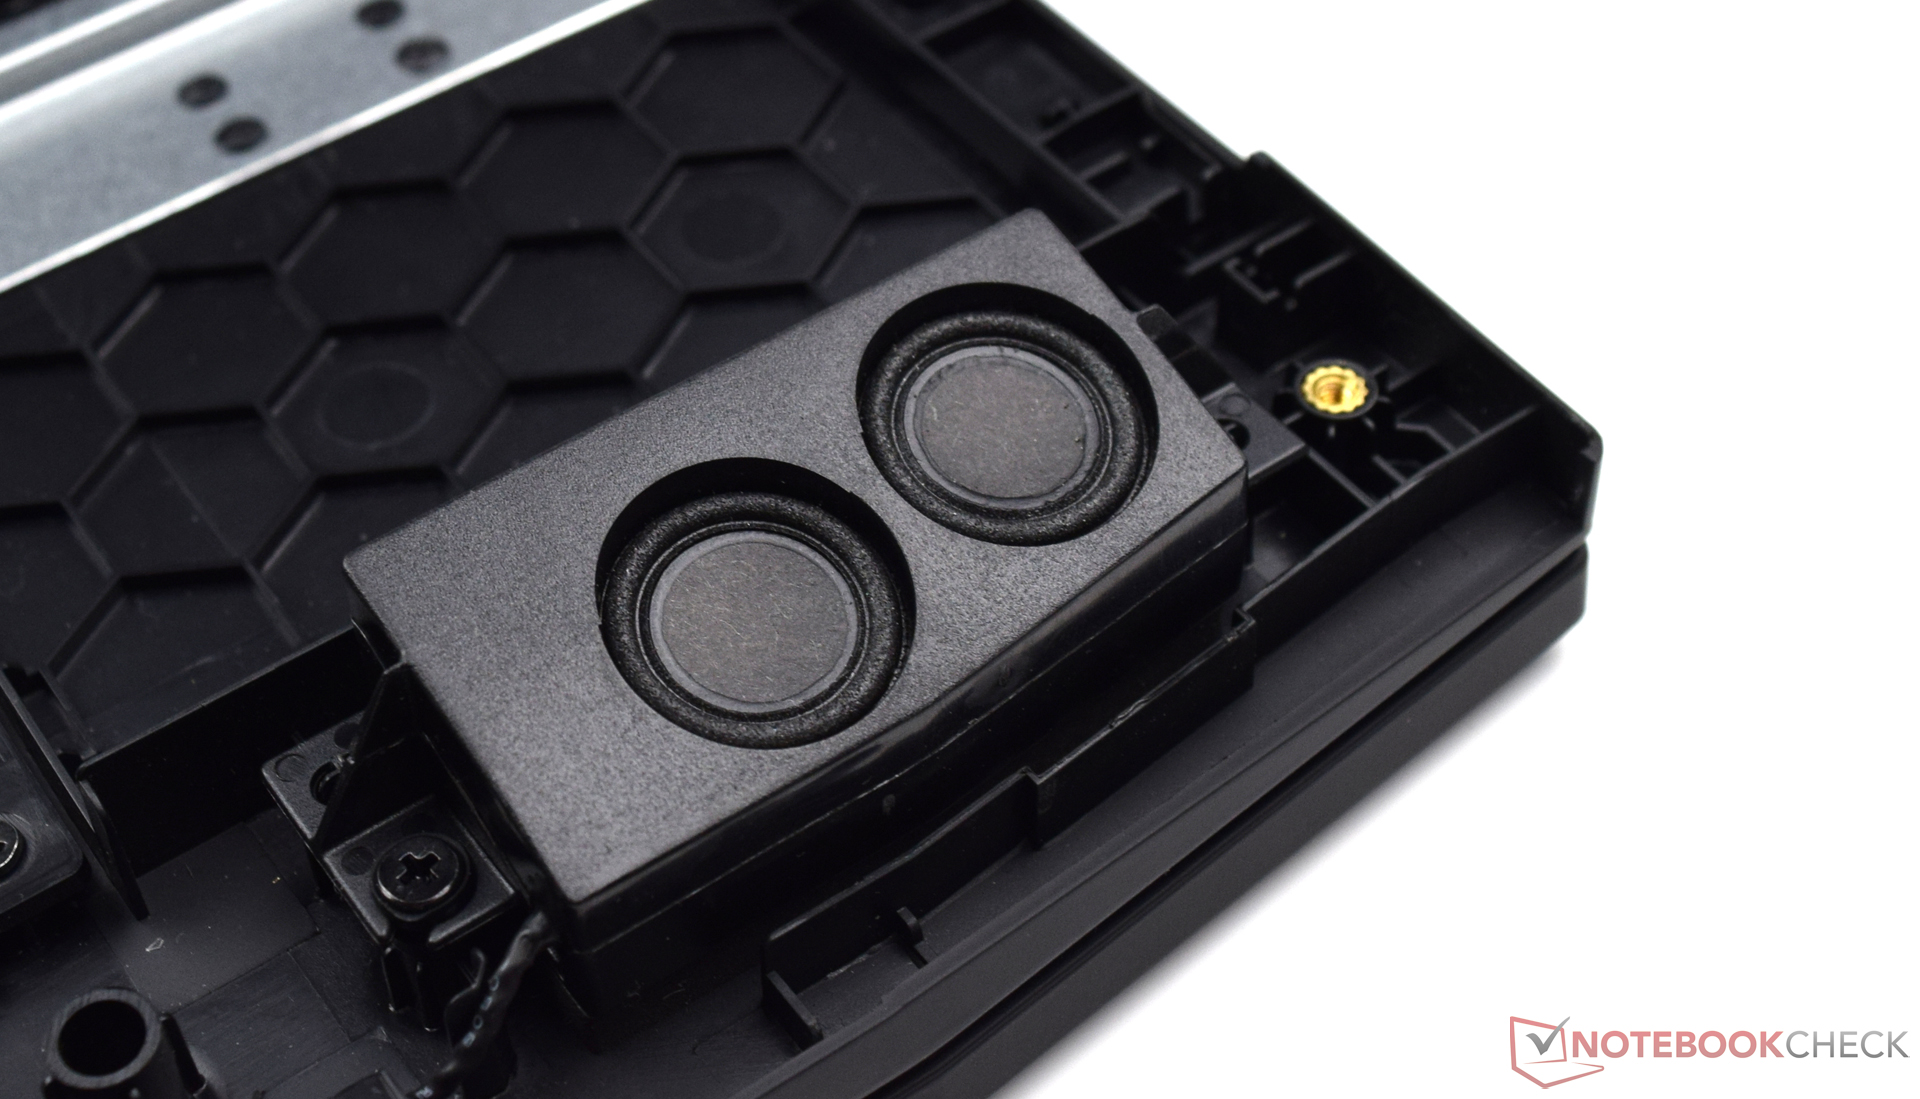
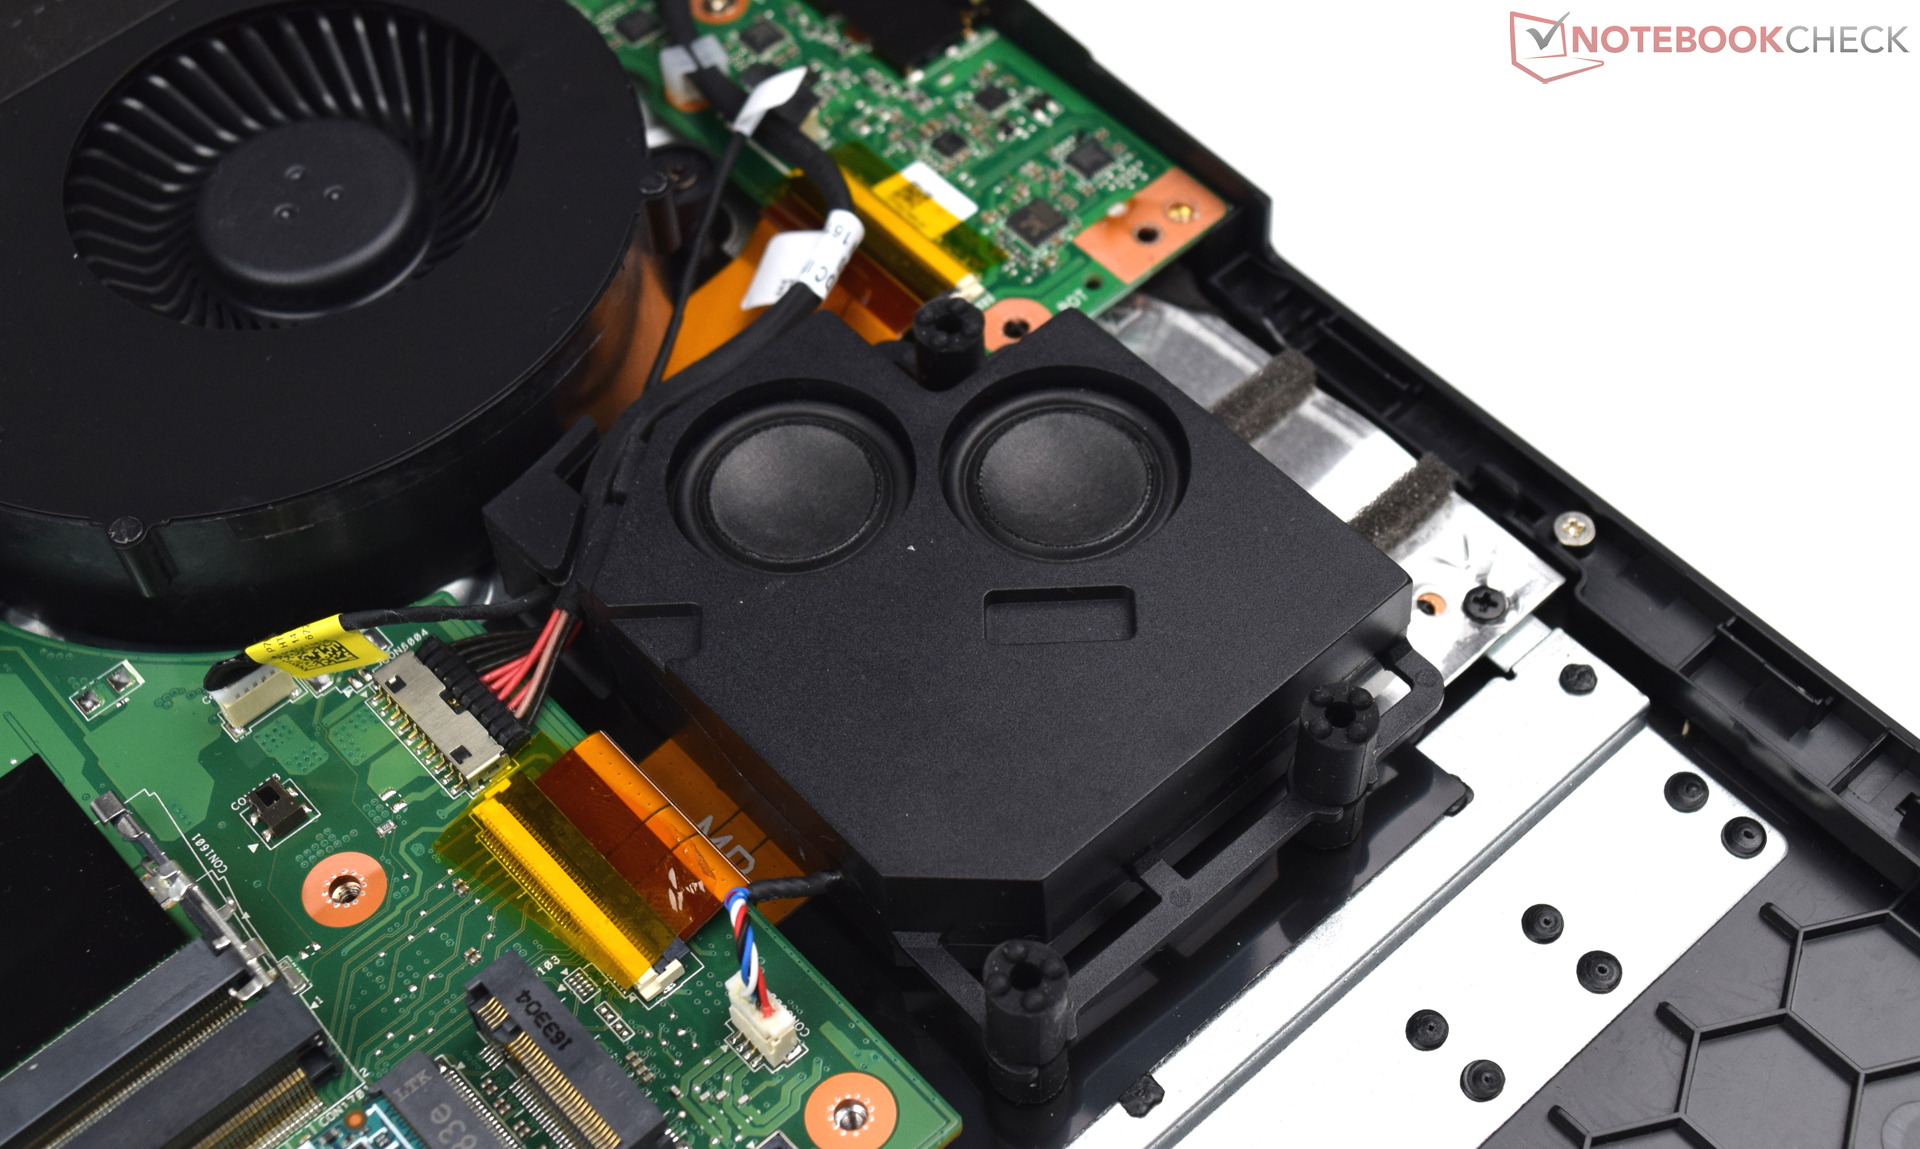
Acer Predator 17 X GX-792-76DL audio analysis
(+) | speakers can play relatively loud (86 dB)
Bass 100 - 315 Hz
(±) | reduced bass - on average 9.6% lower than median
(±) | linearity of bass is average (9.3% delta to prev. frequency)
Mids 400 - 2000 Hz
(+) | balanced mids - only 2.6% away from median
(+) | mids are linear (4.9% delta to prev. frequency)
Highs 2 - 16 kHz
(+) | balanced highs - only 3.9% away from median
(+) | highs are linear (6.7% delta to prev. frequency)
Overall 100 - 16.000 Hz
(+) | overall sound is linear (11.1% difference to median)
Compared to same class
» 8% of all tested devices in this class were better, 3% similar, 89% worse
» The best had a delta of 6%, average was 18%, worst was 132%
Compared to all devices tested
» 7% of all tested devices were better, 2% similar, 91% worse
» The best had a delta of 4%, average was 23%, worst was 134%
MSI GT73VR 7RF-296 audio analysis
(+) | speakers can play relatively loud (93 dB)
Bass 100 - 315 Hz
(±) | reduced bass - on average 11.7% lower than median
(±) | linearity of bass is average (9% delta to prev. frequency)
Mids 400 - 2000 Hz
(+) | balanced mids - only 3% away from median
(+) | mids are linear (3.6% delta to prev. frequency)
Highs 2 - 16 kHz
(+) | balanced highs - only 4% away from median
(+) | highs are linear (3.5% delta to prev. frequency)
Overall 100 - 16.000 Hz
(+) | overall sound is linear (13.6% difference to median)
Compared to same class
» 20% of all tested devices in this class were better, 7% similar, 73% worse
» The best had a delta of 6%, average was 18%, worst was 132%
Compared to all devices tested
» 15% of all tested devices were better, 4% similar, 82% worse
» The best had a delta of 4%, average was 23%, worst was 134%
| Off / Standby | |
| Idle | |
| Load |
|
Key:
min: | |
| Acer Predator 17 X GX-792-76DL i7-7820HK, GeForce GTX 1080 Mobile | MSI GT73VR 7RF-296 i7-7820HK, GeForce GTX 1080 Mobile | Asus G701VIK-BA049T i7-7820HK, GeForce GTX 1080 Mobile | Asus G752VS-XB78K 6820HK, GeForce GTX 1070 Mobile | MSI GT72VR 7RE-433 i7-7700HQ, GeForce GTX 1070 Mobile | Aorus X7 v6 6820HK, GeForce GTX 1070 Mobile | Acer Predator 17 G9-793-77LG 6700HQ, GeForce GTX 1070 Mobile | |
|---|---|---|---|---|---|---|---|
| Power Consumption | -7% | -1% | 10% | 22% | -2% | -1% | |
| Idle Minimum * (Watt) | 27 | 29 -7% | 24 11% | 24 11% | 20 26% | 29 -7% | 25 7% |
| Idle Average * (Watt) | 32 | 35 -9% | 31 3% | 31 3% | 27 16% | 31 3% | 35 -9% |
| Idle Maximum * (Watt) | 41 | 40 2% | 38 7% | 36 12% | 31 24% | 38 7% | 46 -12% |
| Load Average * (Watt) | 102 | 94 8% | 98 4% | 94 8% | 86 16% | 111 -9% | 103 -1% |
| Load Maximum * (Watt) | 248 | 315 -27% | 320 -29% | 204 18% | 184 26% | 253 -2% | 223 10% |
* ... smaller is better
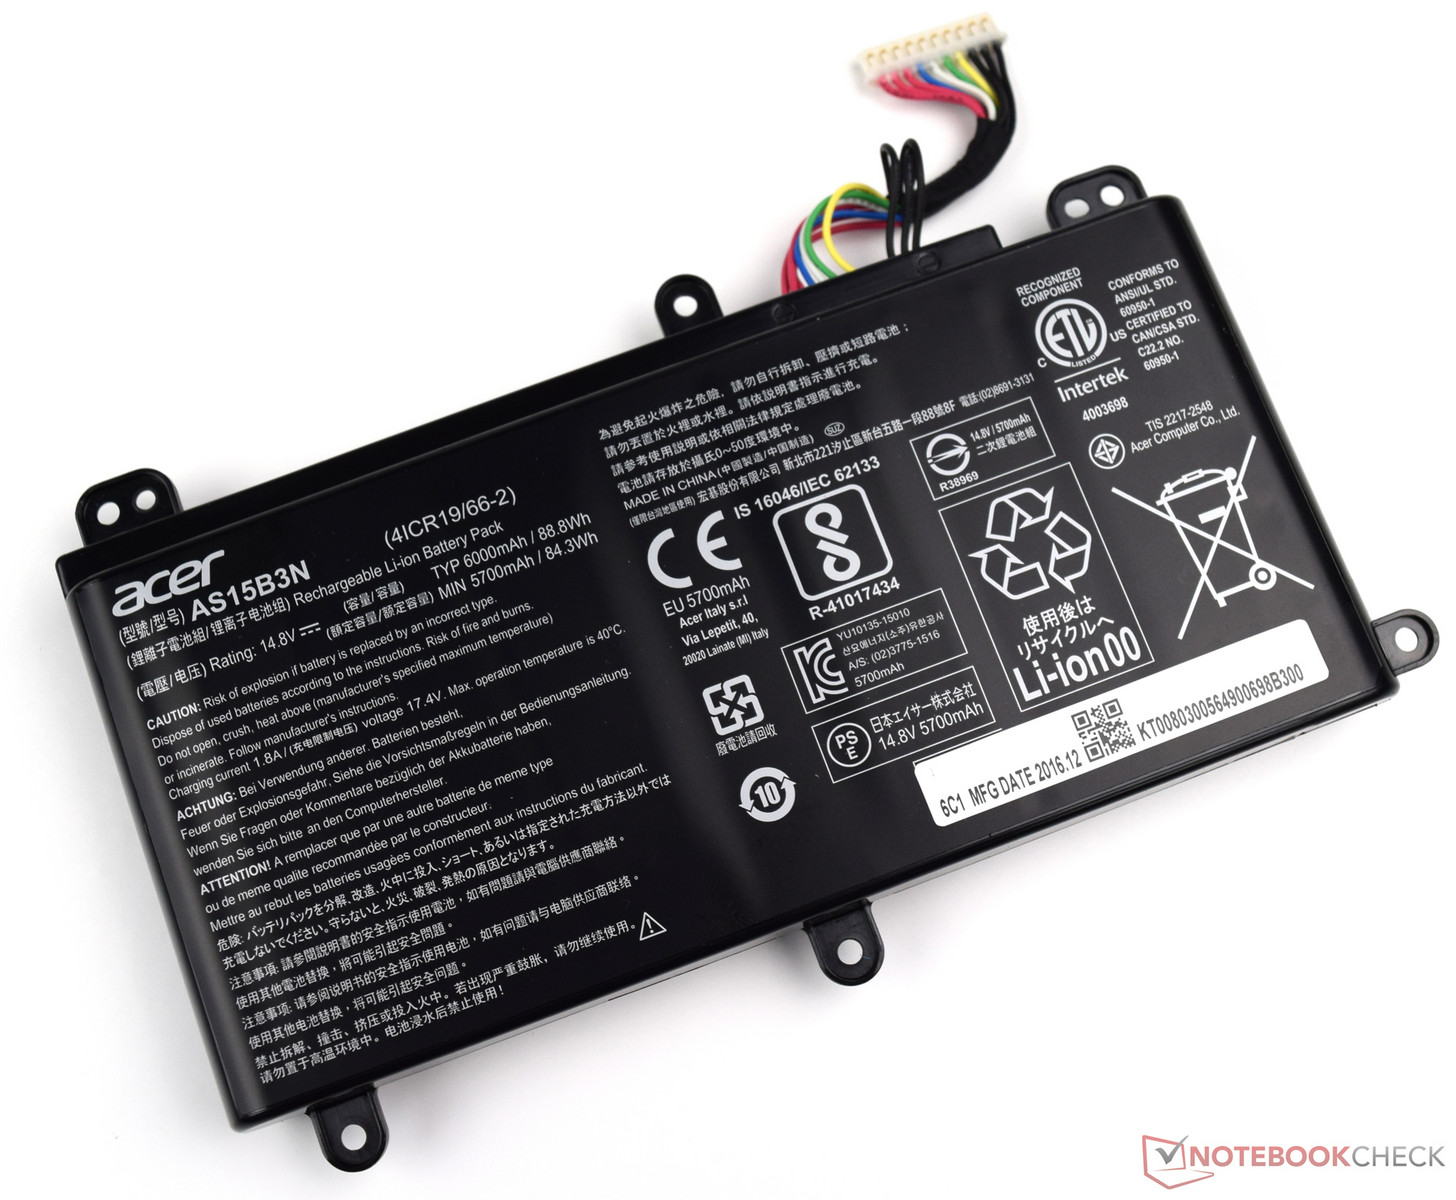


| Acer Predator 17 X GX-792-76DL i7-7820HK, GeForce GTX 1080 Mobile, 88.8 Wh | MSI GT73VR 7RF-296 i7-7820HK, GeForce GTX 1080 Mobile, 75.2 Wh | Asus G701VIK-BA049T i7-7820HK, GeForce GTX 1080 Mobile, 93 Wh | Asus G752VS-XB78K 6820HK, GeForce GTX 1070 Mobile, 90 Wh | MSI GT72VR 7RE-433 i7-7700HQ, GeForce GTX 1070 Mobile, 83 Wh | Aorus X7 v6 6820HK, GeForce GTX 1070 Mobile, 94 Wh | Acer Predator 17 G9-793-77LG 6700HQ, GeForce GTX 1070 Mobile, 88 Wh | |
|---|---|---|---|---|---|---|---|
| Battery runtime | -33% | -1% | -8% | 1% | -29% | -11% | |
| Reader / Idle (h) | 5.2 | 5.7 10% | 5.2 0% | 5.3 2% | 4.6 -12% | ||
| H.264 (h) | 3.4 | 2.4 -29% | 3.1 -9% | 3.8 12% | |||
| WiFi v1.3 (h) | 4.2 | 2.7 -36% | 4 -5% | 3.5 -17% | 3.8 -10% | 3 -29% | 3.3 -21% |
| Load (h) | 1.5 | 1.4 -7% | 1.4 -7% | 1.5 0% | 1.5 0% |
Pros
Cons

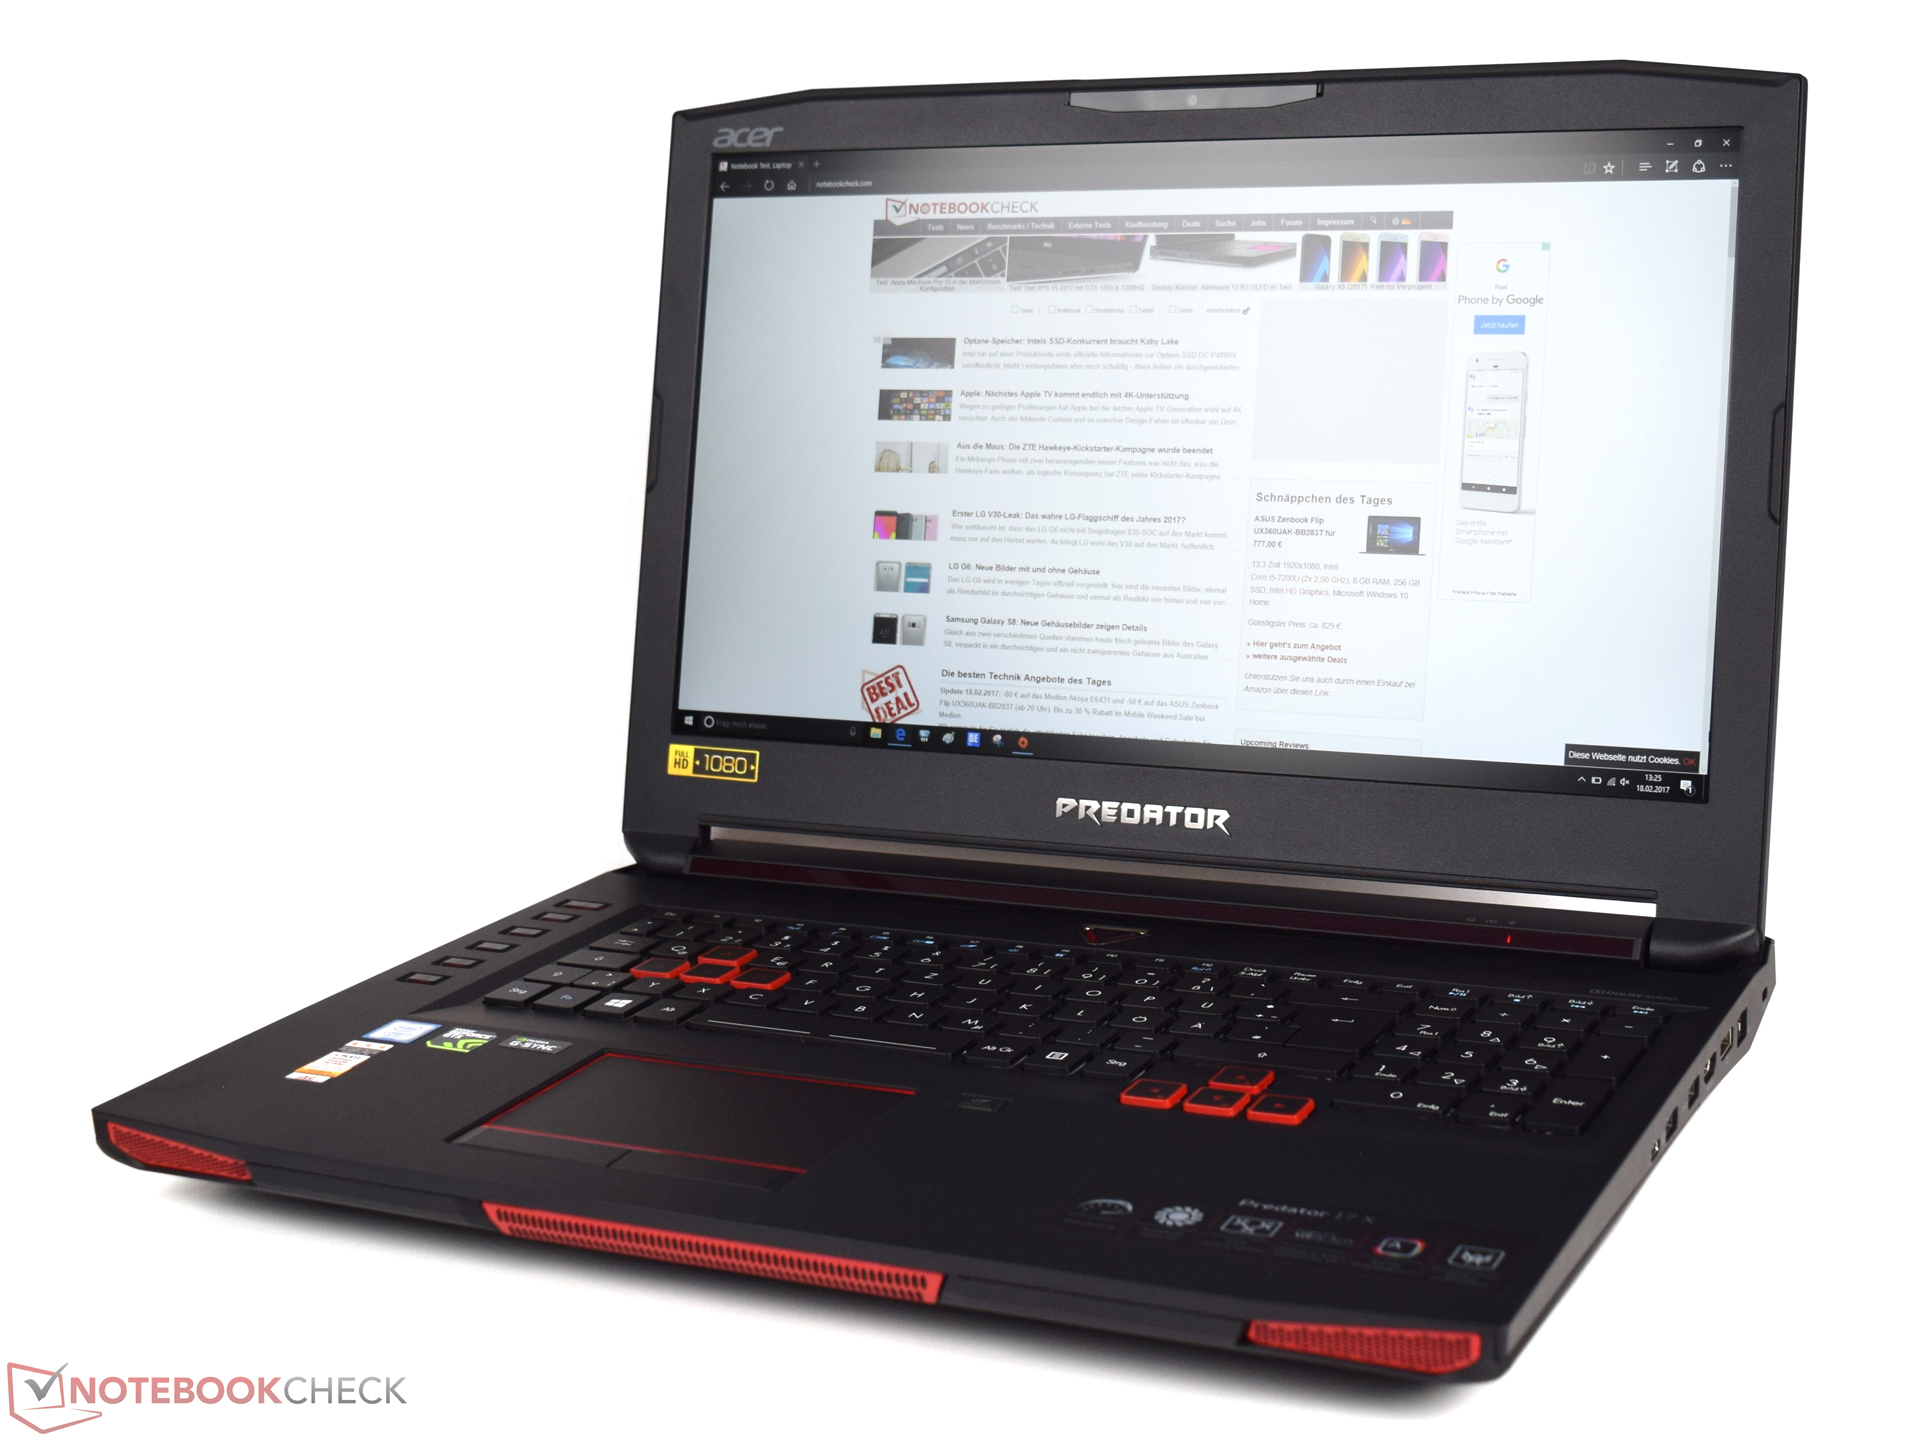
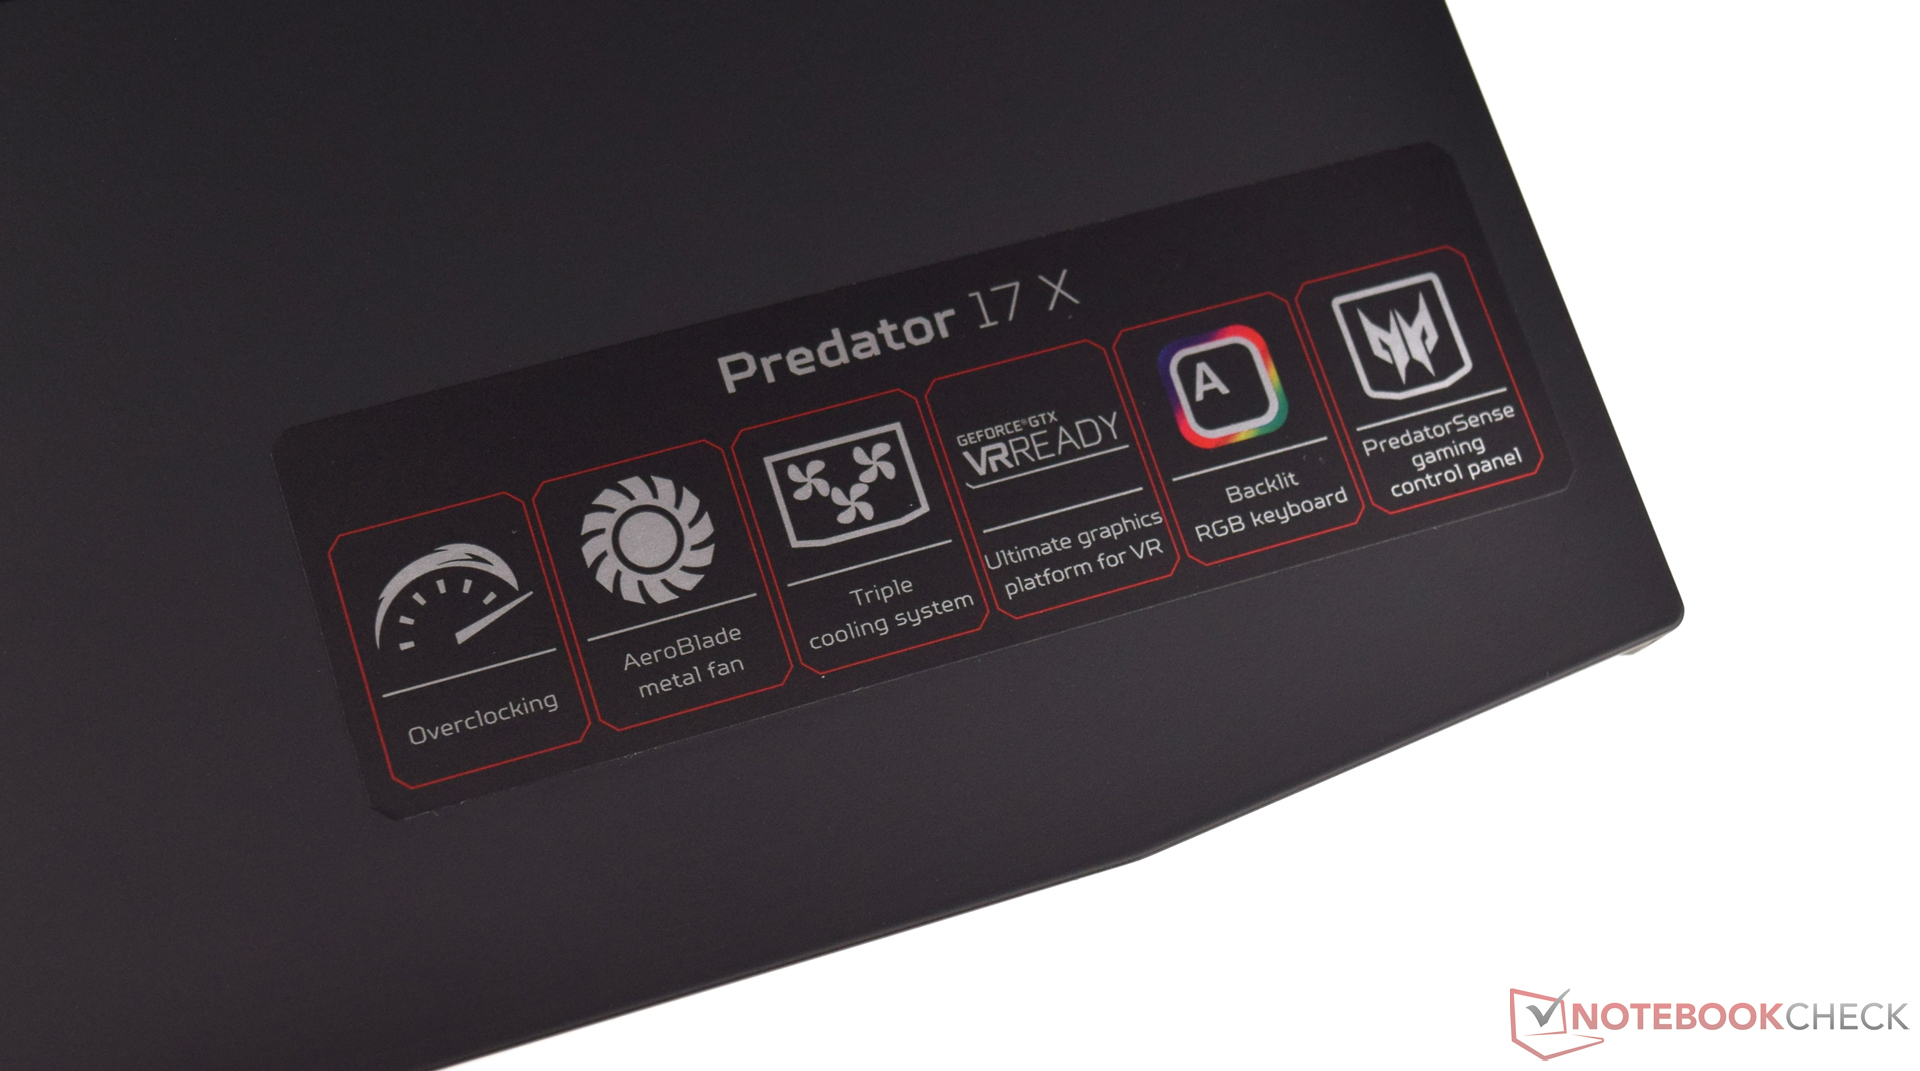
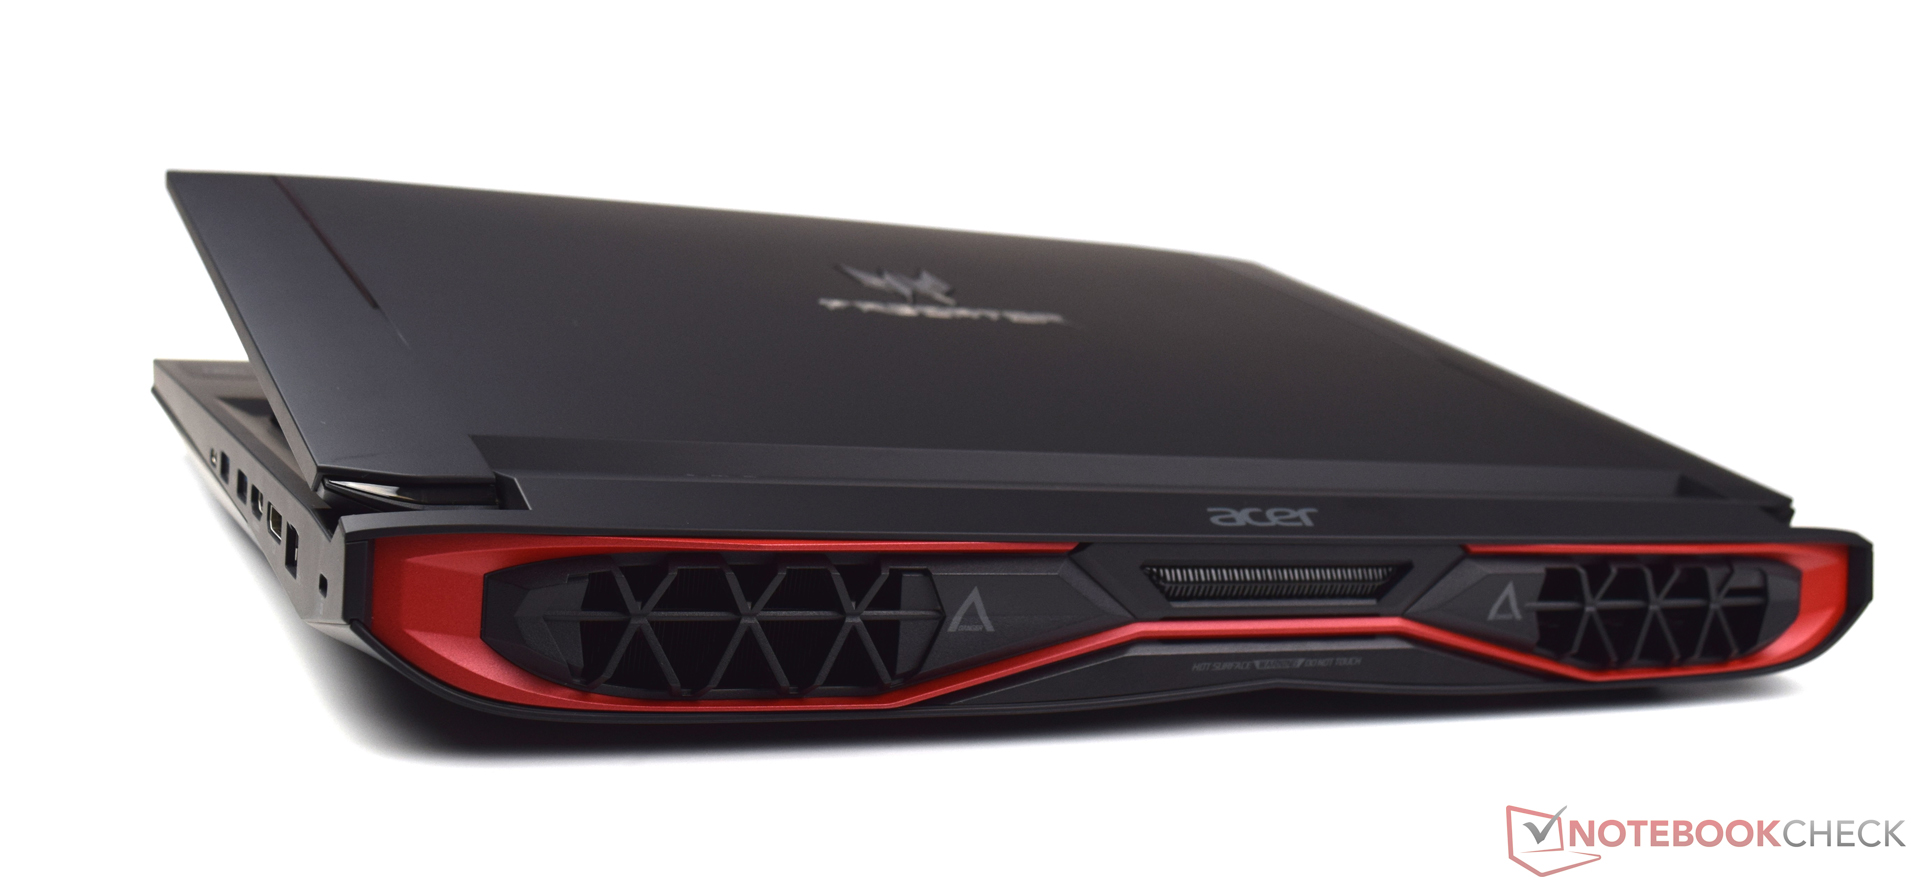
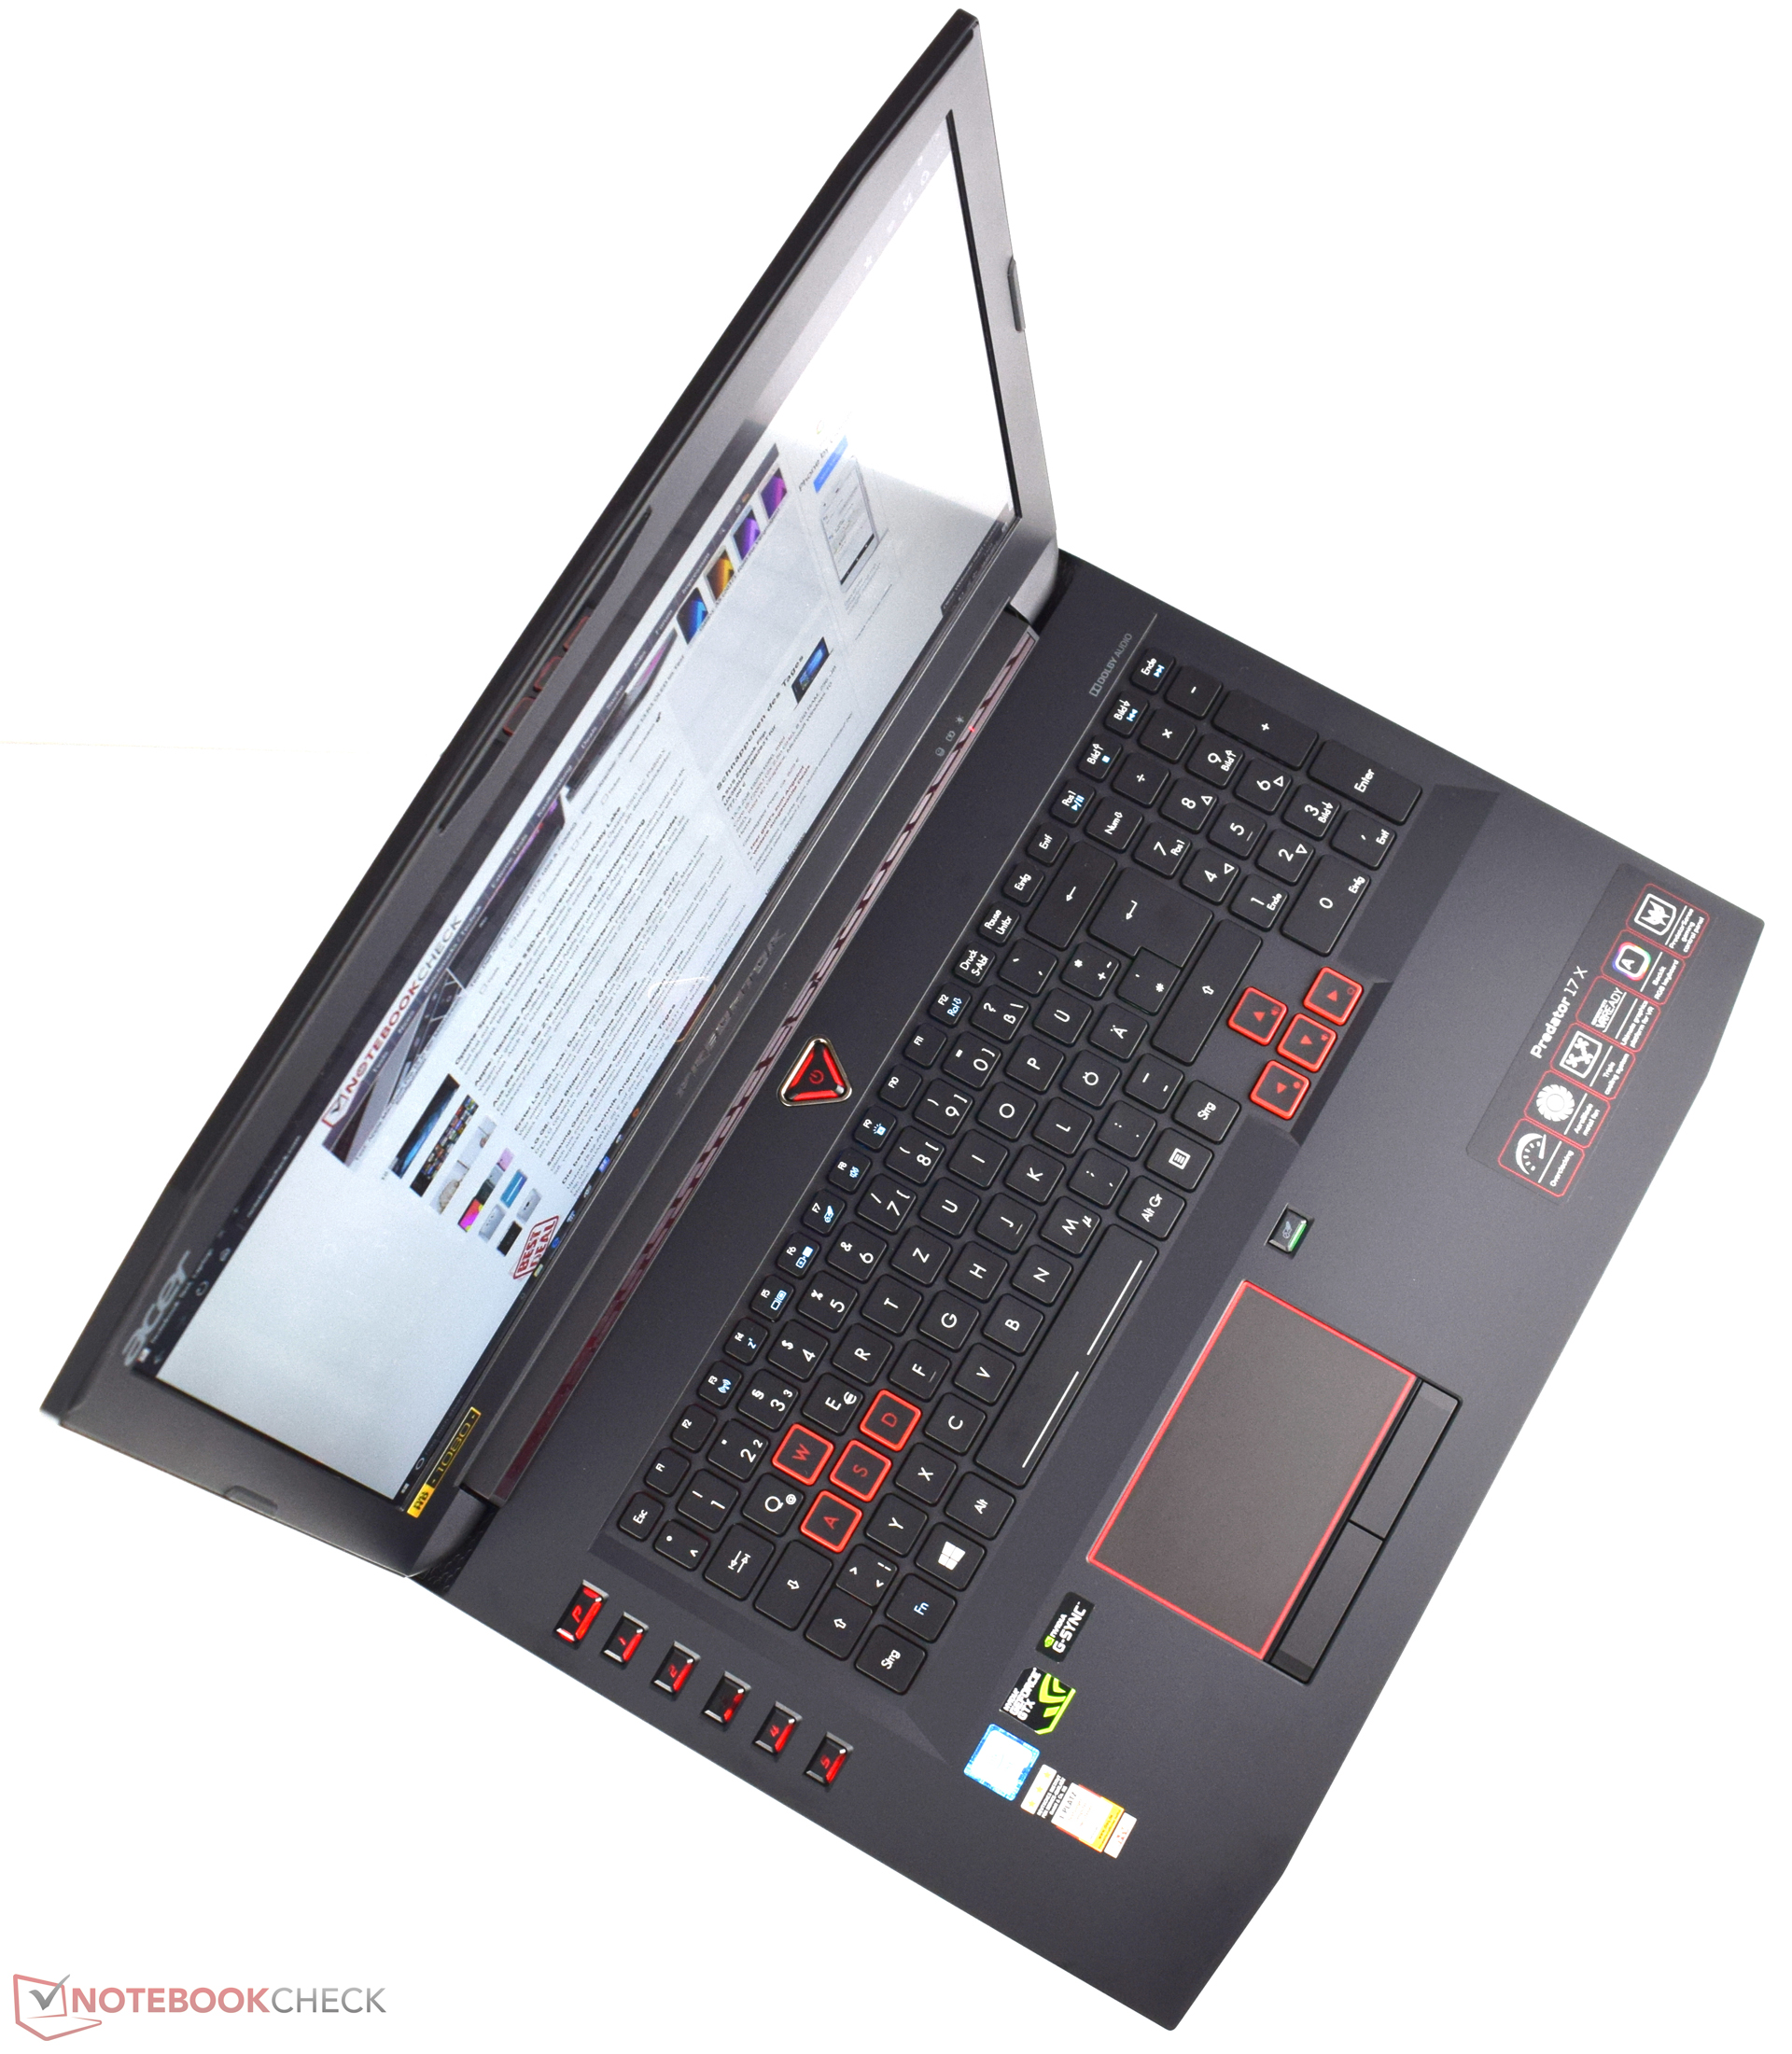
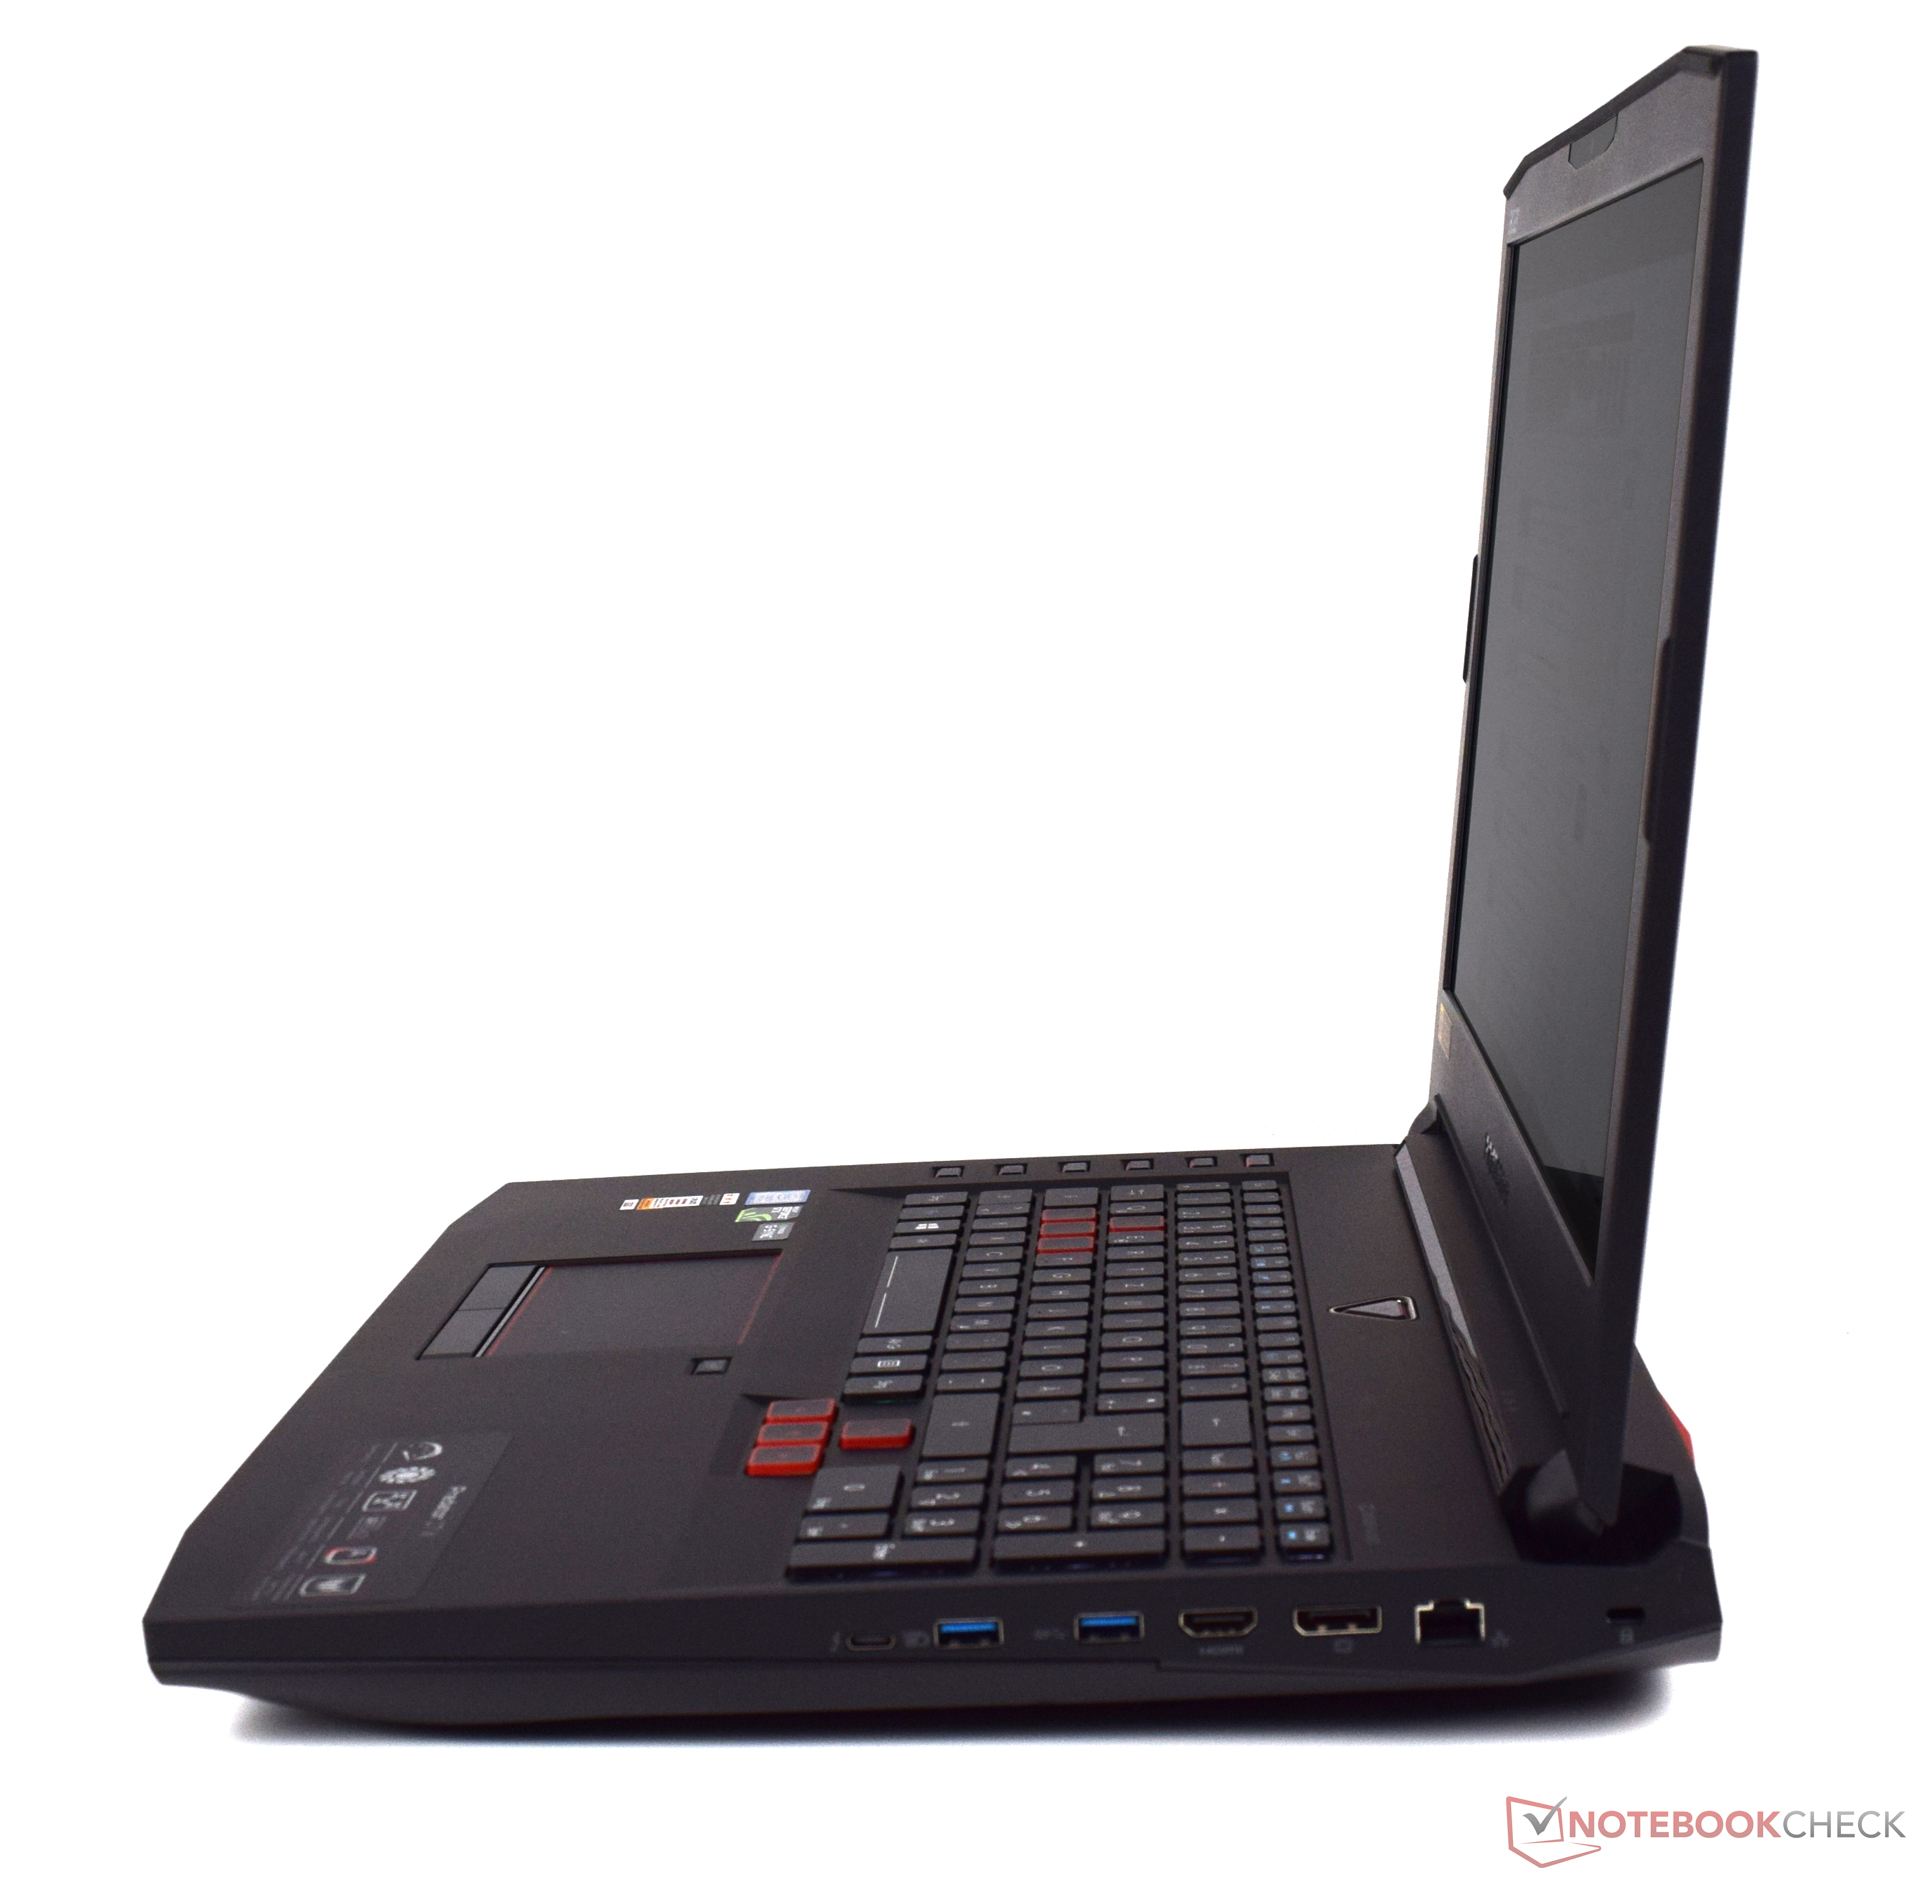
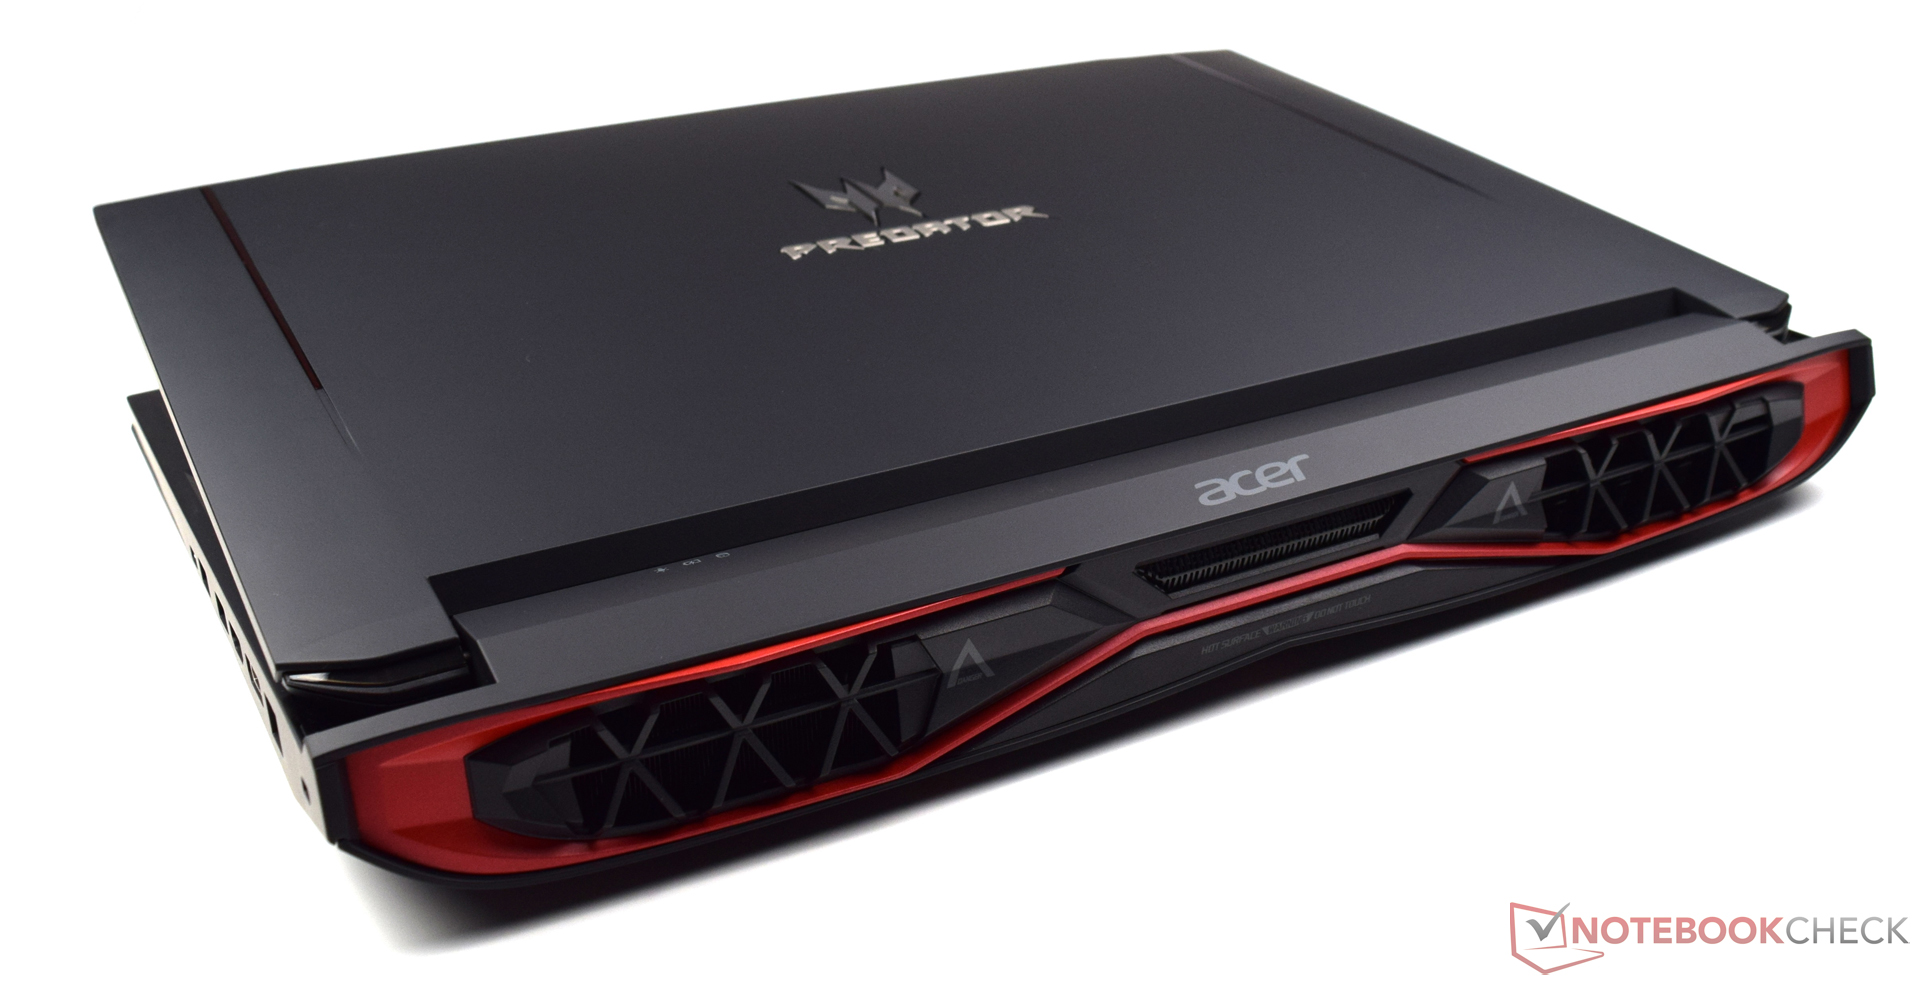
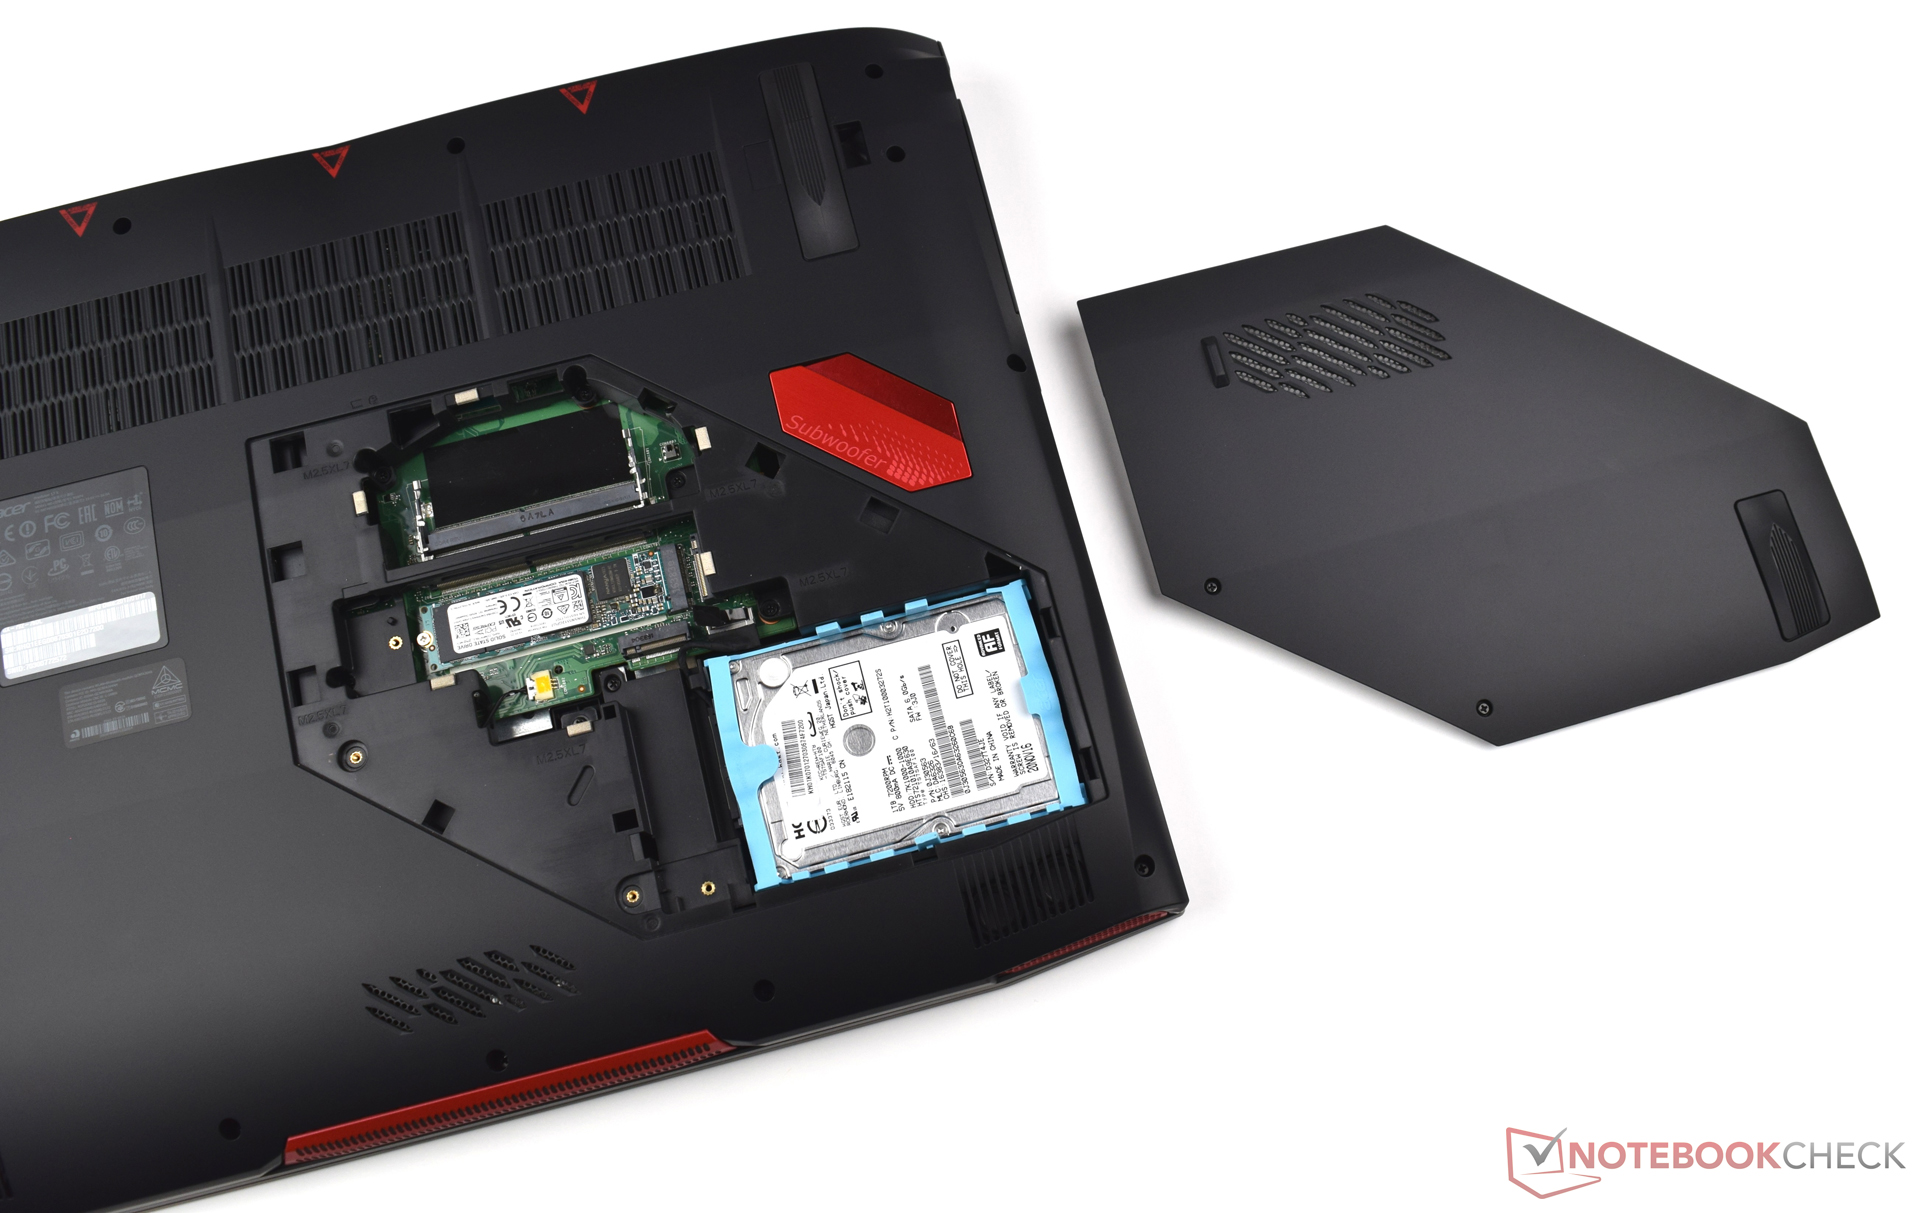
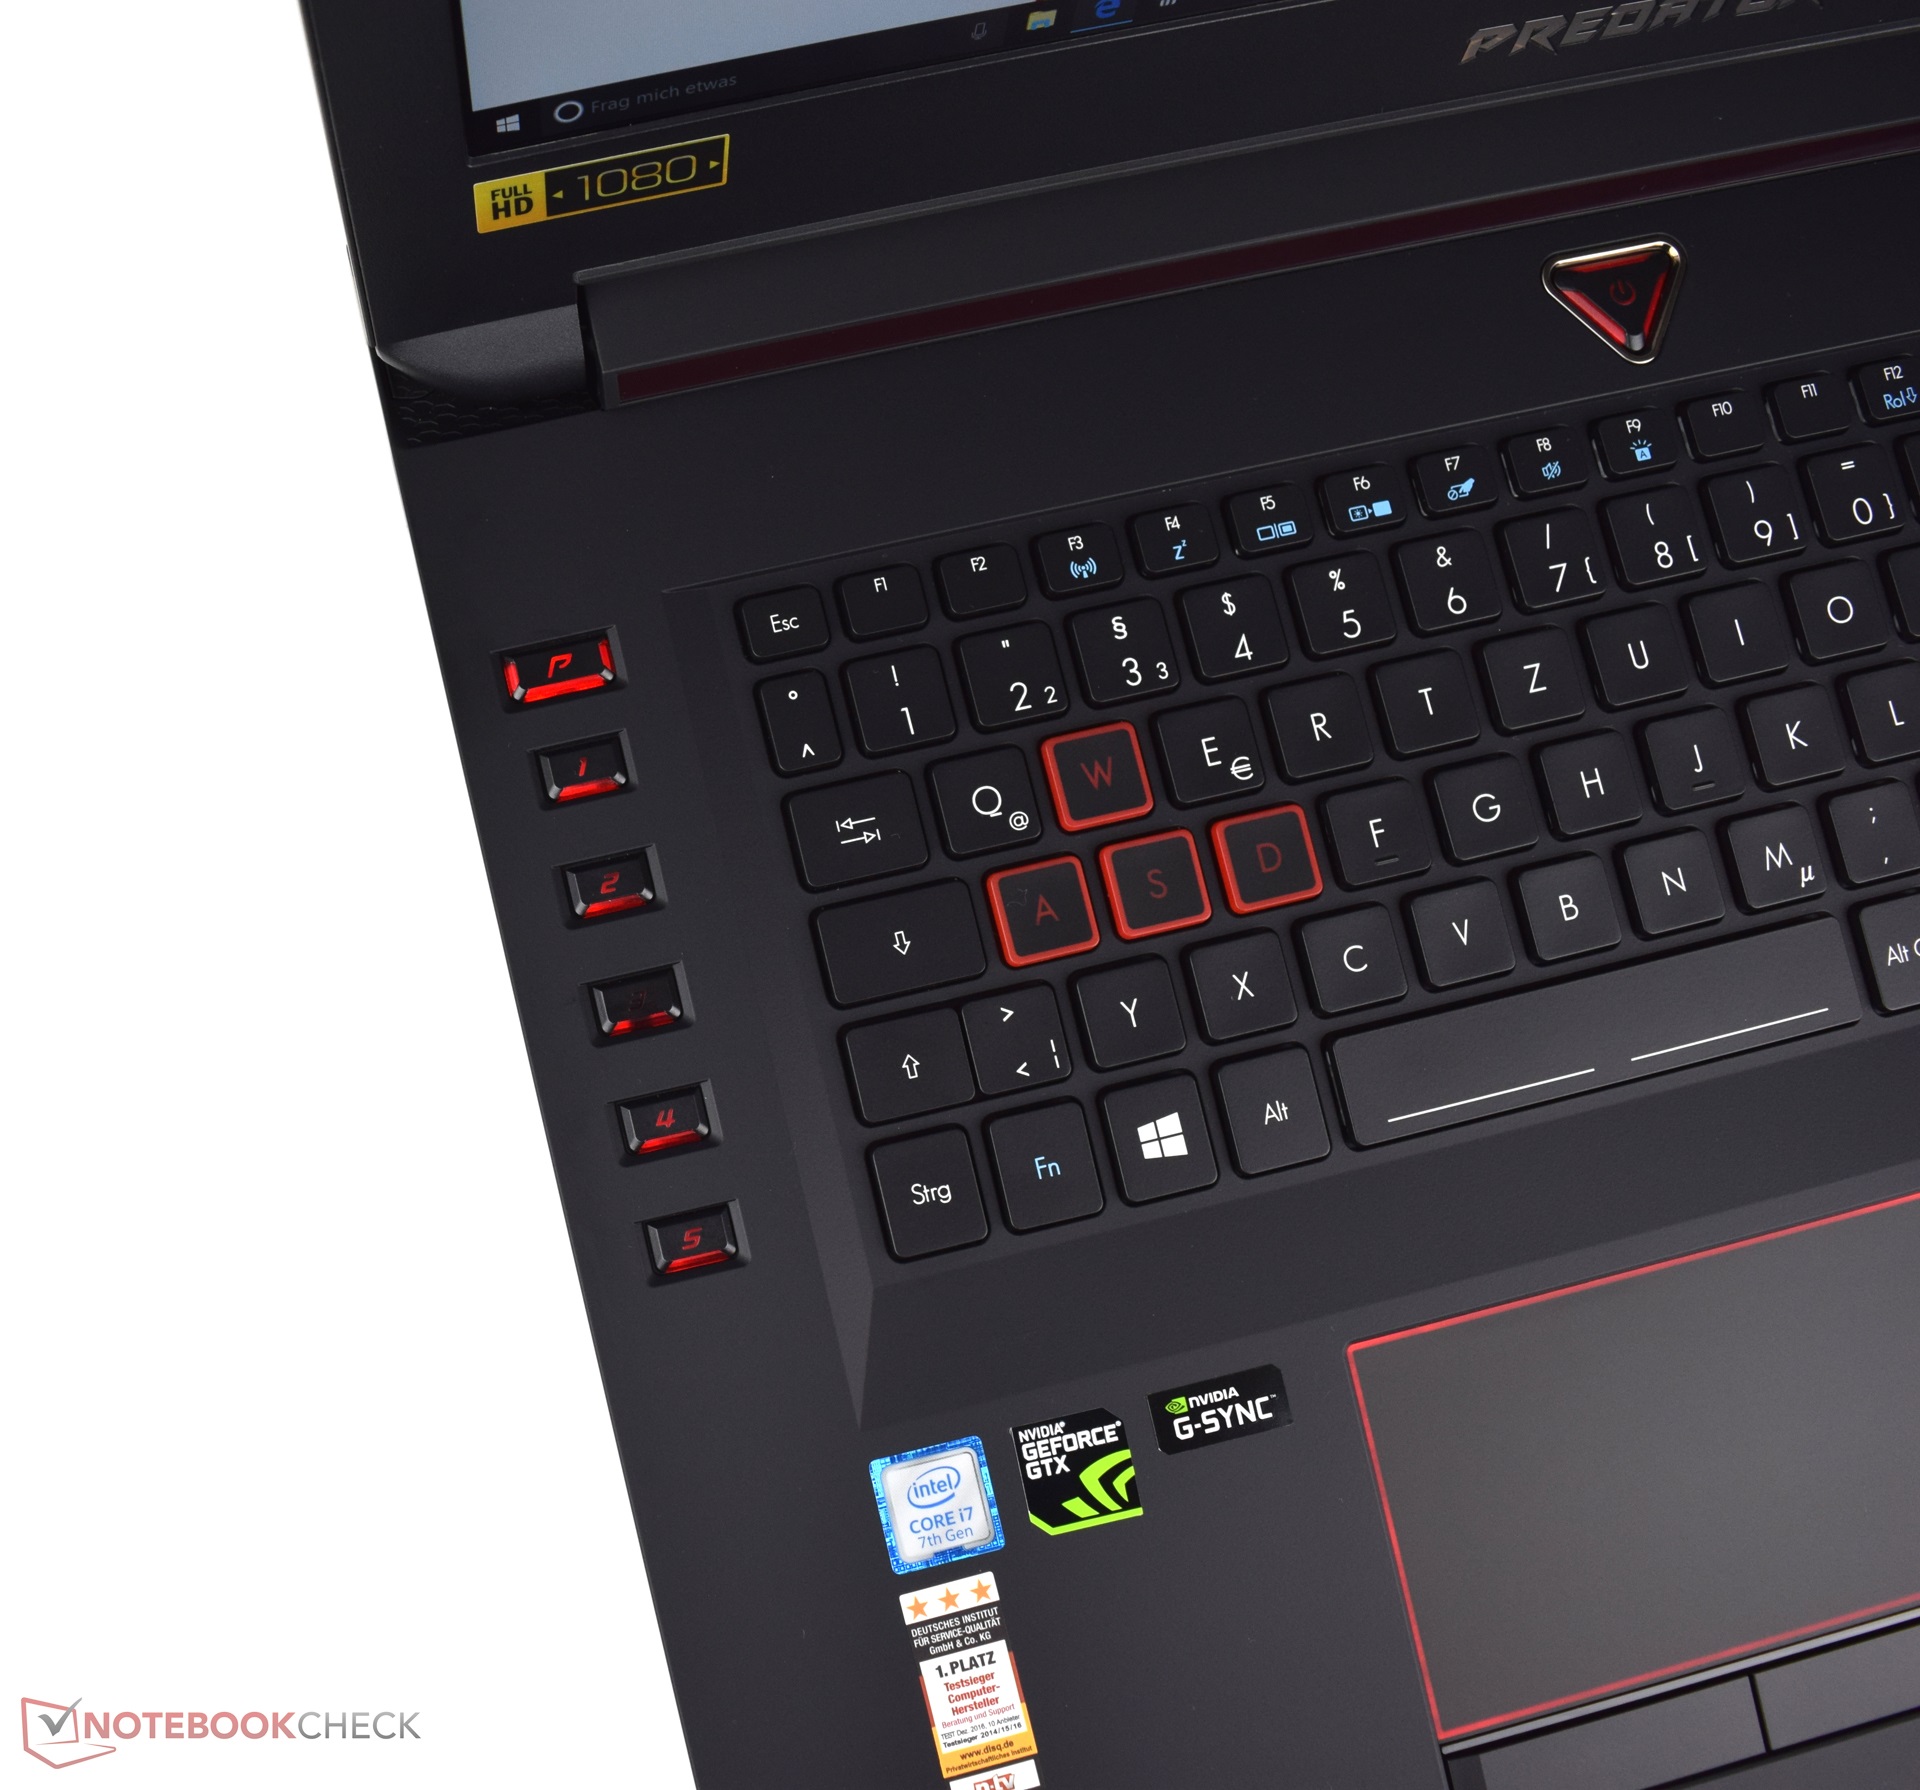
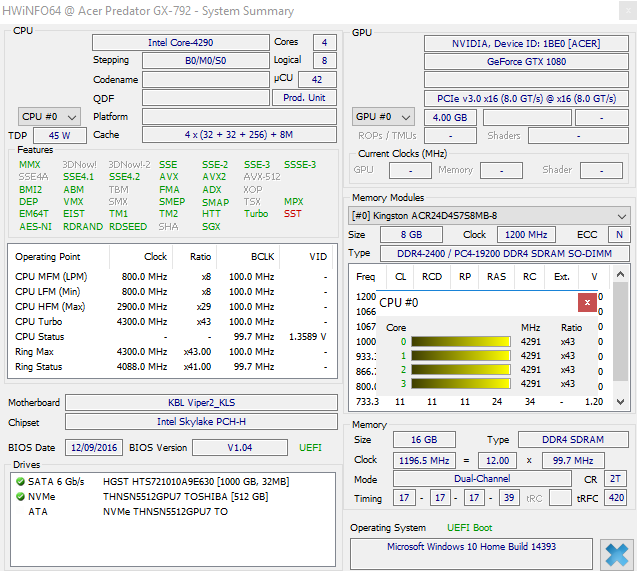
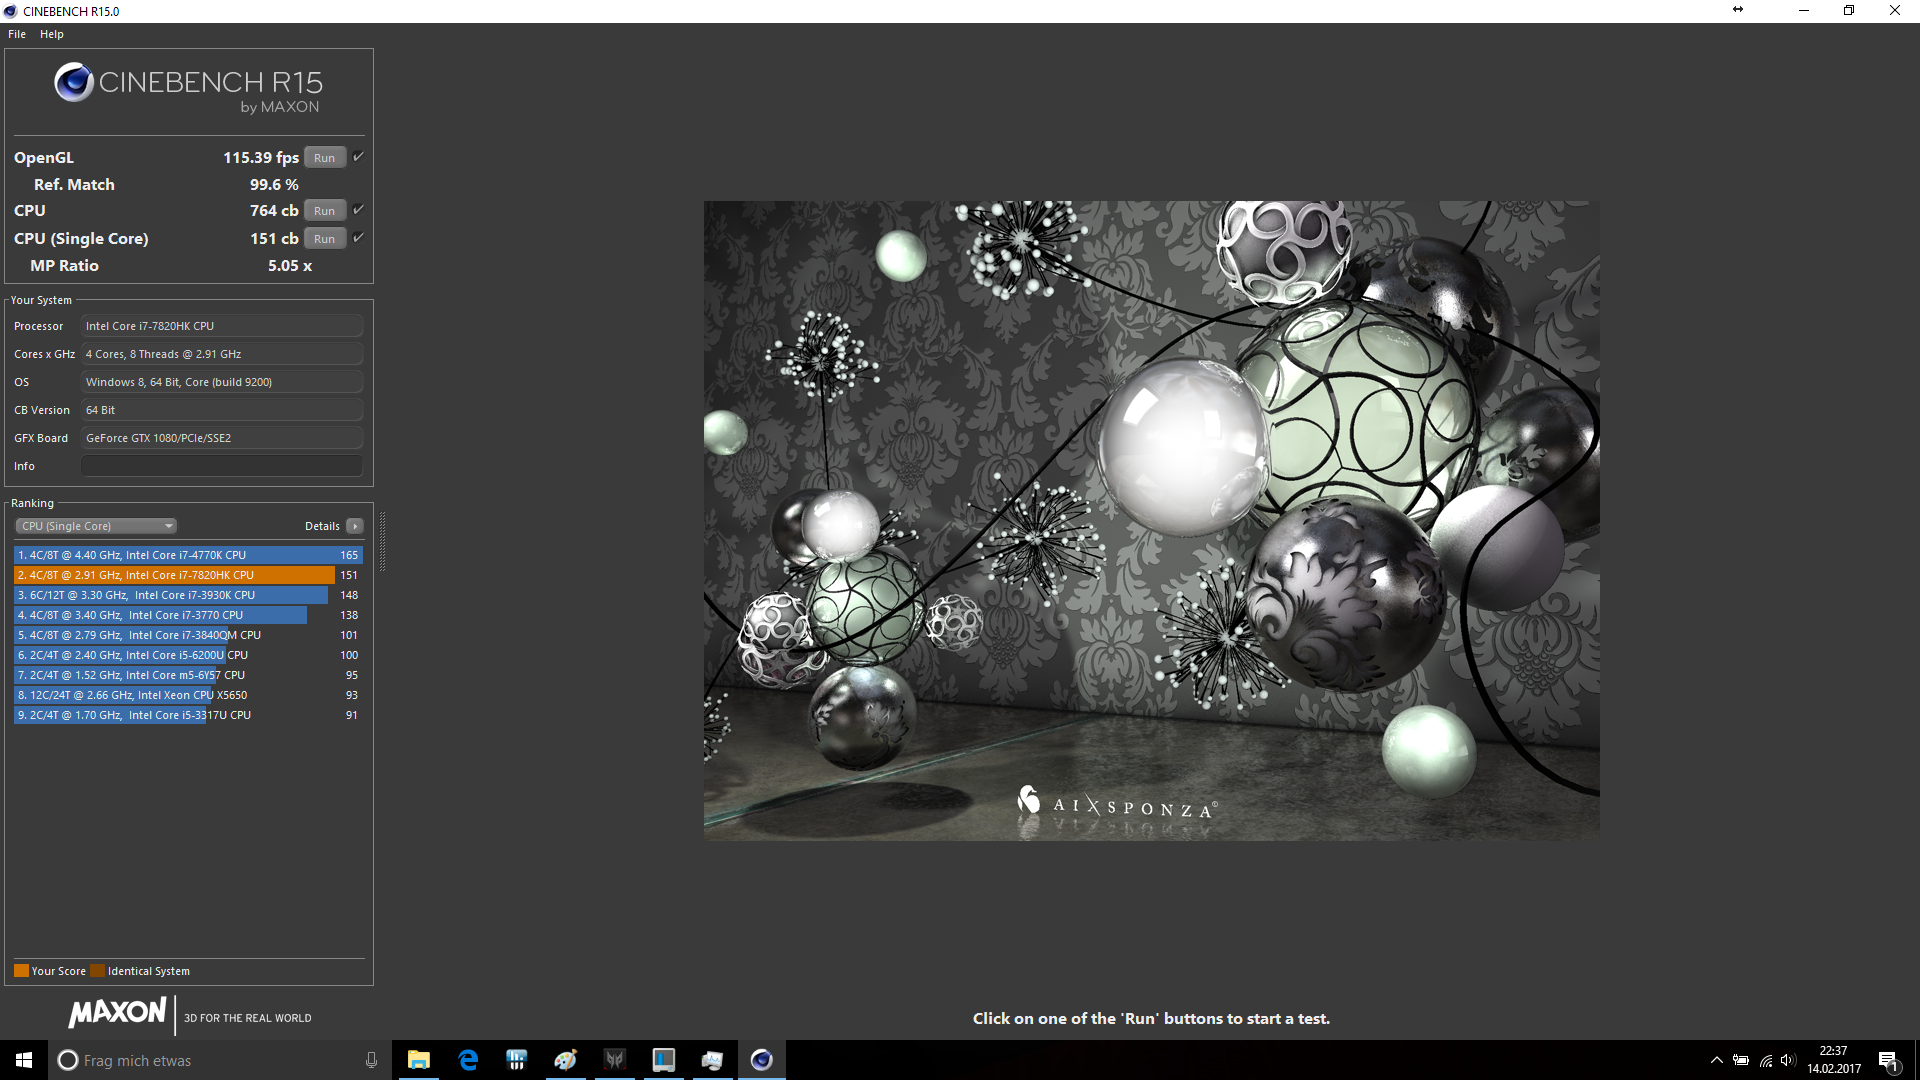
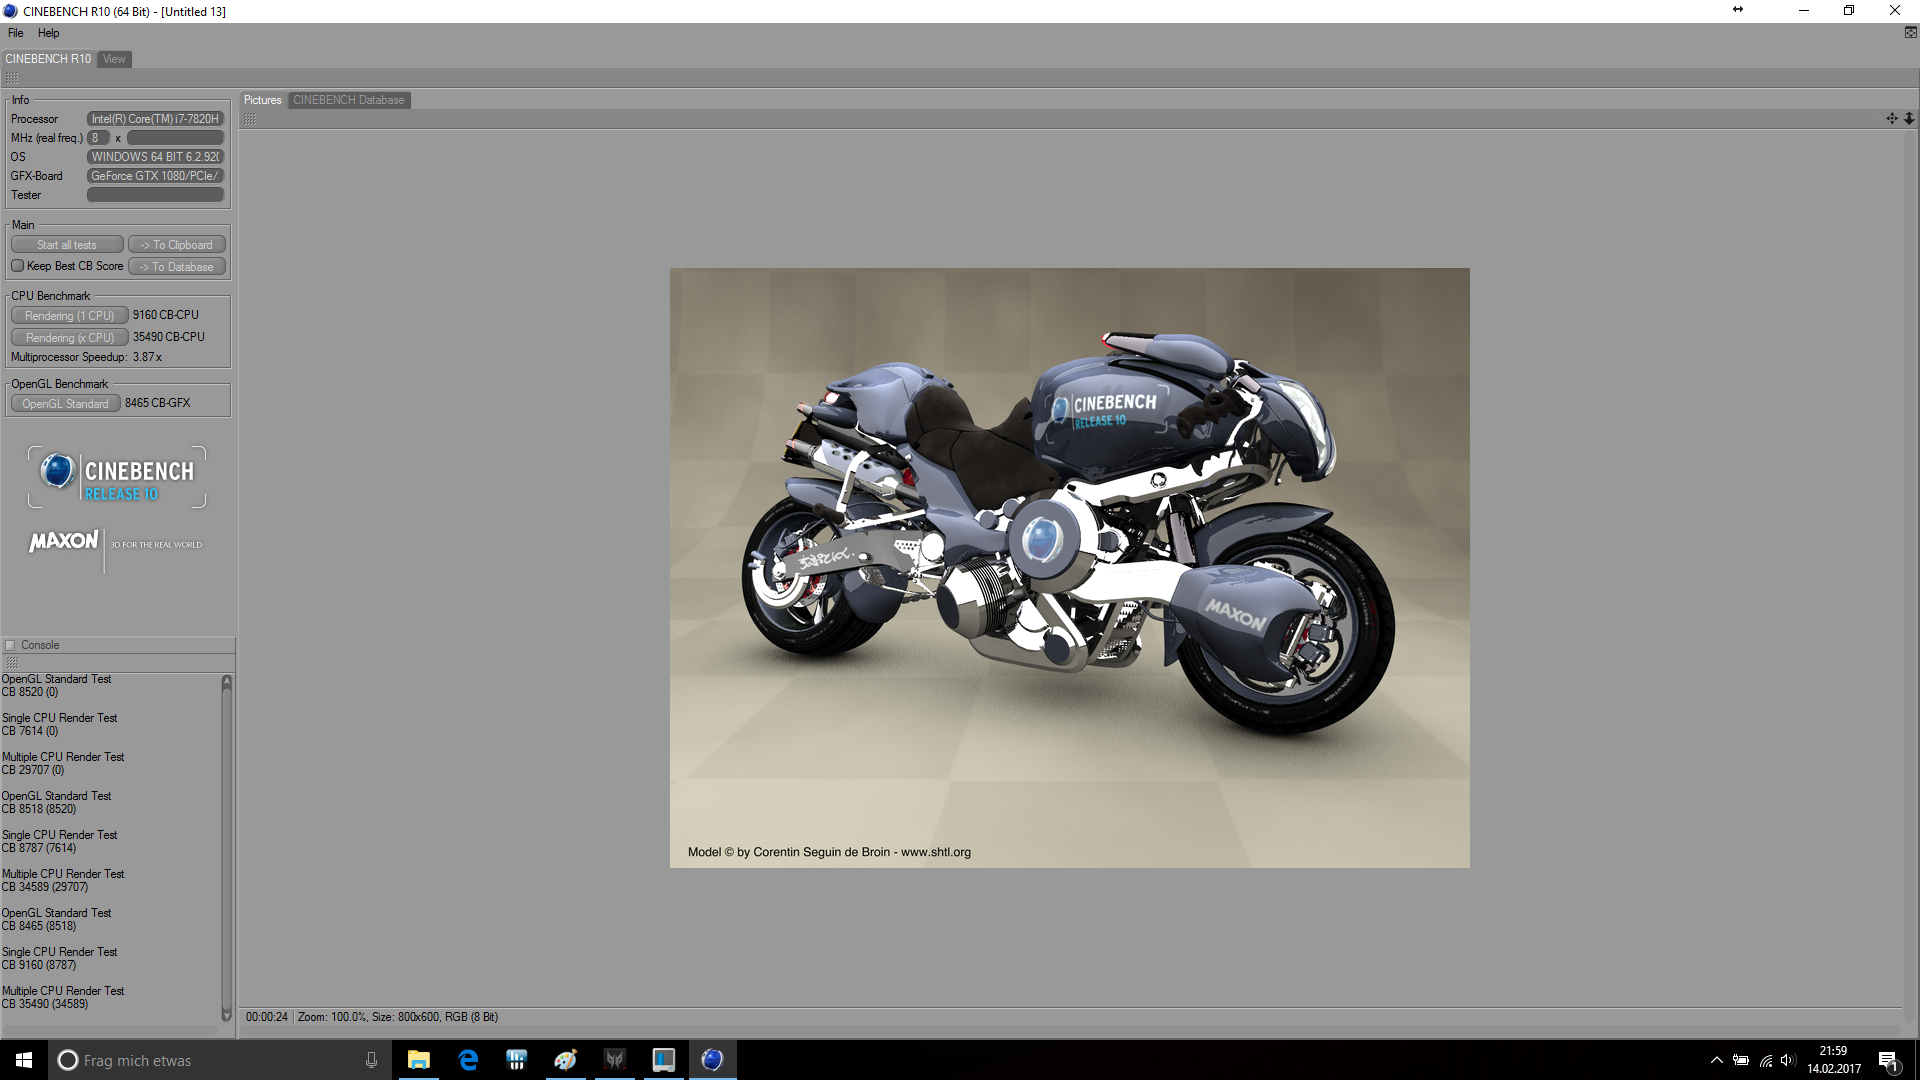
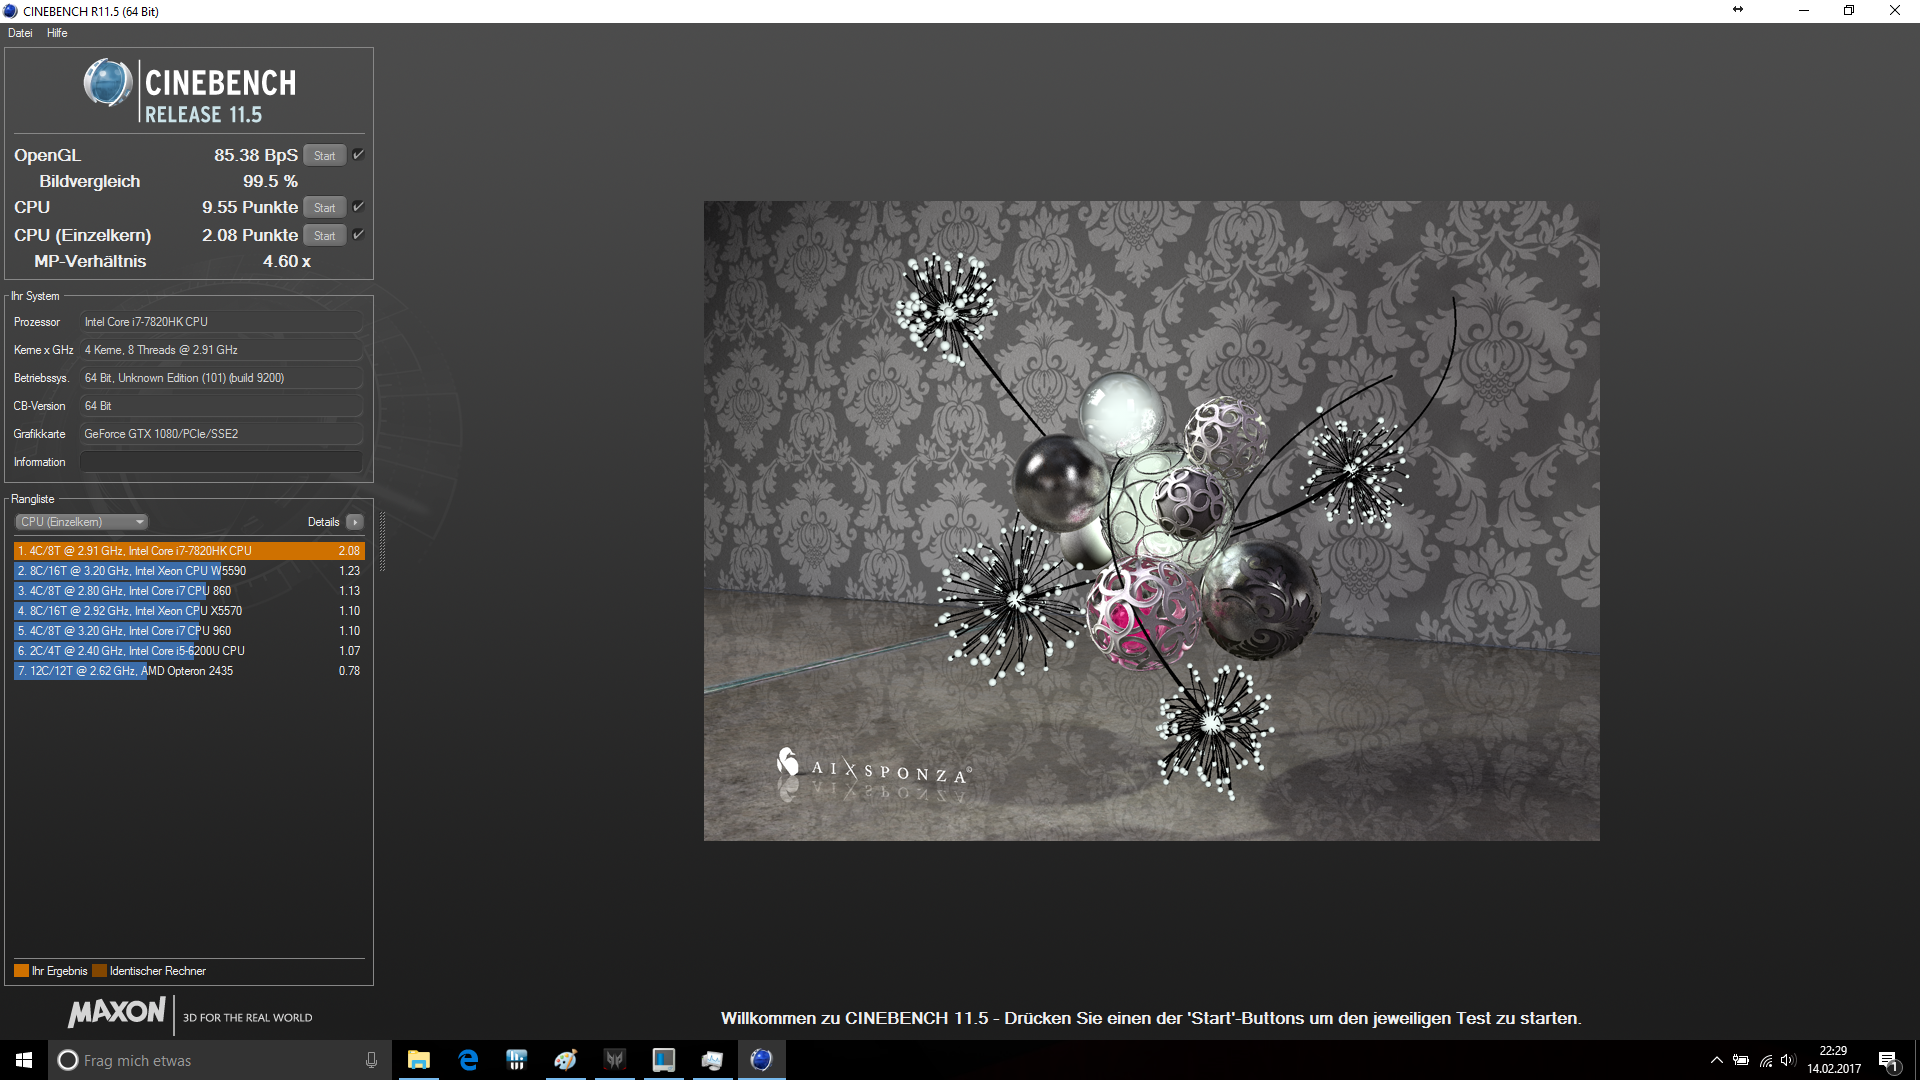
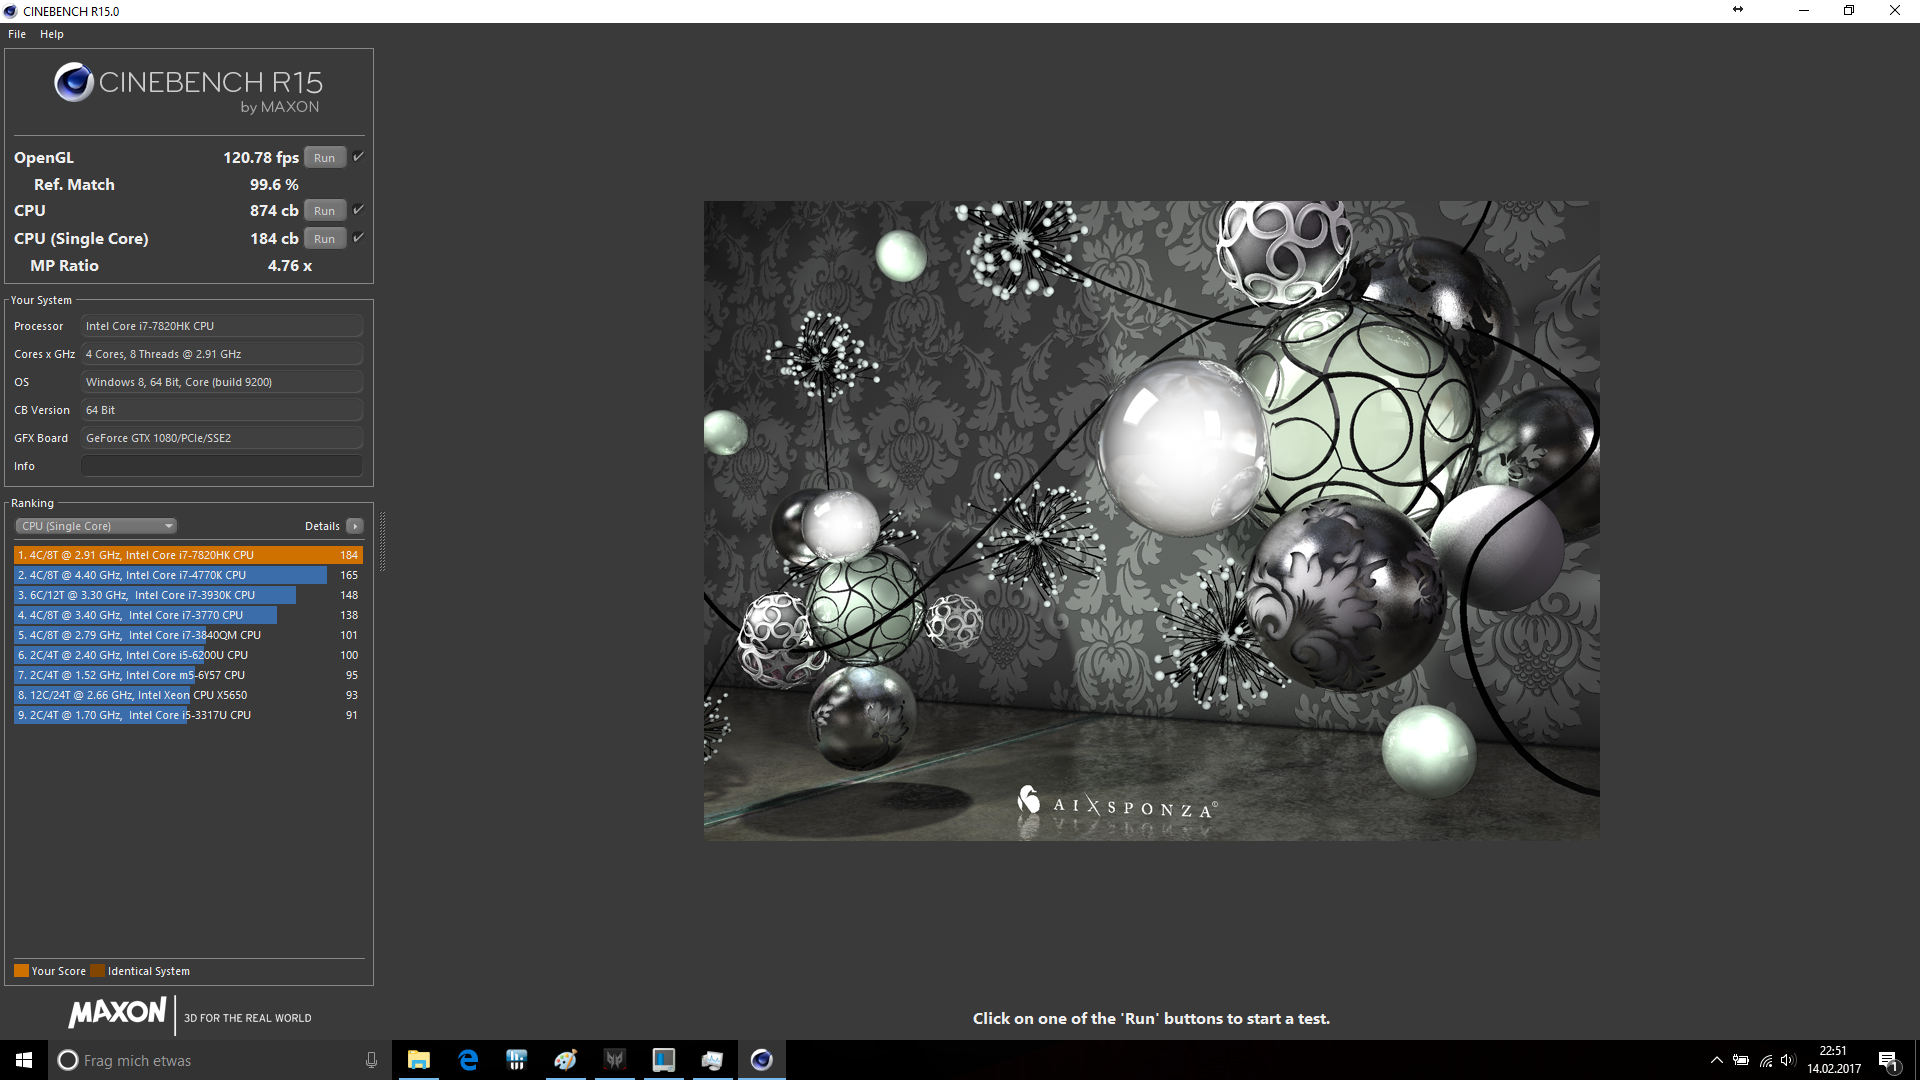
Predator 17 X是一个普通版本 Predator 17的一个备选方案,虽然说宏碁没有优化所有之前的缺点。该机性能无可挑剔:Intel Core i7-7820HK 和Nvidia GeForce GTX 1080。我们可以看到基准测试中它的得分,它确实是性能强劲的游戏本。而它的设计与其他的Predator机型类似。
宏碁又生产了一个高端游戏本。Predator 17 X是是一个性能强劲的游戏设备。在同类产品中,有很大竞争力。
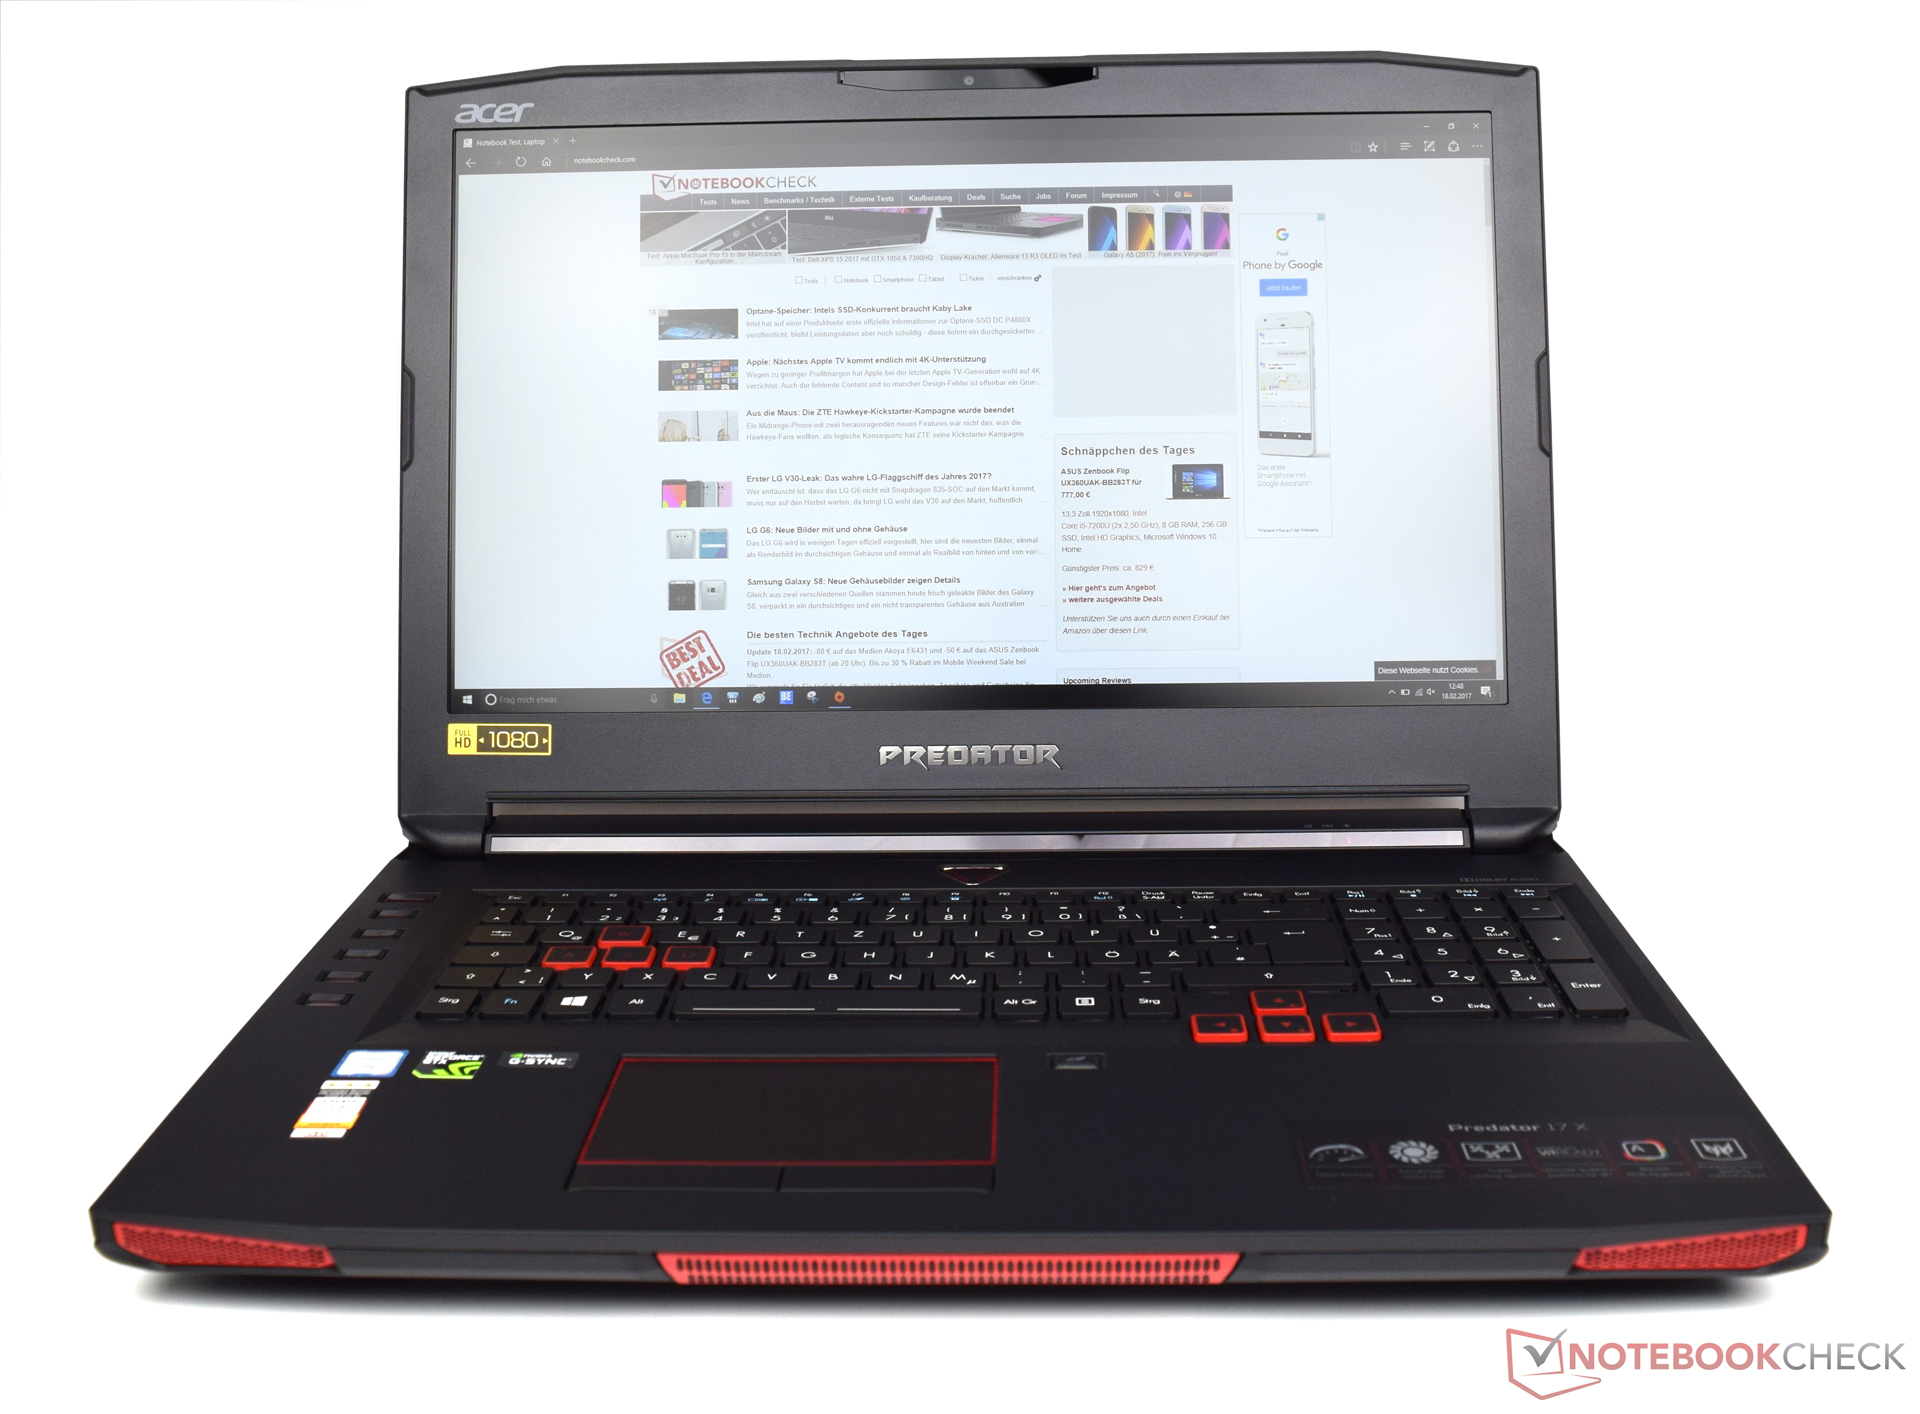
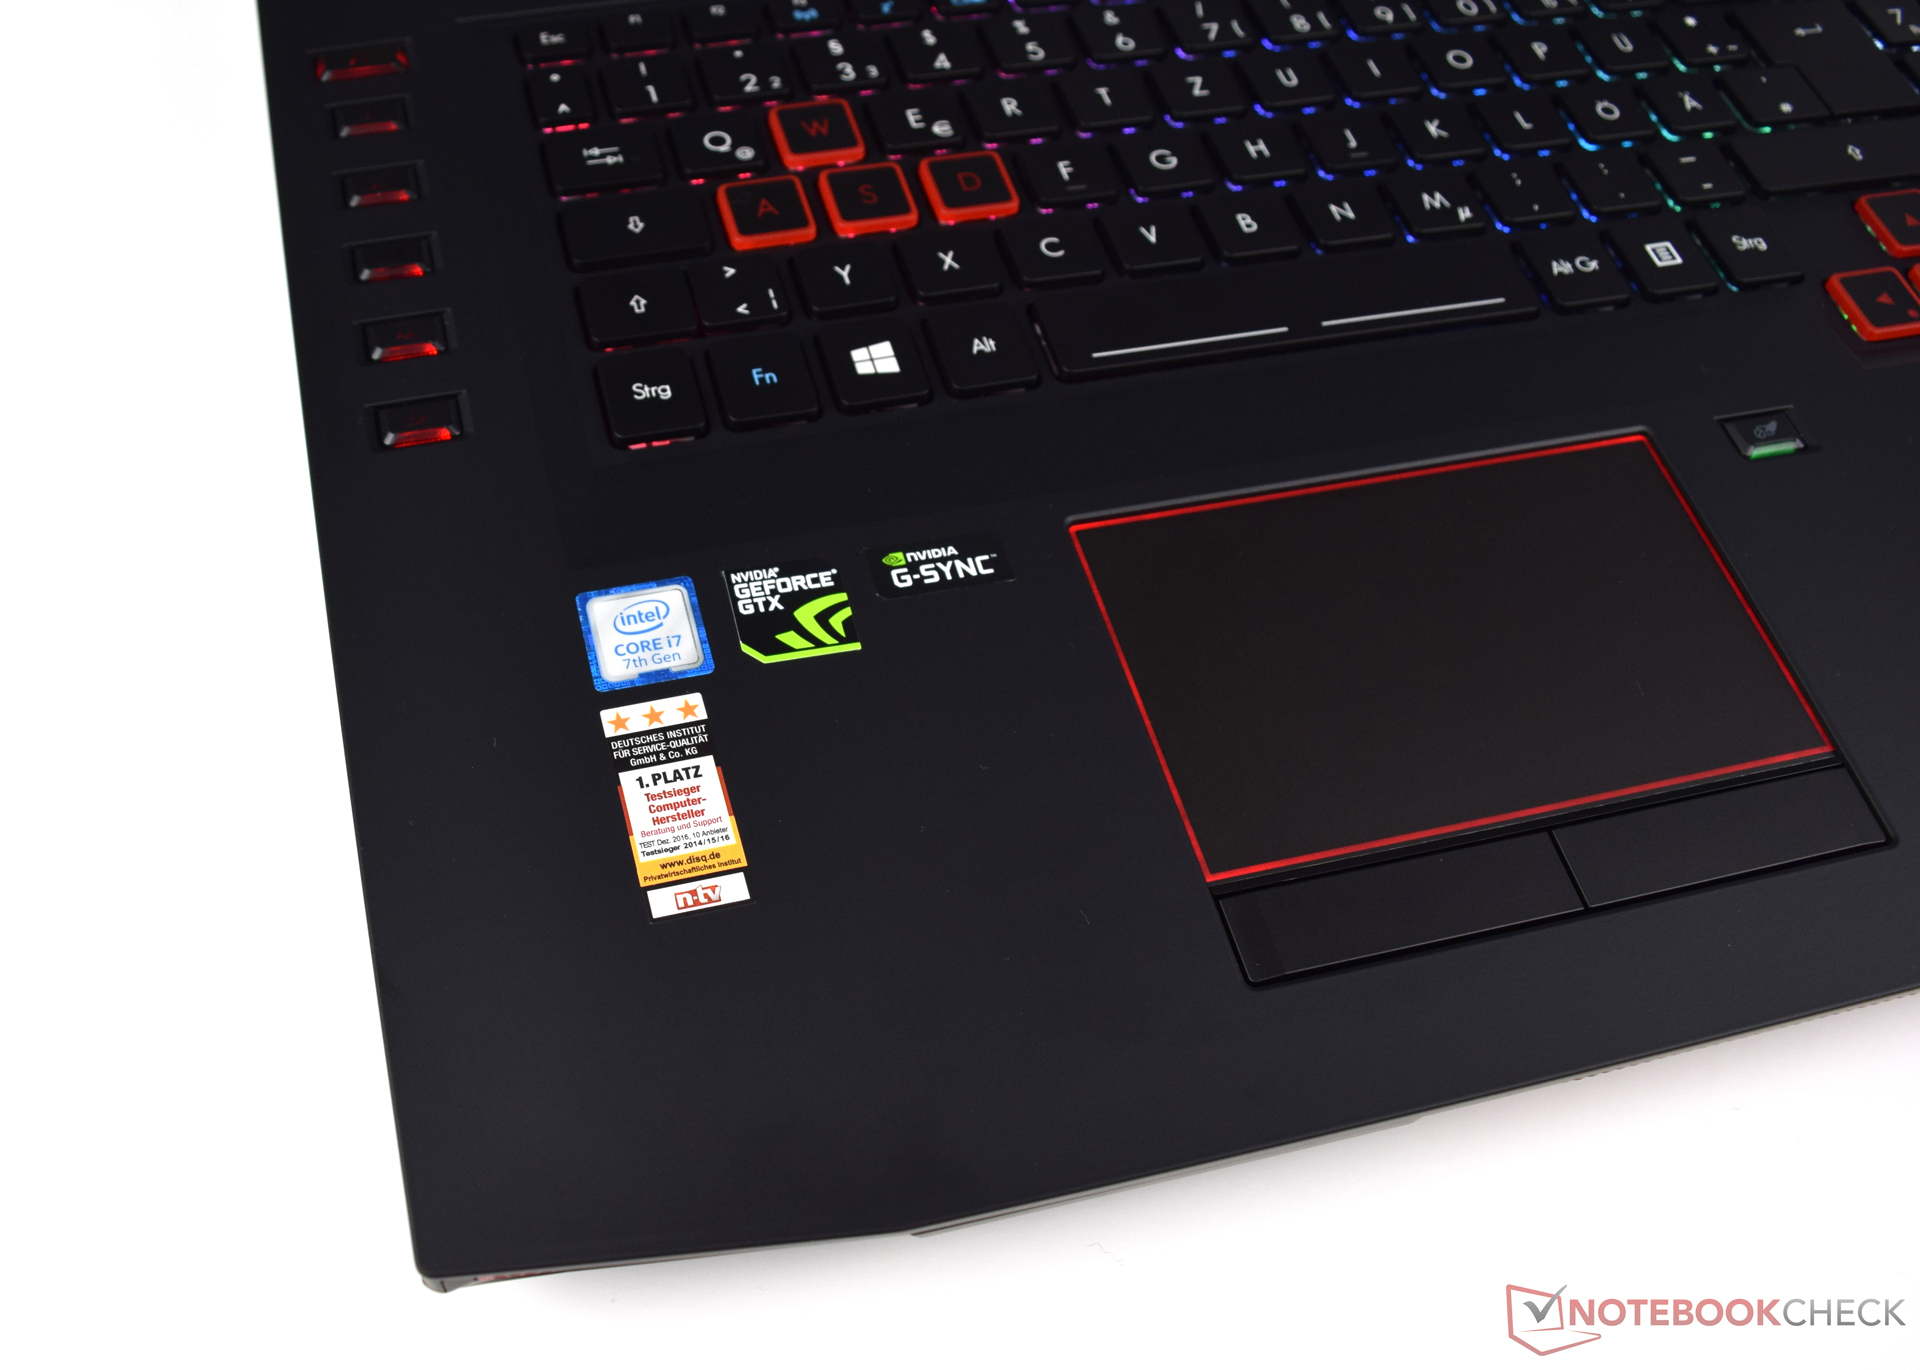
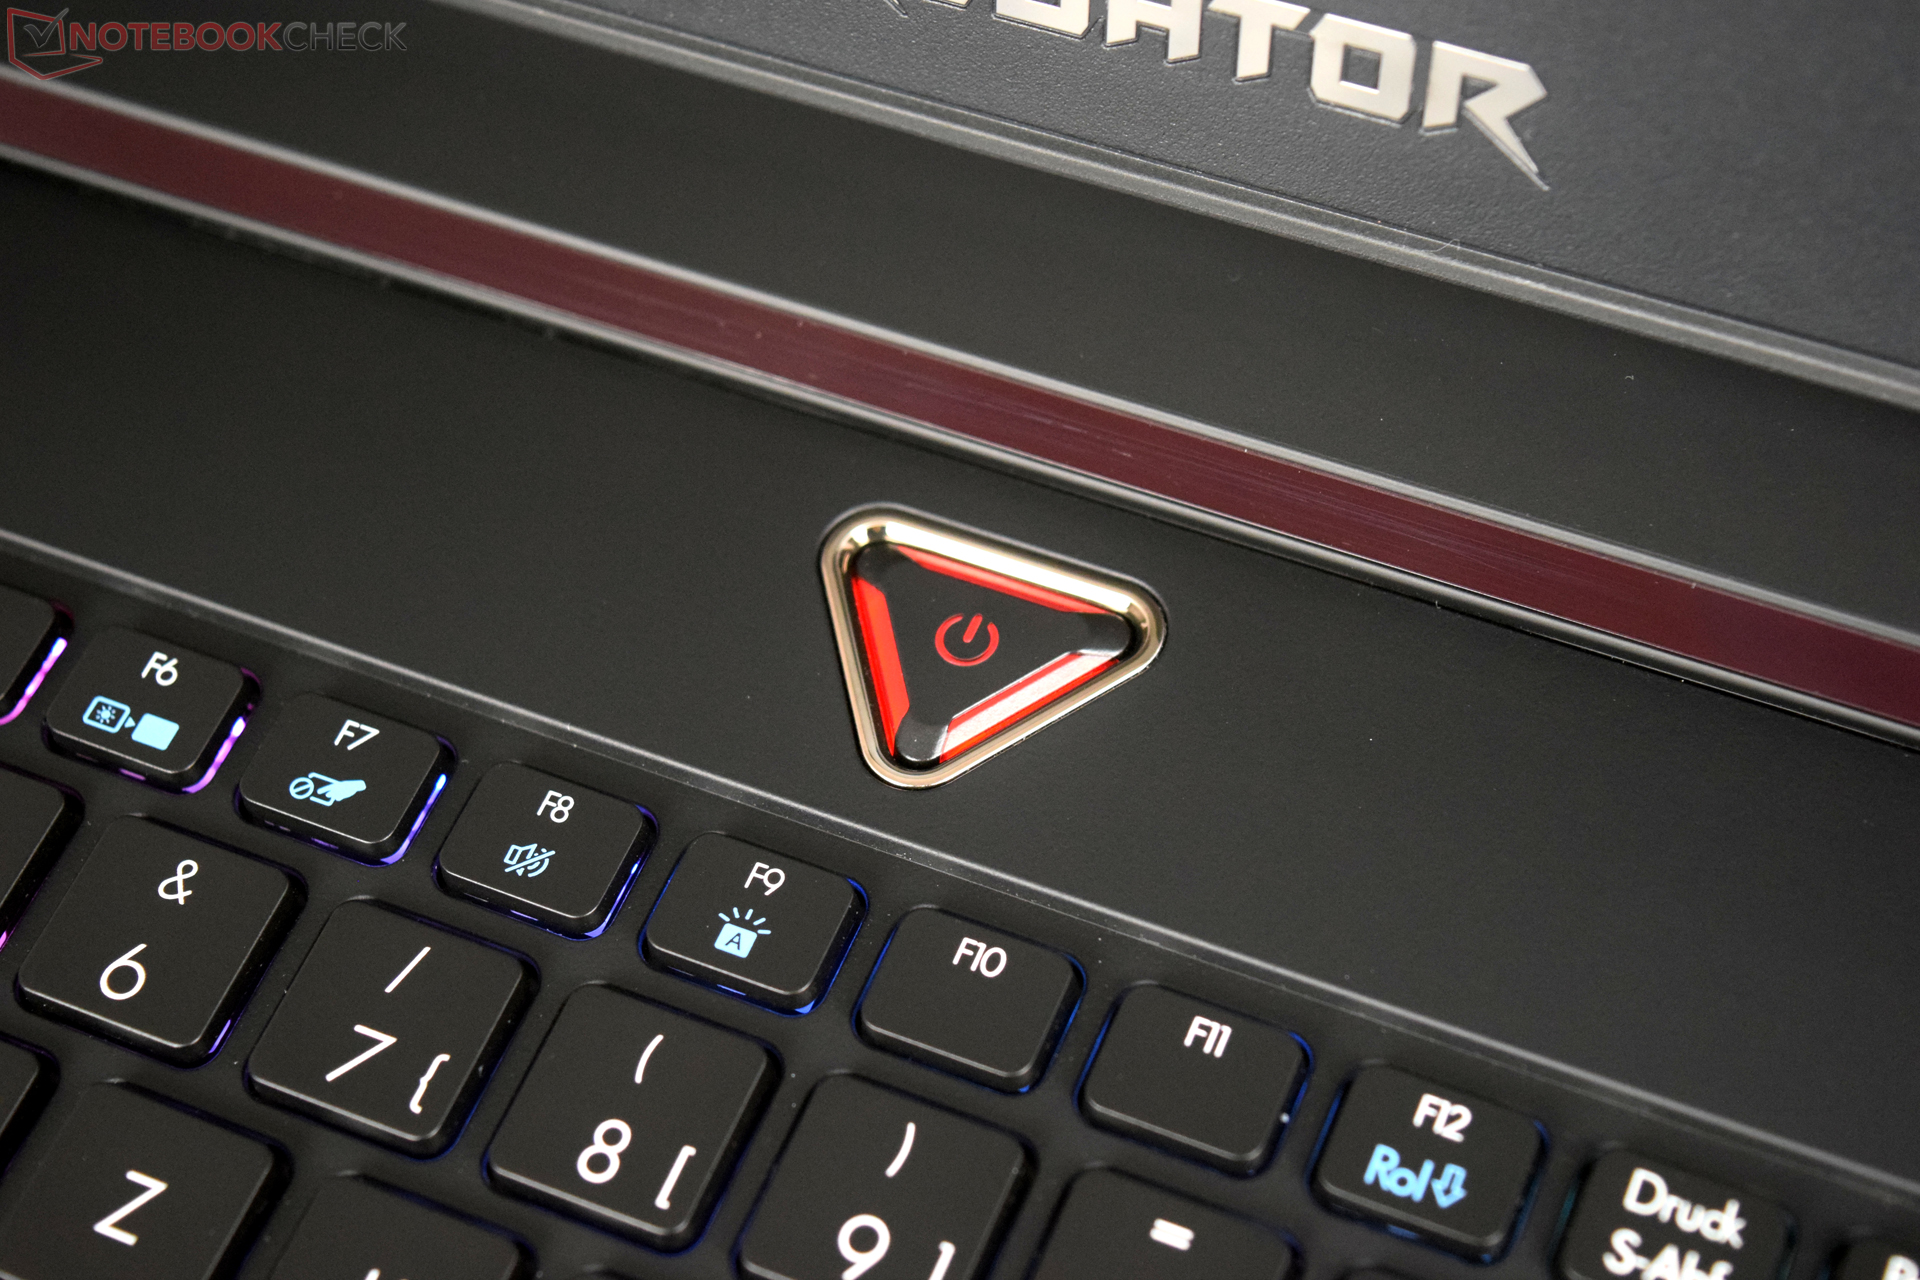
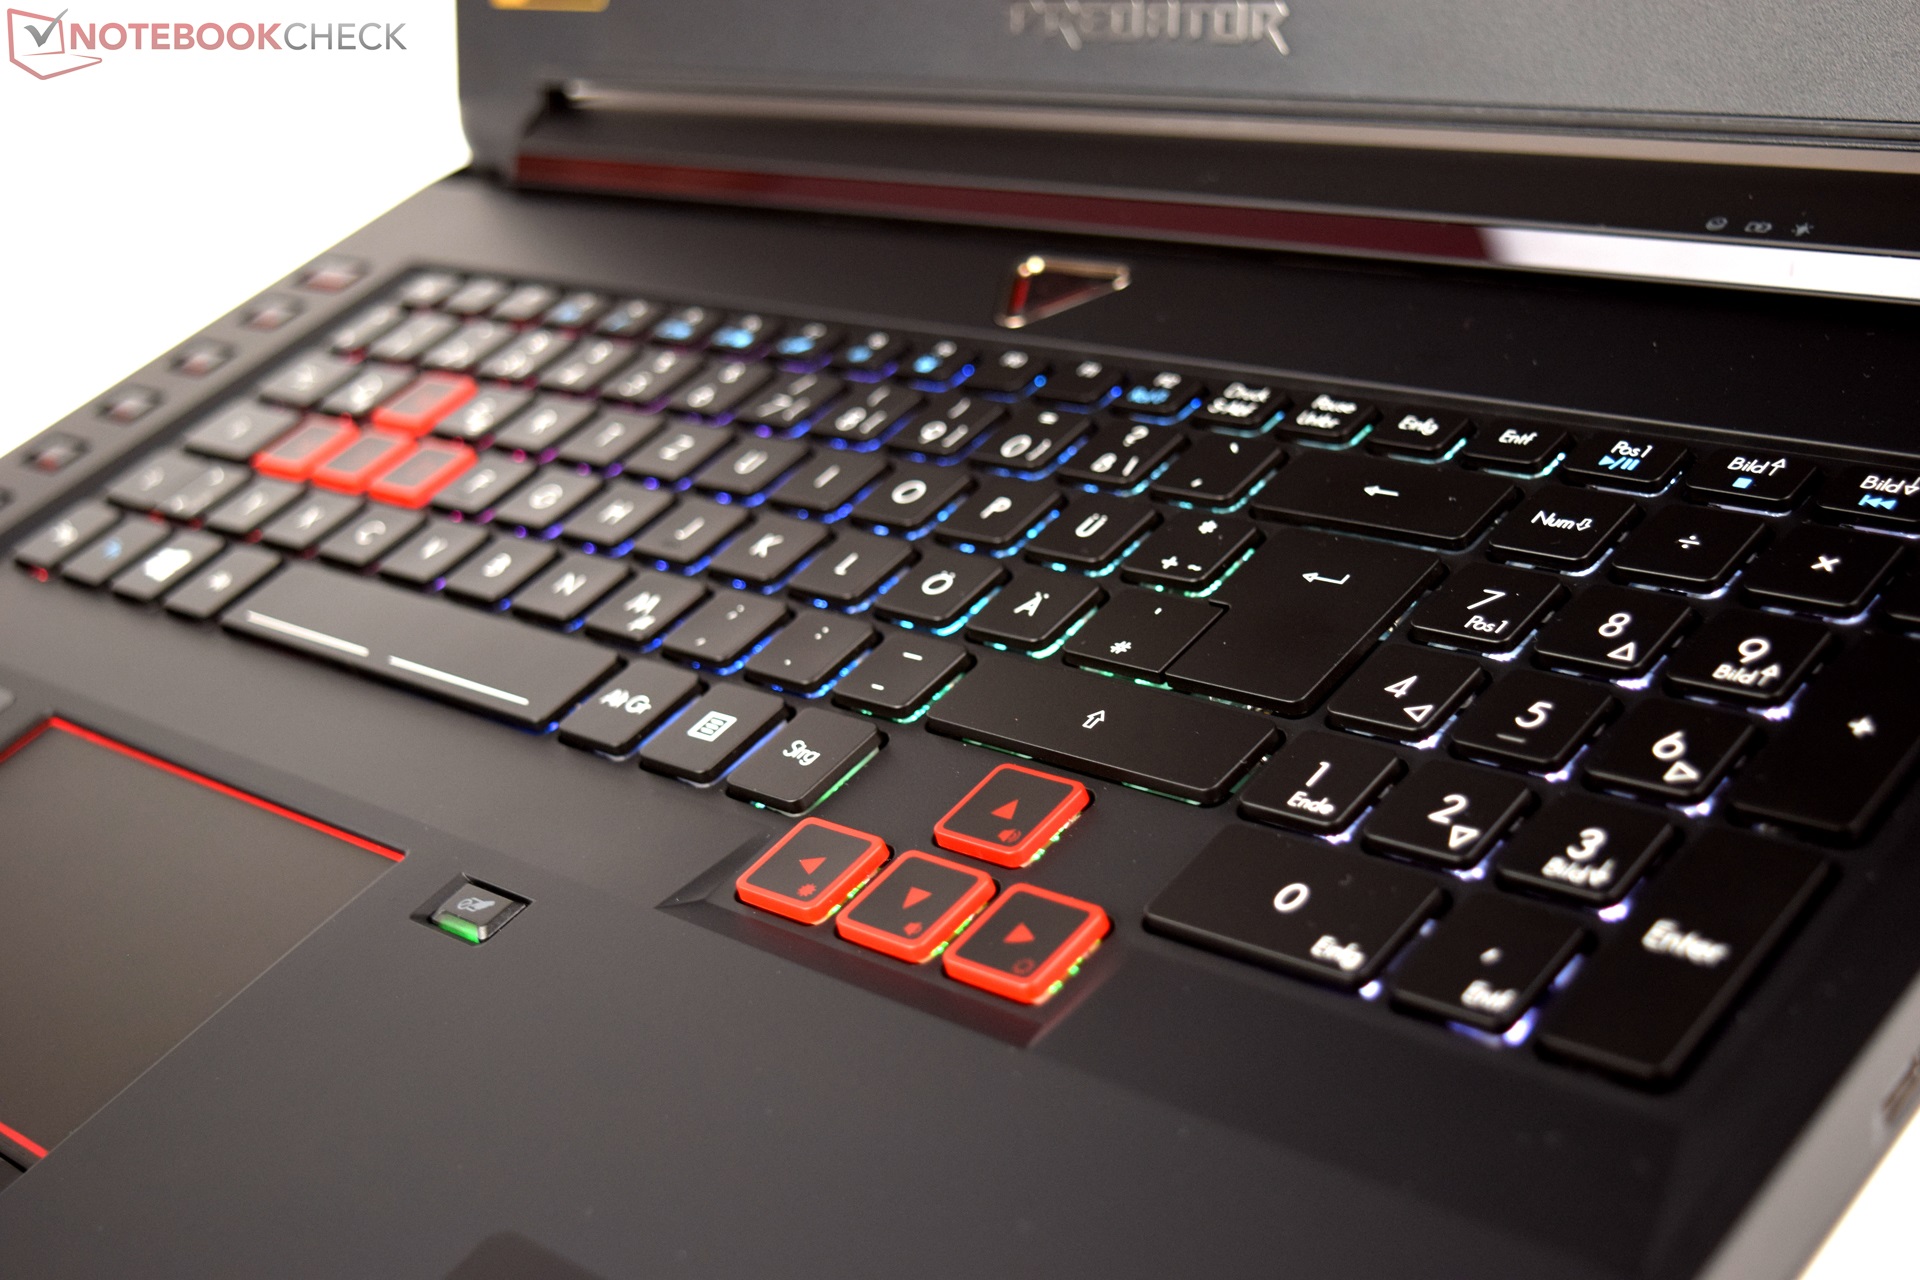
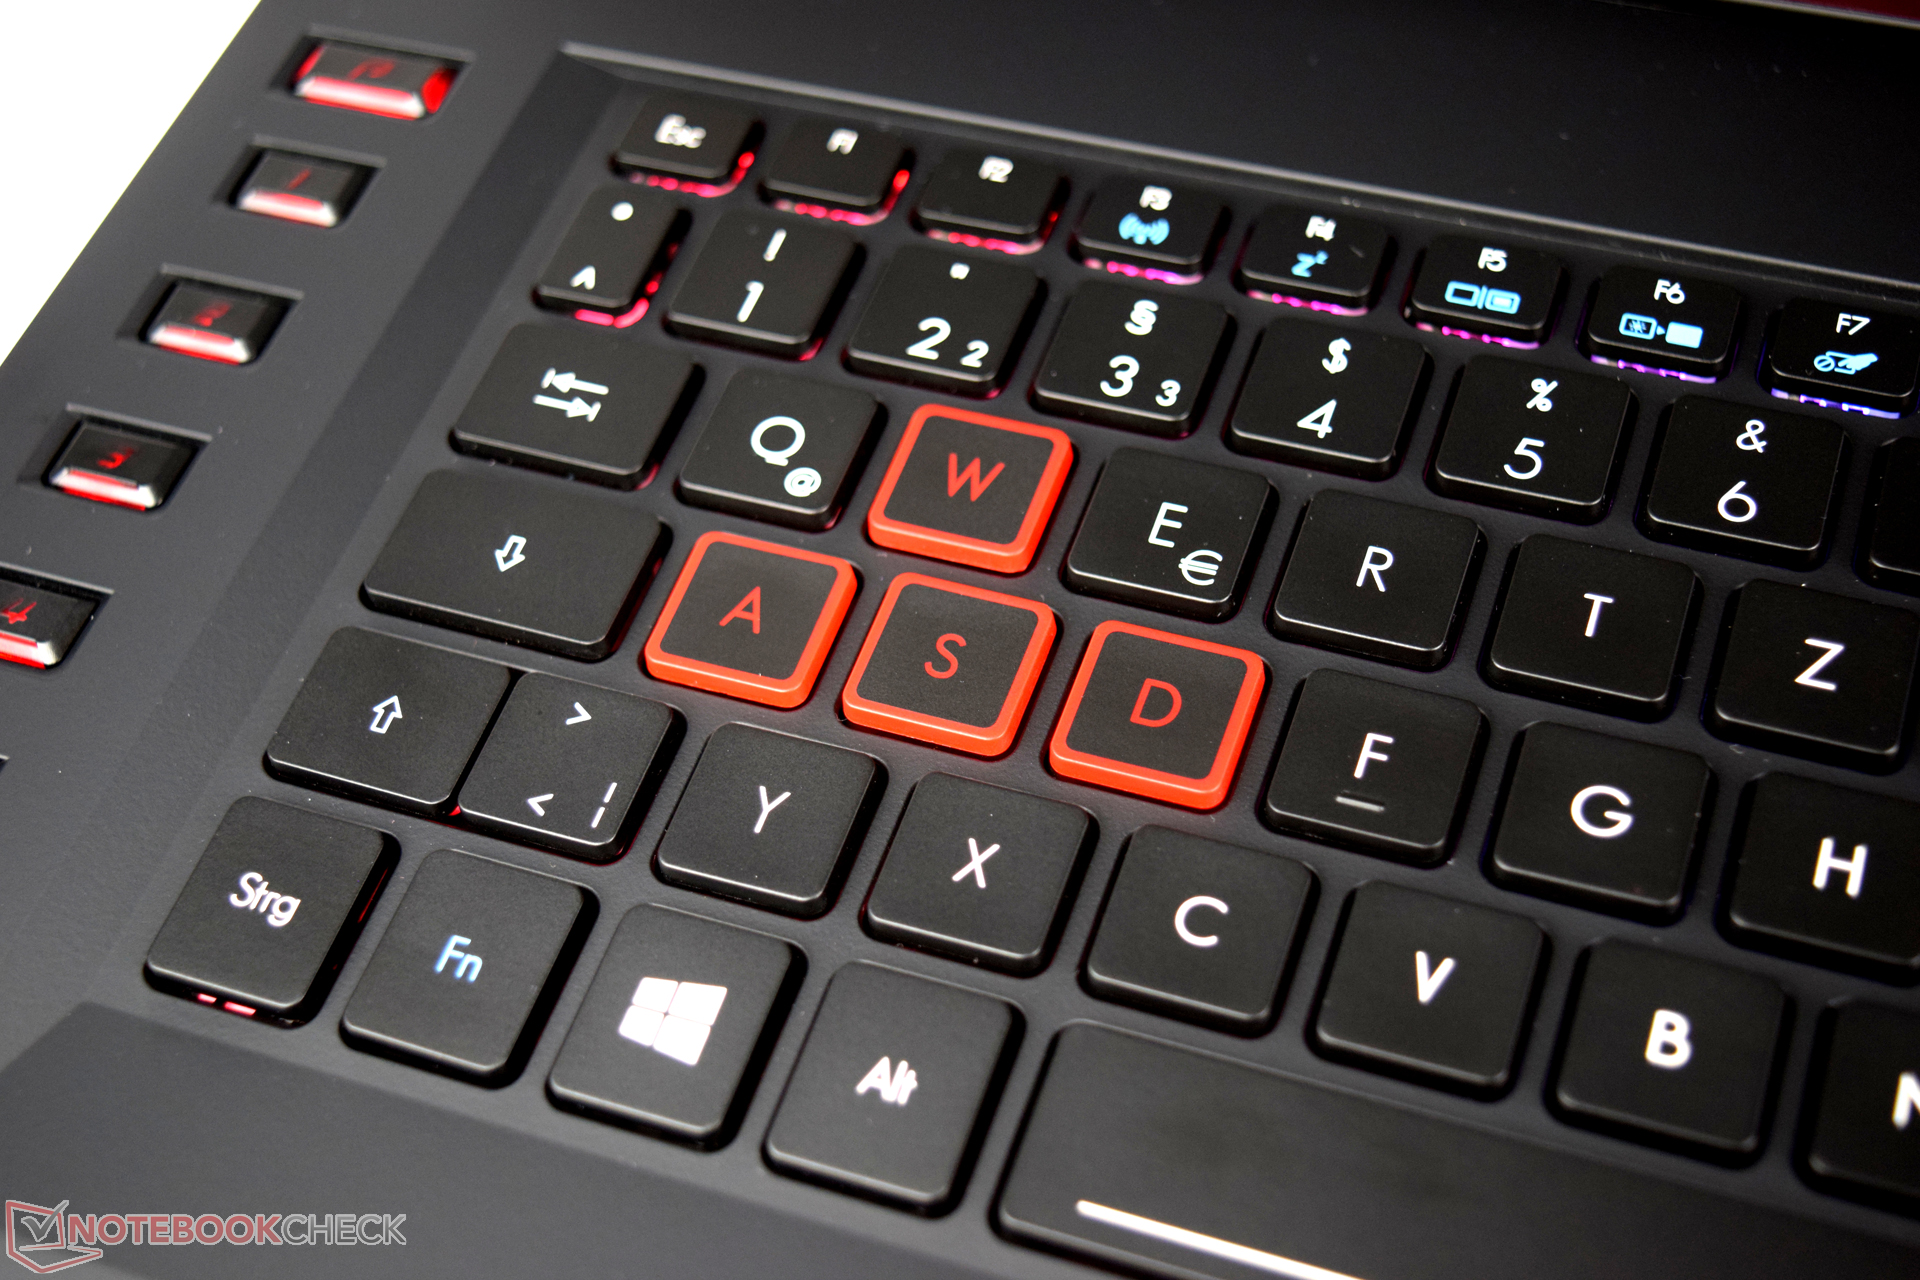
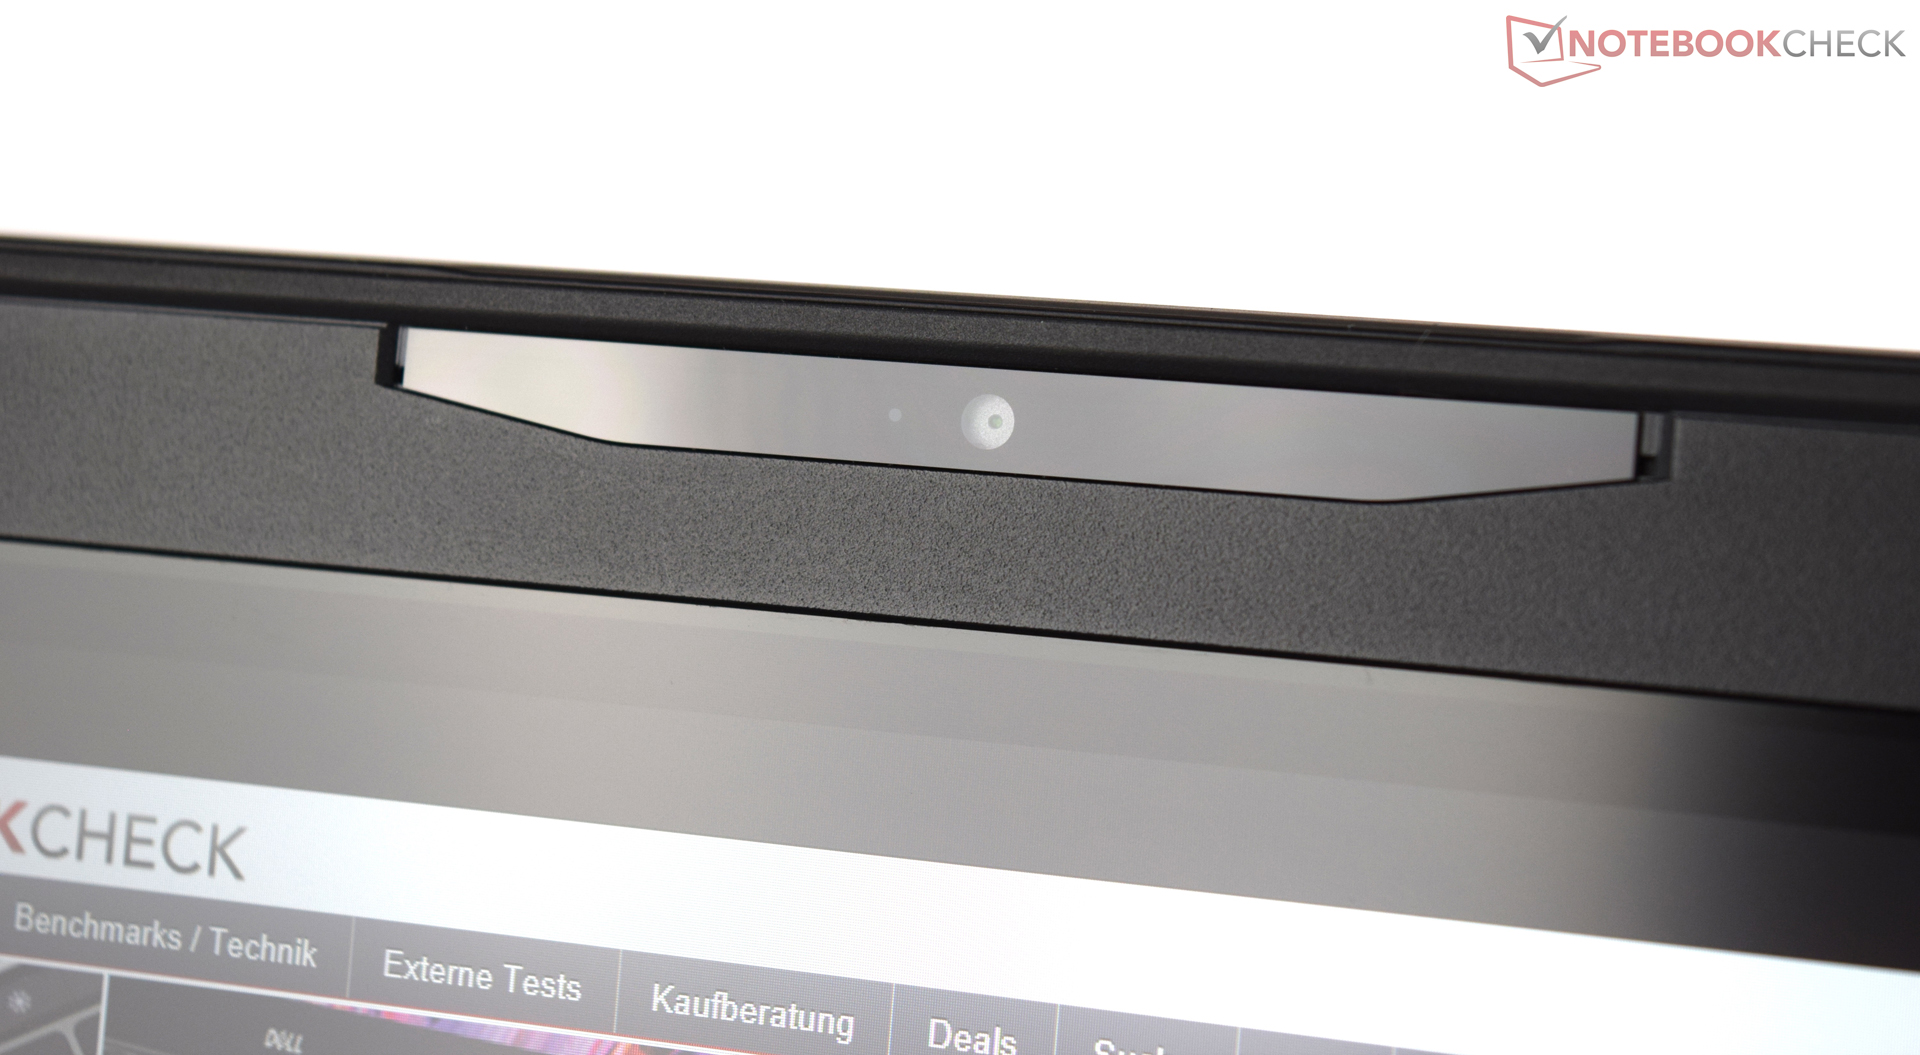
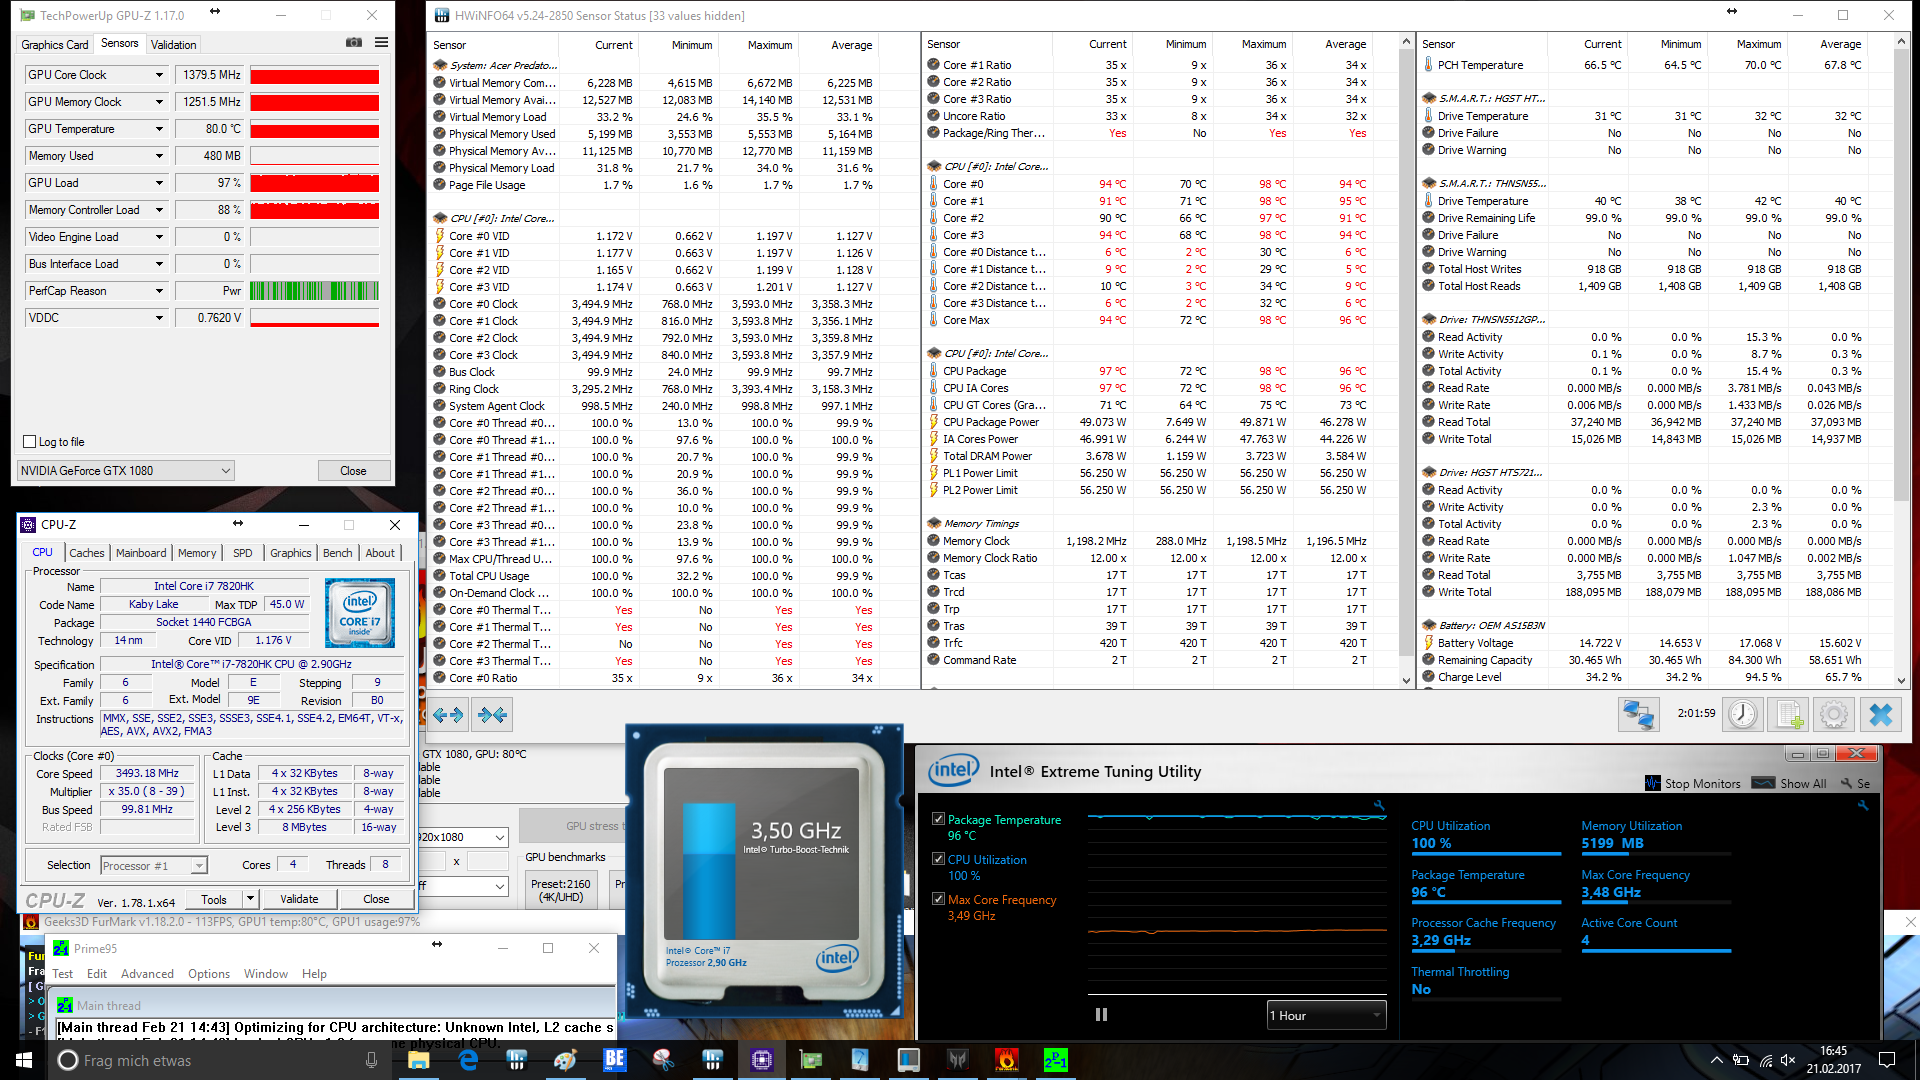
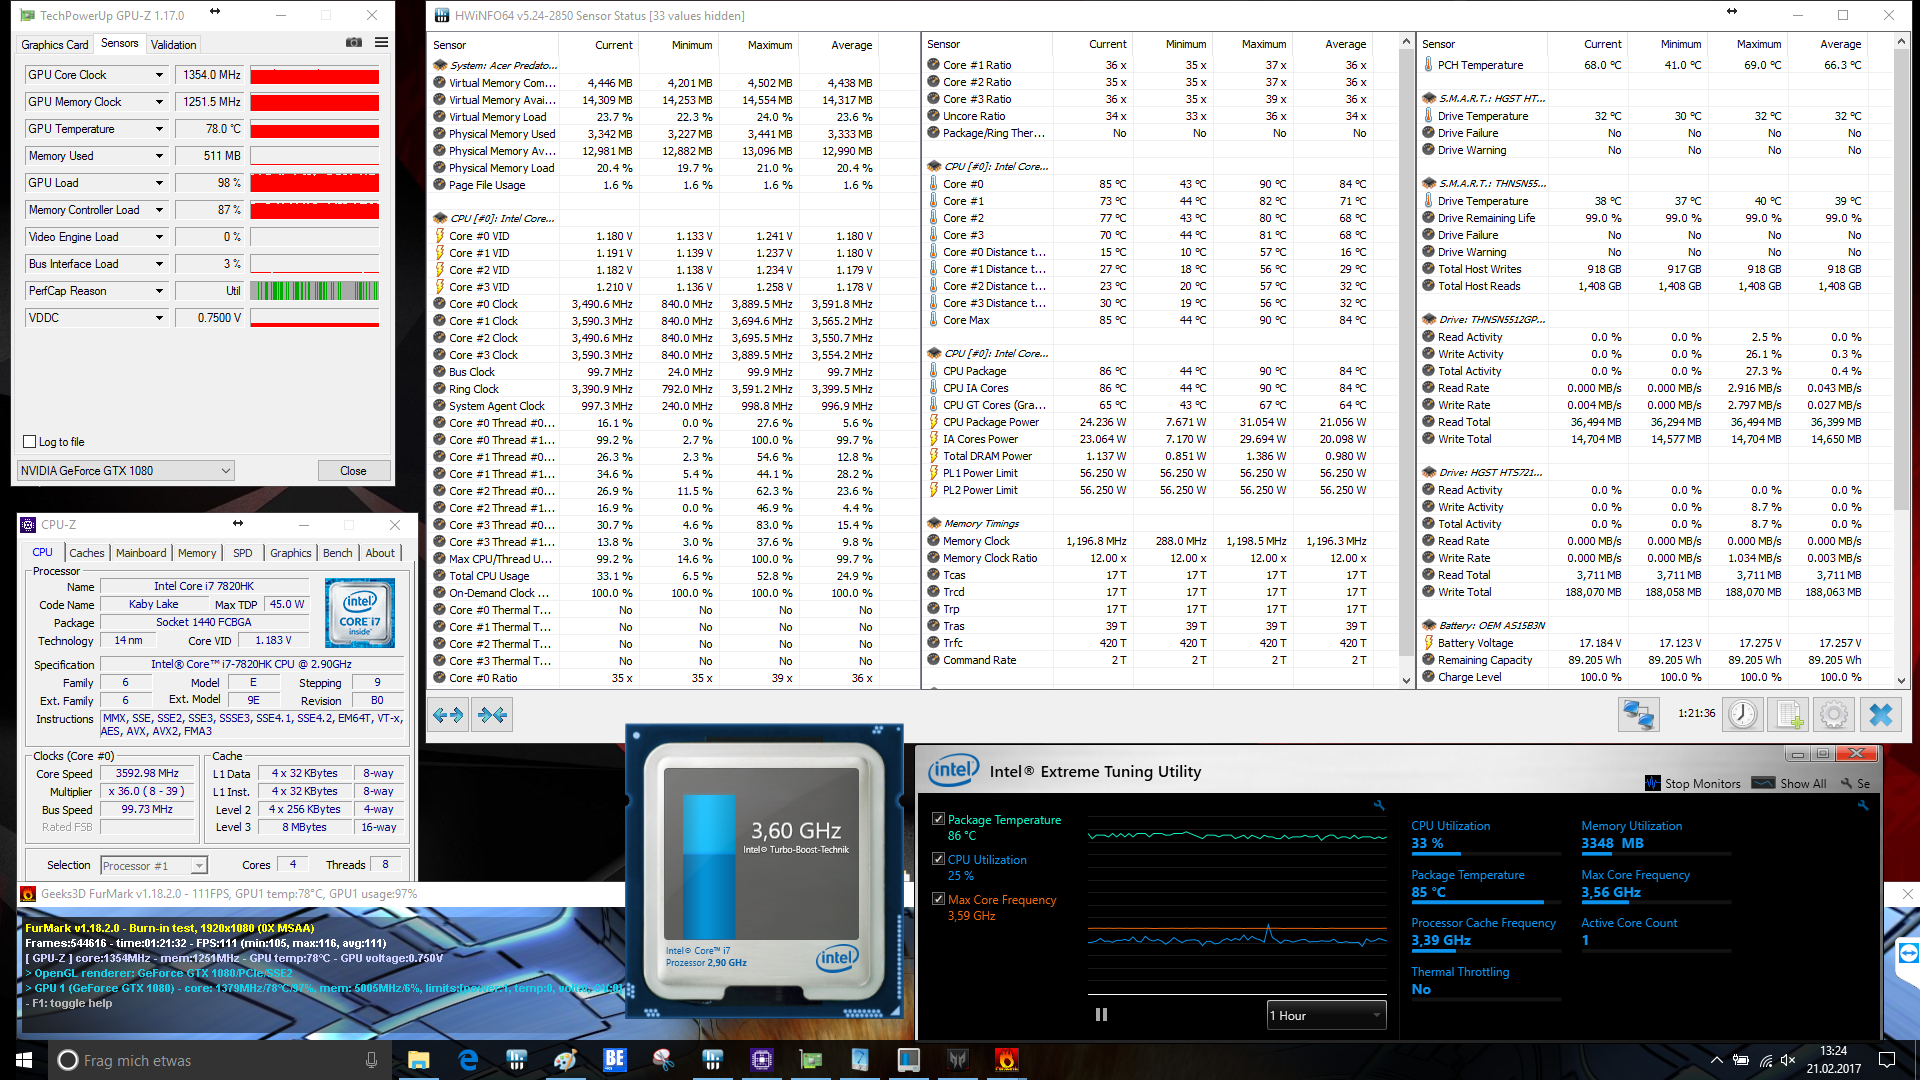
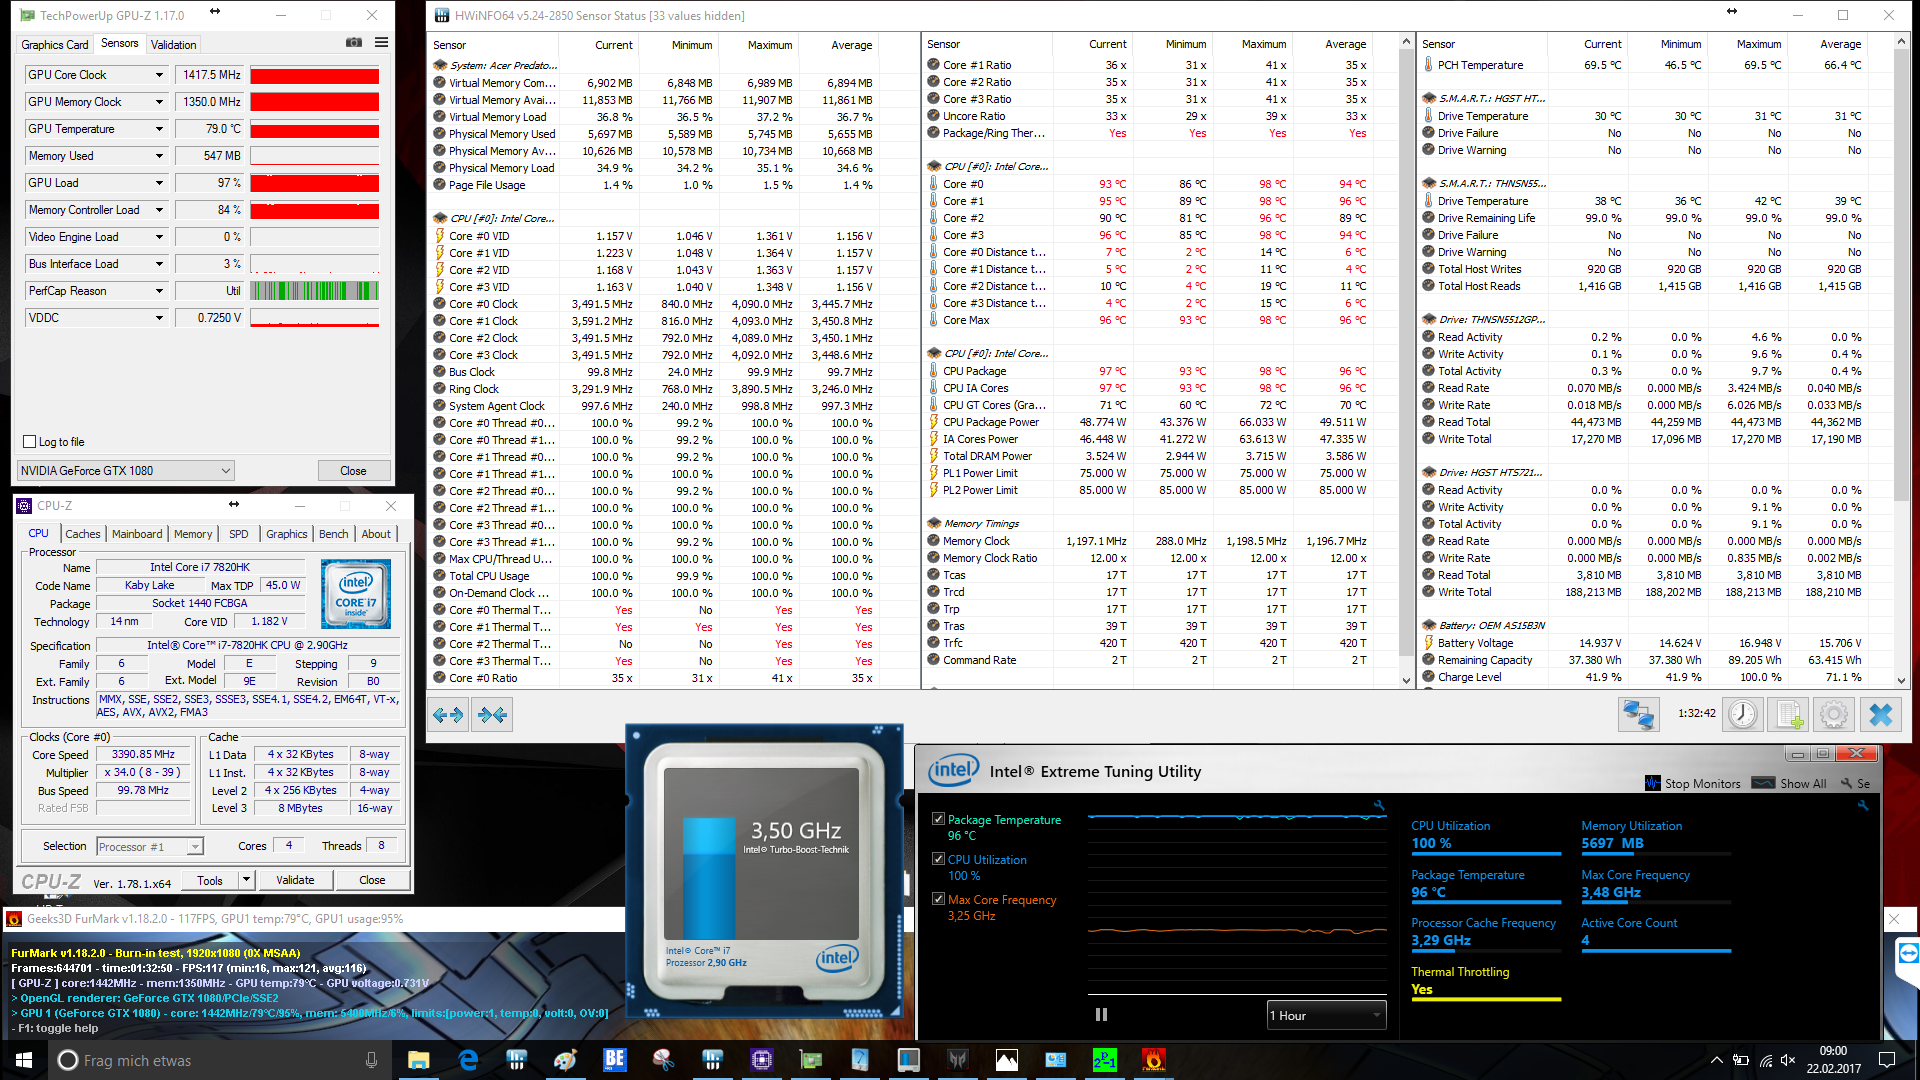
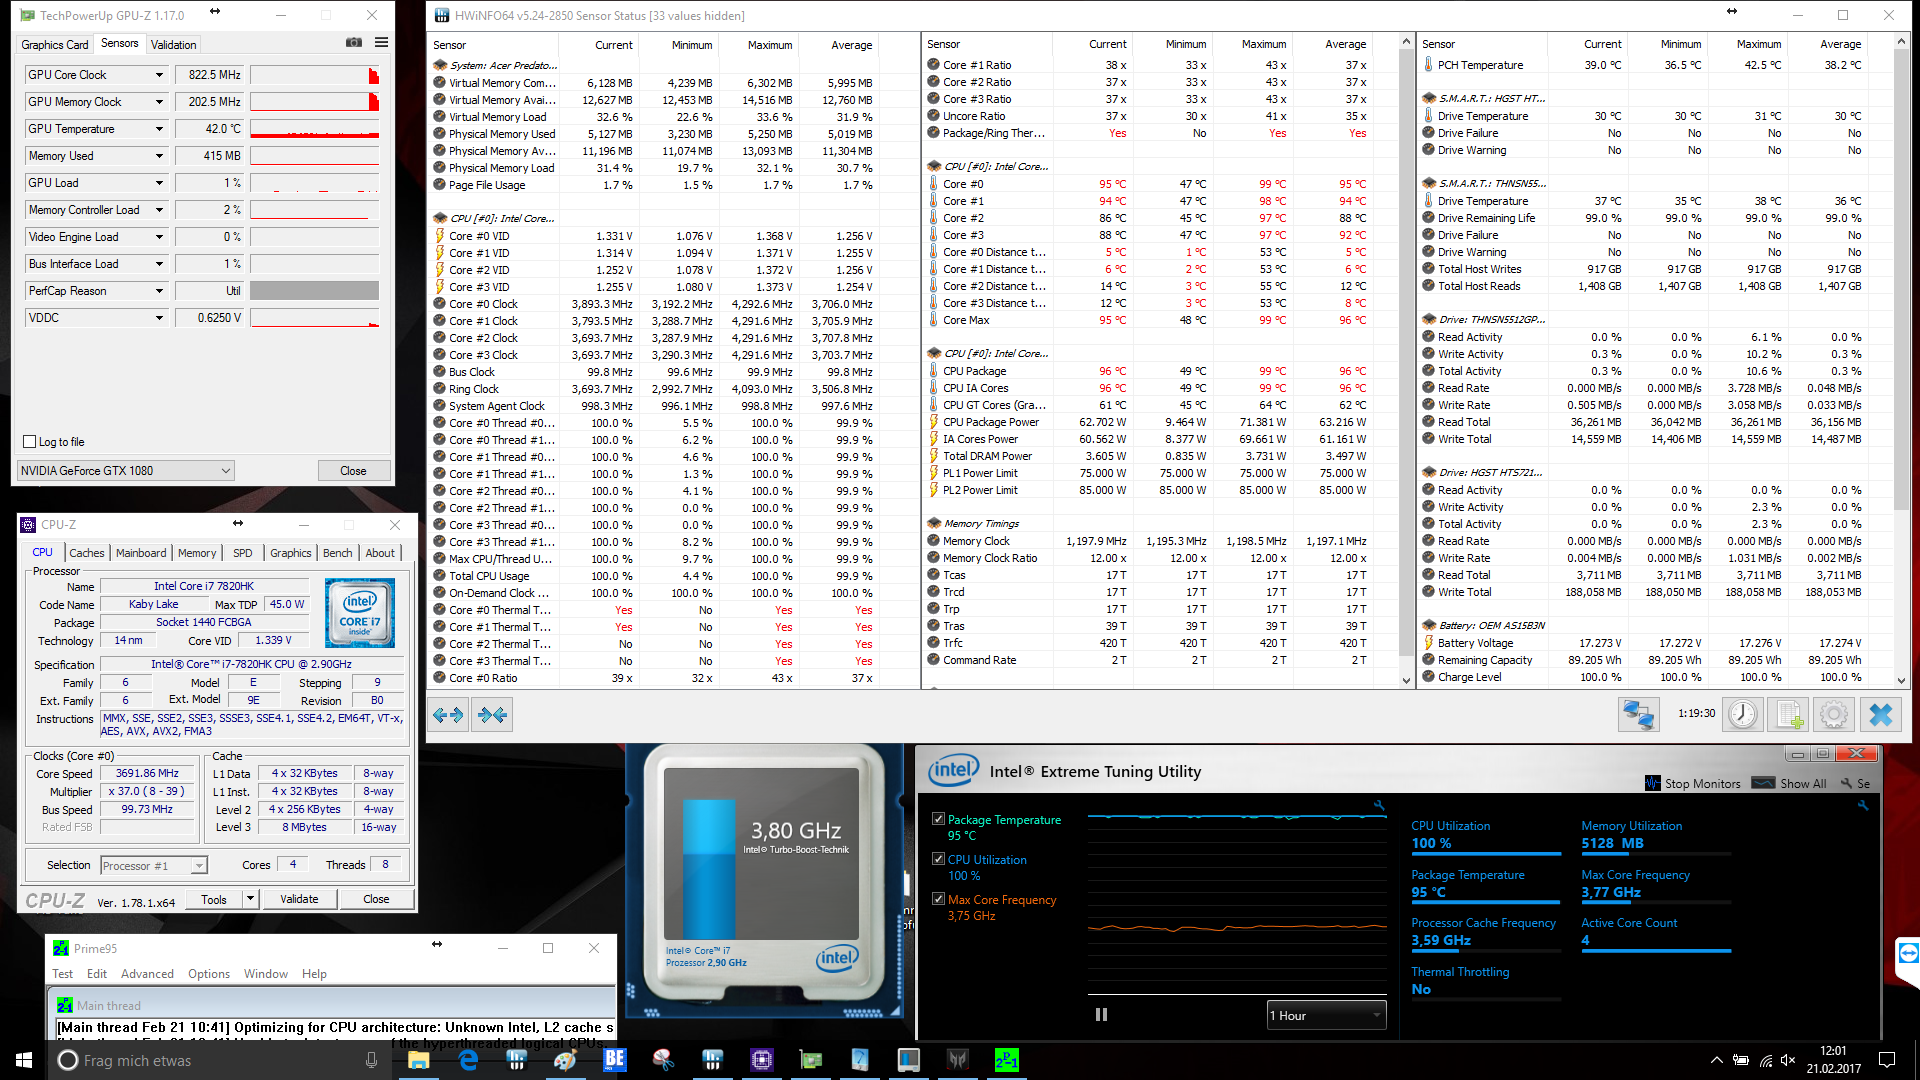
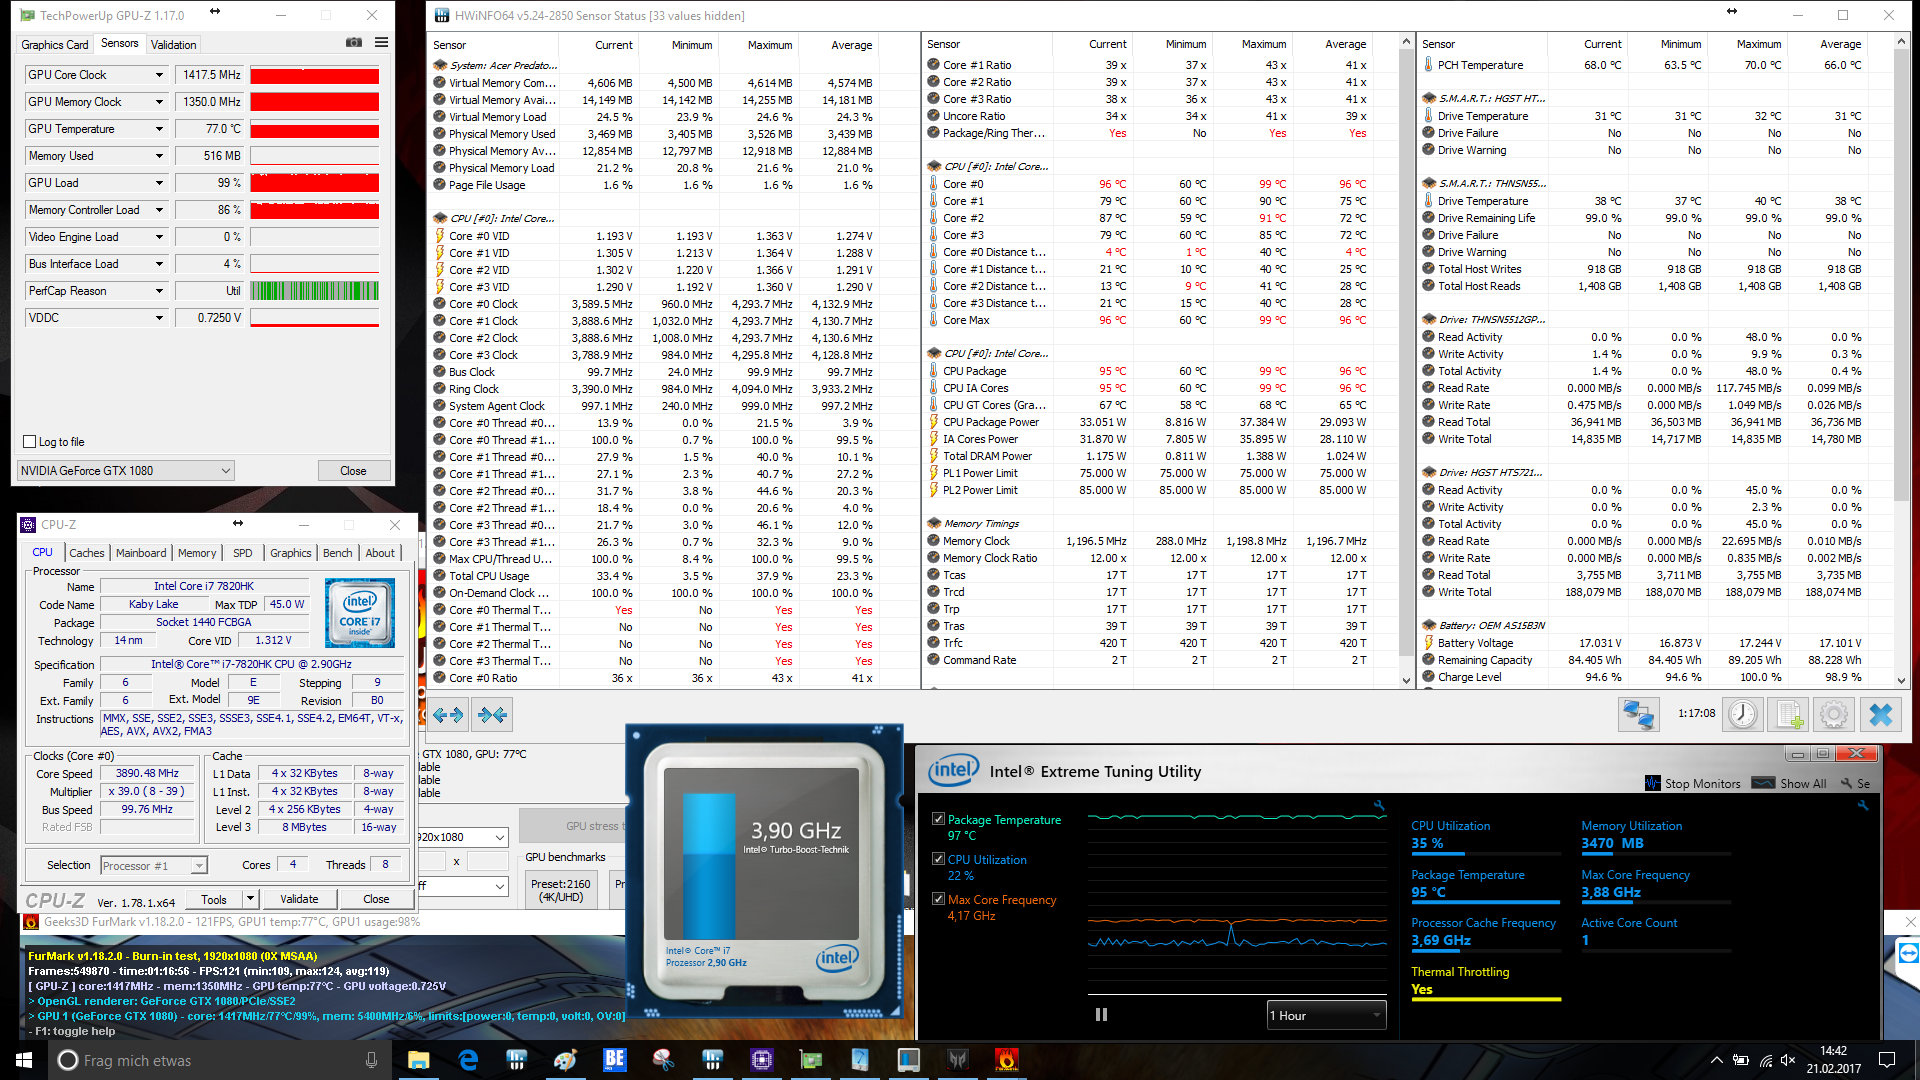
我们非常喜欢该机的输入设备和高品质外壳。然而,显示屏让人有些失望。亮度可以,但是反应有点慢。该机还有一个优点,那就是可以超频,以此获得更好的性能表现。这种情况下,处理器将会很快达到最高温度限制,但与原本默认设置相比,性能仍有提高。
注:本文是基于完整评测的缩减版本,阅读完整的英文评测,请点击这里。
Acer Predator 17 X GX-792-76DL
- 03/01/2017 v6 (old)
Sebastian Bade
Price comparison
