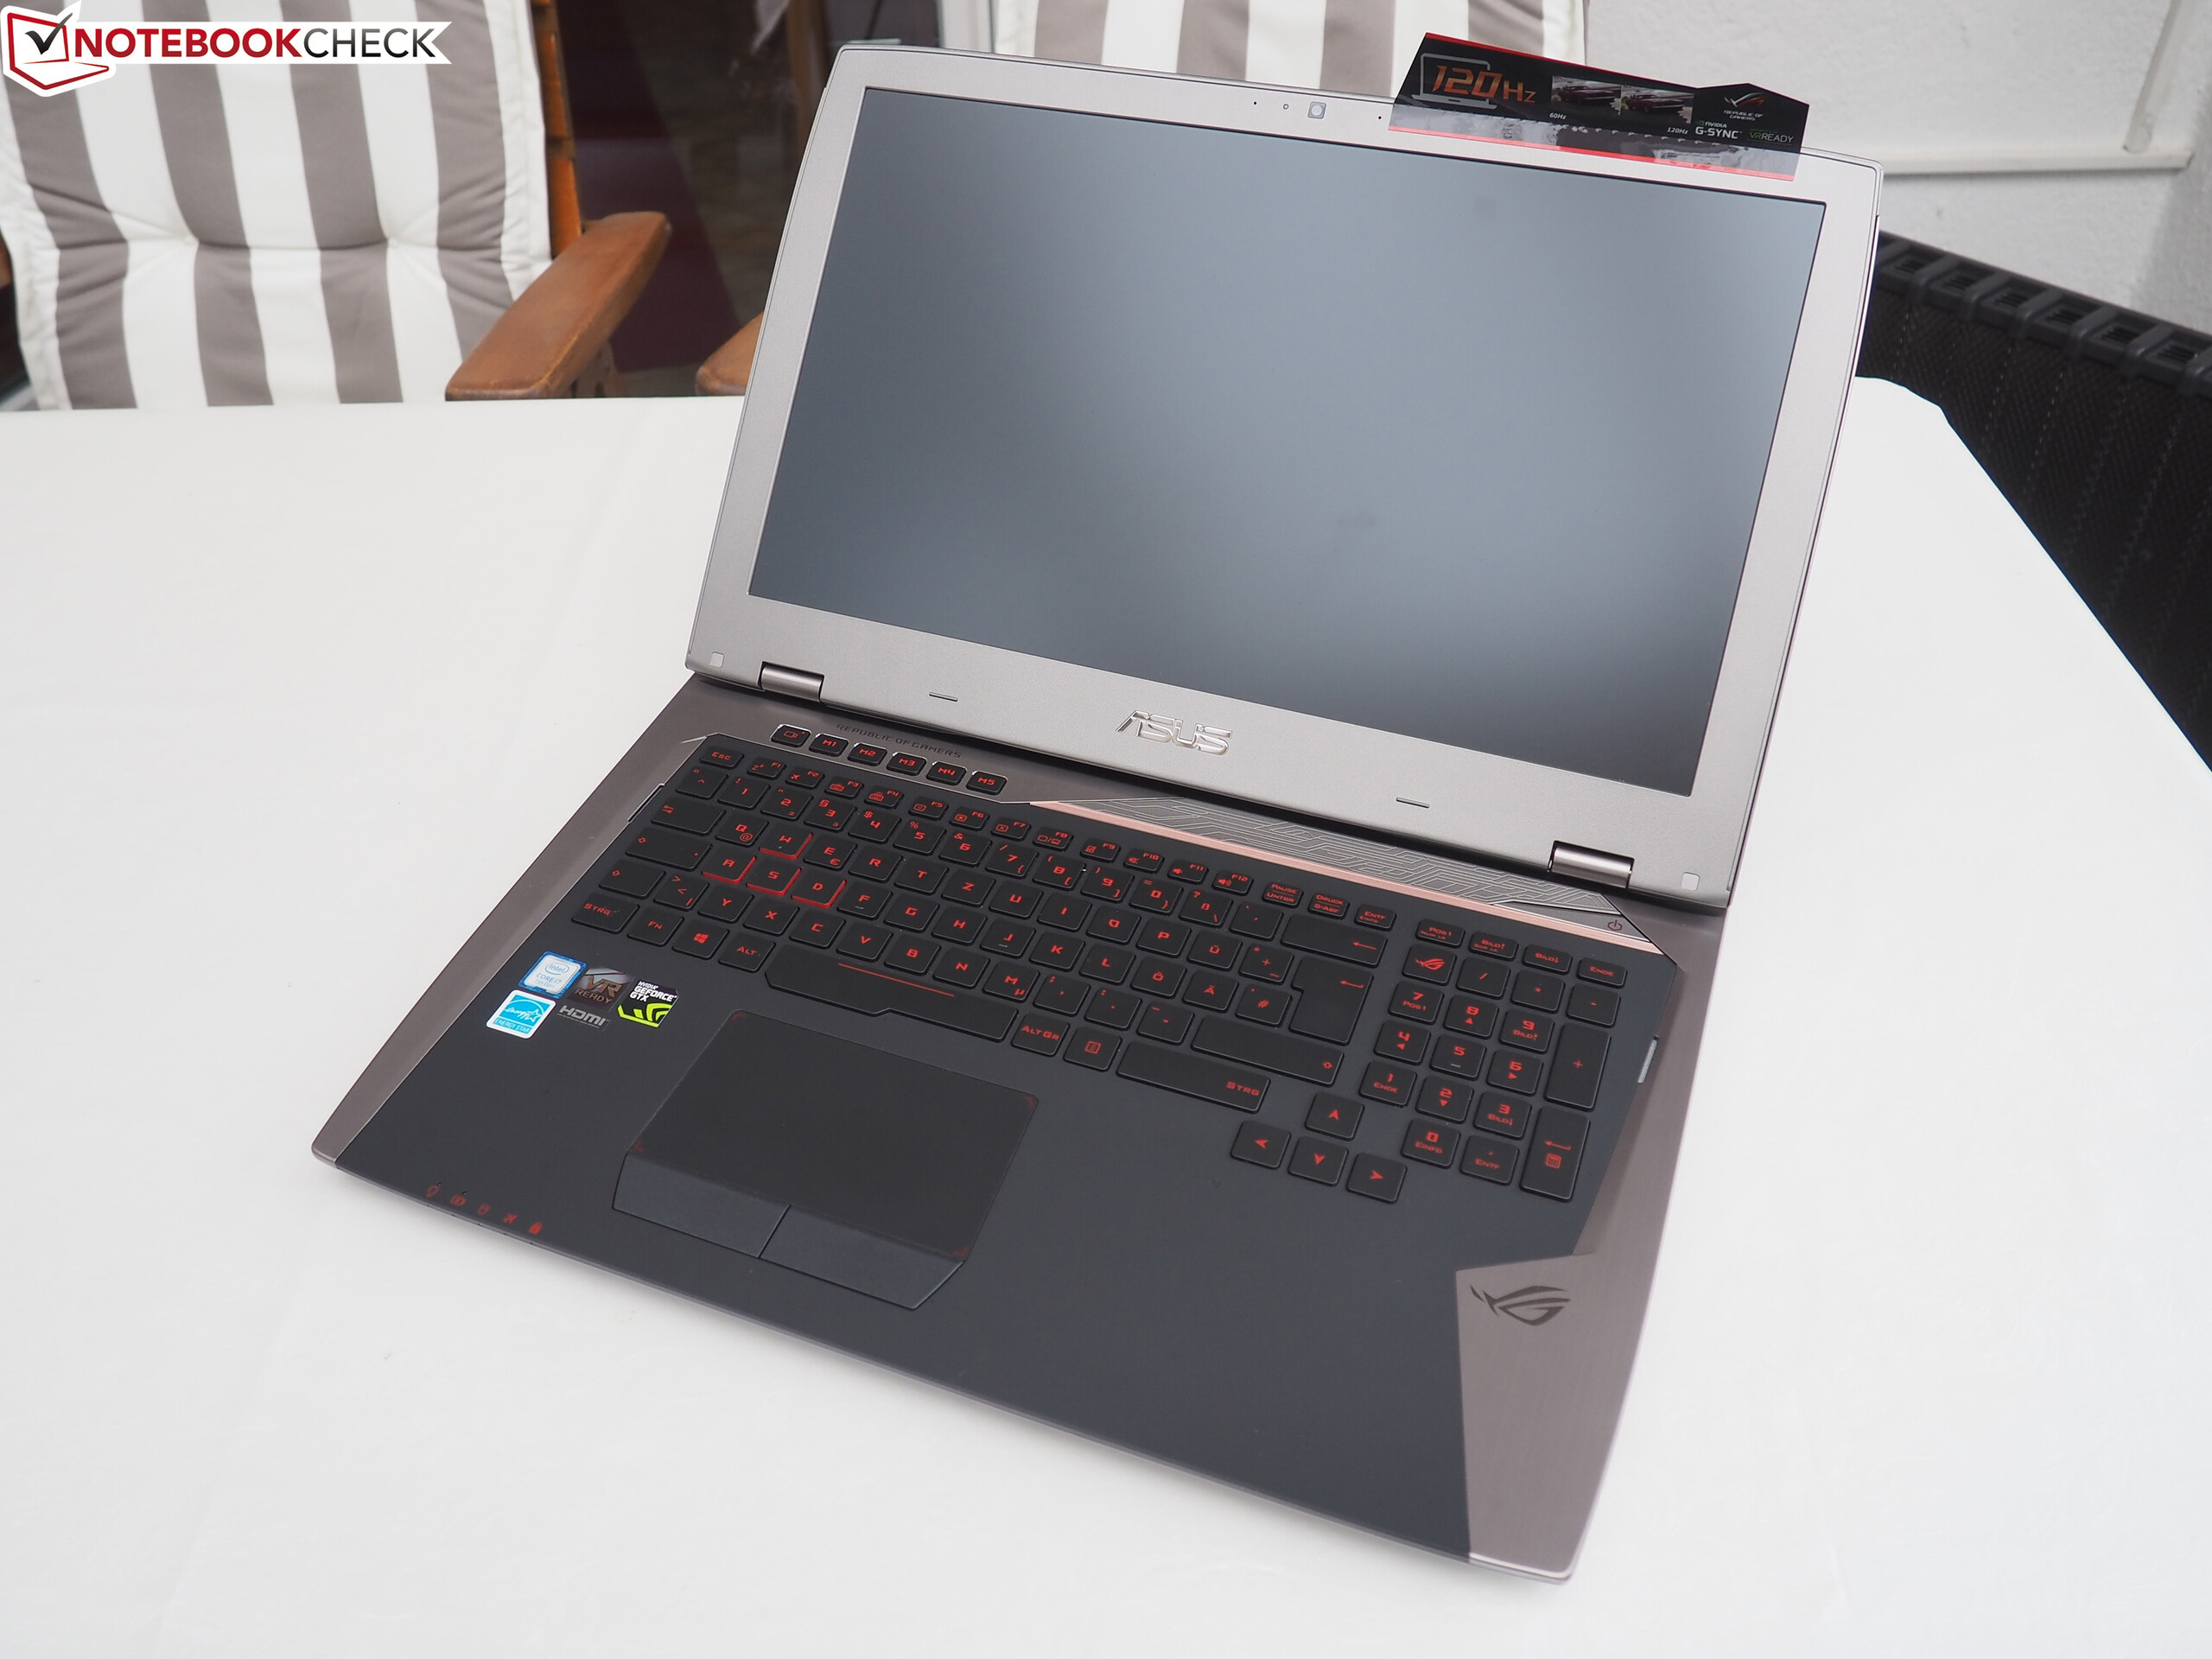
华硕 ROG G701VIK 笔记本简短评测


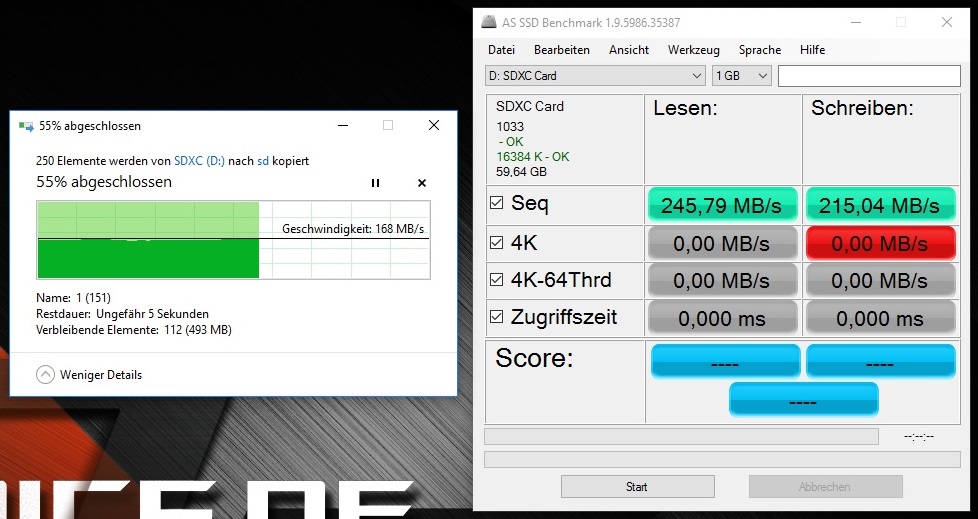
| SD Card Reader | |
| average JPG Copy Test (av. of 3 runs) | |
| Asus G701VIK-BA049T | |
| MSI GT73VR 7RF-296 | |
| MSI GT72VR 7RE-433 | |
| Aorus X7 DT v6 | |
| Acer Predator 17 G9-793-77LG | |
| Asus G752VS-XB78K | |
| maximum AS SSD Seq Read Test (1GB) | |
| Asus G701VIK-BA049T | |
| MSI GT73VR 7RF-296 | |
| MSI GT72VR 7RE-433 | |
| Aorus X7 DT v6 | |
| Acer Predator 17 G9-793-77LG | |
| Asus G752VS-XB78K | |
| Networking | |
| iperf3 transmit AX12 | |
| MSI GT73VR 7RF-296 | |
| MSI GT72VR 7RE-433 | |
| Asus G701VIK-BA049T | |
| iperf3 receive AX12 | |
| MSI GT73VR 7RF-296 | |
| Asus G701VIK-BA049T | |
| MSI GT72VR 7RE-433 | |
| |||||||||||||||||||||||||
Brightness Distribution: 91 %
Center on Battery: 306 cd/m²
Contrast: 1133:1 (Black: 0.27 cd/m²)
ΔE ColorChecker Calman: 3.98 | ∀{0.5-29.43 Ø4.71}
ΔE Greyscale Calman: 4.15 | ∀{0.09-98 Ø4.96}
89% sRGB (Argyll 1.6.3 3D)
58% AdobeRGB 1998 (Argyll 1.6.3 3D)
64.1% AdobeRGB 1998 (Argyll 3D)
87.7% sRGB (Argyll 3D)
68.8% Display P3 (Argyll 3D)
Gamma: 2.45
CCT: 7386 K
| Asus G701VIK-BA049T B173HAN01.1 (AUO119D), 1920x1080 | MSI GT73VR 7RF-296 N173HHE-G32 (CMN1747), 1920x1080 | Aorus X7 DT v6 AUO1096, 2560x1440 | Asus G752VS-XB78K LG Philips LP173WF4-SPF3 (LGD04E8), 1920x1080 | MSI GT72VR 7RE-433 Chi Mei N173HHE-G32 (CMN1747), 1920x1080 | Acer Predator 17 G9-793-77LG AU Optronics B173ZAN01.0 (AUO109B), 3840x2160 | |
|---|---|---|---|---|---|---|
| Display | 26% | -8% | -3% | -1% | 32% | |
| Display P3 Coverage (%) | 68.8 | 90.6 32% | 59.6 -13% | 66.9 -3% | 68.3 -1% | 86.9 26% |
| sRGB Coverage (%) | 87.7 | 99.9 14% | 82.8 -6% | 85.2 -3% | 86.7 -1% | 100 14% |
| AdobeRGB 1998 Coverage (%) | 64.1 | 84.7 32% | 60.1 -6% | 62.3 -3% | 63.4 -1% | 99.4 55% |
| Response Times | 49% | 39% | -5% | 45% | -9% | |
| Response Time Grey 50% / Grey 80% * (ms) | 38 ? | 26 ? 32% | 21.6 ? 43% | 38 ? -0% | 29 ? 24% | 37 ? 3% |
| Response Time Black / White * (ms) | 20 ? | 7 ? 65% | 13.2 ? 34% | 22 ? -10% | 7 ? 65% | 24 ? -20% |
| PWM Frequency (Hz) | 59.5 | |||||
| Screen | -37% | -28% | 1% | -36% | 12% | |
| Brightness middle (cd/m²) | 306 | 307 0% | 339.5 11% | 328 7% | 299 -2% | 336 10% |
| Brightness (cd/m²) | 299 | 284 -5% | 309 3% | 317 6% | 277 -7% | 320 7% |
| Brightness Distribution (%) | 91 | 85 -7% | 80 -12% | 88 -3% | 87 -4% | 88 -3% |
| Black Level * (cd/m²) | 0.27 | 0.25 7% | 0.45 -67% | 0.3 -11% | 0.27 -0% | 0.25 7% |
| Contrast (:1) | 1133 | 1228 8% | 754 -33% | 1093 -4% | 1107 -2% | 1344 19% |
| Colorchecker dE 2000 * | 3.98 | 9.65 -142% | 6.88 -73% | 3.74 6% | 9.65 -142% | 3.61 9% |
| Colorchecker dE 2000 max. * | 7.29 | 16.36 -124% | 9.99 -37% | 8.97 -23% | 15.43 -112% | 6.02 17% |
| Greyscale dE 2000 * | 4.15 | 10.07 -143% | 6.57 -58% | 2.67 36% | 9.68 -133% | 4.78 -15% |
| Gamma | 2.45 90% | 2.12 104% | 2.04 108% | 2.41 91% | 1.89 116% | 2.32 95% |
| CCT | 7386 88% | 12145 54% | 8608 76% | 6861 95% | 11652 56% | 6185 105% |
| Color Space (Percent of AdobeRGB 1998) (%) | 58 | 75 29% | 54 -7% | 56 -3% | 75 29% | 88 52% |
| Color Space (Percent of sRGB) (%) | 89 | 100 12% | 82 -8% | 85 -4% | 100 12% | 100 12% |
| Total Average (Program / Settings) | 13% /
-13% | 1% /
-15% | -2% /
-1% | 3% /
-18% | 12% /
13% |
* ... smaller is better
Display Response Times
| ↔ Response Time Black to White | ||
|---|---|---|
| 20 ms ... rise ↗ and fall ↘ combined | ↗ 4 ms rise | 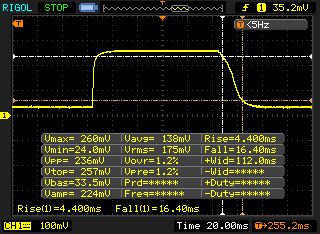 |
| ↘ 16 ms fall | ||
| The screen shows good response rates in our tests, but may be too slow for competitive gamers. In comparison, all tested devices range from 0.1 (minimum) to 240 (maximum) ms. » 44 % of all devices are better. This means that the measured response time is similar to the average of all tested devices (19.8 ms). | ||
| ↔ Response Time 50% Grey to 80% Grey | ||
| 38 ms ... rise ↗ and fall ↘ combined | ↗ 13 ms rise | 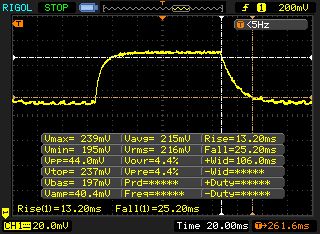 |
| ↘ 25 ms fall | ||
| The screen shows slow response rates in our tests and will be unsatisfactory for gamers. In comparison, all tested devices range from 0.165 (minimum) to 636 (maximum) ms. » 55 % of all devices are better. This means that the measured response time is worse than the average of all tested devices (31 ms). | ||
Screen Flickering / PWM (Pulse-Width Modulation)
| Screen flickering / PWM not detected | 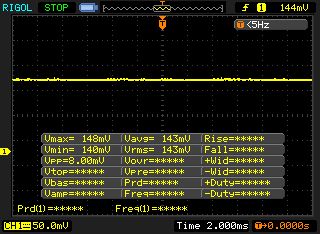 | ||
In comparison: 52 % of all tested devices do not use PWM to dim the display. If PWM was detected, an average of 7757 (minimum: 5 - maximum: 343500) Hz was measured. | |||

| Cinebench R11.5 | |
| CPU Single 64Bit | |
| Asus G701VIK-BA049T | |
| MSI GT73VR 7RF-296 | |
| Aorus X7 DT v6 | |
| MSI GT72VR 7RE-433 | |
| Asus G752VS-XB78K | |
| CPU Multi 64Bit | |
| Asus G701VIK-BA049T | |
| MSI GT73VR 7RF-296 | |
| Aorus X7 DT v6 | |
| Asus G752VS-XB78K | |
| MSI GT72VR 7RE-433 | |
| PCMark 8 | |
| Home Score Accelerated v2 | |
| Asus G701VIK-BA049T | |
| Asus G752VS-XB78K | |
| Aorus X7 DT v6 | |
| MSI GT72VR 7RE-433 | |
| Acer Predator 17 G9-793-77LG | |
| Work Score Accelerated v2 | |
| Asus G701VIK-BA049T | |
| Asus G752VS-XB78K | |
| MSI GT72VR 7RE-433 | |
| Aorus X7 DT v6 | |
| PCMark 7 - Score | |
| Asus G701VIK-BA049T | |
| MSI GT73VR 7RF-296 | |
| Asus G752VS-XB78K | |
| MSI GT72VR 7RE-433 | |
| PCMark 7 Score | 7903 points | |
| PCMark 8 Home Score Accelerated v2 | 5662 points | |
| PCMark 8 Work Score Accelerated v2 | 5846 points | |
Help | ||
| Asus G701VIK-BA049T 2x Samsung SM961 MZVPW256HEGL NVMe (RAID 0) | MSI GT73VR 7RF-296 2x Samsung SM951 MZVPV256HDGL (RAID 0) | Aorus X7 DT v6 Samsung SM951 MZVPV512HDGL m.2 PCI-e | Asus G752VS-XB78K Toshiba NVMe THNSN5512GPU7 | MSI GT72VR 7RE-433 Kingston RBU-SNS8152S3256GG5 | Acer Predator 17 G9-793-77LG Toshiba NVMe THNSN5256GPU7 | |
|---|---|---|---|---|---|---|
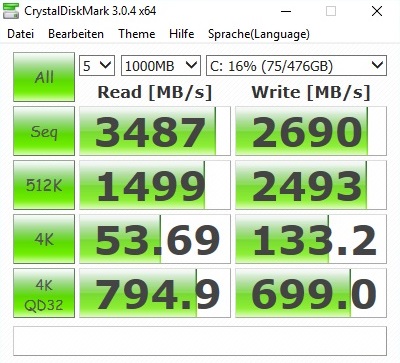
| AS SSD | -8% | -19% | -57% | -38% | ||
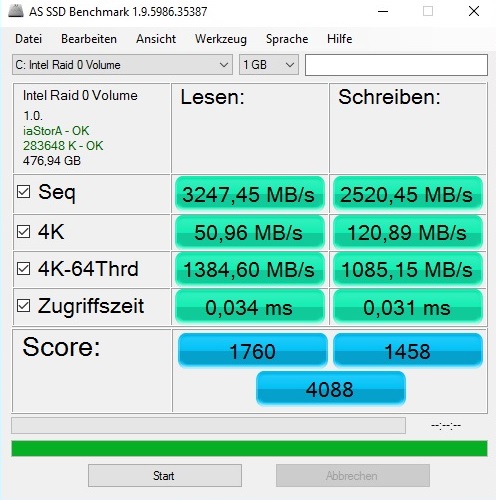
| Seq Read (MB/s) | 3247 | 2988 -8% | 1971 -39% | 509 -84% | 2016 -38% | |
| Seq Write (MB/s) | 2520 | 2332 -7% | 1494 -41% | 282.1 -89% | 837 -67% | |
| 4K Read (MB/s) | 51 | 46.75 -8% | 48.93 -4% | 40.04 -21% | 35.5 -30% | |
| 4K Write (MB/s) | 120.9 | 123.8 2% | 149.1 23% | 95.8 -21% | 105.2 -13% | |
| Score Total (Points) | 4088 | 3310 -19% | 2695 -34% | 1142 -72% | 2320 -43% |

| 3DMark - 1920x1080 Fire Strike Graphics | |
| Asus G701VIK-BA049T | |
| Aorus X7 DT v6 | |
| MSI GT73VR 7RF-296 | |
| MSI GT72VR 7RE-433 | |
| Asus G752VS-XB78K | |
| Acer Predator 17 G9-793-77LG | |
| 3DMark 11 - 1280x720 Performance GPU | |
| Asus G701VIK-BA049T | |
| MSI GT73VR 7RF-296 | |
| Aorus X7 DT v6 | |
| MSI GT72VR 7RE-433 | |
| Asus G752VS-XB78K | |
| Acer Predator 17 G9-793-77LG | |
| Unigine Heaven 4.0 - Extreme Preset DX11 | |
| Asus G701VIK-BA049T | |
| MSI GT73VR 7RF-296 | |
| Asus G752VS-XB78K | |
| 3DMark 11 Performance | 21727 points | |
| 3DMark Ice Storm Standard Score | 193915 points | |
| 3DMark Cloud Gate Standard Score | 32489 points | |
| 3DMark Fire Strike Score | 17700 points | |
Help | ||
| Far Cry Primal | |
| 3840x2160 High Preset AA:SM | |
| Asus G701VIK-BA049T | |
| Asus G752VS-XB78K | |
| Acer Predator 17 G9-793-77LG | |
| 1920x1080 Ultra Preset AA:SM | |
| Asus G701VIK-BA049T | |
| Asus G752VS-XB78K | |
| Acer Predator 17 G9-793-77LG | |
| XCOM 2 | |
| 3840x2160 High Preset AA:FX AF:8x | |
| Asus G701VIK-BA049T | |
| 1920x1080 Maximum Preset (8xMSAA instead of FXAA) AA:8xMS AF:16x | |
| Asus G701VIK-BA049T | |
| The Division | |
| 3840x2160 High Preset AF:8x | |
| Asus G701VIK-BA049T | |
| Acer Predator 17 G9-793-77LG | |
| 1920x1080 Ultra Preset AF:16x | |
| Asus G701VIK-BA049T | |
| Acer Predator 17 G9-793-77LG | |
| Mirror's Edge Catalyst | |
| 3840x2160 High Preset AF:16x | |
| Asus G701VIK-BA049T | |
| Acer Predator 17 G9-793-77LG | |
| 1920x1080 Ultra Preset AF:16x | |
| Asus G701VIK-BA049T | |
| Acer Predator 17 G9-793-77LG | |
| Deus Ex Mankind Divided | |
| 3840x2160 High Preset AF:4x | |
| Asus G701VIK-BA049T | |
| MSI GT73VR 7RF-296 | |
| 1920x1080 Ultra Preset AA:2xMS AF:8x | |
| MSI GT73VR 7RF-296 | |
| Asus G701VIK-BA049T | |
| MSI GT72VR 7RE-433 | |
| FIFA 17 | |
| 3840x2160 High Preset | |
| Asus G701VIK-BA049T | |
| MSI GT73VR 7RF-296 | |
| 1920x1080 Ultra Preset AA:4xMS | |
| MSI GT73VR 7RF-296 | |
| Asus G701VIK-BA049T | |
| Mafia 3 | |
| 3840x2160 High Preset | |
| Asus G701VIK-BA049T | |
| 1920x1080 High Preset | |
| Asus G701VIK-BA049T | |
| Battlefield 1 | |
| 3840x2160 High Preset AA:T | |
| Asus G701VIK-BA049T | |
| MSI GT73VR 7RF-296 | |
| 1920x1080 Ultra Preset AA:T | |
| Asus G701VIK-BA049T | |
| MSI GT73VR 7RF-296 | |
| MSI GT72VR 7RE-433 | |
| Titanfall 2 | |
| 3840x2160 High / Enabled AA:TS AF:8x | |
| MSI GT73VR 7RF-296 | |
| Asus G701VIK-BA049T | |
| 1920x1080 Very High (Insane Texture Quality) / Enabled AA:TS AF:16x | |
| MSI GT73VR 7RF-296 | |
| Asus G701VIK-BA049T | |
| MSI GT72VR 7RE-433 | |
| Call of Duty Infinite Warfare | |
| 3840x2160 High / On AA:FX | |
| Asus G701VIK-BA049T | |
| MSI GT73VR 7RF-296 | |
| 1920x1080 Ultra / On AA:T2X SM | |
| MSI GT73VR 7RF-296 | |
| Asus G701VIK-BA049T | |
| Dishonored 2 | |
| 3840x2160 High Preset AA:TX | |
| Asus G701VIK-BA049T | |
| MSI GT73VR 7RF-296 | |
| 1920x1080 Ultra Preset AA:TX | |
| Asus G701VIK-BA049T | |
| MSI GT73VR 7RF-296 | |
| Watch Dogs 2 | |
| 3840x2160 High Preset | |
| Asus G701VIK-BA049T | |
| MSI GT73VR 7RF-296 | |
| 1920x1080 Ultra Preset | |
| Asus G701VIK-BA049T | |
| MSI GT73VR 7RF-296 | |
| Resident Evil 7 | |
| 3840x2160 High / On AA:FXAA+T | |
| Asus G701VIK-BA049T | |
| 1920x1080 Very High / On AA:FXAA+T | |
| Asus G701VIK-BA049T | |
| For Honor | |
| 3840x2160 High Preset AA:T AF:8x | |
| Asus G701VIK-BA049T | |
| 1920x1080 Extreme Preset AA:T AF:16x | |
| Asus G701VIK-BA049T | |
| low | med. | high | ultra | 4K | |
|---|---|---|---|---|---|
| XCOM 2 (2016) | 95.2 | 51.4 | 31.7 | ||
| Far Cry Primal (2016) | 125 | 110 | 51 | ||
| The Division (2016) | 130 | 103 | 51.4 | ||
| Mirror's Edge Catalyst (2016) | 132 | 122 | 49.9 | ||
| Deus Ex Mankind Divided (2016) | 105 | 56.8 | 37.4 | ||
| FIFA 17 (2016) | 335 | 330 | 222 | ||
| Mafia 3 (2016) | 80.9 | 28.4 | |||
| Battlefield 1 (2016) | 155 | 138 | 60 | ||
| Titanfall 2 (2016) | 144 | 135 | 57.8 | ||
| Call of Duty Infinite Warfare (2016) | 125 | 125 | 77.7 | ||
| Dishonored 2 (2016) | 104 | 84 | 55.2 | ||
| Watch Dogs 2 (2016) | 105 | 78.6 | 45.1 | ||
| Resident Evil 7 (2017) | 212 | 175 | 59 | ||
| For Honor (2017) | 186 | 140 | 61.1 |
Noise level
| Idle |
| 30 / 31 / 36 dB(A) |
| Load |
| 47 / 56 dB(A) |
 | ||
30 dB silent 40 dB(A) audible 50 dB(A) loud |
||
min: | ||
| Asus G701VIK-BA049T GeForce GTX 1080 Mobile, i7-7820HK | MSI GT73VR 7RF-296 GeForce GTX 1080 Mobile, i7-7820HK | Aorus X7 DT v6 GeForce GTX 1080 Mobile, 6820HK | Asus G752VS-XB78K GeForce GTX 1070 Mobile, 6820HK | MSI GT72VR 7RE-433 GeForce GTX 1070 Mobile, i7-7700HQ | Acer Predator 17 G9-793-77LG GeForce GTX 1070 Mobile, 6700HQ | |
|---|---|---|---|---|---|---|
| Noise | -2% | -4% | 6% | 2% | -3% | |
| off / environment * (dB) | 30 | 30 -0% | 28.6 5% | 30 -0% | 31 -3% | 31 -3% |
| Idle Minimum * (dB) | 30 | 34 -13% | 32.2 -7% | 31 -3% | 34 -13% | 33 -10% |
| Idle Average * (dB) | 31 | 35 -13% | 35.2 -14% | 32 -3% | 35 -13% | 34 -10% |
| Idle Maximum * (dB) | 36 | 37 -3% | 35.2 2% | 33 8% | 37 -3% | 40 -11% |
| Load Average * (dB) | 47 | 39 17% | 51.7 -10% | 40 15% | 37 21% | 44 6% |
| Load Maximum * (dB) | 56 | 56 -0% | 55.7 1% | 47 16% | 44 21% | 50 11% |
* ... smaller is better
(-) The maximum temperature on the upper side is 50.9 °C / 124 F, compared to the average of 40.4 °C / 105 F, ranging from 21.2 to 68.8 °C for the class Gaming.
(±) The bottom heats up to a maximum of 44.6 °C / 112 F, compared to the average of 43.2 °C / 110 F
(+) In idle usage, the average temperature for the upper side is 28.7 °C / 84 F, compared to the device average of 33.9 °C / 93 F.
(±) The palmrests and touchpad can get very hot to the touch with a maximum of 39.4 °C / 102.9 F.
(-) The average temperature of the palmrest area of similar devices was 28.8 °C / 83.8 F (-10.6 °C / -19.1 F).
| Asus G701VIK-BA049T GeForce GTX 1080 Mobile, i7-7820HK | MSI GT73VR 7RF-296 GeForce GTX 1080 Mobile, i7-7820HK | Aorus X7 DT v6 GeForce GTX 1080 Mobile, 6820HK | Asus G752VS-XB78K GeForce GTX 1070 Mobile, 6820HK | MSI GT72VR 7RE-433 GeForce GTX 1070 Mobile, i7-7700HQ | Acer Predator 17 G9-793-77LG GeForce GTX 1070 Mobile, 6700HQ | |
|---|---|---|---|---|---|---|
| Heat | 7% | -1% | 4% | 7% | 1% | |
| Maximum Upper Side * (°C) | 50.9 | 39.8 22% | 45.4 11% | 42.9 16% | 41.5 18% | 42.6 16% |
| Maximum Bottom * (°C) | 44.6 | 47.8 -7% | 58.2 -30% | 41.5 7% | 50.6 -13% | 44.9 -1% |
| Idle Upper Side * (°C) | 29.9 | 27.1 9% | 27.4 8% | 31.6 -6% | 26.4 12% | 33.1 -11% |
| Idle Bottom * (°C) | 28.8 | 27.4 5% | 27.2 6% | 29.5 -2% | 25.4 12% | 28.9 -0% |
* ... smaller is better
Asus G701VIK-BA049T audio analysis
(±) | speaker loudness is average but good (73 dB)
Bass 100 - 315 Hz
(±) | reduced bass - on average 12.9% lower than median
(±) | linearity of bass is average (8.1% delta to prev. frequency)
Mids 400 - 2000 Hz
(+) | balanced mids - only 3.7% away from median
(+) | mids are linear (4.8% delta to prev. frequency)
Highs 2 - 16 kHz
(+) | balanced highs - only 2.9% away from median
(±) | linearity of highs is average (9% delta to prev. frequency)
Overall 100 - 16.000 Hz
(±) | linearity of overall sound is average (18% difference to median)
Compared to same class
» 56% of all tested devices in this class were better, 9% similar, 36% worse
» The best had a delta of 6%, average was 18%, worst was 132%
Compared to all devices tested
» 38% of all tested devices were better, 8% similar, 54% worse
» The best had a delta of 4%, average was 23%, worst was 134%
MSI GT73VR 7RF-296 audio analysis
(+) | speakers can play relatively loud (93 dB)
Bass 100 - 315 Hz
(±) | reduced bass - on average 11.7% lower than median
(±) | linearity of bass is average (9% delta to prev. frequency)
Mids 400 - 2000 Hz
(+) | balanced mids - only 3% away from median
(+) | mids are linear (3.6% delta to prev. frequency)
Highs 2 - 16 kHz
(+) | balanced highs - only 4% away from median
(+) | highs are linear (3.5% delta to prev. frequency)
Overall 100 - 16.000 Hz
(+) | overall sound is linear (13.6% difference to median)
Compared to same class
» 20% of all tested devices in this class were better, 7% similar, 73% worse
» The best had a delta of 6%, average was 18%, worst was 132%
Compared to all devices tested
» 15% of all tested devices were better, 4% similar, 82% worse
» The best had a delta of 4%, average was 23%, worst was 134%
| Off / Standby | |
| Idle | |
| Load |
|
Key:
min: | |
| Asus G701VIK-BA049T GeForce GTX 1080 Mobile, i7-7820HK | MSI GT73VR 7RF-296 GeForce GTX 1080 Mobile, i7-7820HK | Aorus X7 DT v6 GeForce GTX 1080 Mobile, 6820HK | Asus G752VS-XB78K GeForce GTX 1070 Mobile, 6820HK | MSI GT72VR 7RE-433 GeForce GTX 1070 Mobile, i7-7700HQ | Acer Predator 17 G9-793-77LG GeForce GTX 1070 Mobile, 6700HQ | |
|---|---|---|---|---|---|---|
| Power Consumption | -7% | -24% | 9% | 21% | -3% | |
| Idle Minimum * (Watt) | 24 | 29 -21% | 31.5 -31% | 24 -0% | 20 17% | 25 -4% |
| Idle Average * (Watt) | 31 | 35 -13% | 33.9 -9% | 31 -0% | 27 13% | 35 -13% |
| Idle Maximum * (Watt) | 38 | 40 -5% | 34.6 9% | 36 5% | 31 18% | 46 -21% |
| Load Average * (Watt) | 98 | 94 4% | 205.6 -110% | 94 4% | 86 12% | 103 -5% |
| Load Maximum * (Watt) | 320 | 315 2% | 250.8 22% | 204 36% | 184 43% | 223 30% |
* ... smaller is better
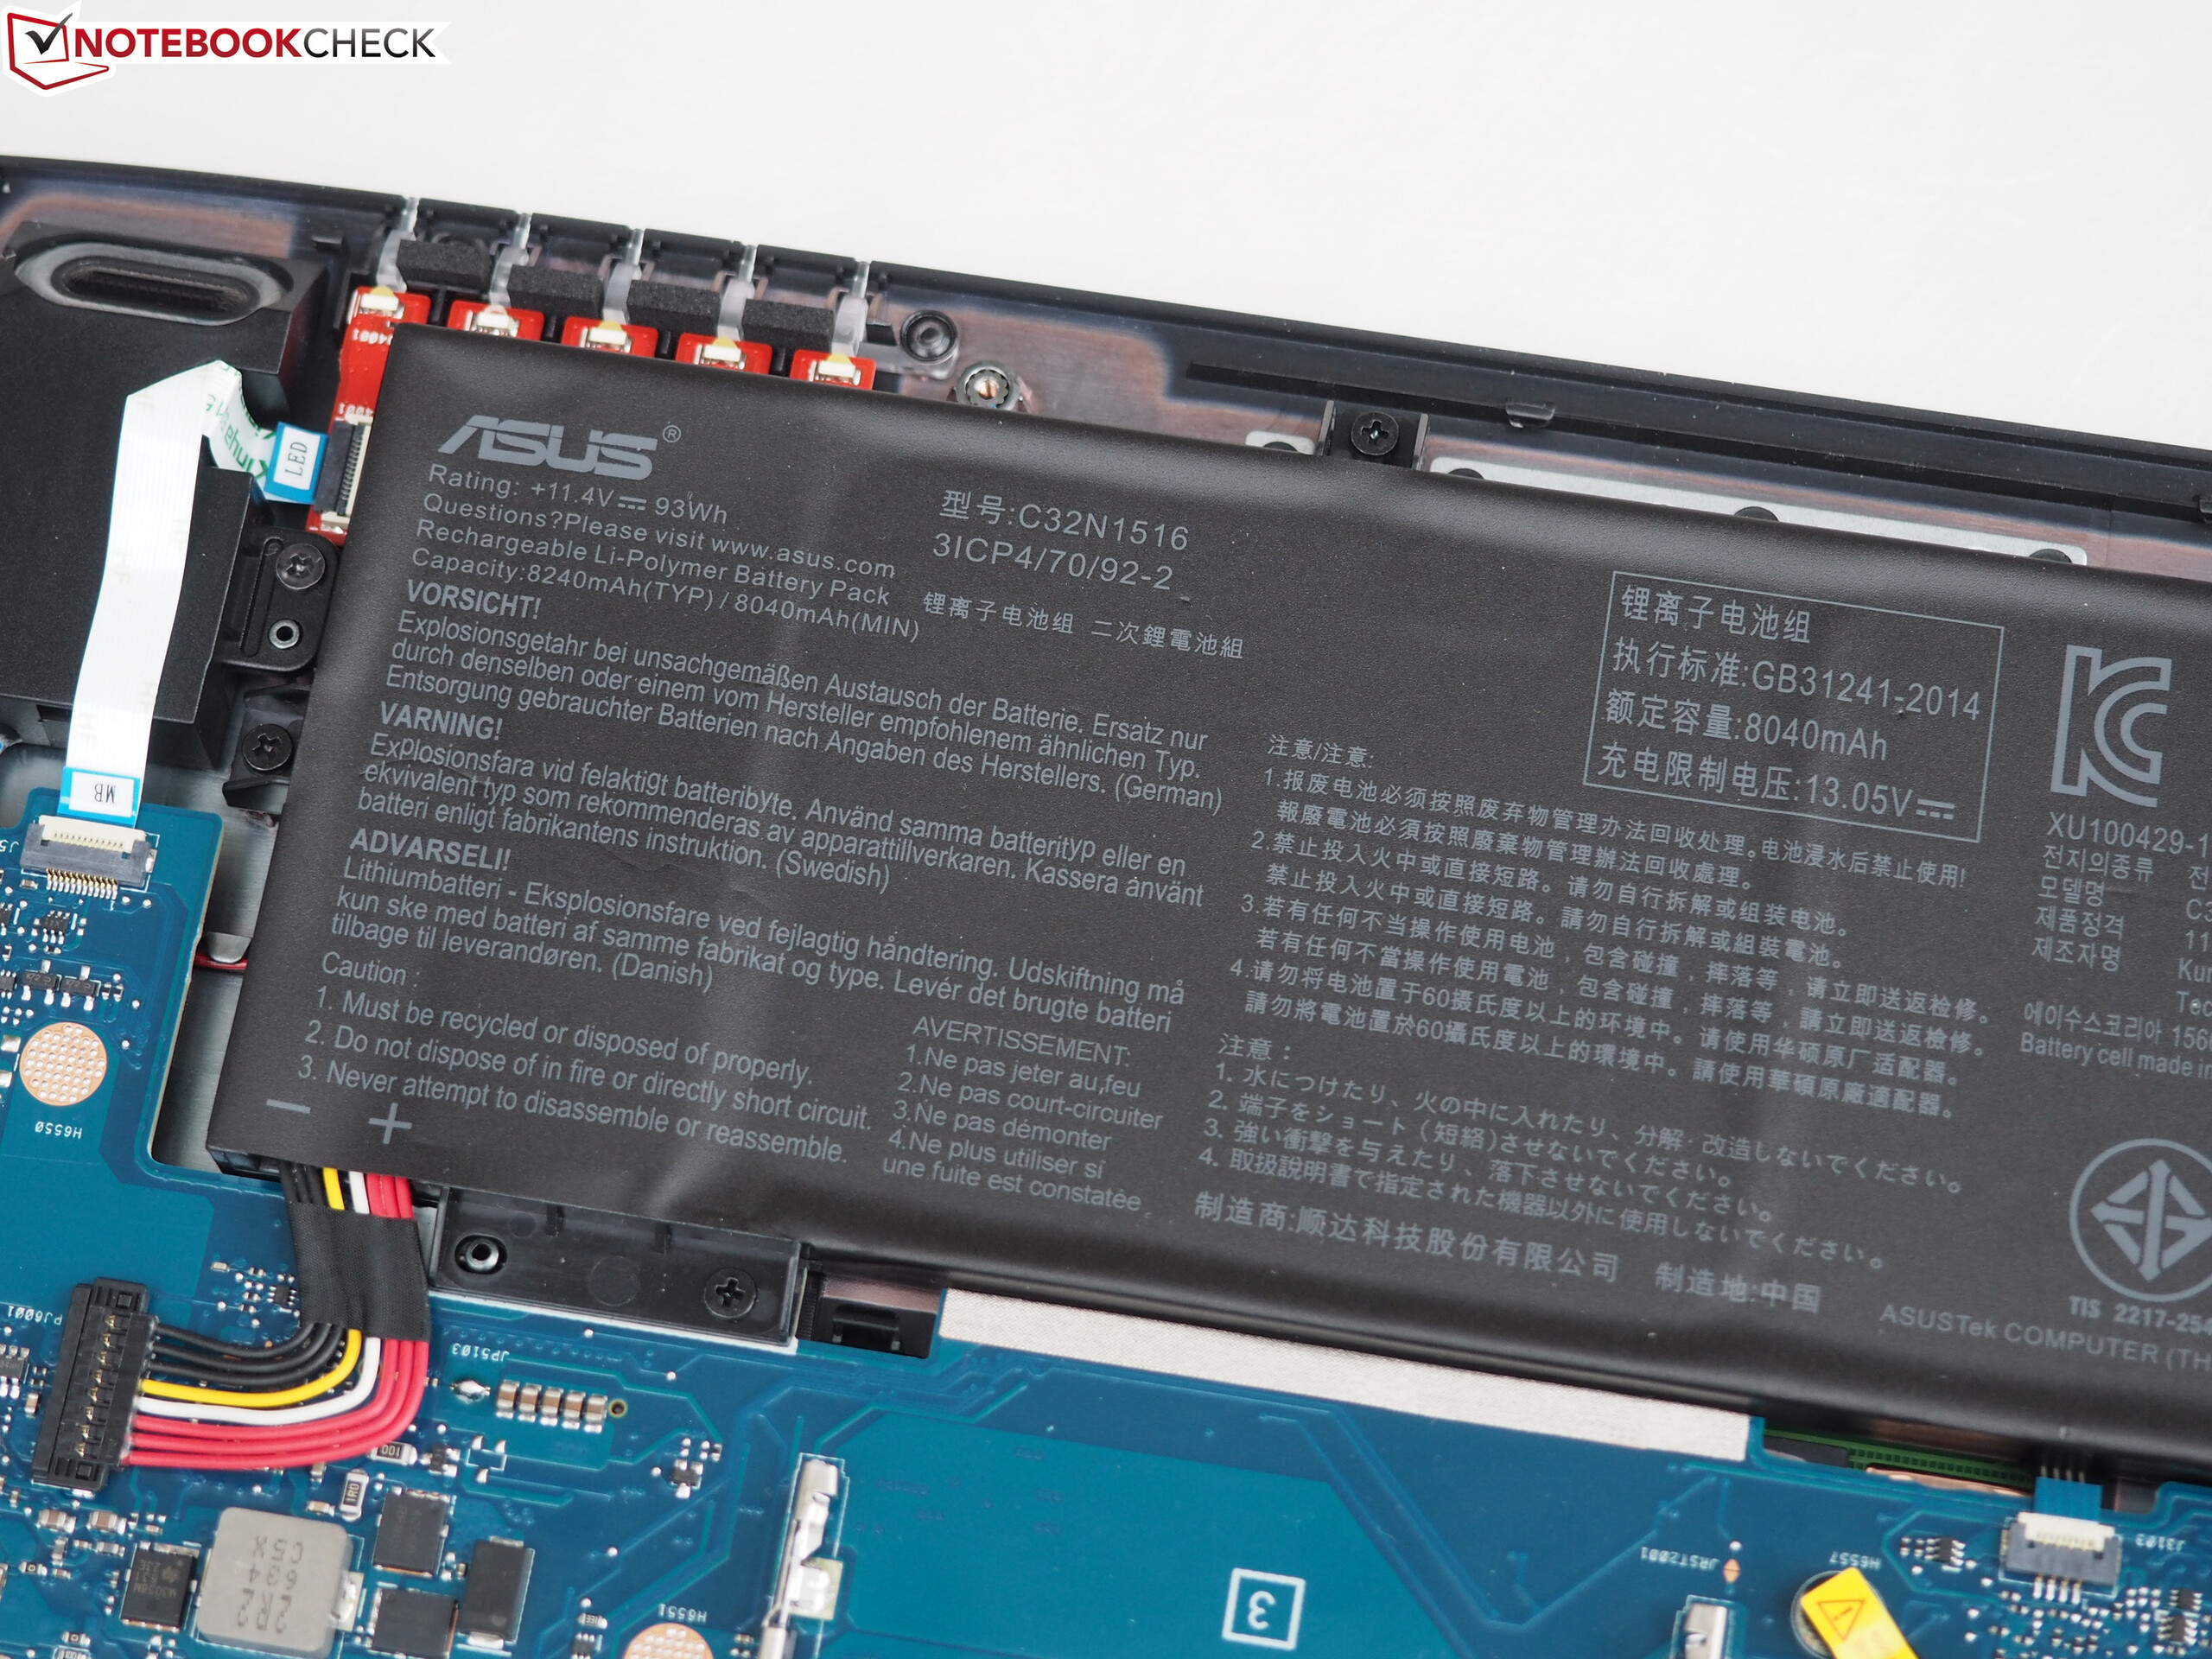
| Asus G701VIK-BA049T GeForce GTX 1080 Mobile, i7-7820HK, 93 Wh | MSI GT73VR 7RF-296 GeForce GTX 1080 Mobile, i7-7820HK, 75.2 Wh | Aorus X7 DT v6 GeForce GTX 1080 Mobile, 6820HK, 94 Wh | Asus G752VS-XB78K GeForce GTX 1070 Mobile, 6820HK, 90 Wh | MSI GT72VR 7RE-433 GeForce GTX 1070 Mobile, i7-7700HQ, 83 Wh | Acer Predator 17 G9-793-77LG GeForce GTX 1070 Mobile, 6700HQ, 88 Wh | |
|---|---|---|---|---|---|---|
| Battery runtime | -32% | -24% | -7% | -2% | -10% | |
| Reader / Idle (h) | 5.7 | 3 -47% | 5.2 -9% | 5.3 -7% | 4.6 -19% | |
| WiFi v1.3 (h) | 4 | 2.7 -32% | 2.4 -40% | 3.5 -12% | 3.8 -5% | 3.3 -17% |
| Load (h) | 1.4 | 1.6 14% | 1.4 0% | 1.5 7% | 1.5 7% | |
| H.264 (h) | 2.4 | 3.1 | 3.8 |
Pros
Cons

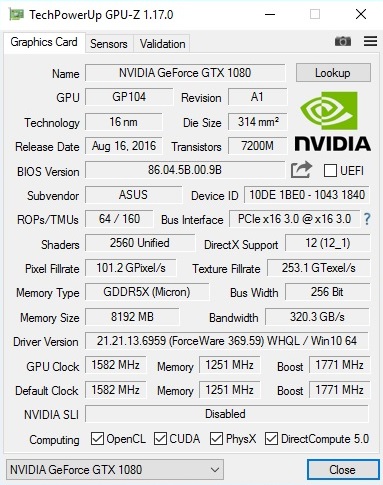
只评价性能的话,华硕在G701做对了所有应该做的事。通过CPU与GPU超频,这台17英寸的怪兽把它的竞争对手们打得落花流水。所有的游戏都能在全高清屏幕(120Hz+G-Sync)上以最高解析度与多倍抗锯齿的画质流畅运行。它的性能甚至能够成熟超高清分辨率的考验,即3840x2160的分辨率。
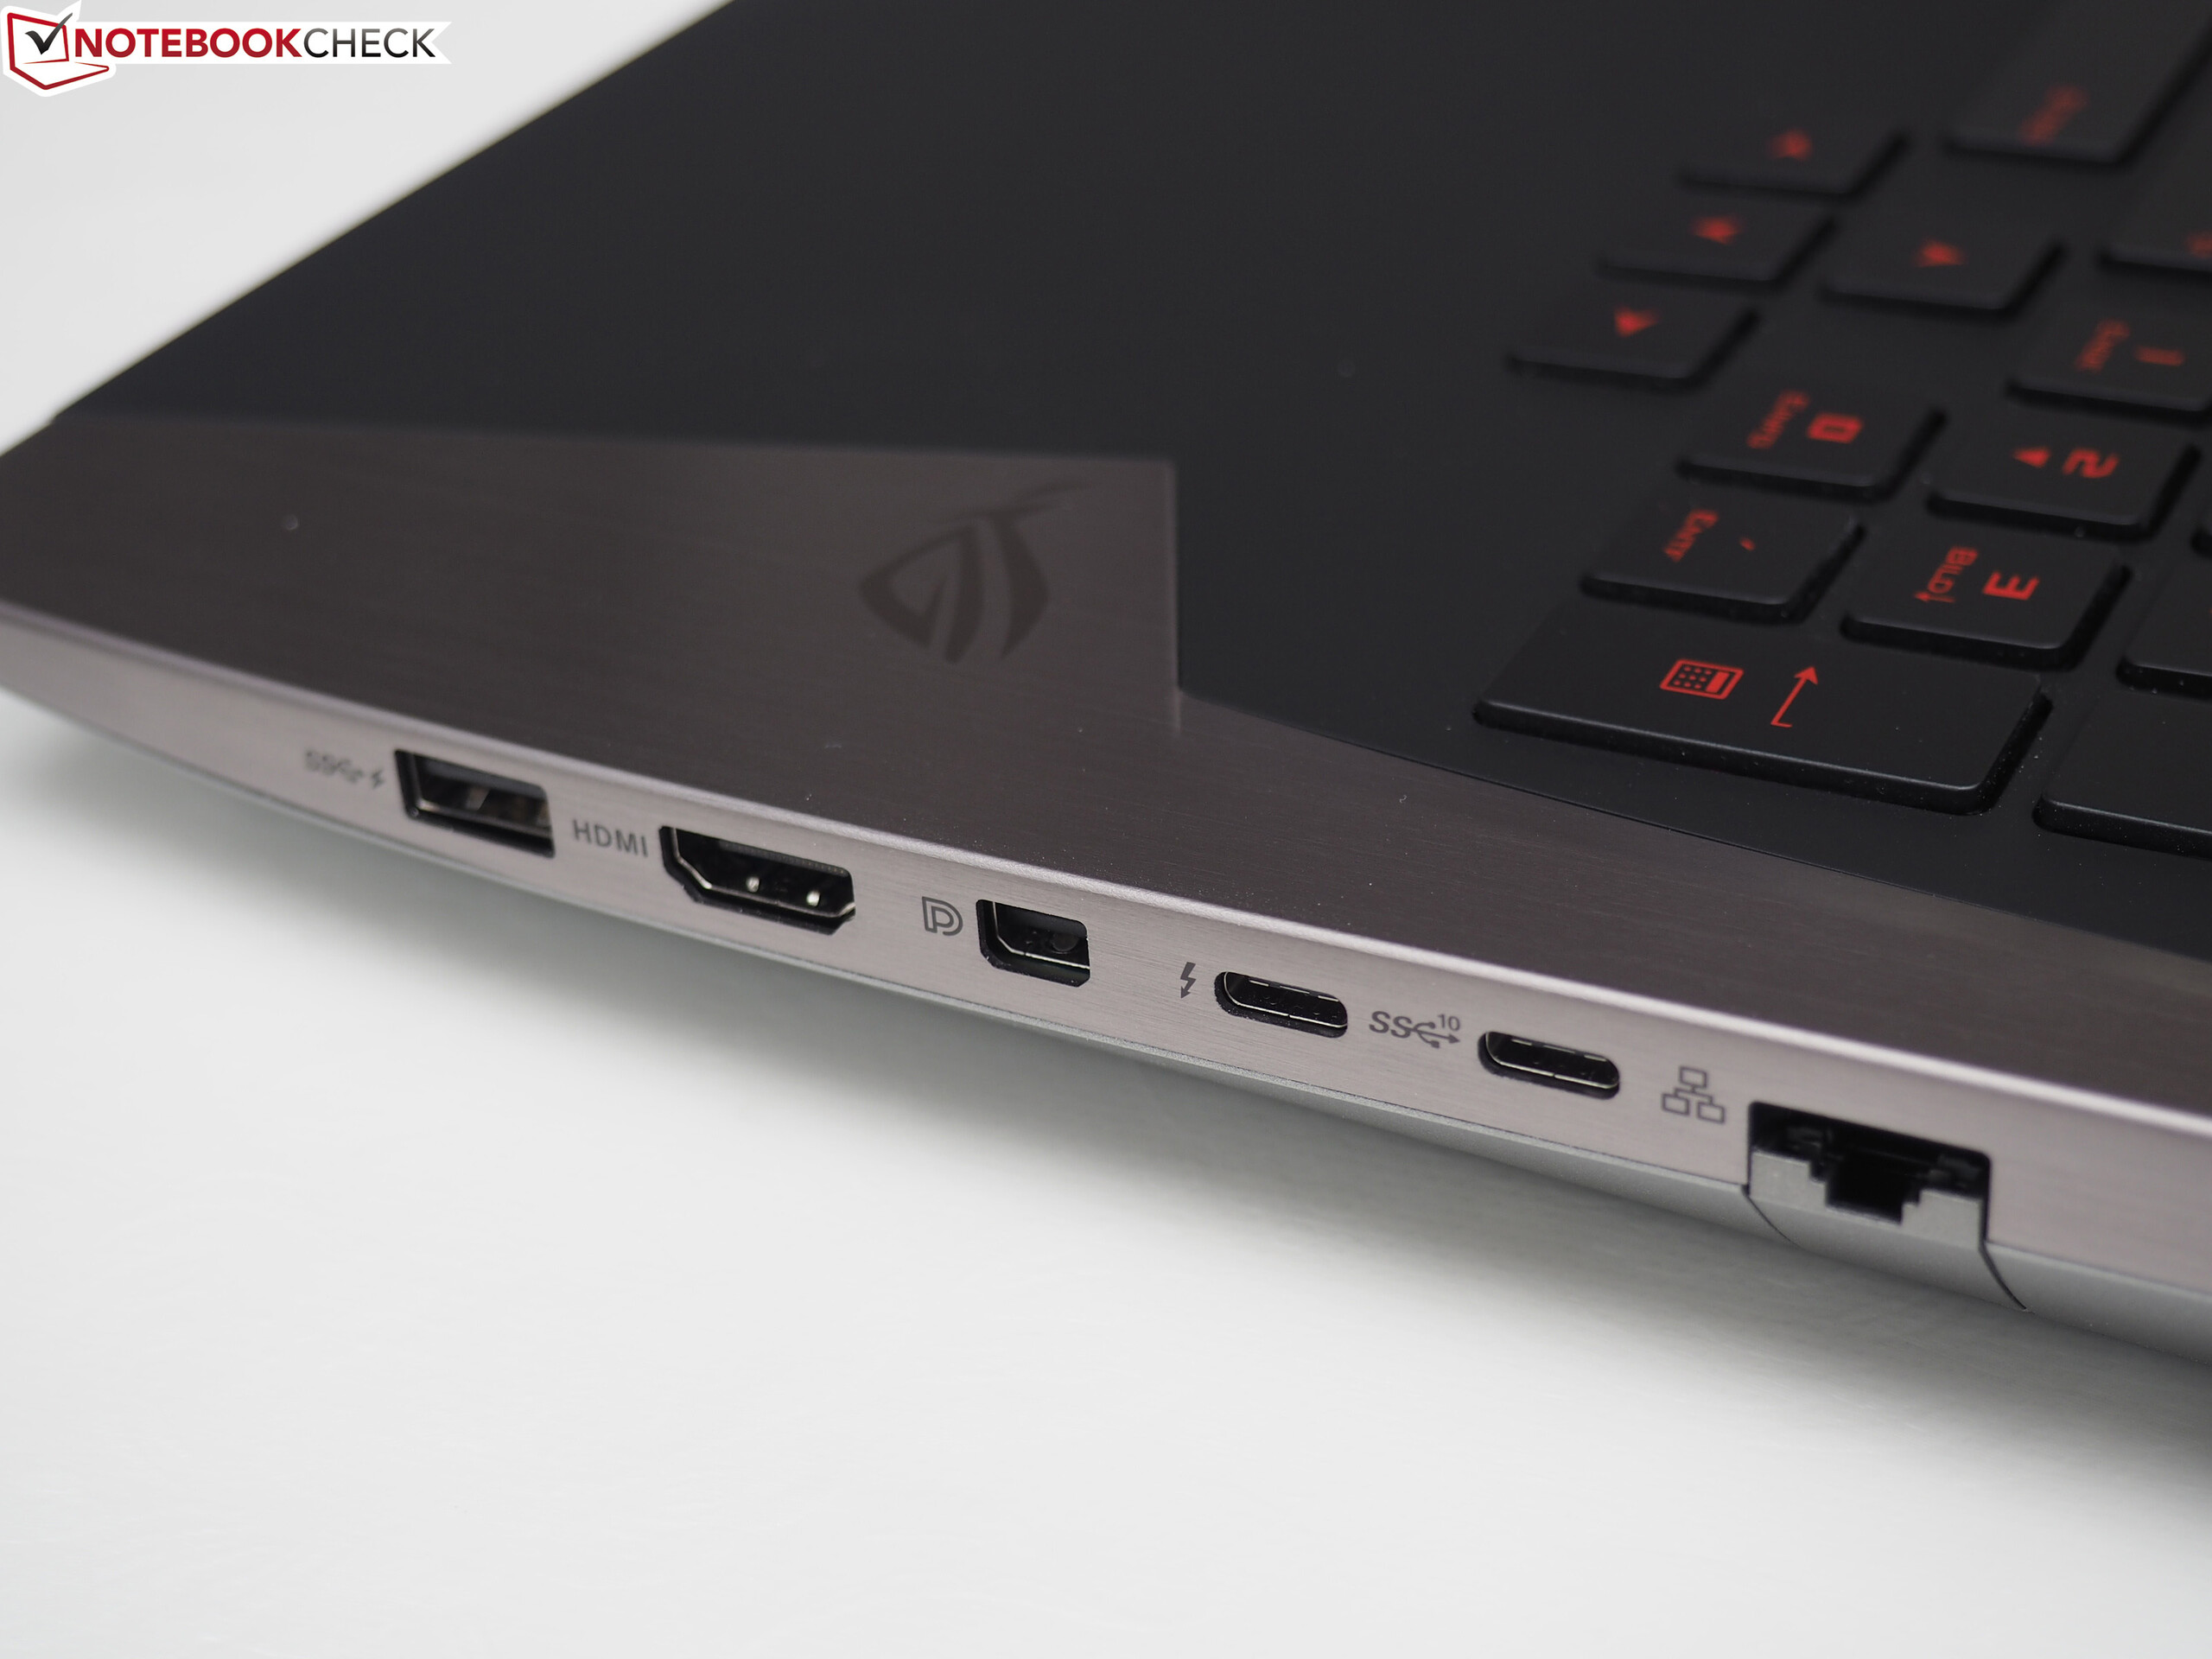
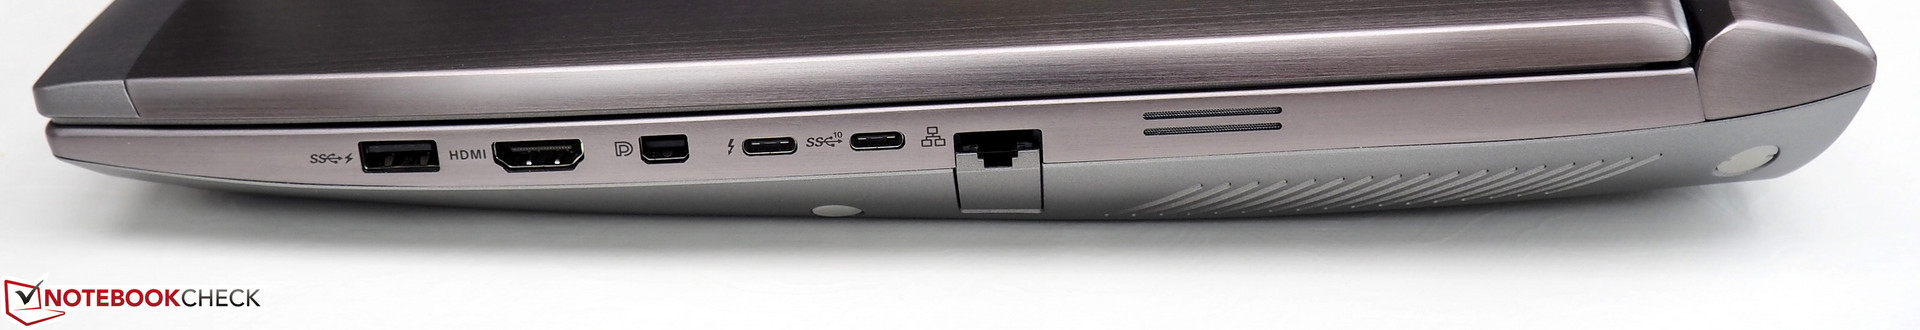
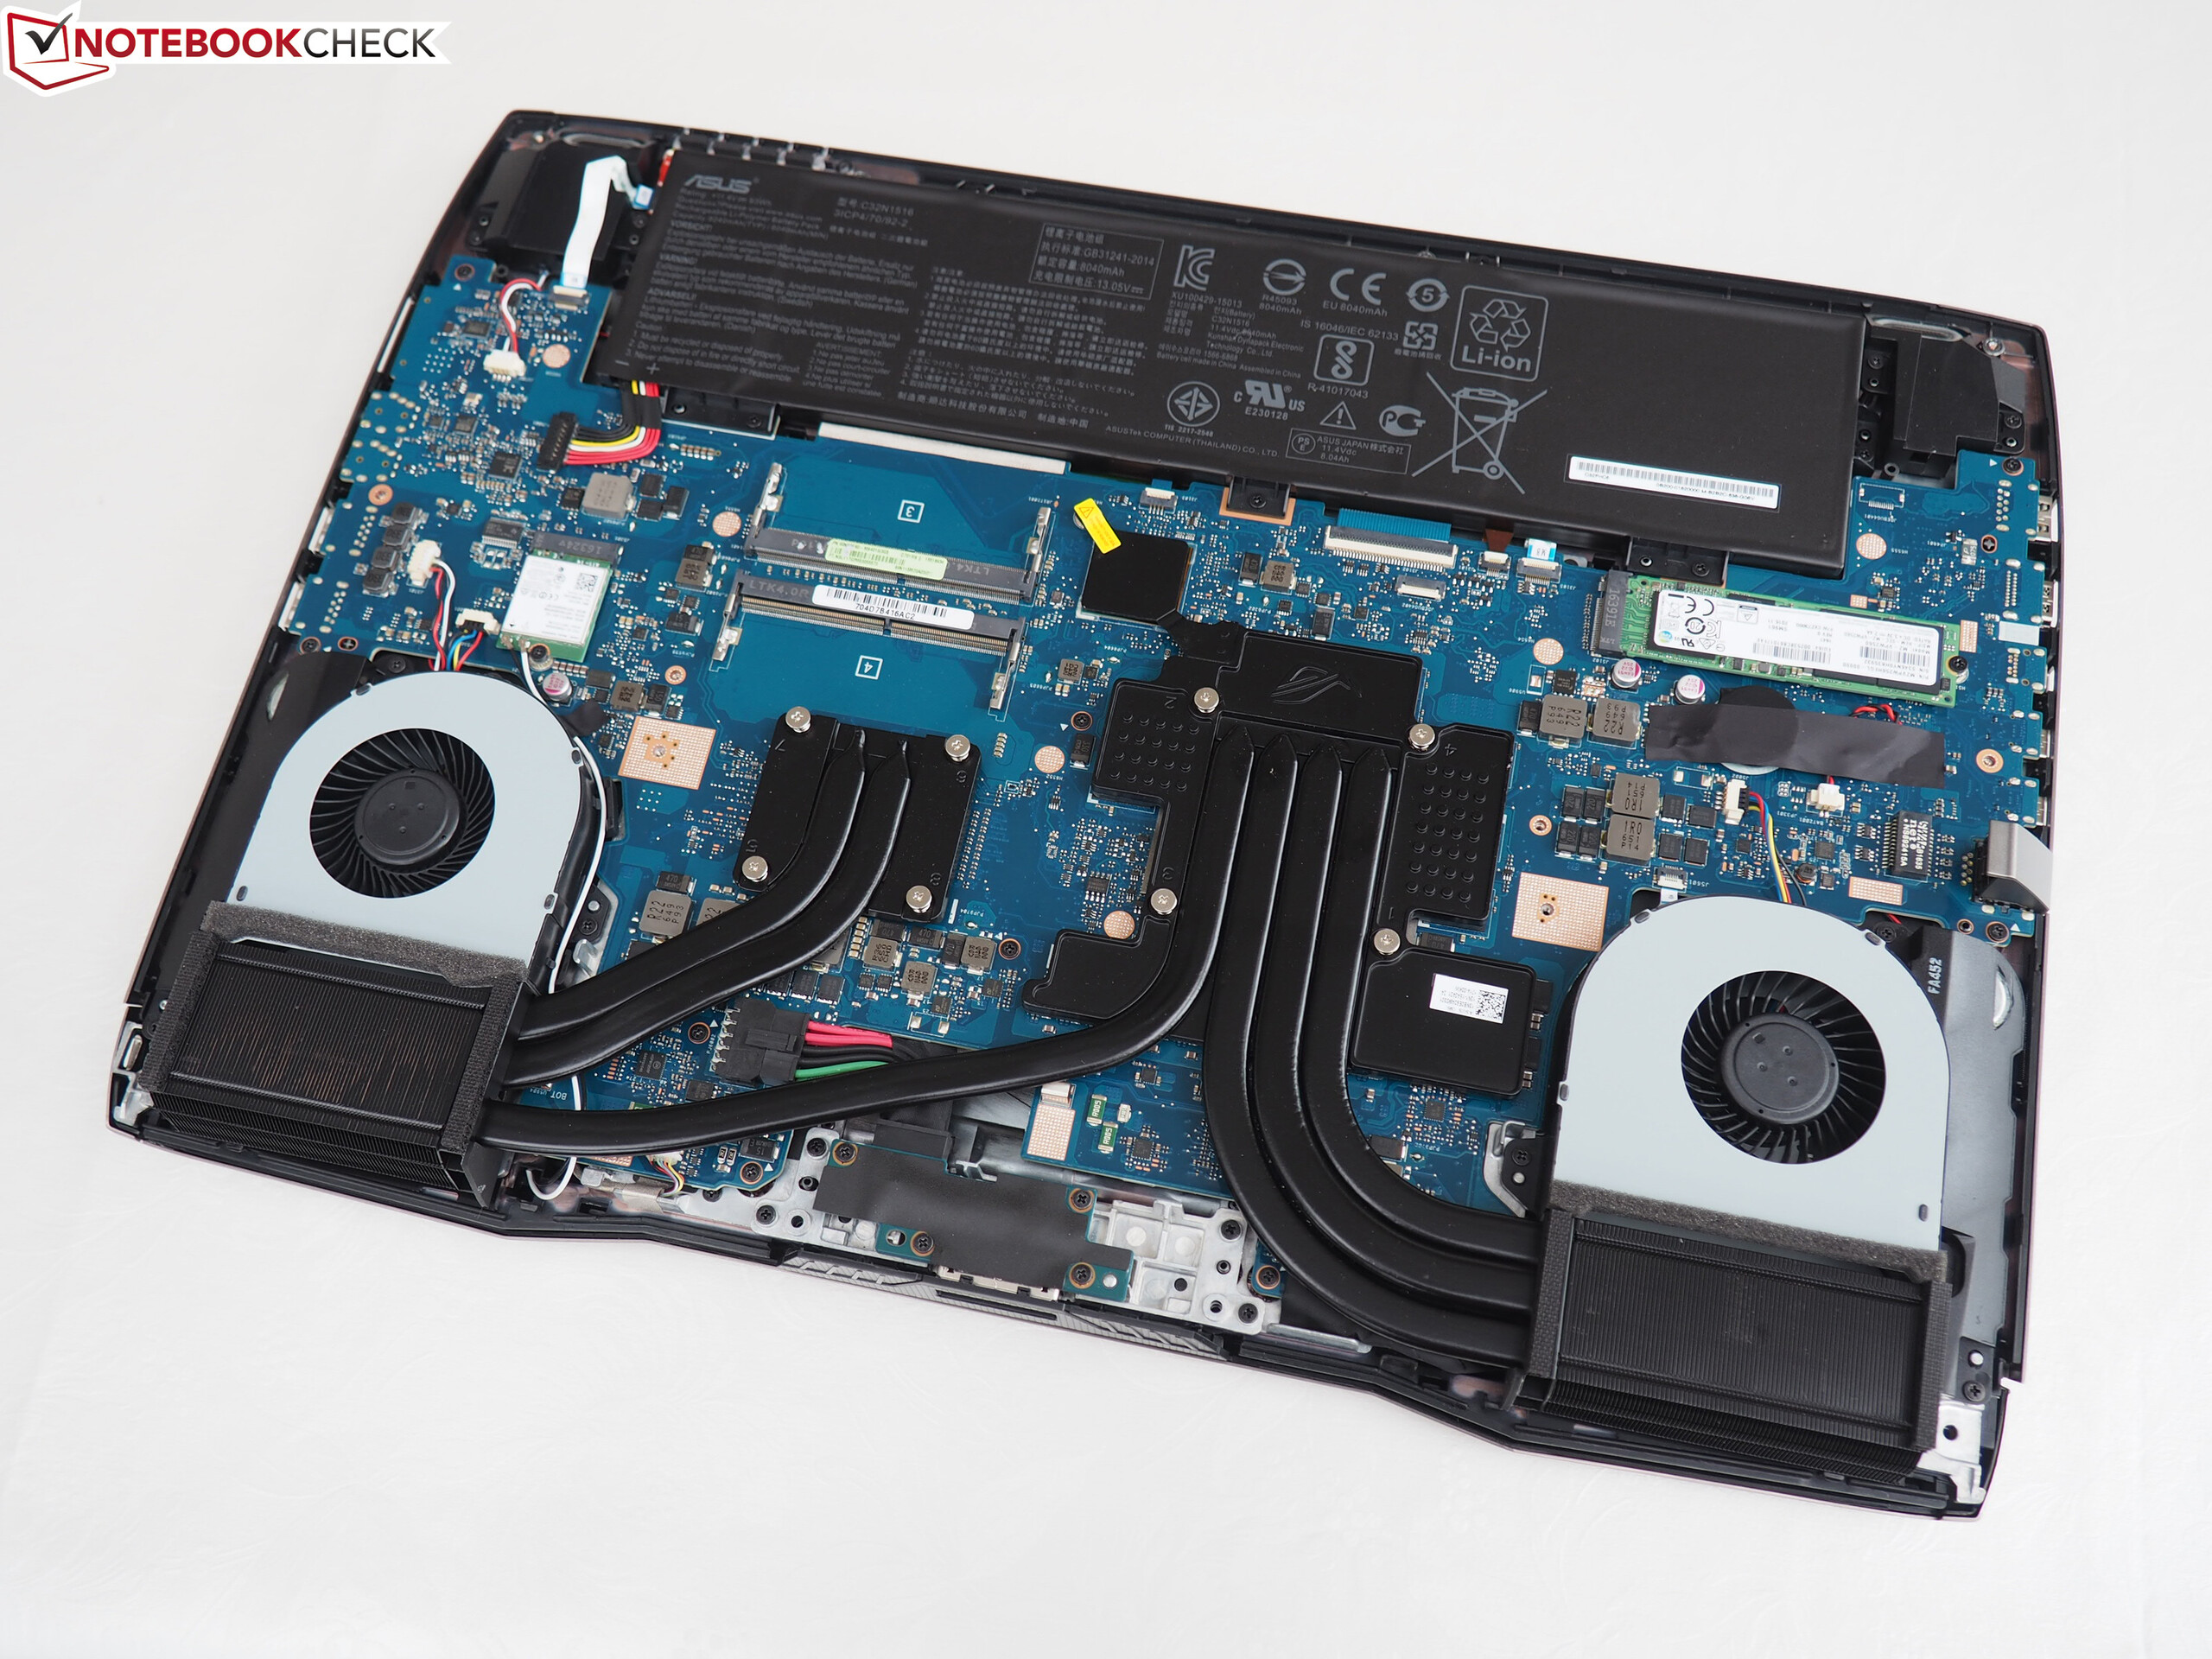
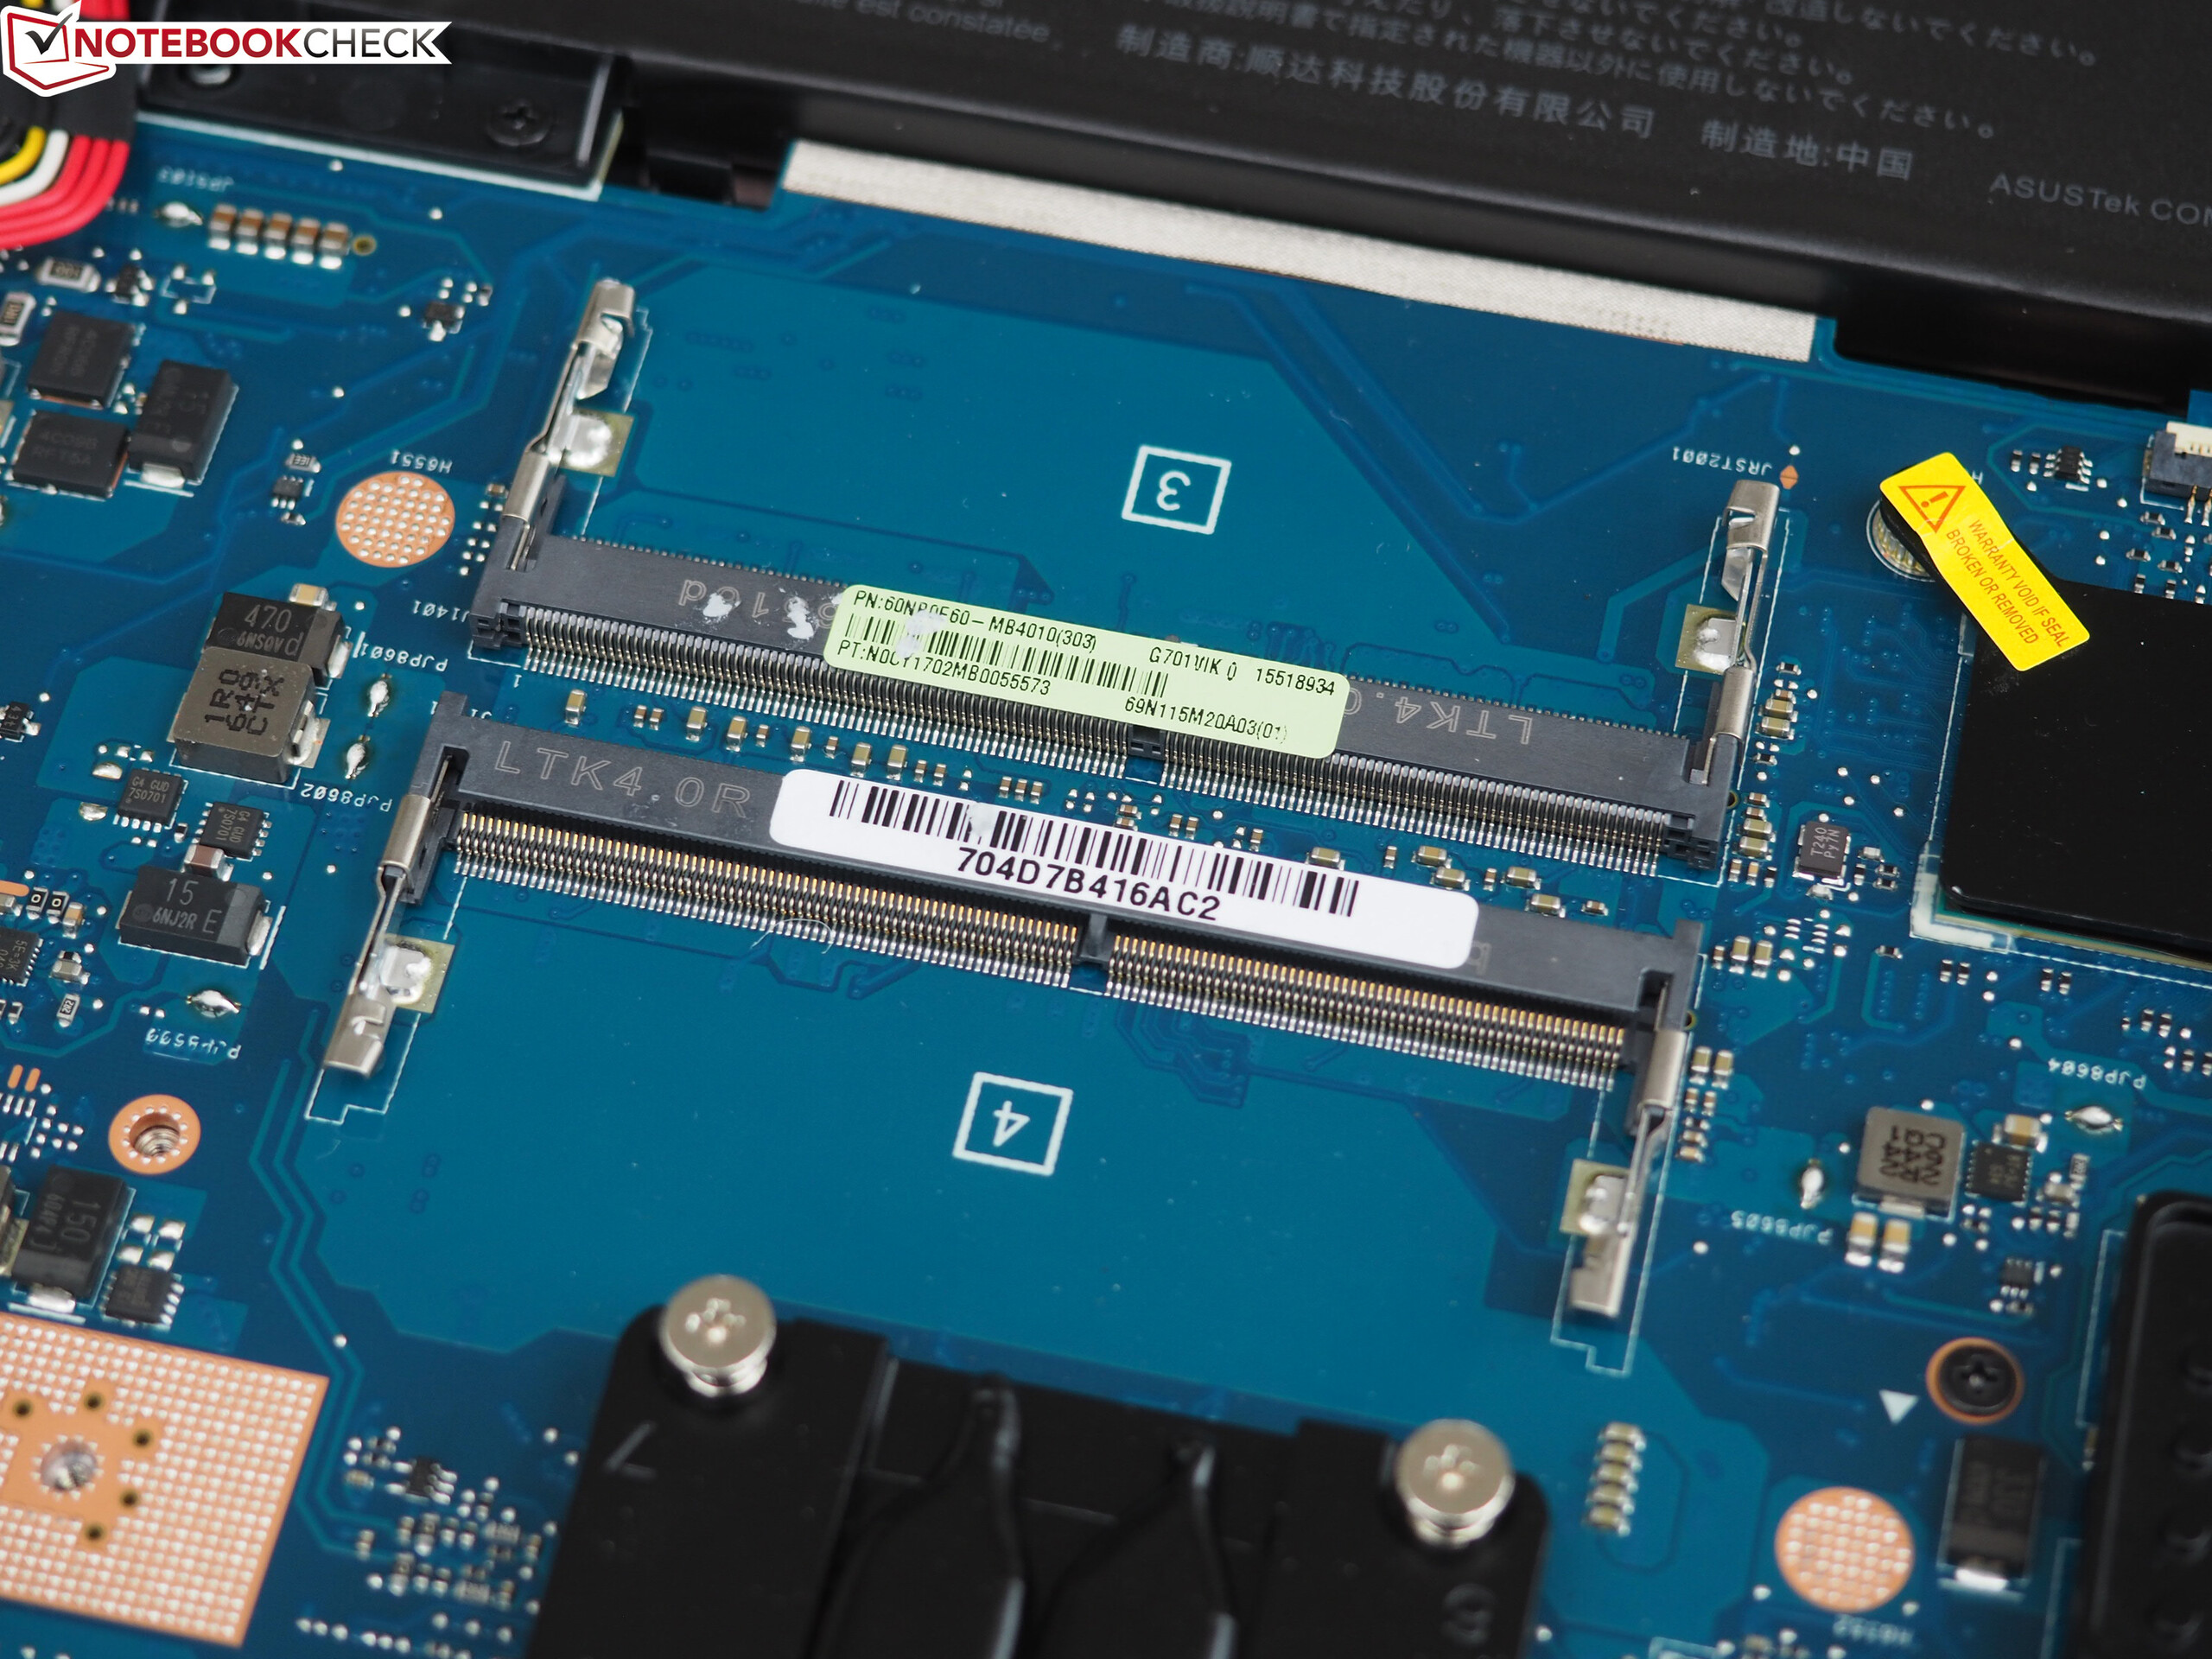
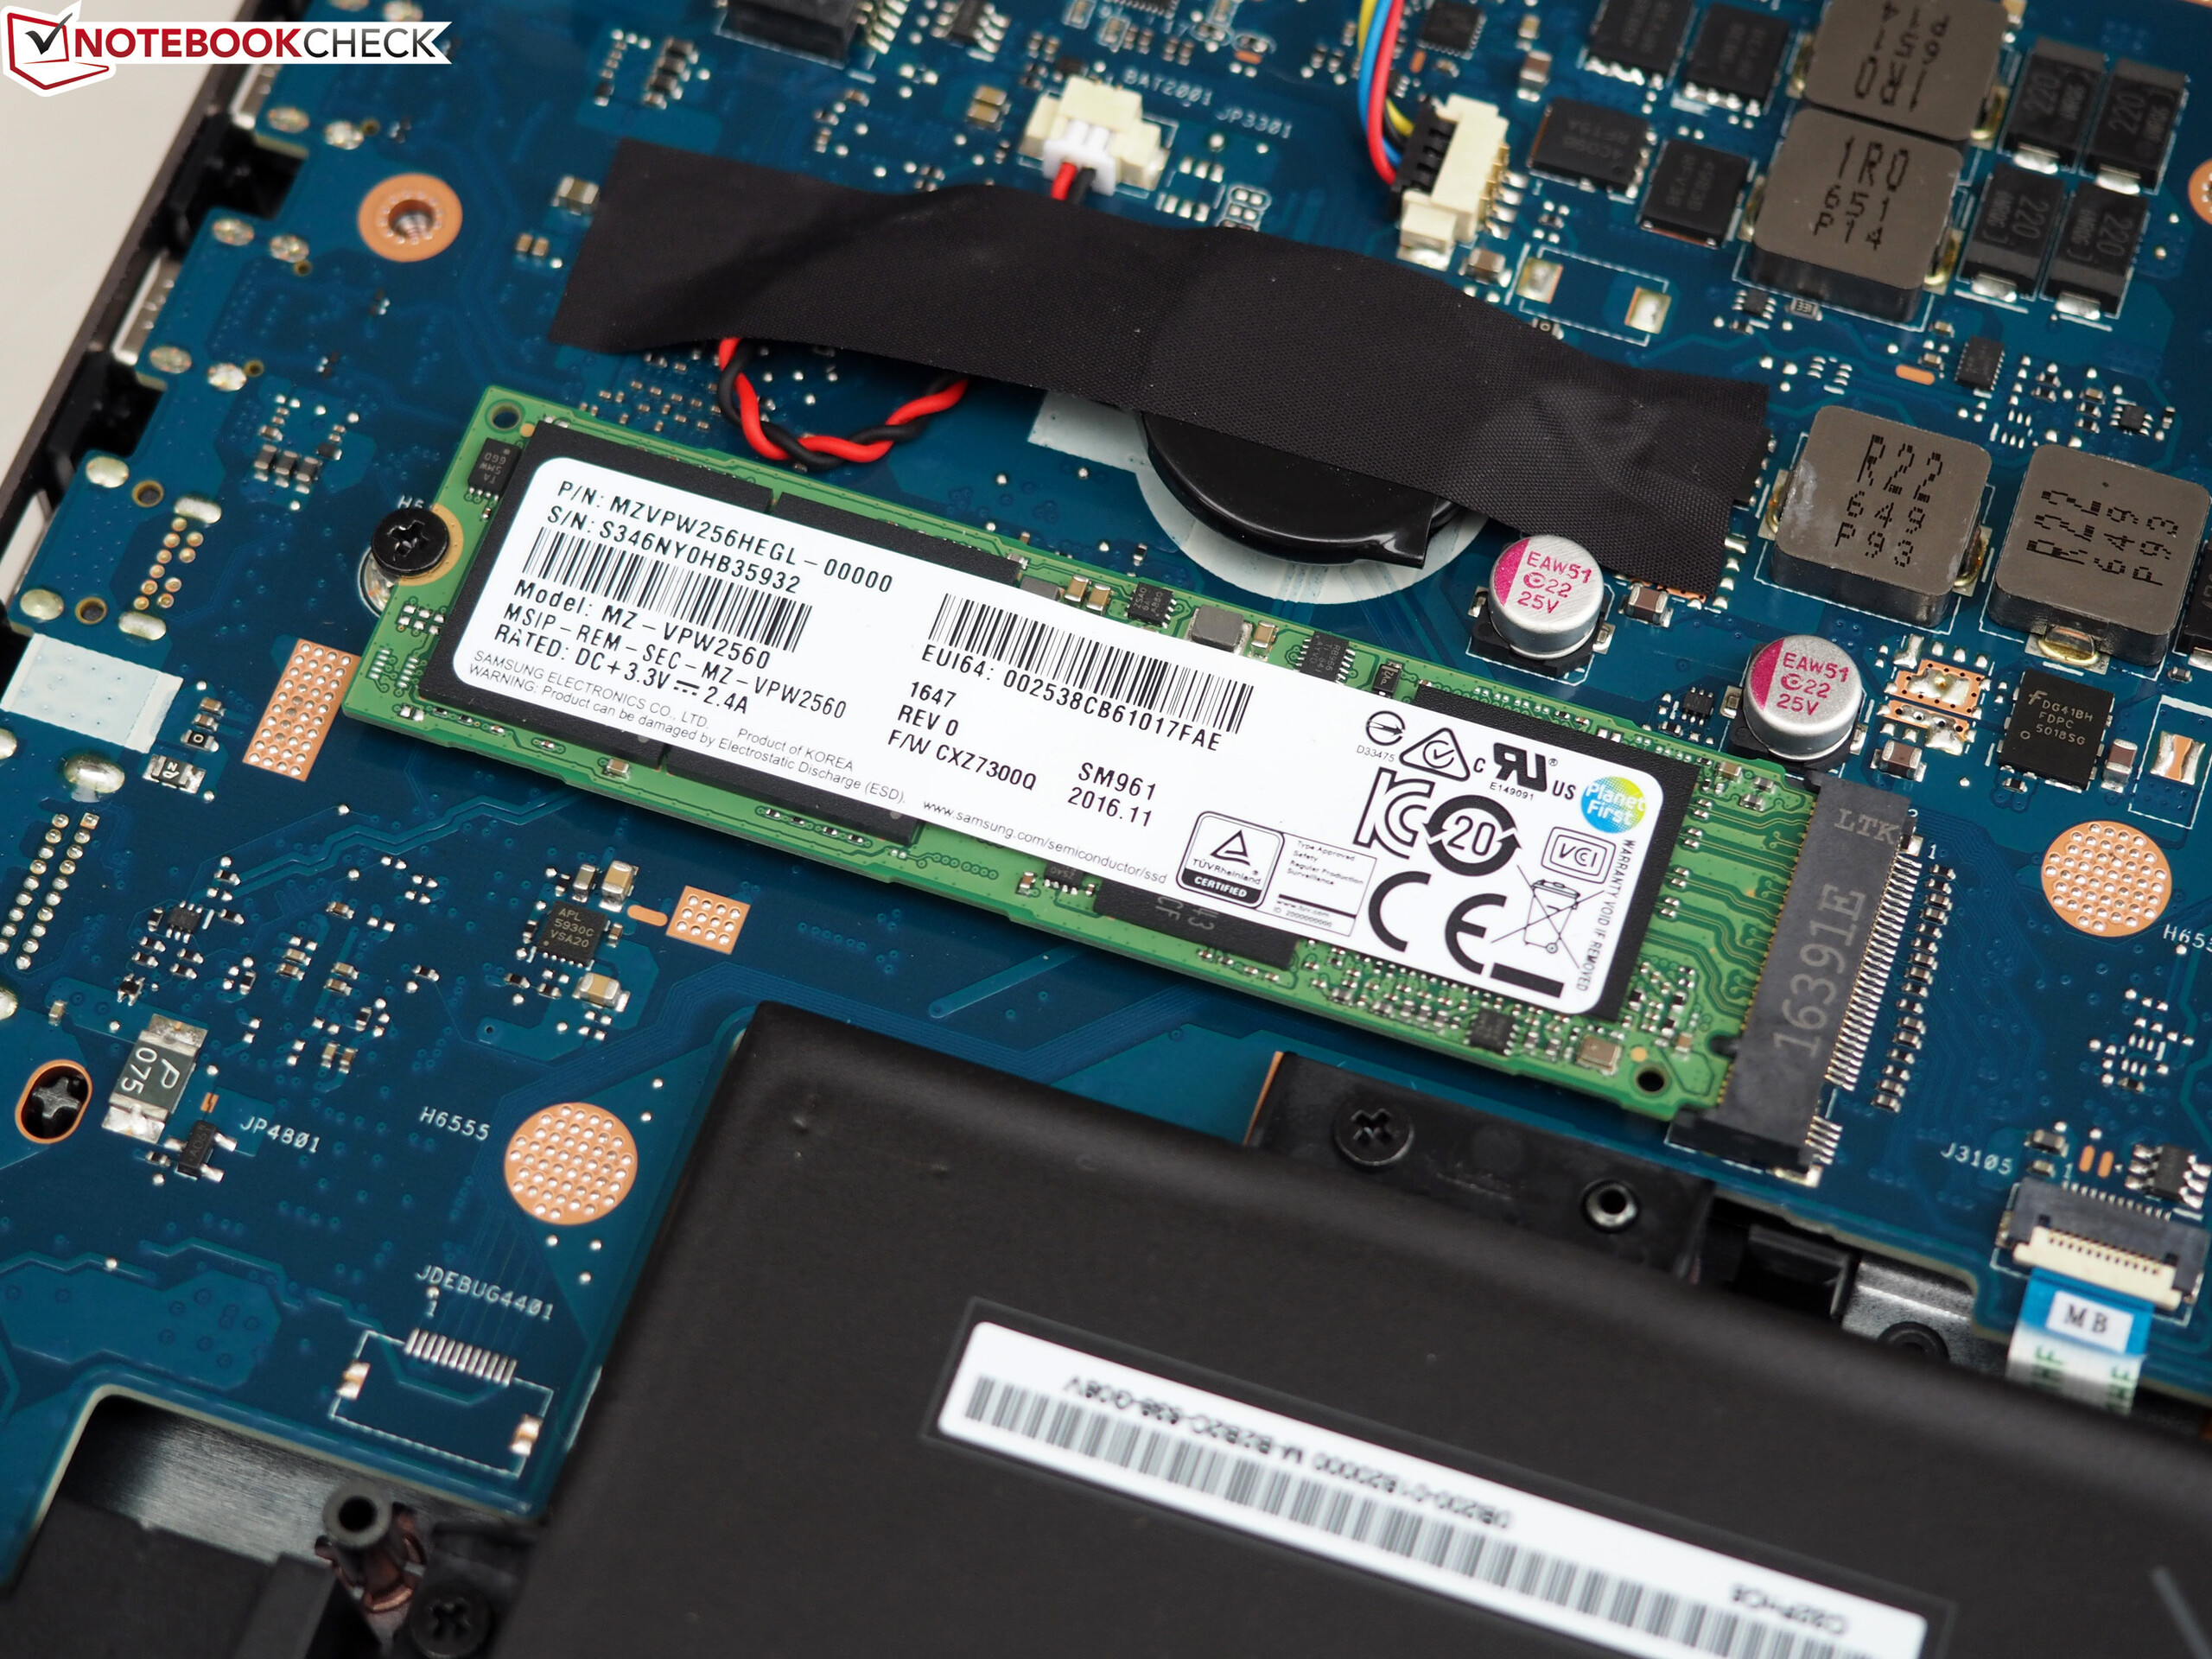
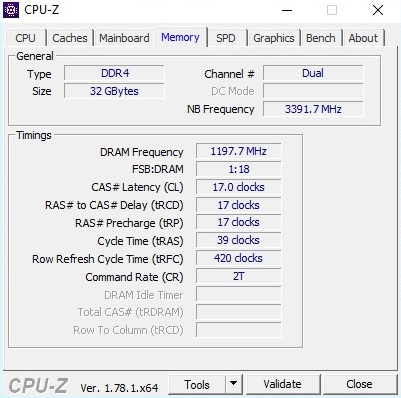
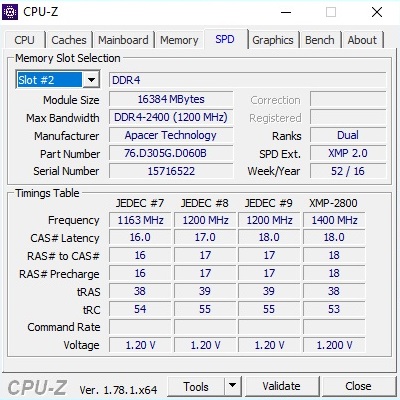
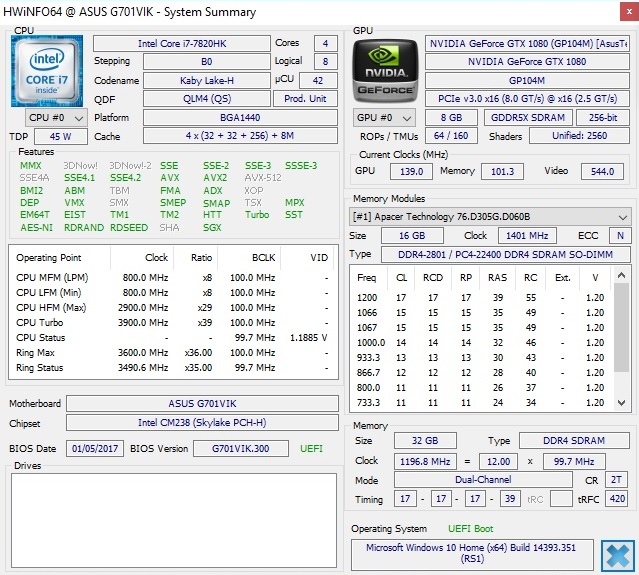
G701的配置也能够出色应对其他任务:32 GB DDR4内存以及双PCI固态硬盘阵列(总容量512 GB)保证了系统能够十分流畅地运行。由于Thunderbolt 3接口的加入,用户能在未来有更多的扩展空间(关键词:外置显卡)。
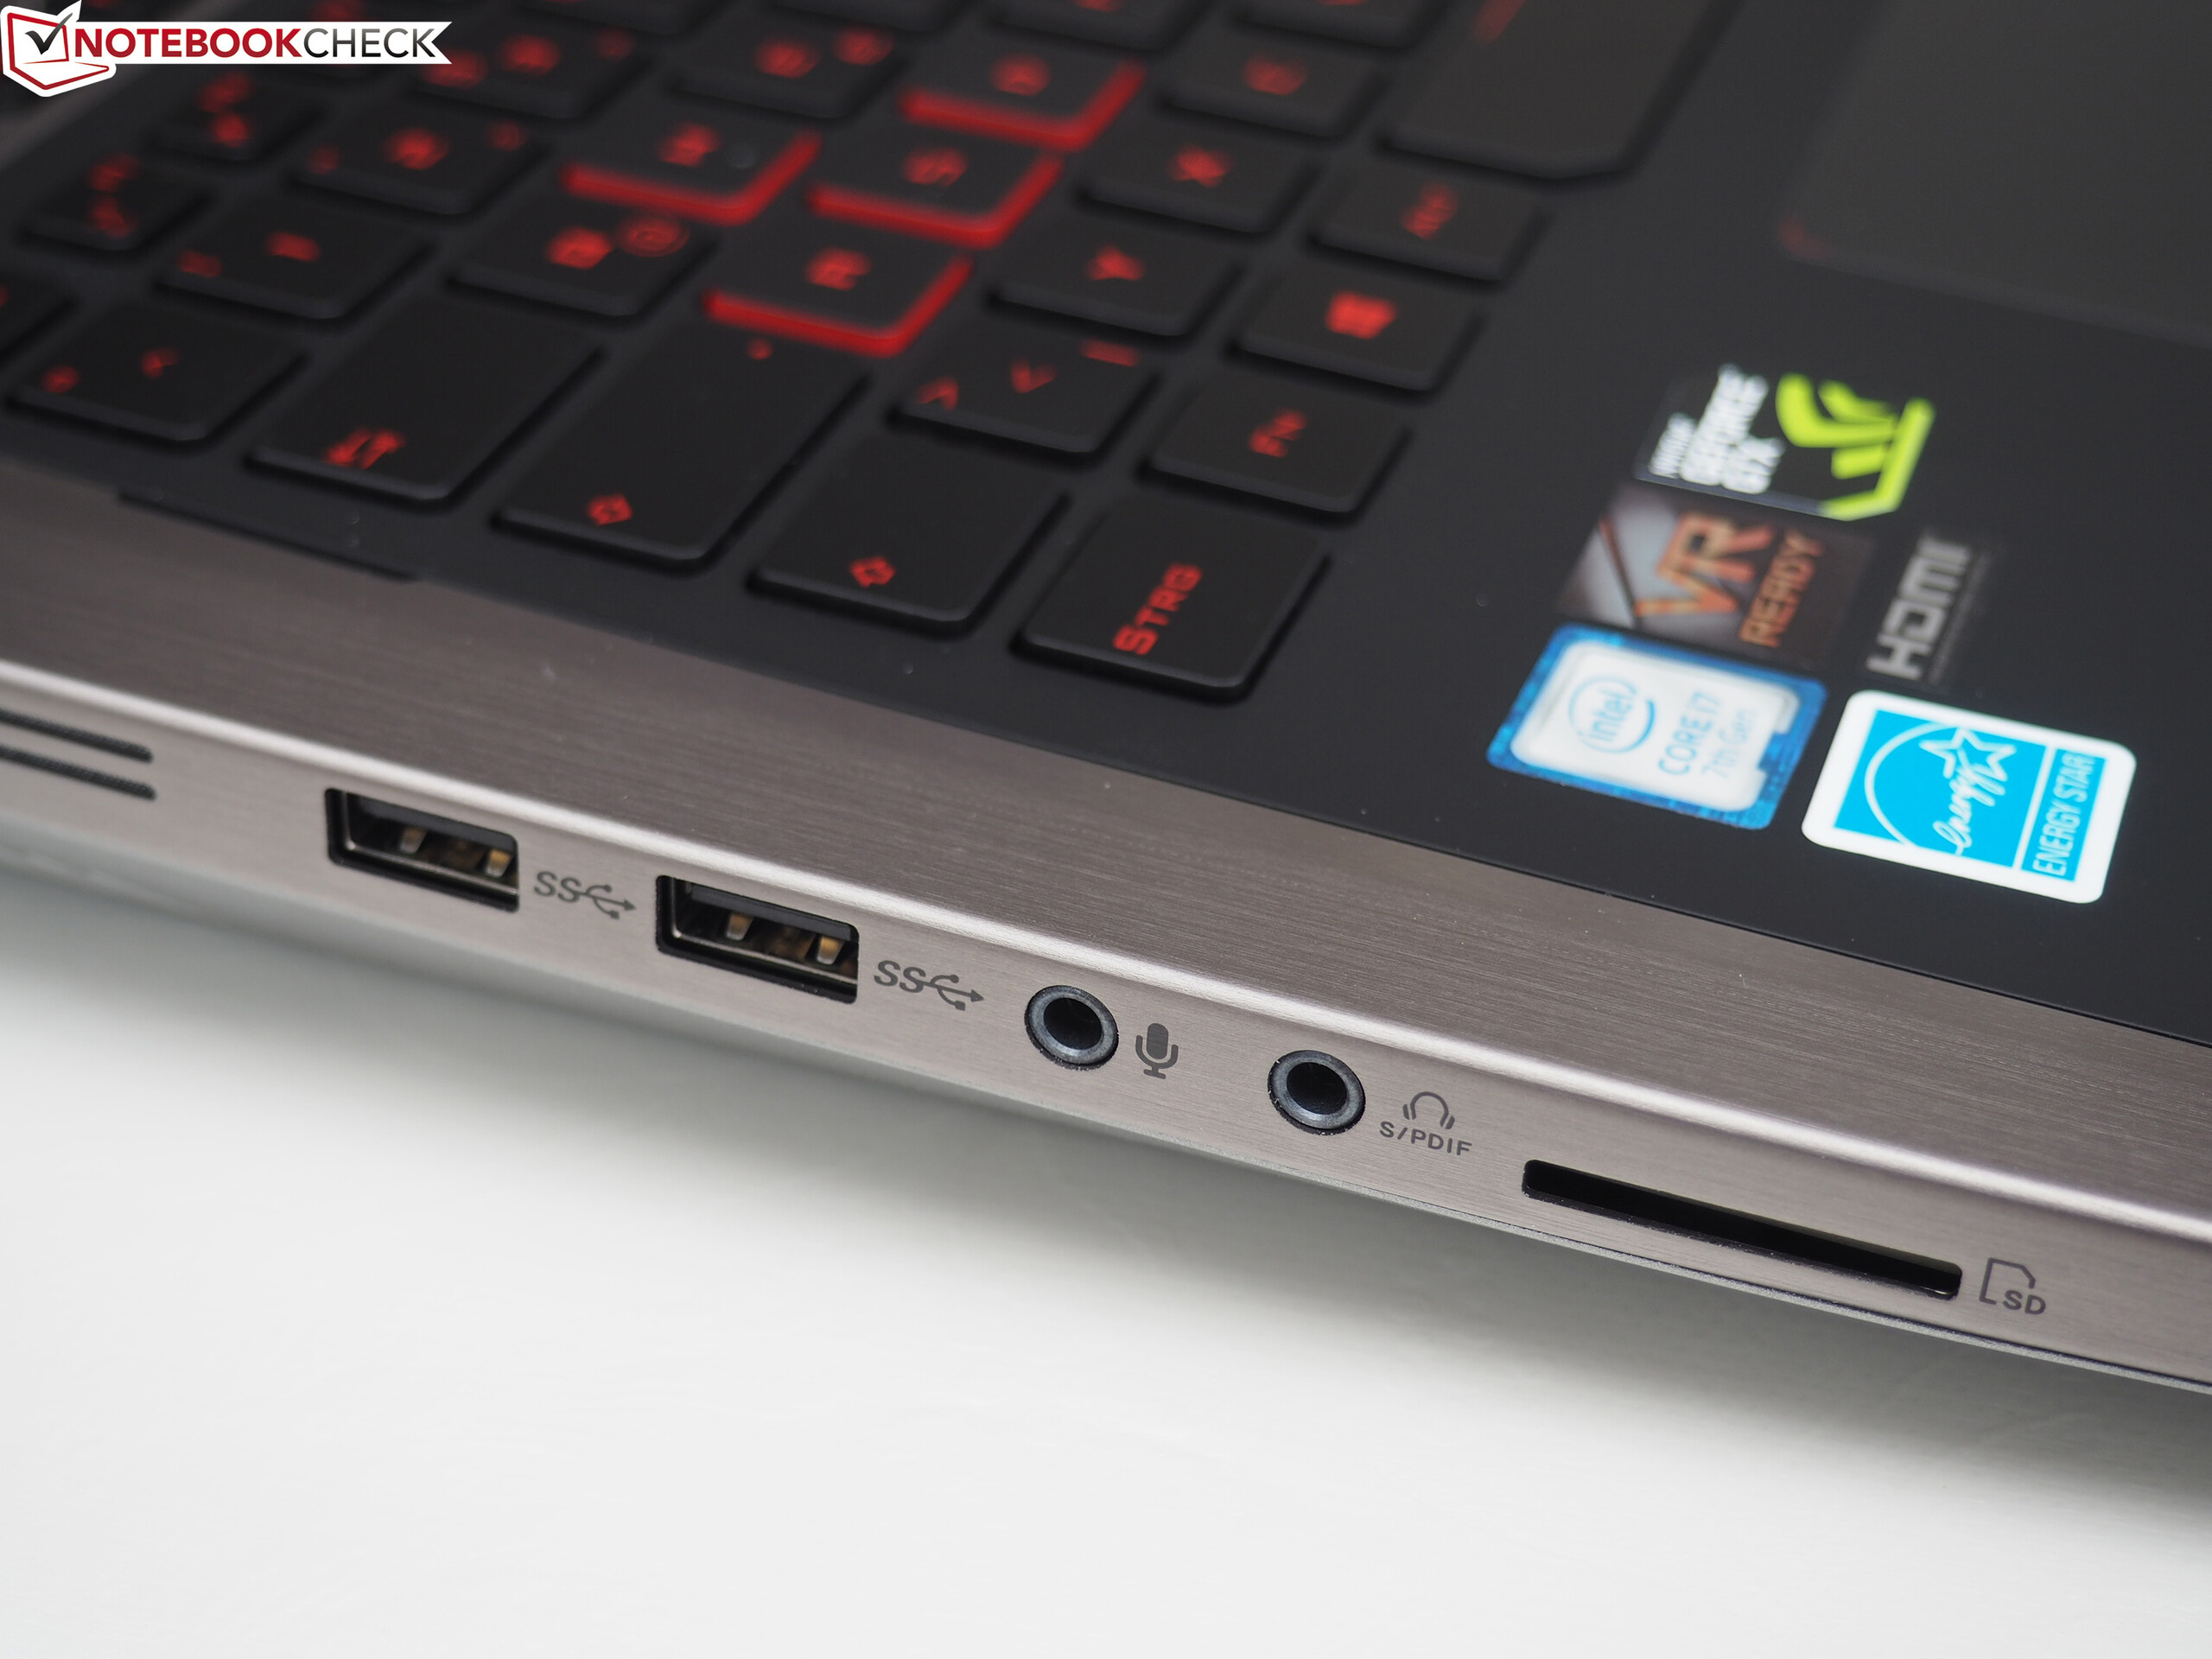
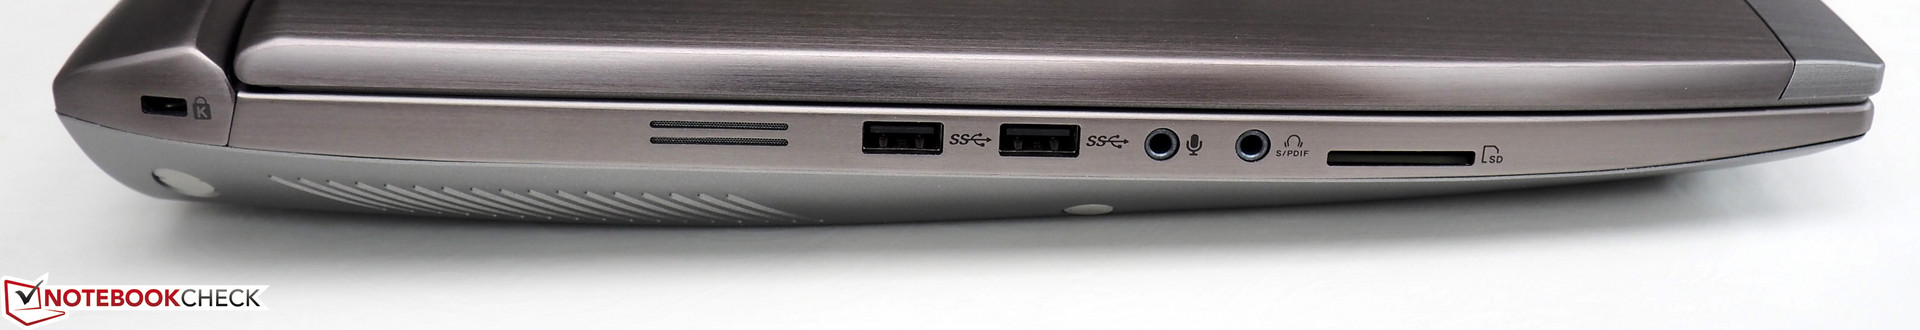
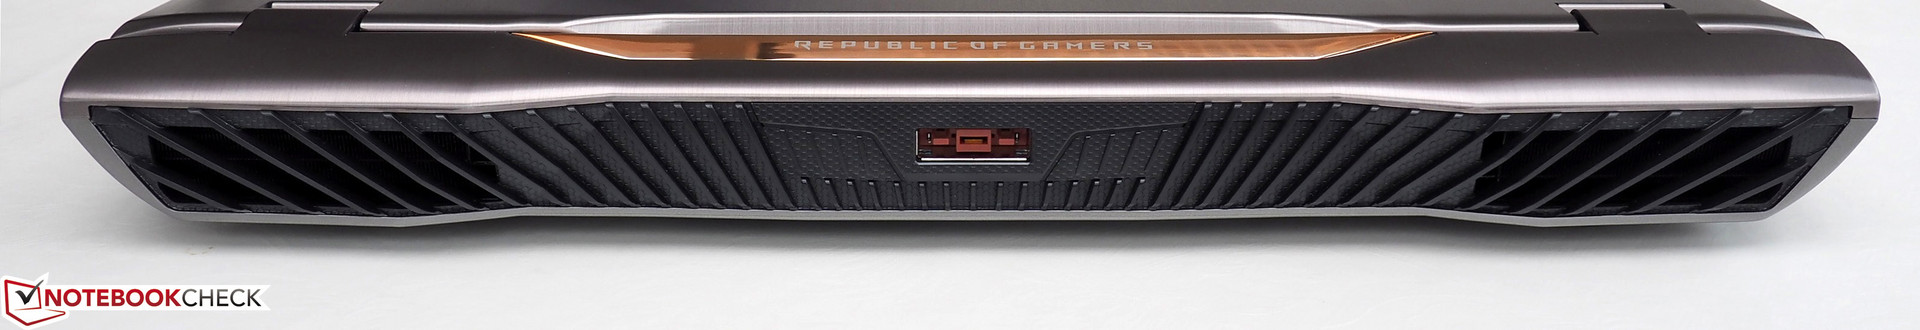
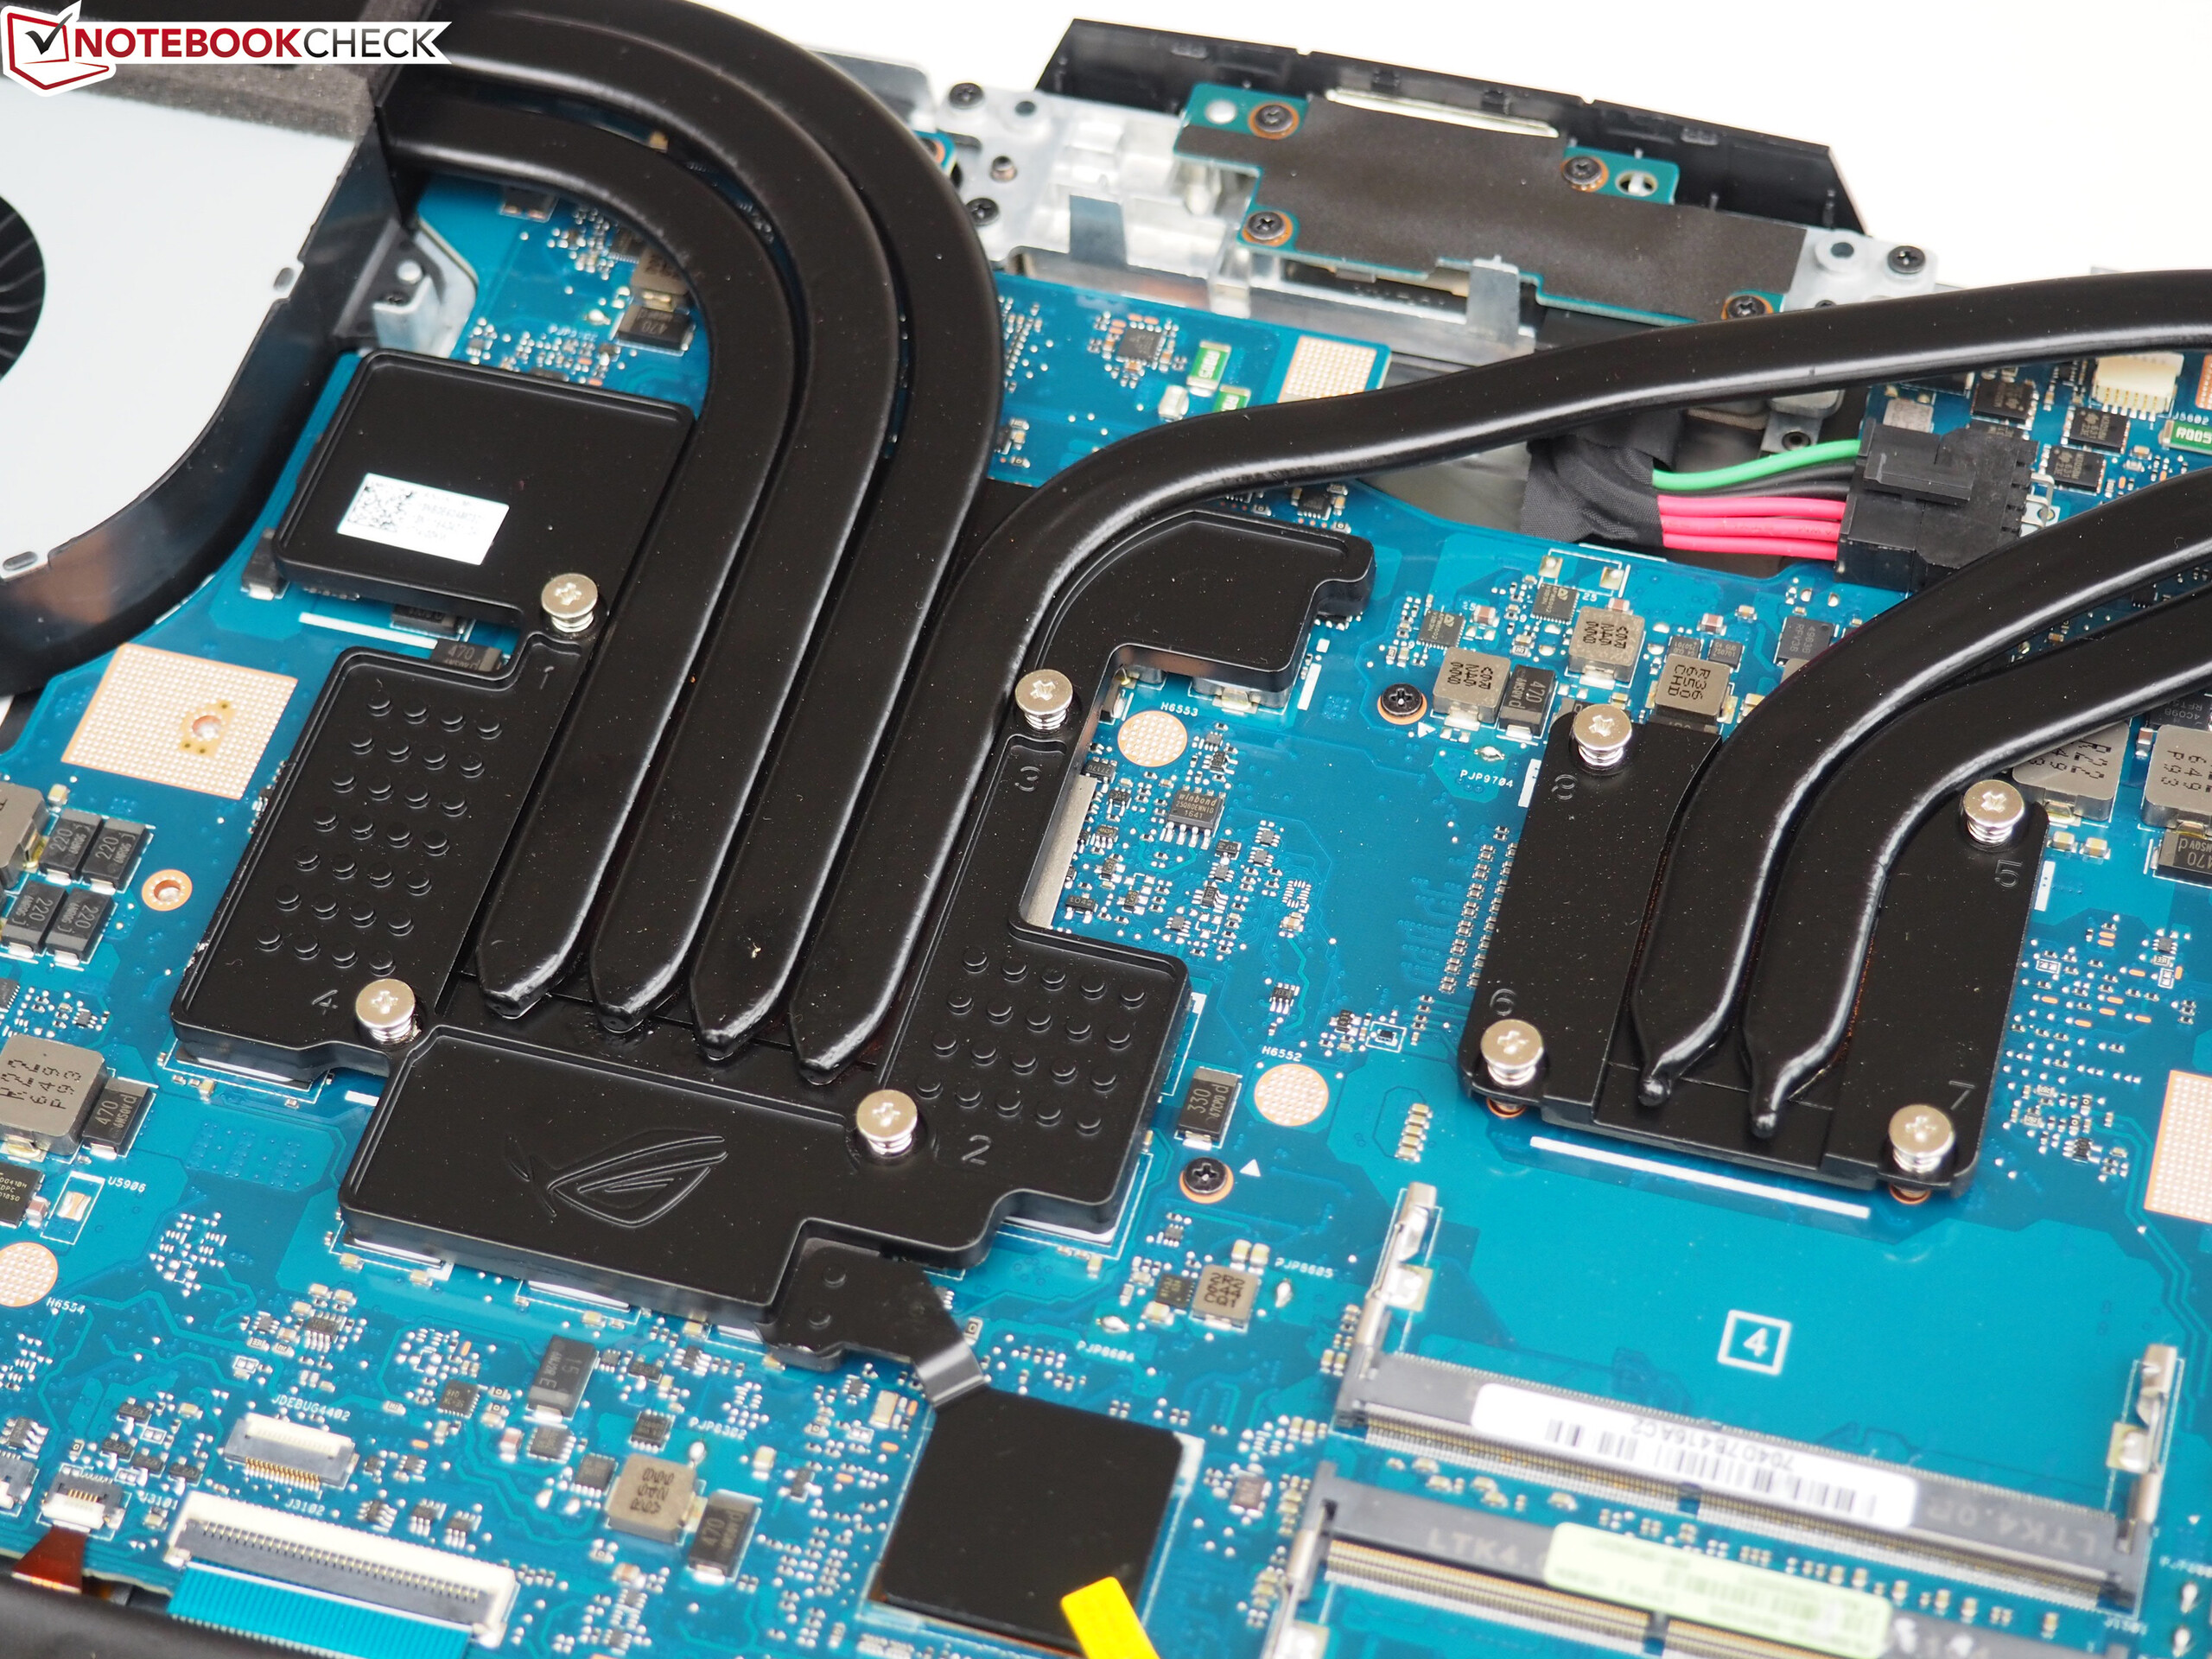
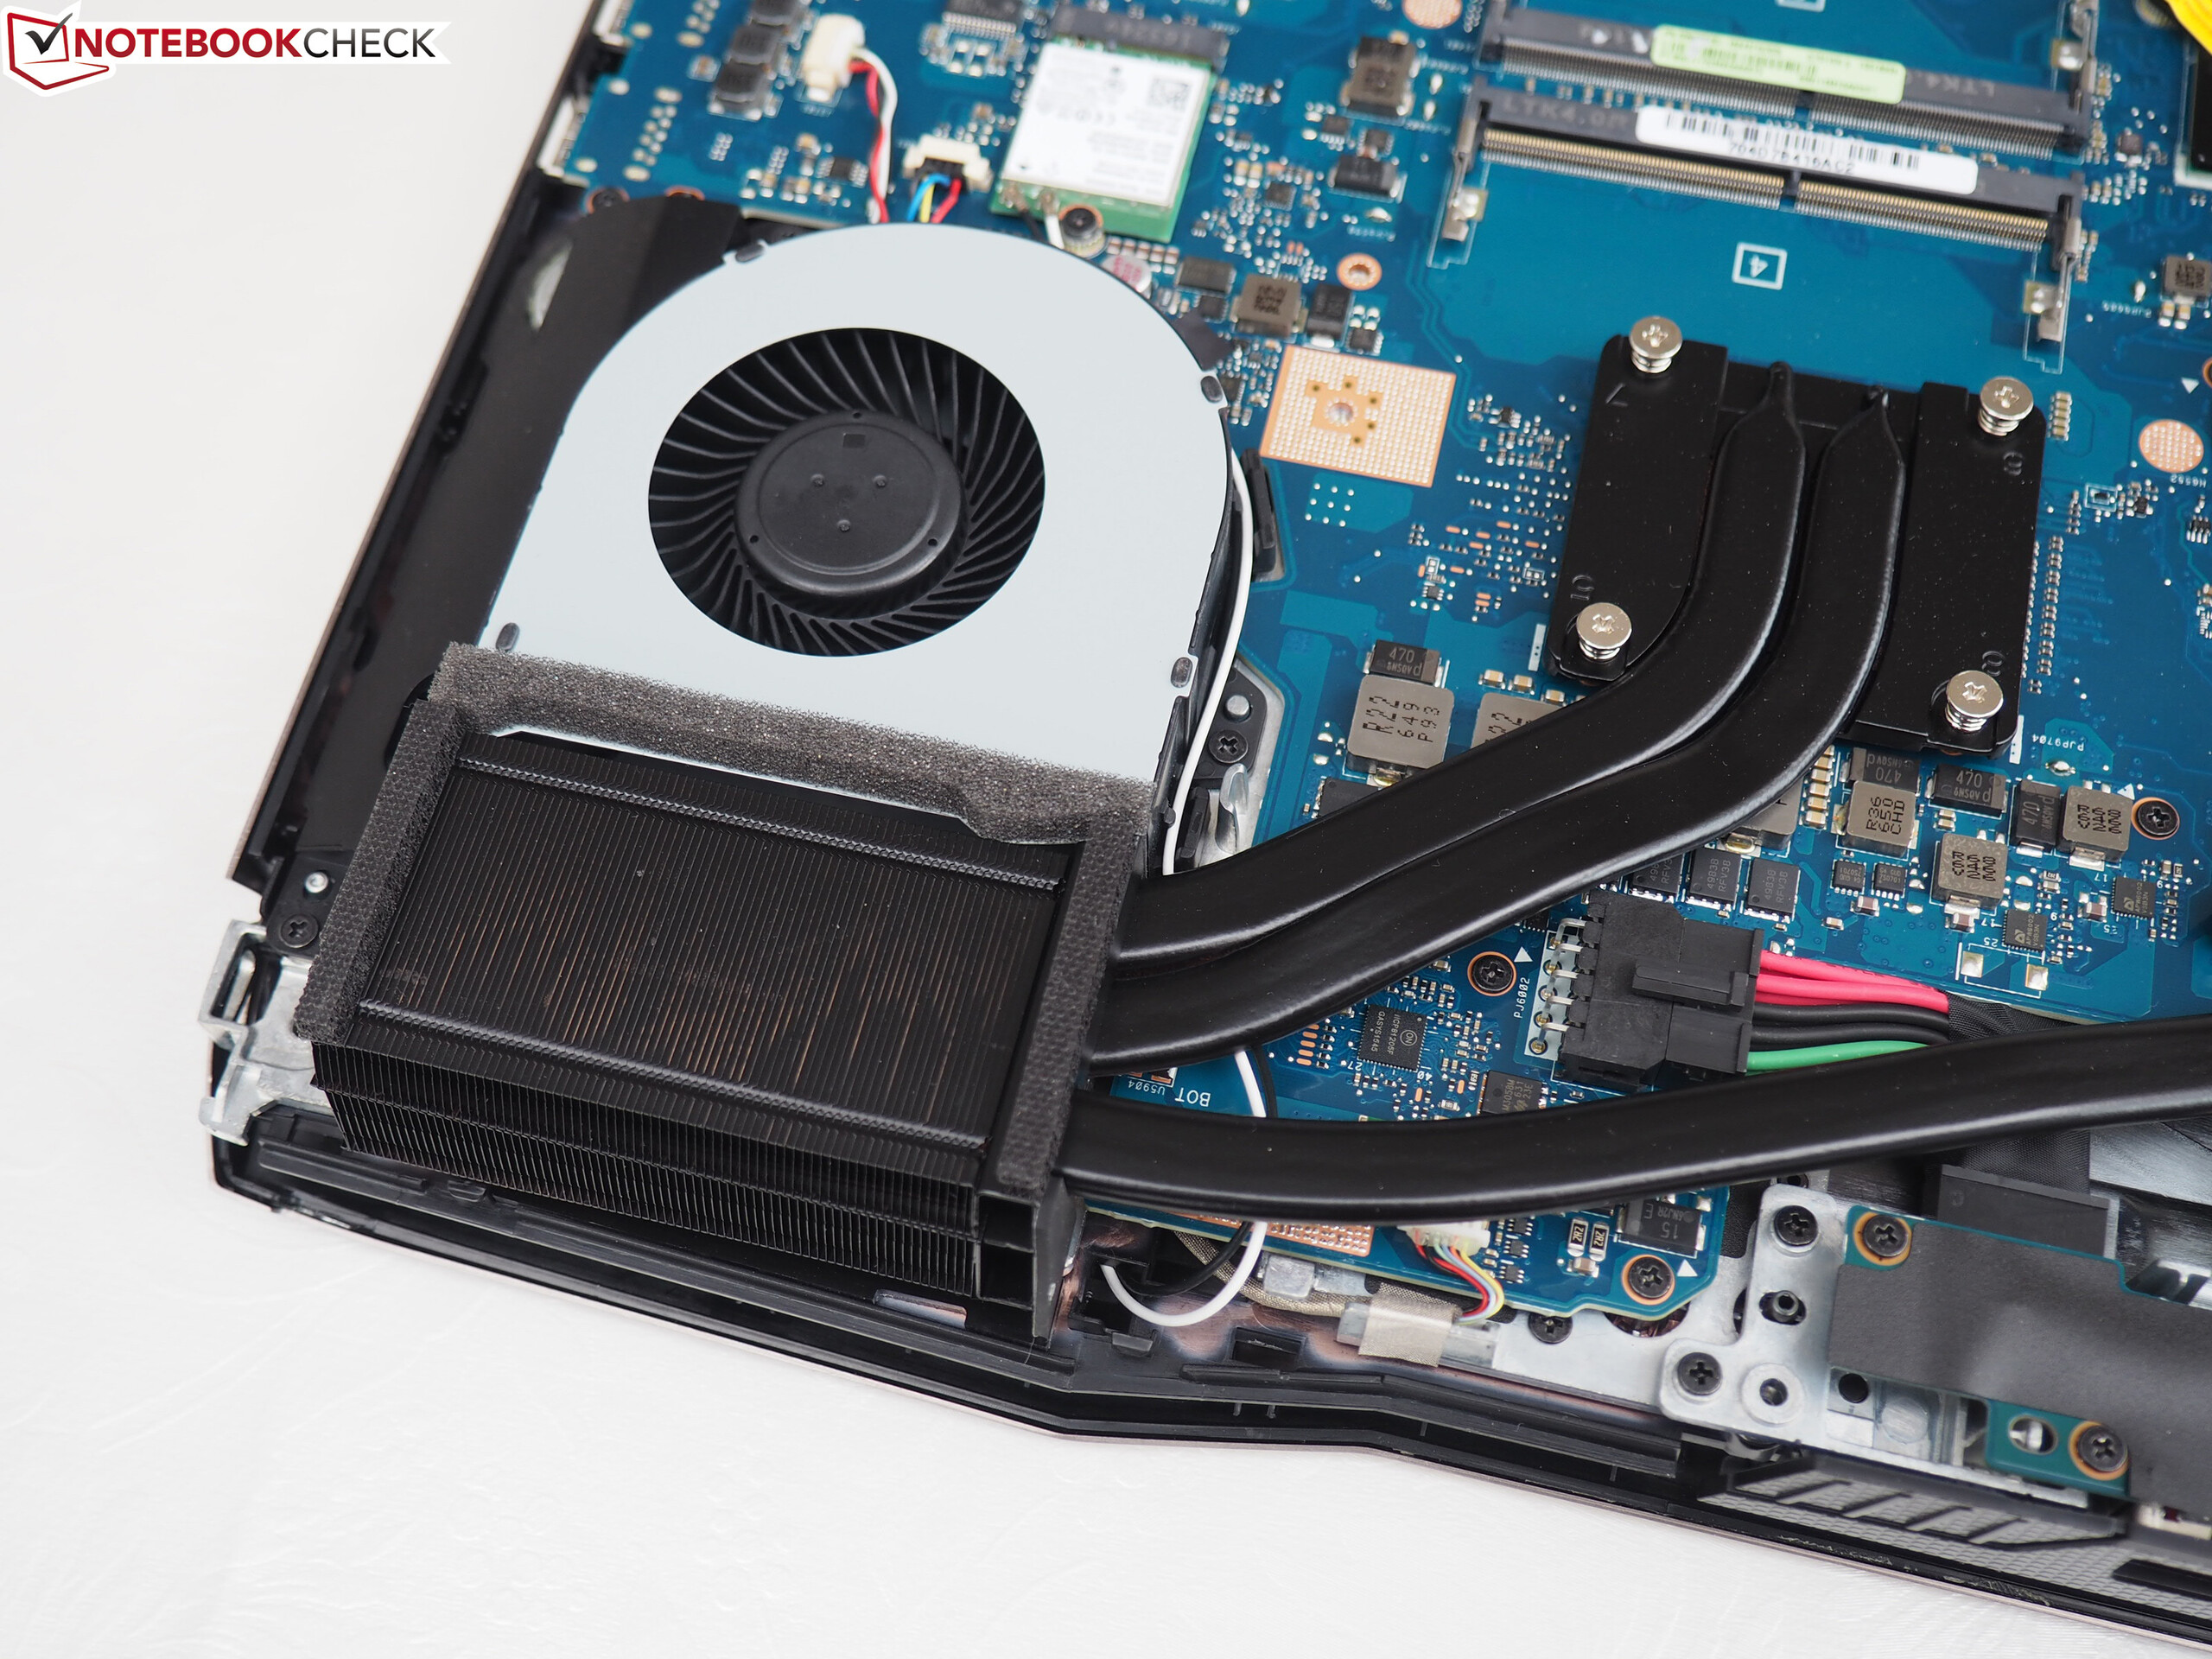
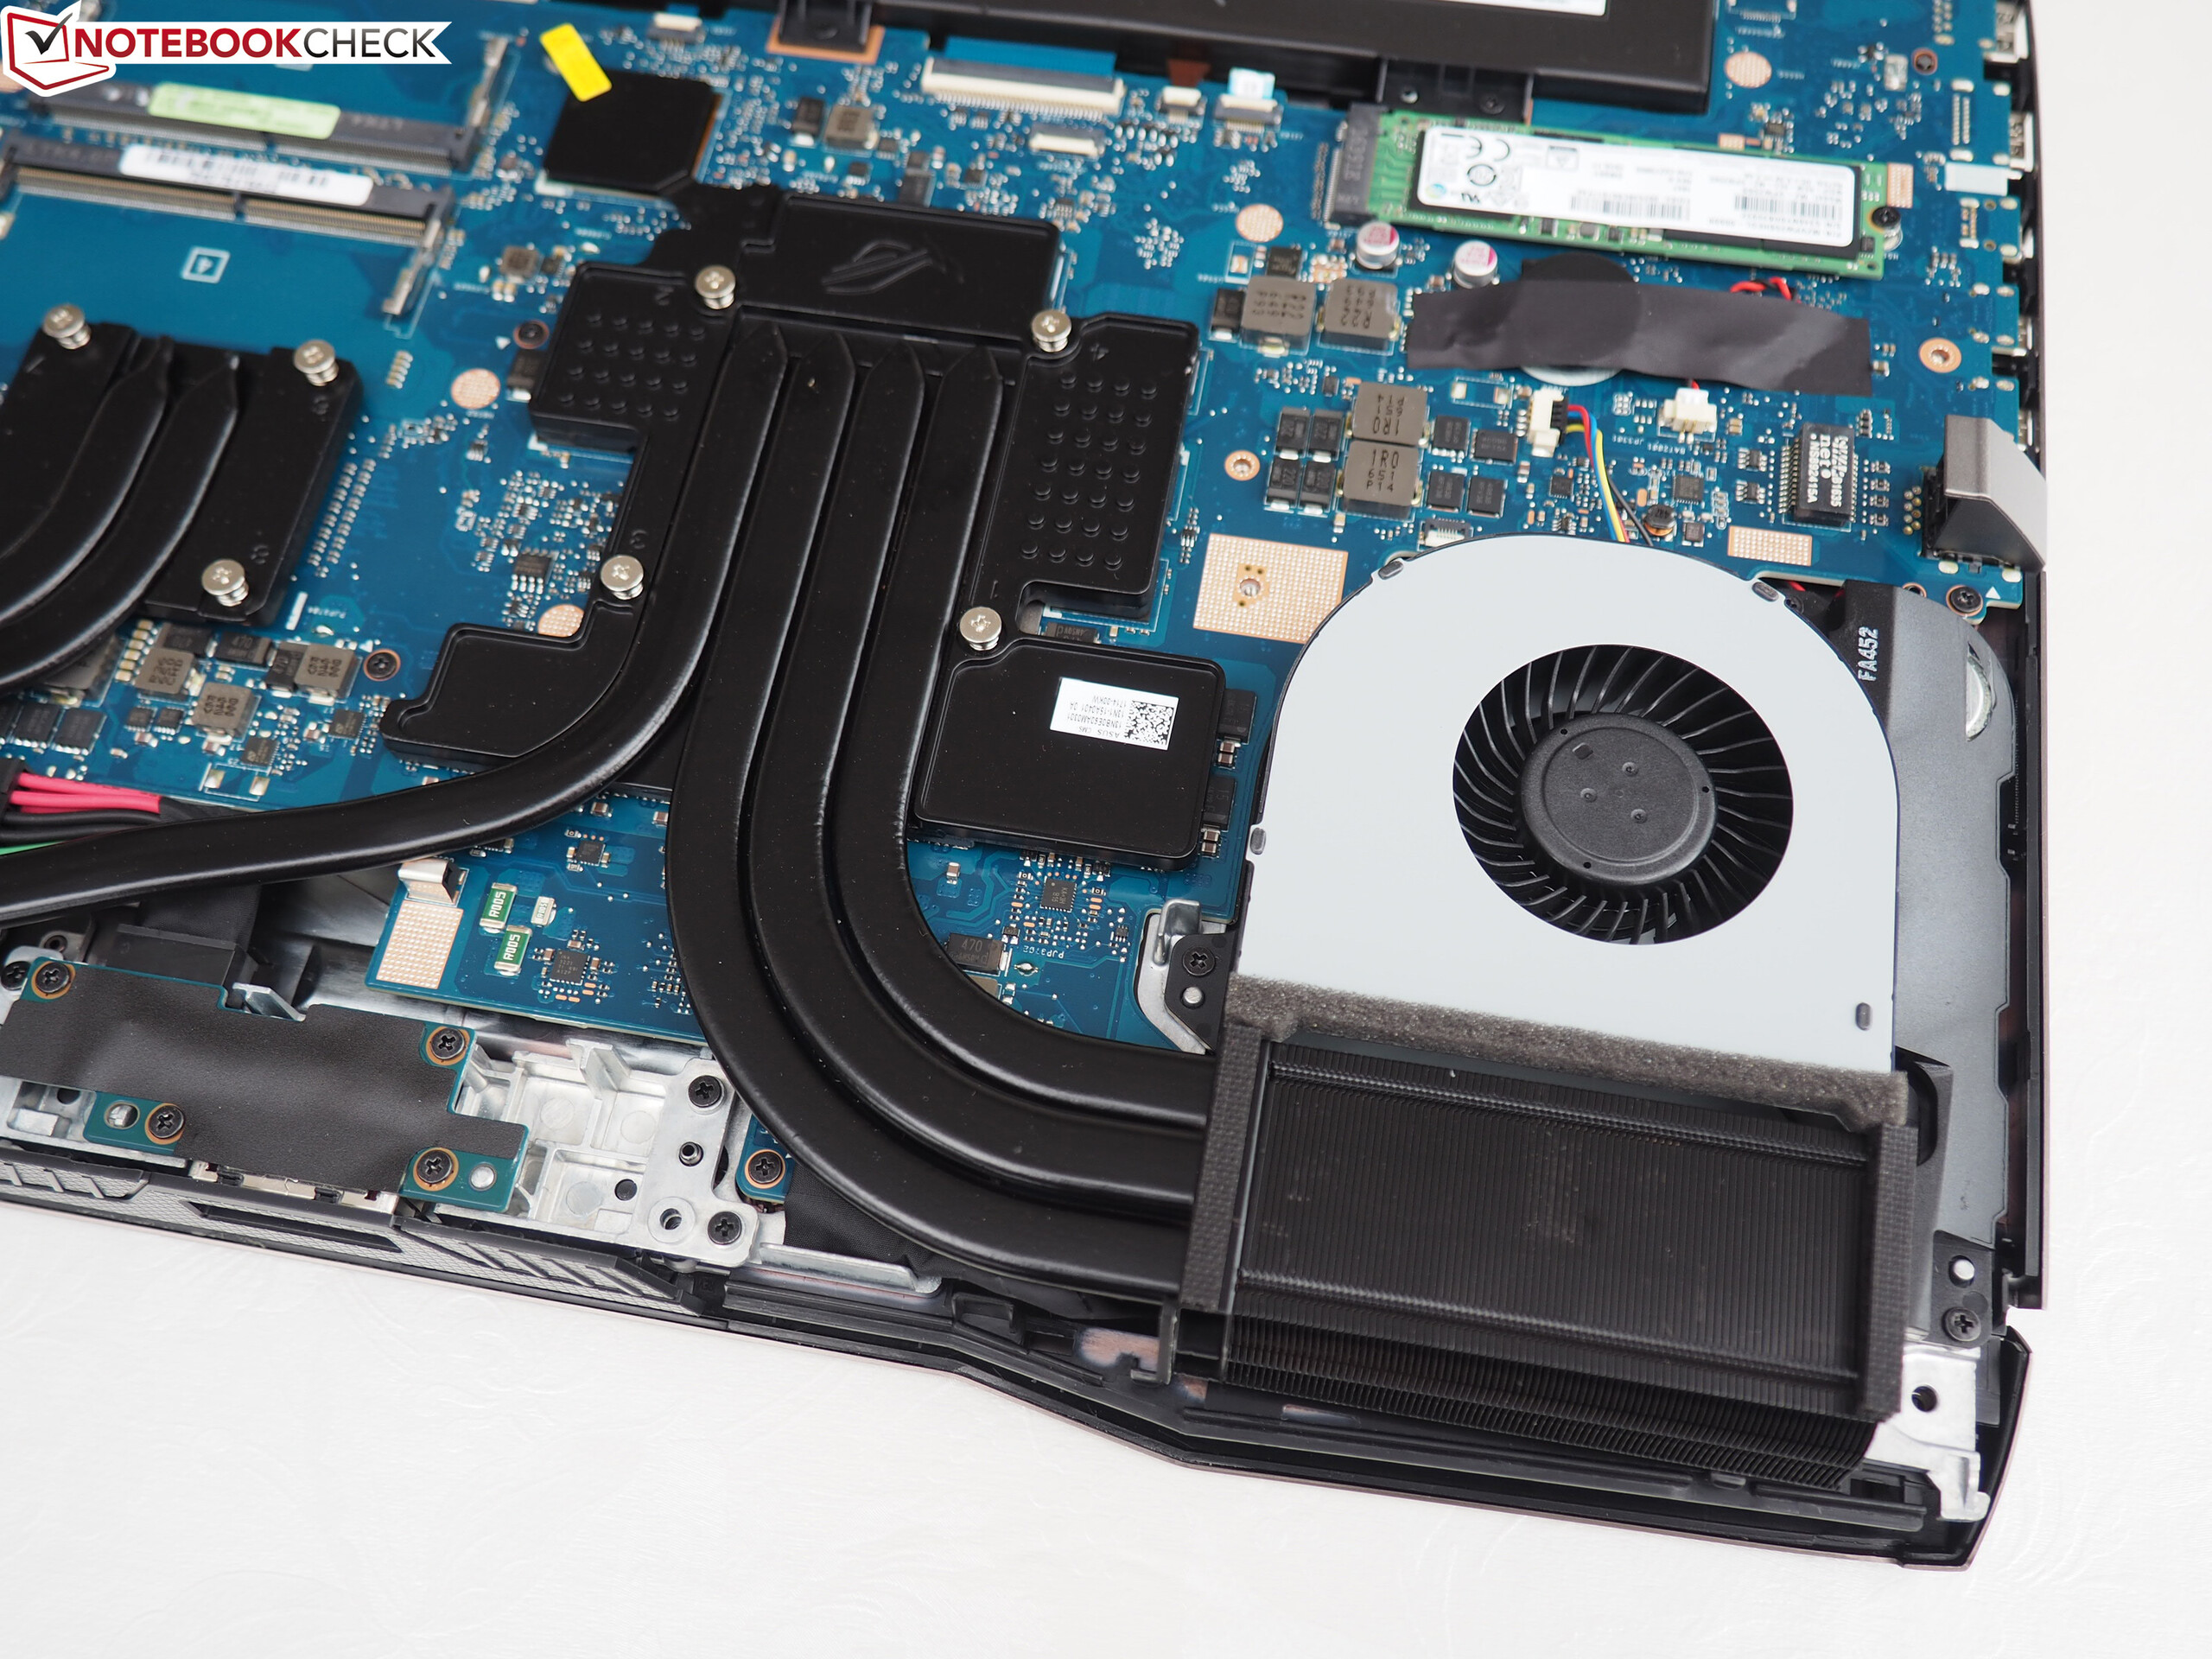
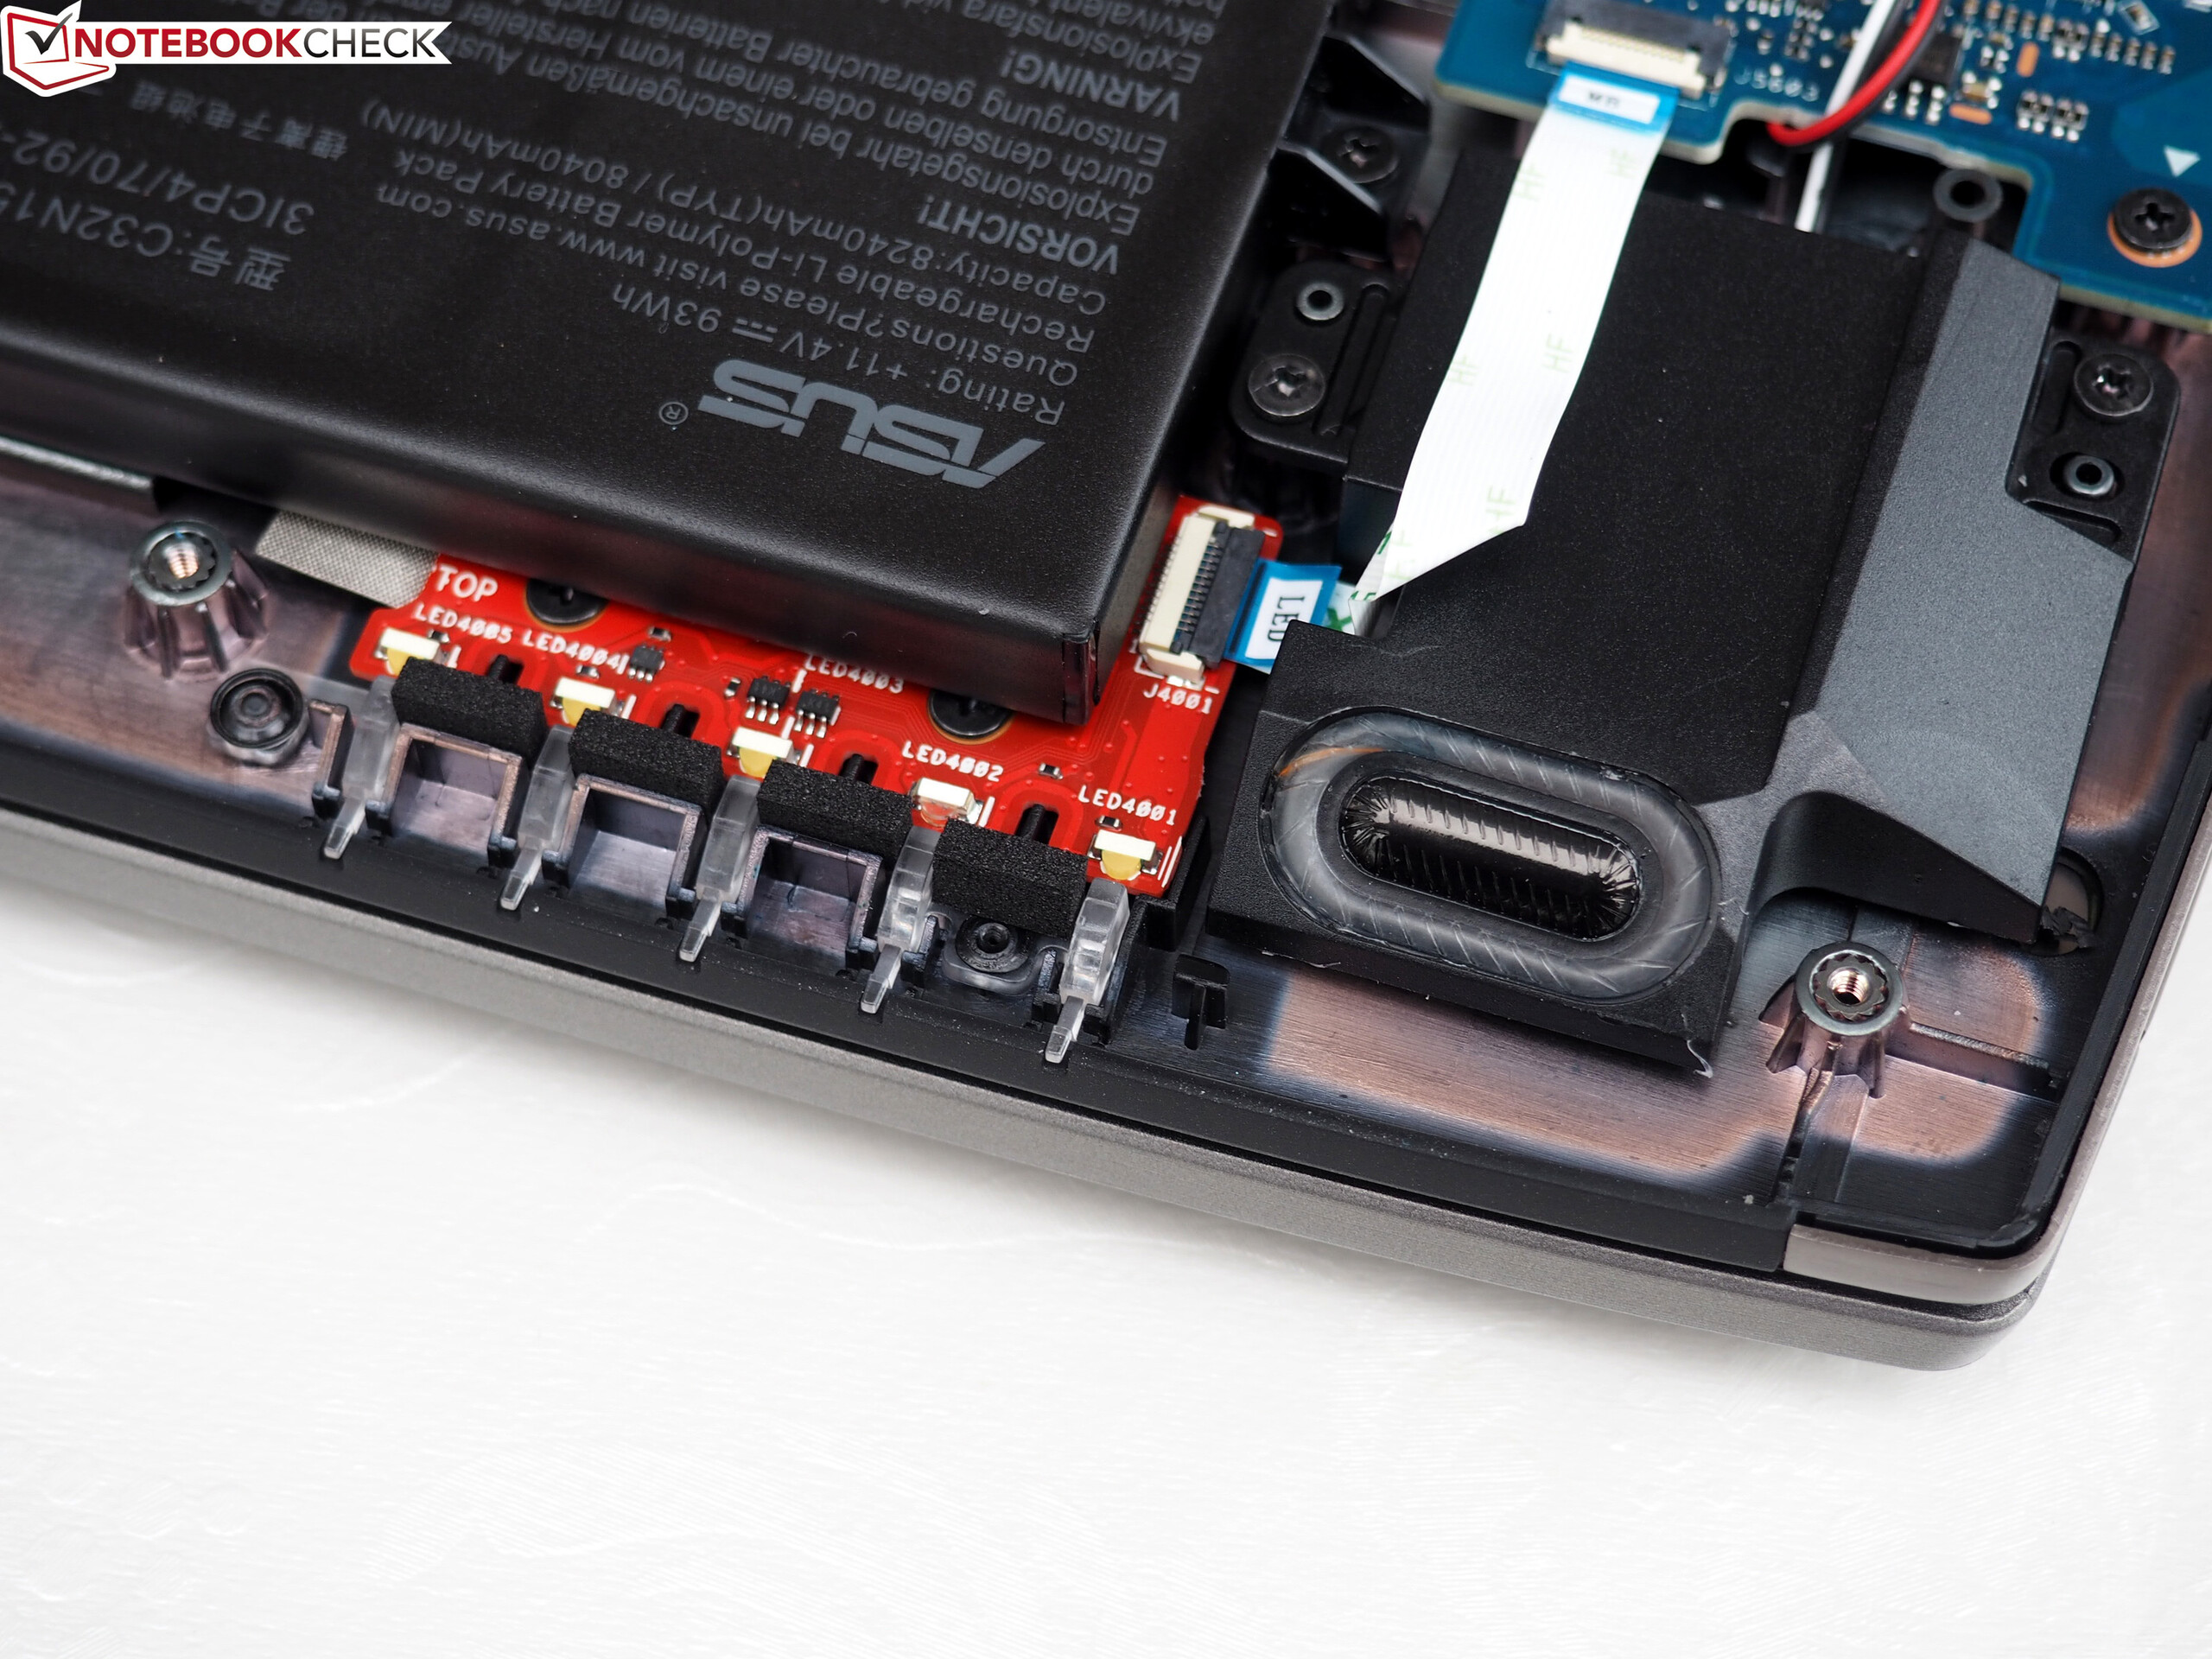
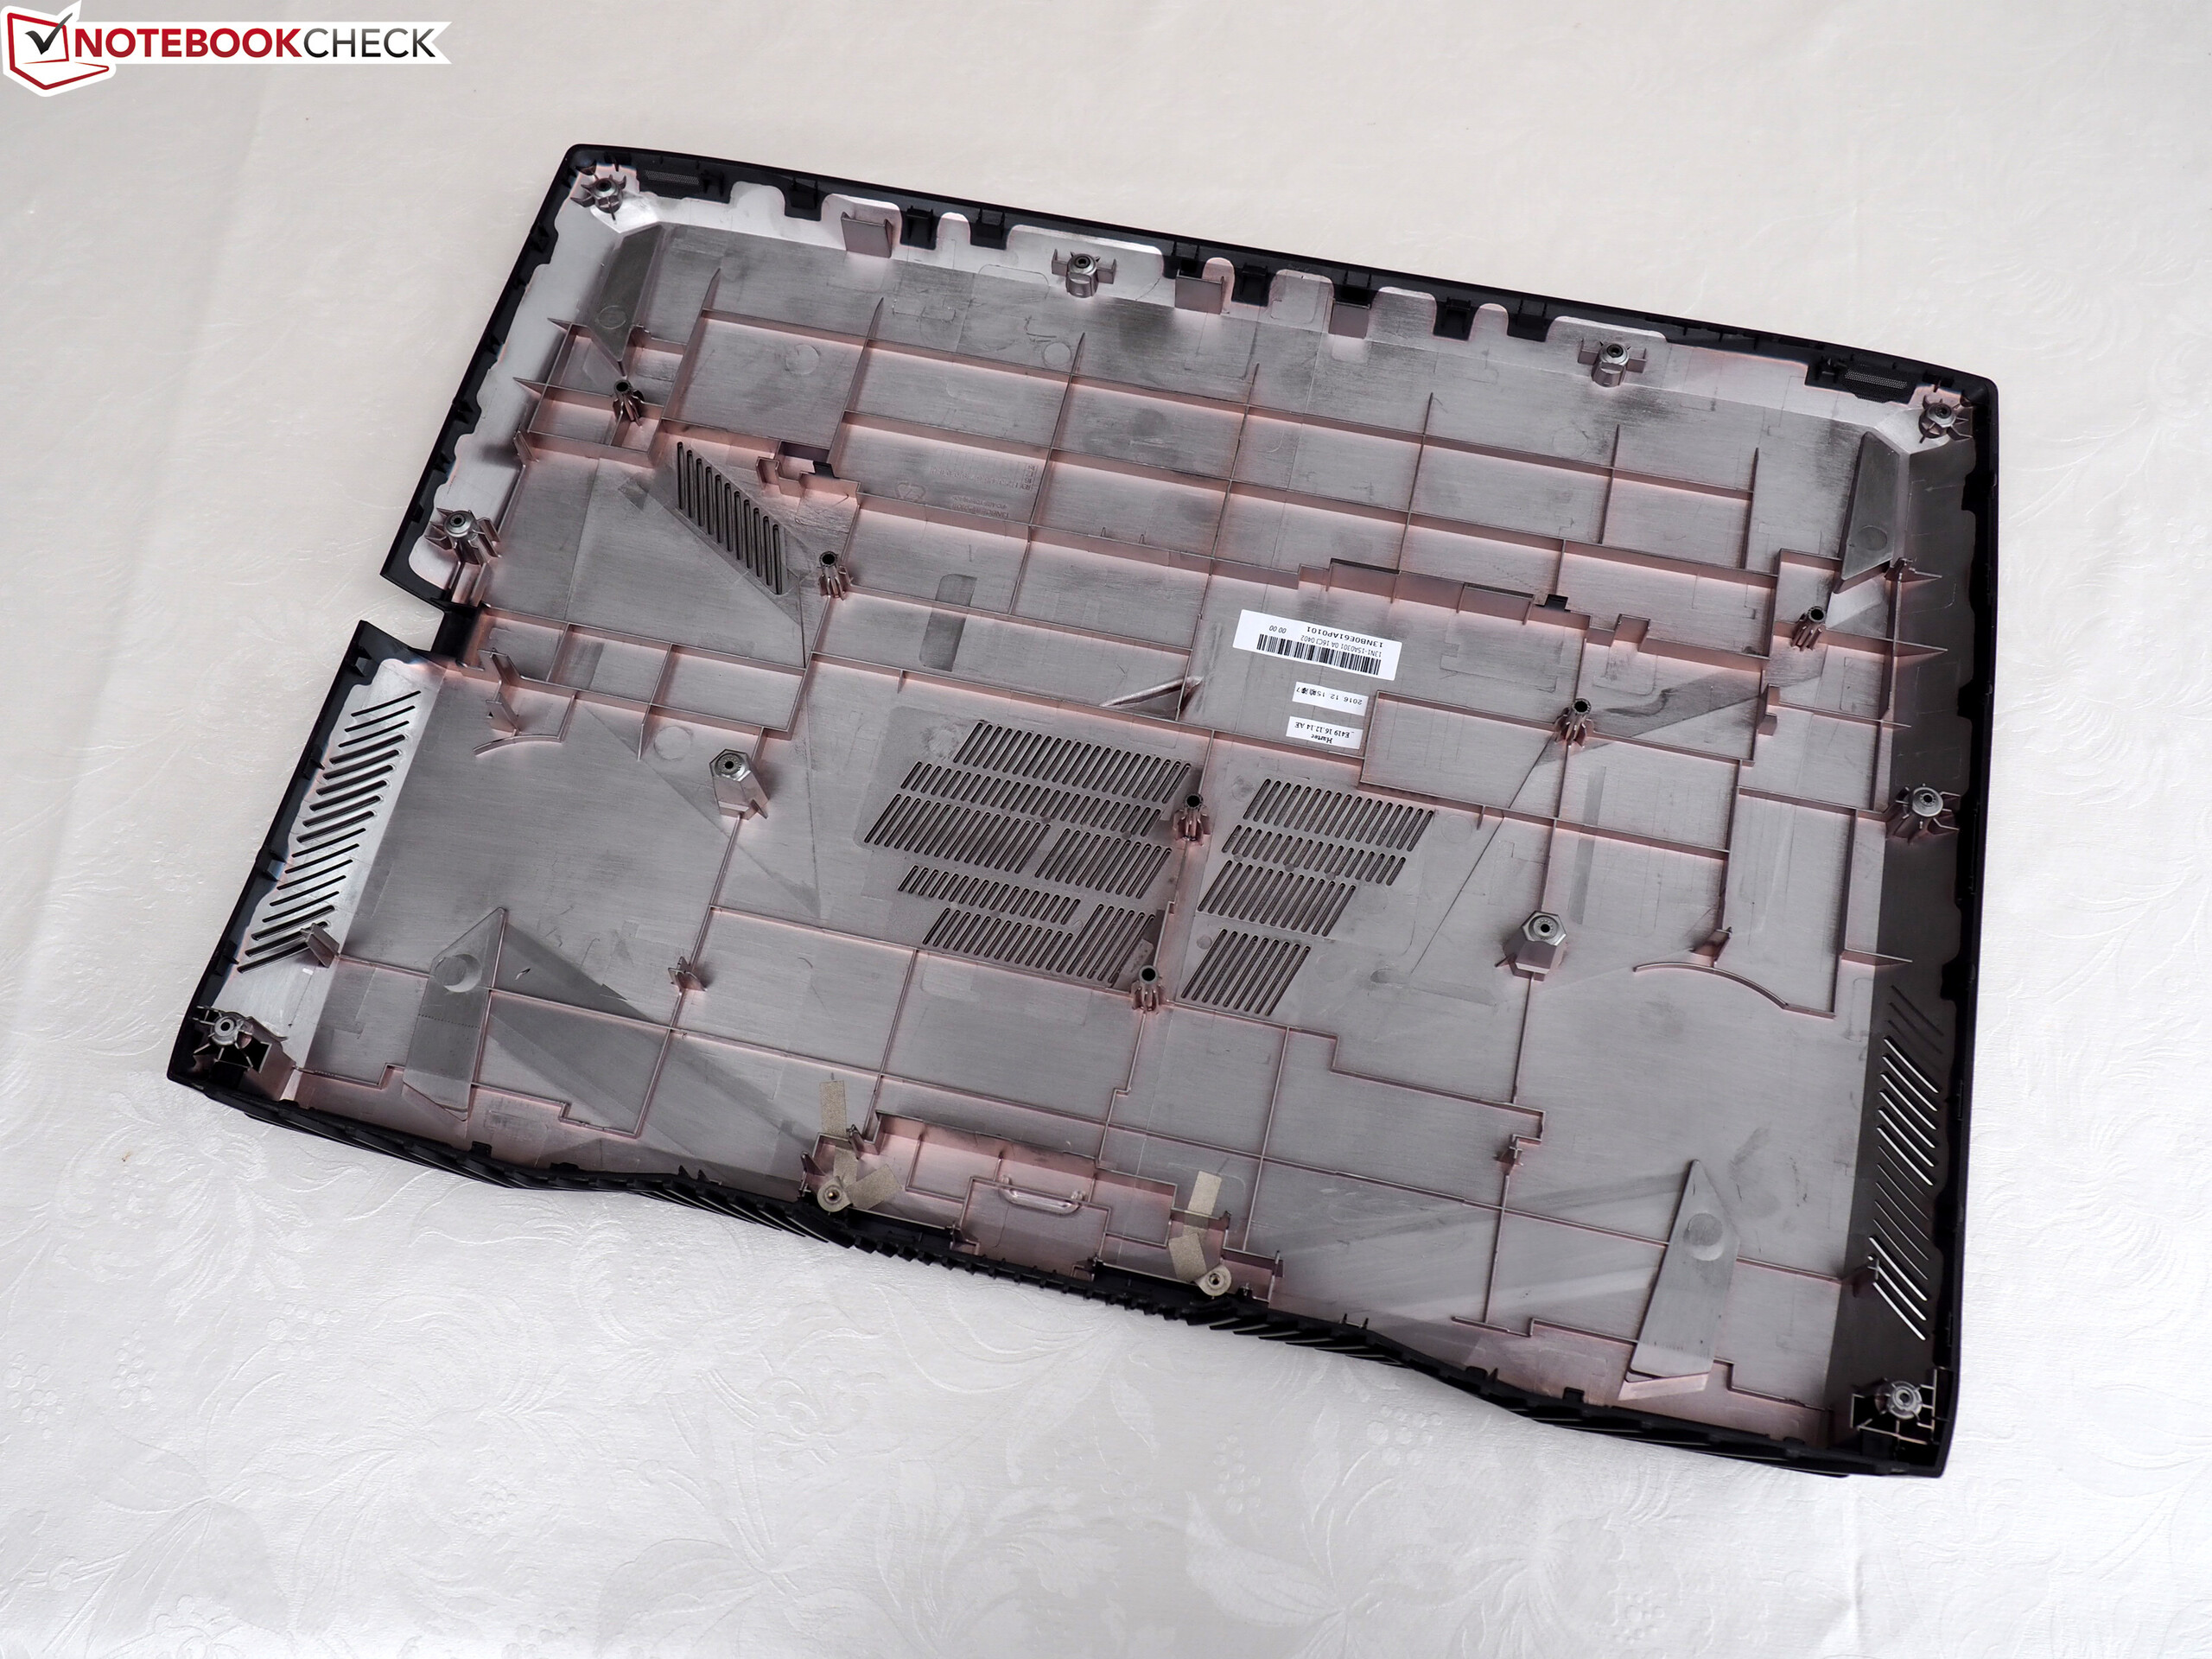
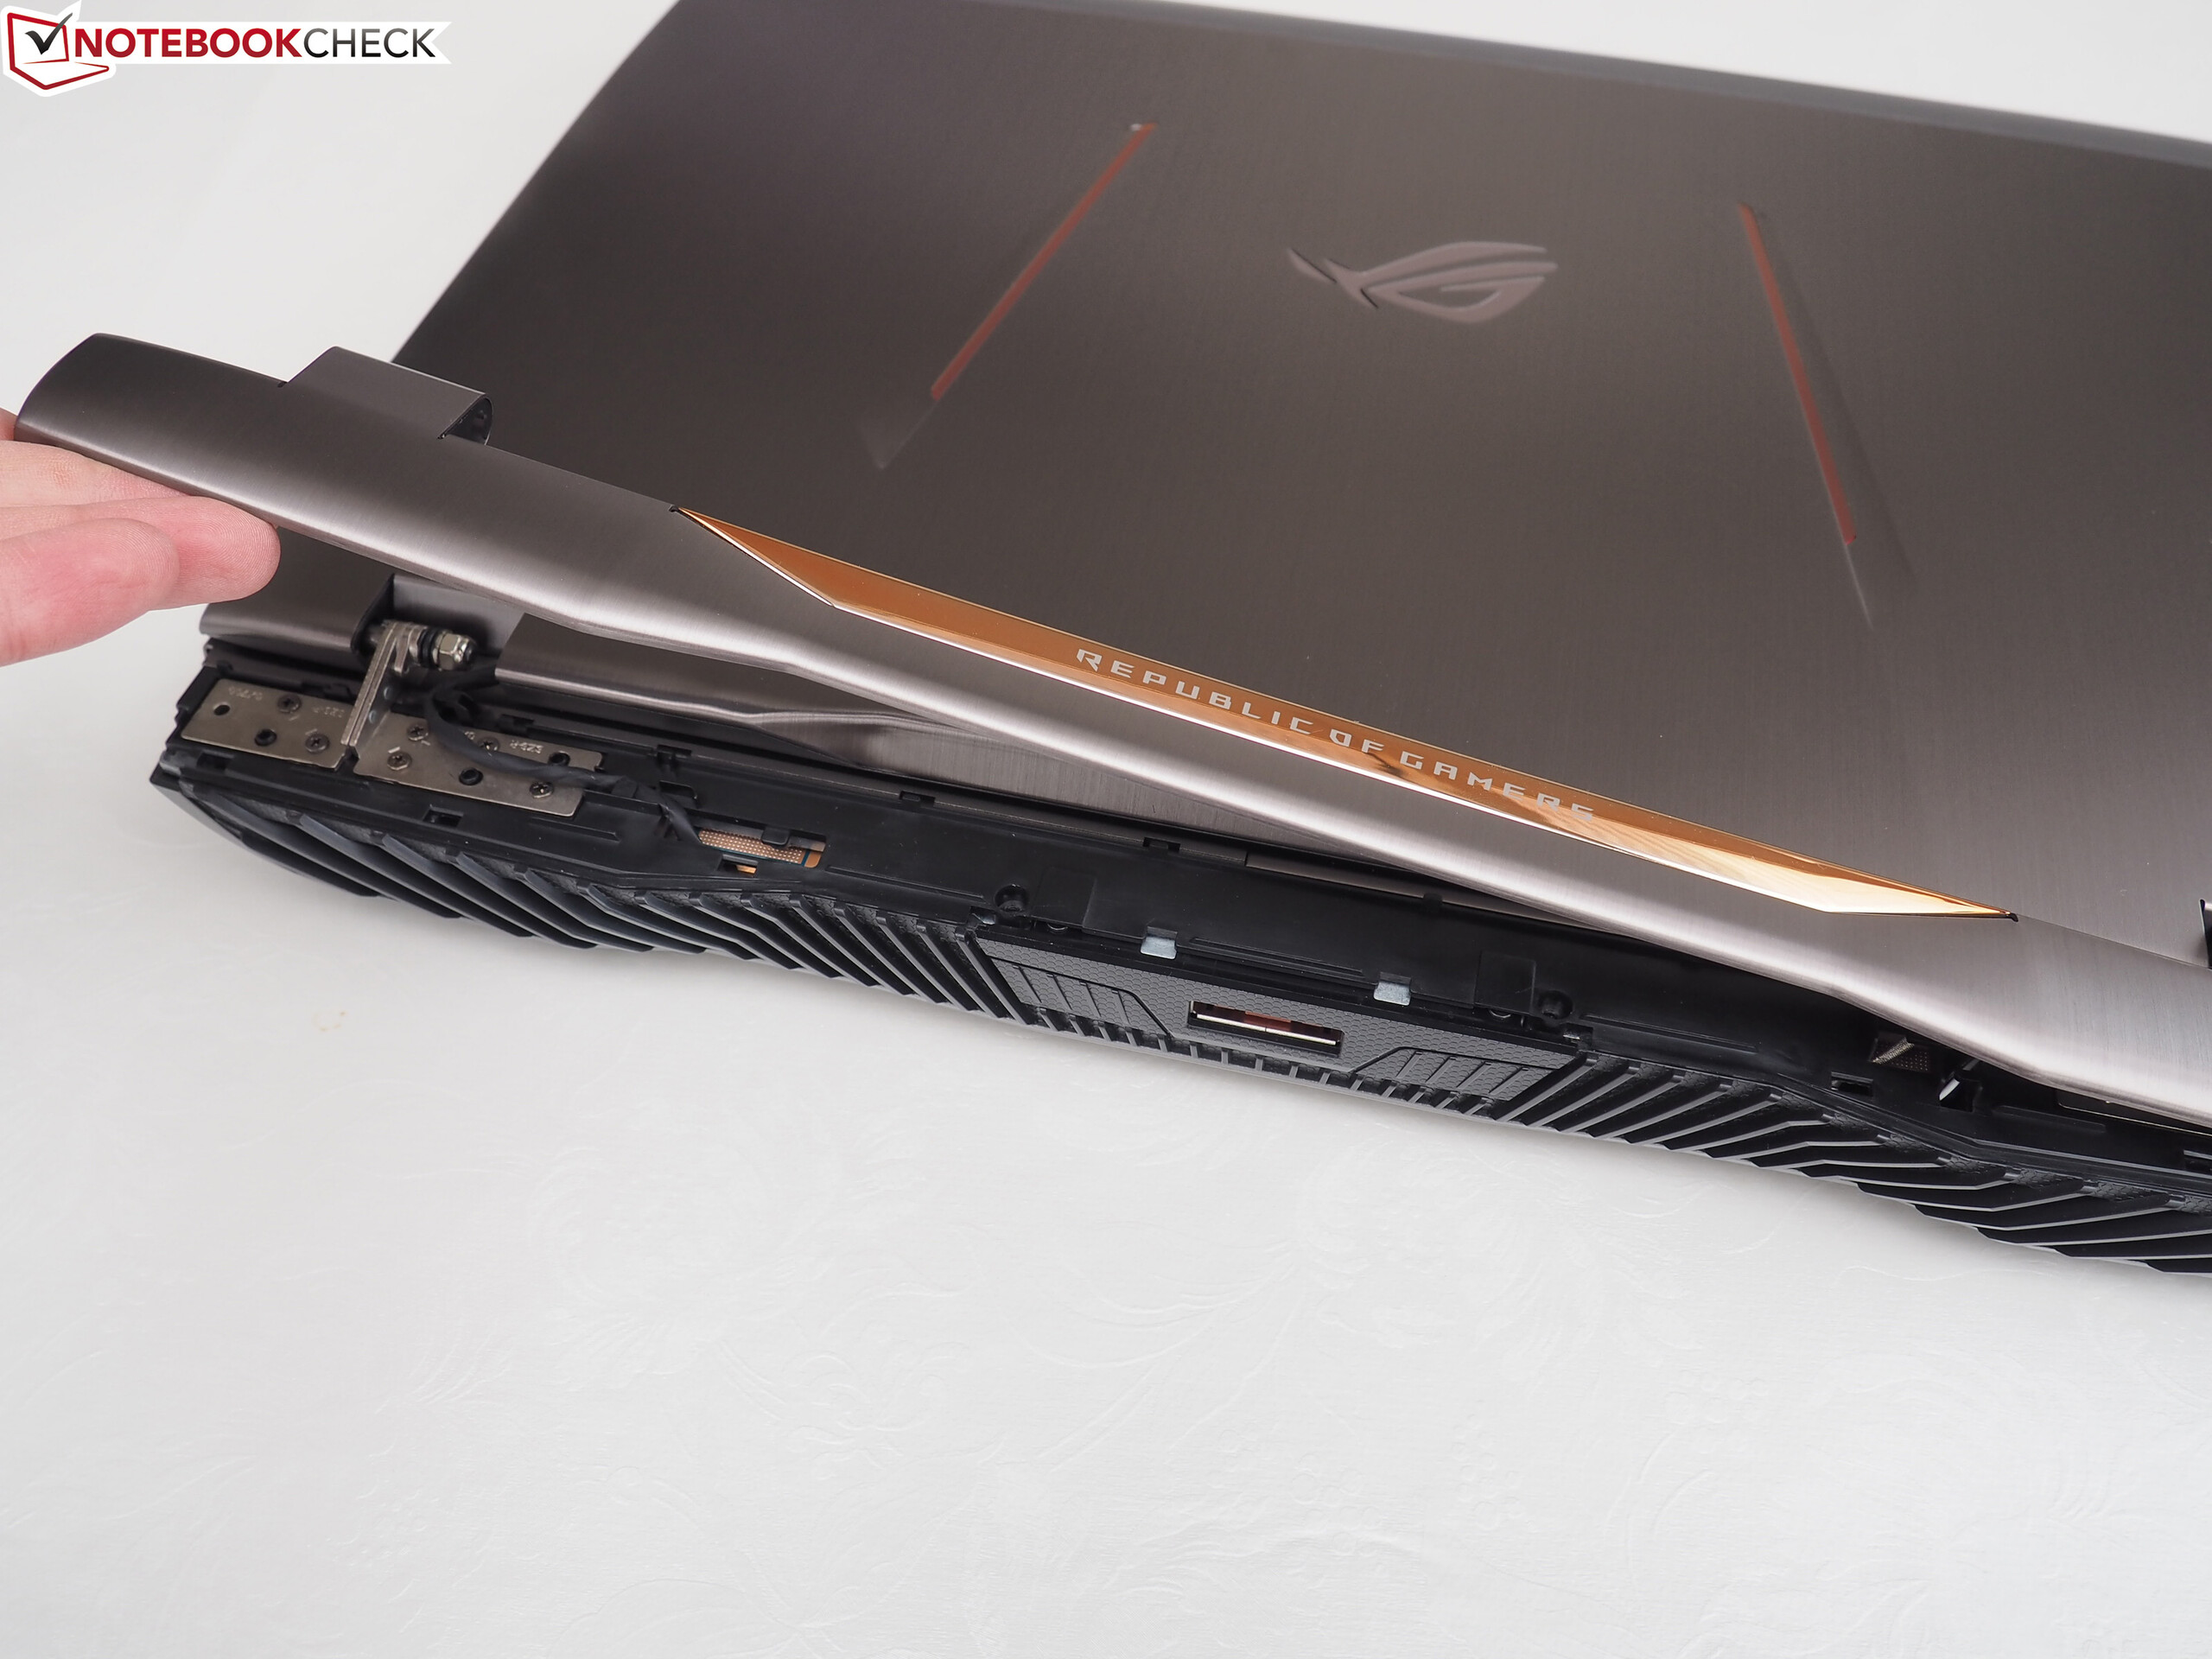
高发热量是这台高科技设备的一个重要缺点,英特尔酷睿i7-7820HK和英伟达GeForce GTX 1080在负载下发热量较大导致了较大的高负载下风扇噪音(即便不开启 Extreme 模式)。华硕也应该改进扬声器,接口排布,键盘和外壳。厂商对于键盘手感的处理并不是顶级的。再者,若要进行维护工作那也是十分麻烦的。
你会对G701感到满意,即使你对性能的要求毫不妥协。
注:本文是基于完整评测的缩减版本,阅读完整的英文评测,请点击这里。
Asus G701VIK-BA049T
- 02/21/2017 v6 (old)
Florian Glaser