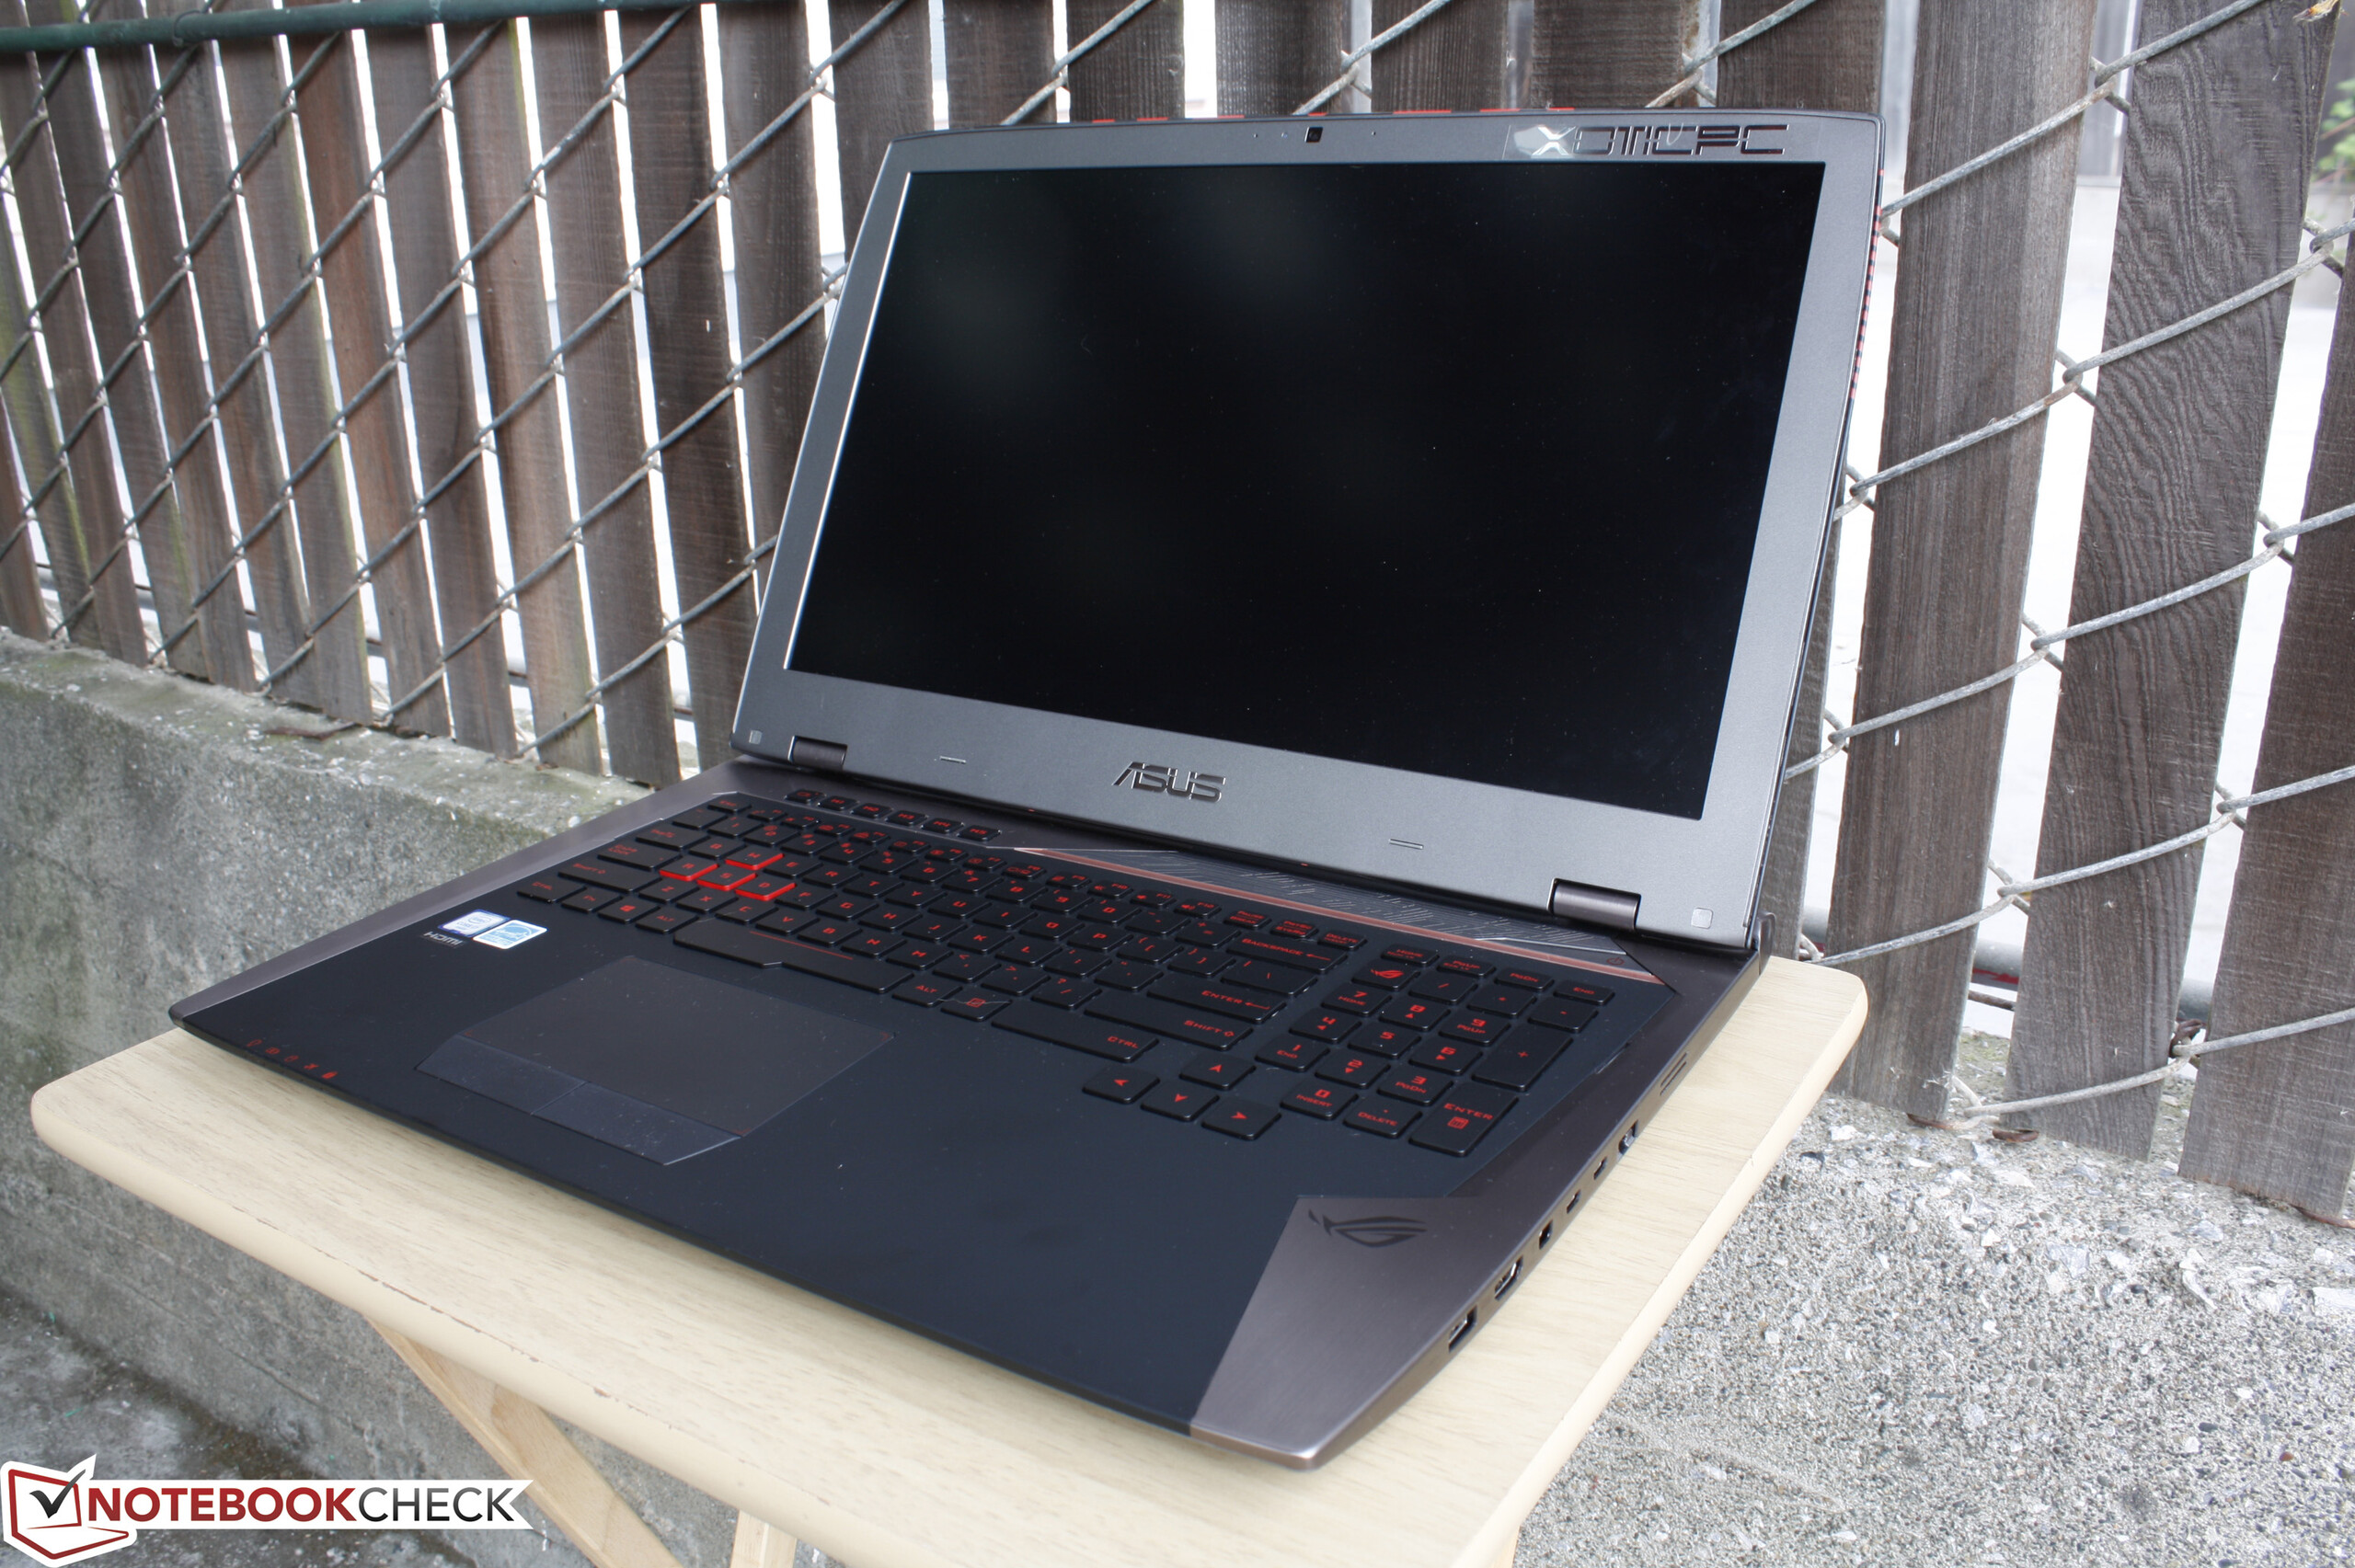
华硕 ROG G701VO-CS74K Xotic PC版 笔记本电脑简短评测
Asus G701VO-CS74K (G701 Series)
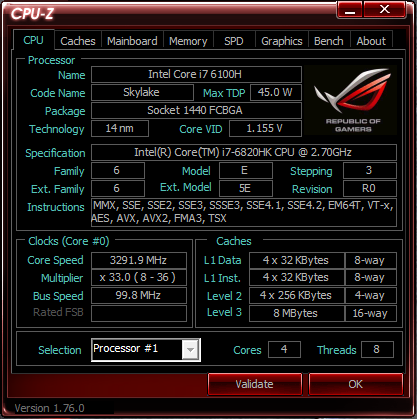
Processor
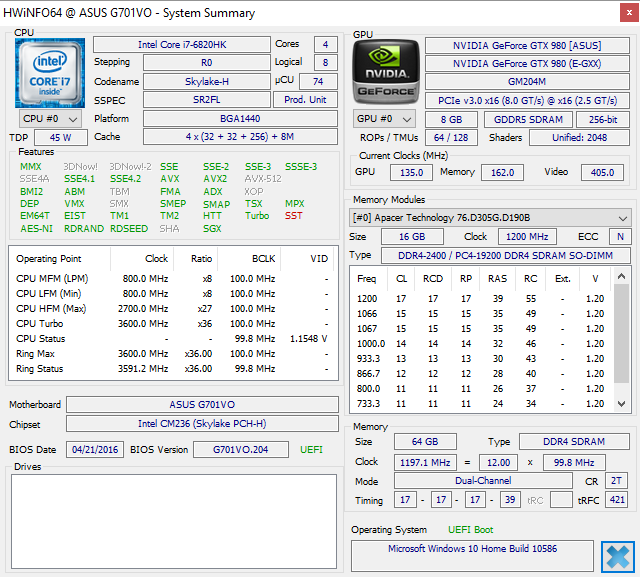
Intel Core i7-6820HK 4c/8t 4 x 2.7 - 3.6 GHz, Skylake
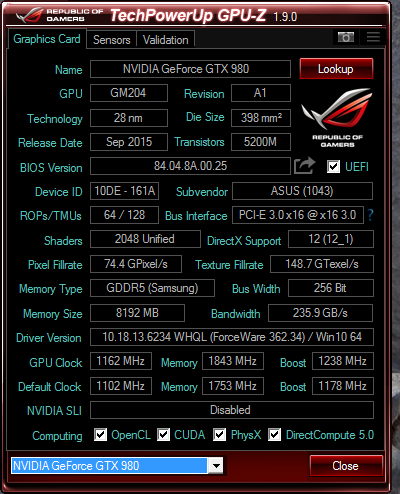
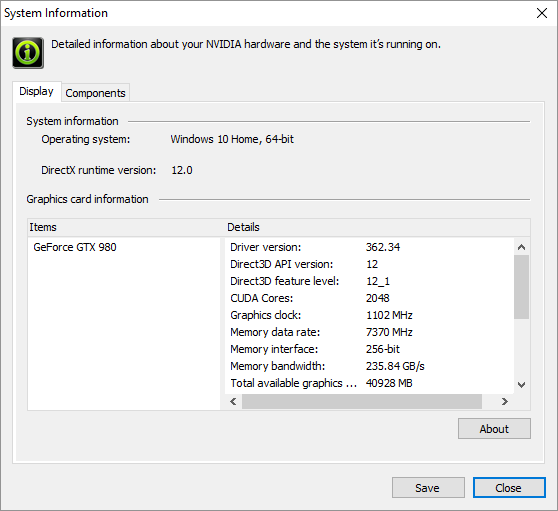
Graphics adapter
NVIDIA GeForce GTX 980 (Laptop) - 8 GB VRAM, Core: 1102 MHz, RAM: 7370 MHz, GDDR5, 362.34
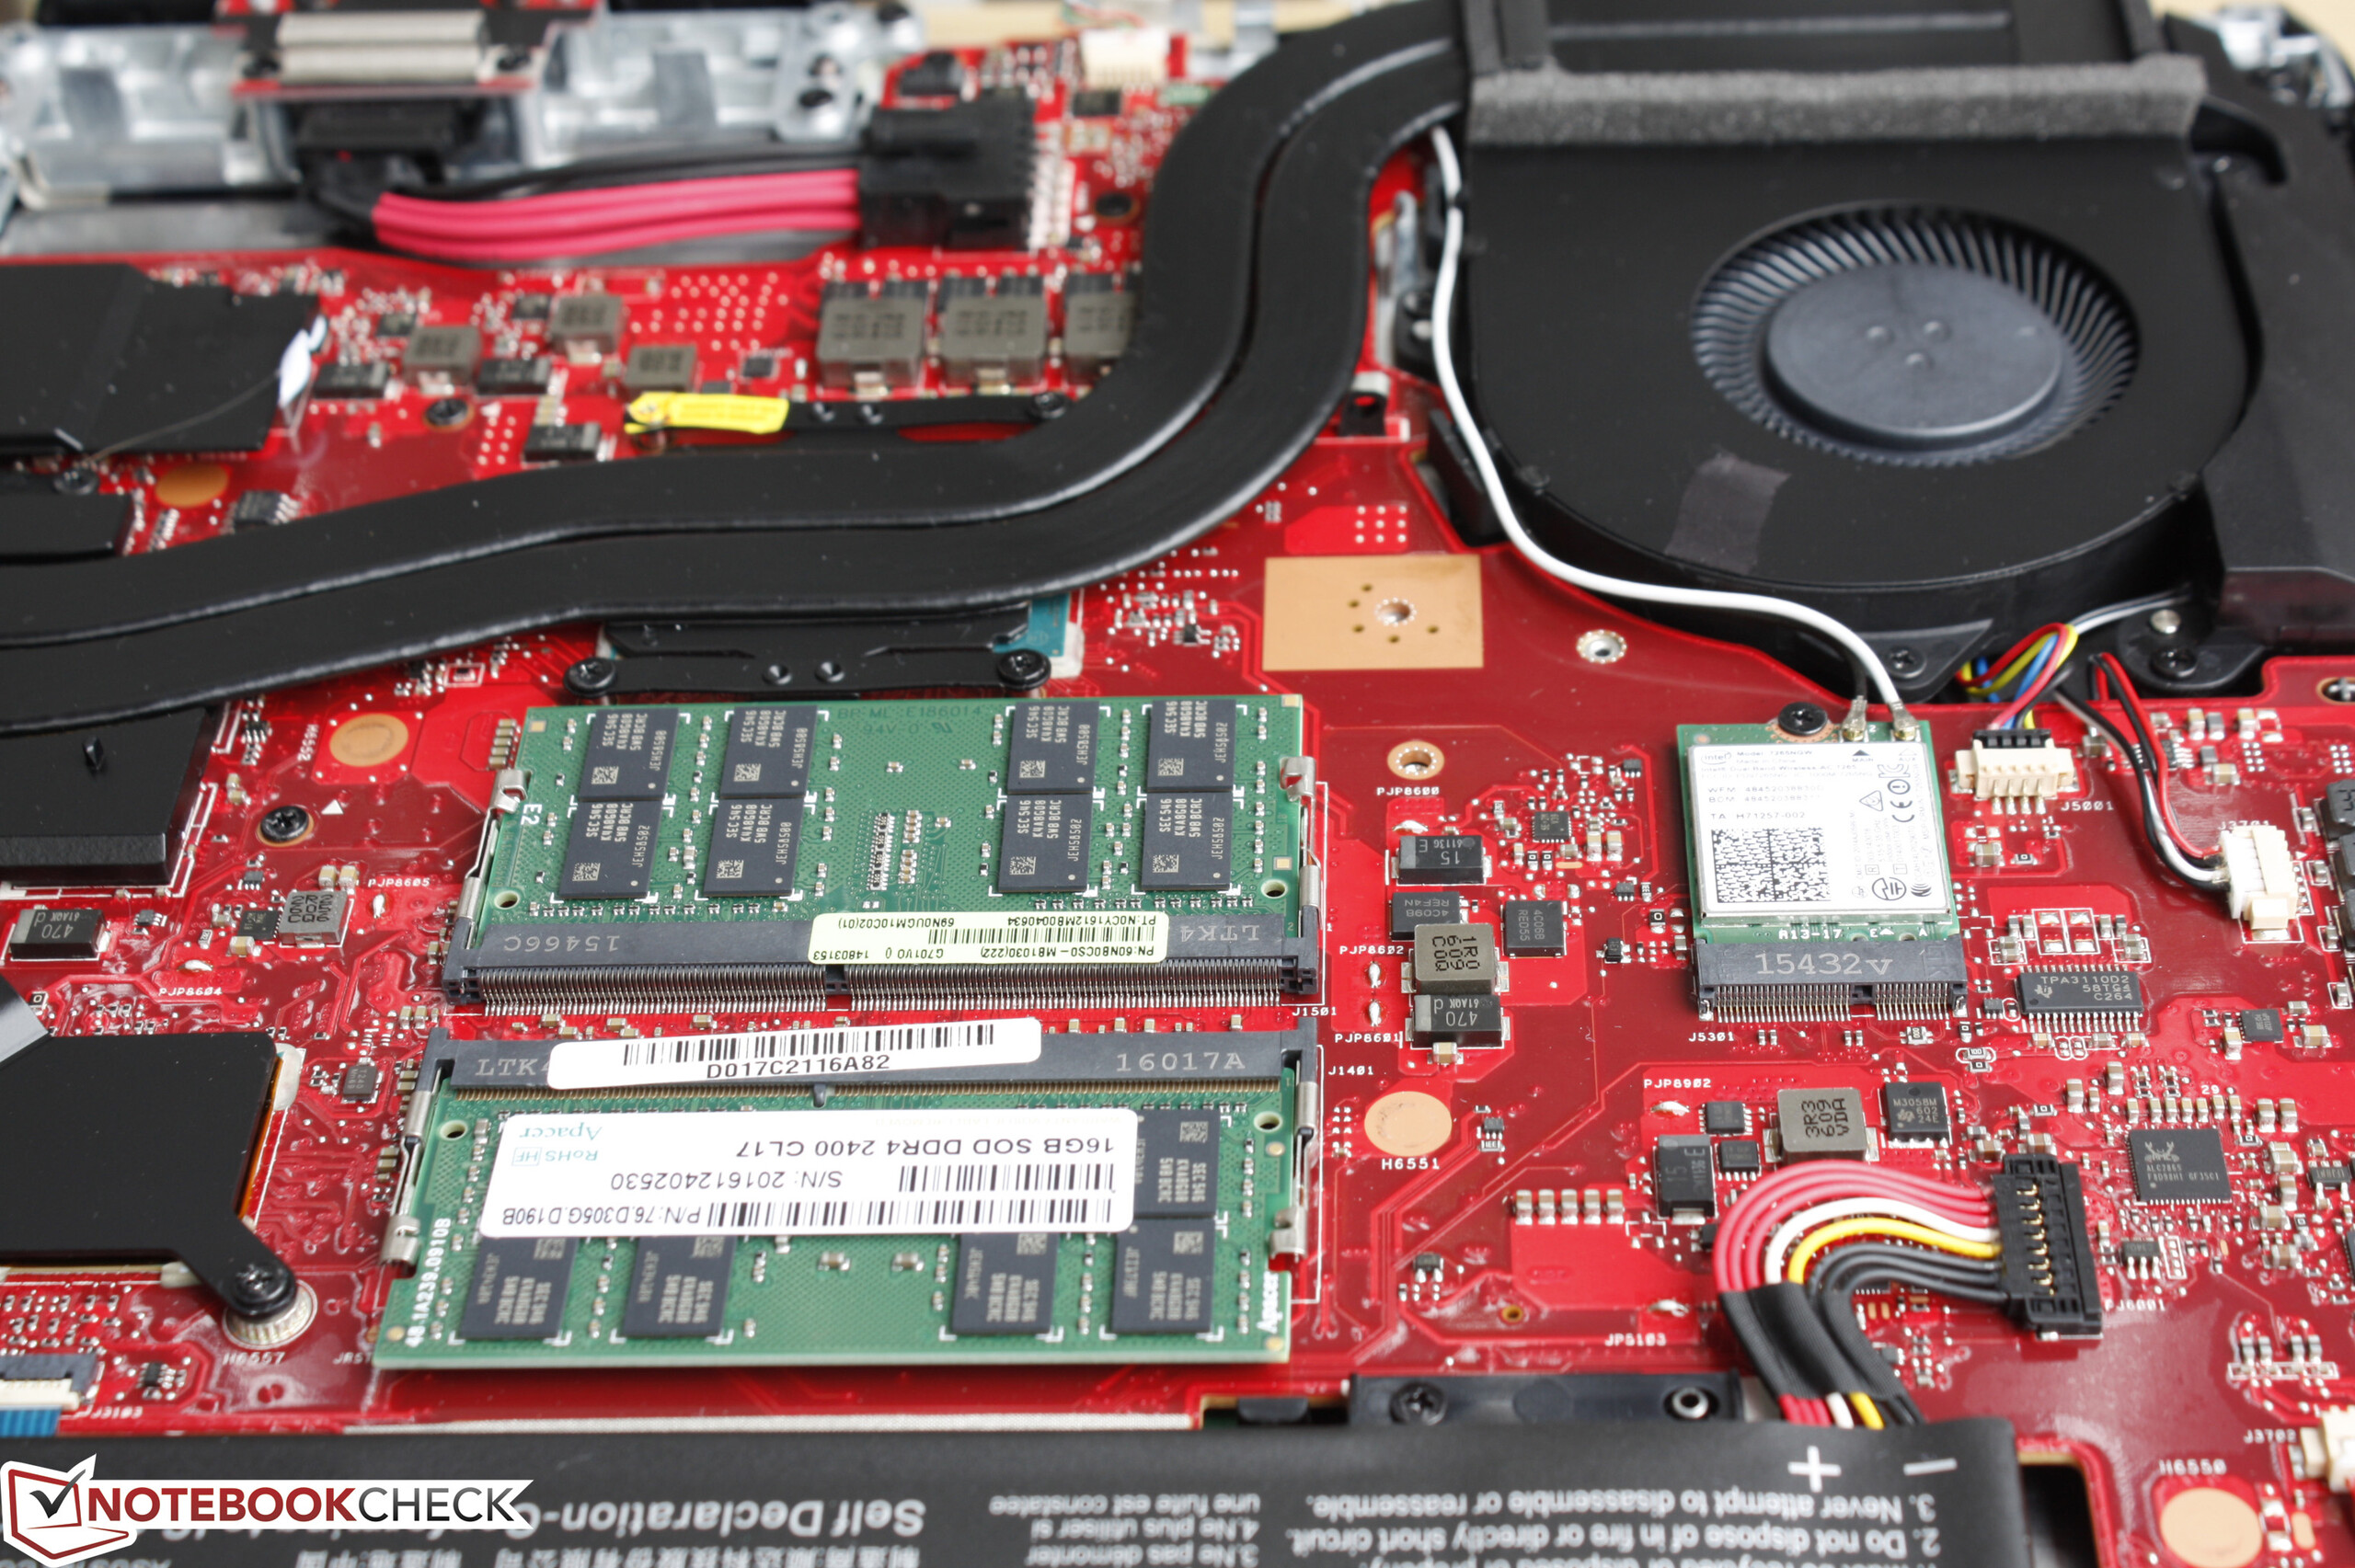
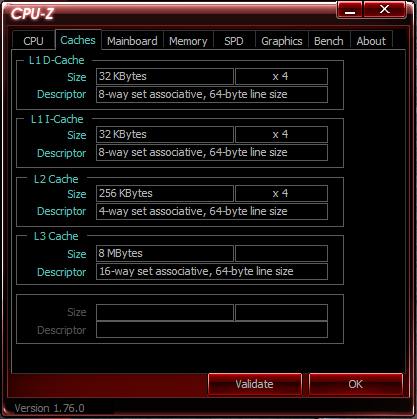
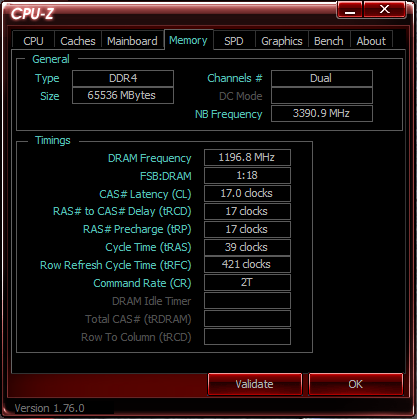
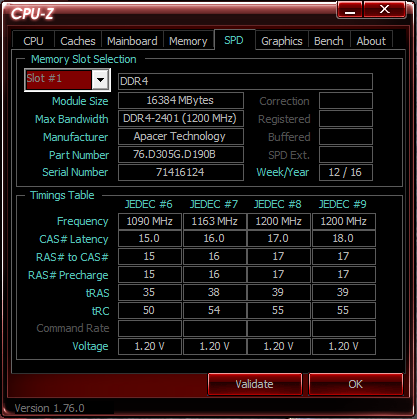
Memory
64 GB
, Apacer 科技, 1300 MHz, 双通道, 17-17-17-39, DDR4-2400/PC4-19200
Display
17.30 inch 16:9, 1920 x 1080 pixel 127 PPI, IPS, Name: LP173WF4-SPF3, ID: LGD04E8, glossy: no
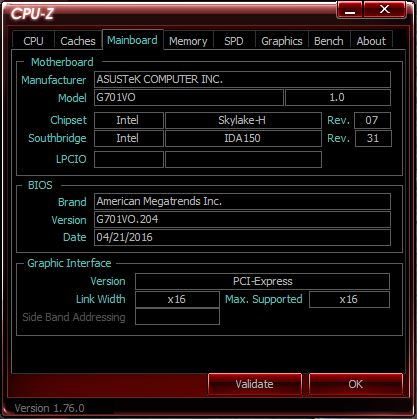
Mainboard
Intel CM236 (Skylake PCH-H)
Storage
2x Samsung SM951 MZVPV512HDGL (RAID 0), 1024 GB
Weight
3.874 kg, Power Supply: 930 g
Price
4000 USD
Note: The manufacturer may use components from different suppliers including display panels, drives or memory sticks with similar specifications.


| SD Card Reader | |
| average JPG Copy Test (av. of 3 runs) | |
| Asus G701VO-CS74K | |
| Apple MacBook Pro Retina 13 inch 2013-10 | |
| Alienware 17 R3 (A17-9935) | |
| Lenovo Yoga 710-14ISK | |
| maximum AS SSD Seq Read Test (1GB) | |
| Asus G701VO-CS74K | |
| Lenovo Yoga 710-14ISK | |
| Alienware 17 R3 (A17-9935) | |
| Networking | |
| iperf Server (receive) TCP 1 m | |
| Apple MacBook 12 (Early 2016) 1.1 GHz | |
| Dell Inspiron 15 5568 | |
| iperf Client (transmit) TCP 1 m | |
| Apple MacBook 12 (Early 2016) 1.1 GHz | |
| Dell Inspiron 15 5568 | |
| |||||||||||||||||||||||||
tested with X-Rite i1Pro Basic 2
Maximum: 376.4 cd/m² (Nits) Average: 348.8 cd/m² Minimum: 39.7 cd/m²Brightness Distribution: 86 %
Center on Battery: 368.1 cd/m²
Contrast: 1008:1 (Black: 0.365 cd/m²)
ΔE ColorChecker Calman: 4.16 | ∀{0.5-29.43 Ø4.71}
ΔE Greyscale Calman: 3.86 | ∀{0.09-98 Ø4.96}
87.6% sRGB (Argyll 1.6.3 3D)
57.6% AdobeRGB 1998 (Argyll 1.6.3 3D)
64.1% AdobeRGB 1998 (Argyll 3D)
87.7% sRGB (Argyll 3D)
68.8% Display P3 (Argyll 3D)
Gamma: 2.19
CCT: 6892 K
| Asus G701VO-CS74K IPS, 17.3", 1920x1080 | Alienware 17 R3 (A17-9935) CV69H_173WF4 (LGD0459), IPS, 17.3", 1920x1080 | Eurocom Sky DLX7 IPS, 17.3", 3840x2160 | MSI GT72S 6QF Name: LG Philips LP173WF4-SPF1, ID: LGD0469, IPS, 17.3", 1920x1080 | Asus G752VY-RH71 ID: LG Philips LGD04E8, Name: LP173WF-SPF3, IPS, 17.3", 1920x1080 | |
|---|---|---|---|---|---|
| Display | -4% | 31% | -2% | -3% | |
| Display P3 Coverage (%) | 68.8 | 66.9 -3% | 86.3 25% | 67.6 -2% | 67.2 -2% |
| sRGB Coverage (%) | 87.7 | 83.9 -4% | 99.9 14% | 86.1 -2% | 85.2 -3% |
| AdobeRGB 1998 Coverage (%) | 64.1 | 61.4 -4% | 99.5 55% | 63 -2% | 62.3 -3% |
| Response Times | 0% | -30% | -29% | -28% | |
| Response Time Grey 50% / Grey 80% * (ms) | 29.2 ? | 33 ? -13% | 45 -54% | 43 ? -47% | 42.8 ? -47% |
| Response Time Black / White * (ms) | 26.4 ? | 23 ? 13% | 28 -6% | 29 ? -10% | 28.4 ? -8% |
| PWM Frequency (Hz) | |||||
| Screen | -8% | 3% | 7% | 1% | |
| Brightness middle (cd/m²) | 368.1 | 360 -2% | 324.1 -12% | 356.7 -3% | 346.8 -6% |
| Brightness (cd/m²) | 349 | 336 -4% | 314 -10% | 326 -7% | 330 -5% |
| Brightness Distribution (%) | 86 | 90 5% | 81 -6% | 85 -1% | 91 6% |
| Black Level * (cd/m²) | 0.365 | 0.44 -21% | 0.4 -10% | 0.282 23% | 0.393 -8% |
| Contrast (:1) | 1008 | 818 -19% | 810 -20% | 1265 25% | 882 -12% |
| Colorchecker dE 2000 * | 4.16 | 4.76 -14% | 4.57 -10% | 4.16 -0% | 3.72 11% |
| Colorchecker dE 2000 max. * | 8.7 | 10.8 -24% | 8.45 3% | ||
| Greyscale dE 2000 * | 3.86 | 3.69 4% | 2.81 27% | 2.47 36% | 2.93 24% |
| Gamma | 2.19 100% | 2.24 98% | 2.43 91% | 2.29 96% | 2.23 99% |
| CCT | 6892 94% | 6091 107% | 6313 103% | 6860 95% | 6525 100% |
| Color Space (Percent of AdobeRGB 1998) (%) | 57.6 | 55 -5% | 88 53% | 56 -3% | 56 -3% |
| Color Space (Percent of sRGB) (%) | 87.6 | 84 -4% | 100 14% | 85 -3% | 85.2 -3% |
| Total Average (Program / Settings) | -4% /
-6% | 1% /
4% | -8% /
0% | -10% /
-4% |
* ... smaller is better
Display Response Times
ℹ
Display response times show how fast the screen is able to change from one color to the next. Slow response times can lead to afterimages and can cause moving objects to appear blurry (ghosting). Gamers of fast-paced 3D titles should pay special attention to fast response times.| ↔ Response Time Black to White | ||
|---|---|---|
| 26.4 ms ... rise ↗ and fall ↘ combined | ↗ 5.2 ms rise | 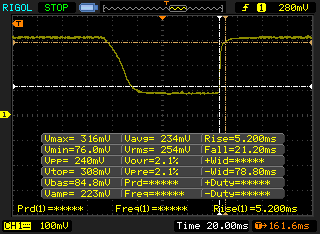 |
| ↘ 21.2 ms fall | ||
| The screen shows relatively slow response rates in our tests and may be too slow for gamers. In comparison, all tested devices range from 0.1 (minimum) to 240 (maximum) ms. » 66 % of all devices are better. This means that the measured response time is worse than the average of all tested devices (19.8 ms). | ||
| ↔ Response Time 50% Grey to 80% Grey | ||
| 29.2 ms ... rise ↗ and fall ↘ combined | ↗ 11.6 ms rise | 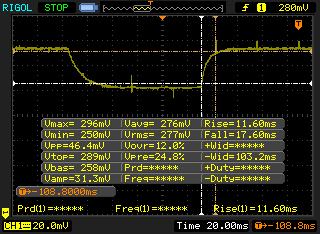 |
| ↘ 17.6 ms fall | ||
| The screen shows relatively slow response rates in our tests and may be too slow for gamers. In comparison, all tested devices range from 0.165 (minimum) to 636 (maximum) ms. » 40 % of all devices are better. This means that the measured response time is similar to the average of all tested devices (31 ms). | ||
Screen Flickering / PWM (Pulse-Width Modulation)
ℹ
To dim the screen, some notebooks will simply cycle the backlight on and off in rapid succession - a method called Pulse Width Modulation (PWM) . This cycling frequency should ideally be undetectable to the human eye. If said frequency is too low, users with sensitive eyes may experience strain or headaches or even notice the flickering altogether.| Screen flickering / PWM not detected | 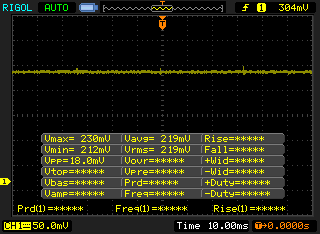 | ||
In comparison: 52 % of all tested devices do not use PWM to dim the display. If PWM was detected, an average of 7754 (minimum: 5 - maximum: 343500) Hz was measured. | |||
| Cinebench R15 | |
| CPU Single 64Bit (sort by value) | |
| Asus G701VO-CS74K | |
| DogHouse Systems Mobius SS | |
| Asus Strix GL502VY-DS71 | |
| MSI GE62 2QC-468XPL | |
| Clevo P150SM-A | |
| CPU Multi 64Bit (sort by value) | |
| Asus G701VO-CS74K | |
| DogHouse Systems Mobius SS | |
| Asus Strix GL502VY-DS71 | |
| MSI GE62 2QC-468XPL | |
| Clevo P150SM-A | |
| Cinebench R11.5 | |
| CPU Single 64Bit (sort by value) | |
| Asus G701VO-CS74K | |
| DogHouse Systems Mobius SS | |
| Asus Strix GL502VY-DS71 | |
| MSI GE62 2QC-468XPL | |
| Clevo P150SM-A | |
| CPU Multi 64Bit (sort by value) | |
| Asus G701VO-CS74K | |
| DogHouse Systems Mobius SS | |
| Asus Strix GL502VY-DS71 | |
| MSI GE62 2QC-468XPL | |
| Clevo P150SM-A | |
| Cinebench R10 | |
| Rendering Multiple CPUs 32Bit (sort by value) | |
| Asus G701VO-CS74K | |
| DogHouse Systems Mobius SS | |
| Asus Strix GL502VY-DS71 | |
| MSI GE62 2QC-468XPL | |
| Clevo P150SM-A | |
| Rendering Single 32Bit (sort by value) | |
| Asus G701VO-CS74K | |
| DogHouse Systems Mobius SS | |
| Asus Strix GL502VY-DS71 | |
| MSI GE62 2QC-468XPL | |
| Clevo P150SM-A | |
| wPrime 2.10 - 1024m (sort by value) | |
| Asus G701VO-CS74K | |
| DogHouse Systems Mobius SS | |
| Asus Strix GL502VY-DS71 | |
| MSI GE62 2QC-468XPL | |
| Clevo P150SM-A | |
| Super Pi Mod 1.5 XS 32M - 32M (sort by value) | |
| Asus G701VO-CS74K | |
| DogHouse Systems Mobius SS | |
| Asus Strix GL502VY-DS71 | |
| MSI GE62 2QC-468XPL | |
| Clevo P150SM-A | |
* ... smaller is better
| PCMark 8 | |
| Home Score Accelerated v2 (sort by value) | |
| Asus G701VO-CS74K | |
| MSI GT72S 6QF | |
| DogHouse Systems Mobius SS | |
| Acer Predator 17 G9-791-75PV | |
| Alienware 17 R2 | |
| Work Score Accelerated v2 (sort by value) | |
| Asus G701VO-CS74K | |
| MSI GT72S 6QF | |
| DogHouse Systems Mobius SS | |
| Alienware 17 R2 | |
| Creative Score Accelerated v2 (sort by value) | |
| Asus G701VO-CS74K | |
| MSI GT72S 6QF | |
| DogHouse Systems Mobius SS | |
| Acer Predator 17 G9-791-75PV | |
| PCMark 8 Home Score Accelerated v2 | 5160 points | |
| PCMark 8 Creative Score Accelerated v2 | 7460 points | |
| PCMark 8 Work Score Accelerated v2 | 5653 points | |
Help | ||
| Asus G701VO-CS74K 2x Samsung SM951 MZVPV512HDGL (RAID 0) | Alienware 17 R3 (A17-9935) Samsung PM951 NVMe 512 GB | Eurocom Sky DLX7 Samsung SM951 MZVPV512HDGL m.2 PCI-e | MSI GT72S 6QE-071PL 2x Toshiba HG6 THNSNJ128G8NU (RAID 0) | Asus G752VY-RH71 Samsung SSD 950 Pro 512GB m.2 NVMe | |
|---|---|---|---|---|---|
| CrystalDiskMark 3.0 | -40% | -7% | -22% | -13% | |
| Read Seq (MB/s) | 3067 | 1263 -59% | 1819 -41% | 3047 -1% | 2007 -35% |
| Write Seq (MB/s) | 2434 | 587 -76% | 1566 -36% | 979 -60% | 1536 -37% |
| Read 512 (MB/s) | 1582 | 569 -64% | 1056 -33% | 1599 1% | 1022 -35% |
| Write 512 (MB/s) | 2255 | 265.2 -88% | 1561 -31% | 1002 -56% | 1510 -33% |
| Read 4k (MB/s) | 47.25 | 42.59 -10% | 54 14% | 39.91 -16% | 51.6 9% |
| Write 4k (MB/s) | 110.7 | 140.6 27% | 166.7 51% | 104.7 -5% | 150.2 36% |
| Read 4k QD32 (MB/s) | 584 | 610 4% | 758 30% | 535 -8% | 576 -1% |
| Write 4k QD32 (MB/s) | 463.3 | 232.8 -50% | 421.8 -9% | 325.4 -30% | 413.7 -11% |

2x Samsung SM951 MZVPV512HDGL (RAID 0)
Sequential Read:
3067 MB/s
Sequential Write:
2434 MB/s
512K Read:
1582 MB/s
512K Write:
2255 MB/s
4K Read:
47.25 MB/s
4K Write:
110.7 MB/s
4K QD32 Read:
584 MB/s
4K QD32 Write:
463.3 MB/s
| 3DMark 11 | |
| 1280x720 Performance GPU (sort by value) | |
| Asus G701VO-CS74K | |
| Asus Strix GTX 980 Ti Desktop PC | |
| MSI GT80-2QES32SR311BW | |
| Asus Strix GL502VY-DS71 | |
| Asus Strix GL502VT-DS74 | |
| MSI Prestige PE70 6QE-055XUS | |
| 1280x720 Performance Combined (sort by value) | |
| Asus G701VO-CS74K | |
| Asus Strix GTX 980 Ti Desktop PC | |
| MSI GT80-2QES32SR311BW | |
| Asus Strix GL502VY-DS71 | |
| Asus Strix GL502VT-DS74 | |
| MSI Prestige PE70 6QE-055XUS | |
| 3DMark | |
| 1920x1080 Fire Strike Graphics (sort by value) | |
| Asus G701VO-CS74K | |
| Asus Strix GTX 980 Ti Desktop PC | |
| MSI GT80-2QES32SR311BW | |
| Asus Strix GL502VY-DS71 | |
| Asus Strix GL502VT-DS74 | |
| MSI Prestige PE70 6QE-055XUS | |
| Fire Strike Extreme Graphics (sort by value) | |
| Asus G701VO-CS74K | |
| Asus Strix GTX 980 Ti Desktop PC | |
| Asus Strix GL502VY-DS71 | |
| Asus Strix GL502VT-DS74 | |
| MSI Prestige PE70 6QE-055XUS | |
| 3840x2160 Fire Strike Ultra Graphics (sort by value) | |
| Asus G701VO-CS74K | |
| Asus Strix GTX 980 Ti Desktop PC | |
| Asus Strix GL502VY-DS71 | |
| 3DMark 11 Performance | 14046 points | |
| 3DMark Ice Storm Standard Score | 120819 points | |
| 3DMark Cloud Gate Standard Score | 24329 points | |
| 3DMark Fire Strike Score | 10869 points | |
| 3DMark Fire Strike Extreme Score | 5753 points | |
Help | ||
BioShock Infinite | Sleeping Dogs | Metro: Last Light | Thief | Batman: Arkham Knight | Fallout 4 | Rise of the Tomb Raider | Doom | Overwatch
| BioShock Infinite - 1920x1080 Ultra Preset, DX11 (DDOF) | |
| Asus Strix GTX 980 Ti Desktop PC | |
| MSI GT80 Titan SLI | |
| Asus G701VO-CS74K | |
| Asus Strix GL502VY-DS71 | |
| Asus Strix GL502VT-DS74 | |
| MSI Prestige PE70 6QE-055XUS | |
| Sleeping Dogs - 1920x1080 Extreme Preset AA:Extreme | |
| MSI GT80 Titan SLI | |
| Asus G701VO-CS74K | |
| Asus Strix GL502VY-DS71 | |
| Asus Strix GL502VT-DS74 | |
| MSI Prestige PE70 6QE-055XUS | |
| Metro: Last Light - 1920x1080 Very High (DX11) AF:16x | |
| Asus Strix GTX 980 Ti Desktop PC | |
| Asus G701VO-CS74K | |
| MSI GT80 Titan SLI | |
| Asus Strix GL502VT-DS74 | |
| MSI Prestige PE70 6QE-055XUS | |
| Thief - 1920x1080 Very High Preset AA:FXAA & High SS AF:8x | |
| MSI GT80 Titan SLI | |
| Asus G701VO-CS74K | |
| Asus Strix GL502VY-DS71 | |
| Asus Strix GL502VT-DS74 | |
| MSI Prestige PE70 6QE-055XUS | |
| Batman: Arkham Knight - 1920x1080 High / On AA:SM AF:16x | |
| Asus G701VO-CS74K | |
| MSI GT80 Titan SLI | |
| Asus Strix GL502VT-DS74 | |
| Fallout 4 - 1920x1080 Ultra Preset AA:T AF:16x | |
| Asus Strix GTX 980 Ti Desktop PC | |
| Asus G701VO-CS74K | |
| Asus Strix GL502VY-DS71 | |
| Asus Strix GL502VT-DS74 | |
| MSI Prestige PE70 6QE-055XUS | |
| Rise of the Tomb Raider - 1920x1080 Very High Preset AA:FX AF:16x | |
| Asus Strix GTX 980 Ti Desktop PC | |
| Asus G701VO-CS74K | |
| Asus Strix GL502VY-DS71 | |
| Asus Strix GL502VT-DS74 | |
| MSI Prestige PE70 6QE-055XUS | |
| Doom - 1920x1080 Ultra Preset AA:SM | |
| Asus Strix GTX 980 Ti Desktop PC | |
| Asus G701VO-CS74K | |
| Asus Strix GL502VY-DS71 | |
| Overwatch - 1920x1080 Epic (Render Scale 100 %) AA:SM AF:16x | |
| Asus Strix GTX 980 Ti Desktop PC | |
| Asus G701VO-CS74K | |
| Asus Strix GL502VY-DS71 | |
| low | med. | high | ultra | |
|---|---|---|---|---|
| Sleeping Dogs (2012) | 75.2 | |||
| BioShock Infinite (2013) | 106.2 | |||
| Metro: Last Light (2013) | 88.3 | |||
| Thief (2014) | 67.9 | |||
| Batman: Arkham Knight (2015) | 63 | |||
| Metal Gear Solid V (2015) | 60 | |||
| Fallout 4 (2015) | 79.3 | |||
| Rise of the Tomb Raider (2016) | 60.4 | |||
| Doom (2016) | 84.3 | |||
| Overwatch (2016) | 118.2 |
Noise level
| Idle |
| 29.1 / 31.9 / 31.9 dB(A) |
| Load |
| 46 / 47.5 dB(A) |
 | ||
30 dB silent 40 dB(A) audible 50 dB(A) loud |
||
min: | ||
| Asus G701VO-CS74K GeForce GTX 980 (Laptop), 6820HK, 2x Samsung SM951 MZVPV512HDGL (RAID 0) | Alienware 17 R3 (A17-9935) GeForce GTX 980M, 6700HQ, Samsung PM951 NVMe 512 GB | Asus GX700 GeForce GTX 980 (Laptop), 6820HK, 2x Samsung SM951 MZVPV512HDGL (RAID 0) | Asus G752VY-GC110T GeForce GTX 980M, 6700HQ, Plextor PX-G256M6e | MSI GT72S 6QF GeForce GTX 980 (Laptop), 6820HK, 2x Micron M600 MTFDDAV128MBF NVMe (RAID 0) | |
|---|---|---|---|---|---|
| Noise | -0% | -11% | 3% | -6% | |
| off / environment * (dB) | 29.1 | 30 -3% | |||
| Idle Minimum * (dB) | 29.1 | 31 -7% | 33 -13% | 31.2 -7% | 33.1 -14% |
| Idle Average * (dB) | 31.9 | 32 -0% | 35 -10% | 31.9 -0% | 33.3 -4% |
| Idle Maximum * (dB) | 31.9 | 33 -3% | 42 -32% | 32.8 -3% | 37 -16% |
| Load Average * (dB) | 46 | 38 17% | 46 -0% | 38.2 17% | 39 15% |
| Load Maximum * (dB) | 47.5 | 50 -5% | 48 -1% | 44 7% | 52.2 -10% |
* ... smaller is better
(±) The average temperature for the upper side under maximal load is 36 °C / 97 F, compared to the average of 33.9 °C / 93 F for the devices in the class Gaming.
(-) The maximum temperature on the upper side is 55 °C / 131 F, compared to the average of 40.4 °C / 105 F, ranging from 21.2 to 68.8 °C for the class Gaming.
(-) The bottom heats up to a maximum of 49.8 °C / 122 F, compared to the average of 43.2 °C / 110 F
(+) In idle usage, the average temperature for the upper side is 25.8 °C / 78 F, compared to the device average of 33.9 °C / 93 F.
(+) The palmrests and touchpad are cooler than skin temperature with a maximum of 26.8 °C / 80.2 F and are therefore cool to the touch.
(±) The average temperature of the palmrest area of similar devices was 28.8 °C / 83.8 F (+2 °C / 3.6 F).
Power Consumption
| Off / Standby | |
| Idle | |
| Load |
|
Key:
min: | |
| Asus G701VO-CS74K 6820HK, GeForce GTX 980 (Laptop), 2x Samsung SM951 MZVPV512HDGL (RAID 0), IPS, 1920x1080, 17.3" | Alienware 17 R3 (A17-9935) 6700HQ, GeForce GTX 980M, Samsung PM951 NVMe 512 GB, IPS, 1920x1080, 17.3" | Asus GX700 6820HK, GeForce GTX 980 (Laptop), 2x Samsung SM951 MZVPV512HDGL (RAID 0), IPS, 1920x1080, 17.3" | Asus G752VL-T7023T 6700HQ, GeForce GTX 965M, Samsung SSD 950 Pro 512GB m.2 NVMe, IPS, 1920x1080, 17.3" | MSI GT72S 6QE-071PL 6820HK, GeForce GTX 980M, 2x Toshiba HG6 THNSNJ128G8NU (RAID 0), IPS, 1920x1080, 17.3" | |
|---|---|---|---|---|---|
| Power Consumption | 31% | -42% | 26% | 0% | |
| Idle Minimum * (Watt) | 28.2 | 12 57% | 40 -42% | 14.5 49% | 14.5 49% |
| Idle Average * (Watt) | 32 | 18 44% | 45 -41% | 22.3 30% | 28.3 12% |
| Idle Maximum * (Watt) | 32.6 | 26 20% | 51 -56% | 29.4 10% | 44 -35% |
| Load Average * (Watt) | 162.2 | 95 41% | 149 8% | 110.5 32% | 165.5 -2% |
| Load Maximum * (Watt) | 173.5 | 188 -8% | 313 -80% | 160.8 7% | 214.8 -24% |
* ... smaller is better
| Asus G701VO-CS74K 6820HK, GeForce GTX 980 (Laptop), 93 Wh | Alienware 17 R3 (A17-9935) 6700HQ, GeForce GTX 980M, 92 Wh | Eurocom Sky DLX7 6700K, GeForce GTX 980 (Laptop), 82 Wh | Asus G752VY-RH71 6700HQ, GeForce GTX 980M, 67 Wh | MSI GT72S 6QF 6820HK, GeForce GTX 980 (Laptop), 83 Wh | |
|---|---|---|---|---|---|
| Battery runtime | 118% | -25% | 28% | 36% | |
| Reader / Idle (h) | 4 | 12.6 215% | 2.6 -35% | 6.1 53% | 6.5 63% |
| WiFi v1.3 (h) | 3.4 | 7.4 118% | 2.3 -32% | 4 18% | 4.9 44% |
| Load (h) | 1.5 | 1.8 20% | 1.4 -7% | 1.7 13% | 1.5 0% |
Pros
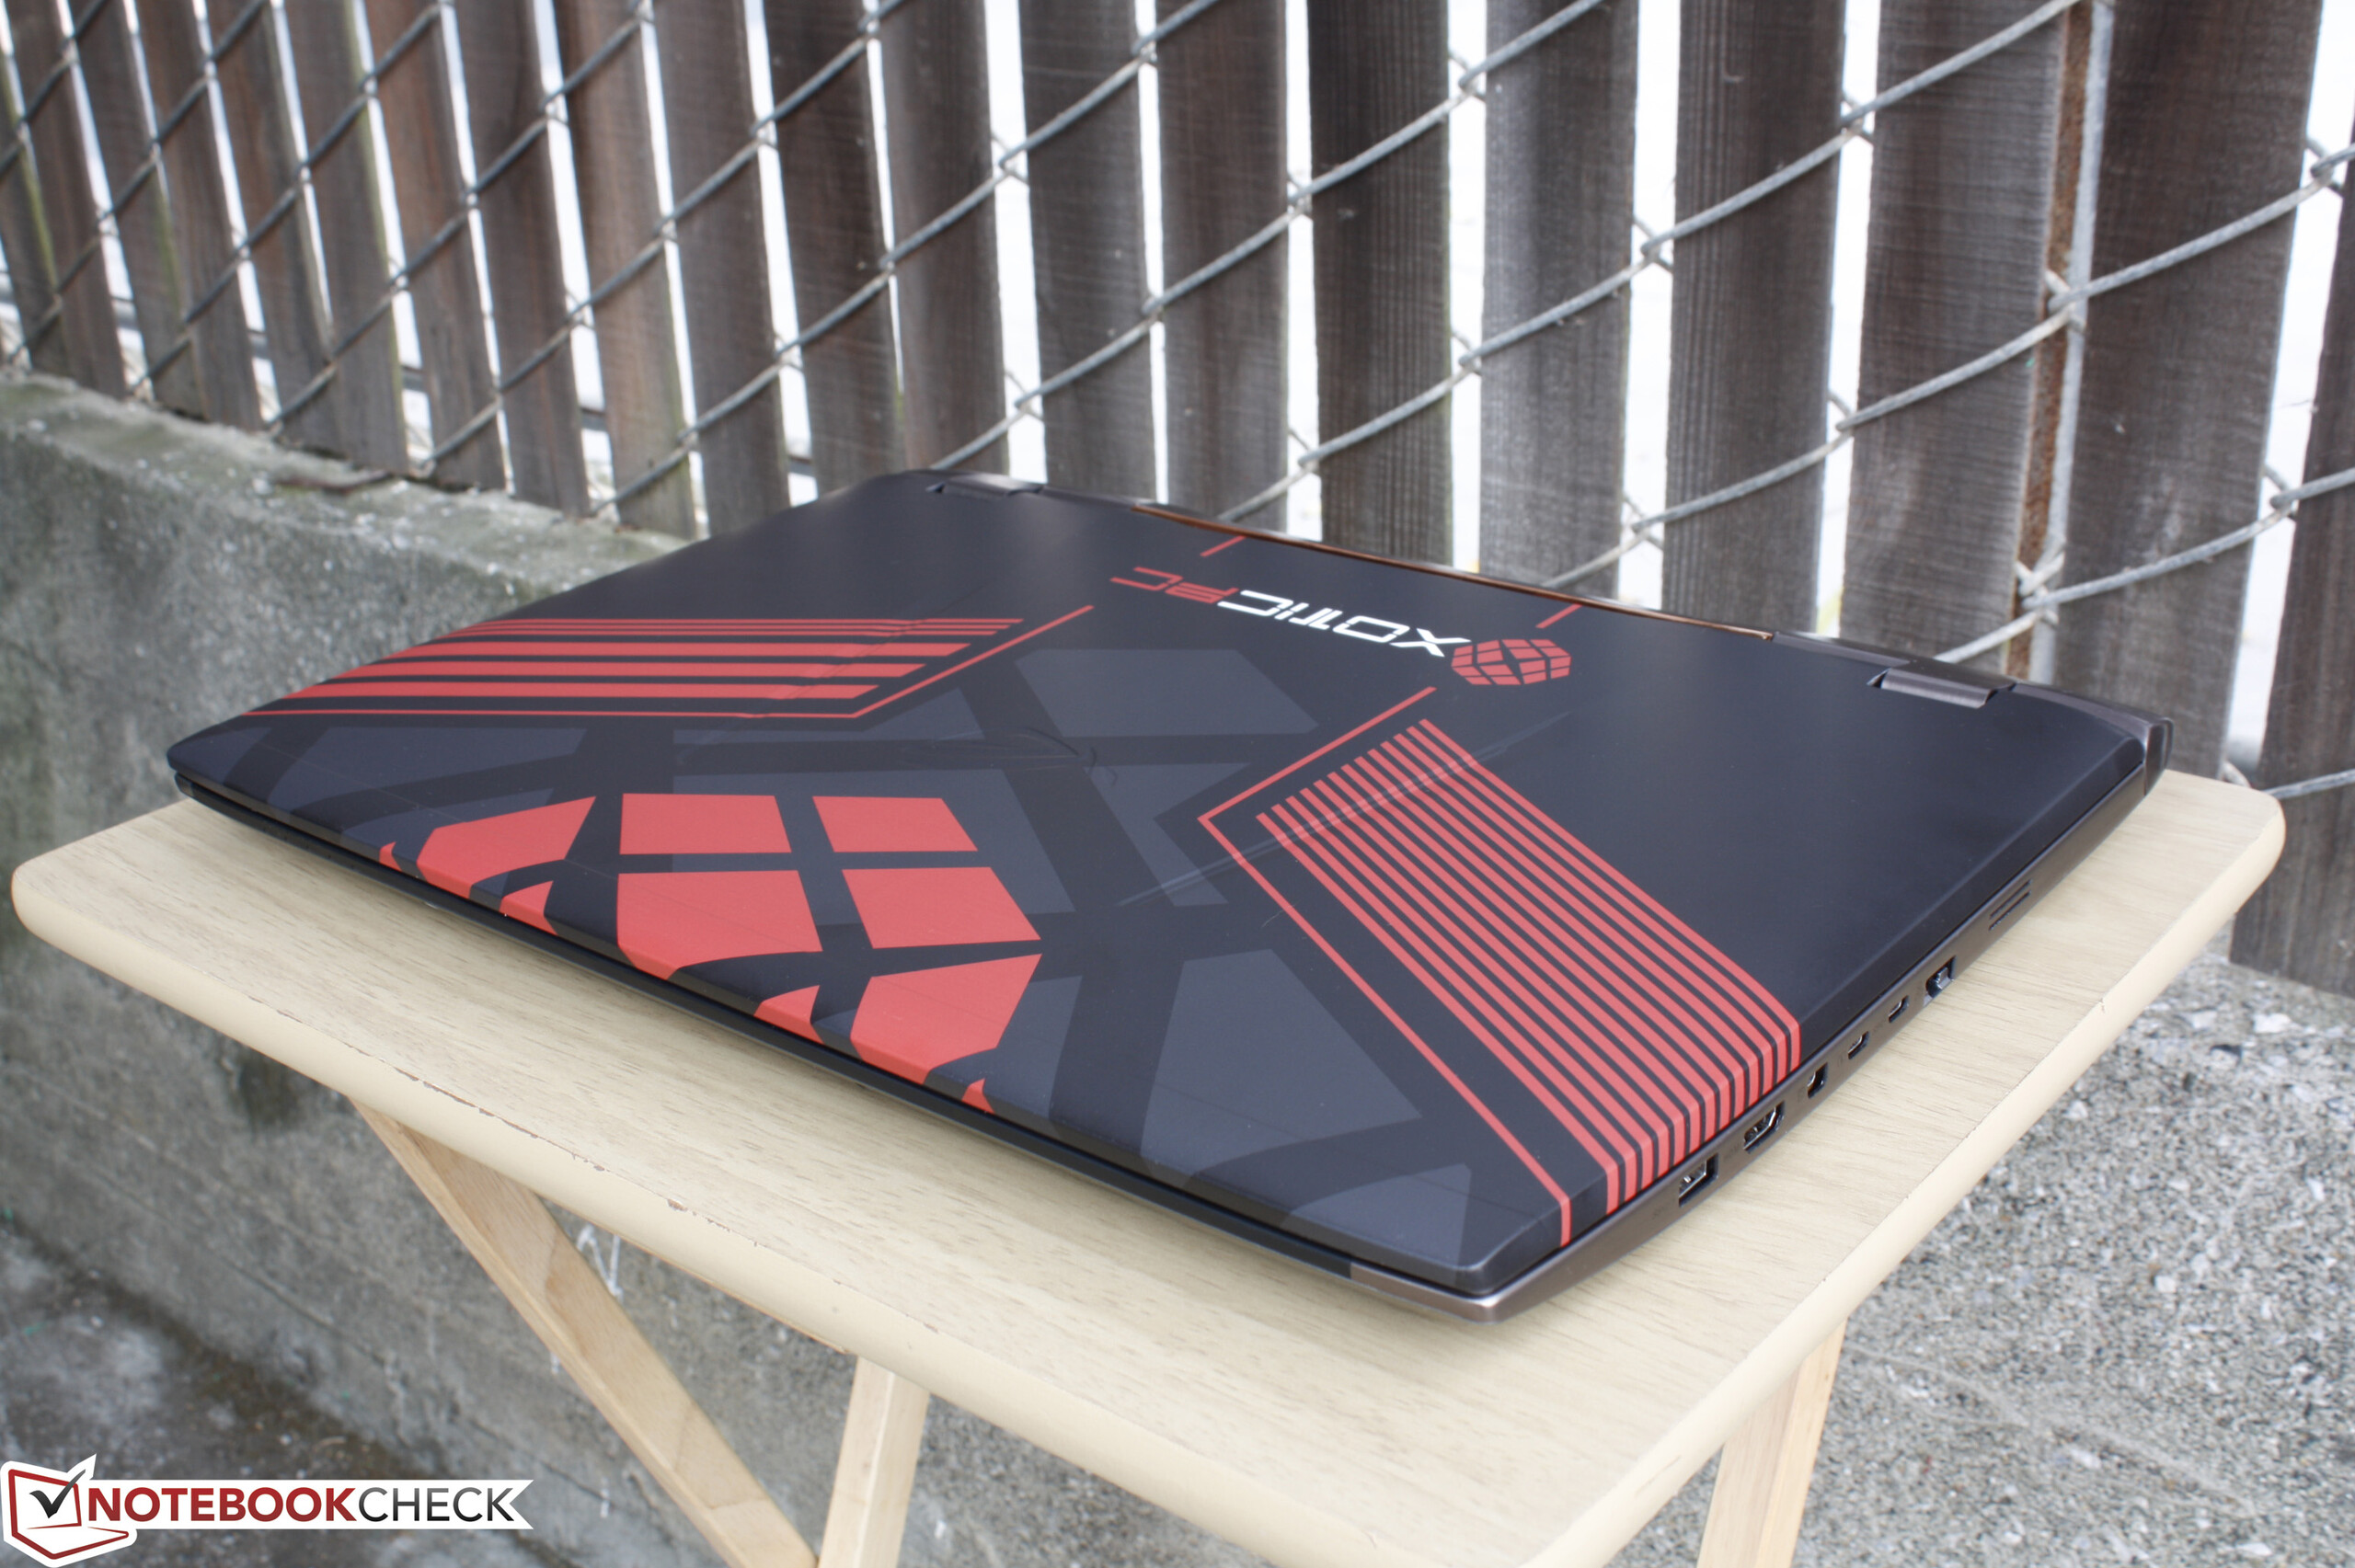
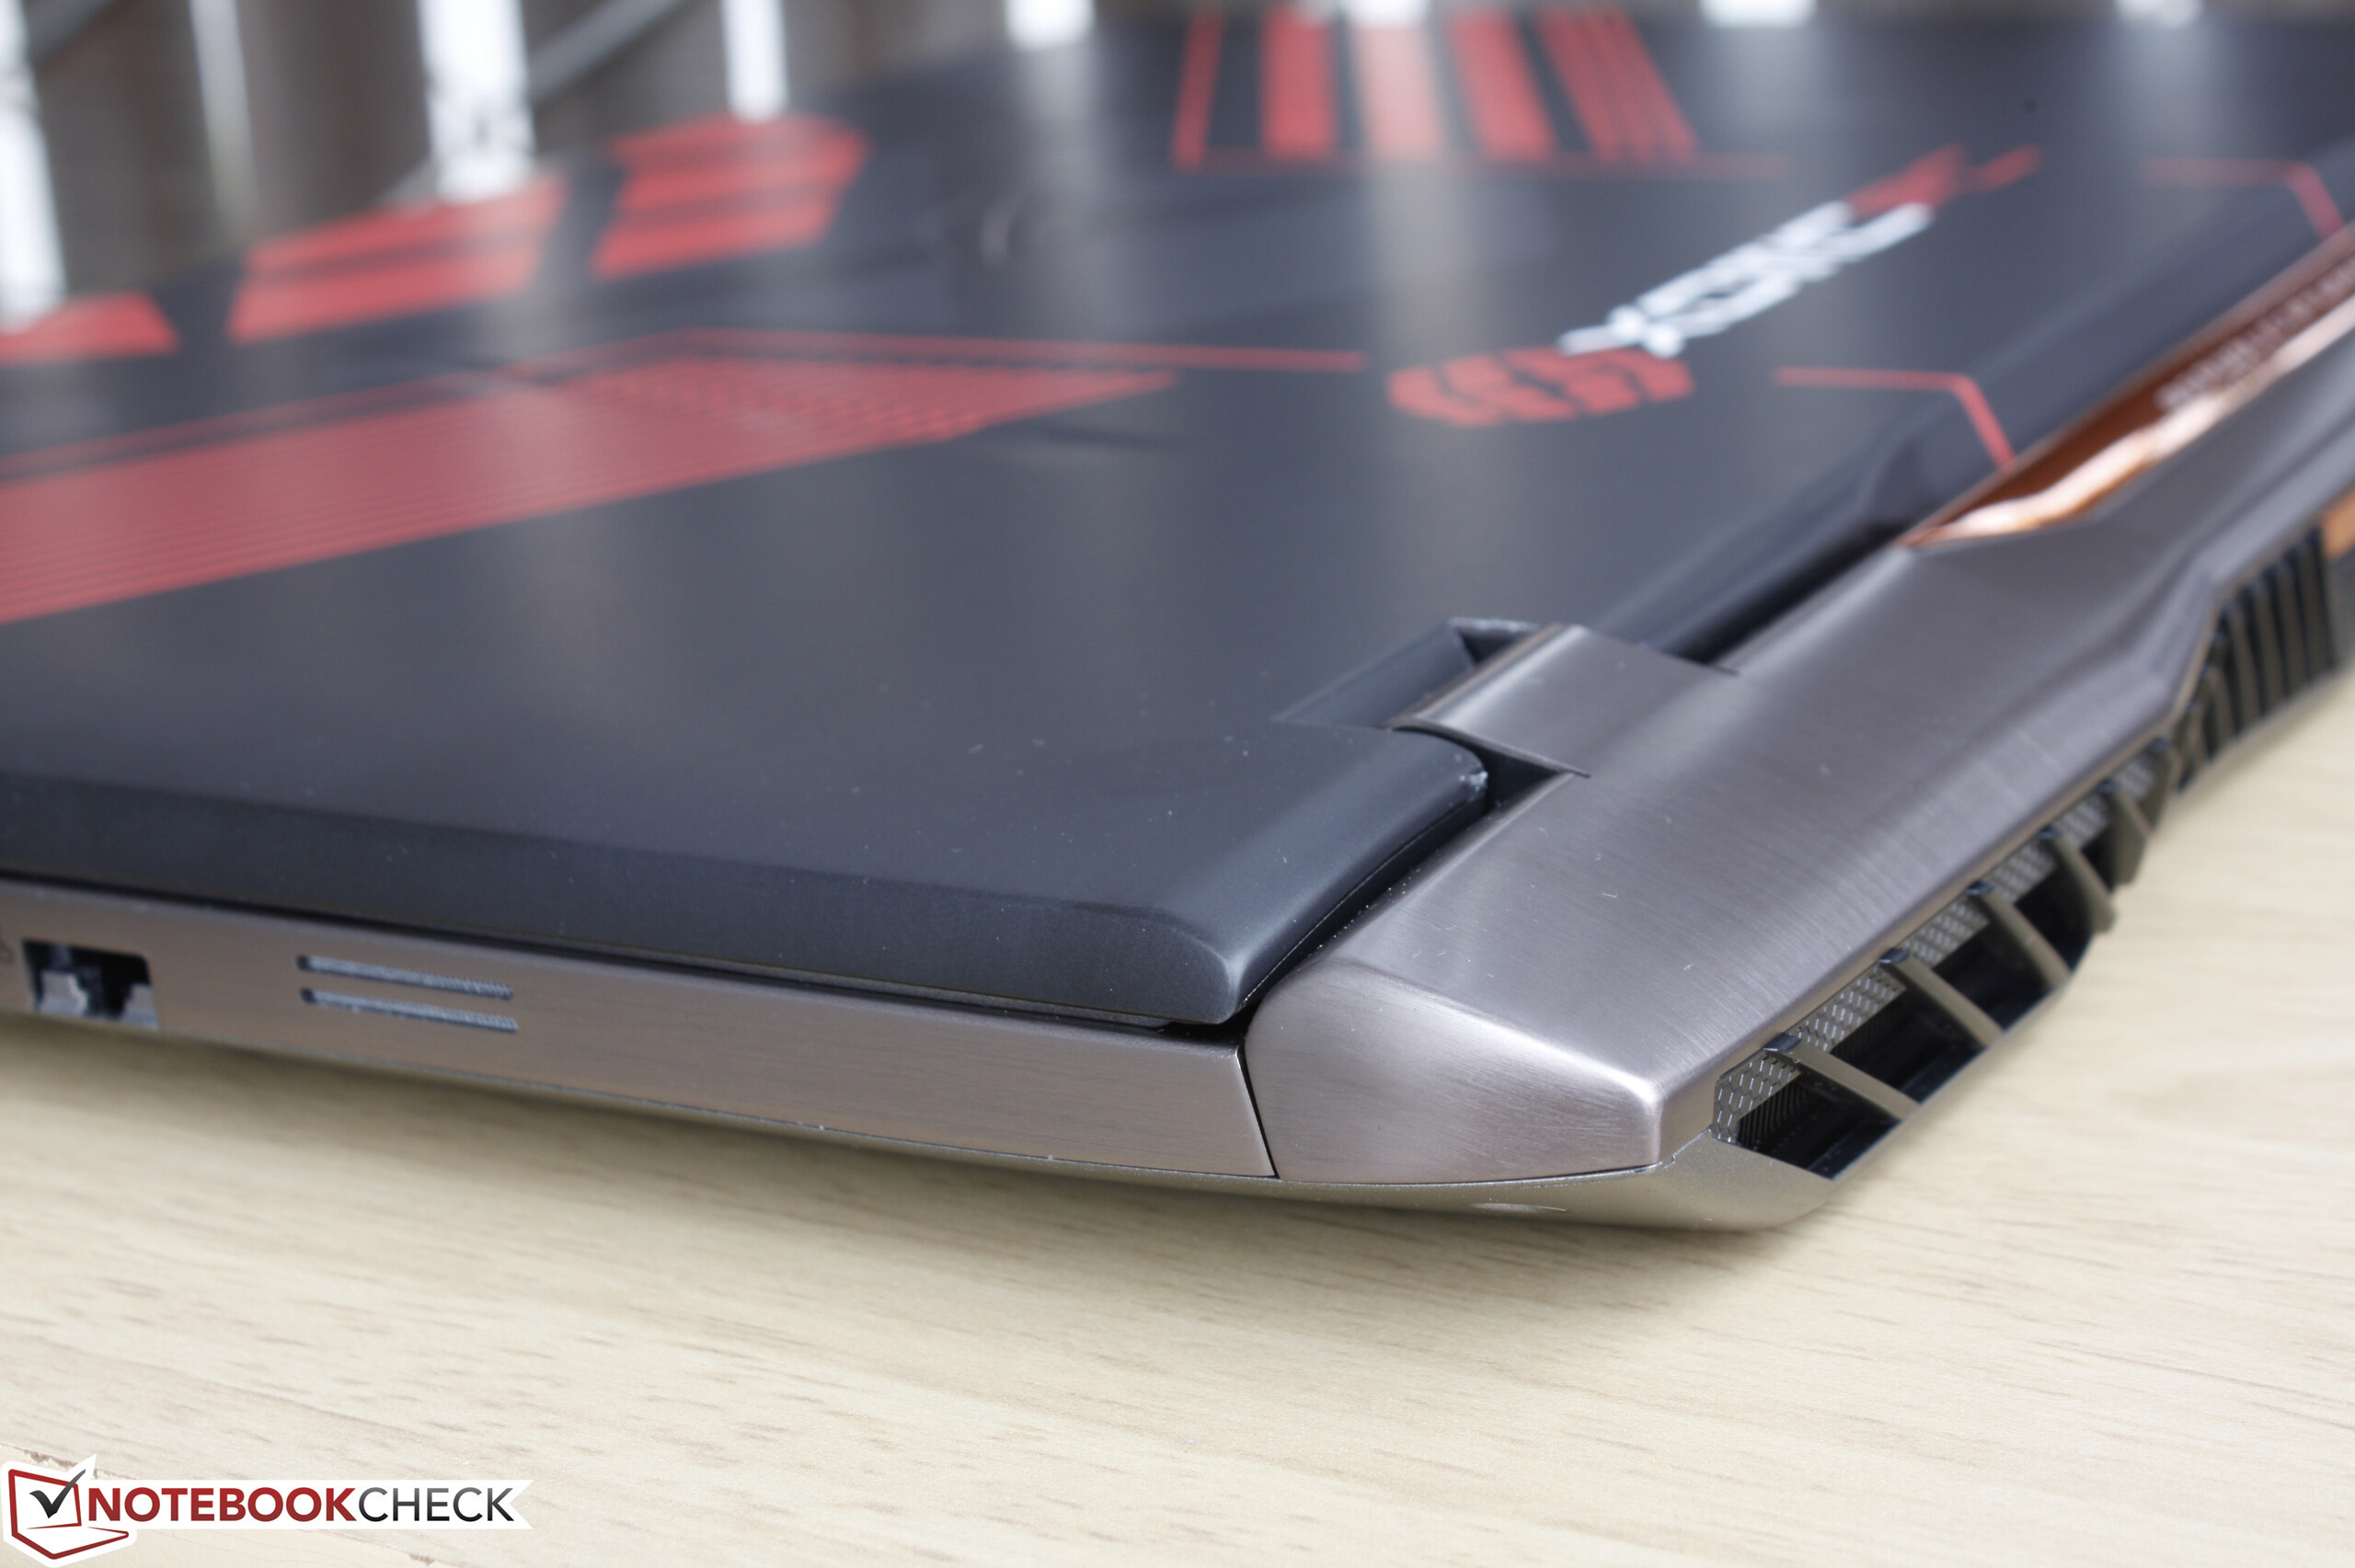
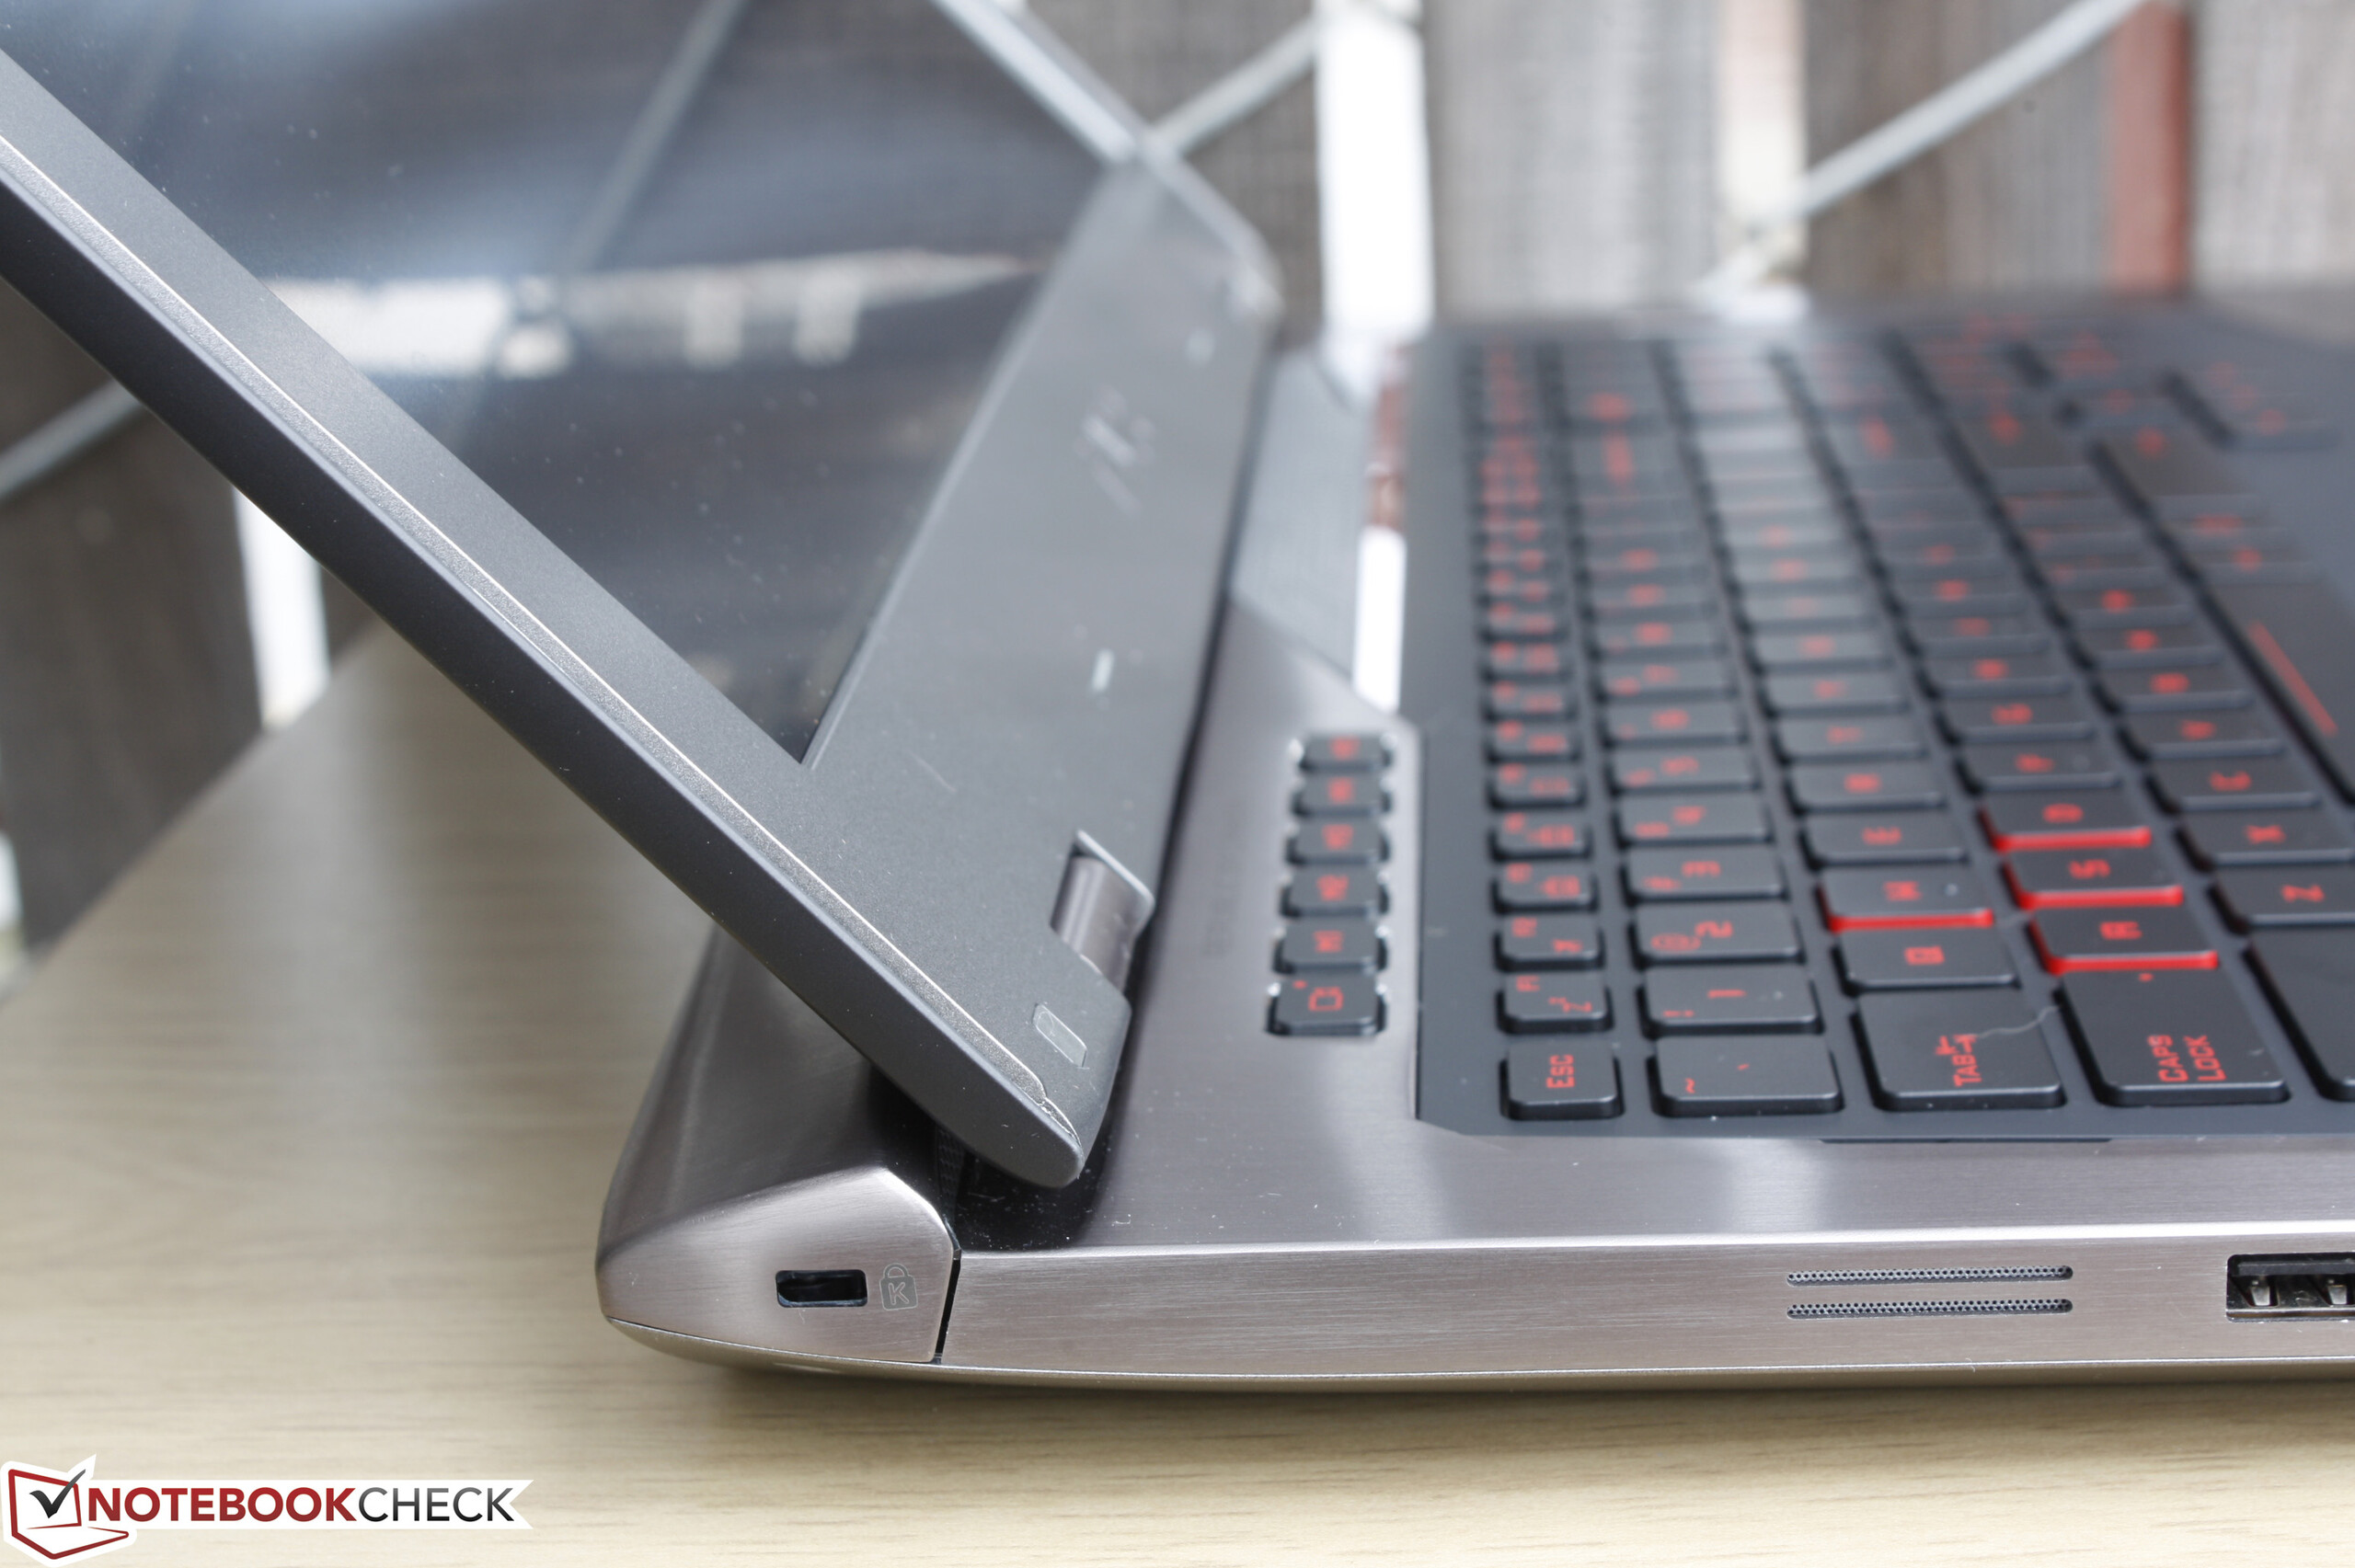
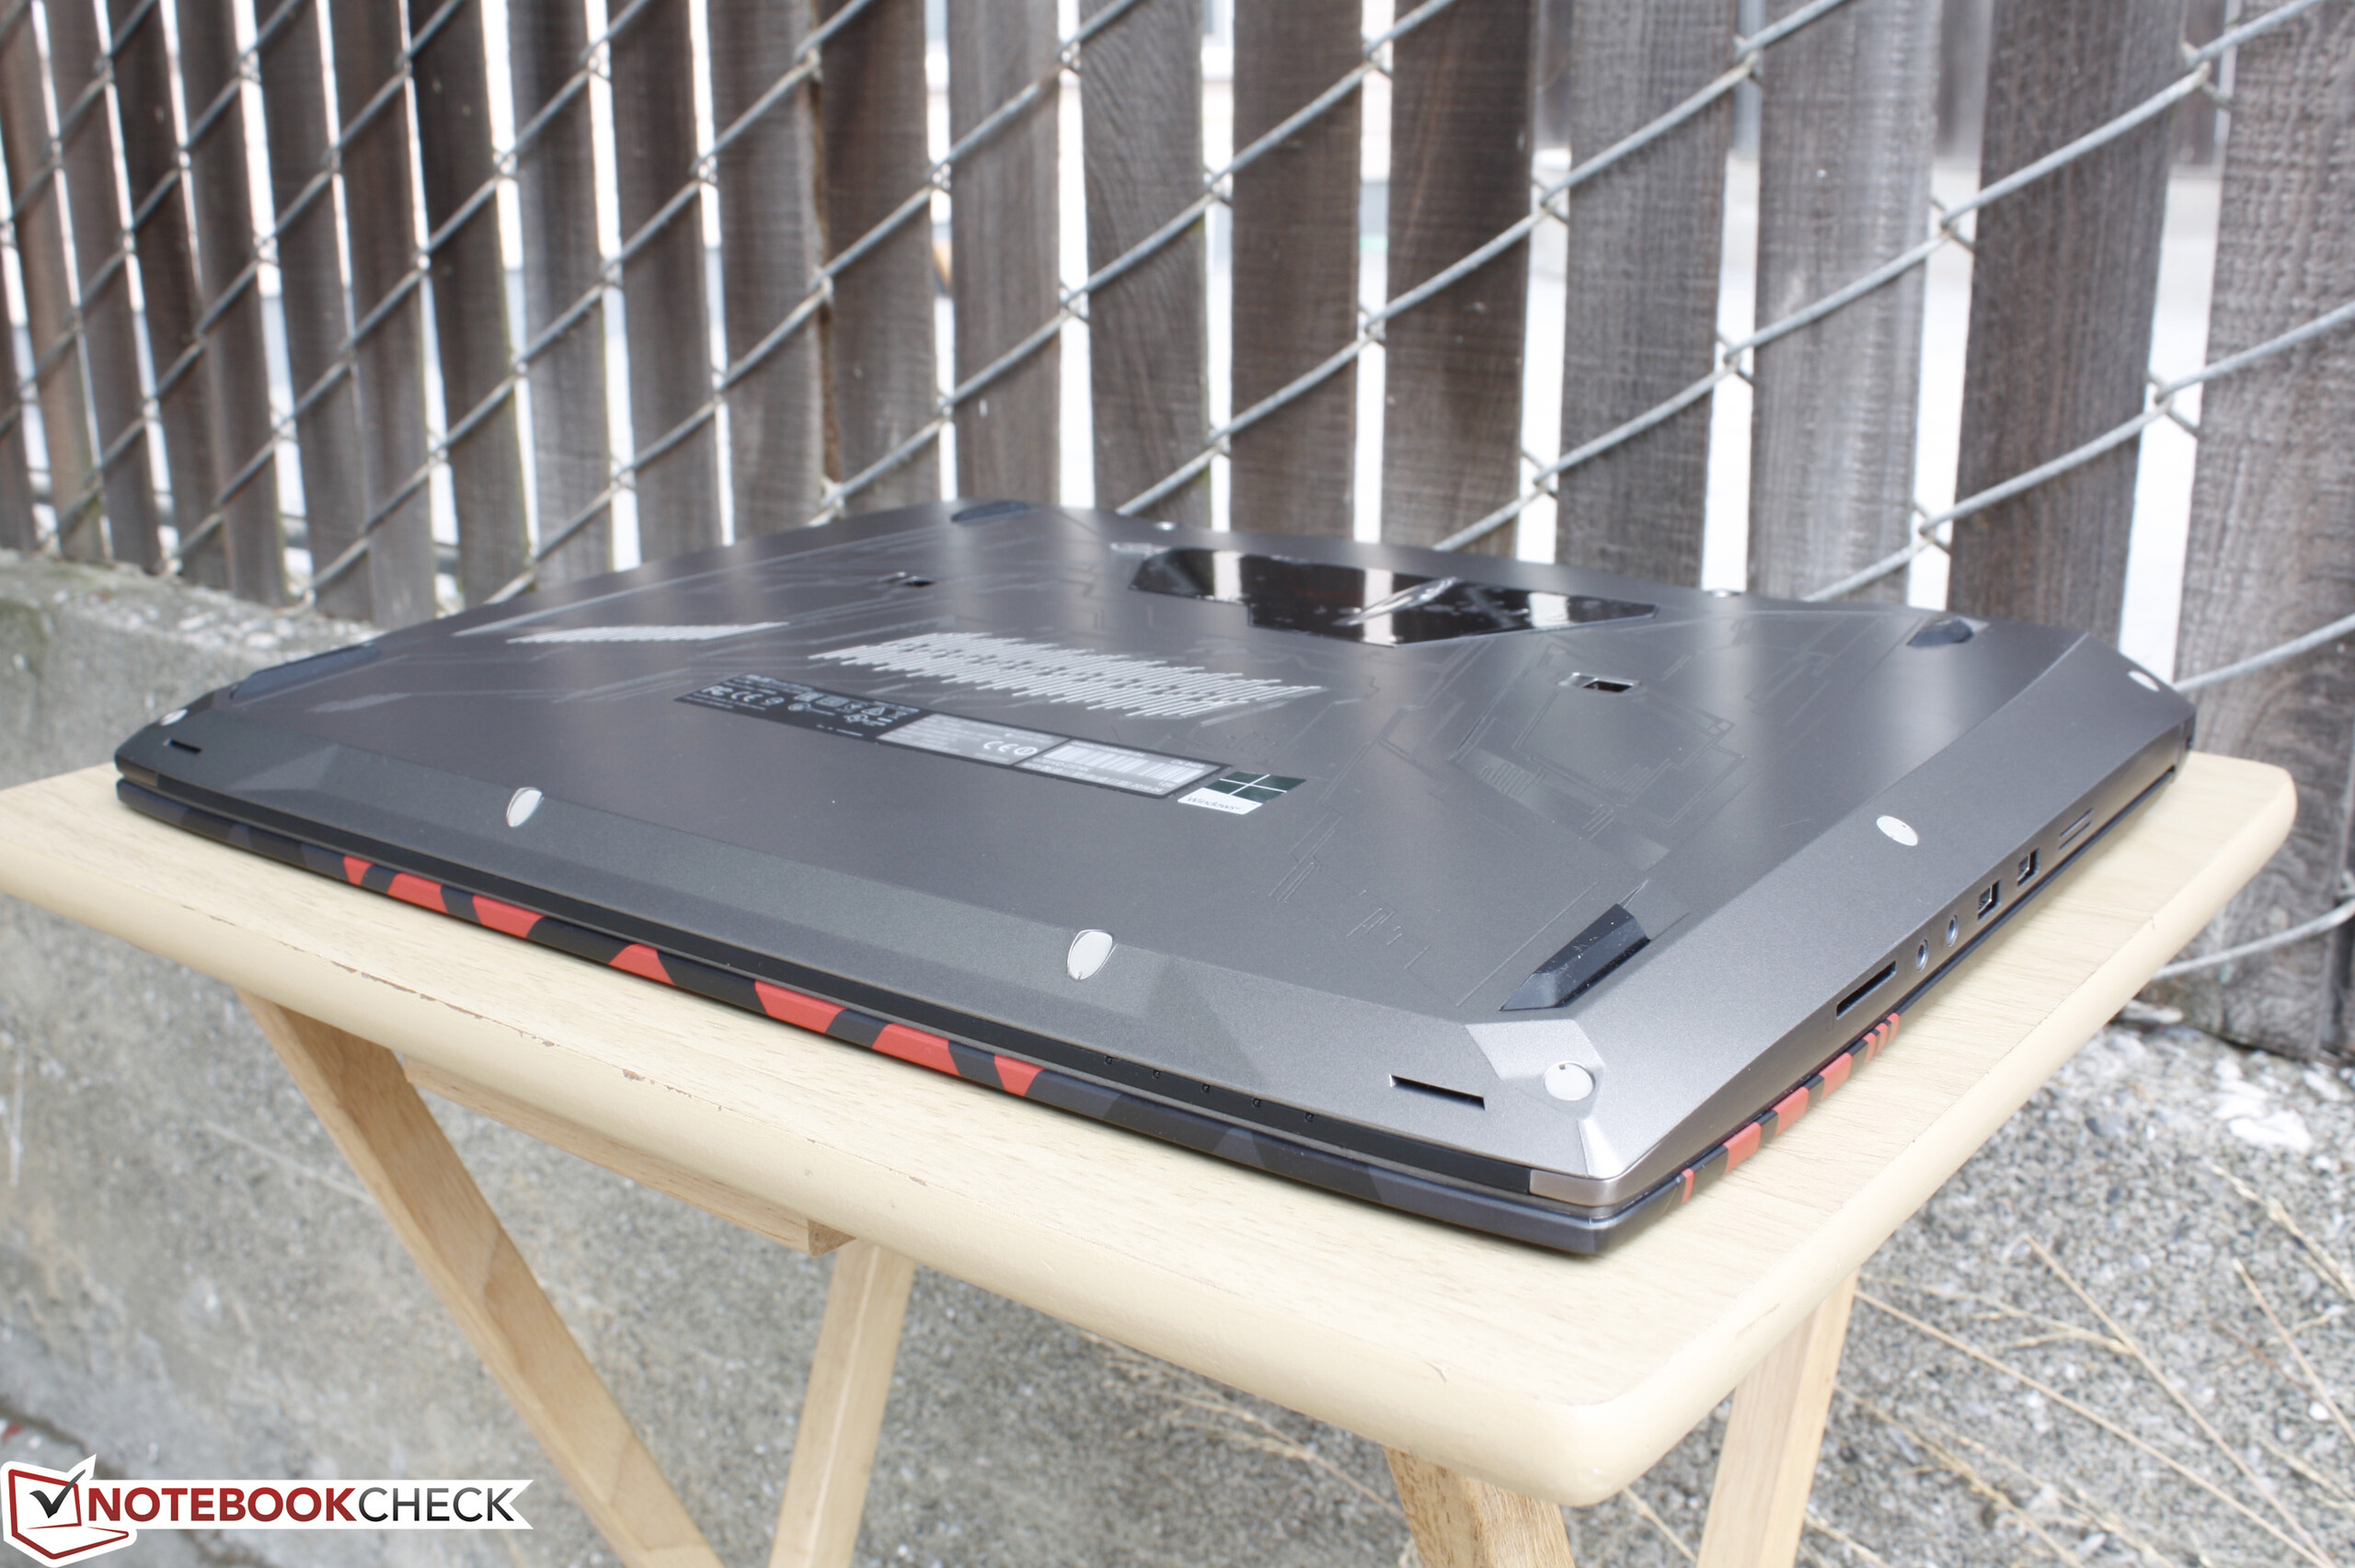
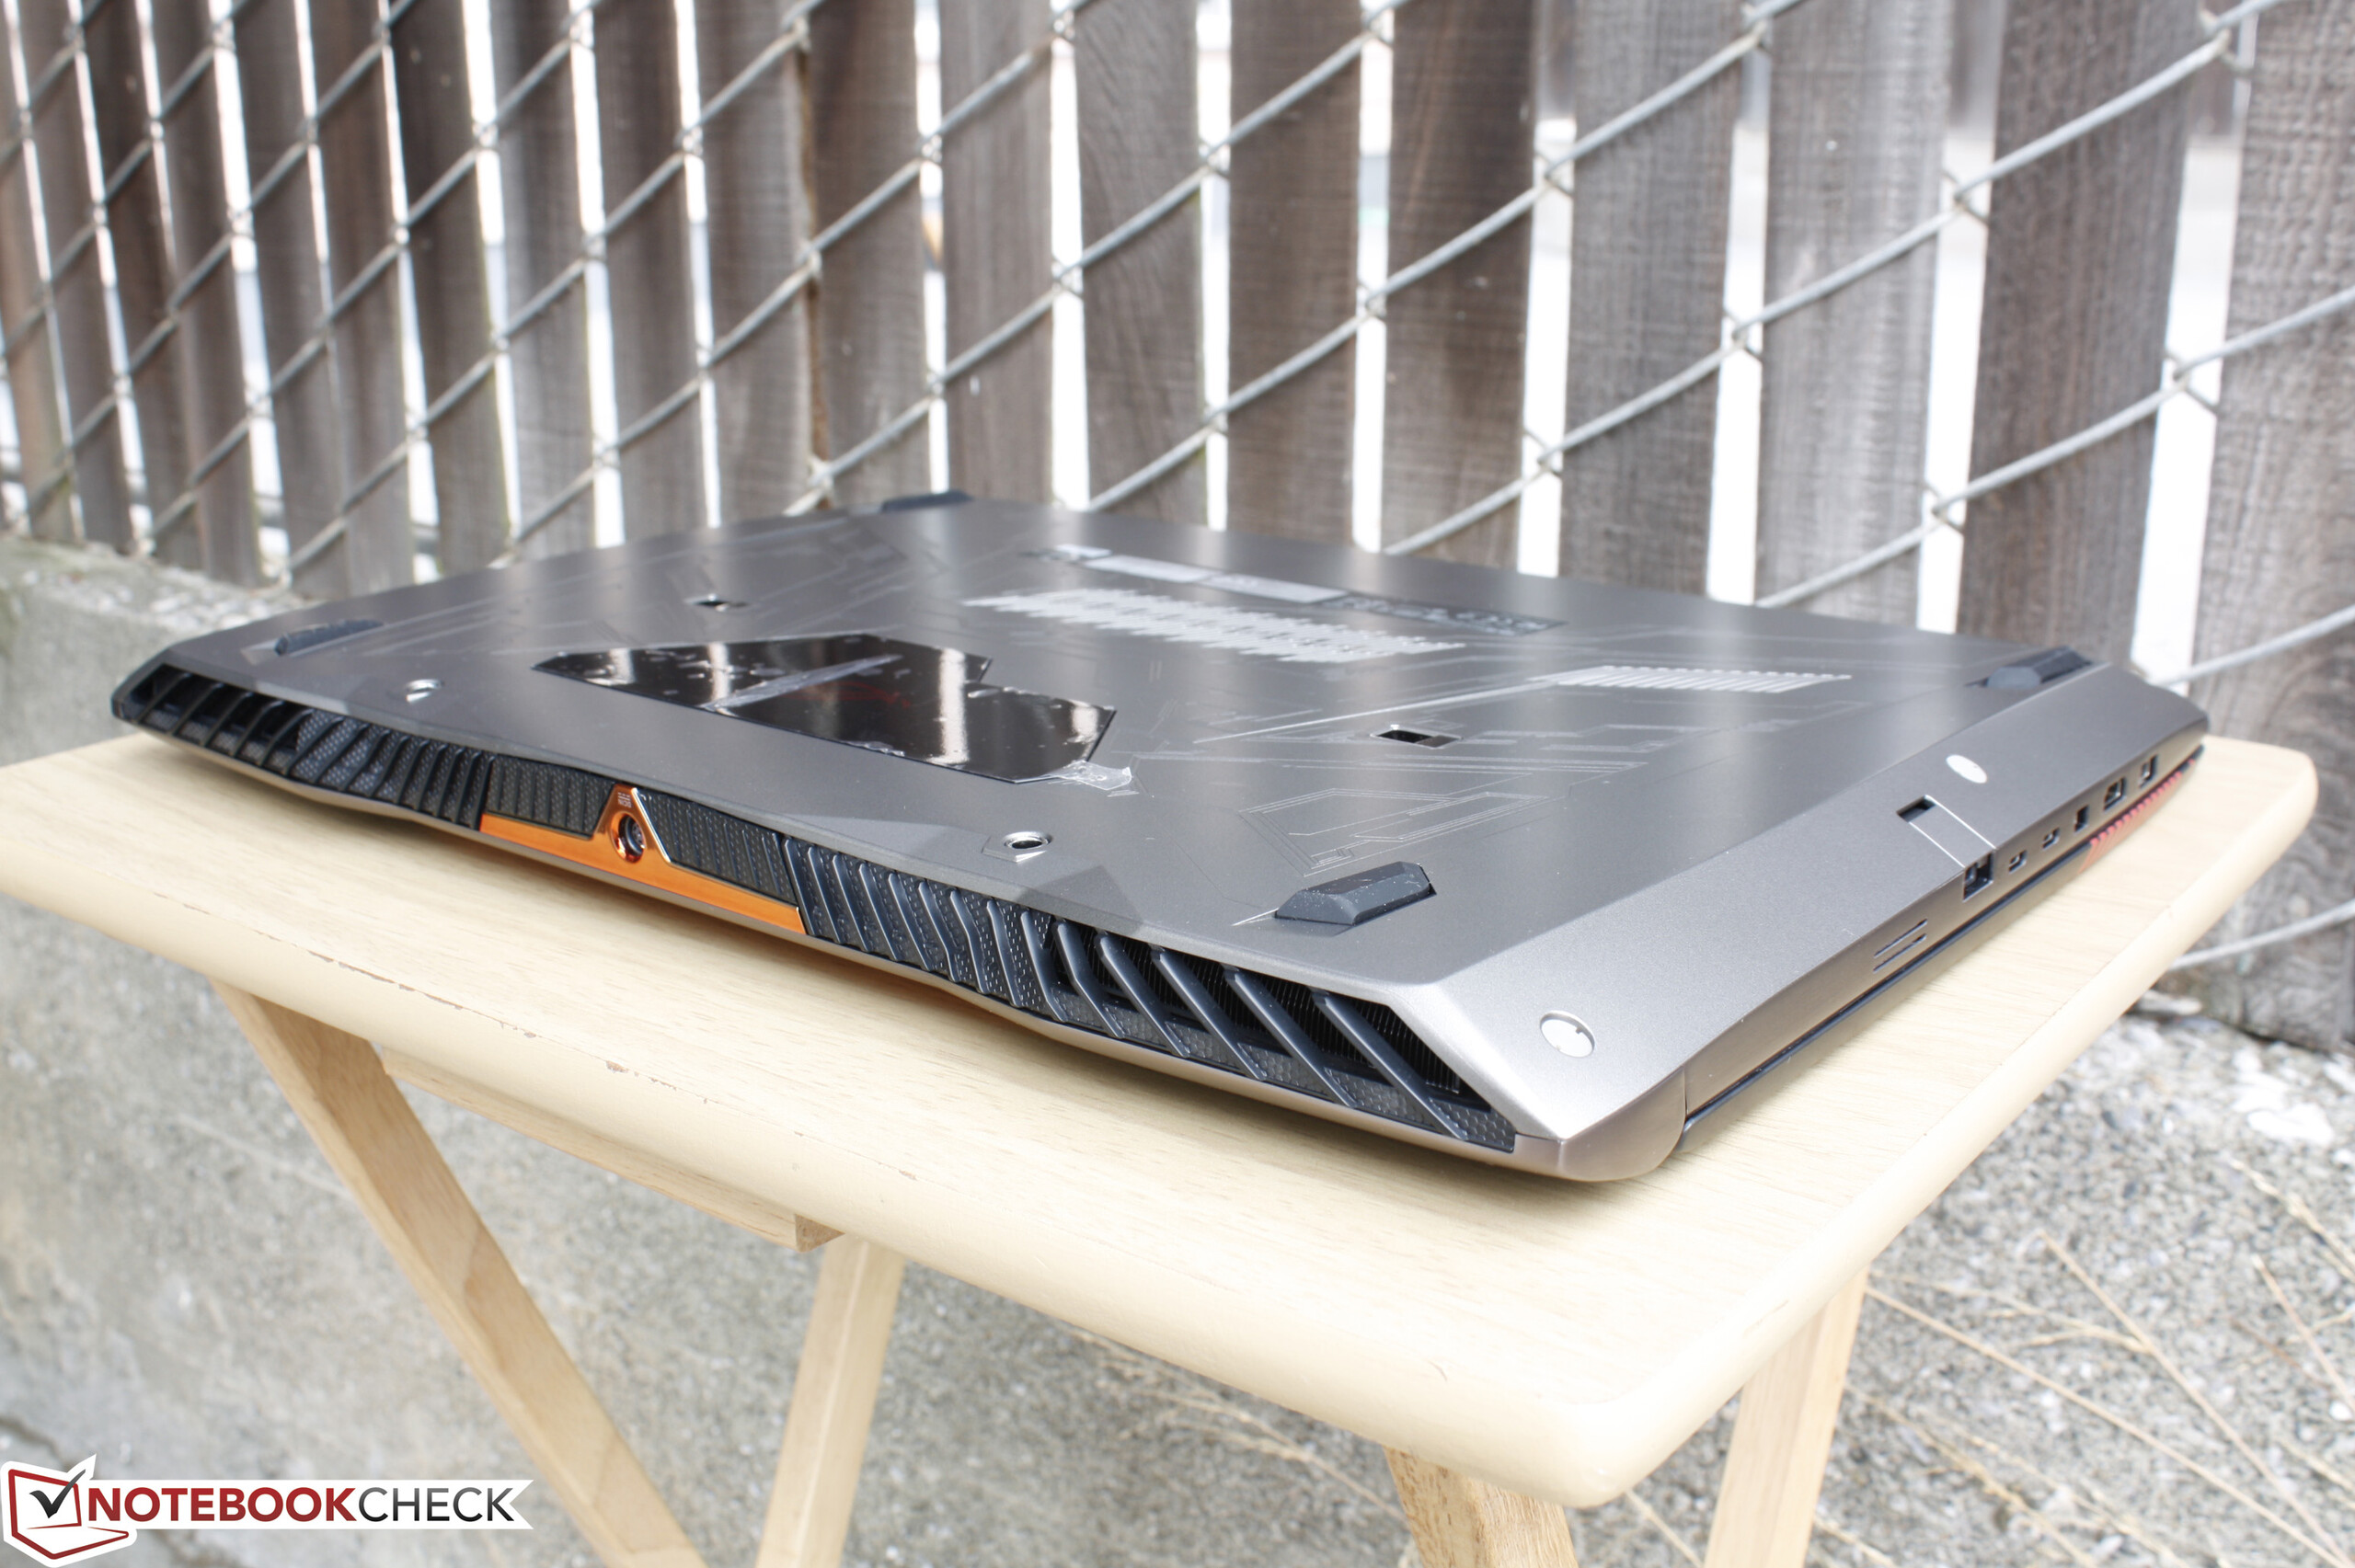
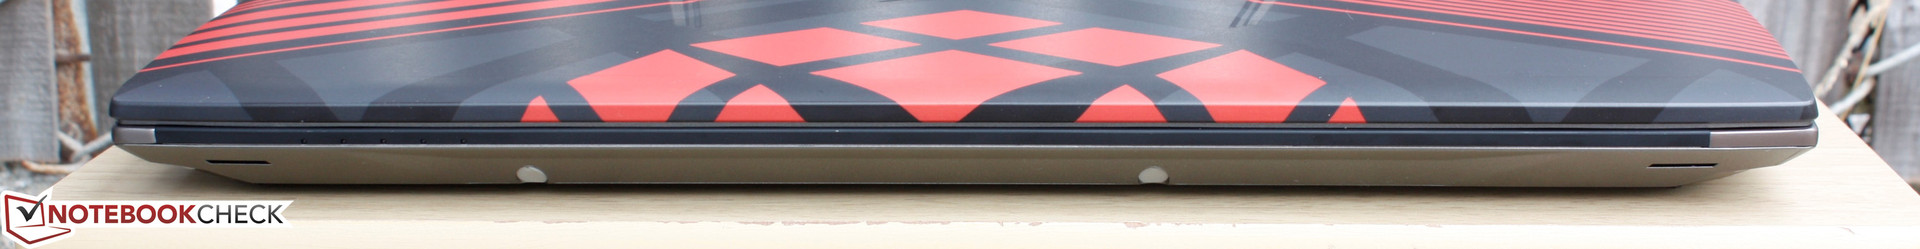
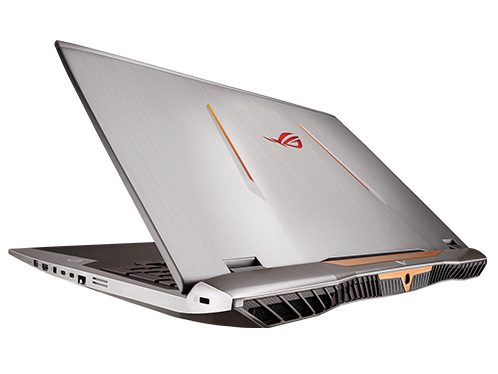
+ 比G752更轻更薄
+ 机身坚固,做工优秀
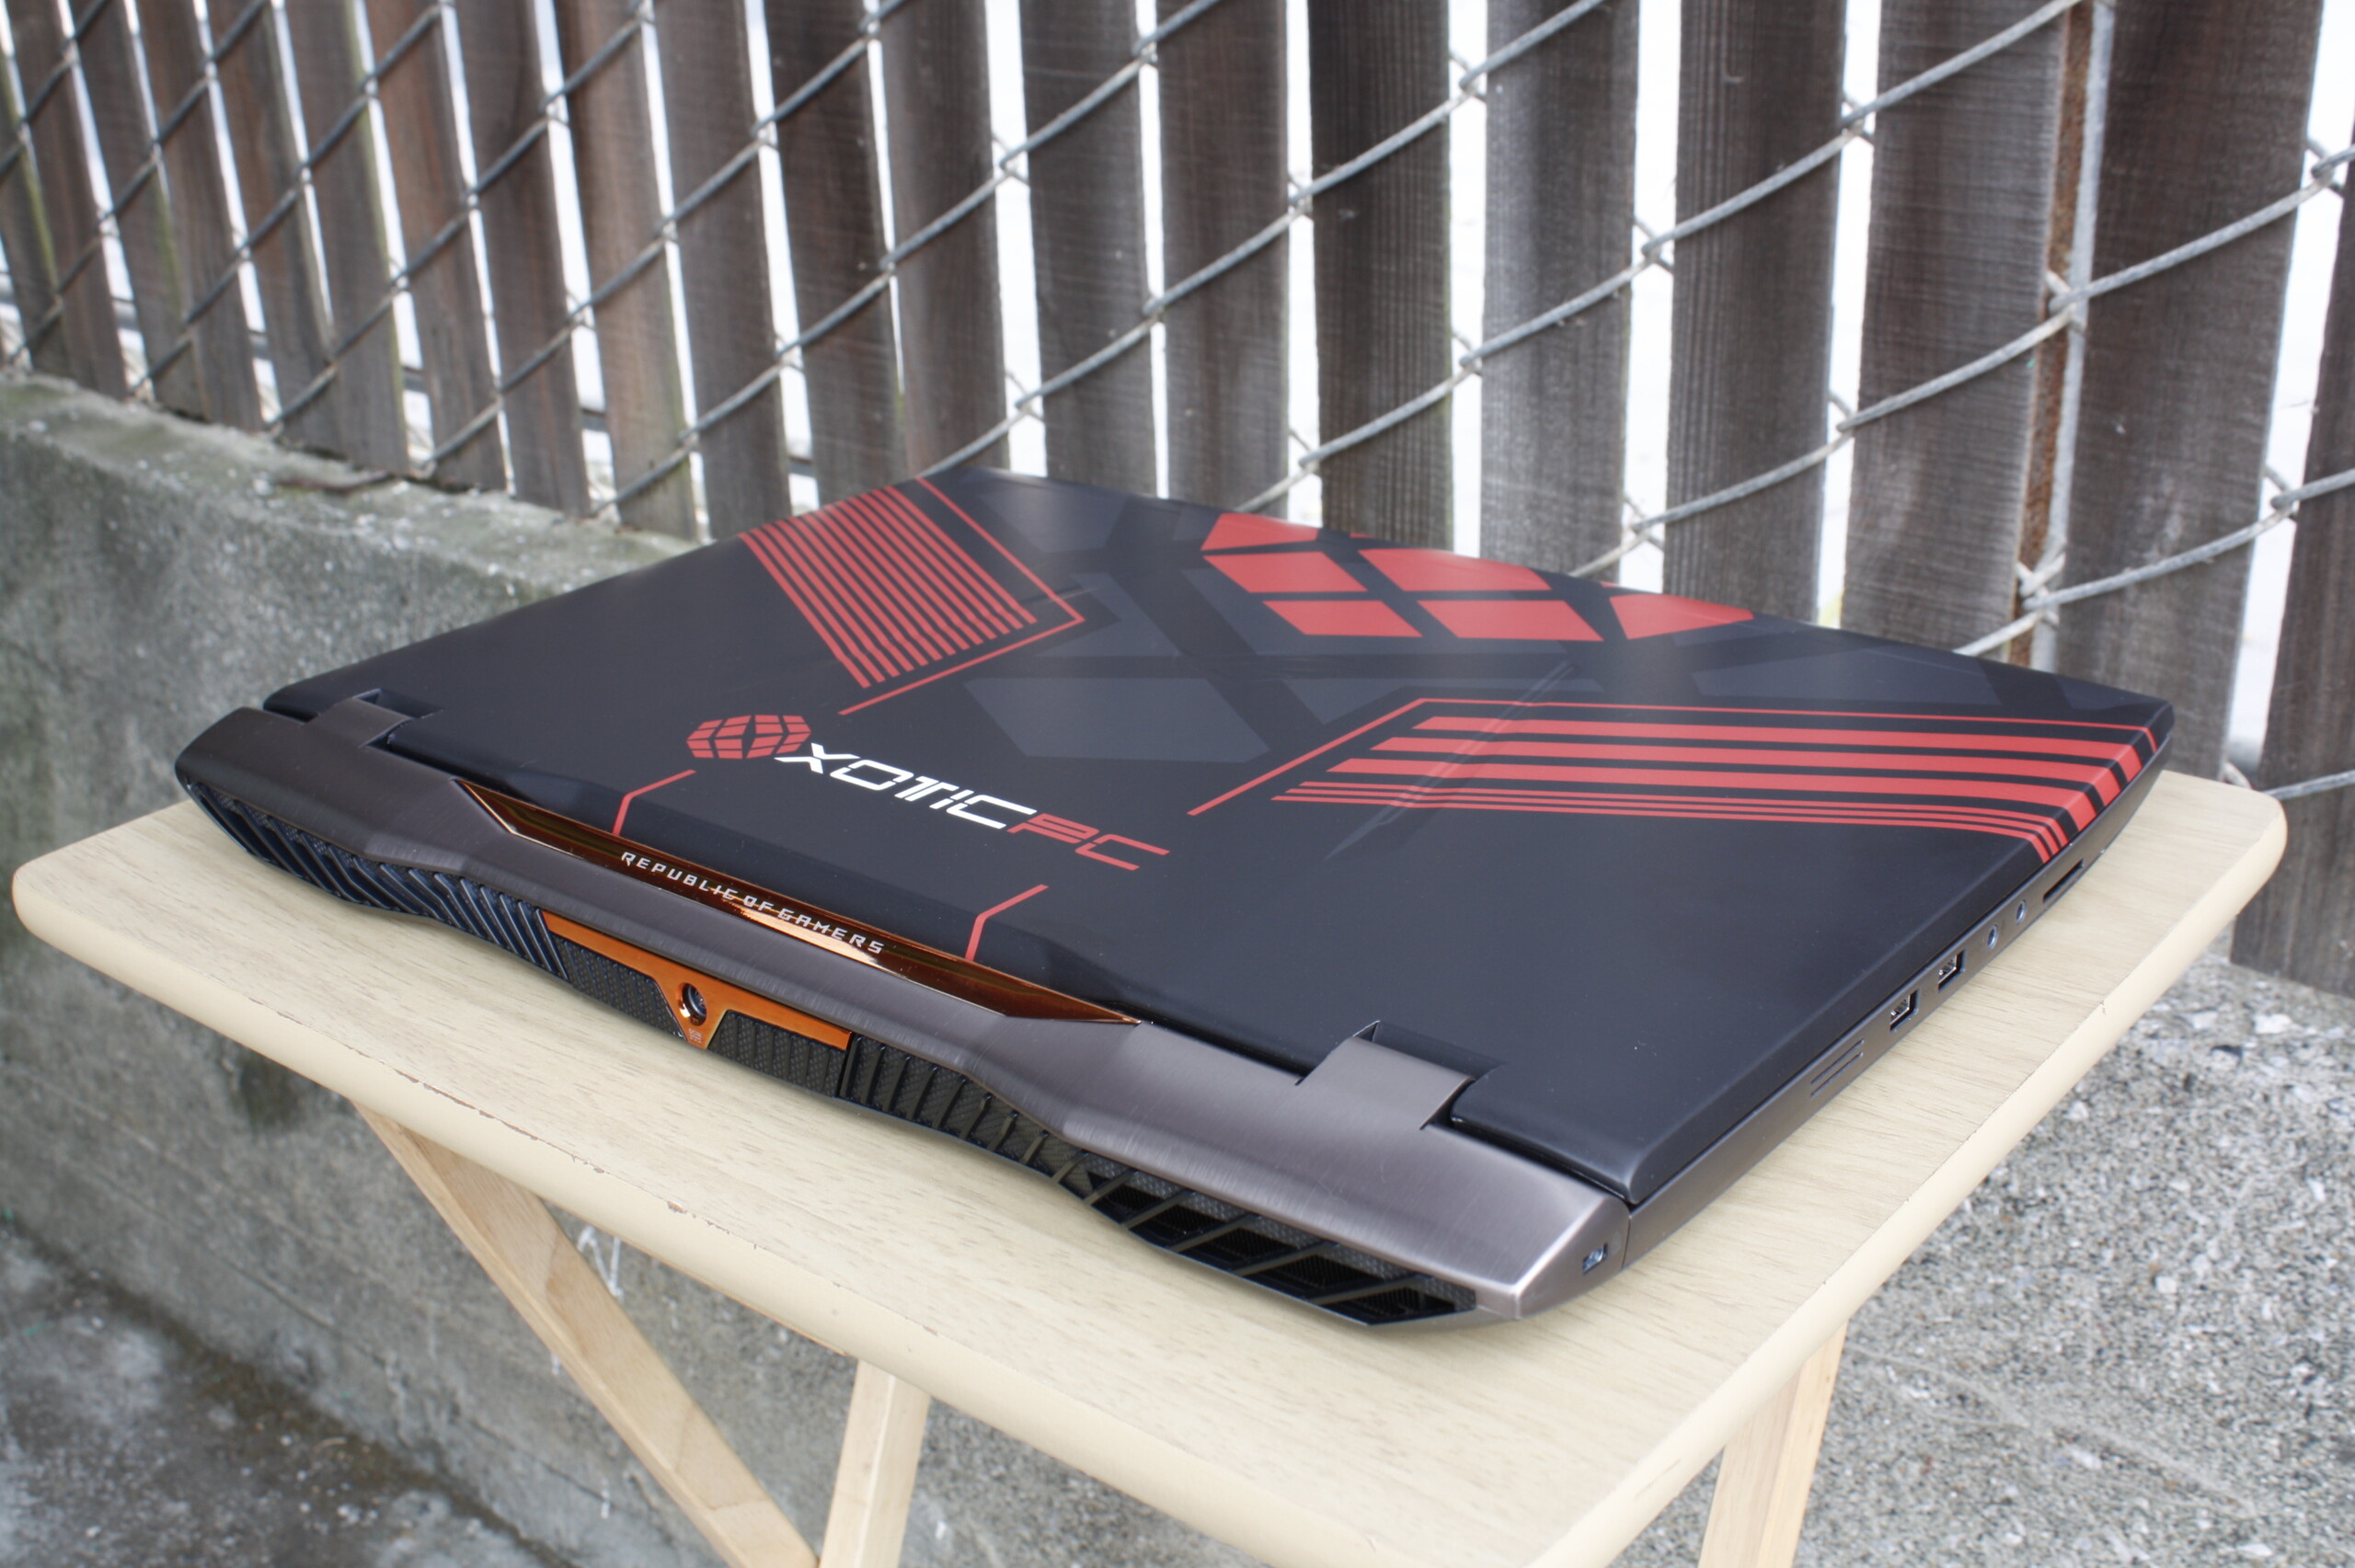
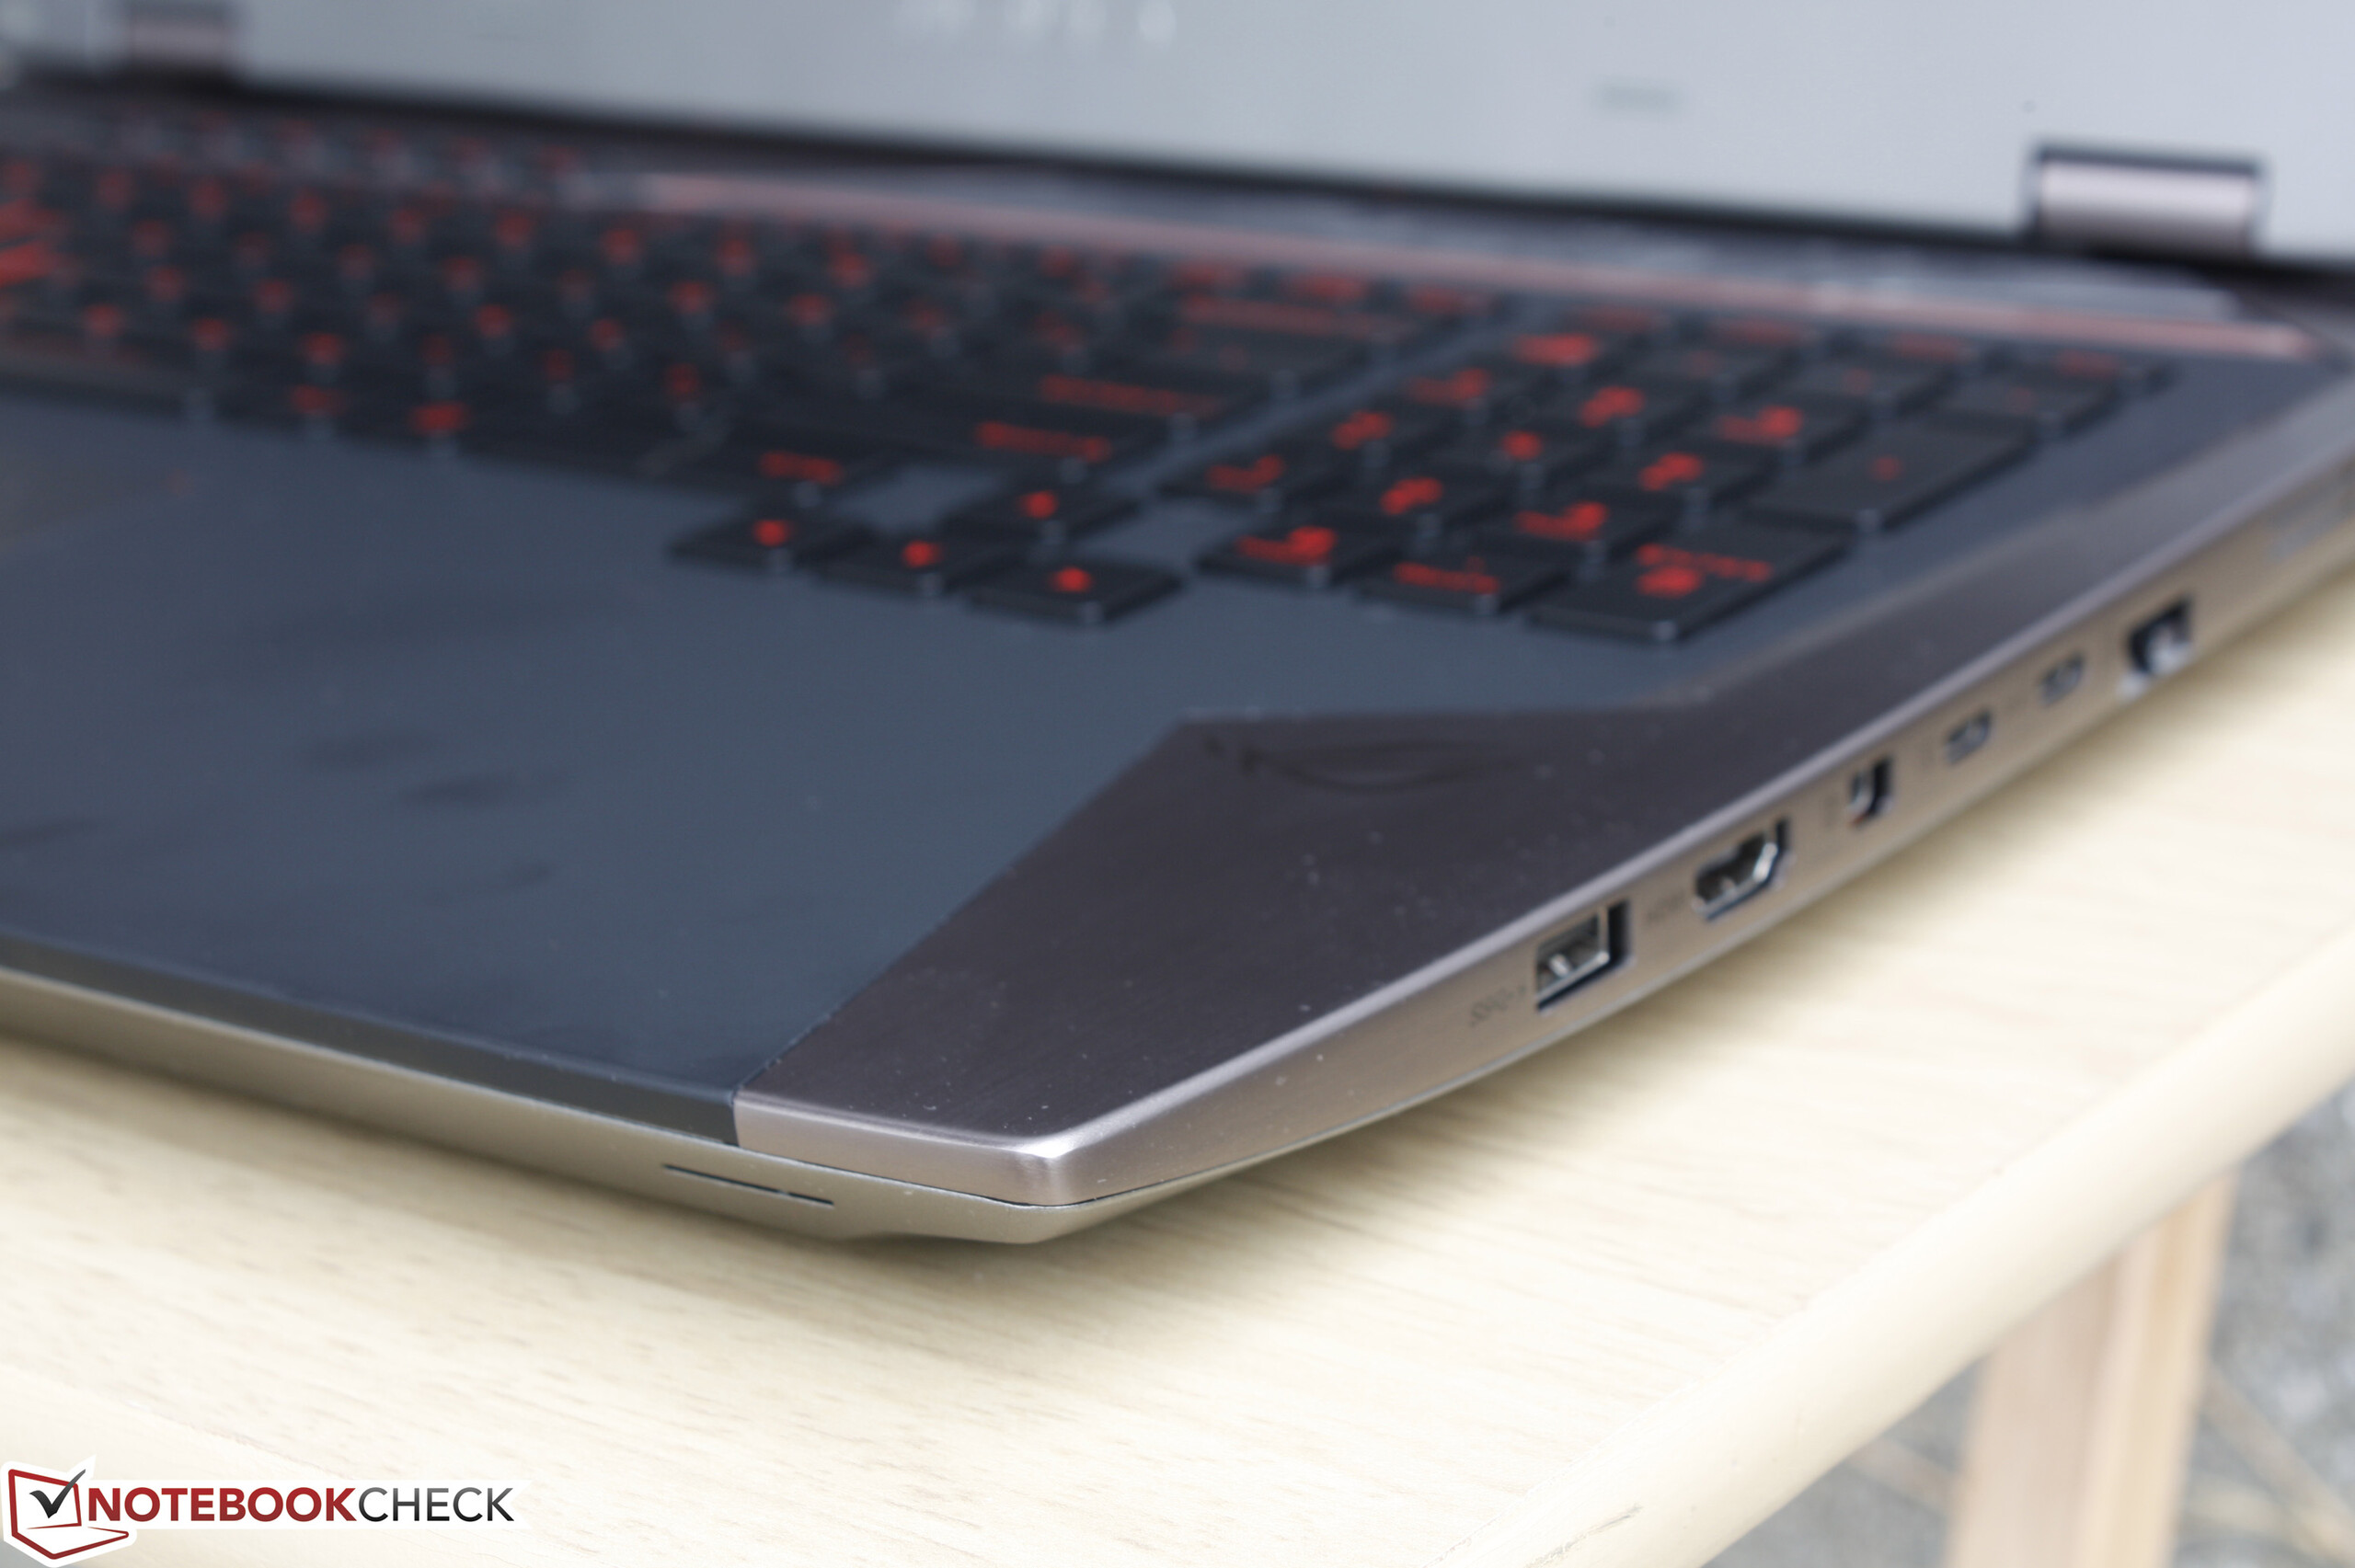
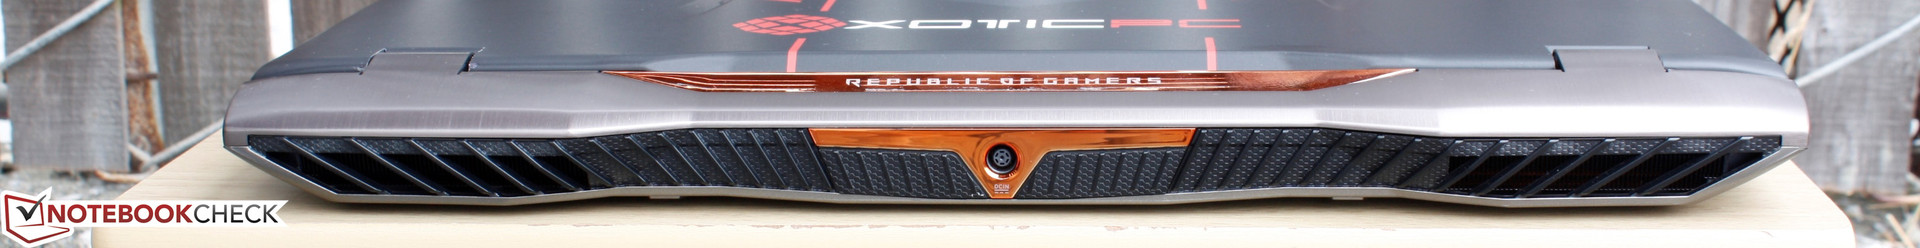
+ 支持USB-C和Thunderbolt 3
+ 可超频的处理器和显卡
+ 4K超高清选项,支持G-Sync
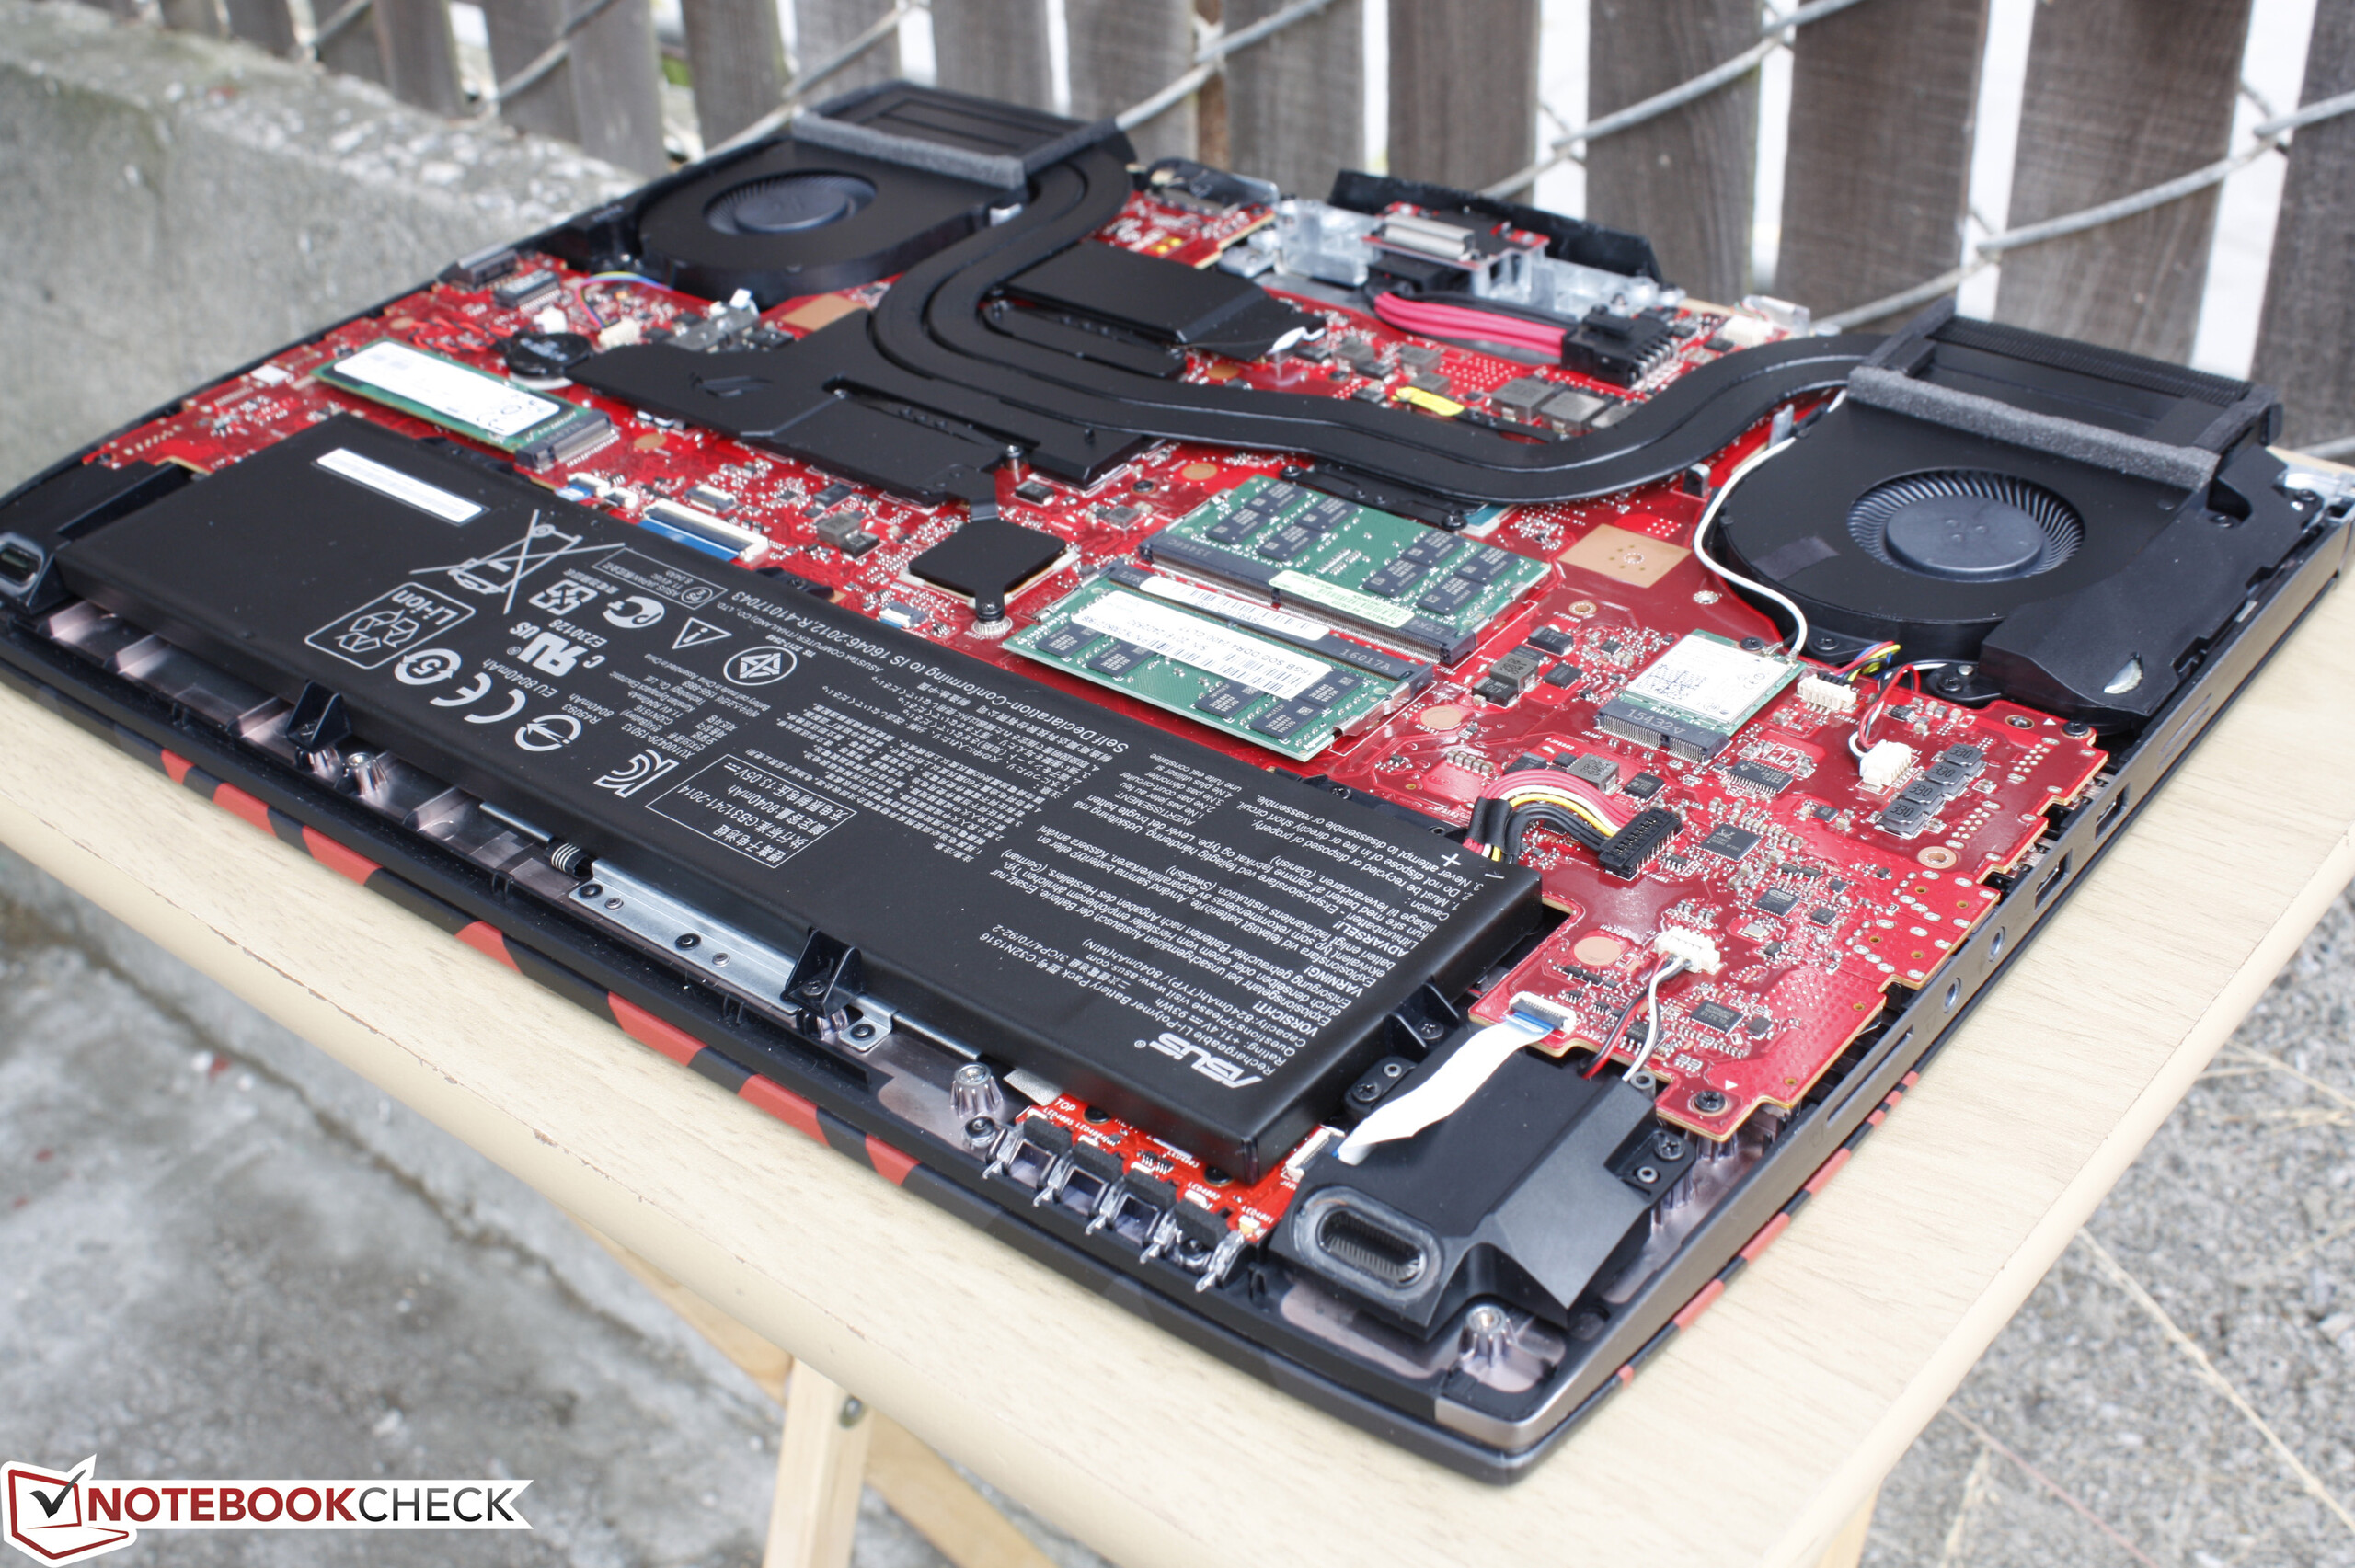
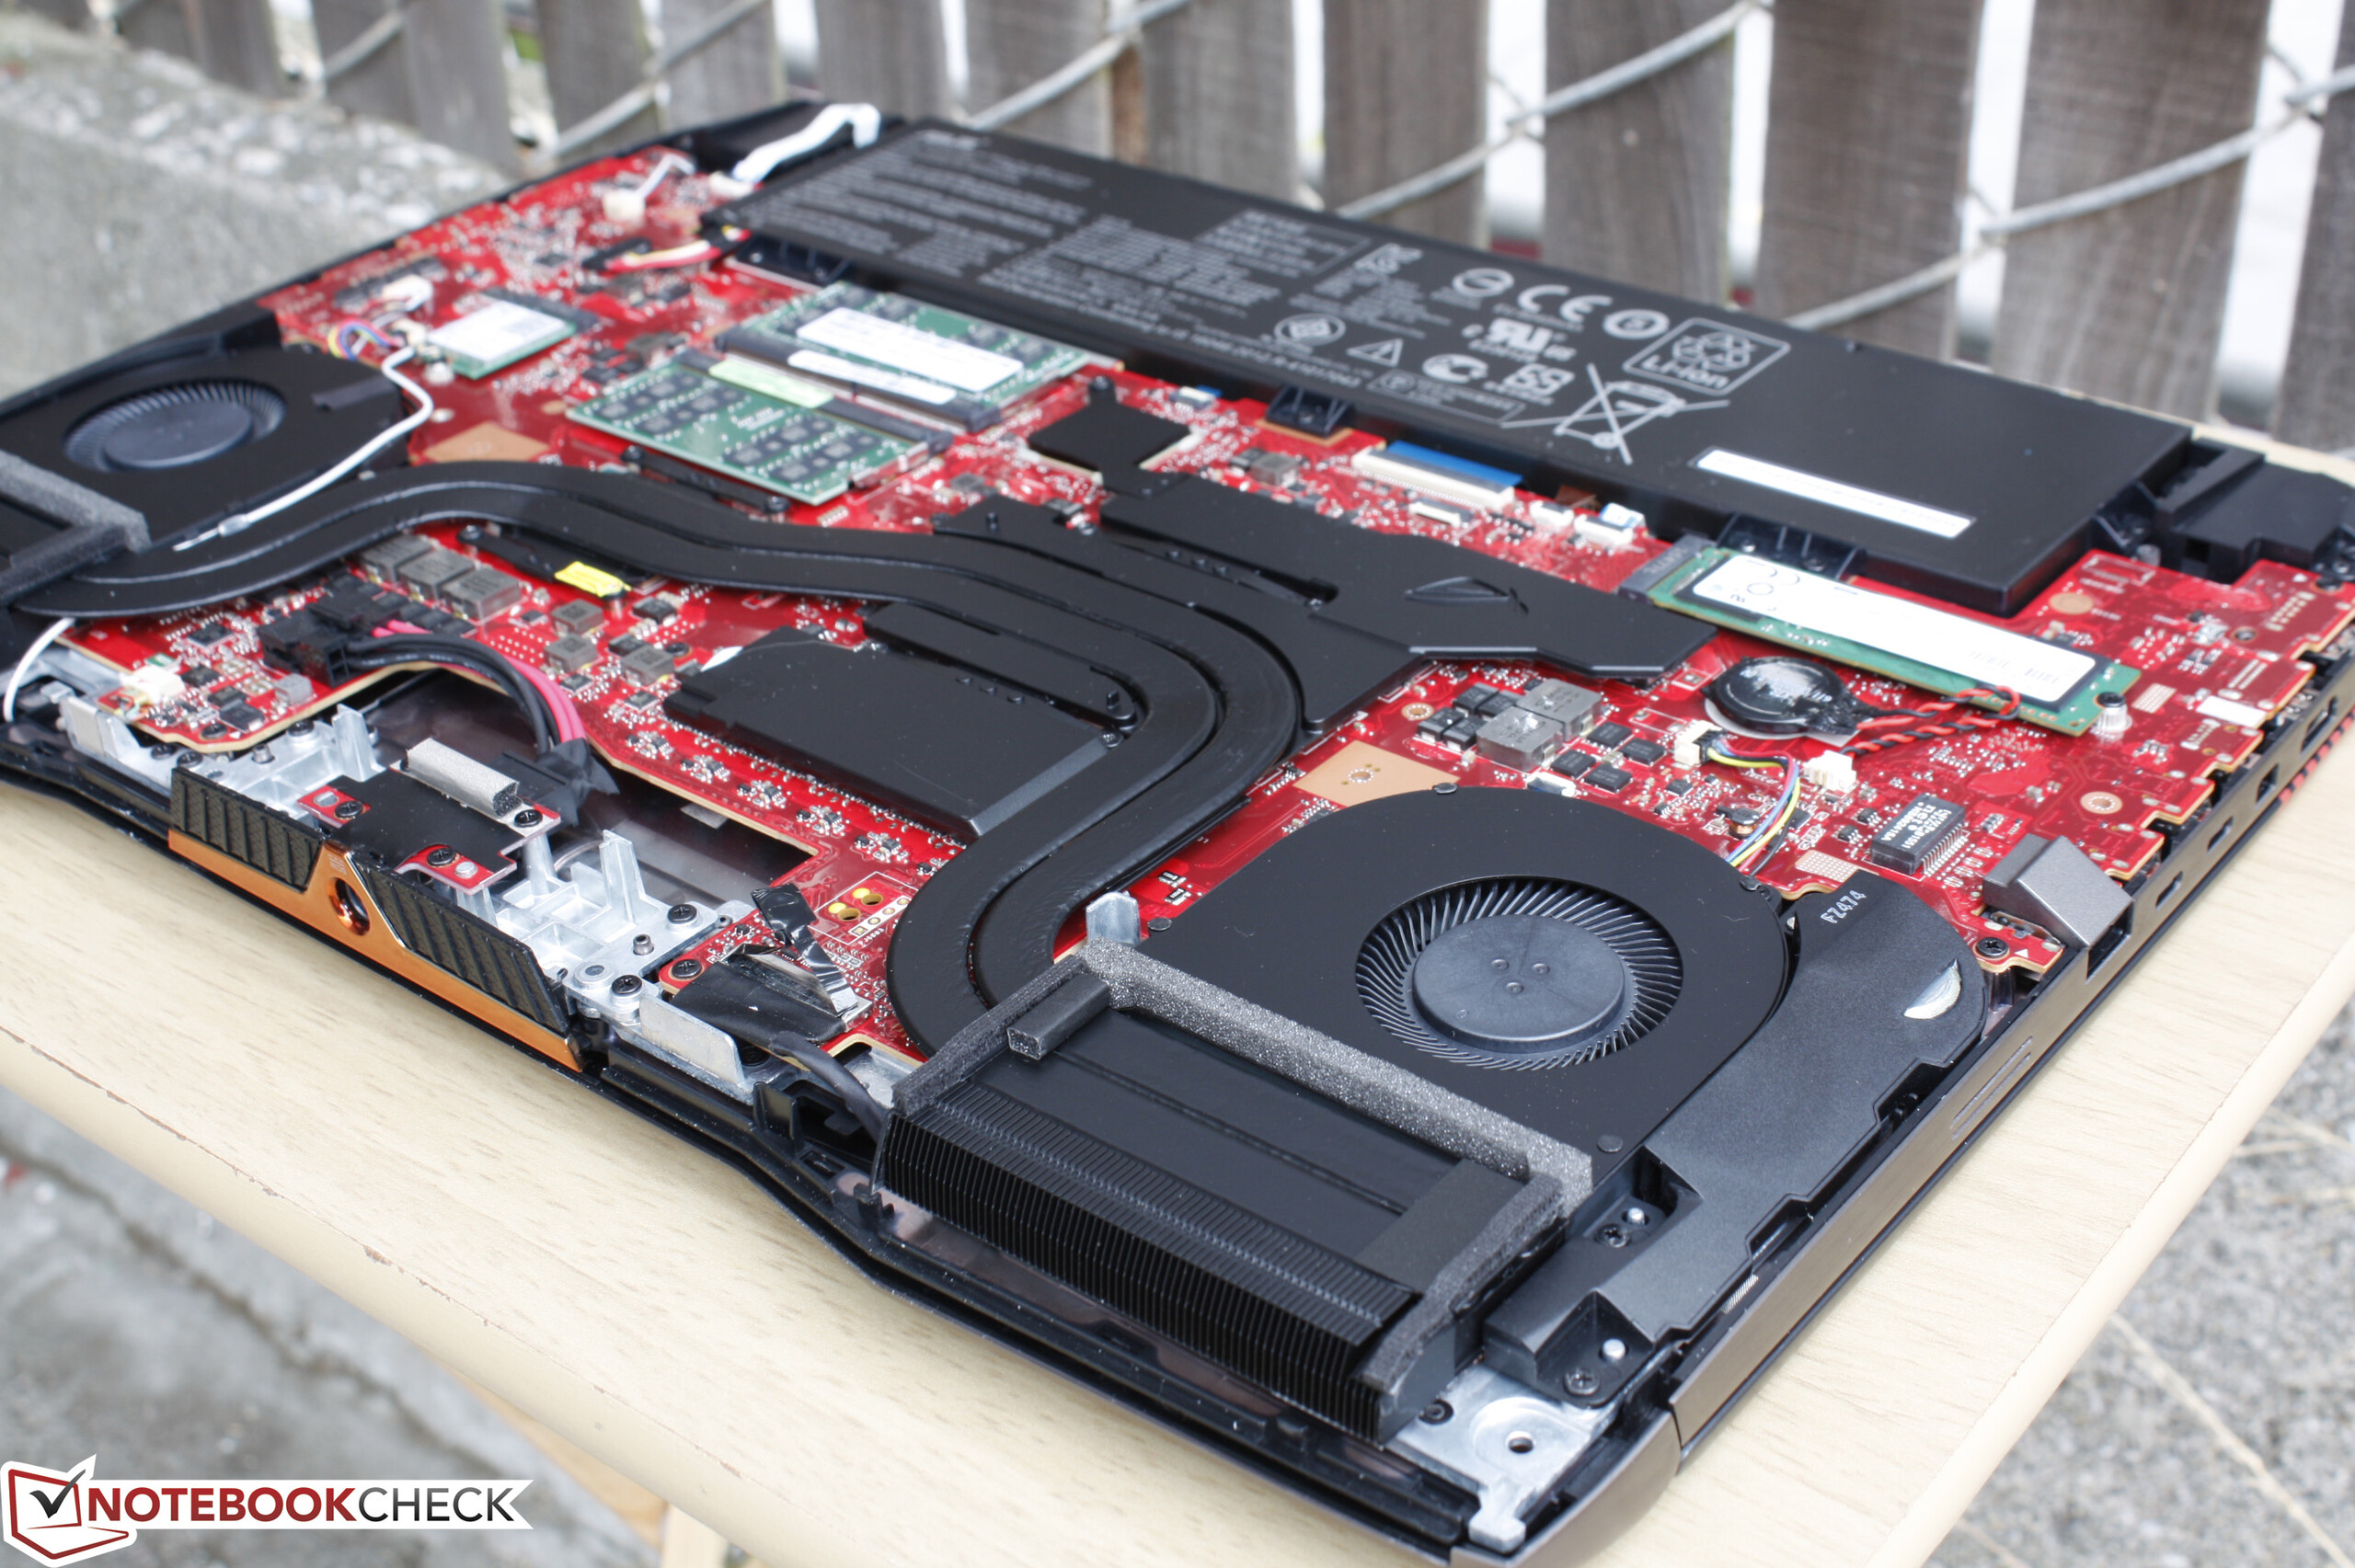
+ 支持NVMe M.2硬盘RAID 0
+ 明亮的屏幕背光
+ 四个内存槽
+ 大尺寸触控版
+ 高速SD读卡器
+ 无屏幕闪烁
Cons
- 相比G752VY/GX700有限的超频潜力
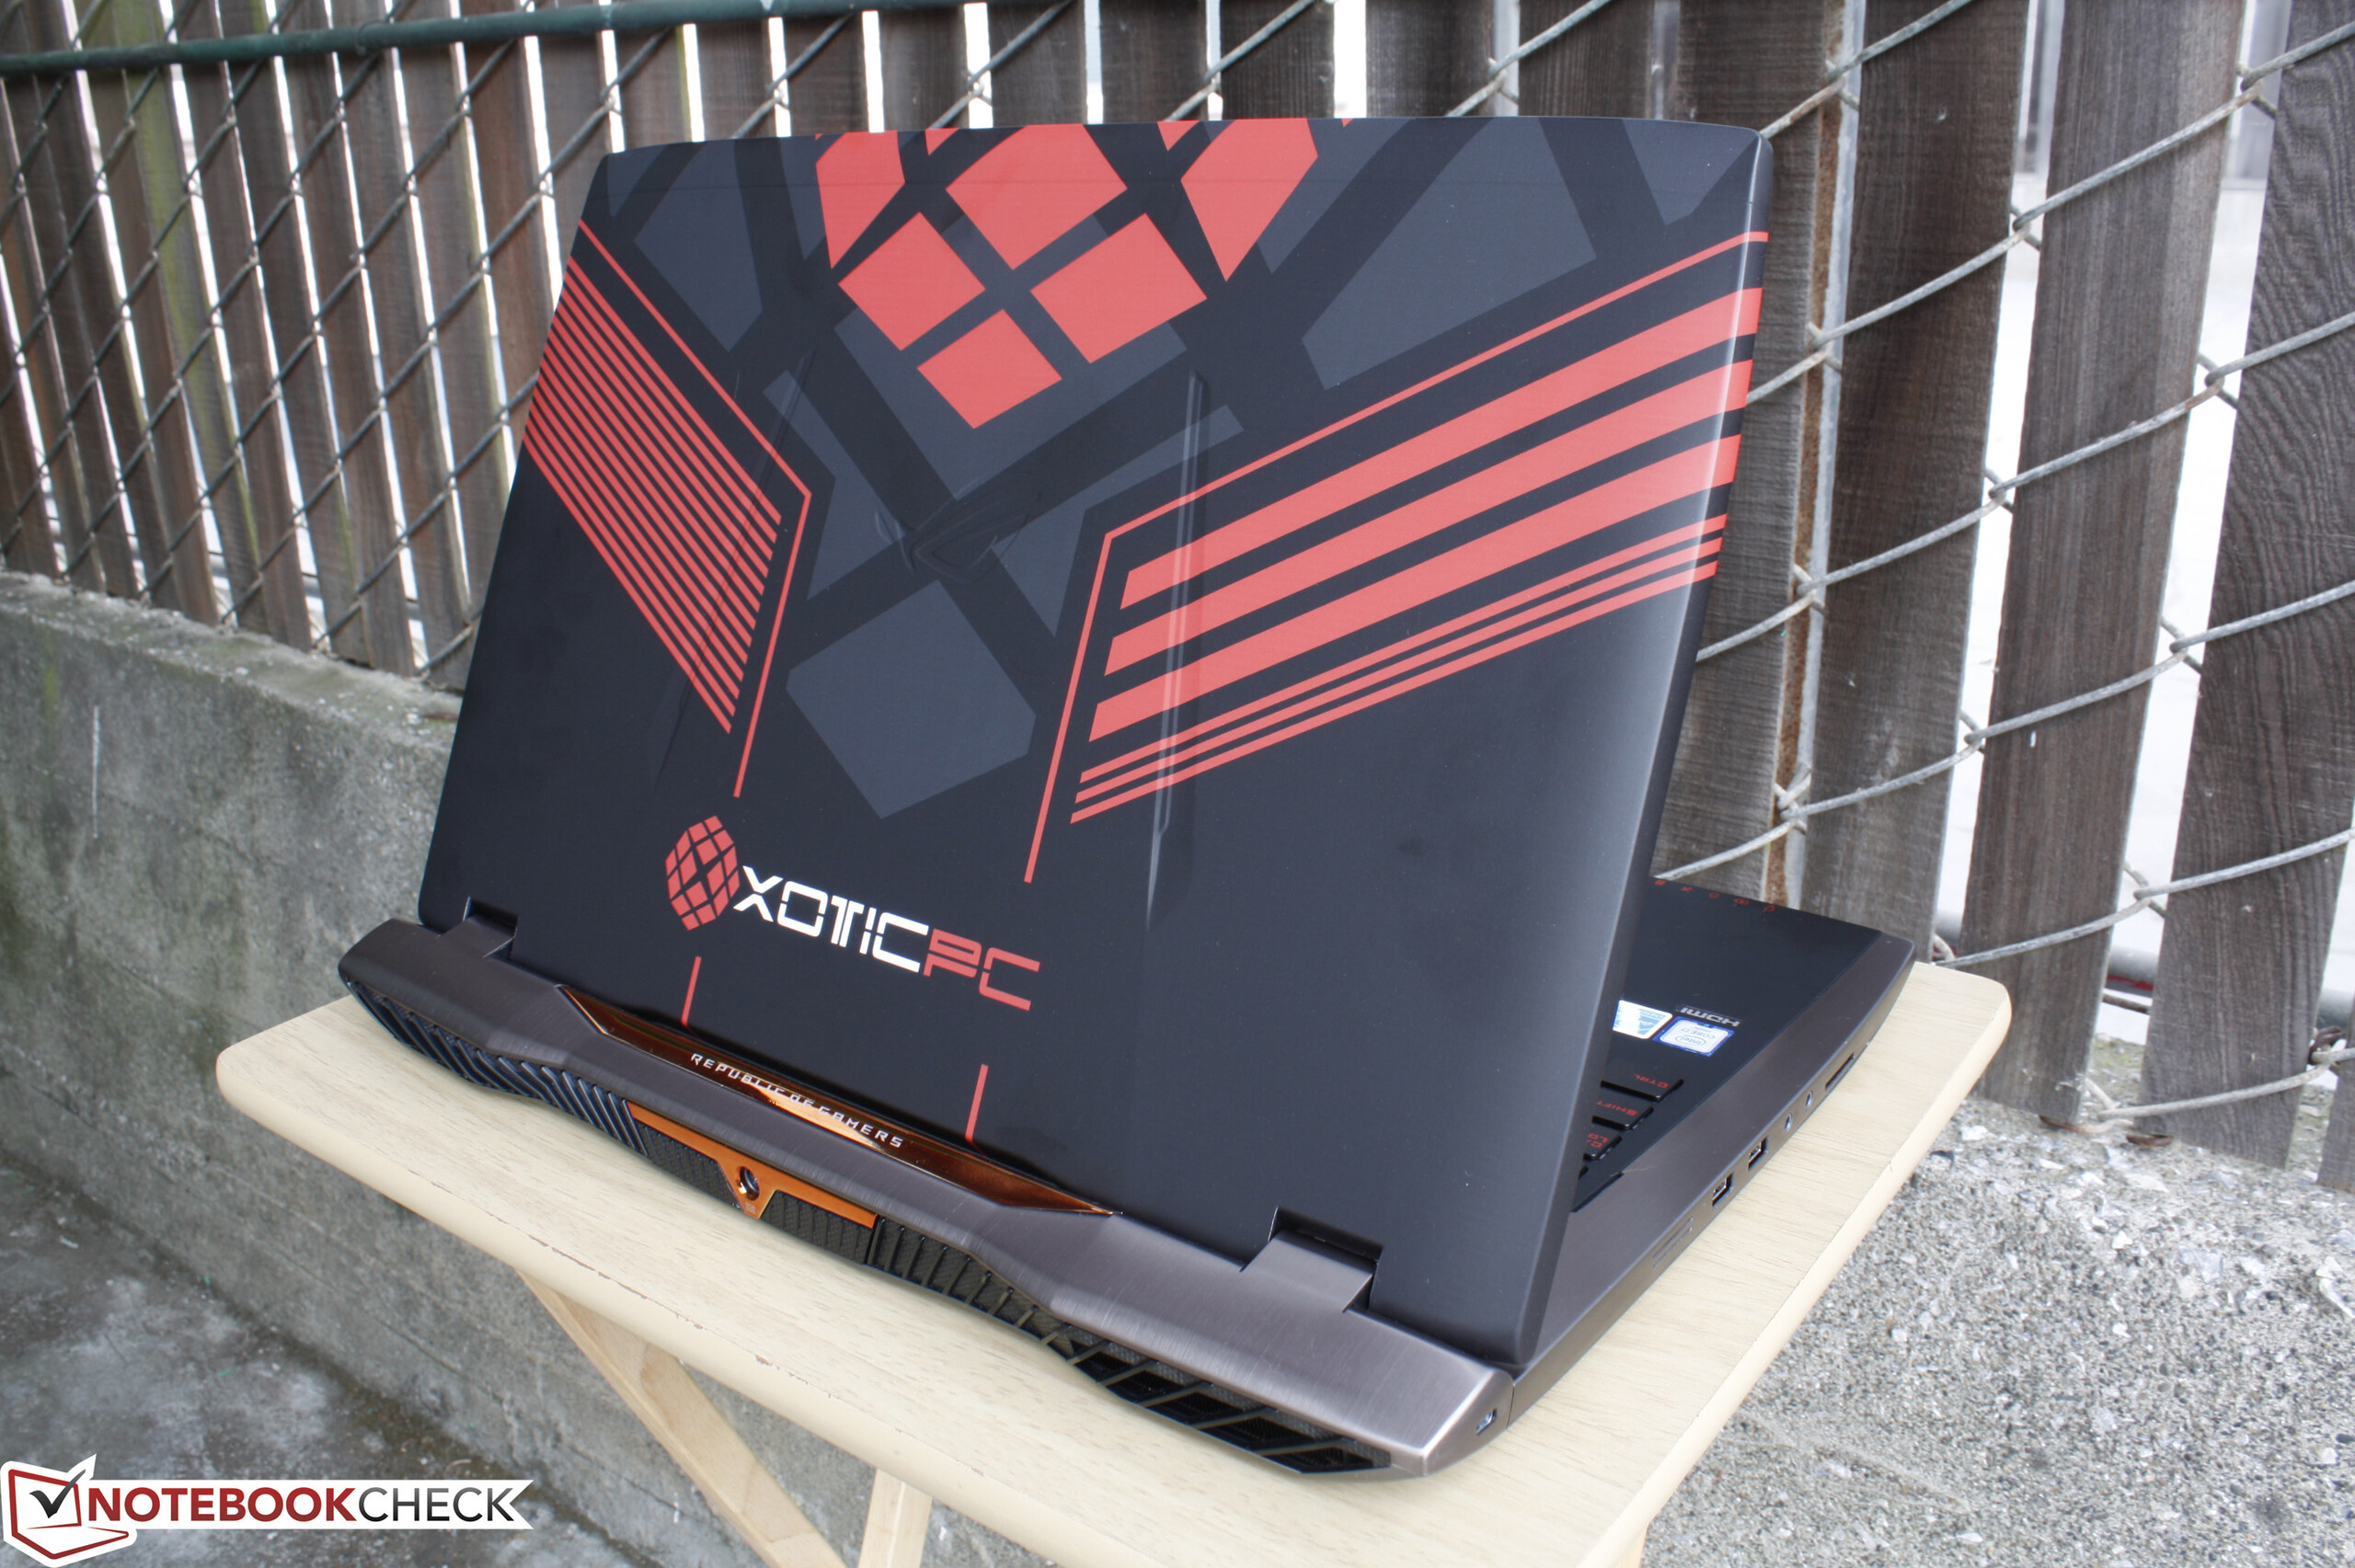
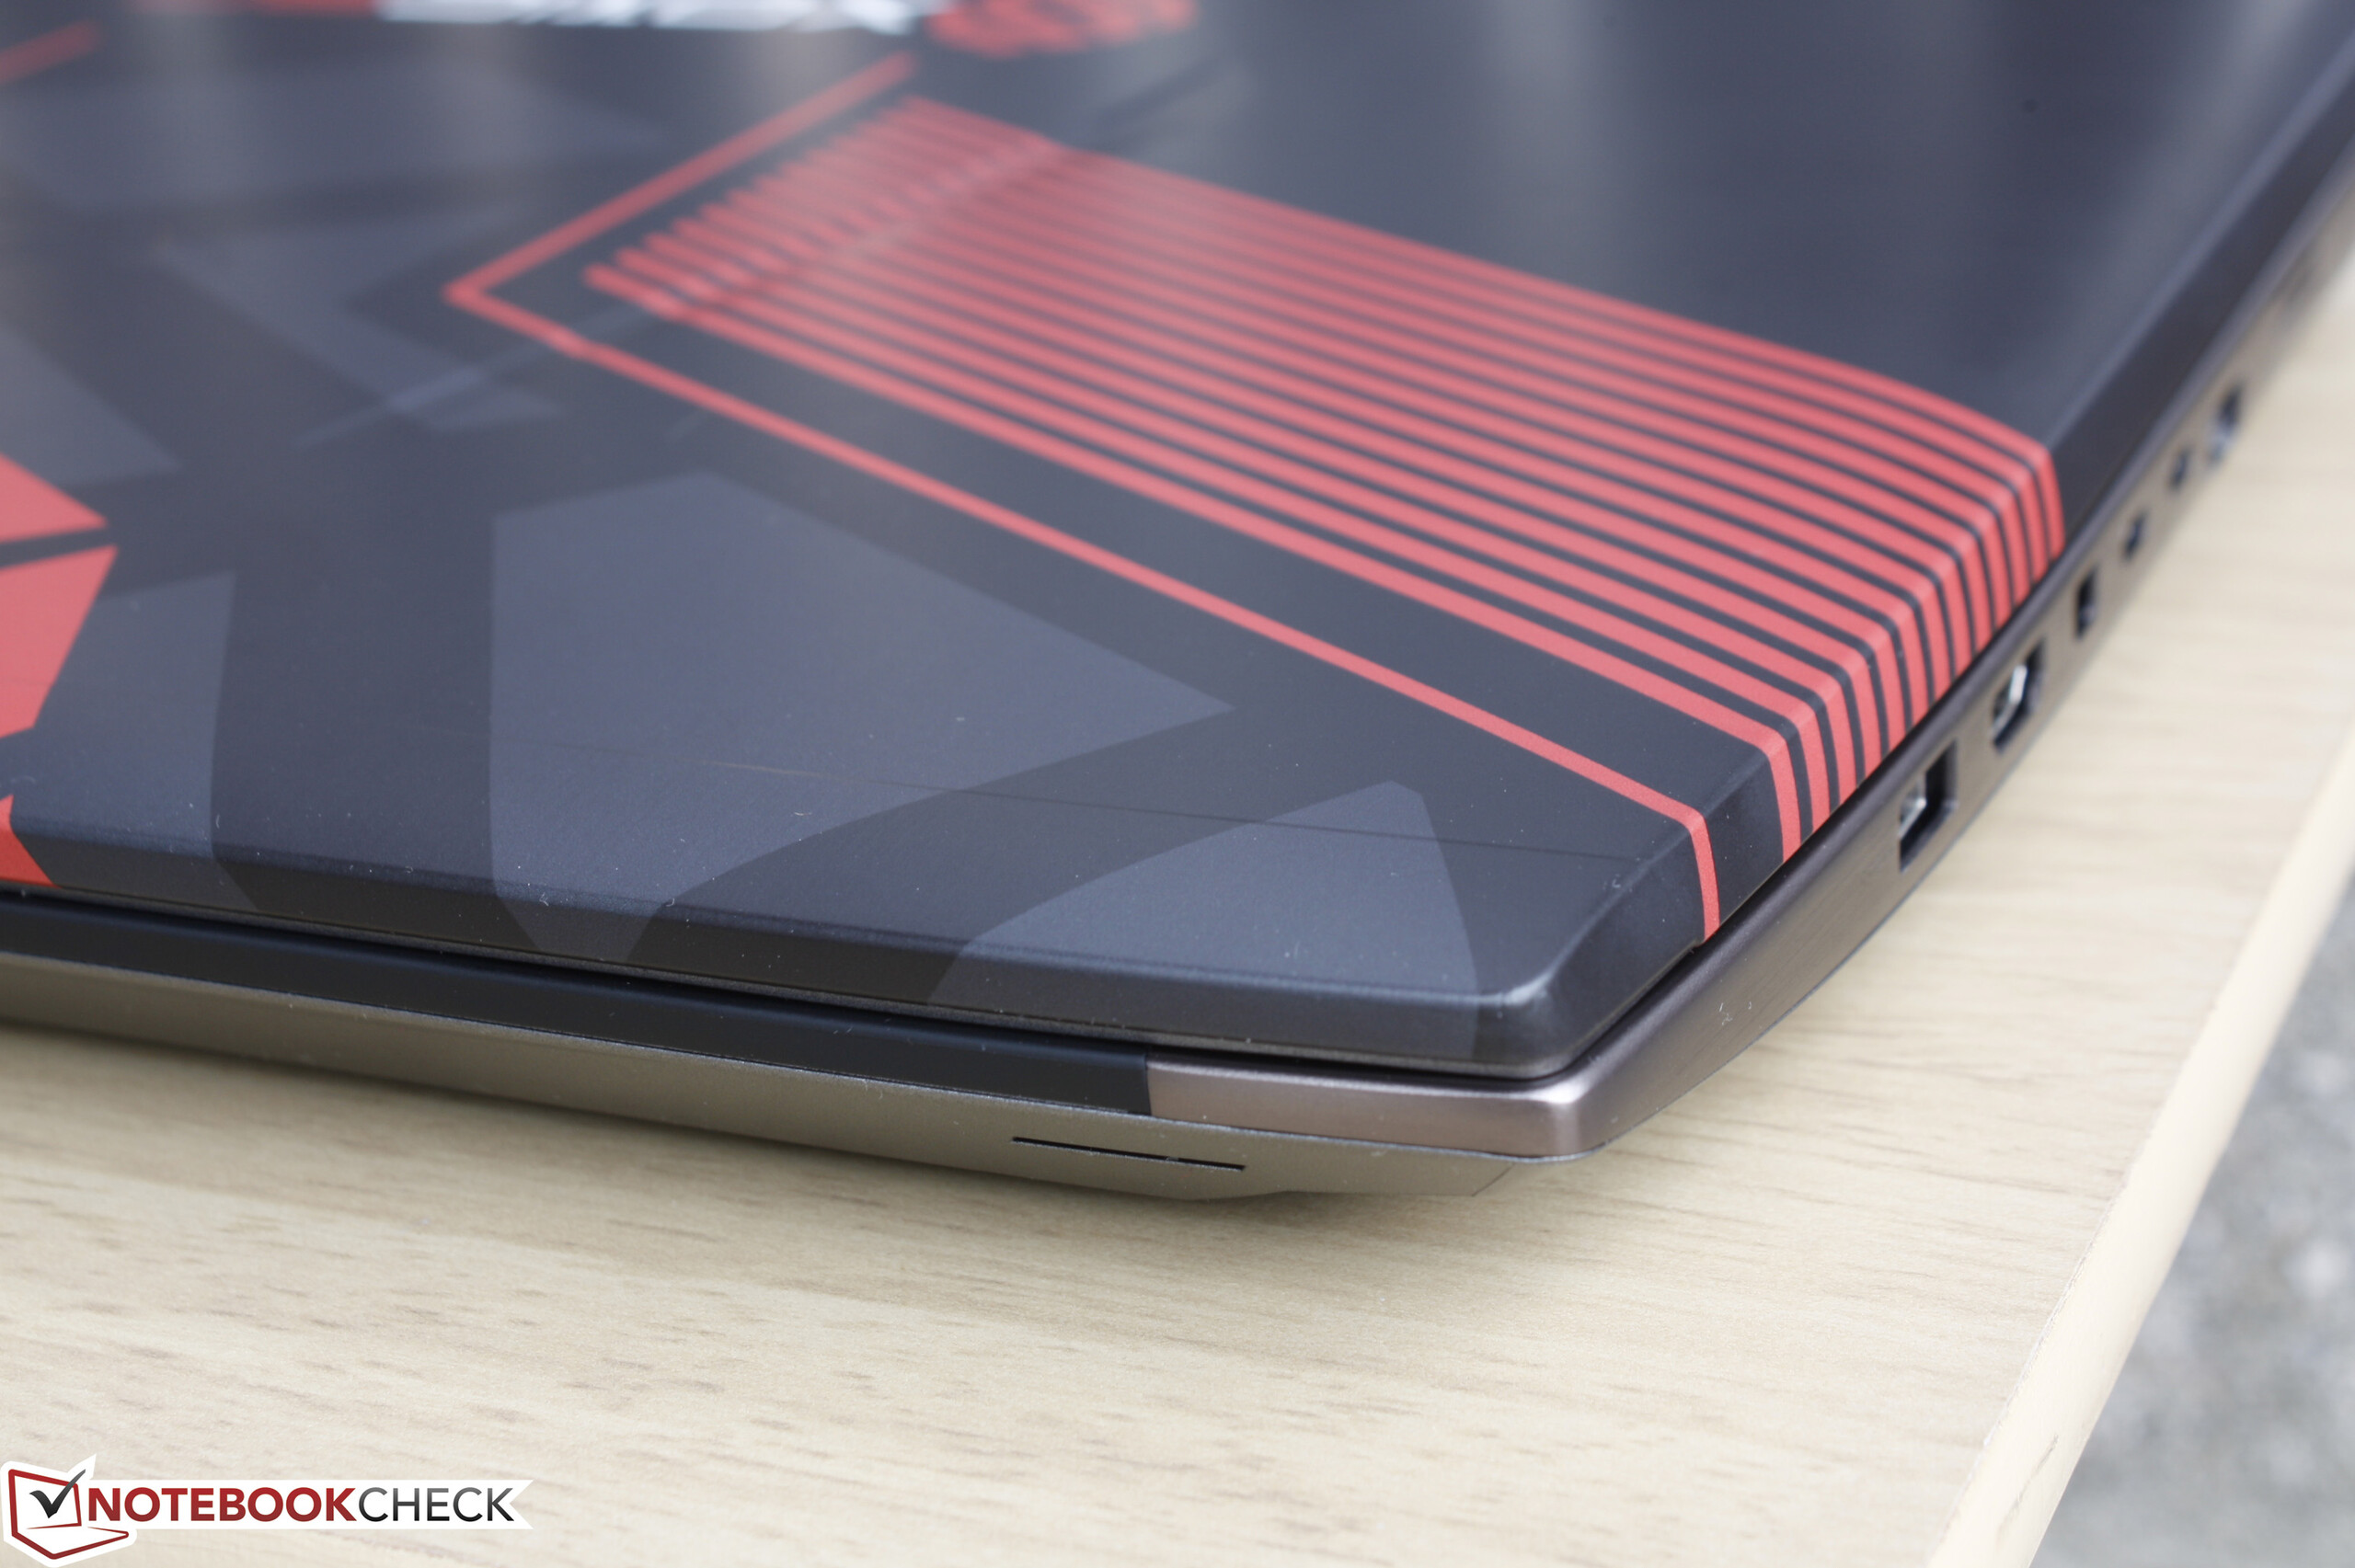
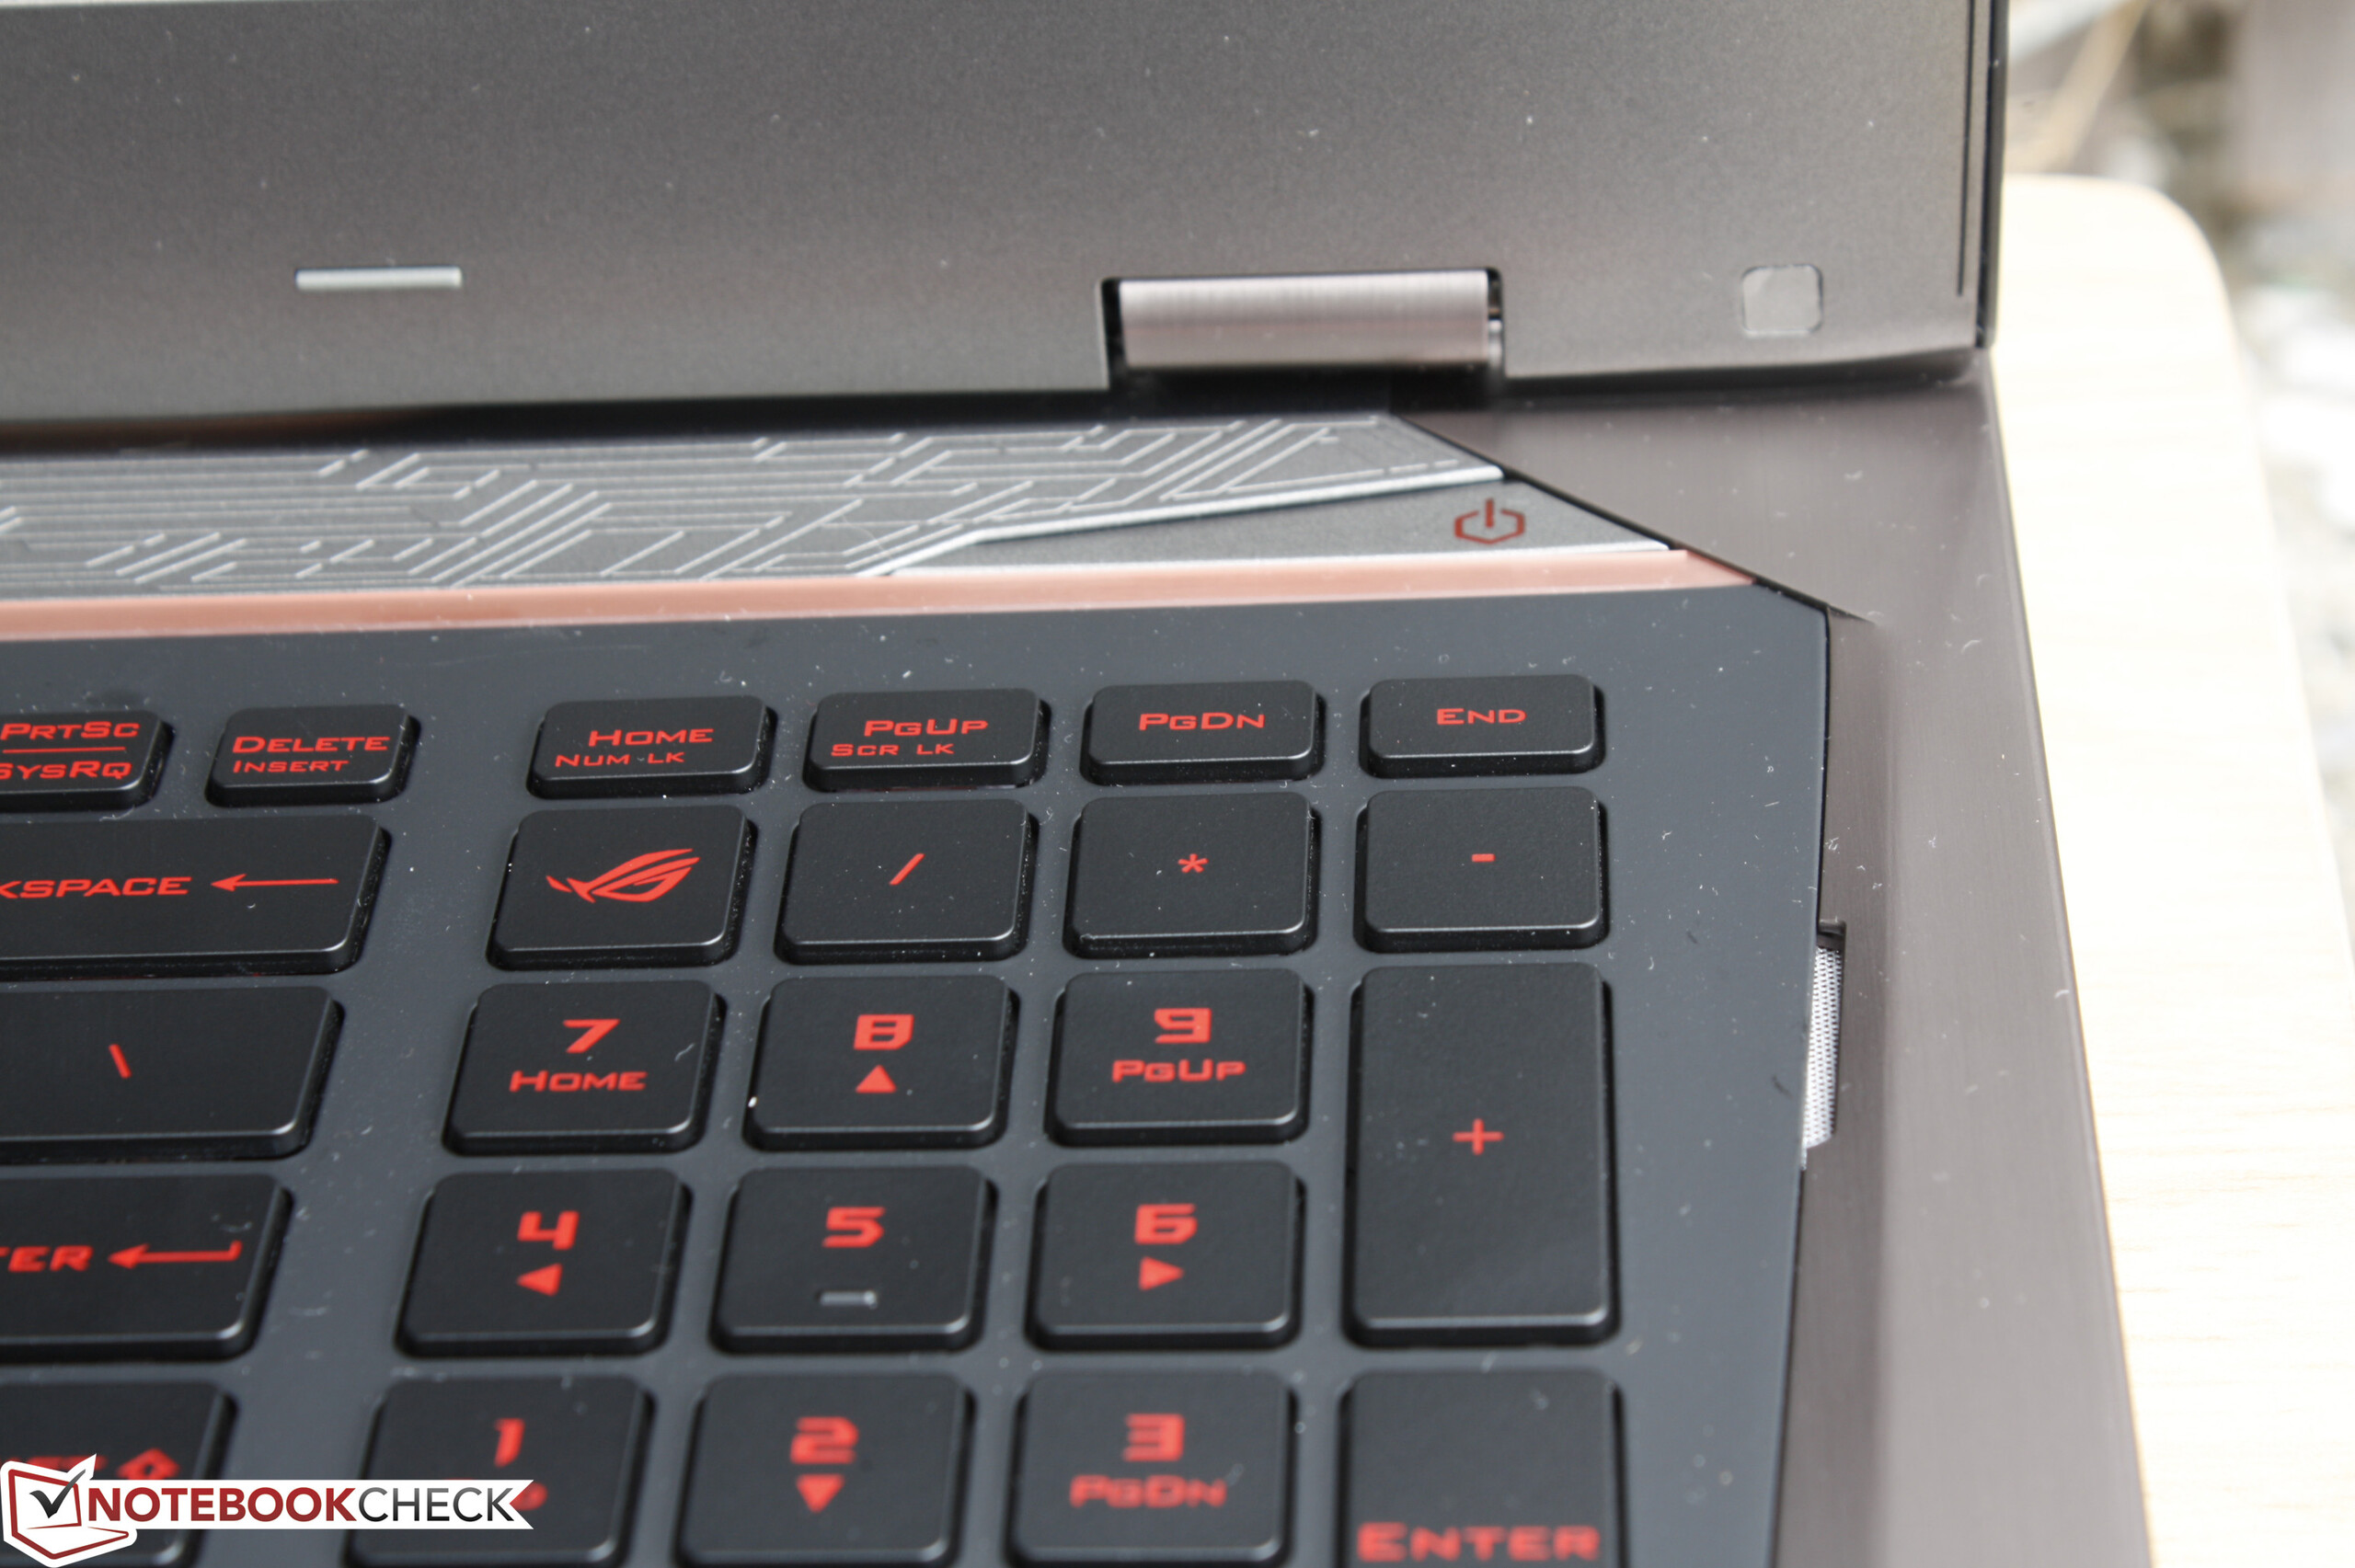
- 胶化表面容易沾染指纹
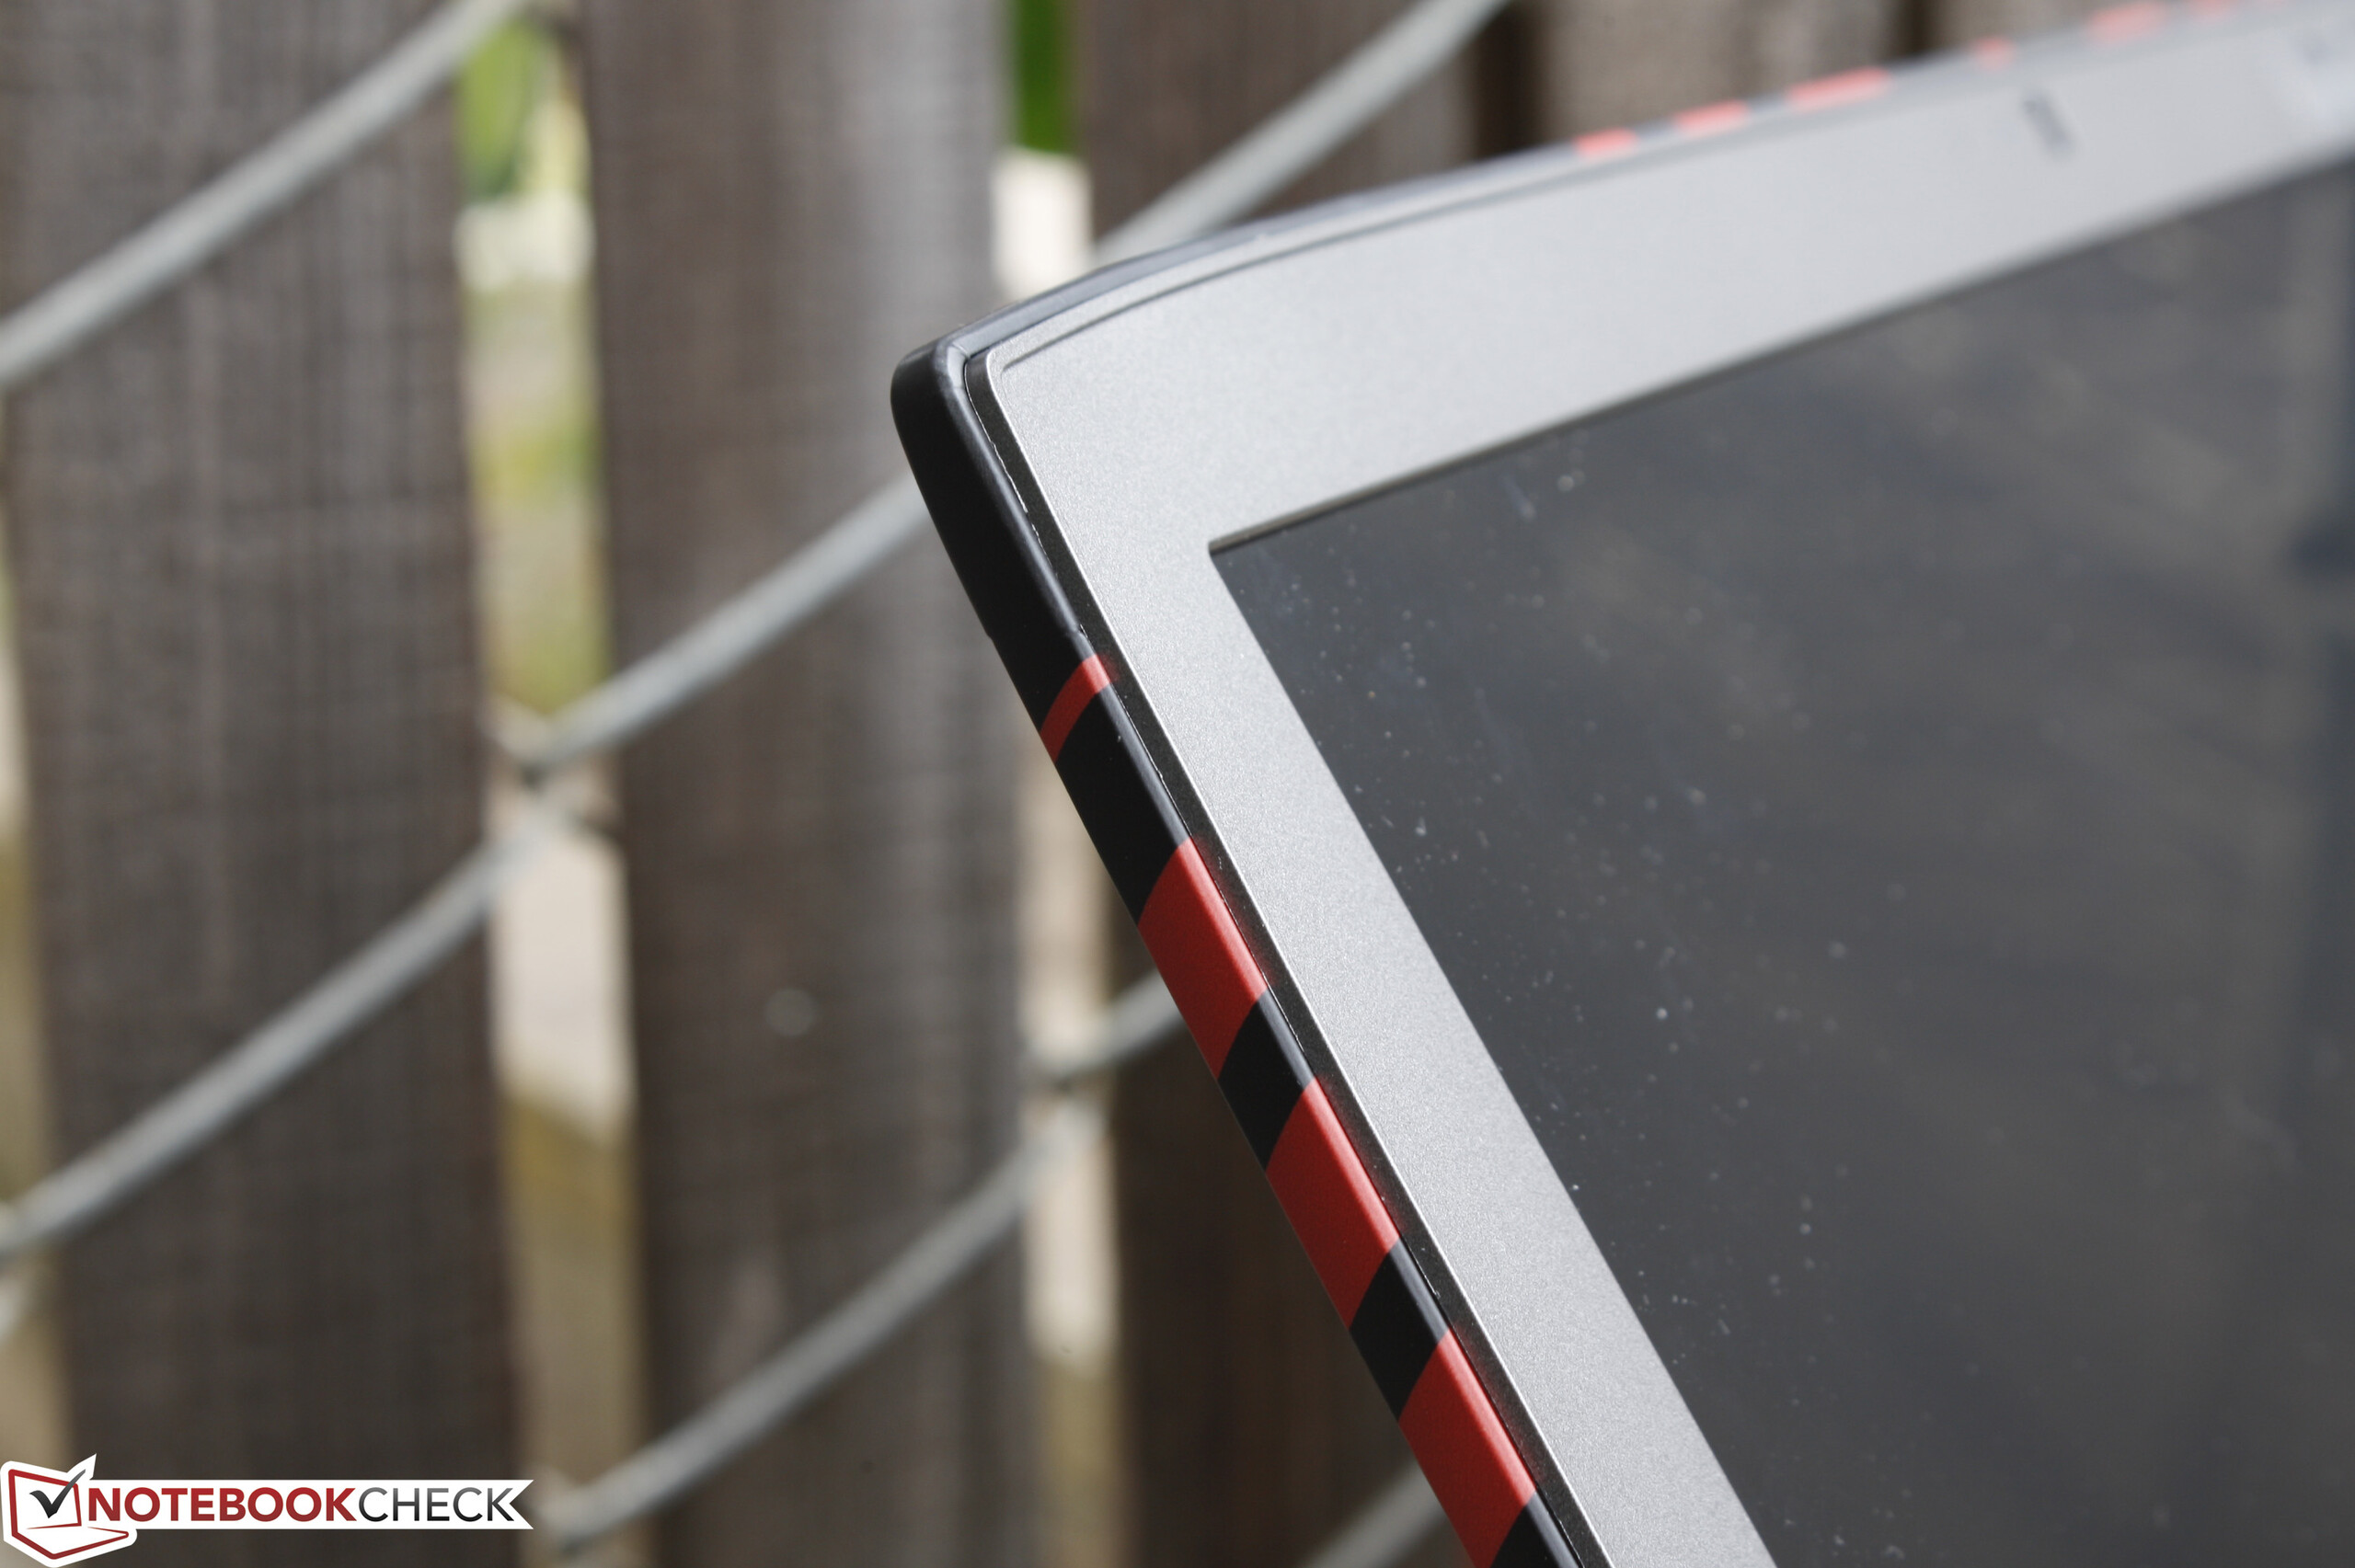
- 测试机的屏幕边缘存在漏光问题
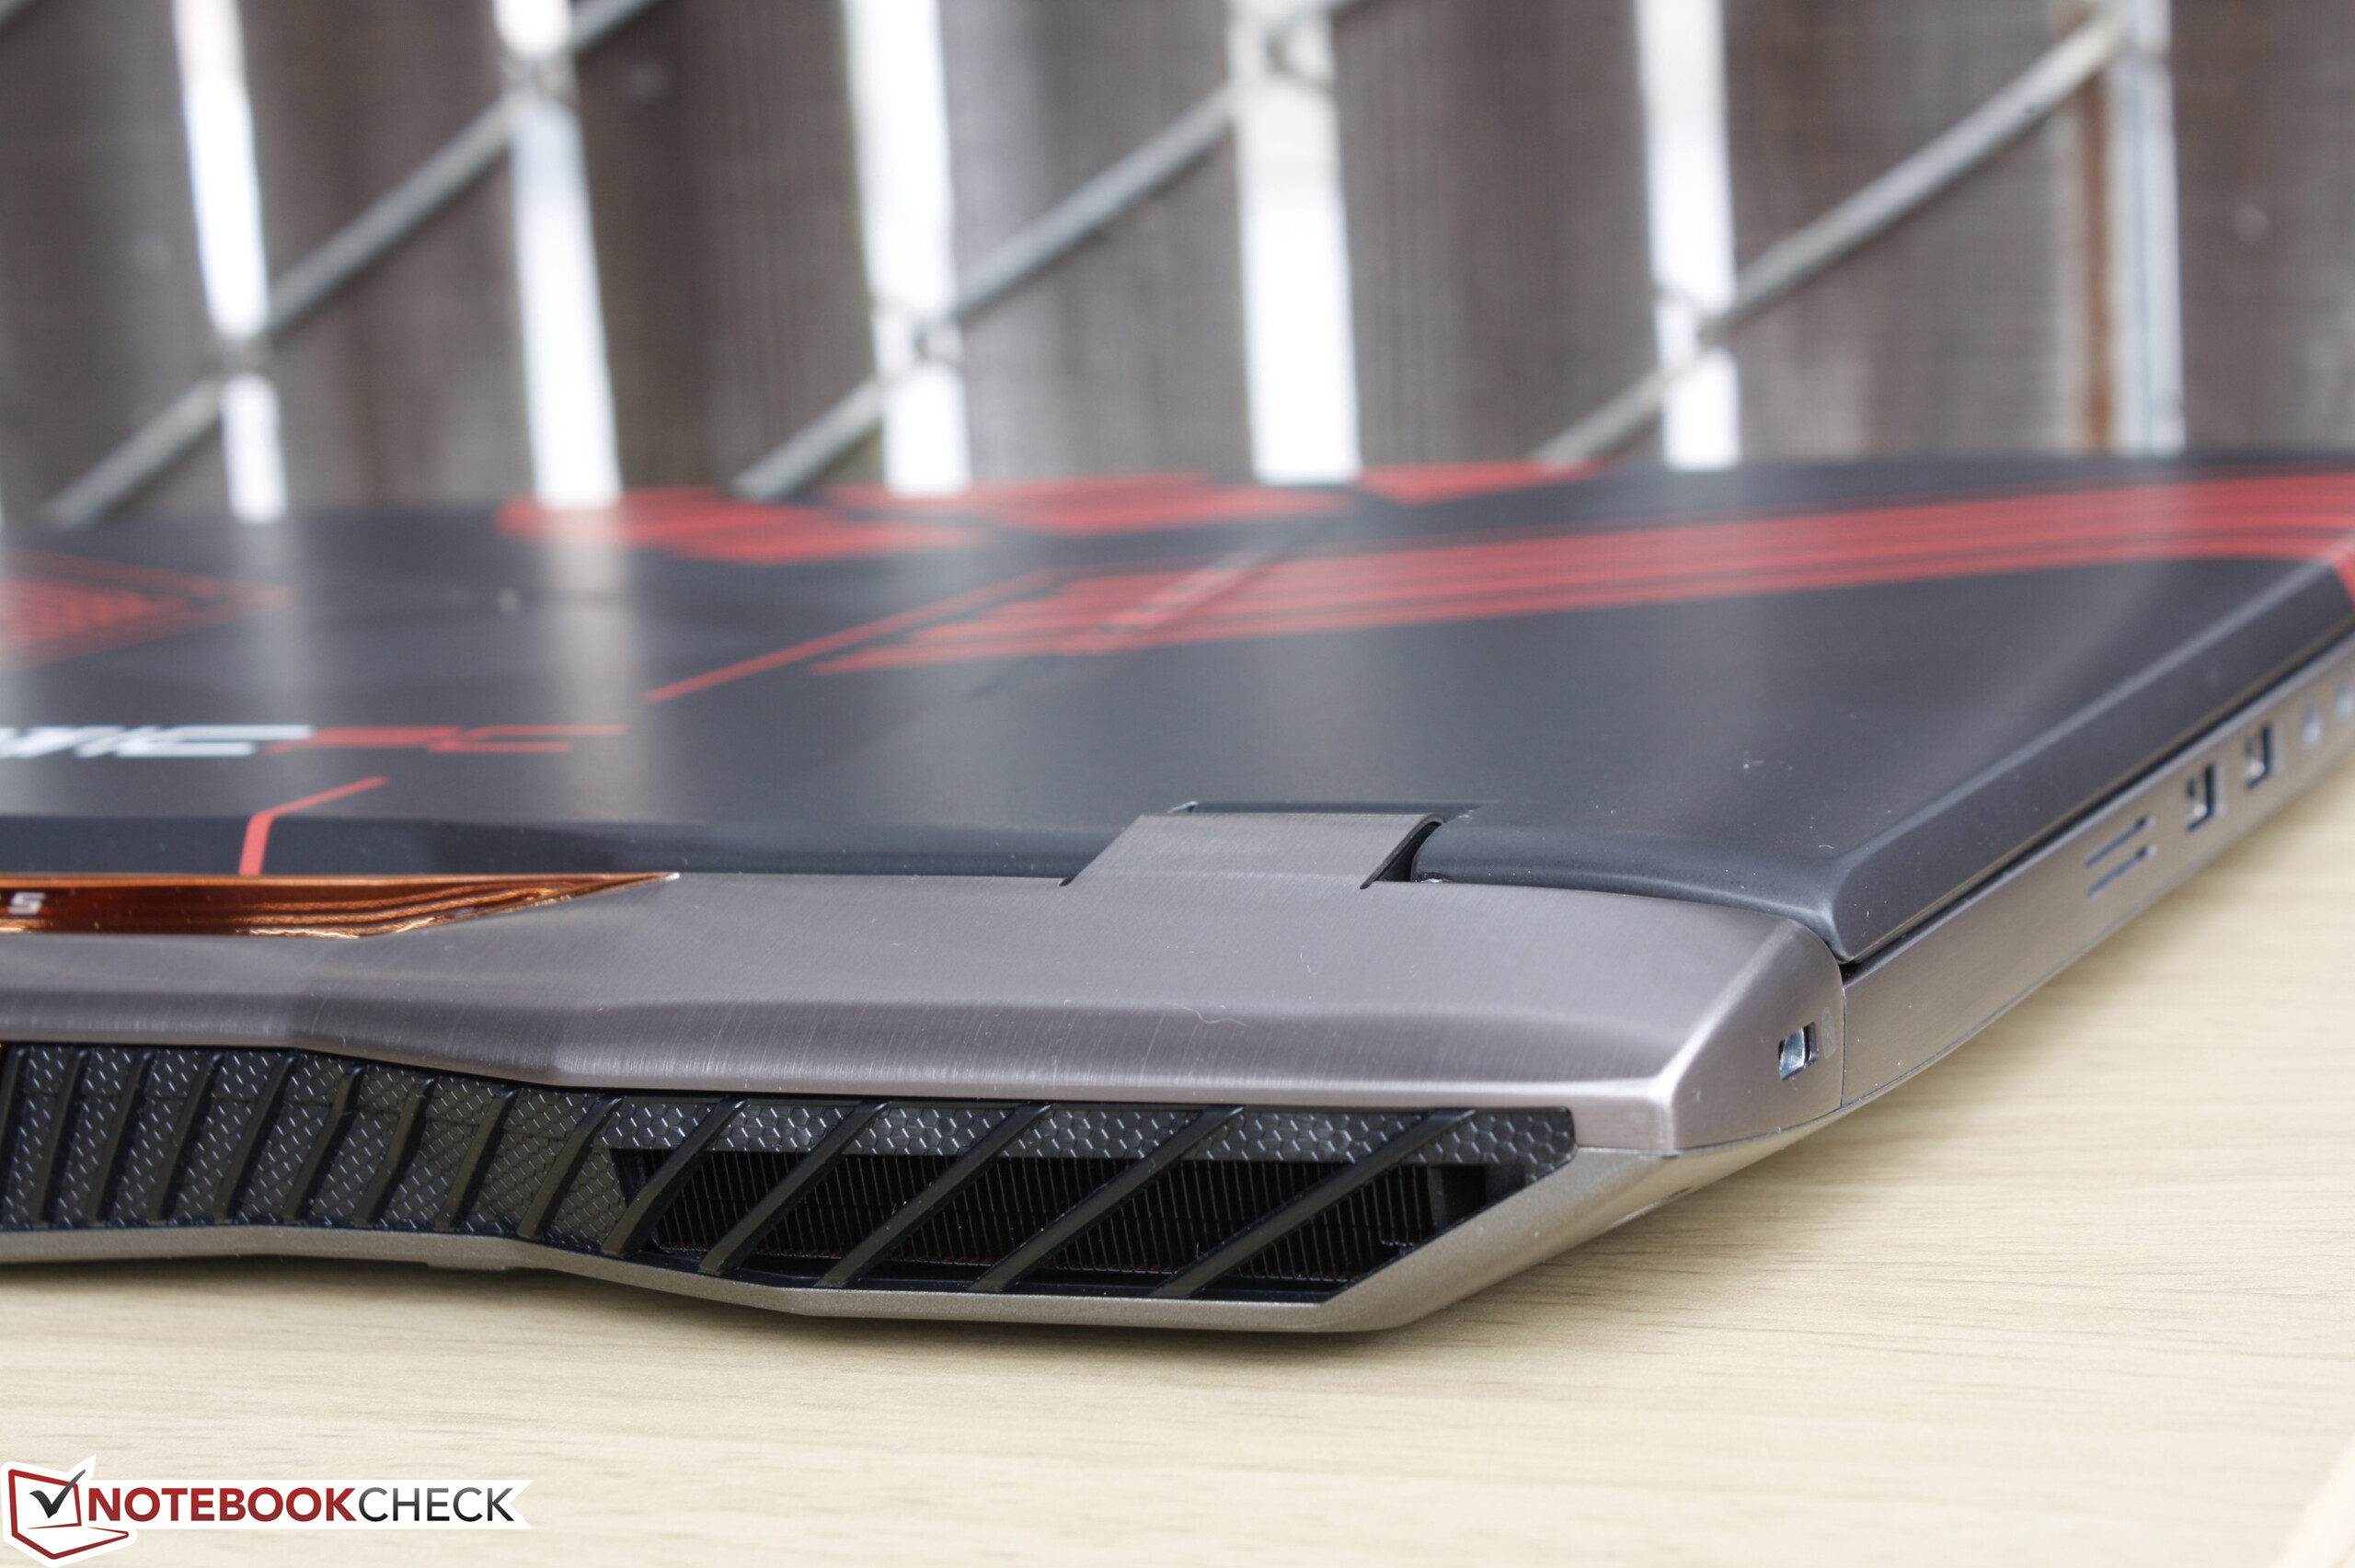
- 系统风扇几乎一直开启
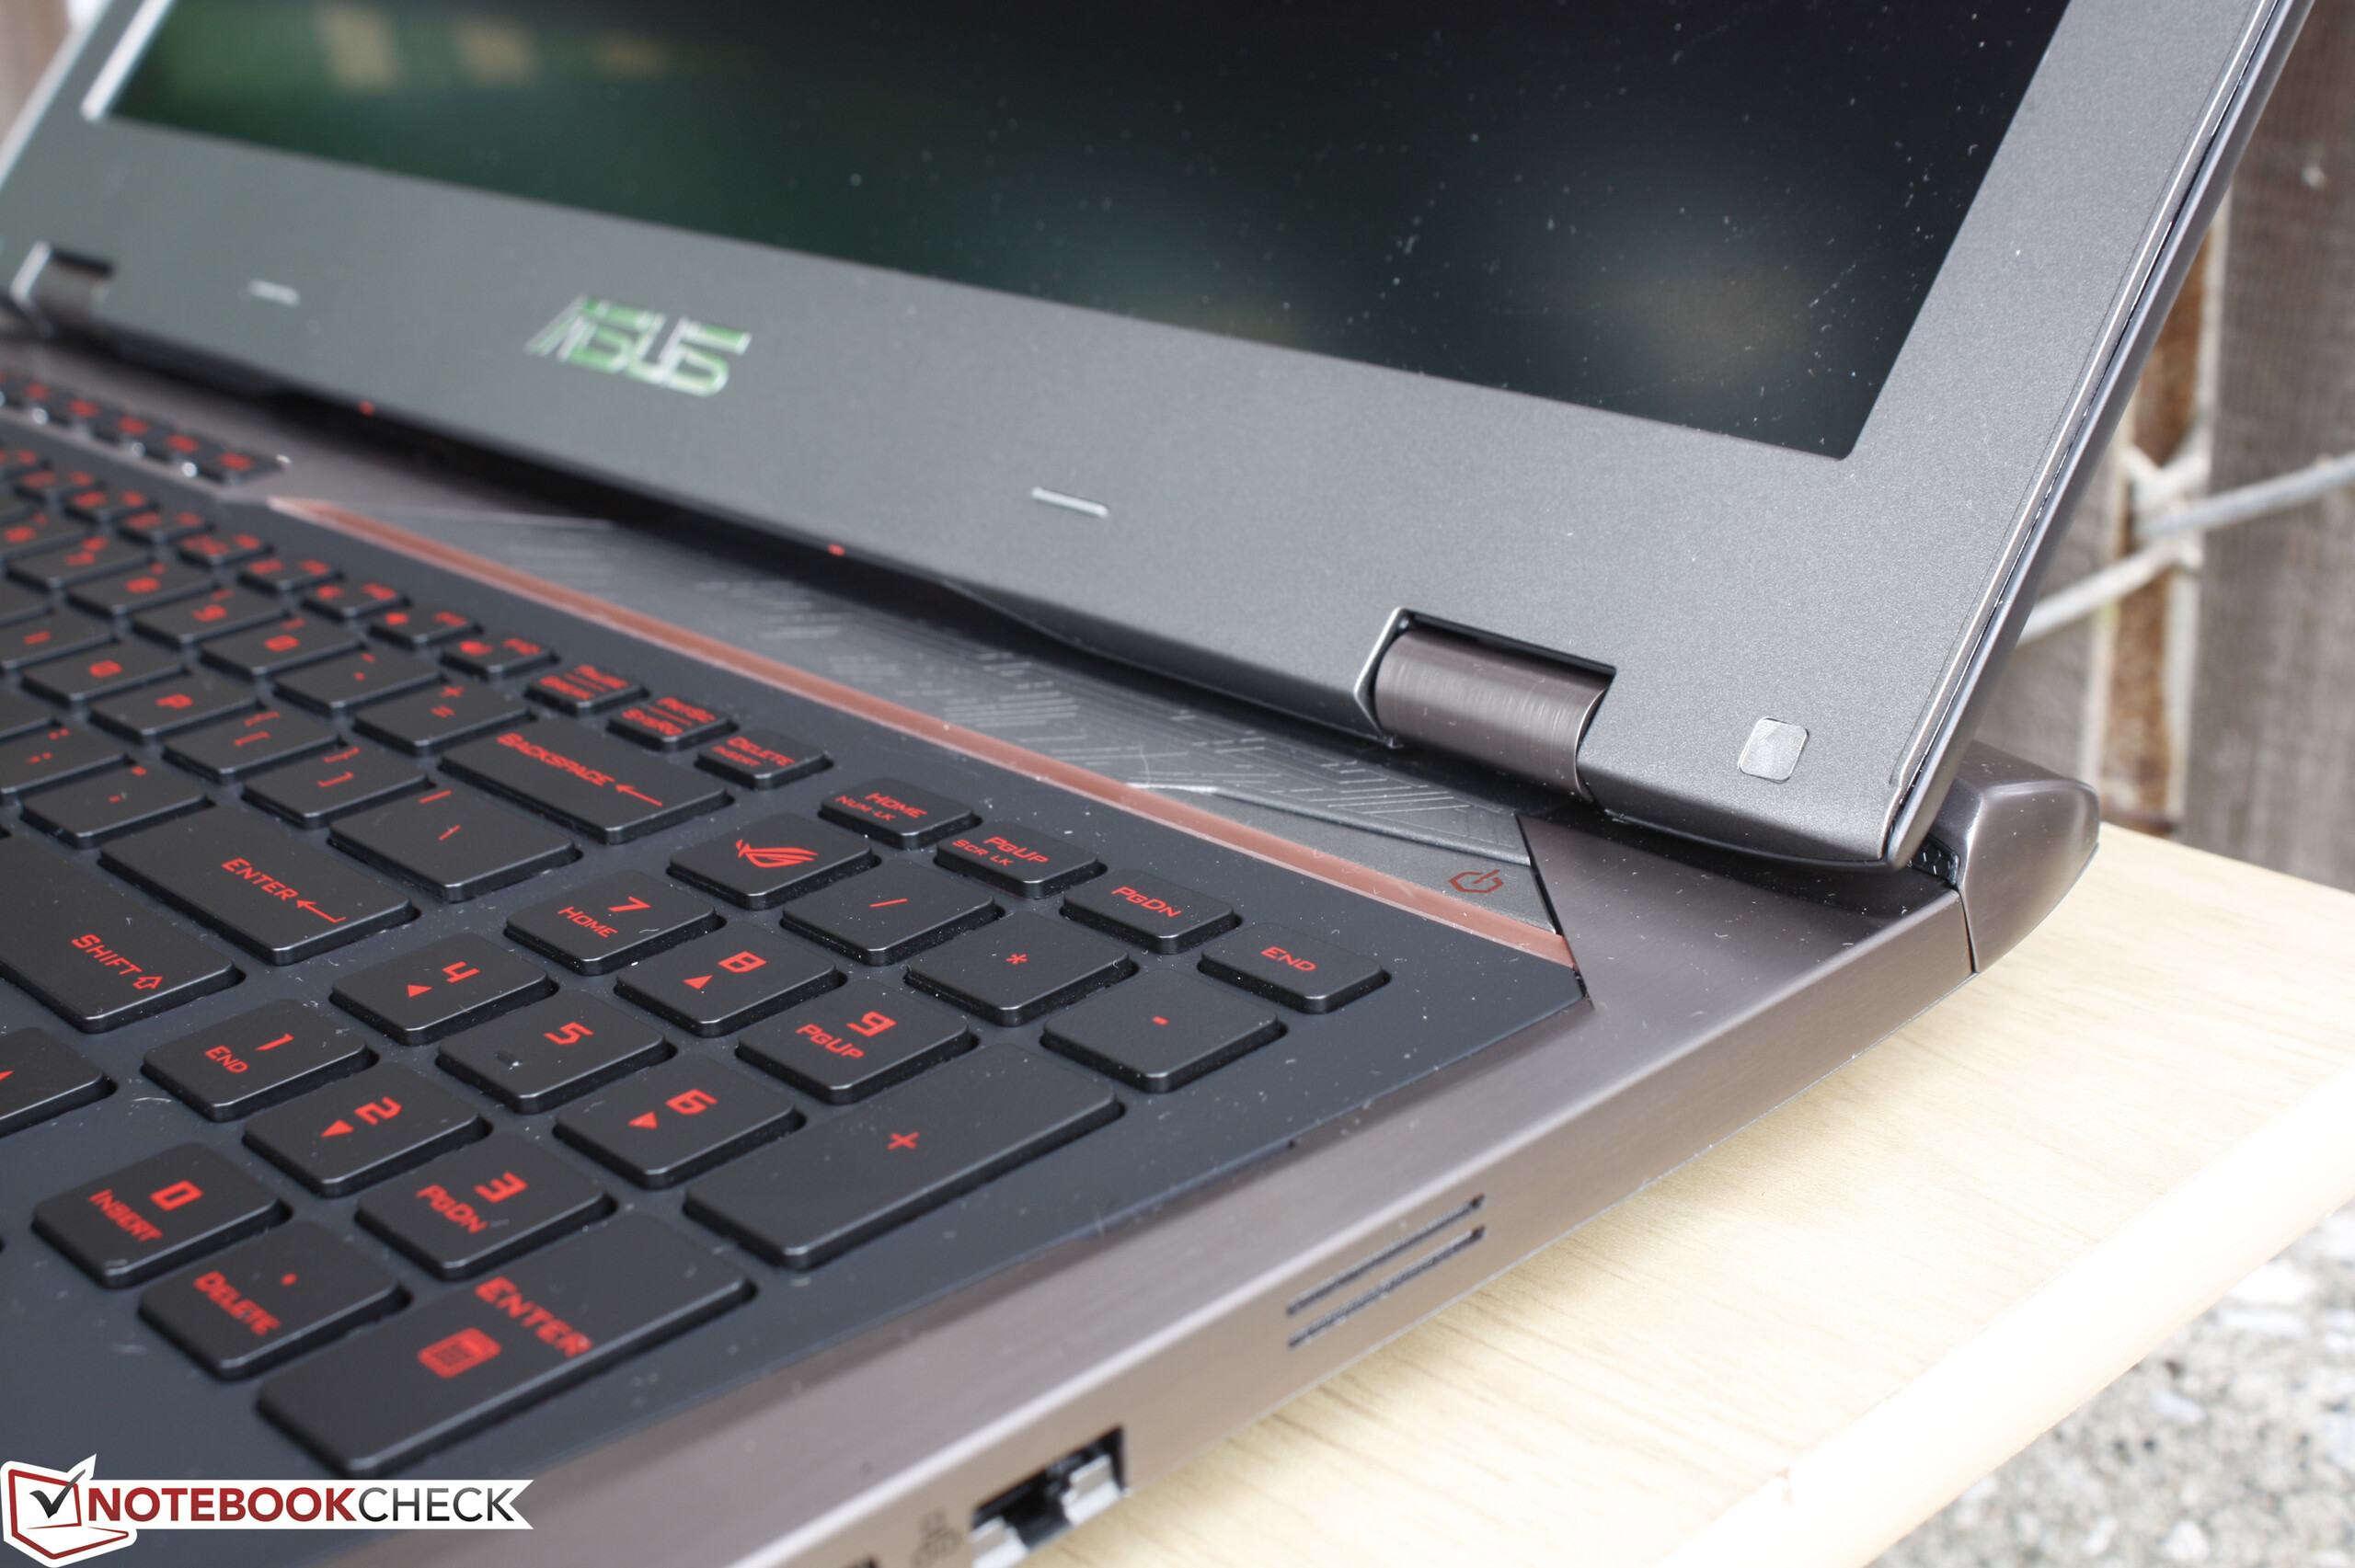
- 屏幕上盖不够坚固
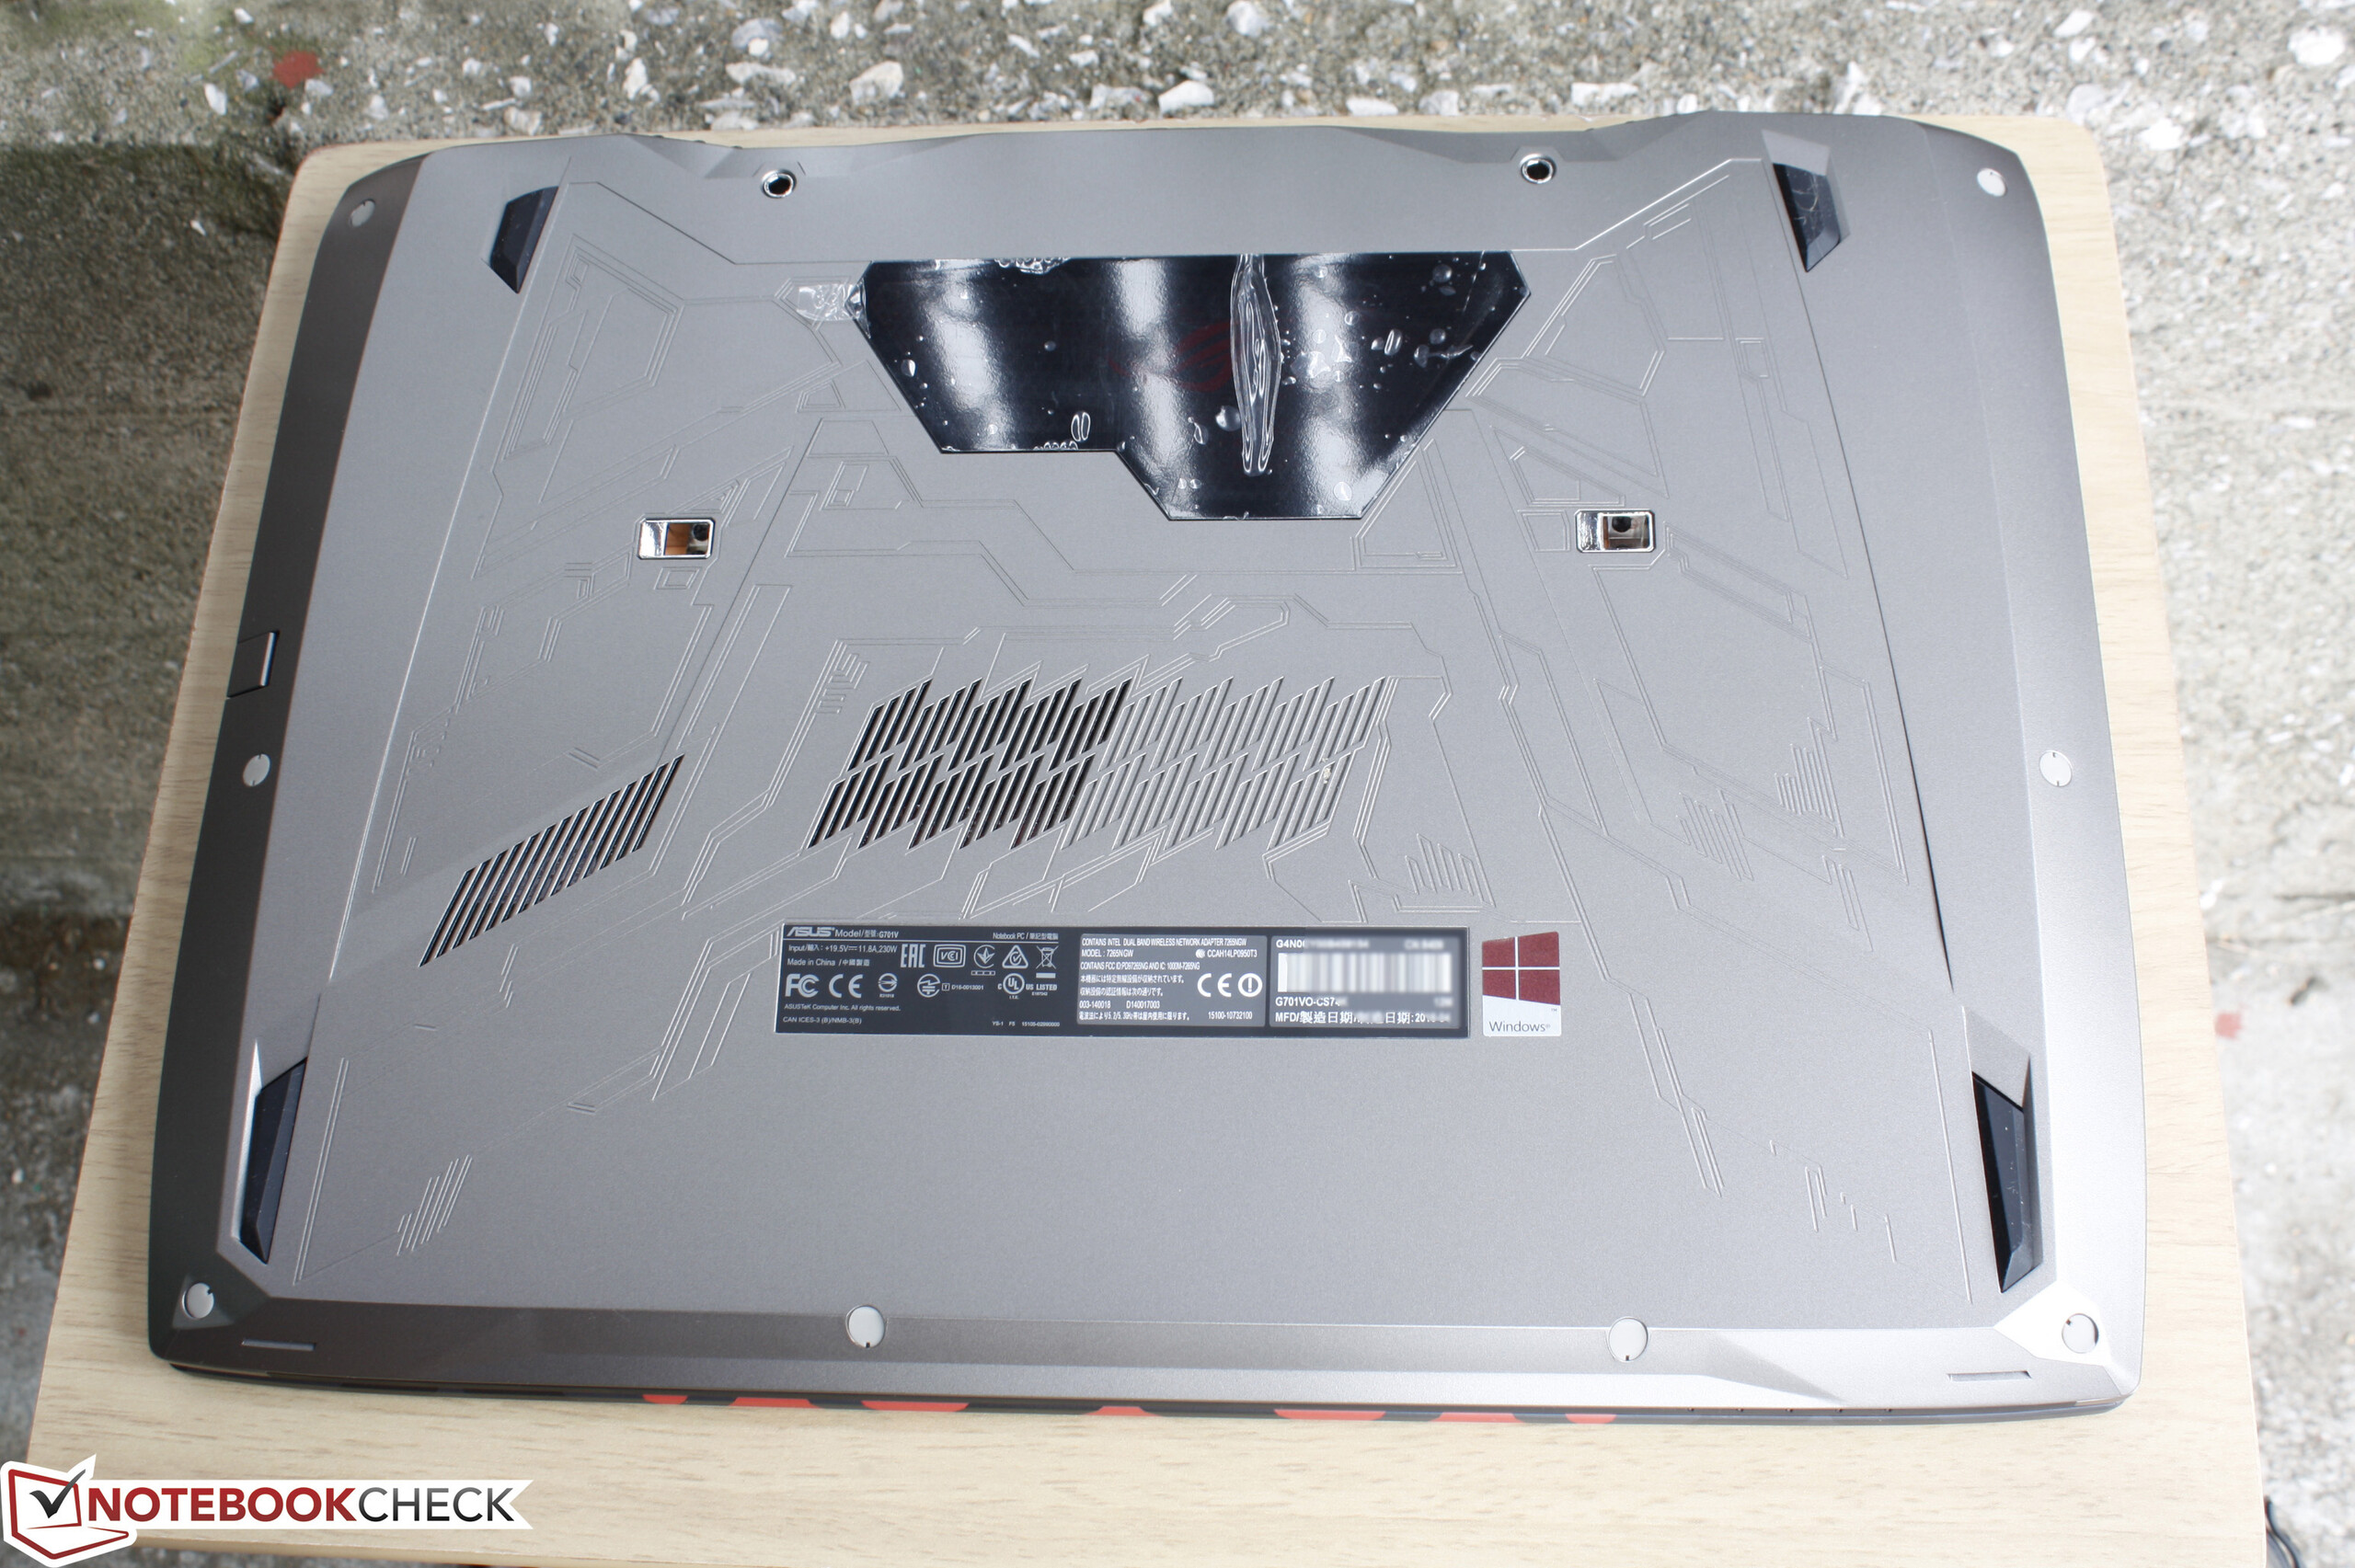
- 相对难以维护更新
- 无2.5寸硬盘选项
- 仅3个USB 3.0 A型接口
- 不均匀的键盘背光
- 低音较弱,无低音炮
- 板载GTX 980显卡
- 可编程按键尺寸较小
- 电池续航短

一直在等待搭配GTX 980系统,而未购买骨灰级的GX700的ROG粉现在可以考虑更薄的G701了。尽管G701的整体性能和配置都中规中矩,但它相比竞争机型如微星GT72S或Clevo准系统还是略逊一筹。例如,G701的硬盘选项仅限于M.2,它搭配了更轻(更吵)的散热系统,这也意味着它的处理器将会比GT72S或Eurocom DLX7在游戏负载下更烫。因此它的超频潜力也相应较低,同时为了节省空间它的显卡也采用了板载设计,让人十分失望。它的机身相比GT72S明显更薄,实际达到了10毫米的差距,不过在维护扩展性上也相应较差。
不论如何,G701依然是目前搭配GTX 980显卡的不多几款笔记本电脑之一,它的硬件能够正常发挥性能水平。不过它正在Plascali系列显卡上市之前,在未来几周或几月中应该会有所降价。
注:本文是基于完整评测的缩减版本,阅读完整的英文评测,请点击这里。
Asus G701VO-CS74K
- 07/29/2016 v5.1 (old)
Allen Ngo
Gaming - Weighted Average
Price comparison
