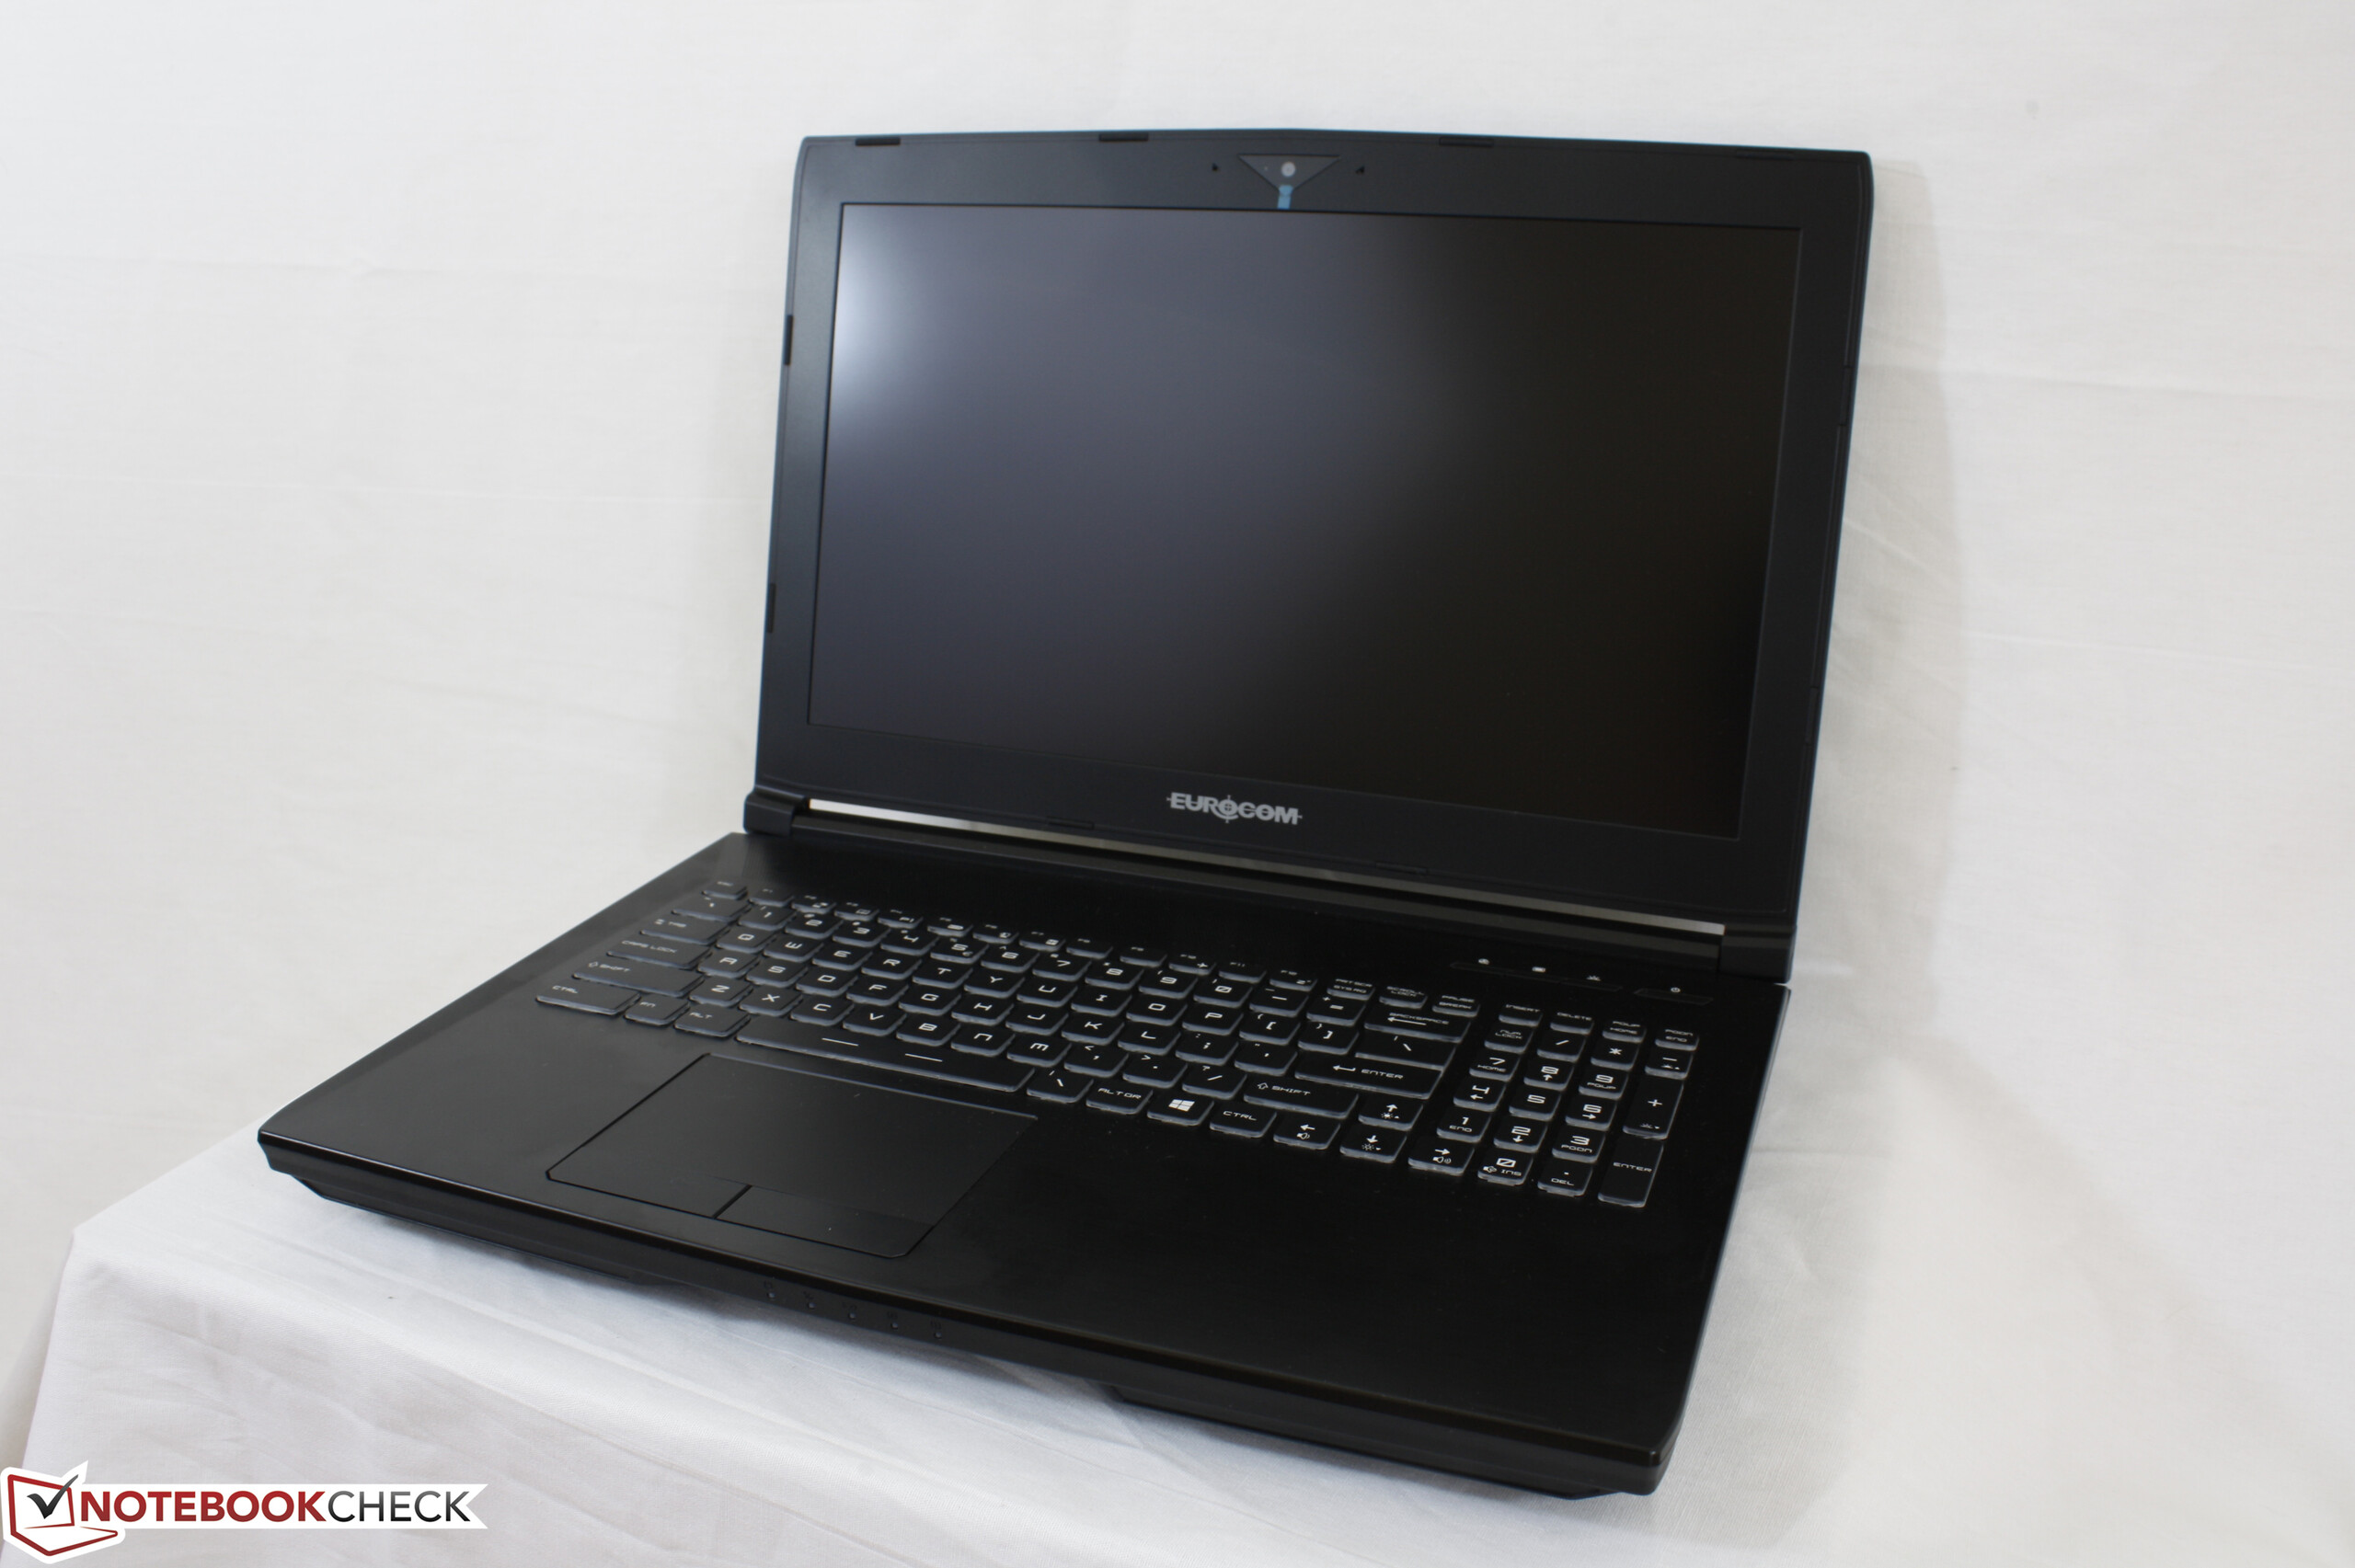
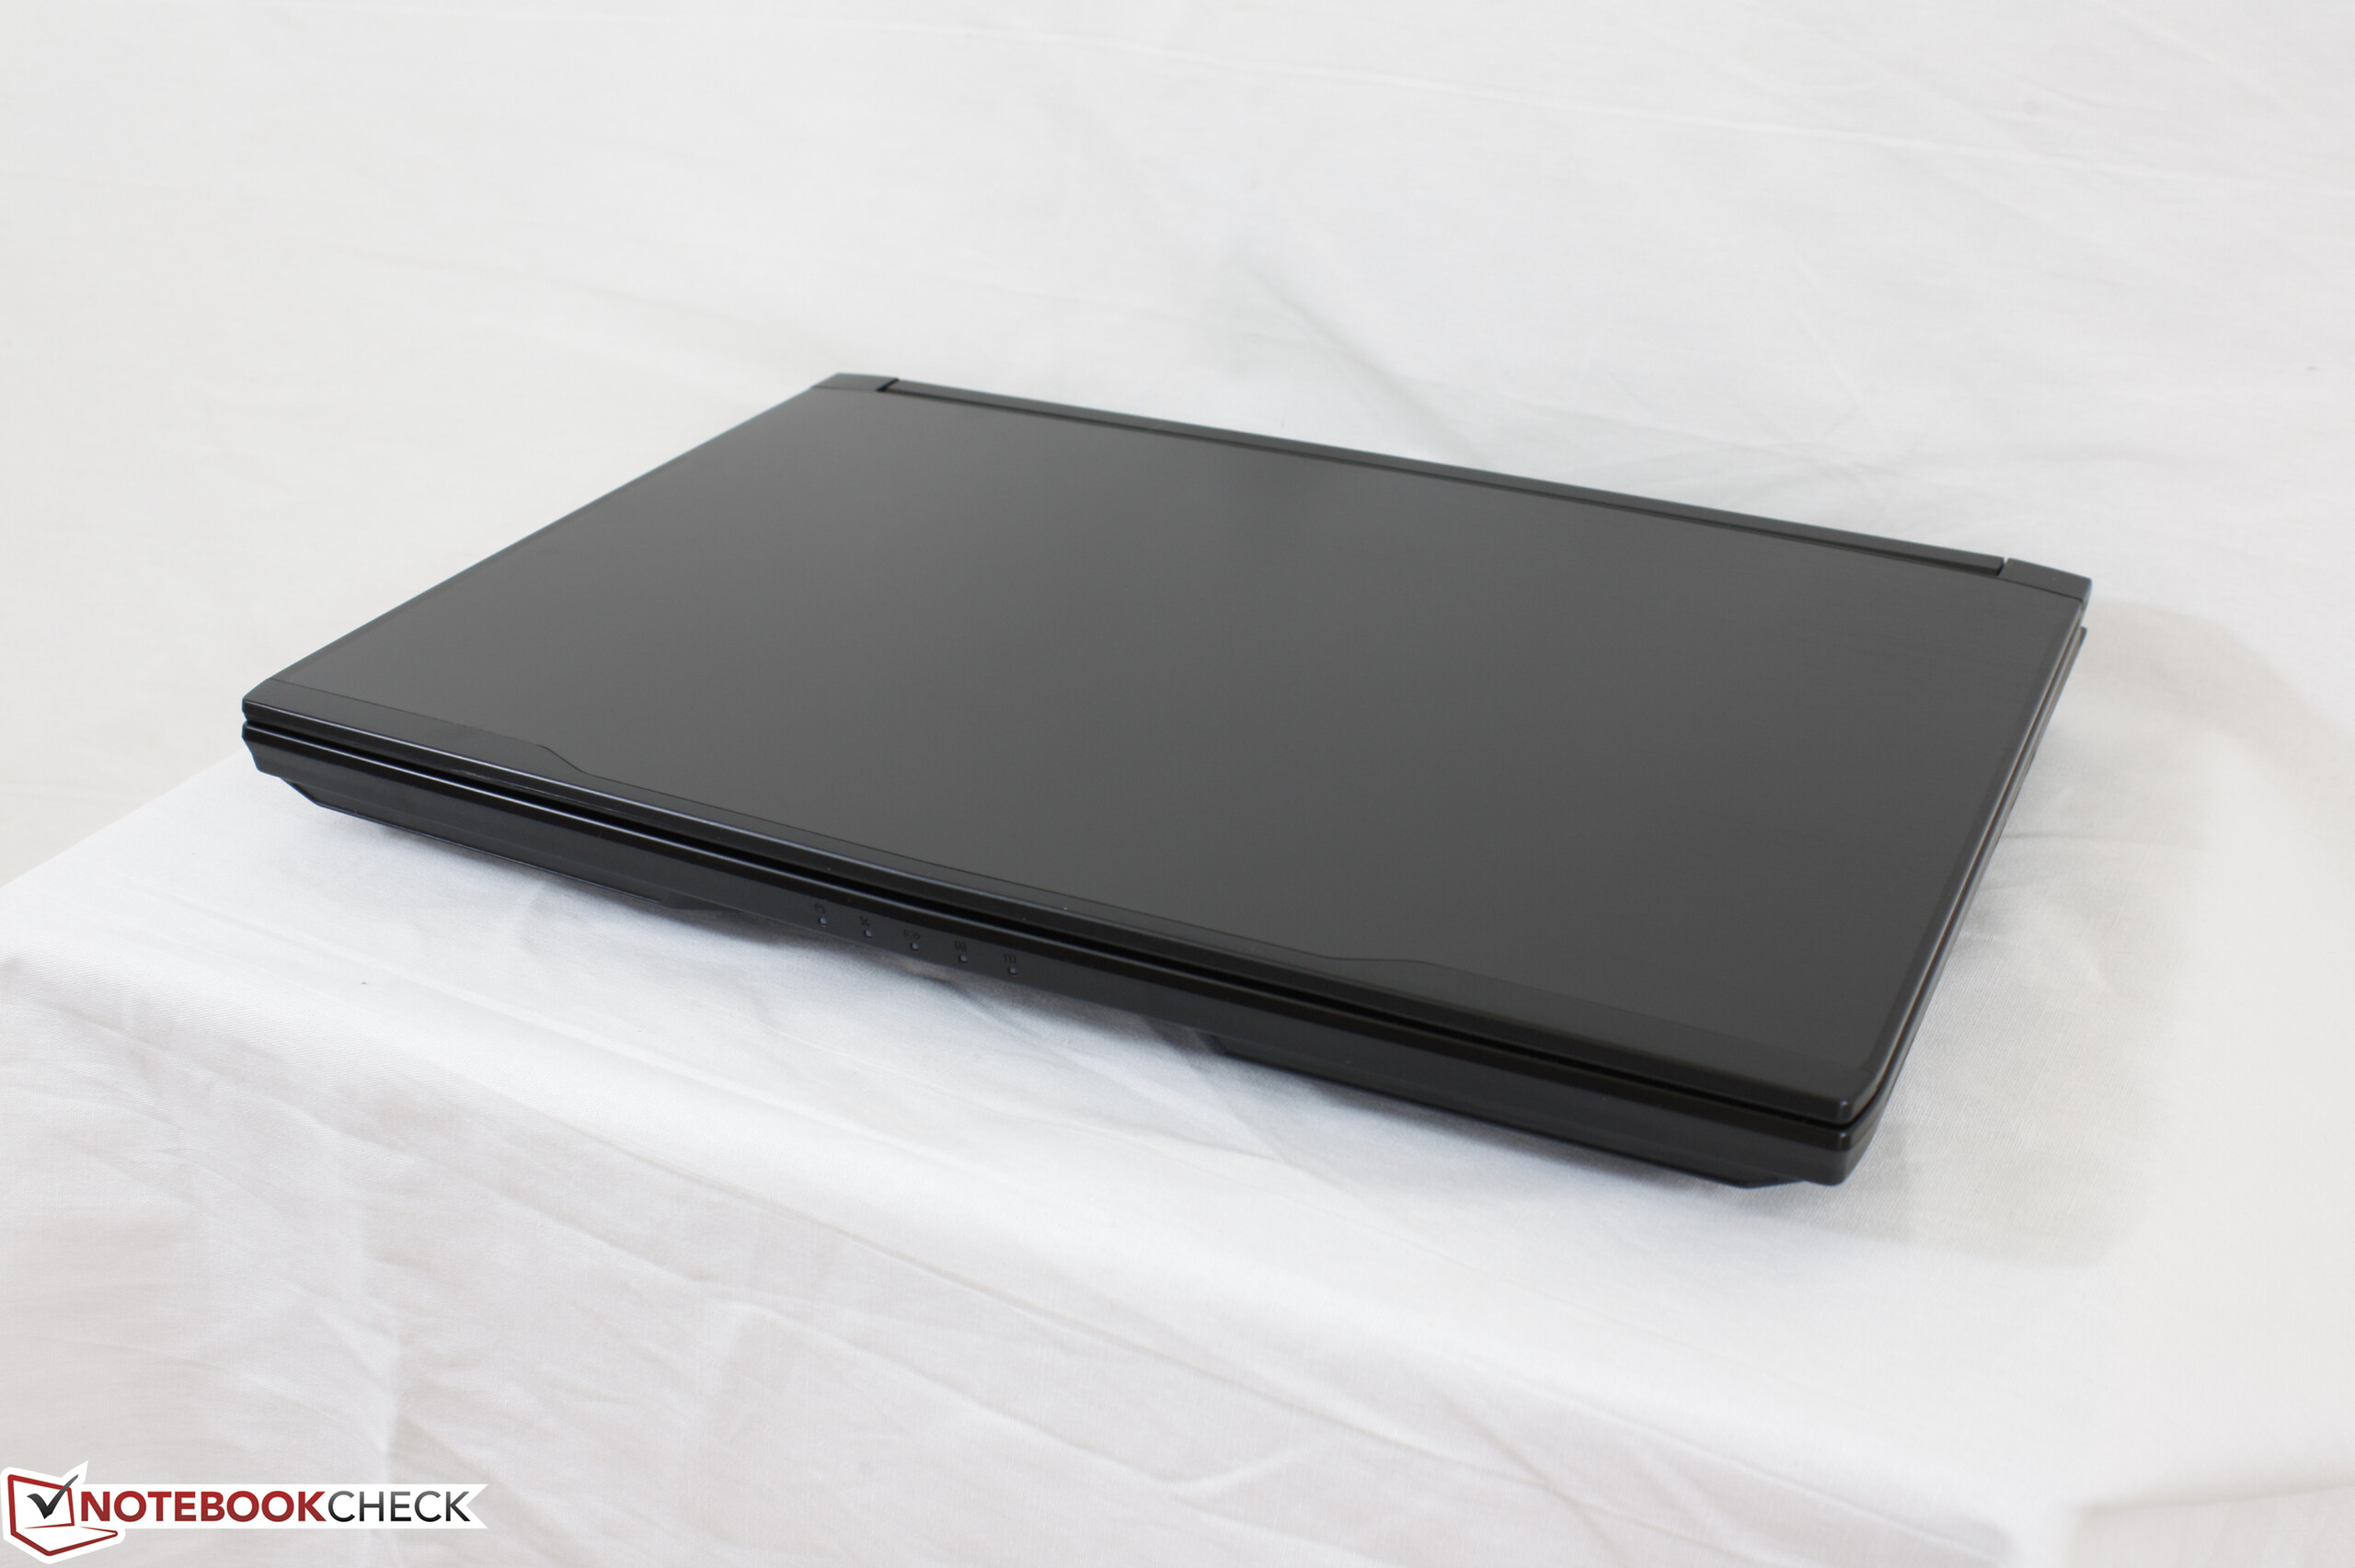
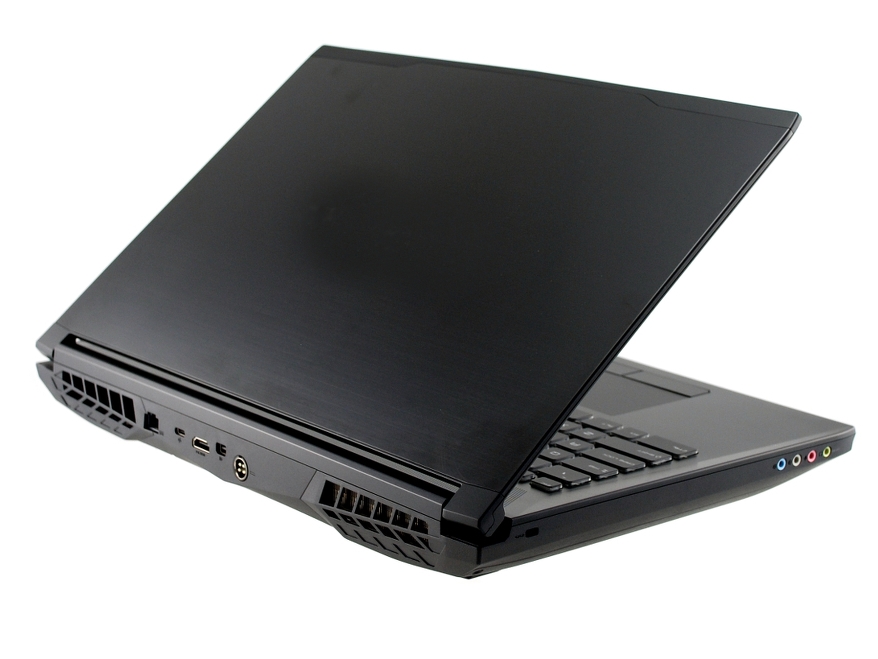
Eurocom Tornado F5 Killer Edition (i5-7600K, 4K UHD, GTX 1080, MSI 16L13) 笔记本电脑简短评测


| SD Card Reader | |
| average JPG Copy Test (av. of 3 runs) | |
| Eurocom Tornado F5 Killer Edition | |
| MSI GT72VR 7RE-433 | |
| Alienware 17 R3 (A17-9935) | |
| maximum AS SSD Seq Read Test (1GB) | |
| Eurocom Tornado F5 Killer Edition | |
| MSI GT72VR 7RE-433 | |
| Alienware 17 R3 (A17-9935) | |
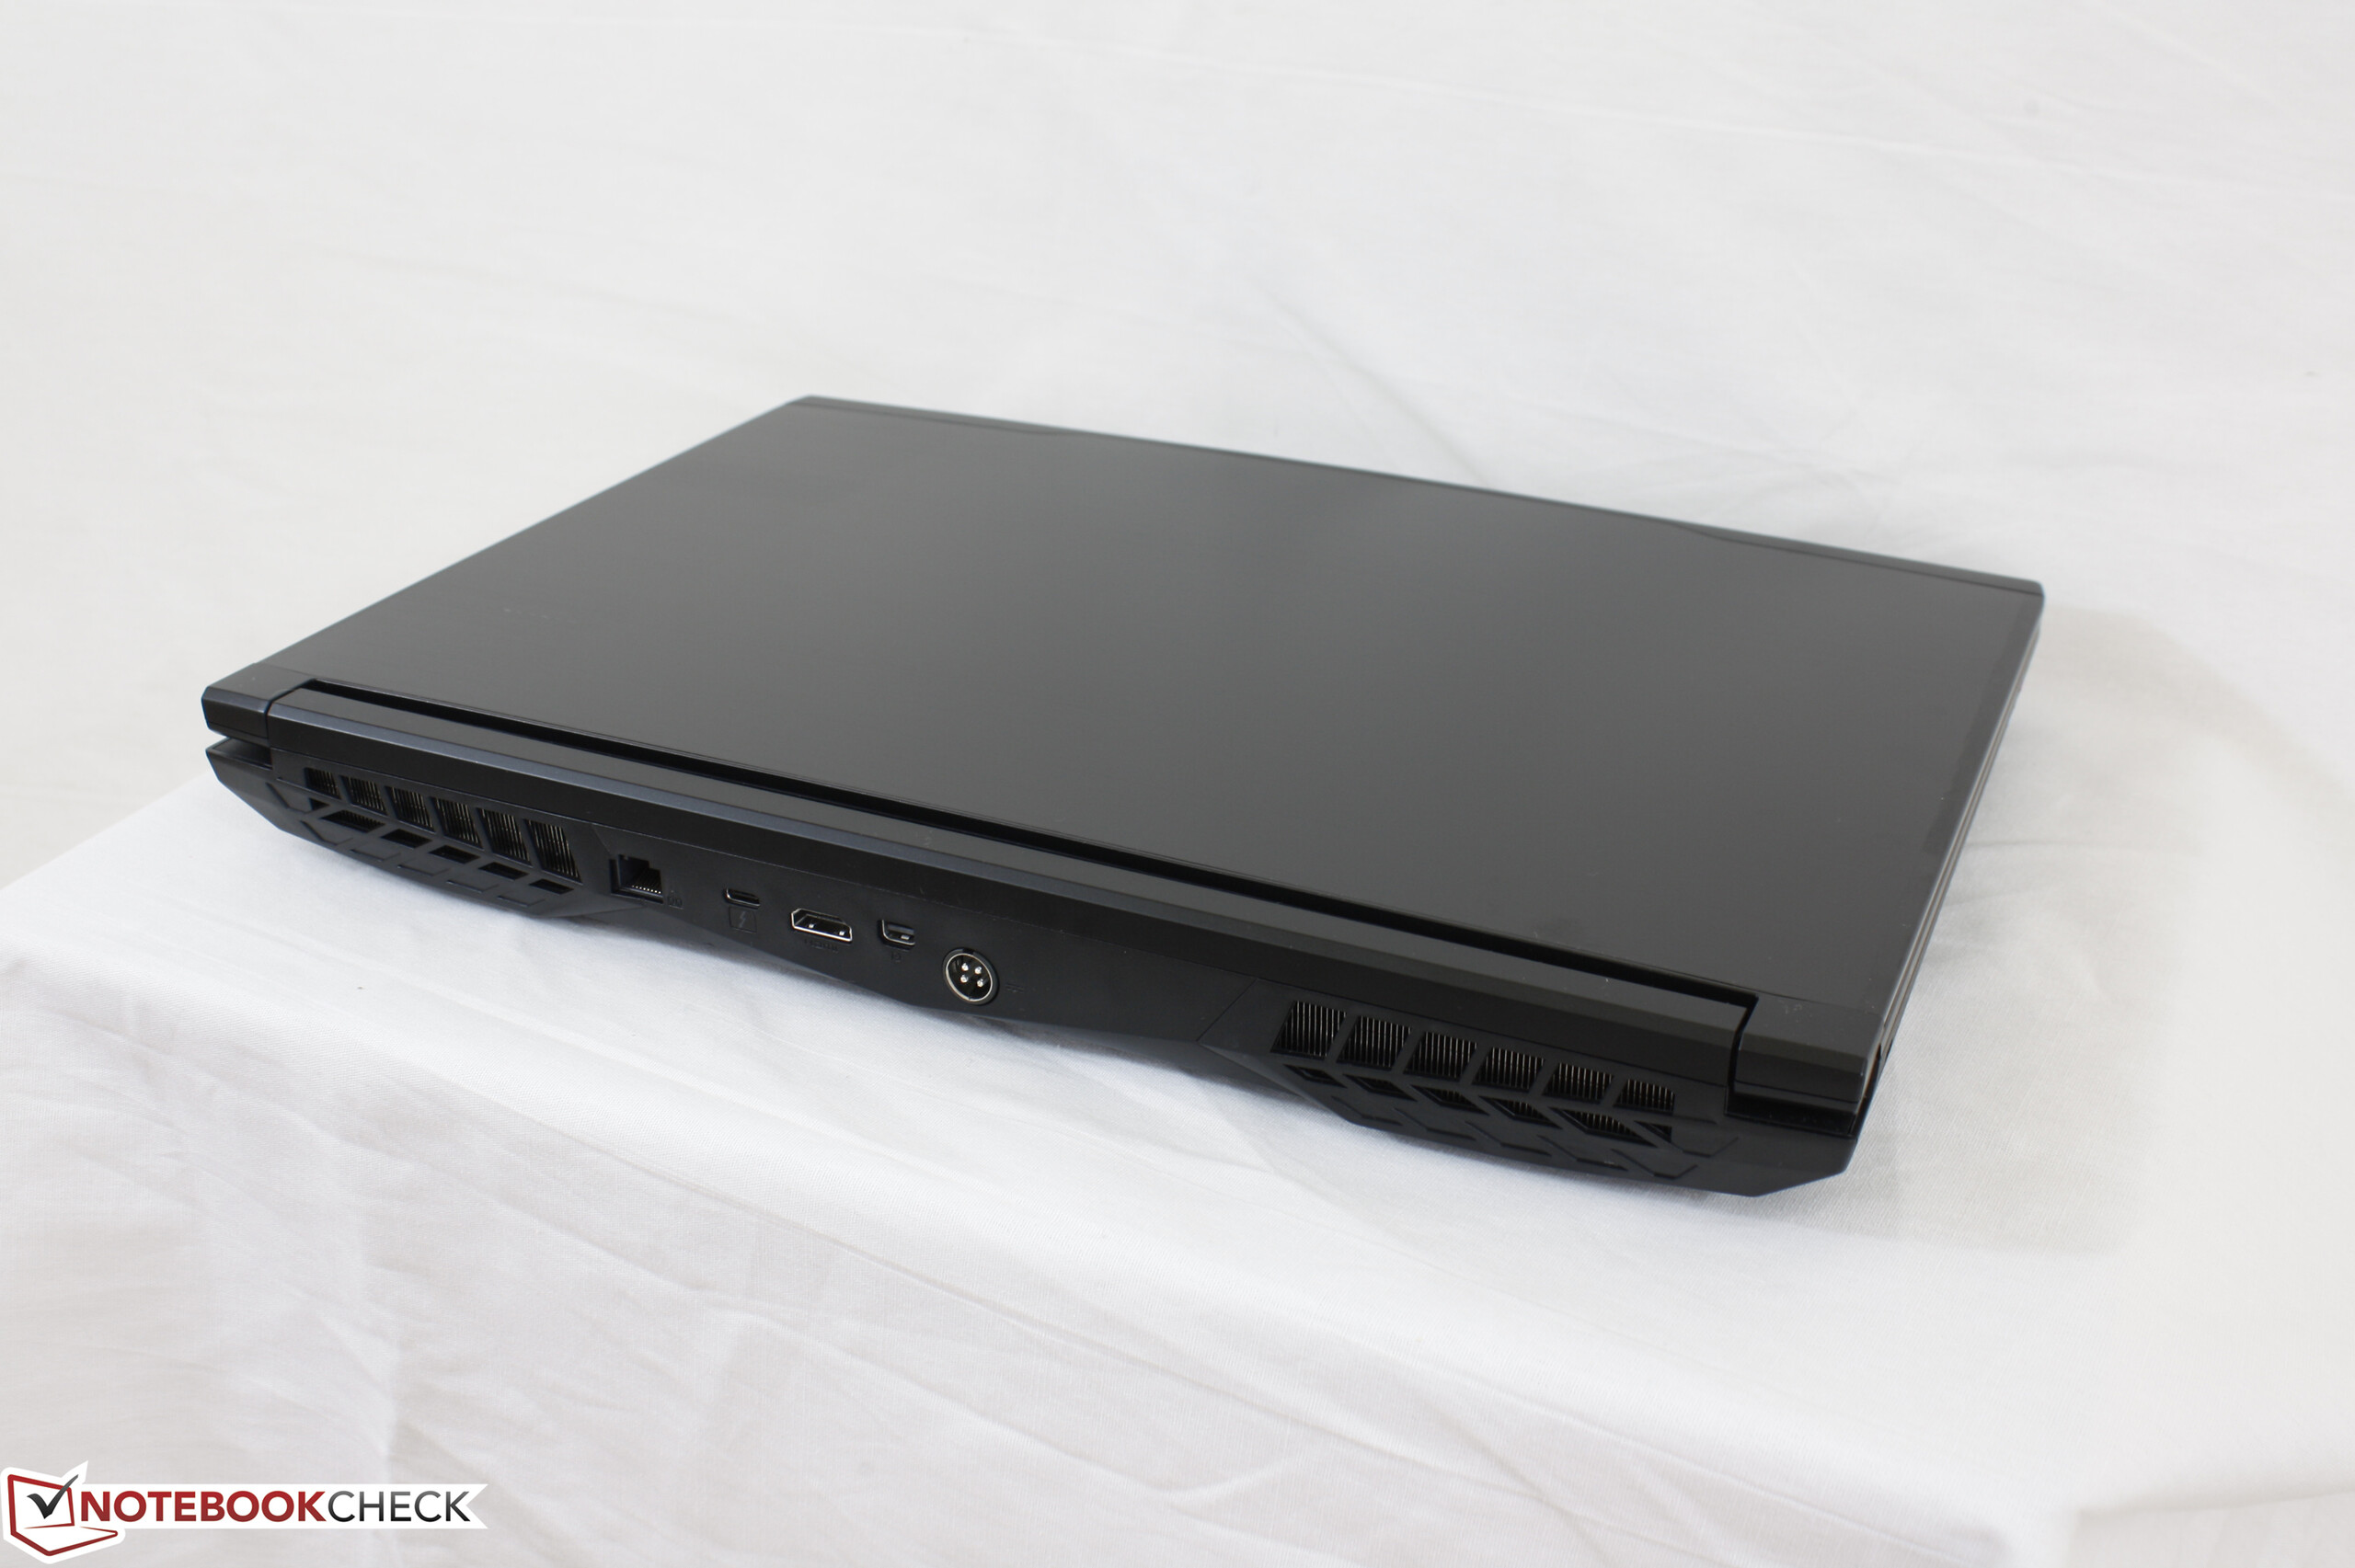
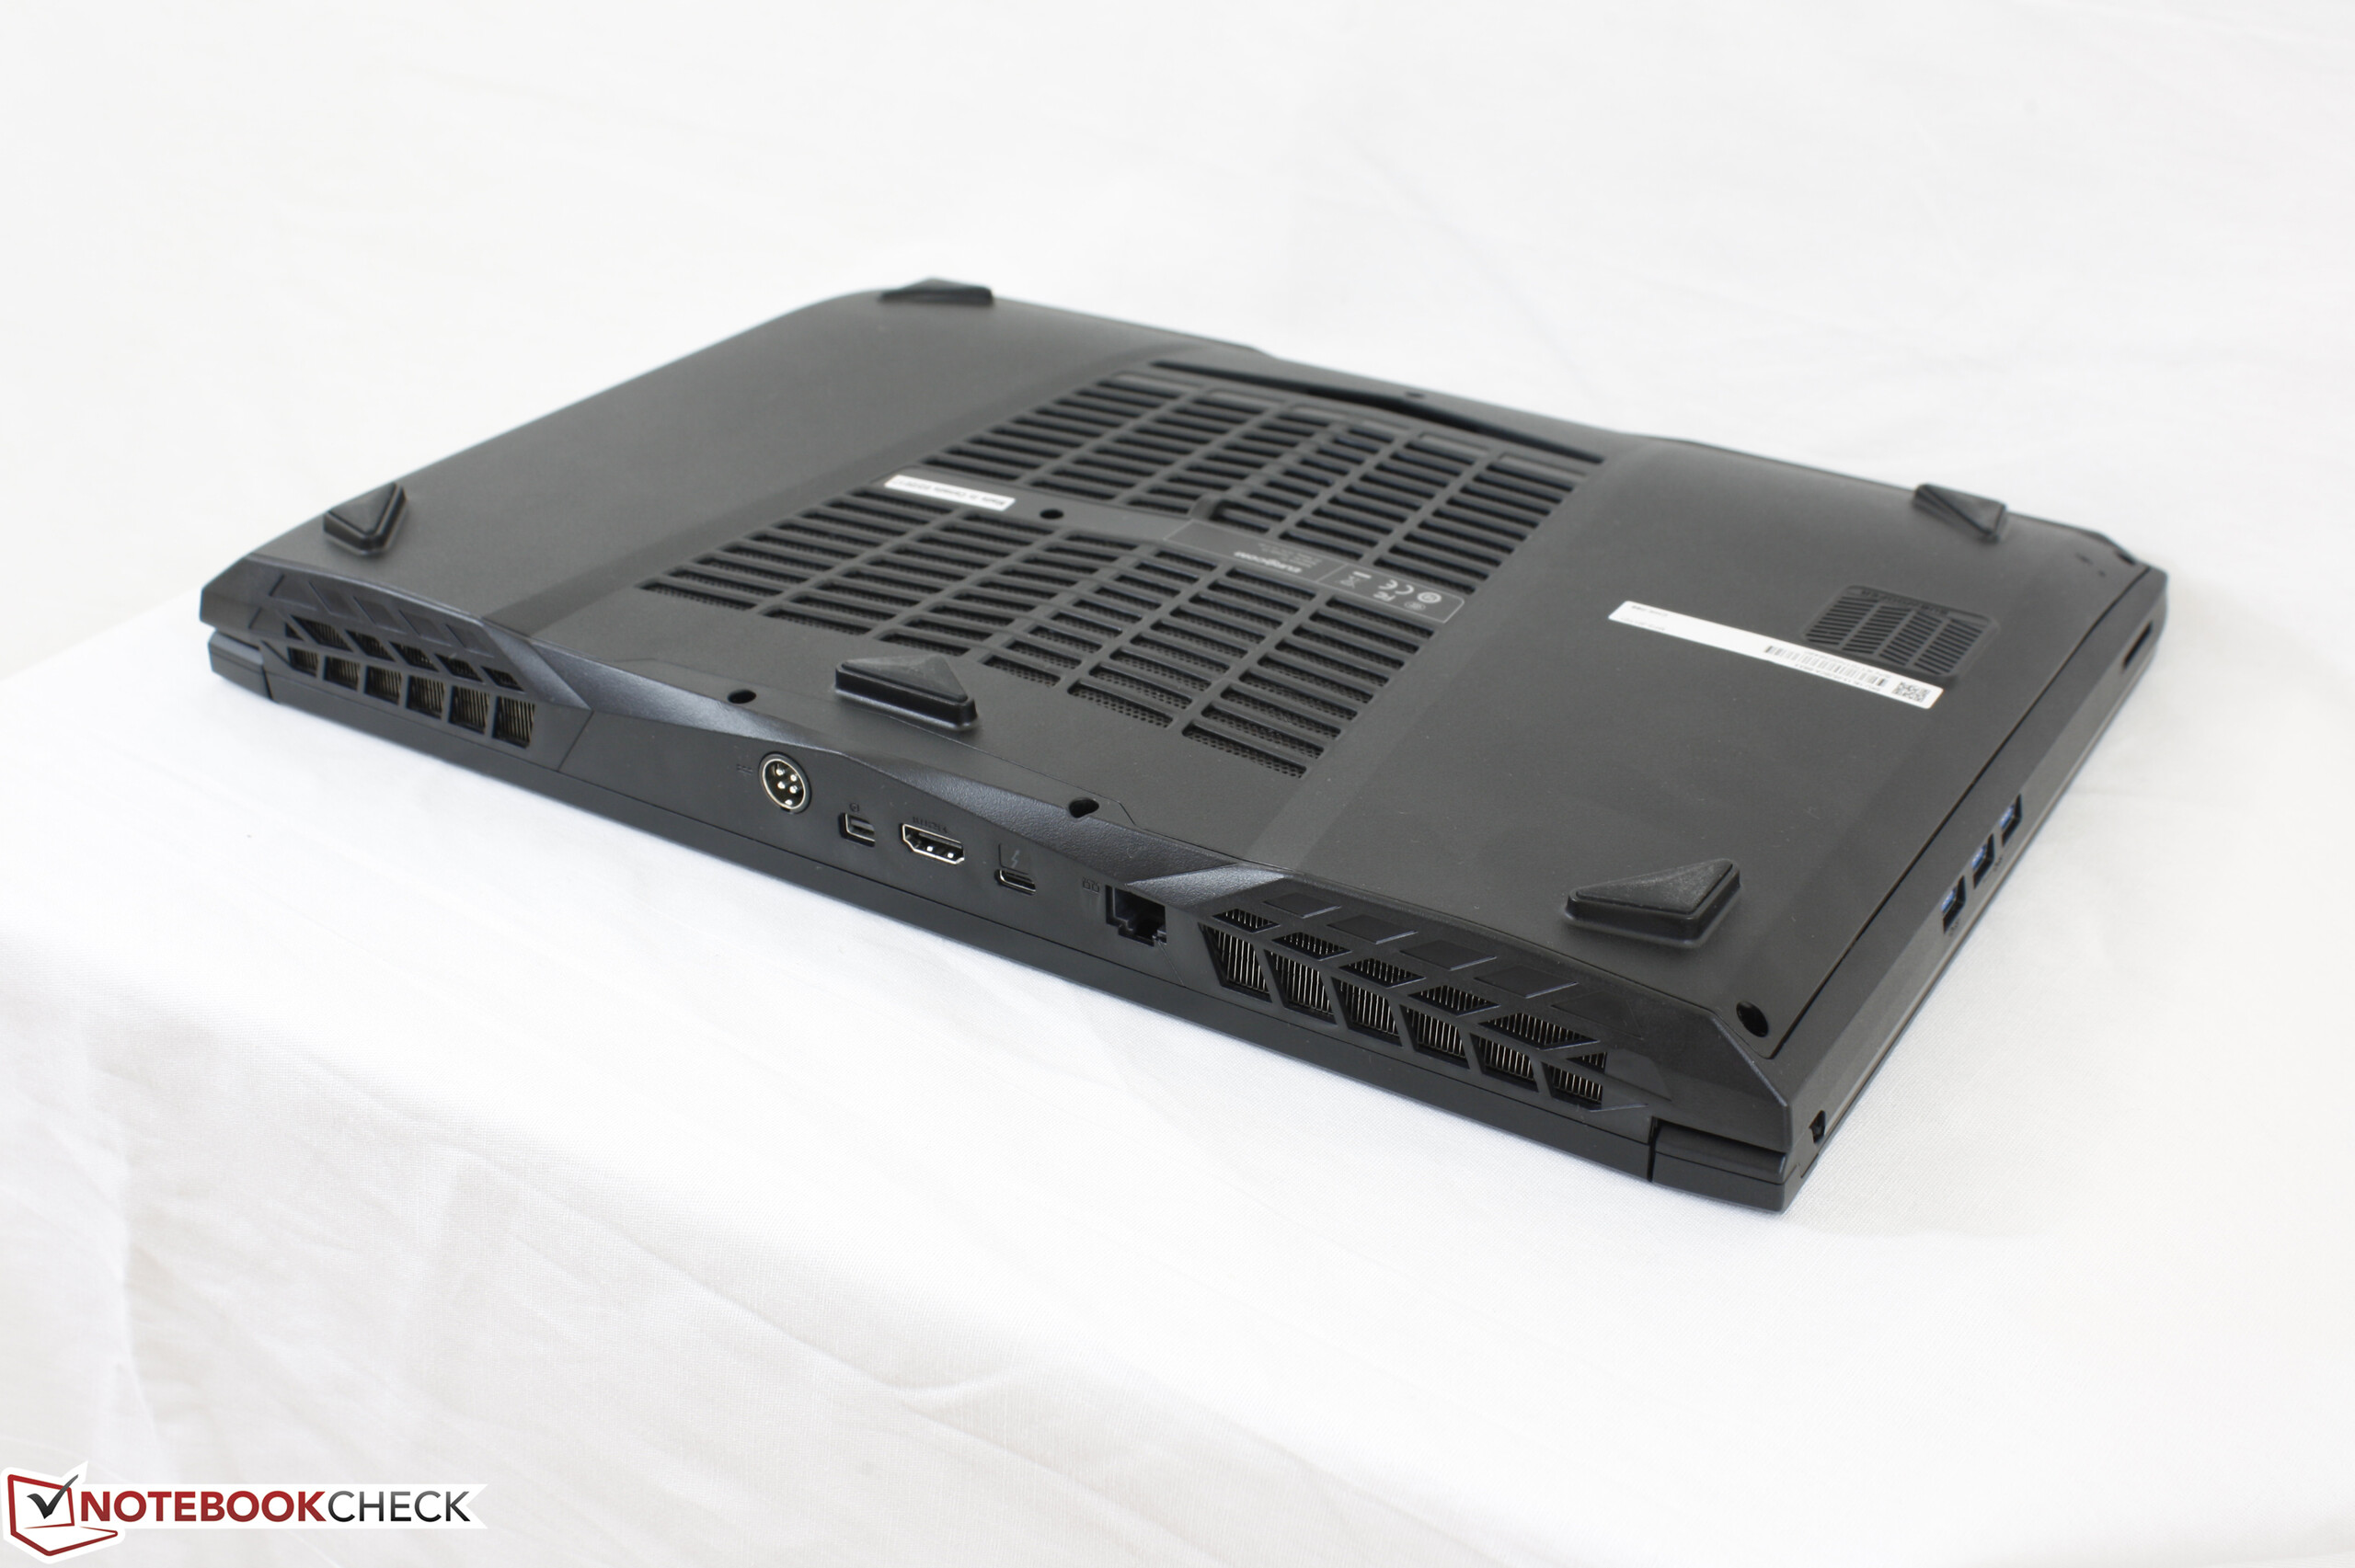
| Networking | |
| iperf3 transmit AX12 | |
| Dell XPS 15 9560 (i7-7700HQ, UHD) | |
| Eurocom Tornado F5 Killer Edition | |
| HP Spectre x360 15-bl002xx | |
| iperf3 receive AX12 | |
| Dell XPS 15 9560 (i7-7700HQ, UHD) | |
| HP Spectre x360 15-bl002xx | |
| Eurocom Tornado F5 Killer Edition | |
| |||||||||||||||||||||||||
Brightness Distribution: 84 %
Center on Battery: 305.8 cd/m²
Contrast: 665:1 (Black: 0.46 cd/m²)
ΔE ColorChecker Calman: 5.2 | ∀{0.5-29.43 Ø4.71}
ΔE Greyscale Calman: 1.1 | ∀{0.09-98 Ø4.96}
75.5% sRGB (Argyll 1.6.3 3D)
47.3% AdobeRGB 1998 (Argyll 1.6.3 3D)
51.5% AdobeRGB 1998 (Argyll 3D)
75% sRGB (Argyll 3D)
49.9% Display P3 (Argyll 3D)
Gamma: 2.23
CCT: 6732 K
| Eurocom Tornado F5 Killer Edition IPS, 15.6", 3840x2160 | Dell XPS 15 9560 (i7-7700HQ, UHD) IGZO IPS, 15.6", 3840x2160 | Alienware 15 R3 HPJGK_B156HTN (AUO51ED), TN, 15.6", 1920x1080 | Acer Predator 15 G9-593-765Q LG Philips LP156WF6-SPP1 (LGD04D5), IPS, 15.6", 1920x1080 | Eurocom Tornado F5 IPS, 15.6", 1920x1080 | |
|---|---|---|---|---|---|
| Display | 69% | 27% | 19% | 19% | |
| Display P3 Coverage (%) | 49.9 | 89.7 80% | 66 32% | 63.6 27% | 64.5 29% |
| sRGB Coverage (%) | 75 | 100 33% | 90.5 21% | 83.9 12% | 83 11% |
| AdobeRGB 1998 Coverage (%) | 51.5 | 100 94% | 66.2 29% | 61.3 19% | 60.7 18% |
| Response Times | -40% | 48% | 13% | 4% | |
| Response Time Grey 50% / Grey 80% * (ms) | 38.8 ? | 57.2 ? -47% | 25 ? 36% | 35 ? 10% | 33.6 ? 13% |
| Response Time Black / White * (ms) | 29.6 ? | 39.2 ? -32% | 12 ? 59% | 25 ? 16% | 31.2 ? -5% |
| PWM Frequency (Hz) | 1351 ? | 962 | |||
| Screen | -6% | -87% | 2% | -15% | |
| Brightness middle (cd/m²) | 305.8 | 370.1 21% | 386 26% | 273 -11% | 315.8 3% |
| Brightness (cd/m²) | 282 | 356 26% | 382 35% | 267 -5% | 310 10% |
| Brightness Distribution (%) | 84 | 87 4% | 93 11% | 83 -1% | 90 7% |
| Black Level * (cd/m²) | 0.46 | 0.37 20% | 0.39 15% | 0.27 41% | 0.33 28% |
| Contrast (:1) | 665 | 1000 50% | 990 49% | 1011 52% | 957 44% |
| Colorchecker dE 2000 * | 5.2 | 5.3 -2% | 10.2 -96% | 3.77 27% | 5 4% |
| Colorchecker dE 2000 max. * | 11.9 | 9.9 17% | 15.81 -33% | 10.64 11% | 10.1 15% |
| Greyscale dE 2000 * | 1.1 | 4.6 -318% | 11.28 -925% | 2.48 -125% | 4.2 -282% |
| Gamma | 2.23 99% | 2.31 95% | 2.23 99% | 2.37 93% | 2.12 104% |
| CCT | 6732 97% | 6284 103% | 11383 57% | 6854 95% | 6107 106% |
| Color Space (Percent of AdobeRGB 1998) (%) | 47.3 | 88.3 87% | 59 25% | 55 16% | 54.5 15% |
| Color Space (Percent of sRGB) (%) | 75.5 | 100 32% | 90 19% | 84 11% | 83 10% |
| Total Average (Program / Settings) | 8% /
4% | -4% /
-46% | 11% /
7% | 3% /
-5% |
* ... smaller is better
Display Response Times
| ↔ Response Time Black to White | ||
|---|---|---|
| 29.6 ms ... rise ↗ and fall ↘ combined | ↗ 19.6 ms rise |  |
| ↘ 10 ms fall | ||
| The screen shows relatively slow response rates in our tests and may be too slow for gamers. In comparison, all tested devices range from 0.1 (minimum) to 240 (maximum) ms. » 79 % of all devices are better. This means that the measured response time is worse than the average of all tested devices (19.8 ms). | ||
| ↔ Response Time 50% Grey to 80% Grey | ||
| 38.8 ms ... rise ↗ and fall ↘ combined | ↗ 17.2 ms rise | 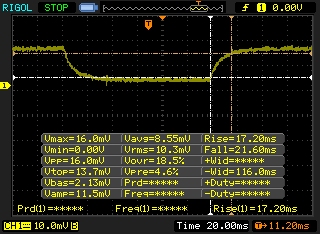 |
| ↘ 21.6 ms fall | ||
| The screen shows slow response rates in our tests and will be unsatisfactory for gamers. In comparison, all tested devices range from 0.165 (minimum) to 636 (maximum) ms. » 58 % of all devices are better. This means that the measured response time is worse than the average of all tested devices (30.9 ms). | ||
Screen Flickering / PWM (Pulse-Width Modulation)
| Screen flickering / PWM detected | 1351 Hz | ≤ 19 % brightness setting | 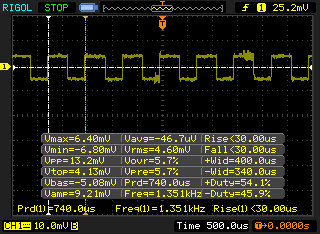 |
The display backlight flickers at 1351 Hz (worst case, e.g., utilizing PWM) Flickering detected at a brightness setting of 19 % and below. There should be no flickering or PWM above this brightness setting. The frequency of 1351 Hz is quite high, so most users sensitive to PWM should not notice any flickering. In comparison: 52 % of all tested devices do not use PWM to dim the display. If PWM was detected, an average of 7741 (minimum: 5 - maximum: 343500) Hz was measured. | |||
| Cinebench R15 | |
| CPU Single 64Bit | |
| i5-7600K Gigabyte Z270-Gaming K3 | |
| Eurocom Tornado F5 | |
| Asus G701VIK-BA049T | |
| Eurocom Tornado F5 Killer Edition | |
| Eurocom Sky X7E2 | |
| Dell XPS 15 9560 (i7-7700HQ, UHD) | |
| MSI GT80 Titan SLI | |
| Asus GL702VM-GC102D | |
| Lenovo IdeaPad Y50 | |
| CPU Multi 64Bit | |
| Asus G701VIK-BA049T | |
| Eurocom Tornado F5 | |
| Eurocom Sky X7E2 | |
| Dell XPS 15 9560 (i7-7700HQ, UHD) | |
| MSI GT80 Titan SLI | |
| i5-7600K Gigabyte Z270-Gaming K3 | |
| Asus GL702VM-GC102D | |
| Eurocom Tornado F5 Killer Edition | |
| Lenovo IdeaPad Y50 | |
| Cinebench R11.5 | |
| CPU Single 64Bit | |
| Eurocom Tornado F5 | |
| Asus G701VIK-BA049T | |
| i5-7600K Gigabyte Z270-Gaming K3 | |
| Eurocom Tornado F5 Killer Edition | |
| Dell XPS 15 9560 (i7-7700HQ, UHD) | |
| Eurocom Sky X7E2 | |
| MSI GT80 Titan SLI | |
| Asus GL702VM-GC102D | |
| Lenovo IdeaPad Y50 | |
| CPU Multi 64Bit | |
| Asus G701VIK-BA049T | |
| Eurocom Tornado F5 | |
| Eurocom Sky X7E2 | |
| Dell XPS 15 9560 (i7-7700HQ, UHD) | |
| i5-7600K Gigabyte Z270-Gaming K3 | |
| MSI GT80 Titan SLI | |
| Eurocom Tornado F5 Killer Edition | |
| Asus GL702VM-GC102D | |
| Lenovo IdeaPad Y50 | |
| Cinebench R10 | |
| Rendering Multiple CPUs 32Bit | |
| Eurocom Tornado F5 | |
| i5-7600K Gigabyte Z270-Gaming K3 | |
| Eurocom Sky X7E2 | |
| Eurocom Tornado F5 Killer Edition | |
| MSI GT80 Titan SLI | |
| Dell XPS 15 9560 (i7-7700HQ, UHD) | |
| Asus GL702VM-GC102D | |
| Lenovo IdeaPad Y50 | |
| Rendering Single 32Bit | |
| Eurocom Tornado F5 | |
| i5-7600K Gigabyte Z270-Gaming K3 | |
| Eurocom Tornado F5 Killer Edition | |
| Eurocom Sky X7E2 | |
| Dell XPS 15 9560 (i7-7700HQ, UHD) | |
| MSI GT80 Titan SLI | |
| Asus GL702VM-GC102D | |
| Lenovo IdeaPad Y50 | |
| wPrime 2.10 - 1024m | |
| Lenovo IdeaPad Y50 | |
| i5-7600K Gigabyte Z270-Gaming K3 | |
| Eurocom Tornado F5 Killer Edition | |
| Dell XPS 15 9560 (i7-7700HQ, UHD) | |
| Eurocom Sky X7E2 | |
| Eurocom Tornado F5 | |
| 3DMark | |
| 3840x2160 Fire Strike Ultra Physics | |
| Eurocom Tornado F5 | |
| Eurocom Sky X7E2 | |
| Dell XPS 15 9560 (i7-7700HQ, UHD) | |
| Asus GL702VM-GC102D | |
| Eurocom Tornado F5 Killer Edition | |
| Fire Strike Extreme Physics | |
| Eurocom Tornado F5 | |
| Eurocom Sky X7E2 | |
| MSI GT80 Titan SLI | |
| Dell XPS 15 9560 (i7-7700HQ, UHD) | |
| Asus GL702VM-GC102D | |
| Eurocom Tornado F5 Killer Edition | |
| Lenovo IdeaPad Y50 | |
| 1920x1080 Fire Strike Physics | |
| Eurocom Tornado F5 | |
| Eurocom Sky X7E2 | |
| Asus G701VIK-BA049T | |
| MSI GT80 Titan SLI | |
| Dell XPS 15 9560 (i7-7700HQ, UHD) | |
| i5-7600K Gigabyte Z270-Gaming K3 | |
| Asus GL702VM-GC102D | |
| Eurocom Tornado F5 Killer Edition | |
| Lenovo IdeaPad Y50 | |
* ... smaller is better
| PCMark 8 | |
| Home Score Accelerated v2 | |
| Asus G701VIK-BA049T | |
| Eurocom Tornado F5 | |
| Alienware 15 R3 | |
| Eurocom Tornado F5 Killer Edition | |
| Dell XPS 15 9560 (i7-7700HQ, UHD) | |
| Work Score Accelerated v2 | |
| Eurocom Tornado F5 | |
| Asus G701VIK-BA049T | |
| Alienware 15 R3 | |
| Eurocom Tornado F5 Killer Edition | |
| Dell XPS 15 9560 (i7-7700HQ, UHD) | |
| Creative Score Accelerated v2 | |
| Eurocom Tornado F5 | |
| Eurocom Tornado F5 Killer Edition | |
| Alienware 15 R3 | |
| Dell XPS 15 9560 (i7-7700HQ, UHD) | |
| PCMark 8 Home Score Accelerated v2 | 4821 points | |
| PCMark 8 Creative Score Accelerated v2 | 8420 points | |
| PCMark 8 Work Score Accelerated v2 | 4831 points | |
Help | ||
| Eurocom Tornado F5 Killer Edition Samsung SSD 960 Evo 250GB m.2 NVMe | Dell XPS 15 9560 (i7-7700HQ, UHD) Lite-On CX2-8B512-Q11 | Alienware 15 R3 | Eurocom Tornado F5 Samsung SSD 960 Pro 512 GB m.2 | MSI GT62VR 7RE-223 Samsung SSD PM871a MZNLN256HMHQ | |
|---|---|---|---|---|---|
| CrystalDiskMark 3.0 | -7% | -31% | 10% | -50% | |
| Read Seq (MB/s) | 1546 | 1684 9% | 1123 -27% | 2145 39% | 521 -66% |
| Write Seq (MB/s) | 1456 | 1106 -24% | 429.2 -71% | 1724 18% | 422.8 -71% |
| Read 512 (MB/s) | 710 | 977 38% | 833 17% | 715 1% | 462 -35% |
| Write 512 (MB/s) | 860 | 1119 30% | 428.1 -50% | 967 12% | 286.9 -67% |
| Read 4k (MB/s) | 58.8 | 45.14 -23% | 37.8 -36% | 55.9 -5% | 38.55 -34% |
| Write 4k (MB/s) | 174.1 | 134.1 -23% | 122.9 -29% | 180.6 4% | 122.8 -29% |
| Read 4k QD32 (MB/s) | 711 | 509 -28% | 542 -24% | 744 5% | 388.4 -45% |
| Write 4k QD32 (MB/s) | 579 | 398.1 -31% | 429.8 -26% | 634 9% | 257.9 -55% |

| 3DMark | |
| 1920x1080 Fire Strike Graphics | |
| i7-6950X Asus X99-E | |
| Schenker XMG U727 2017 | |
| MSI GT73VR 6RF | |
| Eurocom Tornado F5 Killer Edition | |
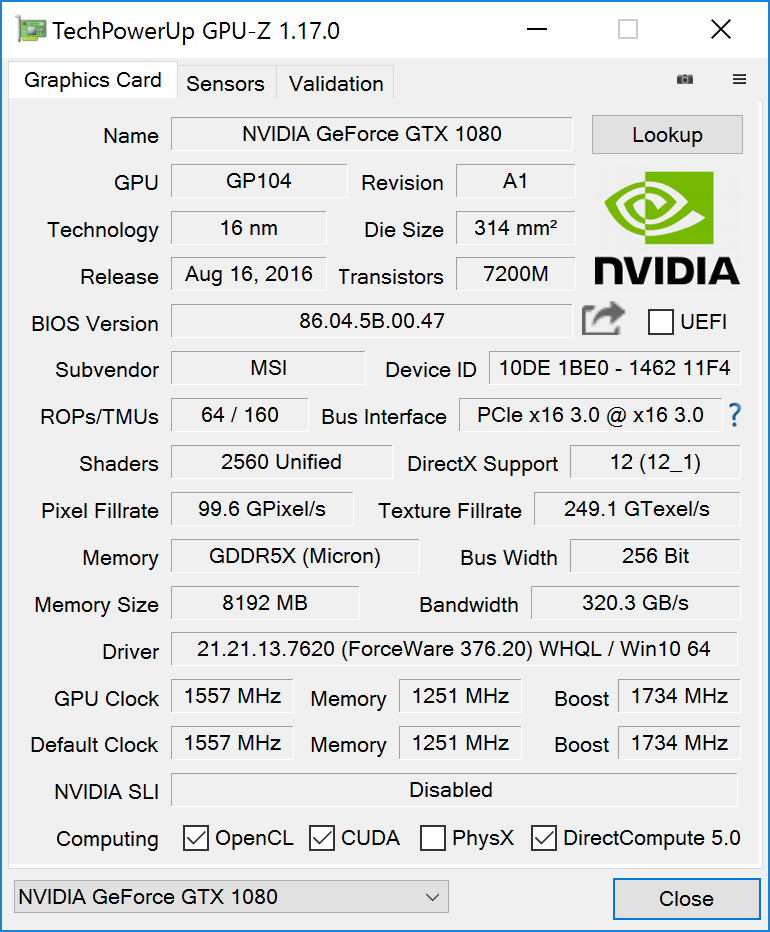
| Nvidia GeForce GTX 1080 Founders Edition | |
| Eurocom X8 | |
| Eurocom Tornado F5 | |
| Asus FX502VM-AS73 | |
| Asus Strix GL502VY-DS71 | |
| 3840x2160 Fire Strike Ultra Graphics | |
| i7-6950X Asus X99-E | |
| MSI GT73VR 6RF | |
| Eurocom Tornado F5 Killer Edition | |
| Nvidia GeForce GTX 1080 Founders Edition | |
| Eurocom Tornado F5 | |
| Asus FX502VM-AS73 | |
| Asus Strix GL502VY-DS71 | |
| Fire Strike Extreme Graphics | |
| i7-6950X Asus X99-E | |
| MSI GT73VR 6RF | |
| Nvidia GeForce GTX 1080 Founders Edition | |
| Eurocom Tornado F5 Killer Edition | |
| Eurocom X8 | |
| Eurocom Tornado F5 | |
| Asus FX502VM-AS73 | |
| Asus Strix GL502VY-DS71 | |
| 3DMark 11 | |
| 1280x720 Performance GPU | |
| i7-6950X Asus X99-E | |
| Nvidia GeForce GTX 1080 Founders Edition | |
| Schenker XMG U727 2017 | |
| MSI GT73VR 6RF | |
| Eurocom Tornado F5 Killer Edition | |
| Eurocom Tornado F5 | |
| Eurocom X8 | |
| Asus FX502VM-AS73 | |
| Asus Strix GL502VY-DS71 | |
| 1280x720 Performance Combined | |
| i7-6950X Asus X99-E | |
| Nvidia GeForce GTX 1080 Founders Edition | |
| Schenker XMG U727 2017 | |
| Eurocom Tornado F5 | |
| Asus FX502VM-AS73 | |
| MSI GT73VR 6RF | |
| Eurocom X8 | |
| Eurocom Tornado F5 Killer Edition | |
| Asus Strix GL502VY-DS71 | |
| 3DMark 11 Performance | 17375 points | |
| 3DMark Ice Storm Standard Score | 153604 points | |
| 3DMark Cloud Gate Standard Score | 22675 points | |
| 3DMark Fire Strike Score | 15116 points | |
| 3DMark Fire Strike Extreme Score | 8680 points | |
Help | ||
| The Witcher 3 - 3840x2160 High Graphics & Postprocessing (Nvidia HairWorks Off) | |
| Nvidia GeForce GTX 1080 Ti Founders Edition | |
| Eurocom Tornado F5 Killer Edition | |
| Nvidia GeForce GTX 1080 Founders Edition | |
| Schenker XMG U727 2017 | |
| Metal Gear Solid V - 3840x2160 High / On | |
| Nvidia GeForce GTX 1080 Founders Edition | |
| Eurocom Sky X7E2 | |
| Eurocom Tornado F5 Killer Edition | |
| Fallout 4 - 3840x2160 High Preset AA:T AF:16x | |
| Nvidia GeForce GTX 1080 Ti Founders Edition | |
| Eurocom Sky X7E2 | |
| Nvidia GeForce GTX 1080 Founders Edition | |
| Eurocom Tornado F5 Killer Edition | |
| Gigabyte P57X v7 | |
| Rise of the Tomb Raider - 3840x2160 High Preset AA:FX AF:4x | |
| Nvidia GeForce GTX 1080 Ti Founders Edition | |
| Nvidia GeForce GTX 1080 Ti Founders Edition | |
| Eurocom Sky X7E2 | |
| Eurocom Tornado F5 Killer Edition | |
| Nvidia GeForce GTX 1080 Founders Edition | |
| Nvidia GeForce GTX 1080 Founders Edition | |
| Gigabyte P57X v7 | |
| Ashes of the Singularity - 3840x2160 crazy | |
| Nvidia GeForce GTX 1080 Ti Founders Edition | |
| Eurocom Tornado F5 Killer Edition | |
| Nvidia GeForce GTX 1080 Founders Edition | |
| Overwatch - 3840x2160 High (Render Scale 100 %) AA:SM AF:4x | |
| Nvidia GeForce GTX 1080 Ti Founders Edition | |
| Eurocom Sky X7E2 | |
| Eurocom Tornado F5 Killer Edition | |
| Nvidia GeForce GTX 1080 Founders Edition | |
| Mafia 3 - 3840x2160 High Preset | |
| Nvidia GeForce GTX 1080 Ti Founders Edition | |
| Eurocom Tornado F5 Killer Edition | |
| Asus G701VIK-BA049T | |
| Schenker XMG U727 2017 | |
| Nvidia GeForce GTX 1080 Founders Edition | |
| low | med. | high | ultra | 4K | |
|---|---|---|---|---|---|
| Guild Wars 2 (2012) | 90.5 | ||||
| BioShock Infinite (2013) | 152.3 | ||||
| Metro: Last Light (2013) | 110.2 | ||||
| Thief (2014) | 115 | ||||
| The Witcher 3 (2015) | 74.2 | 55.8 | |||
| Batman: Arkham Knight (2015) | 92 | 56 | |||
| Metal Gear Solid V (2015) | 60 | ||||
| Fallout 4 (2015) | 52.6 | ||||
| Rise of the Tomb Raider (2016) | 112.2 | 50.2 | |||
| Ashes of the Singularity (2016) | 65.9 | 44.2 | |||
| Doom (2016) | 66.9 | ||||
| Overwatch (2016) | 104.9 | ||||
| Mafia 3 (2016) | 95.1 | 29.1 |
Noise level
| Idle |
| 36.1 / 36.1 / 36.1 dB(A) |
| Load |
| 44.3 / 51.7 dB(A) |
 | ||
30 dB silent 40 dB(A) audible 50 dB(A) loud |
||
min: | ||
| Eurocom Tornado F5 Killer Edition GeForce GTX 1080 Mobile, i5-7600K, Samsung SSD 960 Evo 250GB m.2 NVMe | Dell XPS 15 9560 (i7-7700HQ, UHD) GeForce GTX 1050 Mobile, i7-7700HQ, Lite-On CX2-8B512-Q11 | Alienware 15 R3 GeForce GTX 1070 Mobile, i7-7700HQ | Eurocom Tornado F5 GeForce GTX 1070 Mobile, i7-7700K, Samsung SSD 960 Pro 512 GB m.2 | MSI GT62VR 7RE-223 GeForce GTX 1070 Mobile, i7-7700HQ, Samsung SSD PM871a MZNLN256HMHQ | |
|---|---|---|---|---|---|
| Noise | 9% | -1% | 3% | 4% | |
| off / environment * (dB) | 28.8 | 28.4 1% | 30 -4% | 29.4 -2% | 30 -4% |
| Idle Minimum * (dB) | 36.1 | 29 20% | 31 14% | 33.3 8% | 34 6% |
| Idle Average * (dB) | 36.1 | 29 20% | 32 11% | 33.5 7% | 35 3% |
| Idle Maximum * (dB) | 36.1 | 32.2 11% | 42 -16% | 33.5 7% | 36 -0% |
| Load Average * (dB) | 44.3 | 47.1 -6% | 49 -11% | 44.2 -0% | 40 10% |
| Load Maximum * (dB) | 51.7 | 47.1 9% | 50 3% | 52.5 -2% | 46 11% |
| Witcher 3 ultra * (dB) | 52 |
* ... smaller is better
(+) The maximum temperature on the upper side is 39.4 °C / 103 F, compared to the average of 40.4 °C / 105 F, ranging from 21.2 to 68.8 °C for the class Gaming.
(-) The bottom heats up to a maximum of 48.6 °C / 119 F, compared to the average of 43.2 °C / 110 F
(+) In idle usage, the average temperature for the upper side is 24.1 °C / 75 F, compared to the device average of 33.9 °C / 93 F.
(+) The palmrests and touchpad are reaching skin temperature as a maximum (32.2 °C / 90 F) and are therefore not hot.
(-) The average temperature of the palmrest area of similar devices was 28.8 °C / 83.8 F (-3.4 °C / -6.2 F).
Eurocom Tornado F5 Killer Edition audio analysis
(-) | not very loud speakers (64.8 dB)
Bass 100 - 315 Hz
(±) | reduced bass - on average 11.8% lower than median
(±) | linearity of bass is average (11.6% delta to prev. frequency)
Mids 400 - 2000 Hz
(±) | higher mids - on average 5.5% higher than median
(±) | linearity of mids is average (13.5% delta to prev. frequency)
Highs 2 - 16 kHz
(+) | balanced highs - only 3.2% away from median
(±) | linearity of highs is average (9.8% delta to prev. frequency)
Overall 100 - 16.000 Hz
(±) | linearity of overall sound is average (26.1% difference to median)
Compared to same class
» 92% of all tested devices in this class were better, 1% similar, 7% worse
» The best had a delta of 6%, average was 18%, worst was 132%
Compared to all devices tested
» 80% of all tested devices were better, 4% similar, 16% worse
» The best had a delta of 4%, average was 23%, worst was 134%
Apple MacBook 12 (Early 2016) 1.1 GHz audio analysis
(+) | speakers can play relatively loud (83.6 dB)
Bass 100 - 315 Hz
(±) | reduced bass - on average 11.3% lower than median
(±) | linearity of bass is average (14.2% delta to prev. frequency)
Mids 400 - 2000 Hz
(+) | balanced mids - only 2.4% away from median
(+) | mids are linear (5.5% delta to prev. frequency)
Highs 2 - 16 kHz
(+) | balanced highs - only 2% away from median
(+) | highs are linear (4.5% delta to prev. frequency)
Overall 100 - 16.000 Hz
(+) | overall sound is linear (10.2% difference to median)
Compared to same class
» 7% of all tested devices in this class were better, 2% similar, 90% worse
» The best had a delta of 5%, average was 18%, worst was 53%
Compared to all devices tested
» 5% of all tested devices were better, 1% similar, 94% worse
» The best had a delta of 4%, average was 23%, worst was 134%
| Off / Standby | |
| Idle | |
| Load |
|
Key:
min: | |
| Eurocom Tornado F5 Killer Edition i5-7600K, GeForce GTX 1080 Mobile, Samsung SSD 960 Evo 250GB m.2 NVMe, IPS, 3840x2160, 15.6" | Dell XPS 15 9560 (i7-7700HQ, UHD) i7-7700HQ, GeForce GTX 1050 Mobile, Lite-On CX2-8B512-Q11, IGZO IPS, 3840x2160, 15.6" | Alienware 15 R3 i7-7700HQ, GeForce GTX 1070 Mobile, , TN, 1920x1080, 15.6" | Eurocom Tornado F5 i7-7700K, GeForce GTX 1070 Mobile, Samsung SSD 960 Pro 512 GB m.2, IPS, 1920x1080, 15.6" | Asus G701VIK-BA049T i7-7820HK, GeForce GTX 1080 Mobile, 2x Samsung SM961 MZVPW256HEGL NVMe (RAID 0), IPS, 1920x1080, 17.3" | |
|---|---|---|---|---|---|
| Power Consumption | 51% | 31% | 20% | 6% | |
| Idle Minimum * (Watt) | 28.4 | 11.9 58% | 19 33% | 21.2 25% | 24 15% |
| Idle Average * (Watt) | 32 | 17.1 47% | 23 28% | 25.1 22% | 31 3% |
| Idle Maximum * (Watt) | 33.5 | 17.3 48% | 29 13% | 26.3 21% | 38 -13% |
| Load Average * (Watt) | 190.9 | 94.7 50% | 85 55% | 169.4 11% | 98 49% |
| Load Maximum * (Watt) | 259.4 | 122 53% | 192 26% | 202.4 22% | 320 -23% |
| Witcher 3 ultra * (Watt) | 104.8 |
* ... smaller is better
| Eurocom Tornado F5 Killer Edition i5-7600K, GeForce GTX 1080 Mobile, 75.24 Wh | Dell XPS 15 9560 (i7-7700HQ, UHD) i7-7700HQ, GeForce GTX 1050 Mobile, 97 Wh | Alienware 15 R3 i7-7700HQ, GeForce GTX 1070 Mobile, 99 Wh | Eurocom Tornado F5 i7-7700K, GeForce GTX 1070 Mobile, 75.24 Wh | MSI GT62VR 7RE-223 i7-7700HQ, GeForce GTX 1070 Mobile, 75 Wh | |
|---|---|---|---|---|---|
| Battery runtime | 115% | 29% | -3% | 24% | |
| Reader / Idle (h) | 4.2 | 13.9 231% | 6.4 52% | 4.9 17% | 6.3 50% |
| WiFi v1.3 (h) | 3.6 | 7.2 100% | 4.4 22% | 3.6 0% | 4.1 14% |
| Load (h) | 1.5 | 1.7 13% | 1.7 13% | 1.1 -27% | 1.6 7% |
Pros
Cons
Tornado F5应该因在一个相比其他性能较低的同类机型更轻更小巧的15寸机身内搭配了便于用户升级维护的LGA 1151插槽和MXM 3.0插槽而得到我们的推荐。从这个角度来看,这个系统与雷蛇Blade Pro也有相似之处,它们都是将尽可能强大的硬件装进尽可能小的机身之中。而它没有遇到严重的降频问题或采用会影响性能的低成本部件也都算是值得赞扬的成绩。
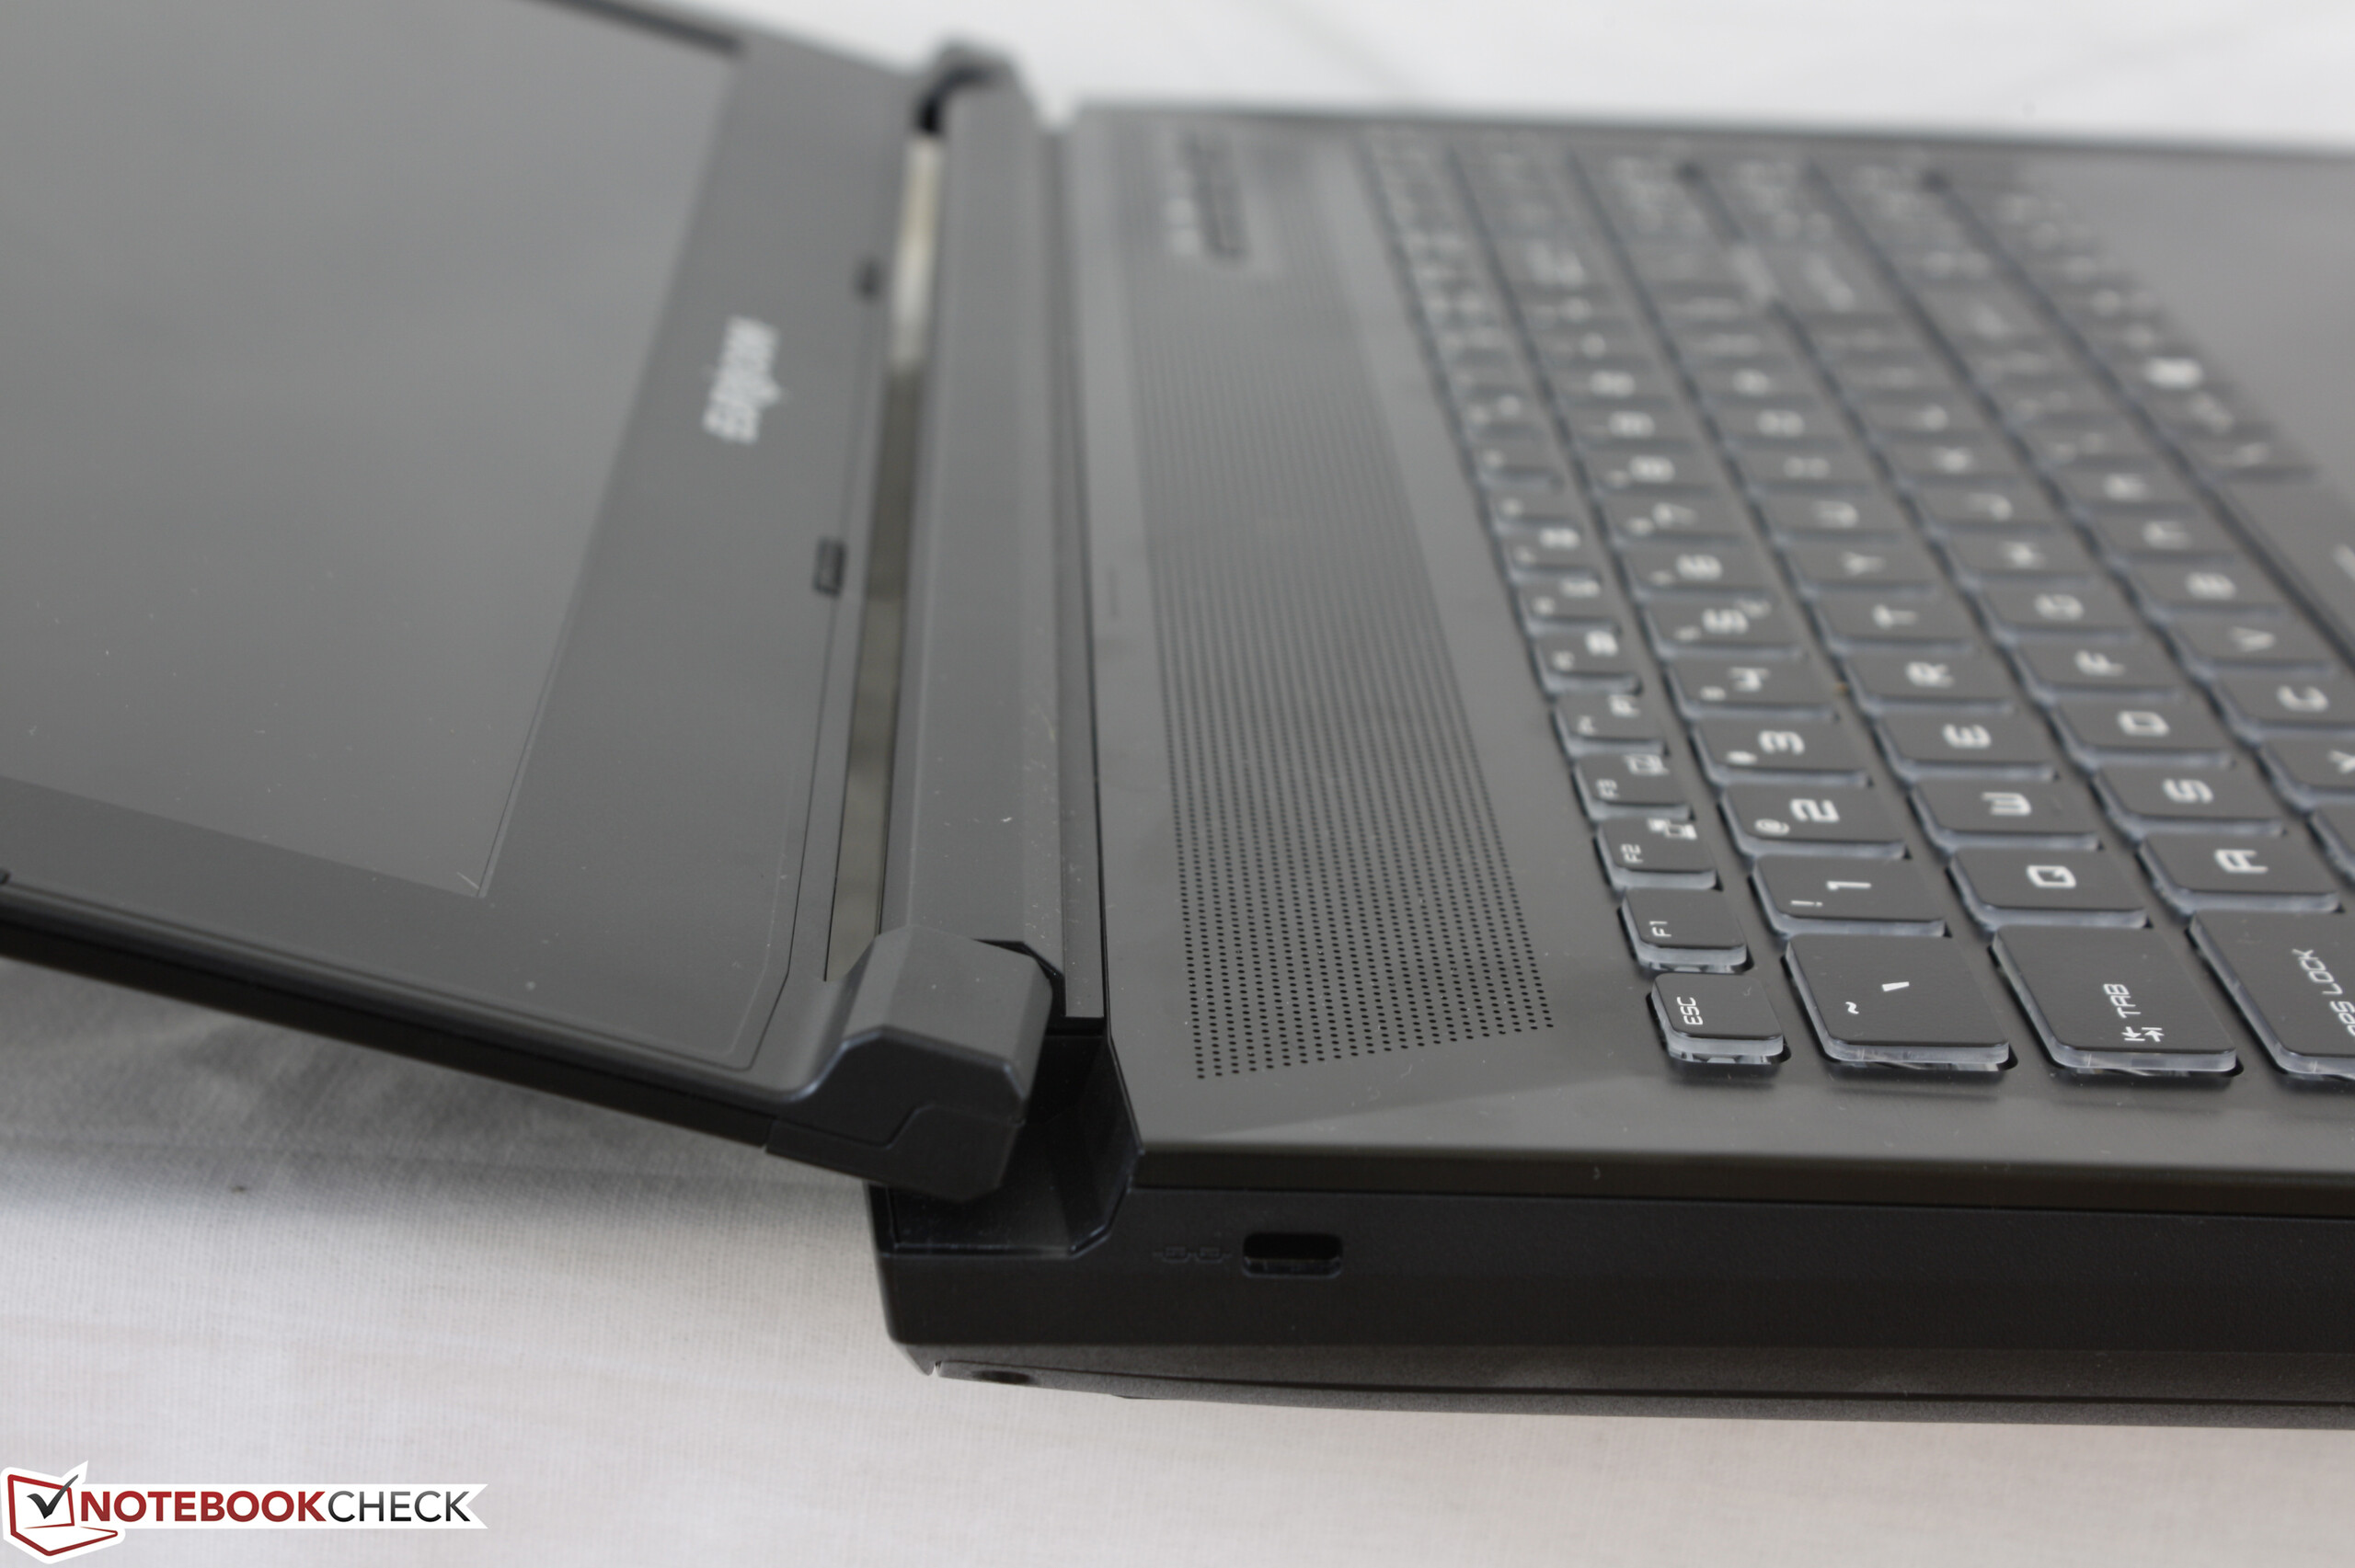
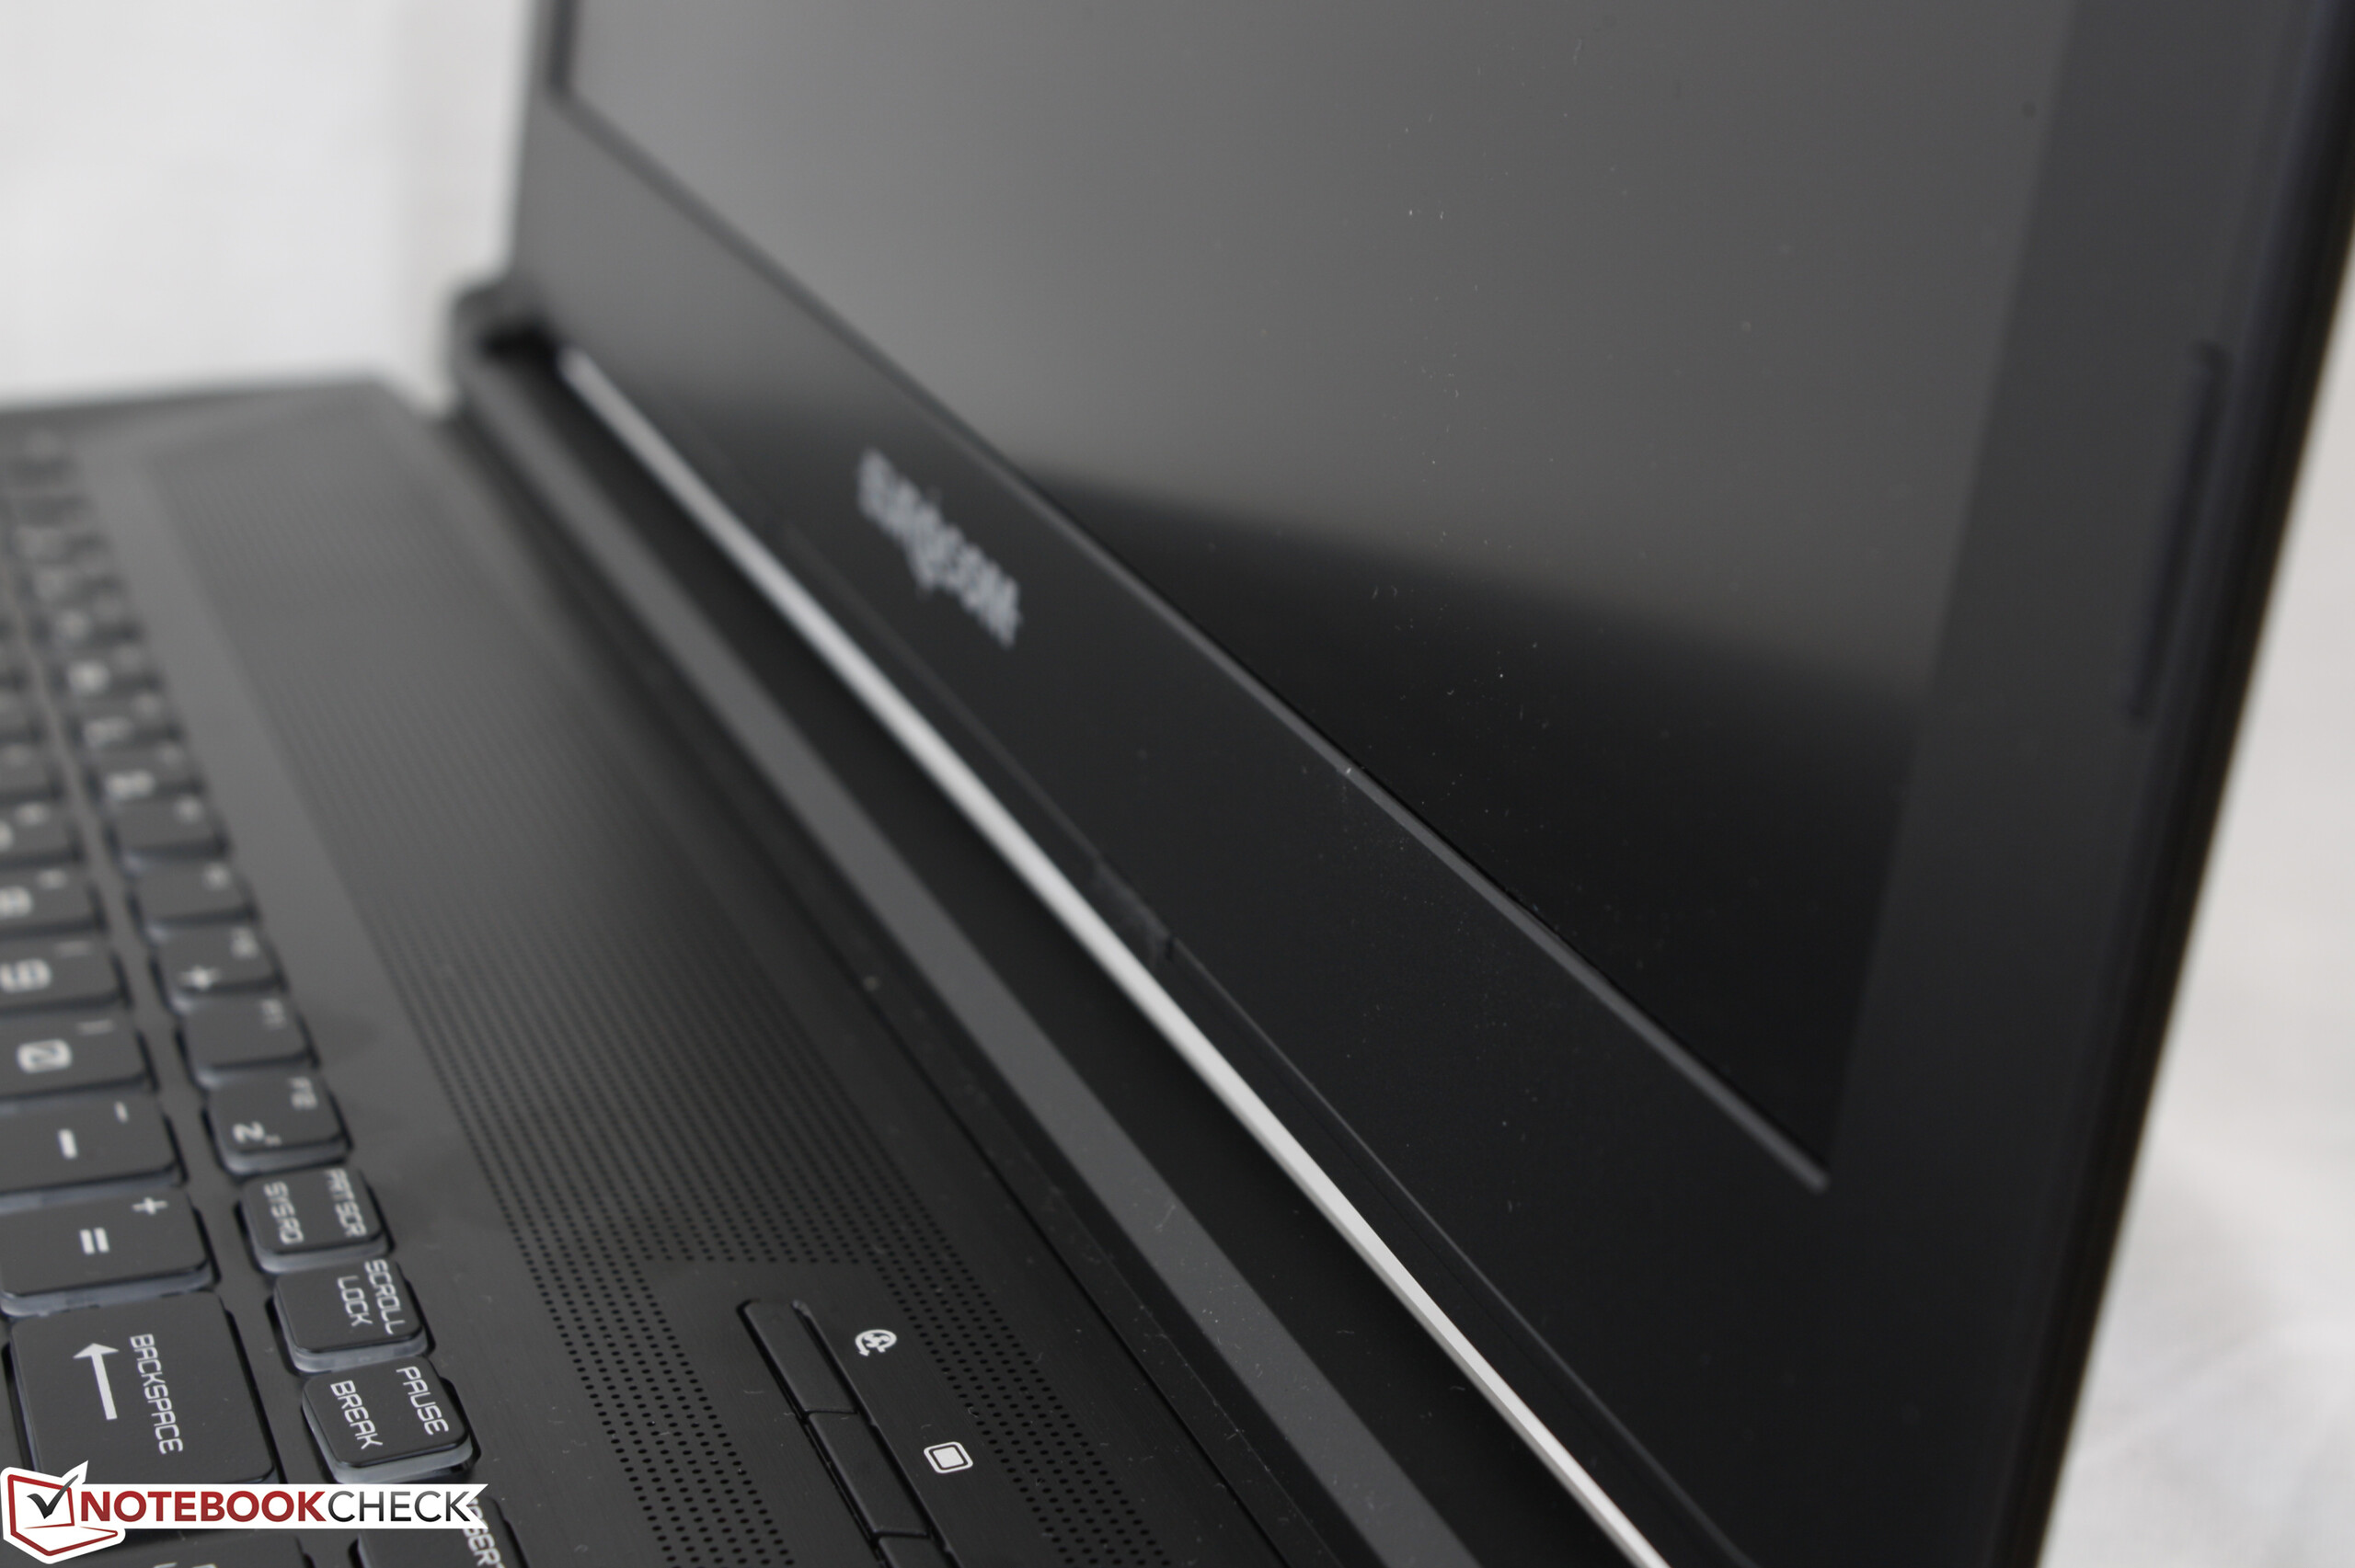
不过它还是有一些常见的缺点,如风扇噪音大和续航时间短。这两项都不算是“新闻”,我们感觉它在低负载时的风扇控制可以得到更好的优化,来降低在安静环境中的噪音。它的屏幕上盖显得十分不稳,屏幕漏光问题也反映出它在质检中需要得到更仔细的检查。
至于它的4K超高清屏幕,我们只能说它优缺点并存,而十分难以衷心推荐。它的色域覆盖较窄,对比度也低于入门级配置的1080p屏幕。另外,另外的1080p 120赫兹/5毫米响应时间屏幕选项可能是个更贴近笔记本电脑游戏的需要,它相比4K超高清60赫兹屏幕带来了更快的响应时间和两倍的刷新率。
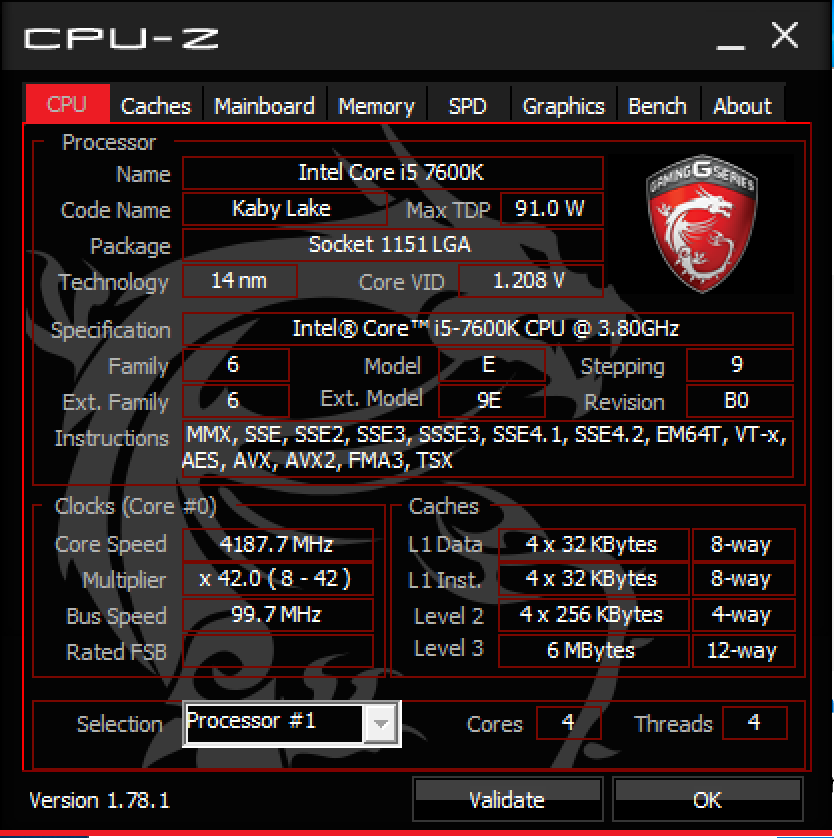
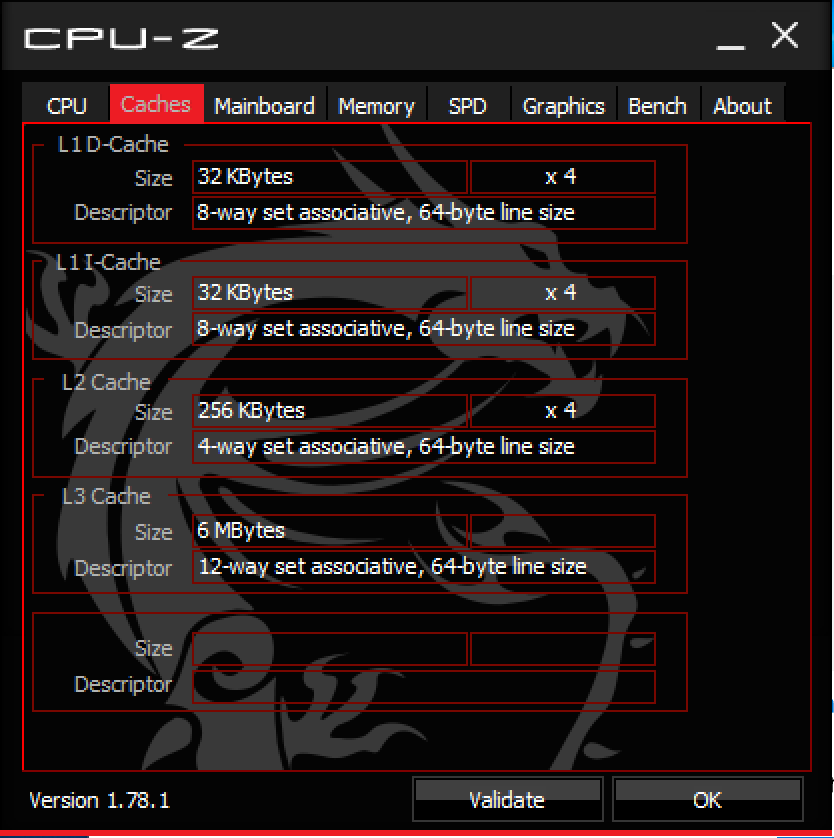
对于骨灰级游戏玩家来说这台Eurocom相比华硕、微星或Alienware设备是否更值得选择,可能会取决于它对模块化组件和台式处理器的支持。易于维护和升级处理器及显卡毋庸置疑是一个引人瞩目的特性,不过这对于游戏性能来说的优势十分有限。一块移动版i7-7700HQ在一些游戏中和i5-7600K或i7-7700K带来的表现基本相同,而只有一半的功耗。单纯从游戏的角度来看,台式处理器带来的优势十分值得商榷。
如果用户需要LGA 1151插槽和MXM 3.0插槽的话,Tornado F5是符合这个要求的设备中最全面的15寸游戏本。除此之外,可能一台板载相似显卡的传统游戏本可以在更低的价位上实现同样的游戏性能。
注:本文是基于完整评测的缩减版本,阅读完整的英文评测,请点击这里。
Eurocom Tornado F5 Killer Edition
- 03/18/2017 v6 (old)
Allen Ngo
Price comparison
