微星 GT73VR 7RF Titan Pro 笔记本电脑简短评测
| SD Card Reader | |
| average JPG Copy Test (av. of 3 runs) | |
| MSI GT73VR 7RF-296 | |
| MSI GT83VR-6RE32SR451 | |
| MSI GT72VR 7RE-433 | |
| Acer Predator 17 G9-793-77LG | |
| Aorus X7 v6 | |
| Asus G752VS-XB78K | |
| maximum AS SSD Seq Read Test (1GB) | |
| MSI GT73VR 7RF-296 | |
| MSI GT72VR 7RE-433 | |
| MSI GT83VR-6RE32SR451 | |
| Acer Predator 17 G9-793-77LG | |
| Aorus X7 v6 | |
| Asus G752VS-XB78K | |
| Networking | |
| iperf3 transmit AX12 | |
| MSI GT73VR 7RF-296 | |
| MSI GT72VR 7RE-433 | |
| MSI GT83VR-6RE32SR451 | |
| Aorus X7 v6 | |
| iperf3 receive AX12 | |
| MSI GT73VR 7RF-296 | |
| MSI GT83VR-6RE32SR451 | |
| MSI GT72VR 7RE-433 | |
| Aorus X7 v6 | |
| |||||||||||||||||||||||||
Brightness Distribution: 85 %
Center on Battery: 307 cd/m²
Contrast: 1228:1 (Black: 0.25 cd/m²)
ΔE ColorChecker Calman: 9.65 | ∀{0.5-29.43 Ø4.71}
ΔE Greyscale Calman: 10.07 | ∀{0.09-98 Ø4.96}
100% sRGB (Argyll 1.6.3 3D)
75% AdobeRGB 1998 (Argyll 1.6.3 3D)
84.7% AdobeRGB 1998 (Argyll 3D)
99.9% sRGB (Argyll 3D)
90.6% Display P3 (Argyll 3D)
Gamma: 2.12
CCT: 12145 K
| MSI GT73VR 7RF-296 N173HHE-G32 (CMN1747), 1920x1080 | Acer Predator 17 G9-793-77LG AU Optronics B173ZAN01.0 (AUO109B), 3840x2160 | Aorus X7 v6 B173QTN01.0 (AUO1096), 2560x1440 | Asus G752VS-XB78K LG Philips LP173WF4-SPF3 (LGD04E8), 1920x1080 | MSI GT72VR 7RE-433 Chi Mei N173HHE-G32 (CMN1747), 1920x1080 | MSI GT83VR-6RE32SR451 Samsung 184HL (SDC4C48), 1920x1080 | |
|---|---|---|---|---|---|---|
| Display | 4% | -26% | -22% | -21% | -20% | |
| Display P3 Coverage (%) | 90.6 | 86.9 -4% | 60.9 -33% | 66.9 -26% | 68.3 -25% | 65.8 -27% |
| sRGB Coverage (%) | 99.9 | 100 0% | 84.2 -16% | 85.2 -15% | 86.7 -13% | 90.3 -10% |
| AdobeRGB 1998 Coverage (%) | 84.7 | 99.4 17% | 61.2 -28% | 62.3 -26% | 63.4 -25% | 66.1 -22% |
| Response Times | -143% | -31% | -130% | -6% | -121% | |
| Response Time Grey 50% / Grey 80% * (ms) | 26 ? | 37 ? -42% | 31 ? -19% | 38 ? -46% | 29 ? -12% | 37 ? -42% |
| Response Time Black / White * (ms) | 7 ? | 24 ? -243% | 10 ? -43% | 22 ? -214% | 7 ? -0% | 21 ? -200% |
| PWM Frequency (Hz) | 250 ? | |||||
| Screen | 23% | -9% | 13% | -1% | 11% | |
| Brightness middle (cd/m²) | 307 | 336 9% | 343 12% | 328 7% | 299 -3% | 310 1% |
| Brightness (cd/m²) | 284 | 320 13% | 312 10% | 317 12% | 277 -2% | 277 -2% |
| Brightness Distribution (%) | 85 | 88 4% | 80 -6% | 88 4% | 87 2% | 84 -1% |
| Black Level * (cd/m²) | 0.25 | 0.25 -0% | 0.5 -100% | 0.3 -20% | 0.27 -8% | 0.4 -60% |
| Contrast (:1) | 1228 | 1344 9% | 686 -44% | 1093 -11% | 1107 -10% | 775 -37% |
| Colorchecker dE 2000 * | 9.65 | 3.61 63% | 7.33 24% | 3.74 61% | 9.65 -0% | 1.83 81% |
| Colorchecker dE 2000 max. * | 16.36 | 6.02 63% | 10.79 34% | 8.97 45% | 15.43 6% | 3.92 76% |
| Greyscale dE 2000 * | 10.07 | 4.78 53% | 7.6 25% | 2.67 73% | 9.68 4% | 1.38 86% |
| Gamma | 2.12 104% | 2.32 95% | 2.19 100% | 2.41 91% | 1.89 116% | 2.44 90% |
| CCT | 12145 54% | 6185 105% | 9024 72% | 6861 95% | 11652 56% | 6723 97% |
| Color Space (Percent of AdobeRGB 1998) (%) | 75 | 88 17% | 55 -27% | 56 -25% | 75 0% | 59 -21% |
| Color Space (Percent of sRGB) (%) | 100 | 100 0% | 84 -16% | 85 -15% | 100 0% | 90 -10% |
| Total Average (Program / Settings) | -39% /
-3% | -22% /
-15% | -46% /
-13% | -9% /
-6% | -43% /
-13% |
* ... smaller is better
Display Response Times
| ↔ Response Time Black to White | ||
|---|---|---|
| 7 ms ... rise ↗ and fall ↘ combined | ↗ 4 ms rise | 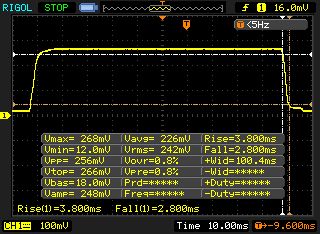 |
| ↘ 3 ms fall | ||
| The screen shows very fast response rates in our tests and should be very well suited for fast-paced gaming. In comparison, all tested devices range from 0.1 (minimum) to 240 (maximum) ms. » 21 % of all devices are better. This means that the measured response time is better than the average of all tested devices (19.8 ms). | ||
| ↔ Response Time 50% Grey to 80% Grey | ||
| 26 ms ... rise ↗ and fall ↘ combined | ↗ 12 ms rise | 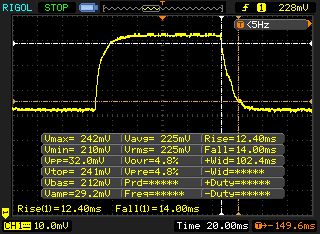 |
| ↘ 14 ms fall | ||
| The screen shows relatively slow response rates in our tests and may be too slow for gamers. In comparison, all tested devices range from 0.165 (minimum) to 636 (maximum) ms. » 36 % of all devices are better. This means that the measured response time is better than the average of all tested devices (31 ms). | ||
Screen Flickering / PWM (Pulse-Width Modulation)
| Screen flickering / PWM not detected |  | ||
In comparison: 52 % of all tested devices do not use PWM to dim the display. If PWM was detected, an average of 7757 (minimum: 5 - maximum: 343500) Hz was measured. | |||
| Cinebench R11.5 | |
| CPU Single 64Bit | |
| MSI GT73VR 7RF-296 | |
| Aorus X7 v6 | |
| MSI GT83VR-6RE32SR451 | |
| MSI GT72VR 7RE-433 | |
| Asus G752VS-XB78K | |
| CPU Multi 64Bit | |
| MSI GT73VR 7RF-296 | |
| MSI GT83VR-6RE32SR451 | |
| Aorus X7 v6 | |
| Asus G752VS-XB78K | |
| MSI GT72VR 7RE-433 | |
| PCMark 7 Score | 7635 points | |
Help | ||
| MSI GT73VR 7RF-296 2x Samsung SM951 MZVPV256HDGL (RAID 0) | Aorus X7 v6 Toshiba NVMe THNSN5512GPU7 | Asus G752VS-XB78K Toshiba NVMe THNSN5512GPU7 | MSI GT72VR 7RE-433 Kingston RBU-SNS8152S3256GG5 | MSI GT83VR-6RE32SR451 2x Samsung SM951 MZVPV256HDGL (RAID 0) | |
|---|---|---|---|---|---|
| CrystalDiskMark 3.0 | -34% | -29% | -65% | -2% | |
| Read Seq (MB/s) | 3219 | 1499 -53% | 1718 -47% | 521 -84% | 3284 2% |
| Write Seq (MB/s) | 2572 | 1411 -45% | 1305 -49% | 311.8 -88% | 2548 -1% |
| Read 512 (MB/s) | 1776 | 966 -46% | 1250 -30% | 403.1 -77% | 1728 -3% |
| Write 512 (MB/s) | 2445 | 1103 -55% | 1438 -41% | 332.3 -86% | 2352 -4% |
| Read 4k (MB/s) | 51.1 | 44.33 -13% | 44.42 -13% | 33.35 -35% | 50.1 -2% |
| Write 4k (MB/s) | 141.3 | 155.5 10% | 154.4 9% | 111.1 -21% | 137.6 -3% |

| 3DMark 11 Performance | 20510 points | |
| 3DMark Ice Storm Standard Score | 181787 points | |
| 3DMark Cloud Gate Standard Score | 31711 points | |
| 3DMark Fire Strike Score | 16478 points | |
Help | ||
| 3DMark - 1920x1080 Fire Strike Graphics | |
| MSI GT83VR-6RE32SR451 | |
| MSI GT73VR 7RF-296 | |
| MSI GT72VR 7RE-433 | |
| Aorus X7 v6 | |
| Asus G752VS-XB78K | |
| Acer Predator 17 G9-793-77LG | |
| 3DMark 11 - 1280x720 Performance GPU | |
| MSI GT83VR-6RE32SR451 | |
| MSI GT73VR 7RF-296 | |
| Aorus X7 v6 | |
| MSI GT72VR 7RE-433 | |
| Asus G752VS-XB78K | |
| Acer Predator 17 G9-793-77LG | |
| Battlefield 1 - 1920x1080 Ultra Preset AA:T | |
| MSI GT73VR 7RF-296 | |
| Aorus X7 v6 | |
| MSI GT72VR 7RE-433 | |
| Titanfall 2 - 1920x1080 Very High (Insane Texture Quality) / Enabled AA:TS AF:16x | |
| MSI GT73VR 7RF-296 | |
| MSI GT72VR 7RE-433 | |
| Call of Duty Infinite Warfare - 1920x1080 Ultra / On AA:T2X SM | |
| MSI GT73VR 7RF-296 | |
| Dishonored 2 - 1920x1080 Ultra Preset AA:TX | |
| MSI GT73VR 7RF-296 | |
| Watch Dogs 2 - 1920x1080 Ultra Preset | |
| MSI GT73VR 7RF-296 | |
| Deus Ex Mankind Divided - 1920x1080 Ultra Preset AA:2xMS AF:8x | |
| MSI GT73VR 7RF-296 | |
| MSI GT83VR-6RE32SR451 | |
| MSI GT72VR 7RE-433 | |
| Aorus X7 v6 | |
| FIFA 17 - 1920x1080 Ultra Preset AA:4xMS | |
| MSI GT73VR 7RF-296 | |
| MSI GT83VR-6RE32SR451 | |
| low | med. | high | ultra | 4K | |
|---|---|---|---|---|---|
| Deus Ex Mankind Divided (2016) | 103 | 57.1 | 35.5 | ||
| FIFA 17 (2016) | 378 | 360 | 208 | ||
| Battlefield 1 (2016) | 152 | 135 | 57.9 | ||
| Titanfall 2 (2016) | 144 | 141 | 58.4 | ||
| Call of Duty Infinite Warfare (2016) | 125 | 125 | 75.7 | ||
| Dishonored 2 (2016) | 100 | 79.9 | 49.2 | ||
| Watch Dogs 2 (2016) | 105 | 71.7 | 41.4 |
Noise level
| Idle |
| 34 / 35 / 37 dB(A) |
| Load |
| 39 / 56 dB(A) |
 | ||
30 dB silent 40 dB(A) audible 50 dB(A) loud |
||
min: | ||
| MSI GT73VR 7RF-296 i7-7820HK, GeForce GTX 1080 Mobile | Acer Predator 17 G9-793-77LG 6700HQ, GeForce GTX 1070 Mobile | Aorus X7 v6 6820HK, GeForce GTX 1070 Mobile | Asus G752VS-XB78K 6820HK, GeForce GTX 1070 Mobile | MSI GT72VR 7RE-433 i7-7700HQ, GeForce GTX 1070 Mobile | MSI GT83VR-6RE32SR451 6820HK, GeForce GTX 1070 SLI (Laptop) | |
|---|---|---|---|---|---|---|
| Noise | -1% | -2% | 7% | 4% | -2% | |
| off / environment * (dB) | 30 | 31 -3% | 30 -0% | 30 -0% | 31 -3% | 30 -0% |
| Idle Minimum * (dB) | 34 | 33 3% | 33 3% | 31 9% | 34 -0% | 33 3% |
| Idle Average * (dB) | 35 | 34 3% | 35 -0% | 32 9% | 35 -0% | 34 3% |
| Idle Maximum * (dB) | 37 | 40 -8% | 40 -8% | 33 11% | 37 -0% | 35 5% |
| Load Average * (dB) | 39 | 44 -13% | 43 -10% | 40 -3% | 37 5% | 48 -23% |
| Load Maximum * (dB) | 56 | 50 11% | 54 4% | 47 16% | 44 21% | 57 -2% |
* ... smaller is better
(+) The maximum temperature on the upper side is 39.8 °C / 104 F, compared to the average of 40.4 °C / 105 F, ranging from 21.2 to 68.8 °C for the class Gaming.
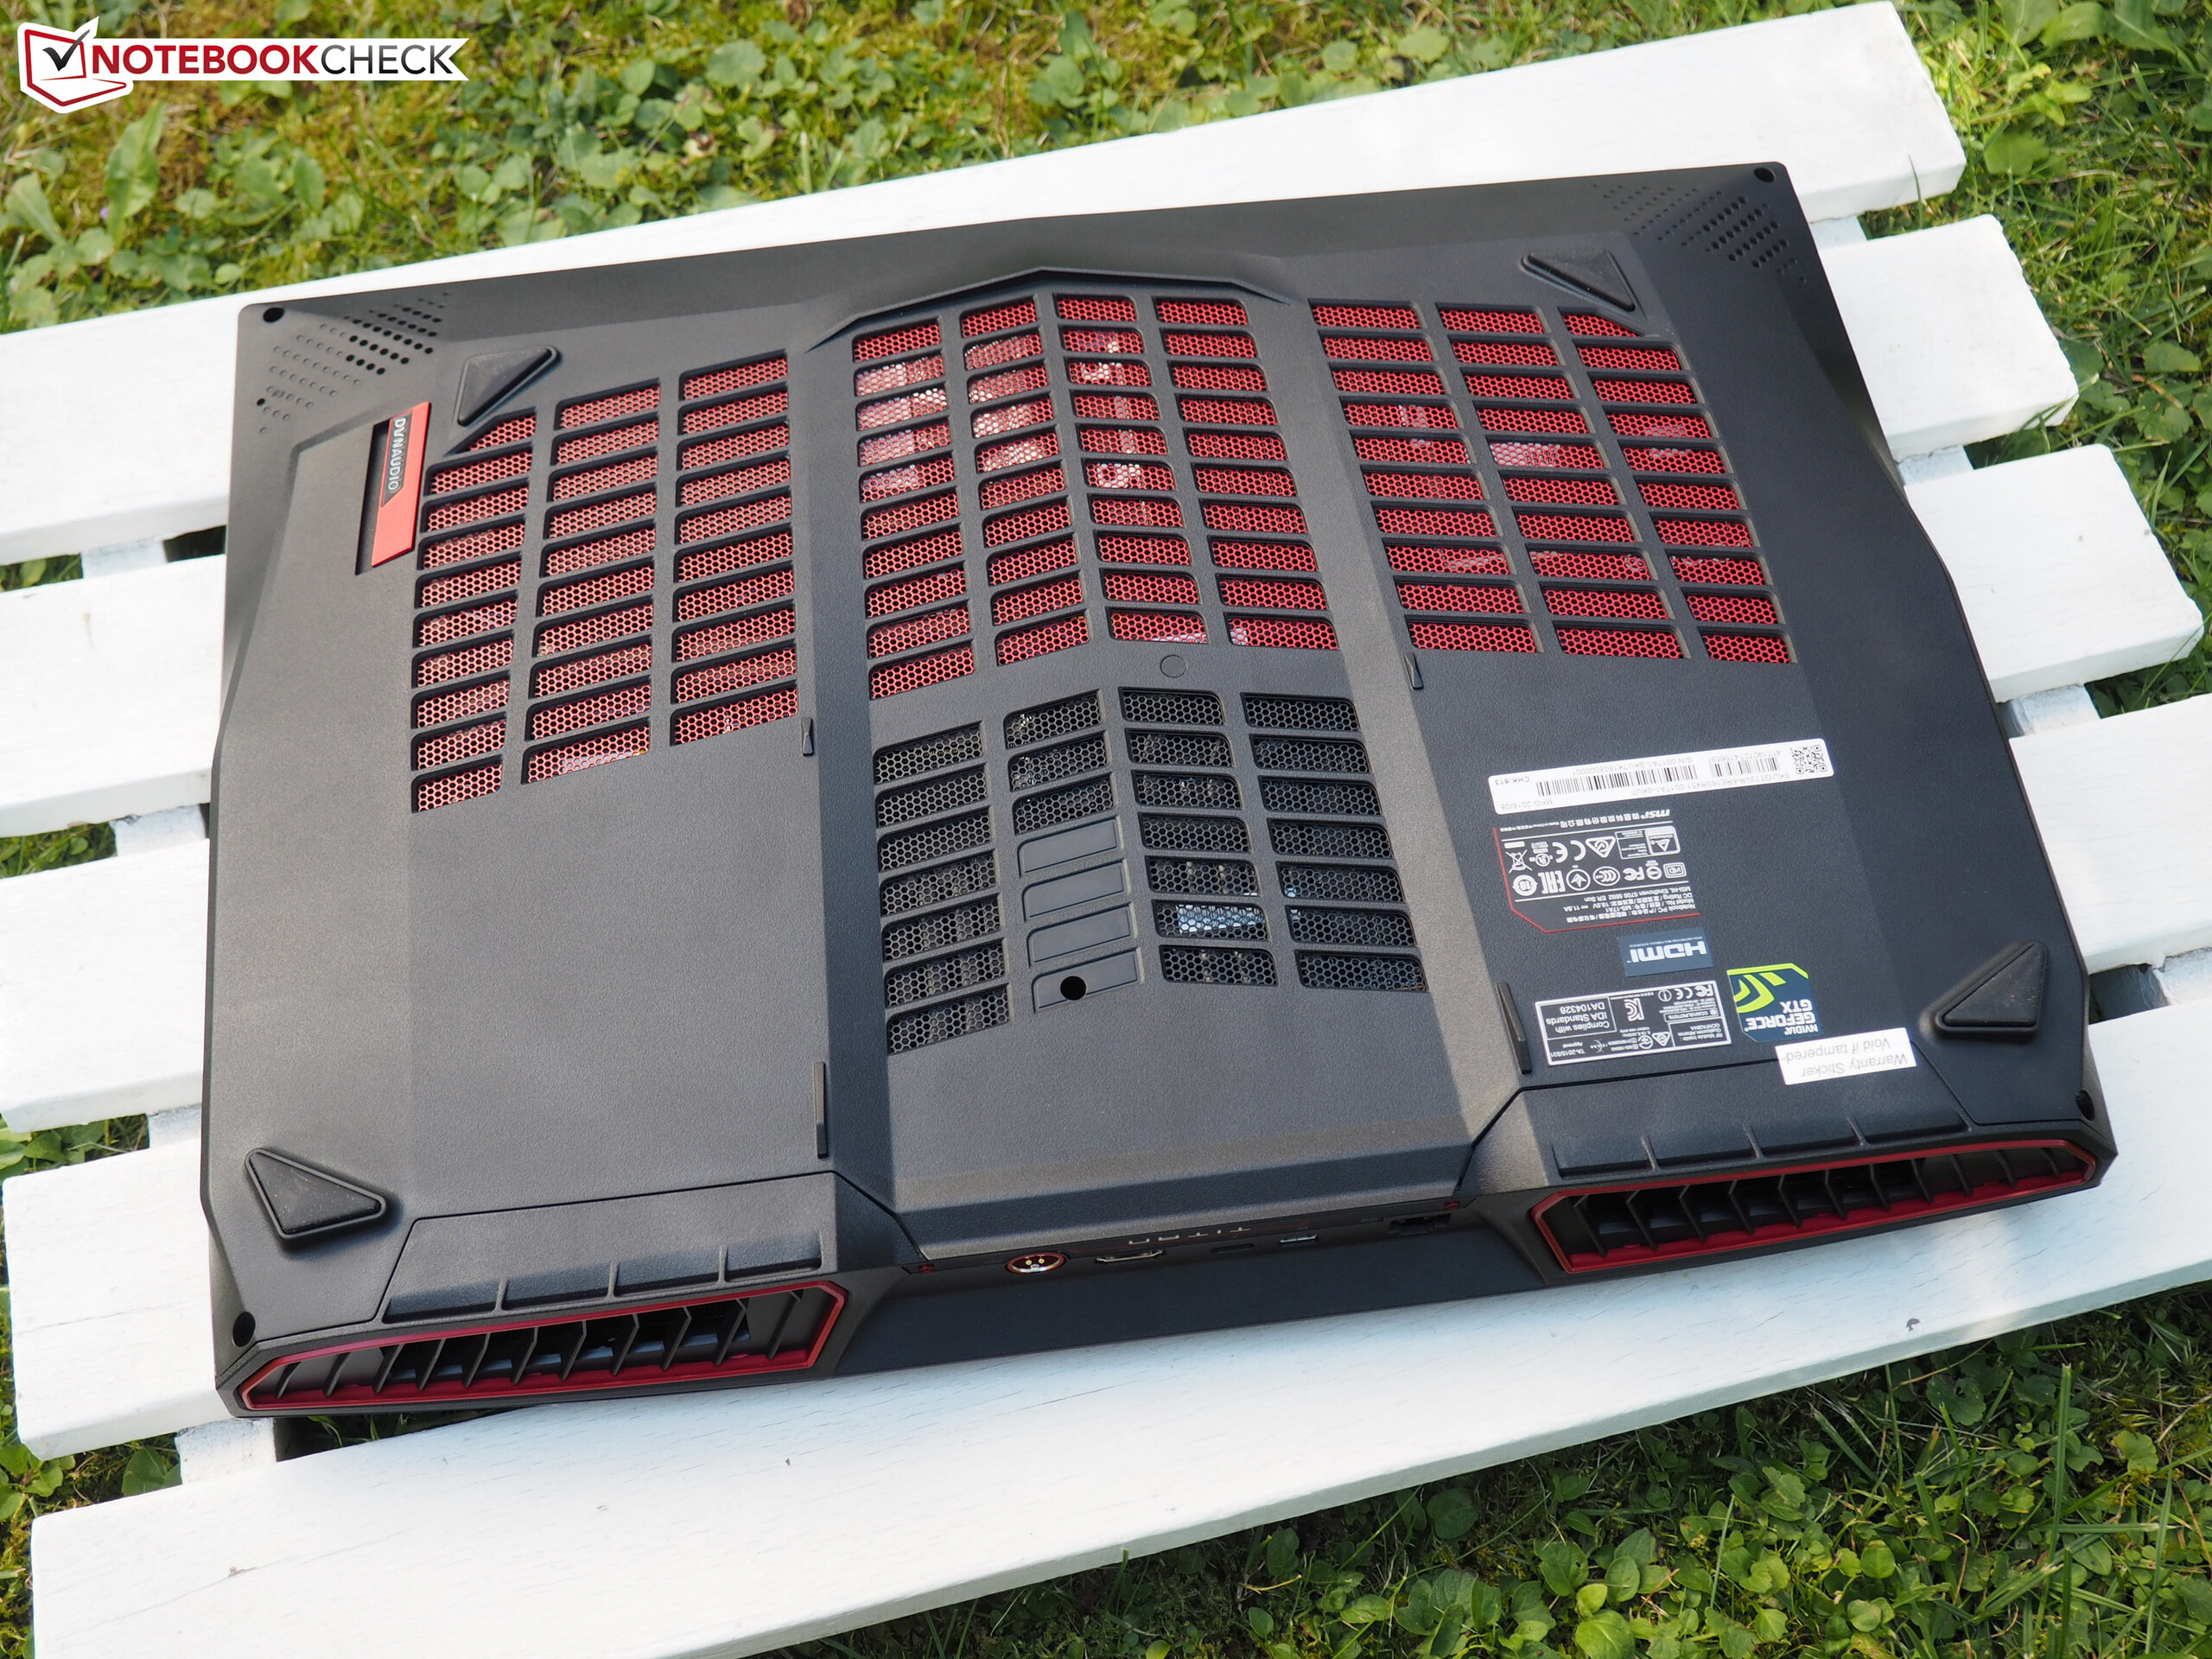
(-) The bottom heats up to a maximum of 47.8 °C / 118 F, compared to the average of 43.2 °C / 110 F
(+) In idle usage, the average temperature for the upper side is 25.4 °C / 78 F, compared to the device average of 33.9 °C / 93 F.
(+) The palmrests and touchpad are cooler than skin temperature with a maximum of 28.4 °C / 83.1 F and are therefore cool to the touch.
(±) The average temperature of the palmrest area of similar devices was 28.8 °C / 83.8 F (+0.4 °C / 0.7 F).
| MSI GT73VR 7RF-296 i7-7820HK, GeForce GTX 1080 Mobile | Acer Predator 17 G9-793-77LG 6700HQ, GeForce GTX 1070 Mobile | Aorus X7 v6 6820HK, GeForce GTX 1070 Mobile | Asus G752VS-XB78K 6820HK, GeForce GTX 1070 Mobile | MSI GT72VR 7RE-433 i7-7700HQ, GeForce GTX 1070 Mobile | MSI GT83VR-6RE32SR451 6820HK, GeForce GTX 1070 SLI (Laptop) | |
|---|---|---|---|---|---|---|
| Heat | -7% | -11% | -5% | 0% | 12% | |
| Maximum Upper Side * (°C) | 39.8 | 42.6 -7% | 47.5 -19% | 42.9 -8% | 41.5 -4% | 35.8 10% |
| Maximum Bottom * (°C) | 47.8 | 44.9 6% | 54.5 -14% | 41.5 13% | 50.6 -6% | 42.8 10% |
| Idle Upper Side * (°C) | 27.1 | 33.1 -22% | 28.6 -6% | 31.6 -17% | 26.4 3% | 24.7 9% |
| Idle Bottom * (°C) | 27.4 | 28.9 -5% | 28.8 -5% | 29.5 -8% | 25.4 7% | 22.8 17% |
* ... smaller is better
MSI GT73VR 7RF-296 audio analysis
(+) | speakers can play relatively loud (93 dB)
Bass 100 - 315 Hz
(±) | reduced bass - on average 11.7% lower than median
(±) | linearity of bass is average (9% delta to prev. frequency)
Mids 400 - 2000 Hz
(+) | balanced mids - only 3% away from median
(+) | mids are linear (3.6% delta to prev. frequency)
Highs 2 - 16 kHz
(+) | balanced highs - only 4% away from median
(+) | highs are linear (3.5% delta to prev. frequency)
Overall 100 - 16.000 Hz
(+) | overall sound is linear (13.6% difference to median)
Compared to same class
» 20% of all tested devices in this class were better, 7% similar, 73% worse
» The best had a delta of 6%, average was 18%, worst was 132%
Compared to all devices tested
» 15% of all tested devices were better, 4% similar, 82% worse
» The best had a delta of 4%, average was 23%, worst was 134%
Asus G752VS-XB78K audio analysis
(±) | speaker loudness is average but good (76 dB)
Bass 100 - 315 Hz
(±) | reduced bass - on average 9.6% lower than median
(±) | linearity of bass is average (10.7% delta to prev. frequency)
Mids 400 - 2000 Hz
(+) | balanced mids - only 4.7% away from median
(±) | linearity of mids is average (10.3% delta to prev. frequency)
Highs 2 - 16 kHz
(±) | reduced highs - on average 8.3% lower than median
(±) | linearity of highs is average (9.7% delta to prev. frequency)
Overall 100 - 16.000 Hz
(±) | linearity of overall sound is average (22.4% difference to median)
Compared to same class
» 80% of all tested devices in this class were better, 6% similar, 14% worse
» The best had a delta of 6%, average was 18%, worst was 132%
Compared to all devices tested
» 66% of all tested devices were better, 6% similar, 29% worse
» The best had a delta of 4%, average was 23%, worst was 134%
| Off / Standby | |
| Idle | |
| Load |
|
Key:
min: | |
| MSI GT73VR 7RF-296 i7-7820HK, GeForce GTX 1080 Mobile | Acer Predator 17 G9-793-77LG 6700HQ, GeForce GTX 1070 Mobile | Aorus X7 v6 6820HK, GeForce GTX 1070 Mobile | Asus G752VS-XB78K 6820HK, GeForce GTX 1070 Mobile | MSI GT72VR 7RE-433 i7-7700HQ, GeForce GTX 1070 Mobile | MSI GT83VR-6RE32SR451 6820HK, GeForce GTX 1070 SLI (Laptop) | |
|---|---|---|---|---|---|---|
| Power Consumption | 4% | 4% | 15% | 25% | -30% | |
| Idle Minimum * (Watt) | 29 | 25 14% | 29 -0% | 24 17% | 20 31% | 32 -10% |
| Idle Average * (Watt) | 35 | 35 -0% | 31 11% | 31 11% | 27 23% | 47 -34% |
| Idle Maximum * (Watt) | 40 | 46 -15% | 38 5% | 36 10% | 31 22% | 52 -30% |
| Load Average * (Watt) | 94 | 103 -10% | 111 -18% | 94 -0% | 86 9% | 152 -62% |
| Load Maximum * (Watt) | 315 | 223 29% | 253 20% | 204 35% | 184 42% | 366 -16% |
* ... smaller is better
| MSI GT73VR 7RF-296 75.2 Wh | Acer Predator 17 G9-793-77LG 88 Wh | Aorus X7 v6 94 Wh | Asus G752VS-XB78K 90 Wh | MSI GT72VR 7RE-433 83 Wh | MSI GT83VR-6RE32SR451 75 Wh | |
|---|---|---|---|---|---|---|
| Battery runtime | 22% | 11% | 30% | 50% | -26% | |
| H.264 (h) | 2.4 | 3.1 29% | 3.8 58% | |||
| WiFi v1.3 (h) | 2.7 | 3.3 22% | 3 11% | 3.5 30% | 3.8 41% | 2 -26% |
Pros
Cons
如果你在期待Kaby Lake可能带来的突破的话,我们的总结可能会有些泼冷水。在我们的初步测试中英特尔的最新处理器架构并没有有效地改进发热量和噪音水平。这台设备的功耗和性能表现相比同频率的Skylake机型也没有太大优势。
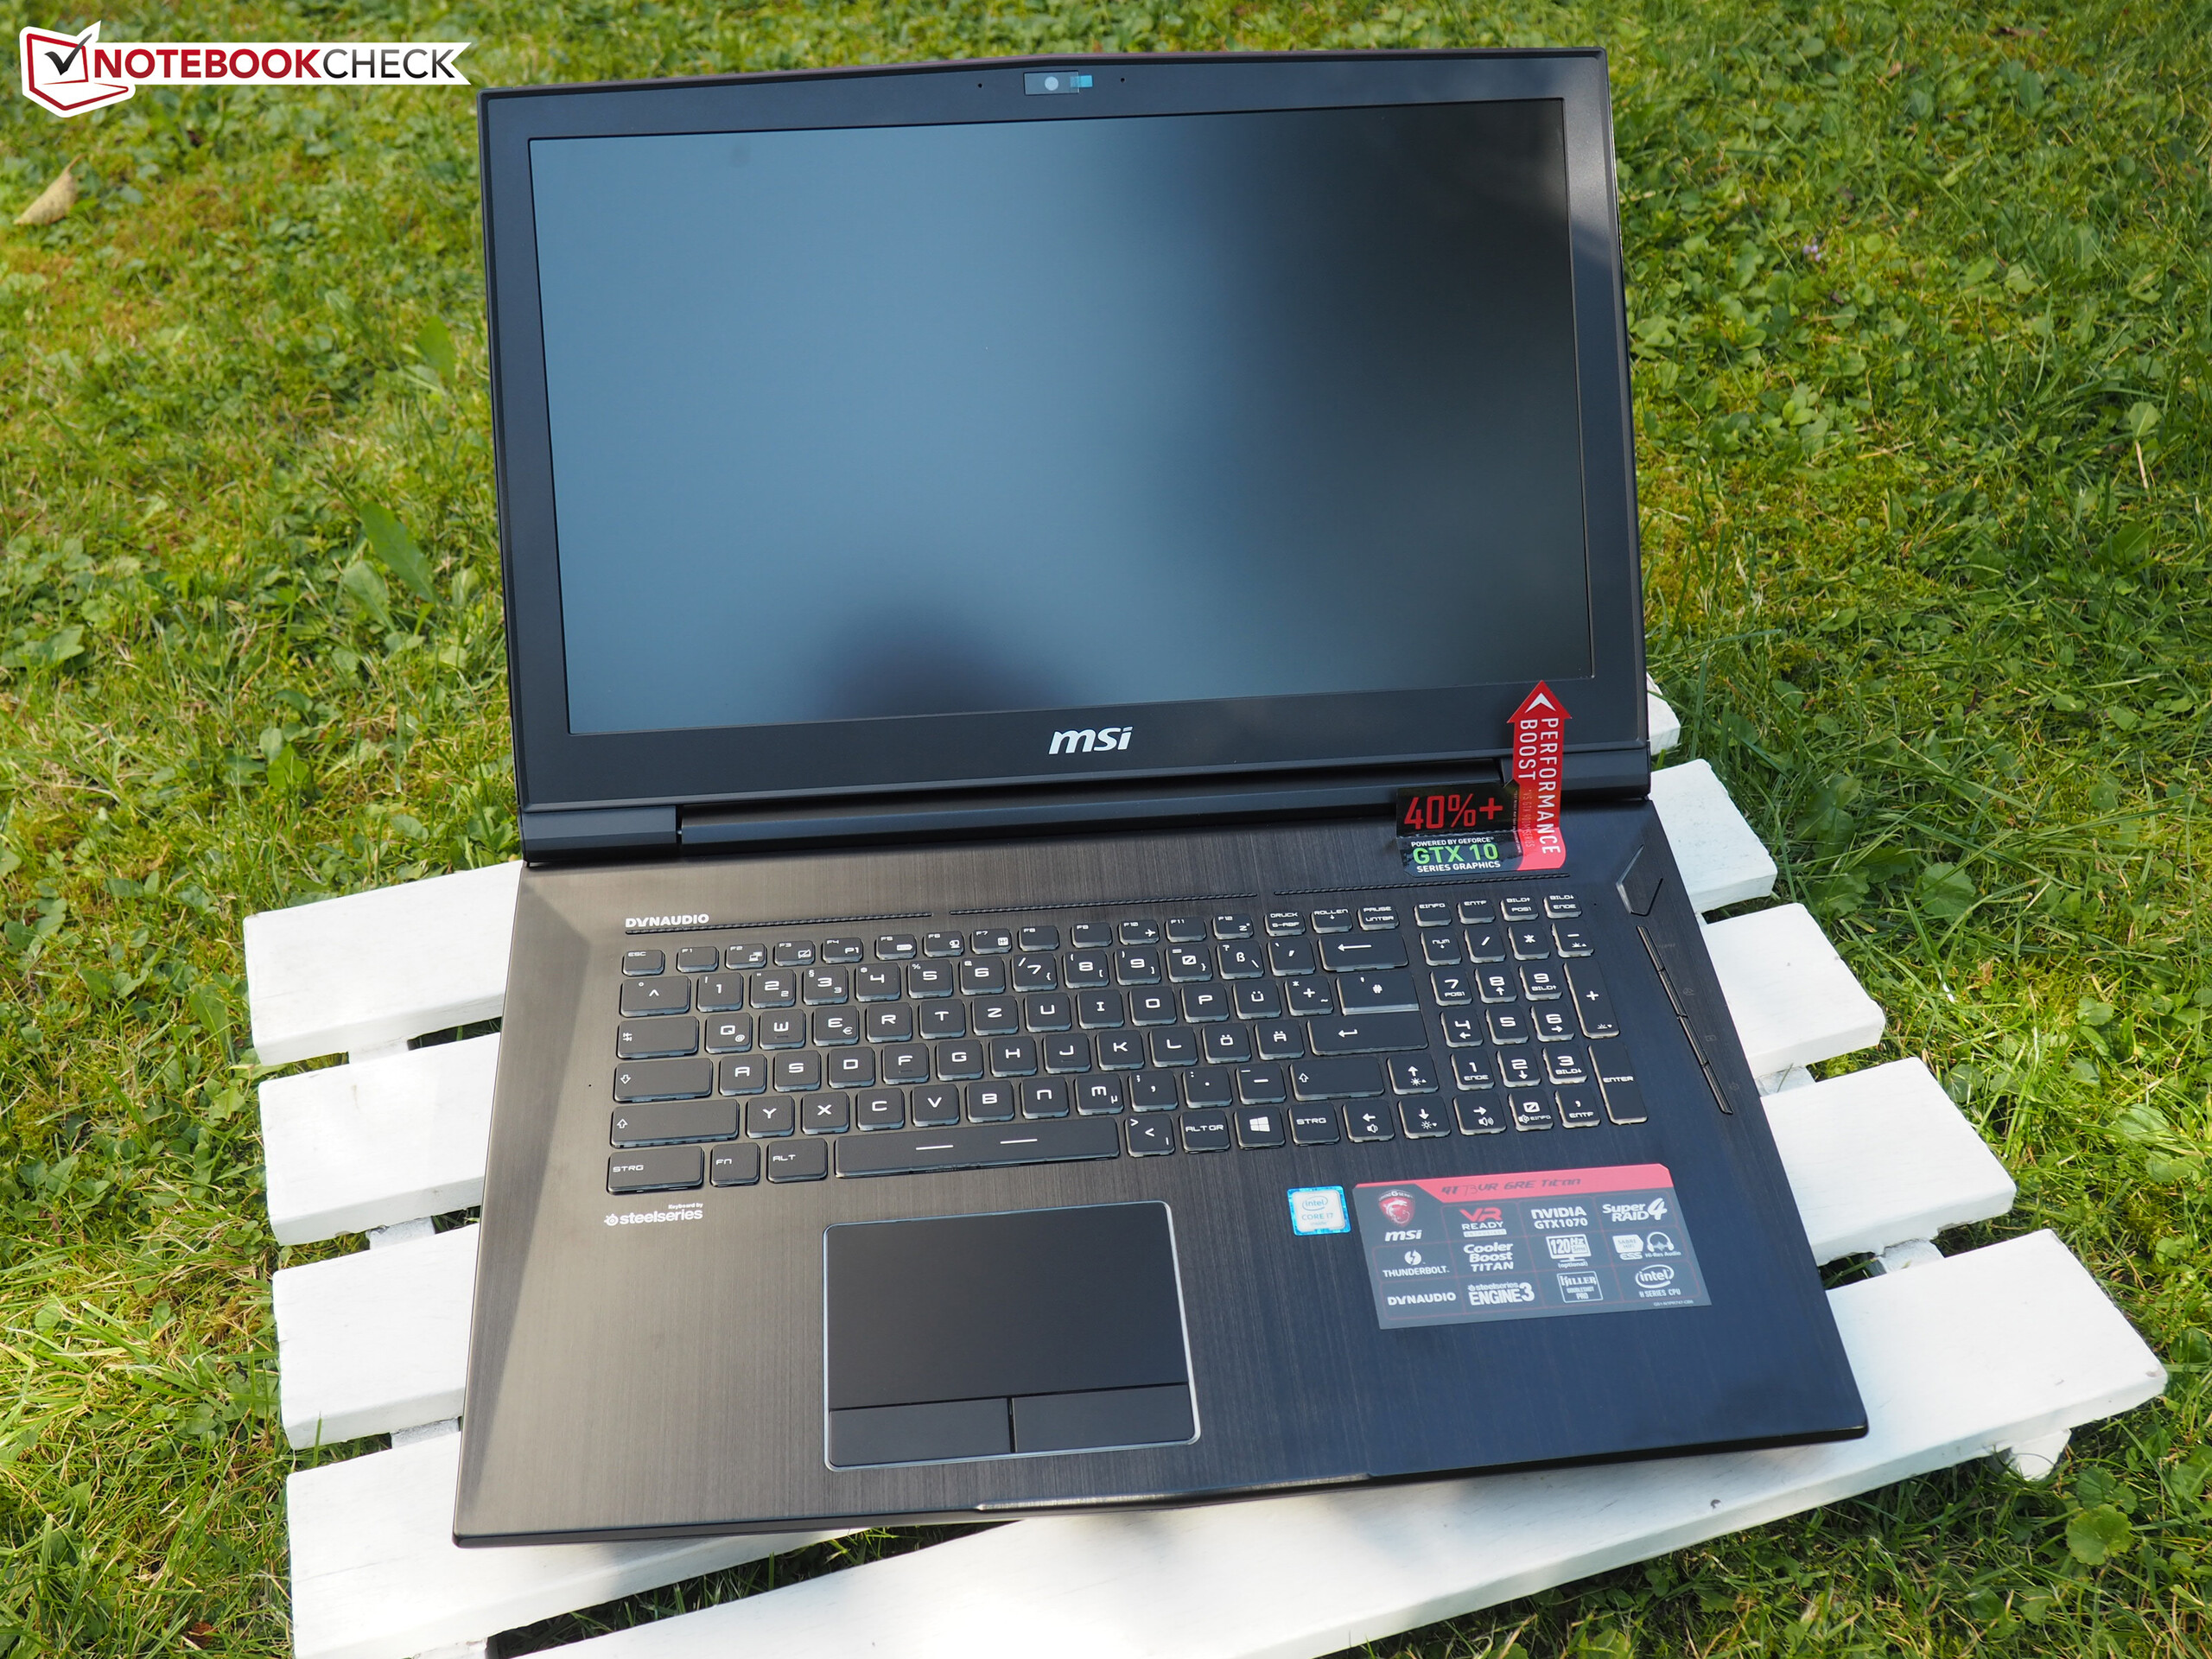
GT73VR的最新版本依然是一台非常成功(尽管十分笨重)的桌面式笔记本电脑,它并没有在任何方面让我们失望。大部分的大型游戏对它来说都是小菜一碟。
注:本文是基于完整评测的缩减版本,阅读完整的英文评测,请点击这里。
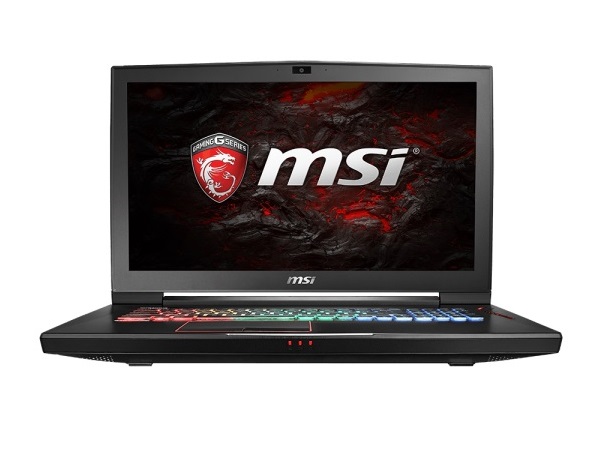
MSI GT73VR 7RF-296
- 12/27/2016 v6 (old)
Florian Glaser
Price comparison