华为MateBook 13s评论。拥有90赫兹显示屏的伟大的副笔记本
除了14英寸MateBook 14s我们几个月前回顾过,华为还提供了一个更紧凑的版本,有一个13.4英寸的显示屏。MateBook 13s也使用英特尔Tiger Lake-H35处理器,但与14英寸的设备相反,稍慢的酷睿i5-11300H.售价为1120欧元,这款笔记本还提供16GB内存,512GB NVMe SSD存储,以及一个高分辨率的2.5K触摸屏,长宽比为3:2,新鲜度为90Hz。
潜在的竞争对手比较
Rating | Date | Model | Weight | Height | Size | Resolution | Price |
|---|---|---|---|---|---|---|---|
| 88.8 % v7 (old) | 02 / 2022 | Huawei MateBook 13s i5 11300H i5-11300H, Iris Xe G7 80EUs | 1.3 kg | 16.5 mm | 13.40" | 2520x1680 | |
| 87.8 % v7 (old) | 01 / 2022 | Lenovo ThinkBook 13s G3 20YA0005GE R7 5800U, Vega 8 | 1.3 kg | 14.9 mm | 13.30" | 1920x1200 | |
| 85.2 % v7 (old) | 06 / 2021 | Microsoft Surface Laptop 4 13 Ryzen 5 R5 4680U, Vega 7 | 1.3 kg | 14 mm | 13.50" | 2256x1504 | |
| 88.9 % v7 (old) | 06 / 2021 | Asus ZenBook 13 UX325EA i7-1165G7, Iris Xe G7 96EUs | 1.2 kg | 13.9 mm | 13.30" | 1920x1080 | |
| 91.1 % v7 (old) | 12 / 2020 | Apple MacBook Air 2020 M1 Entry M1, M1 7-Core GPU | 1.3 kg | 16.1 mm | 13.30" | 2560x1600 | |
| 87.7 % v7 (old) | Dell XPS 13 9305 Core i5 FHD i5-1135G7, Iris Xe G7 80EUs | 1.2 kg | 16 mm | 13.30" | 1920x1080 | ||
| 84.4 % v7 (old) | 08 / 2021 | HP Pavilion Aero 13 be0097nr R7 5800U, Vega 8 | 953 g | 17 mm | 13.30" | 1920x1200 |
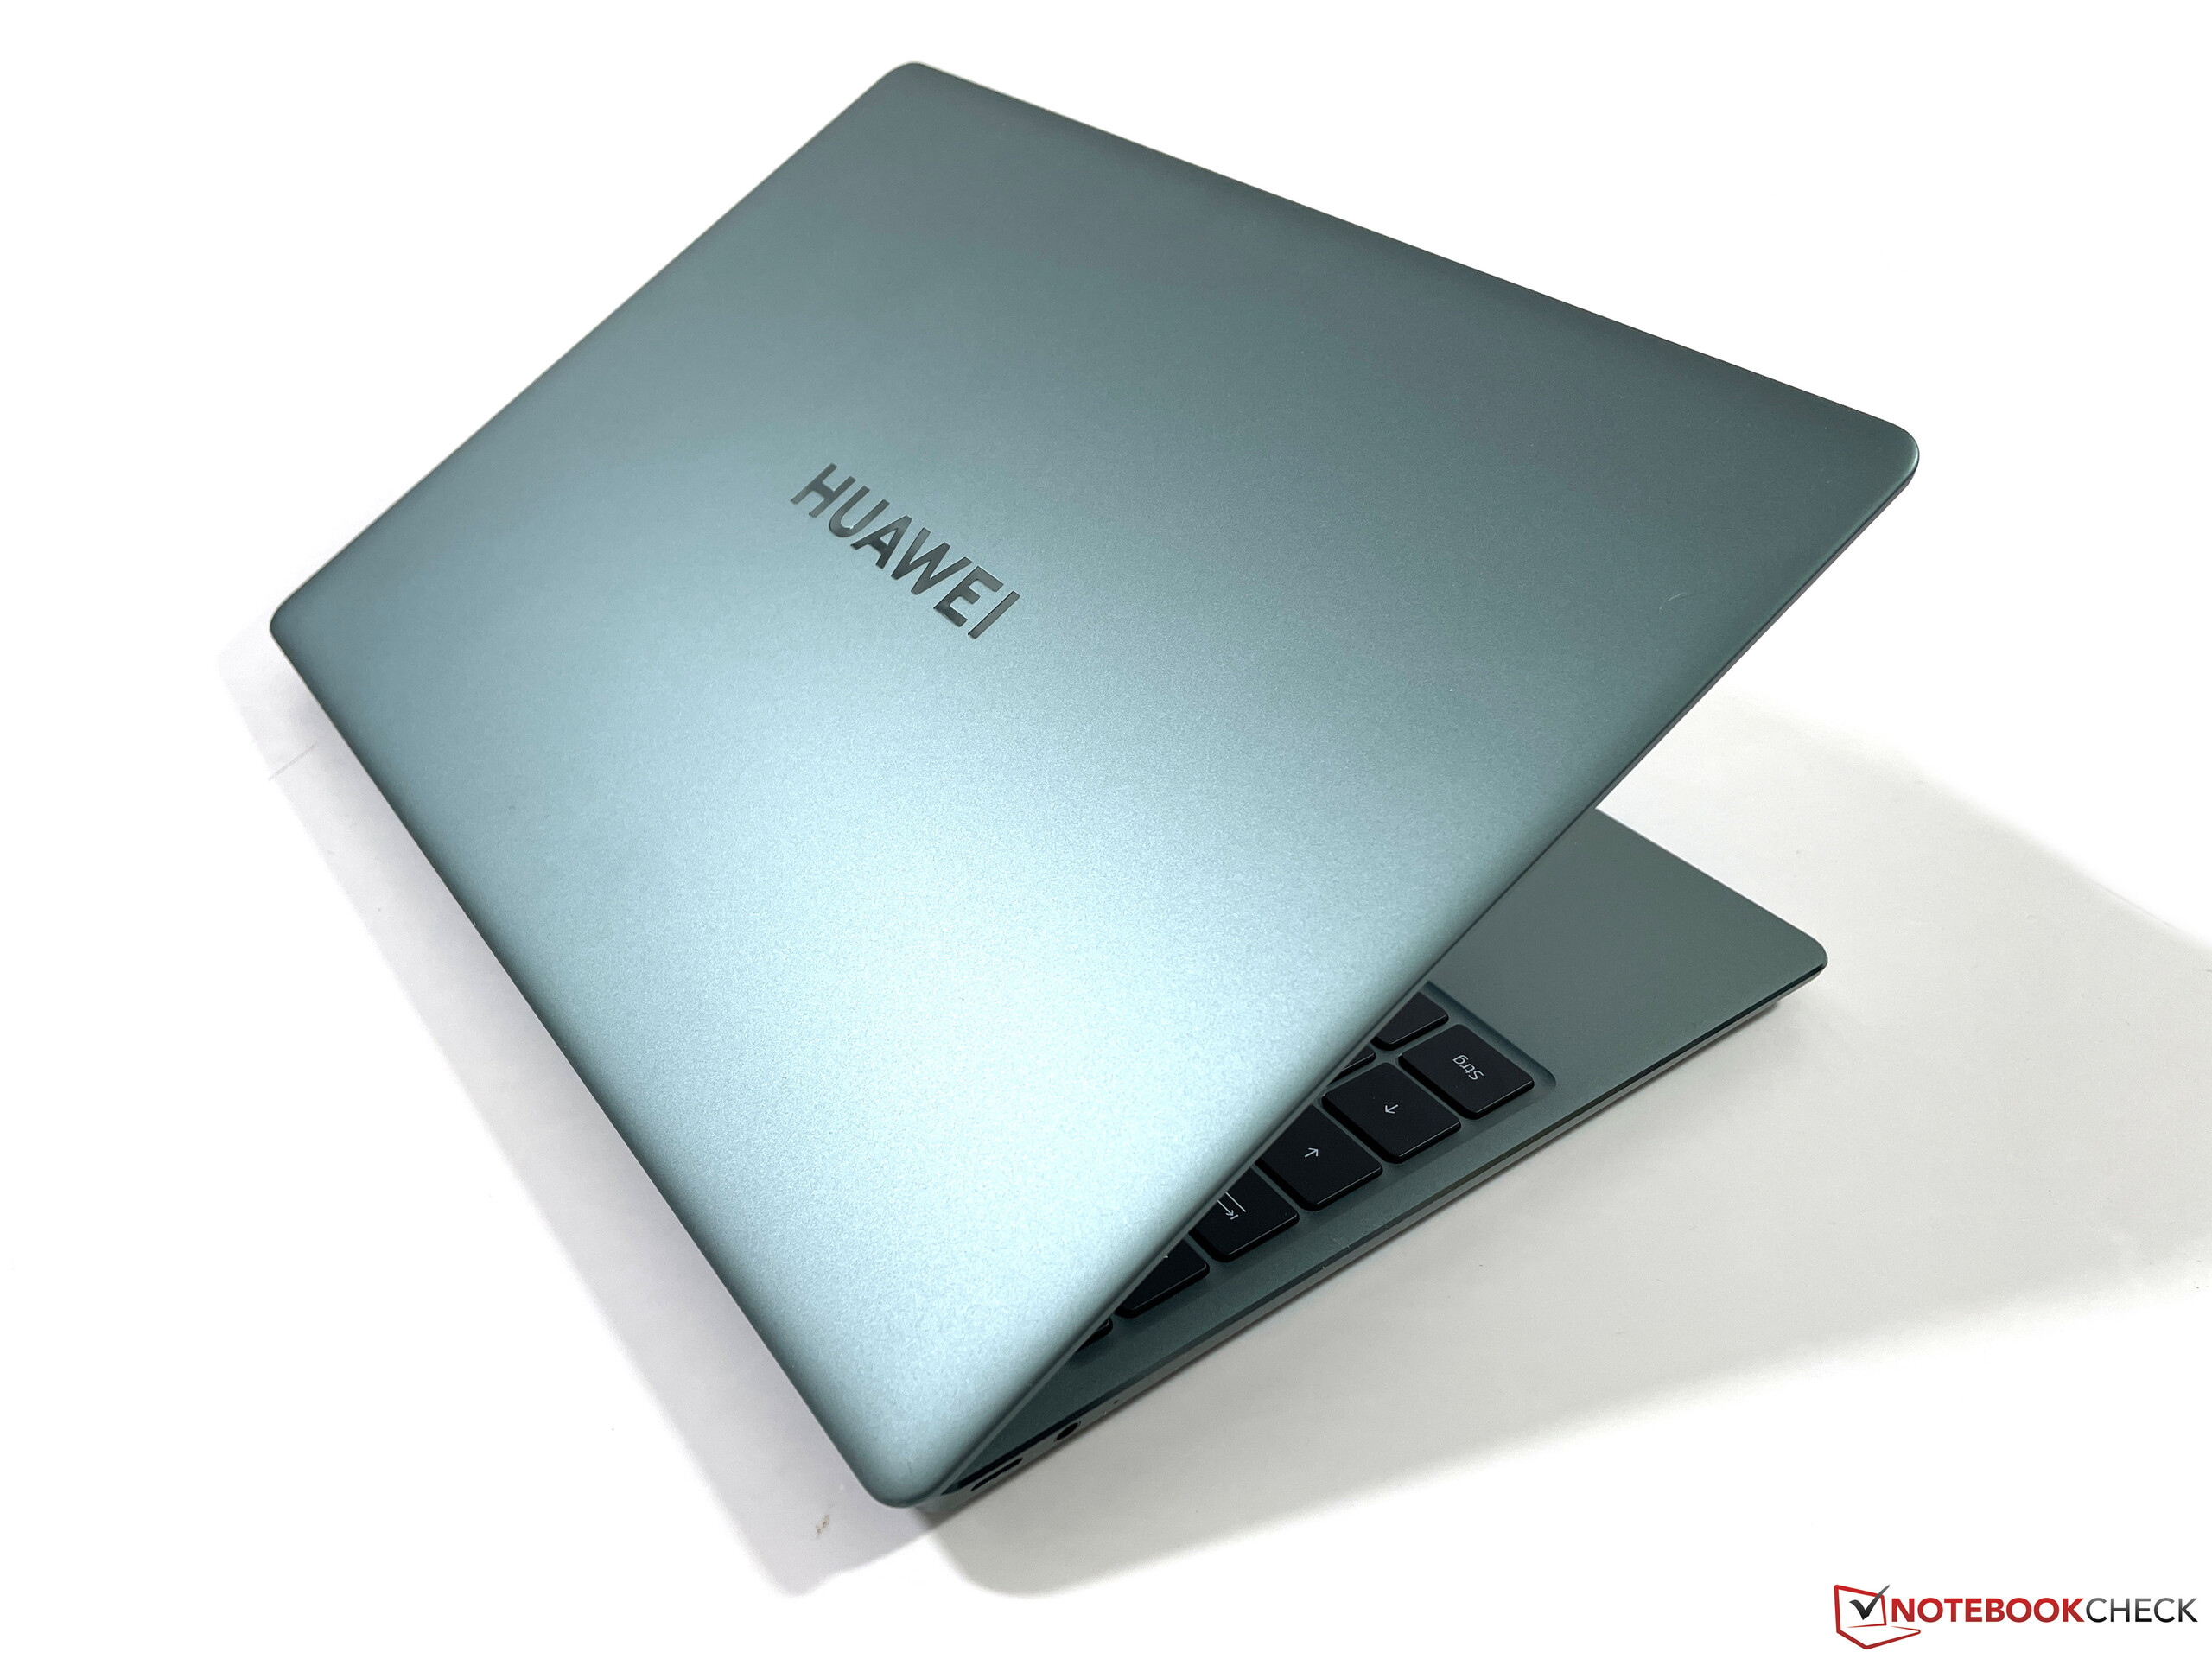
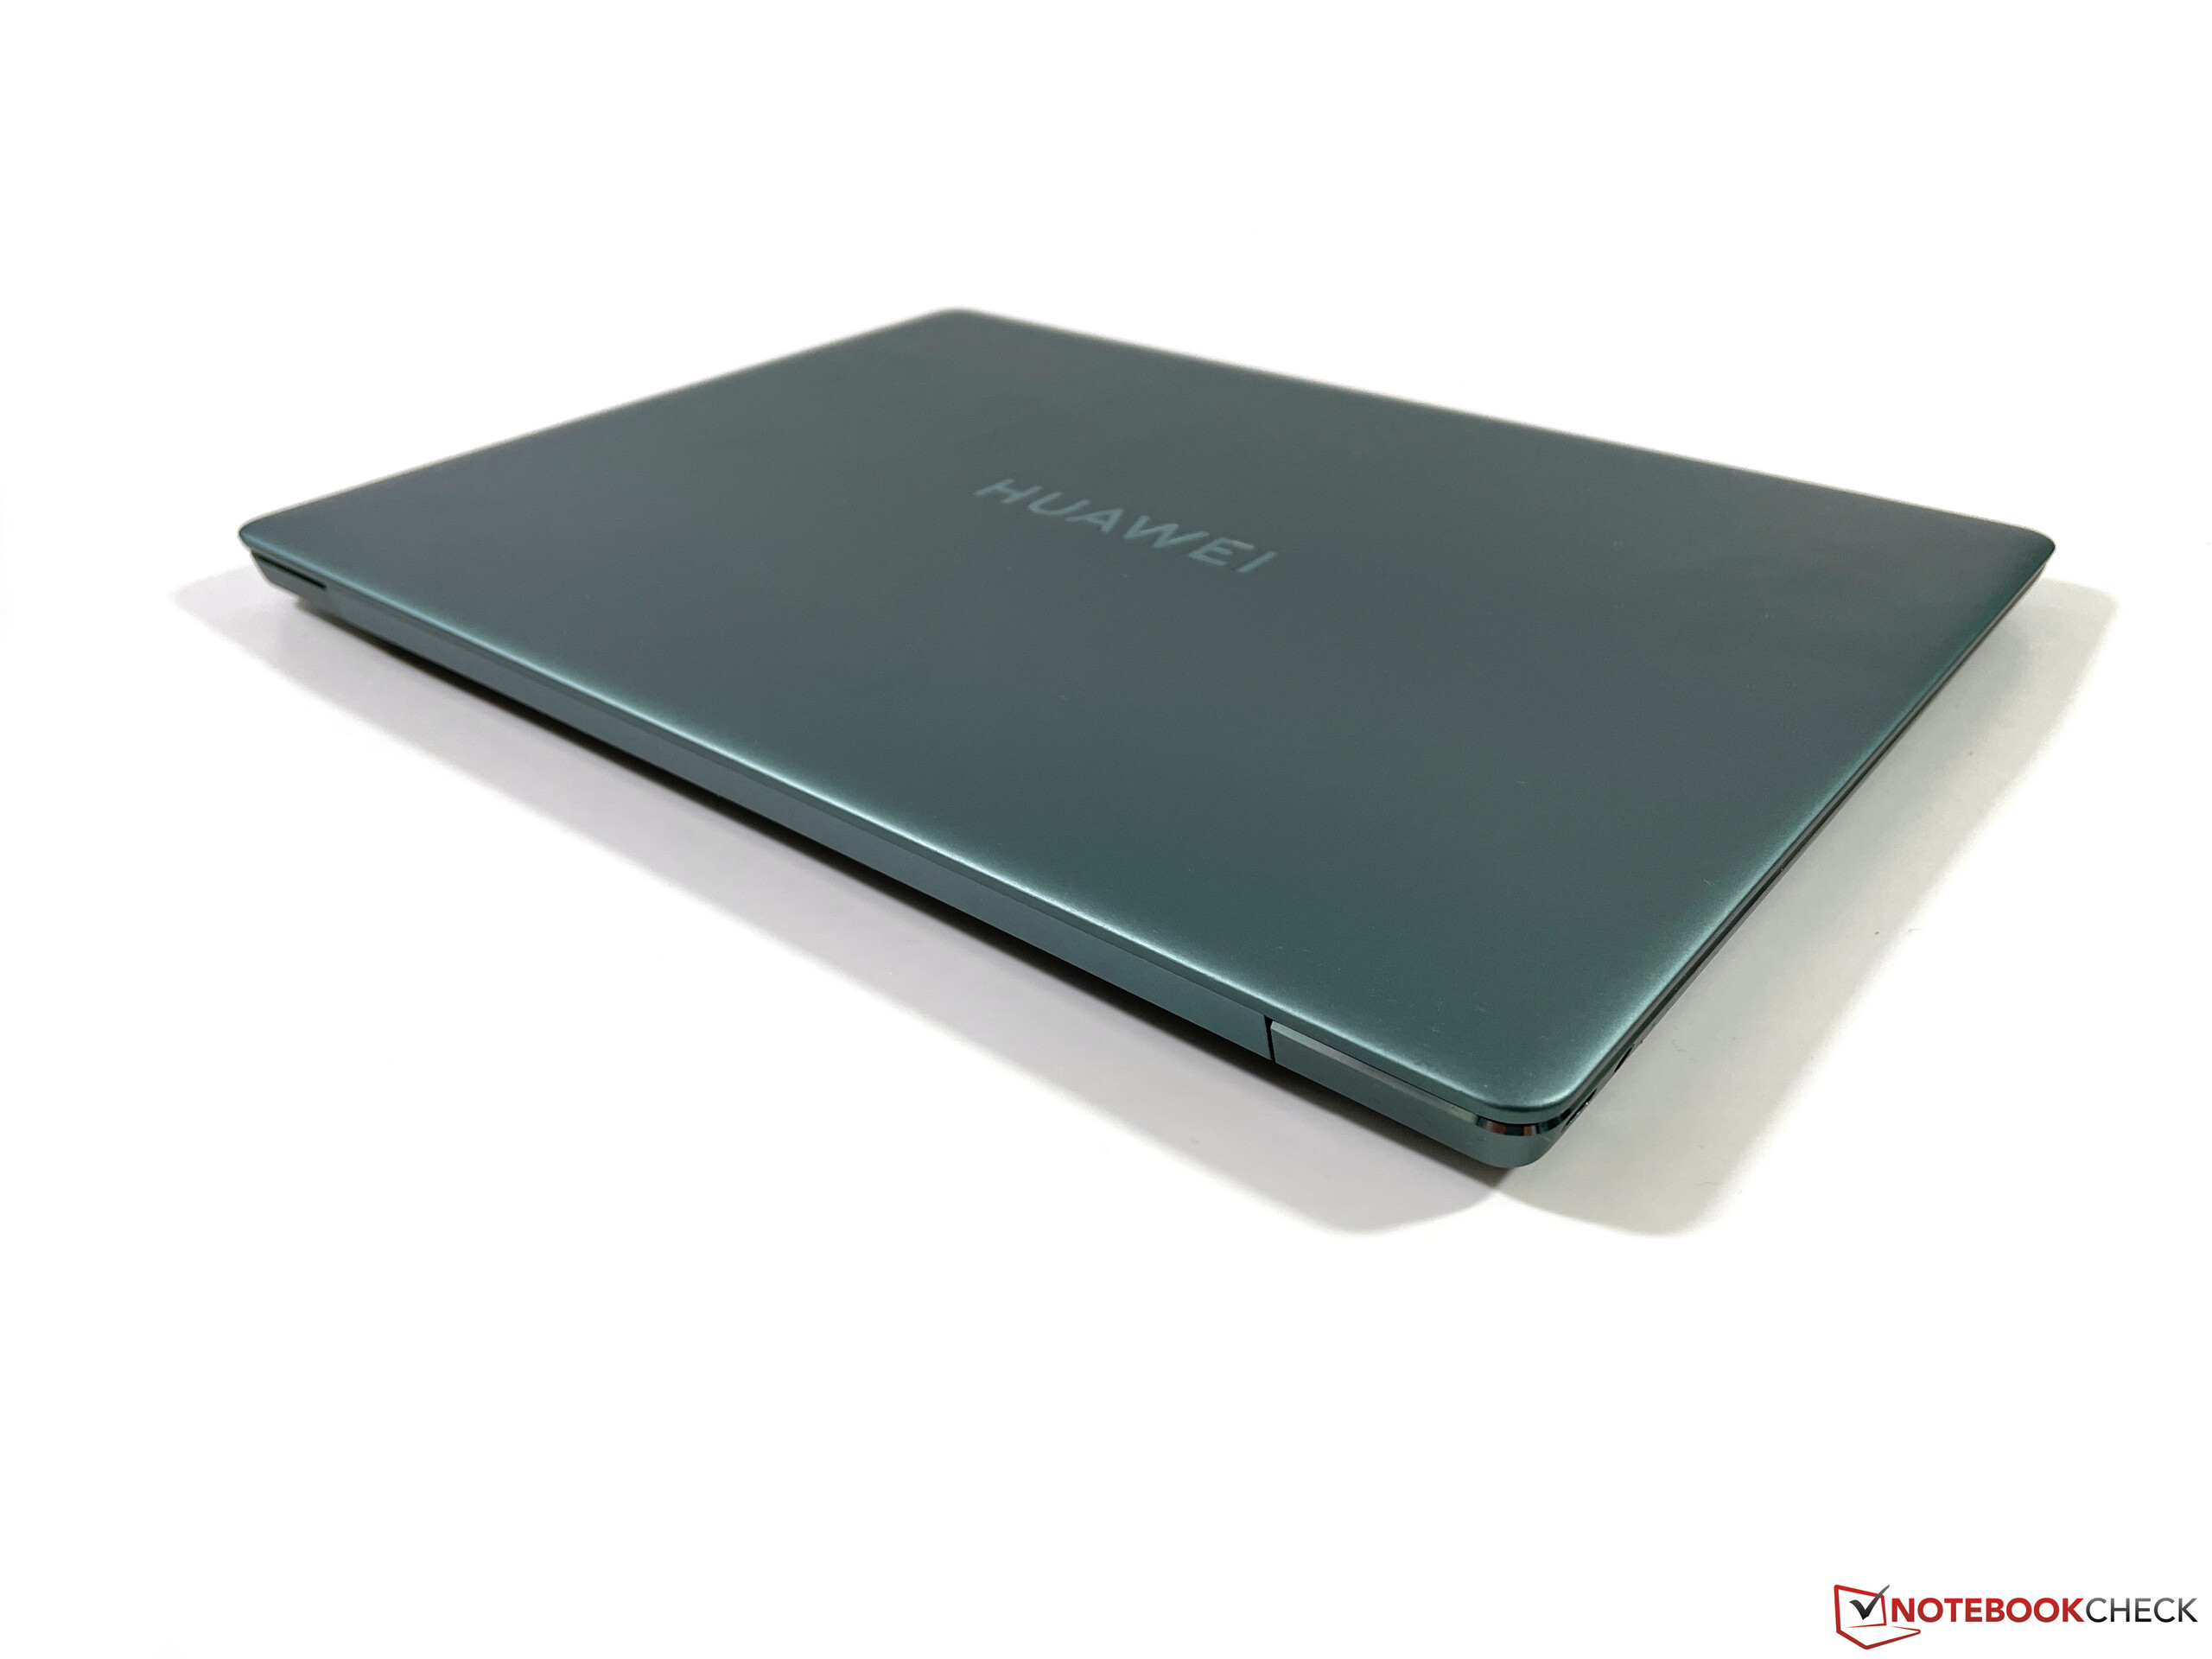
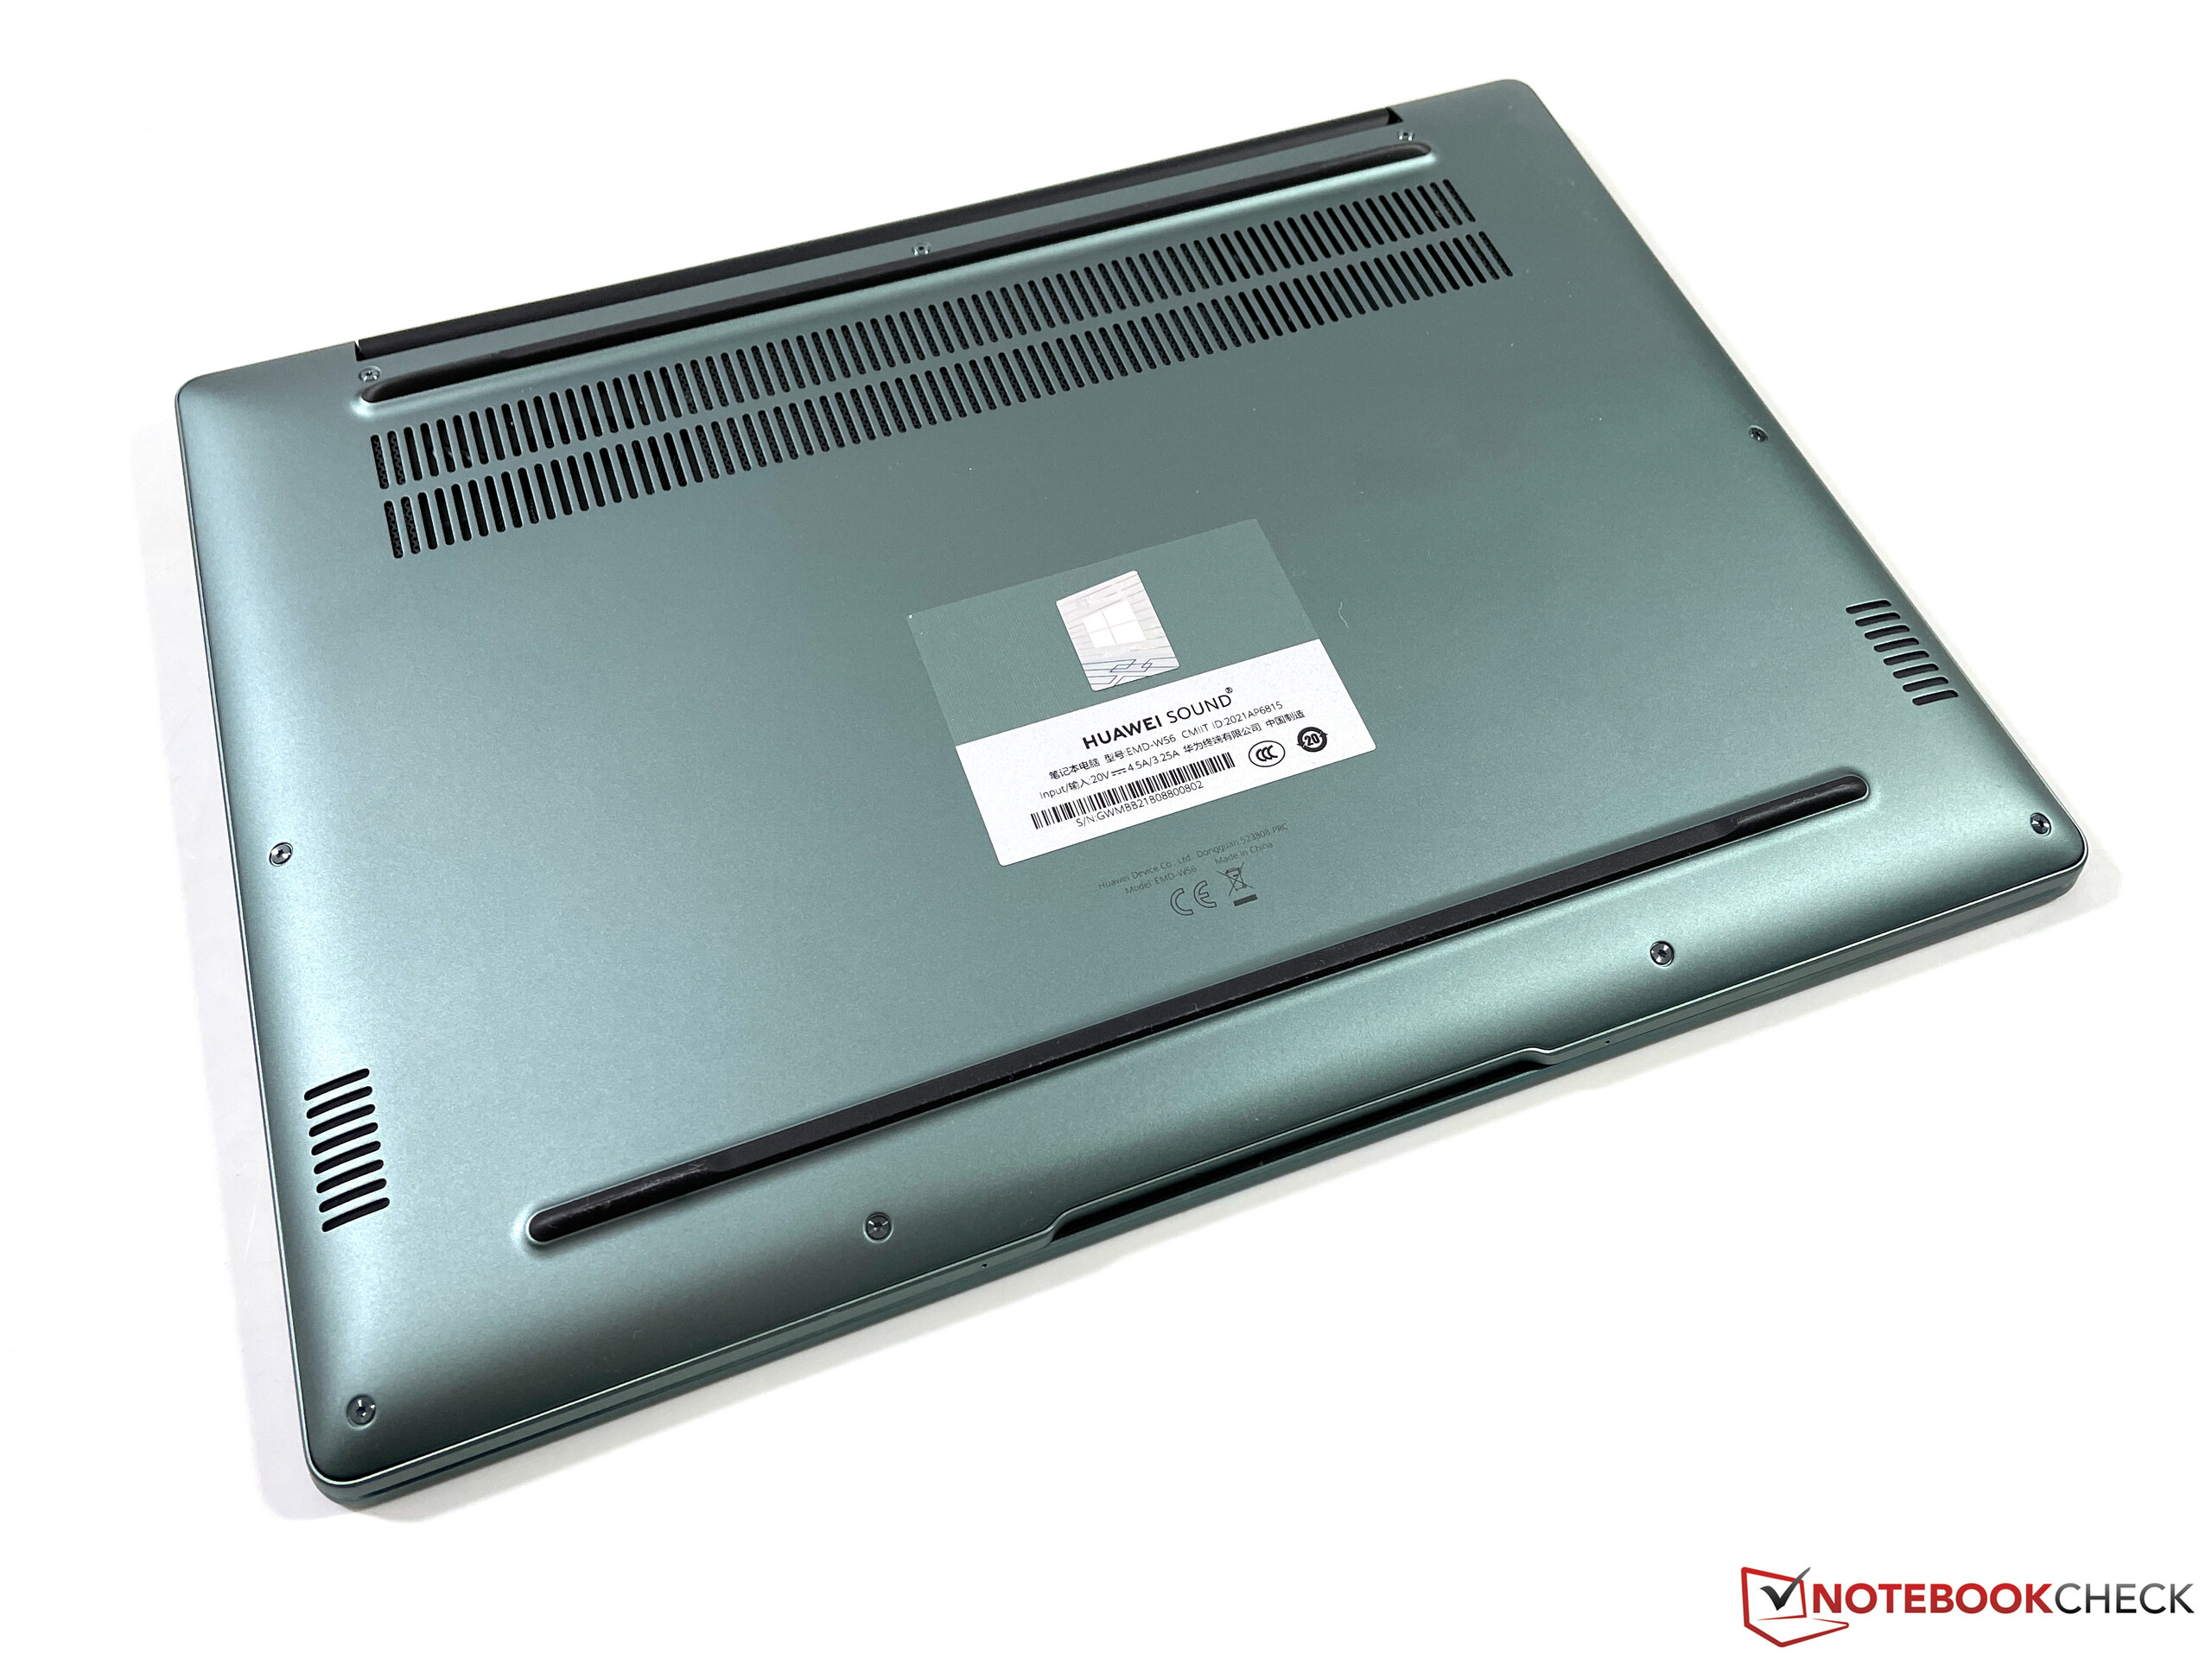
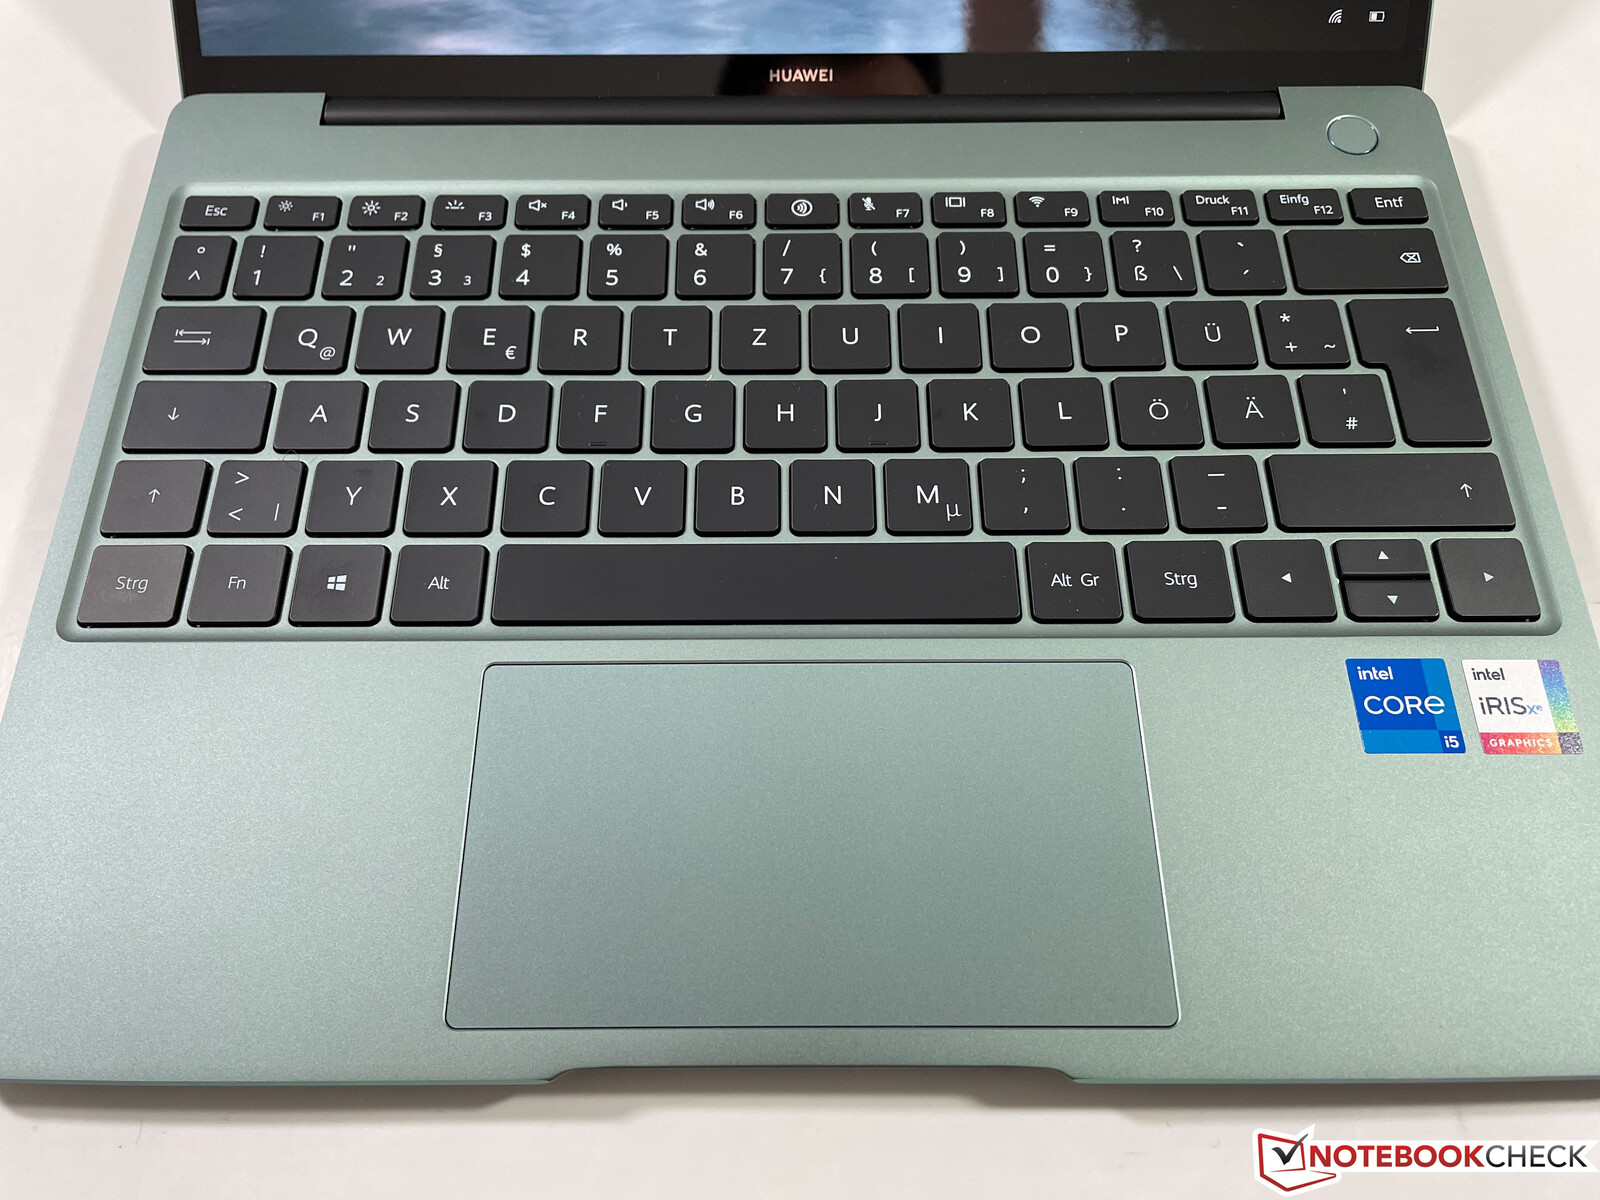
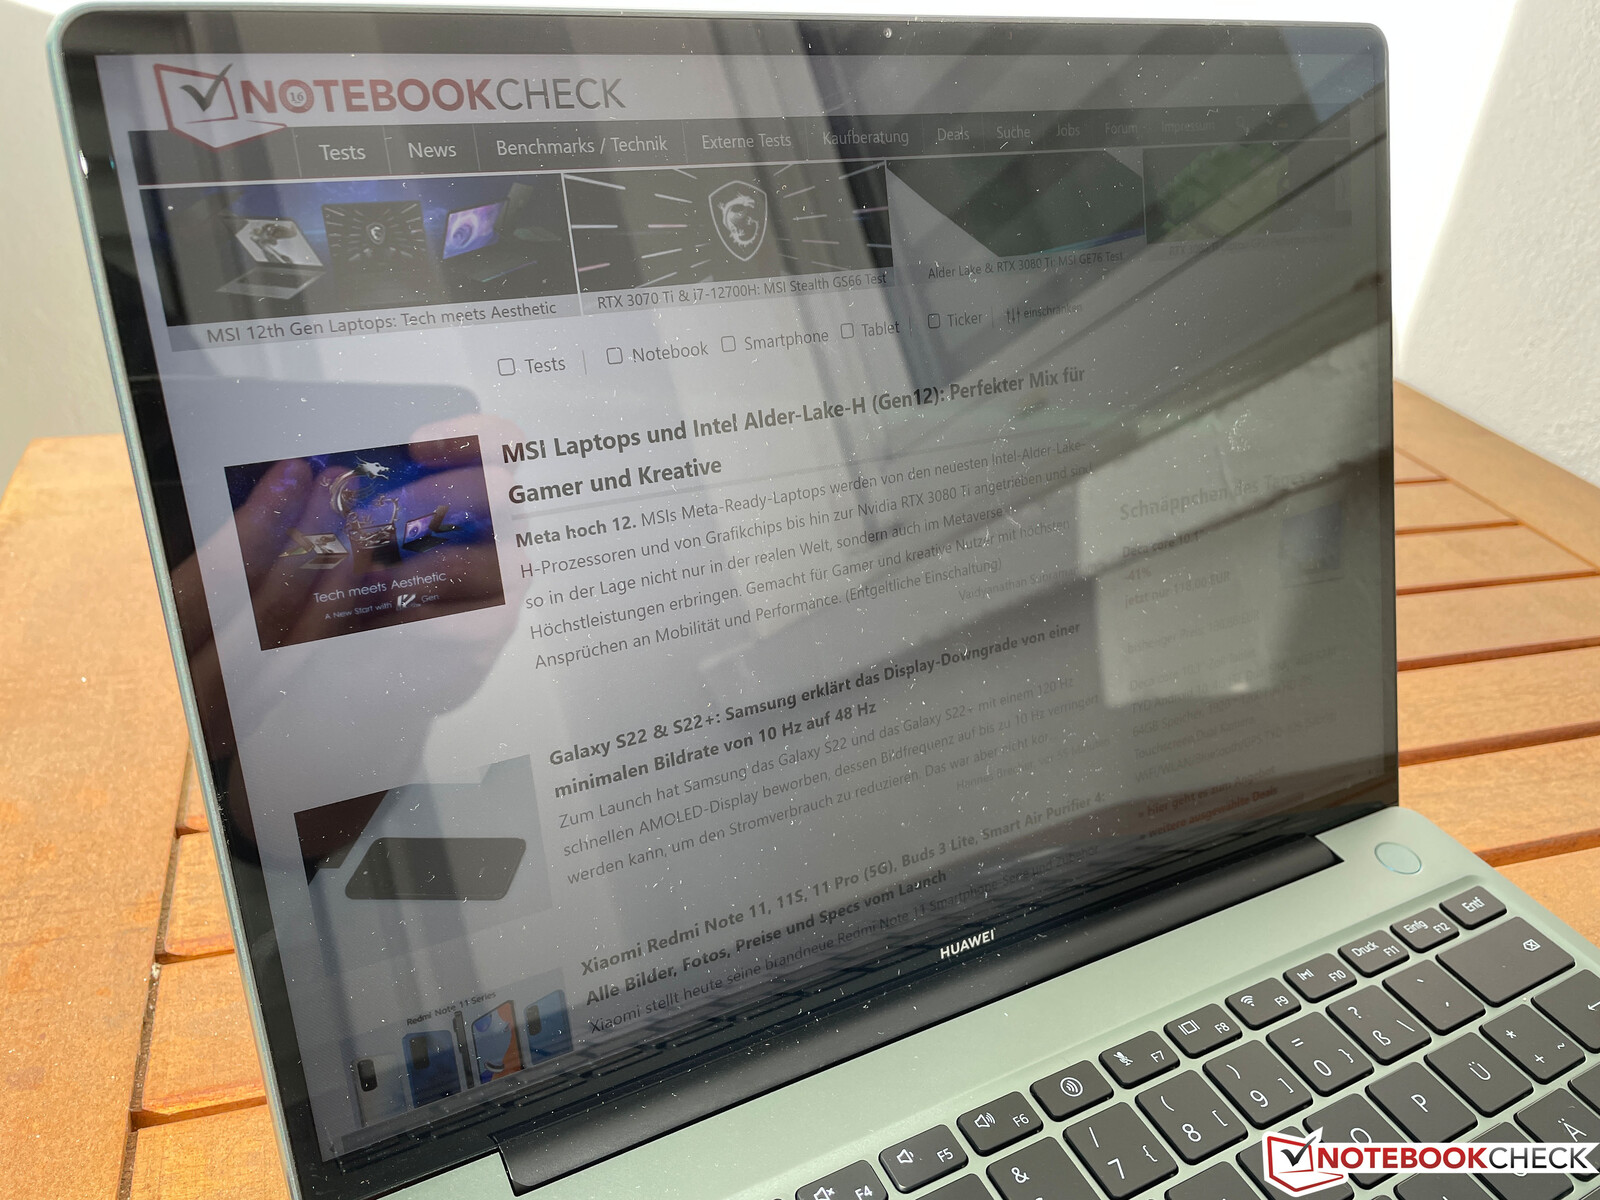
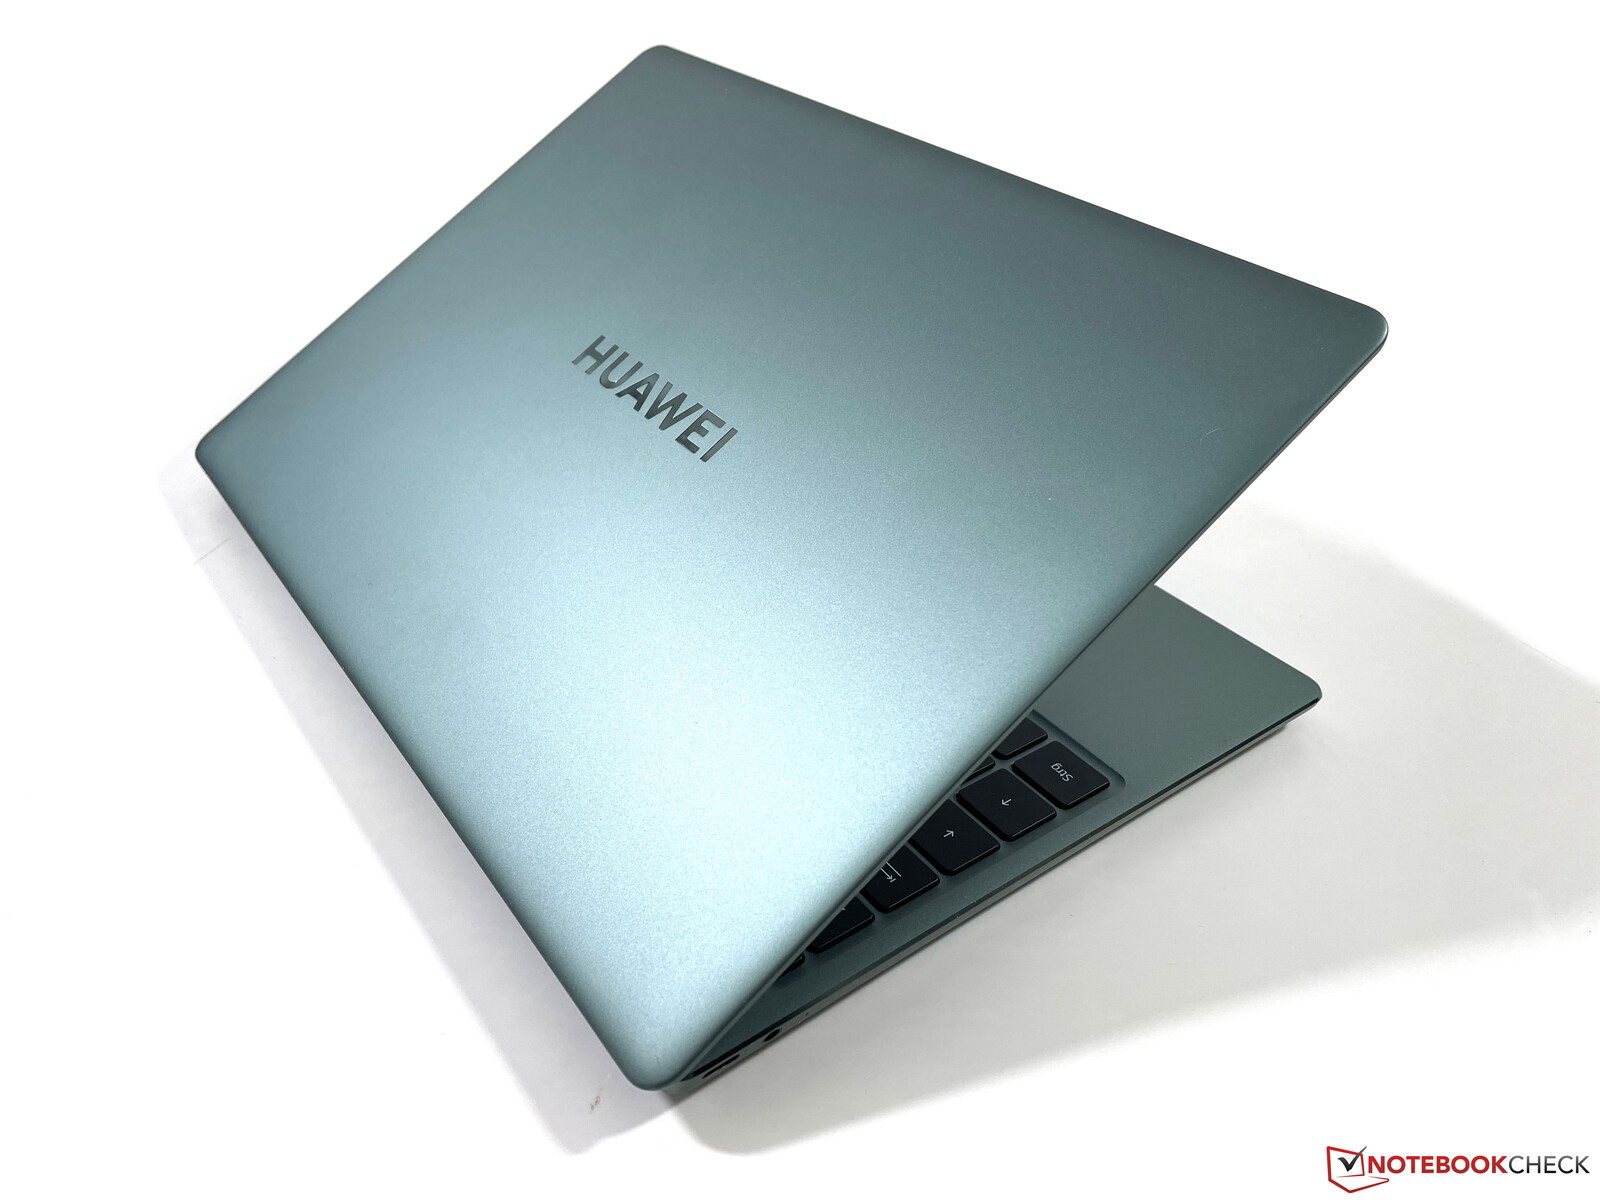
机箱 - MateBook 13s的云杉绿金属机壳
这款铝制机箱是最近评测的小型版本的MateBook 14s而采用云杉绿配色的评测单元看起来非常优雅。与较大的14英寸机型相比,键盘旁边的侧面区域更窄,点击板也没有那么高,但键盘本身的尺寸是相同的。我们喜欢这种窄边框的设计,MateBook 13s的质量印象也很好。制造质量很完美,当你使用它时,感觉就像一件高质量的物品。
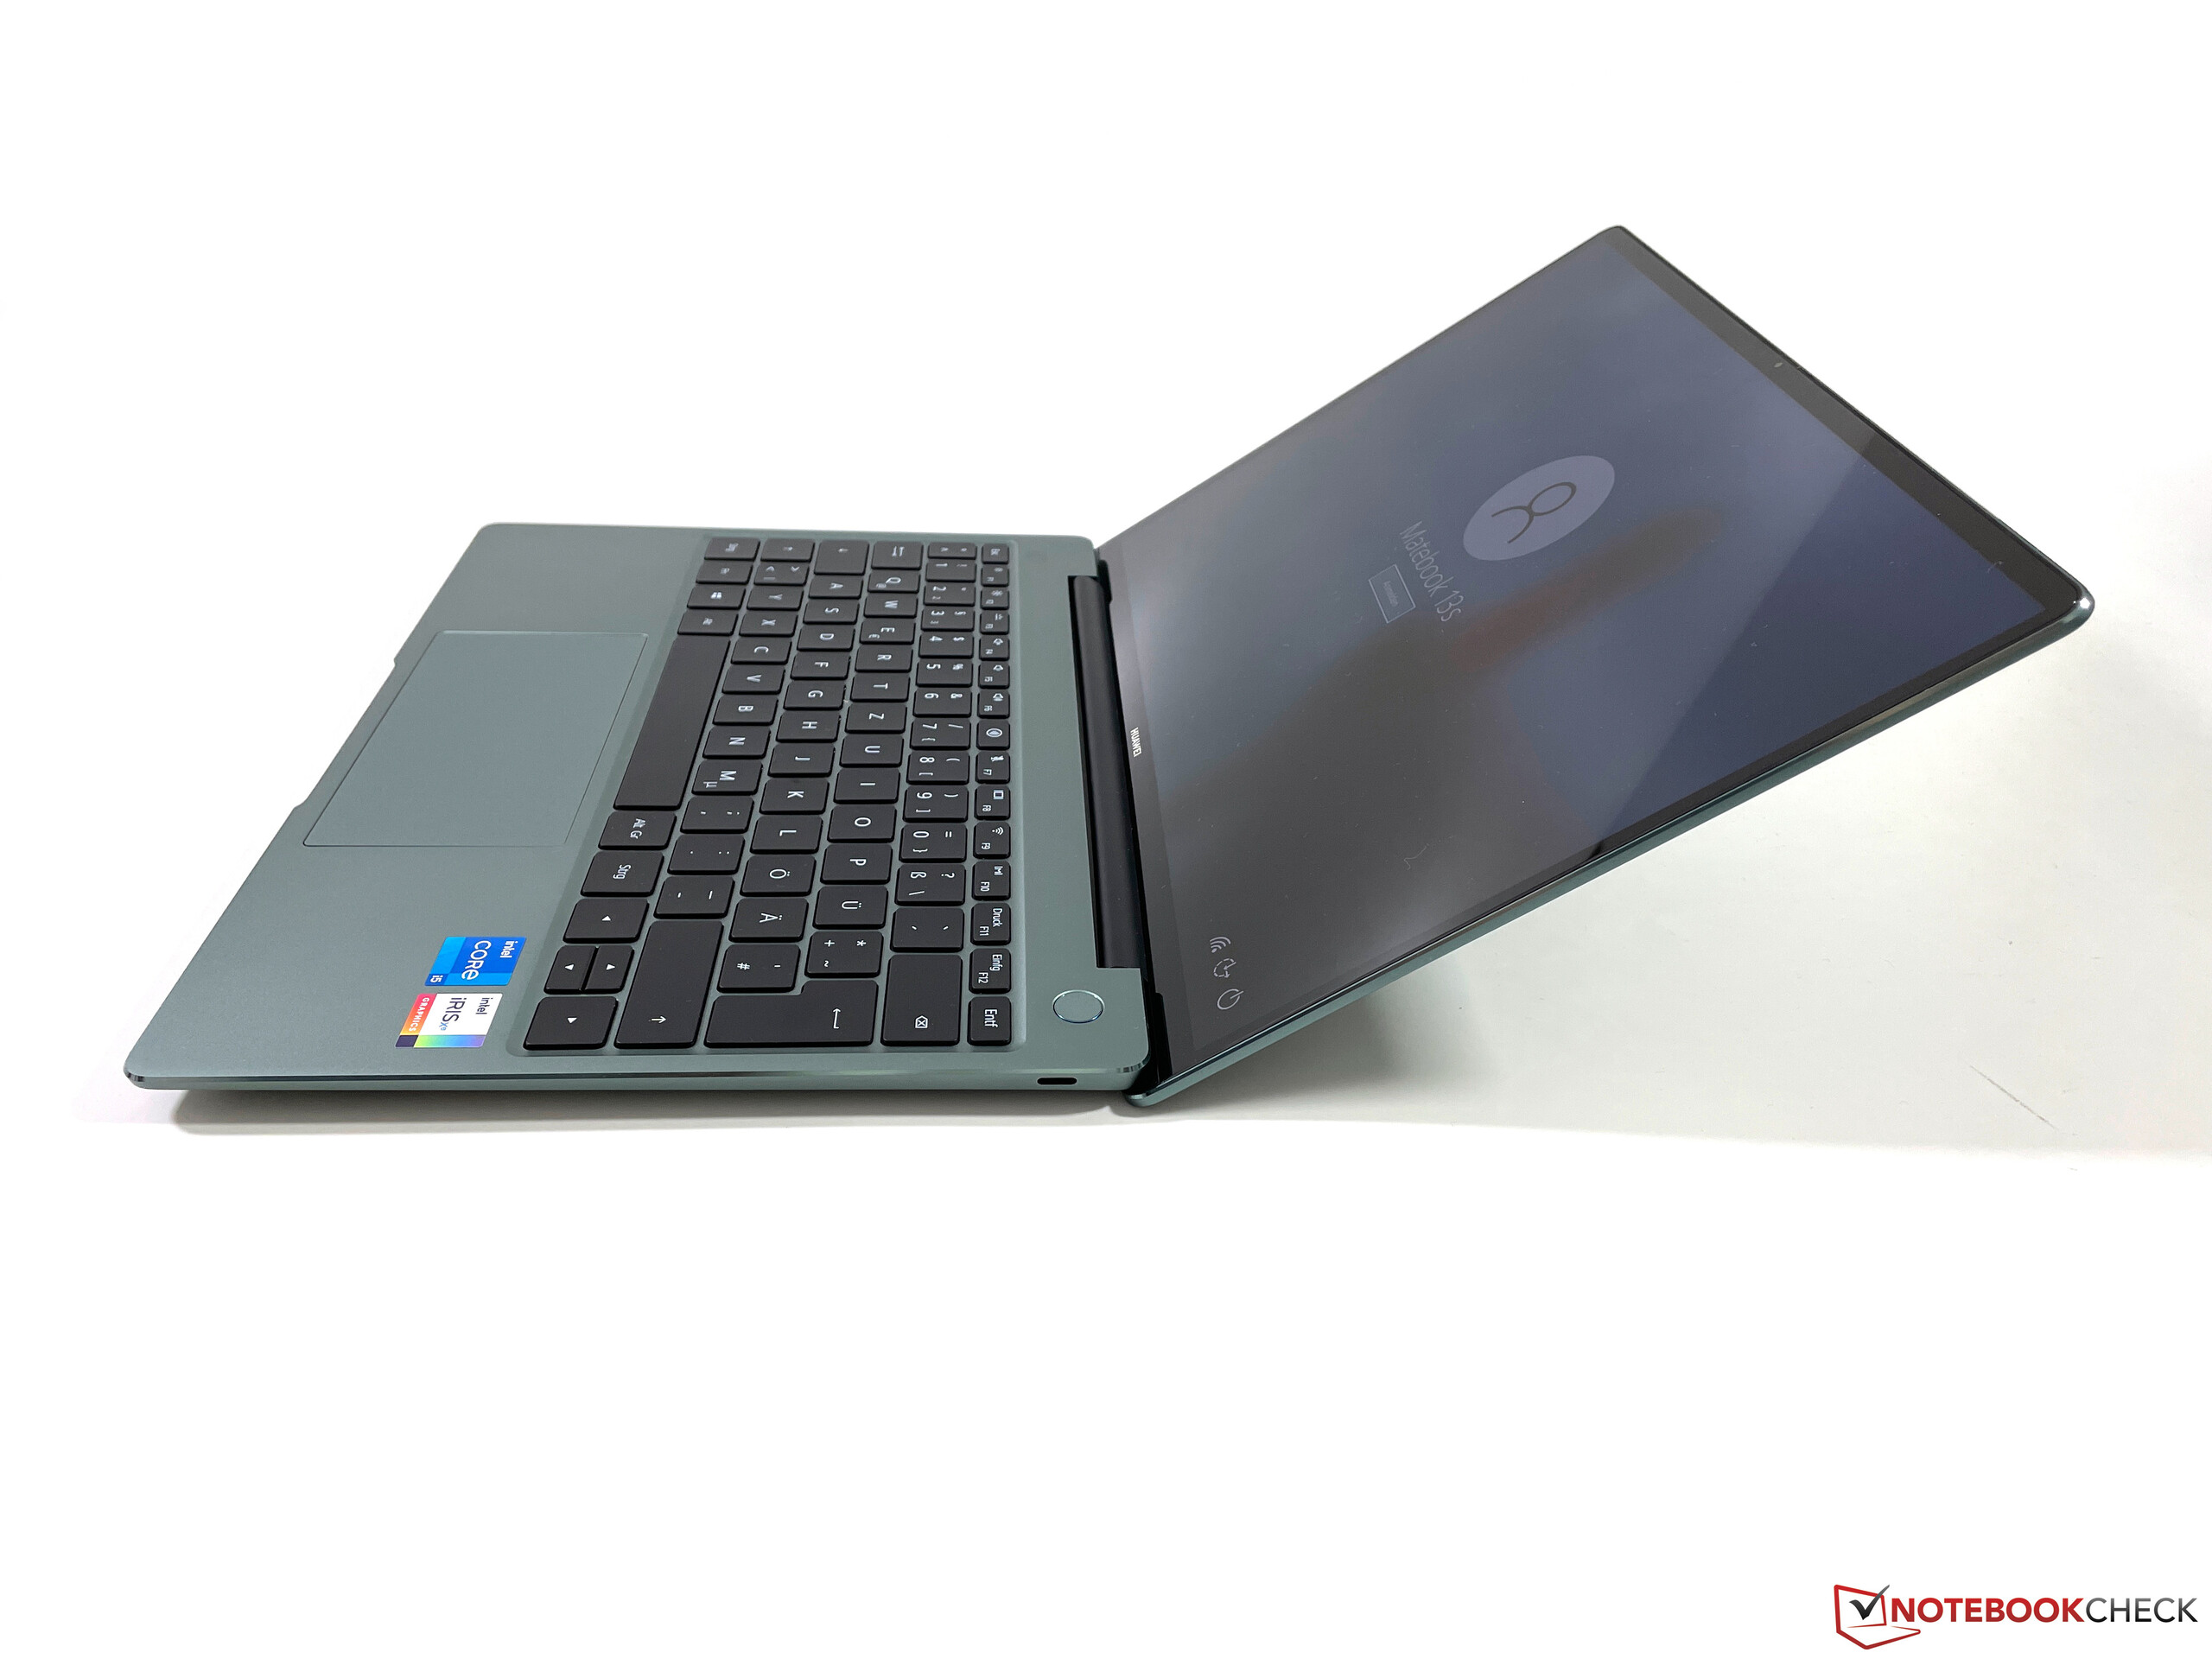
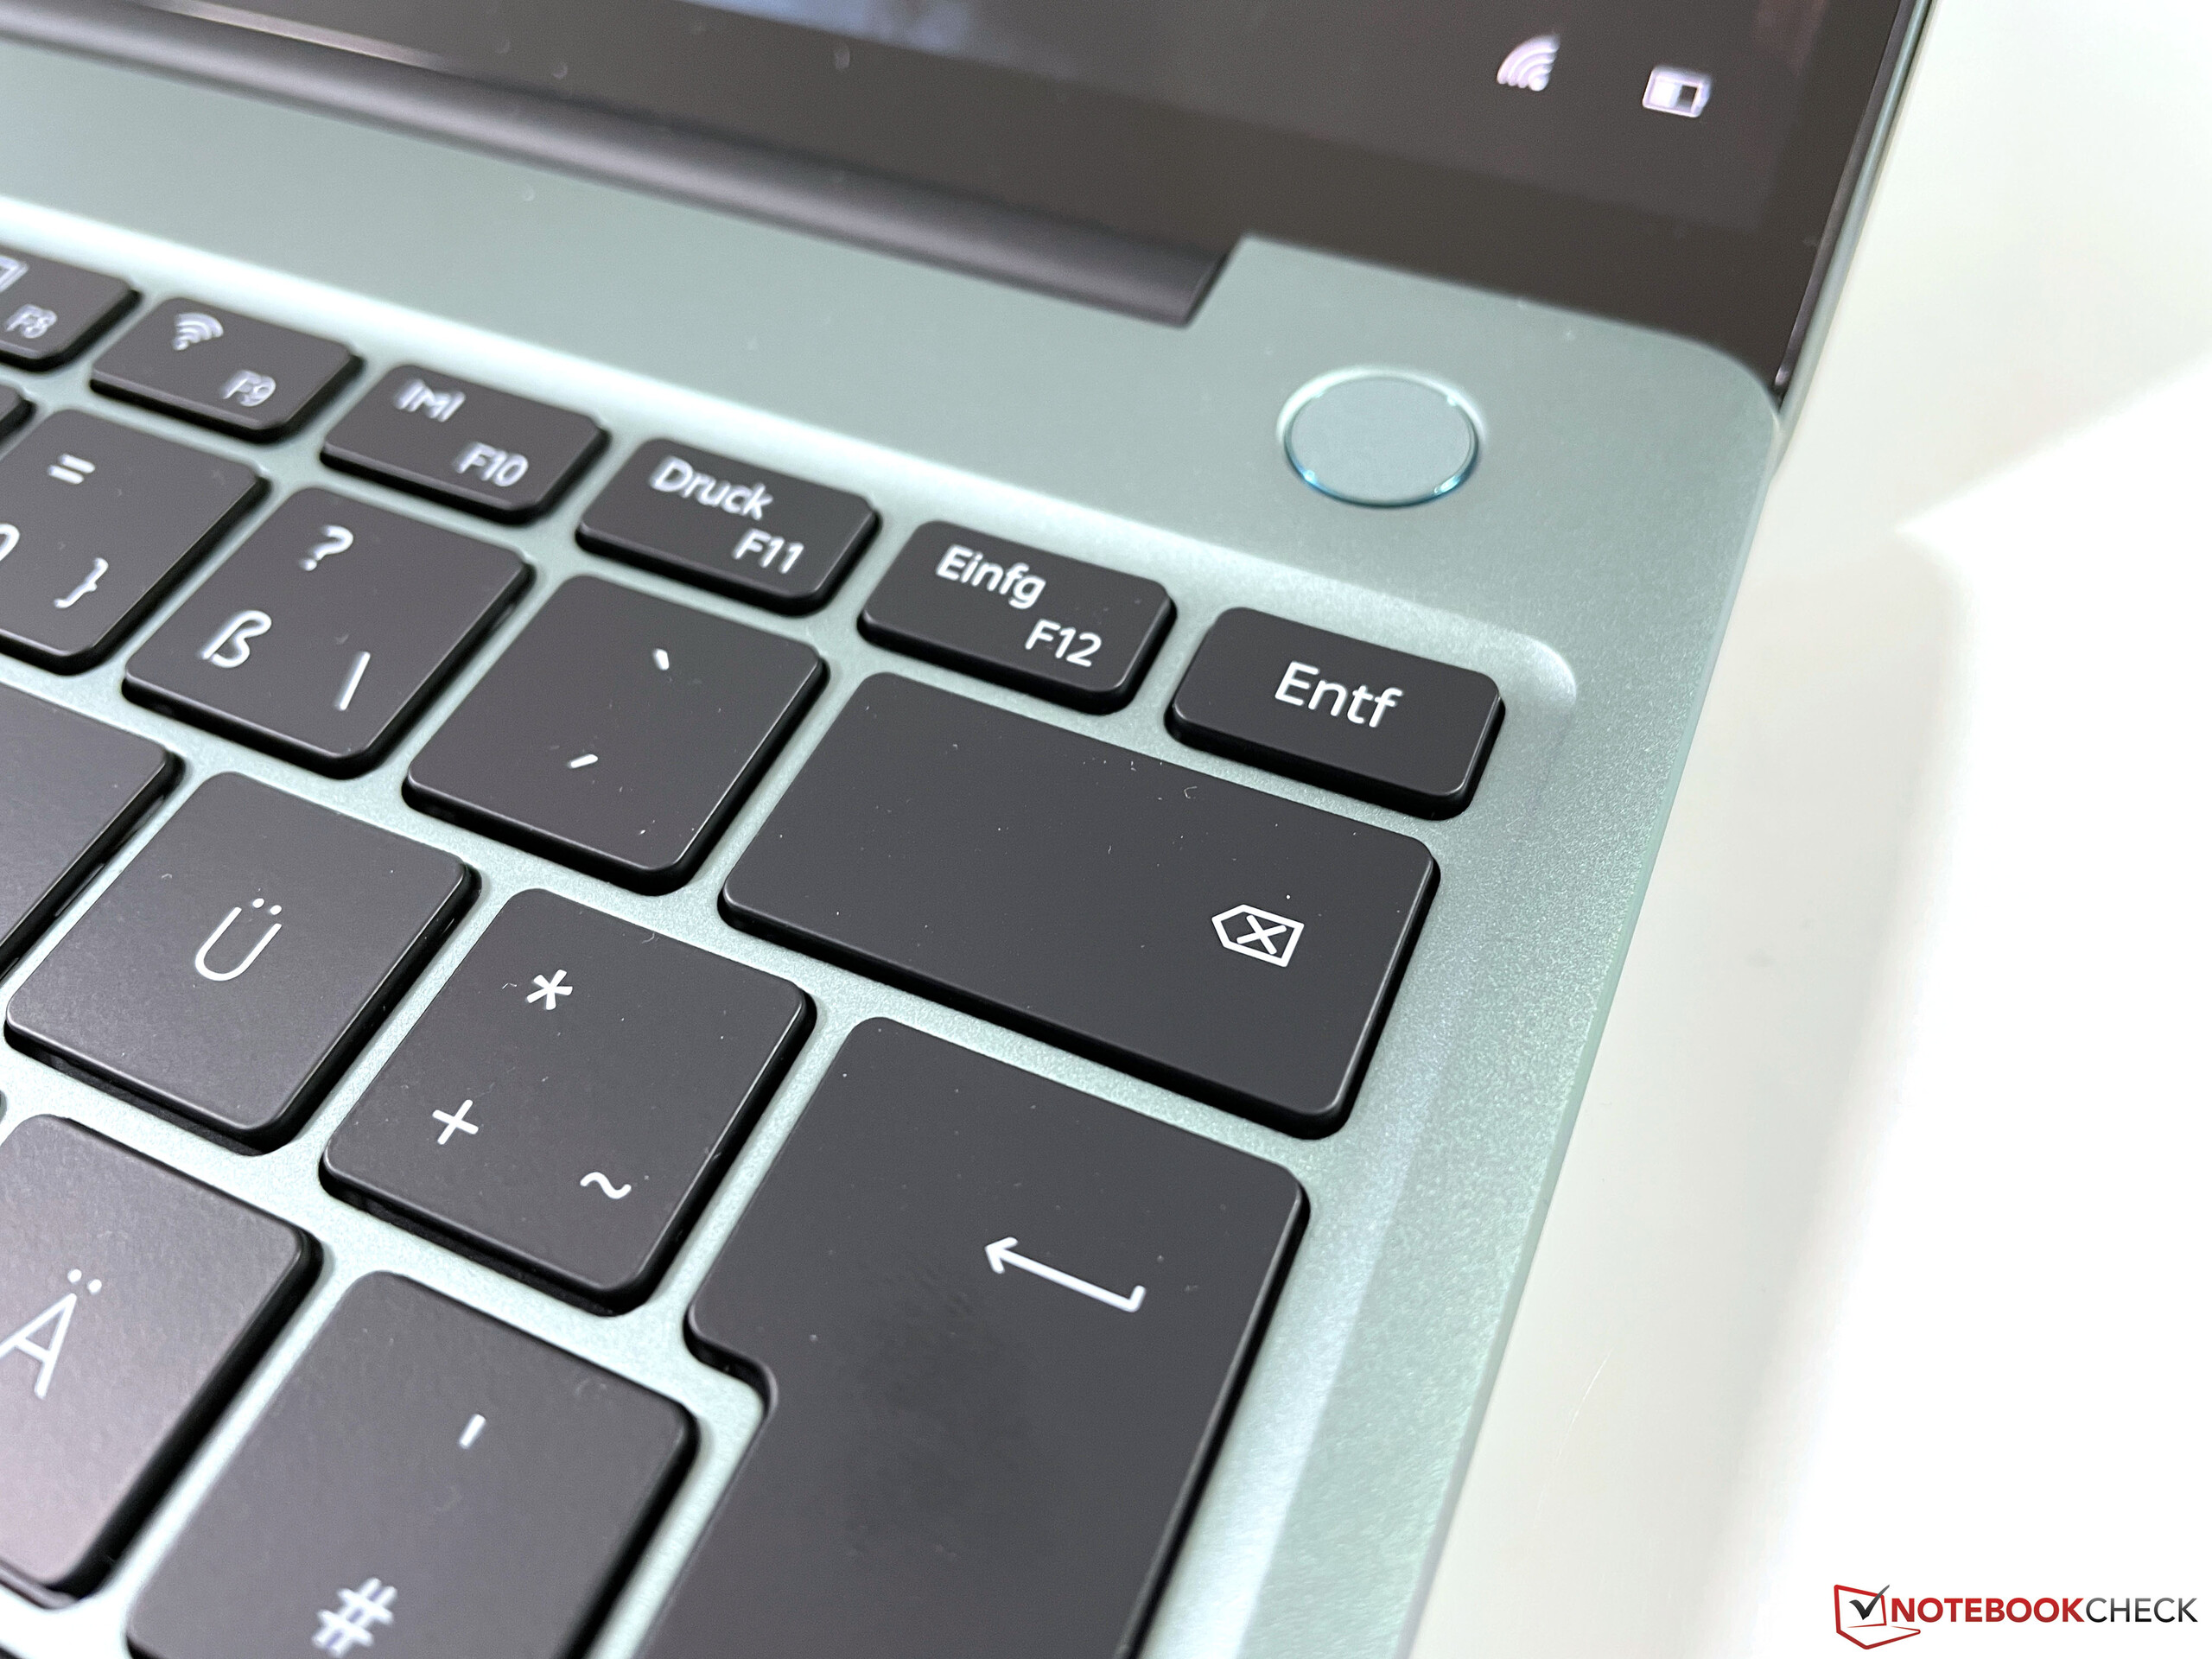
这款紧凑的设备在稳定性方面也令人信服;在很大的压力下,键盘台面仅有轻微弯曲,这也需要在屏幕上激起轻微的波纹。然而,这在实践中不应该是一个问题。华为很好地调整了中央铰链,它使显示屏在最大打开角度约为150度的情况下保持位置。由于基本单元前面的小压痕,打开盖子非常容易。带有指纹扫描仪的电源按钮(工作良好)位于键盘上方的右侧。
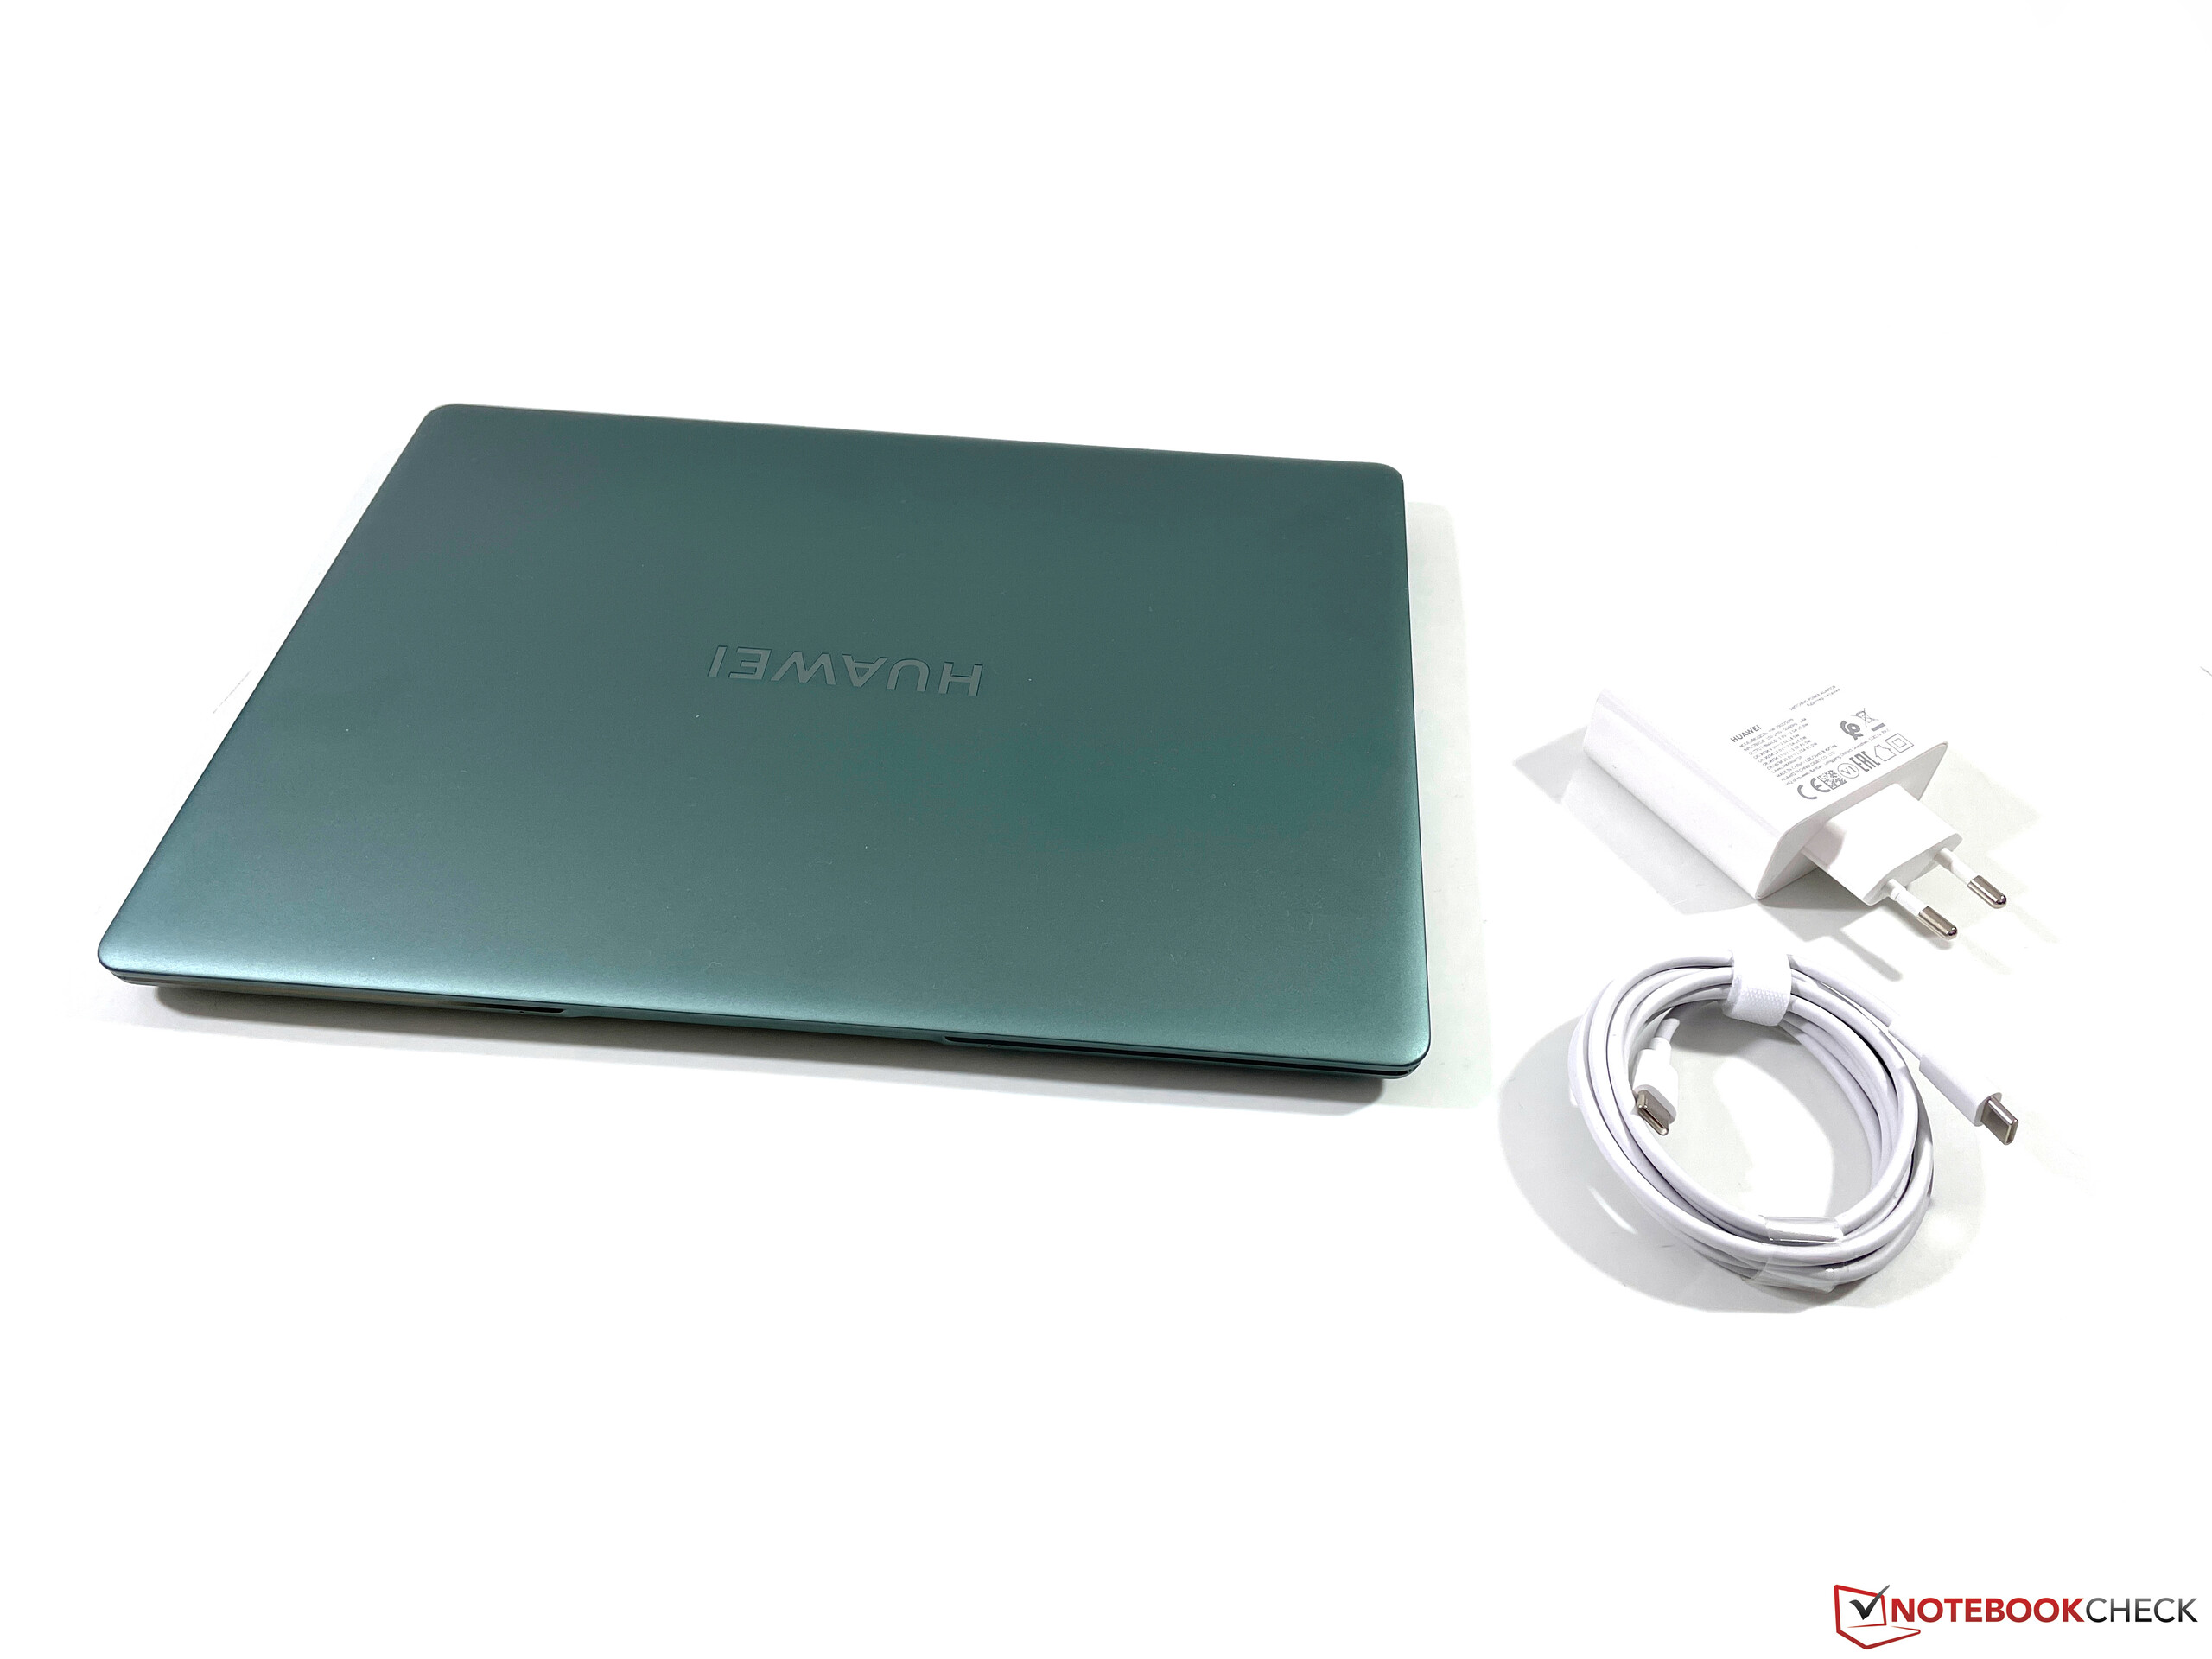
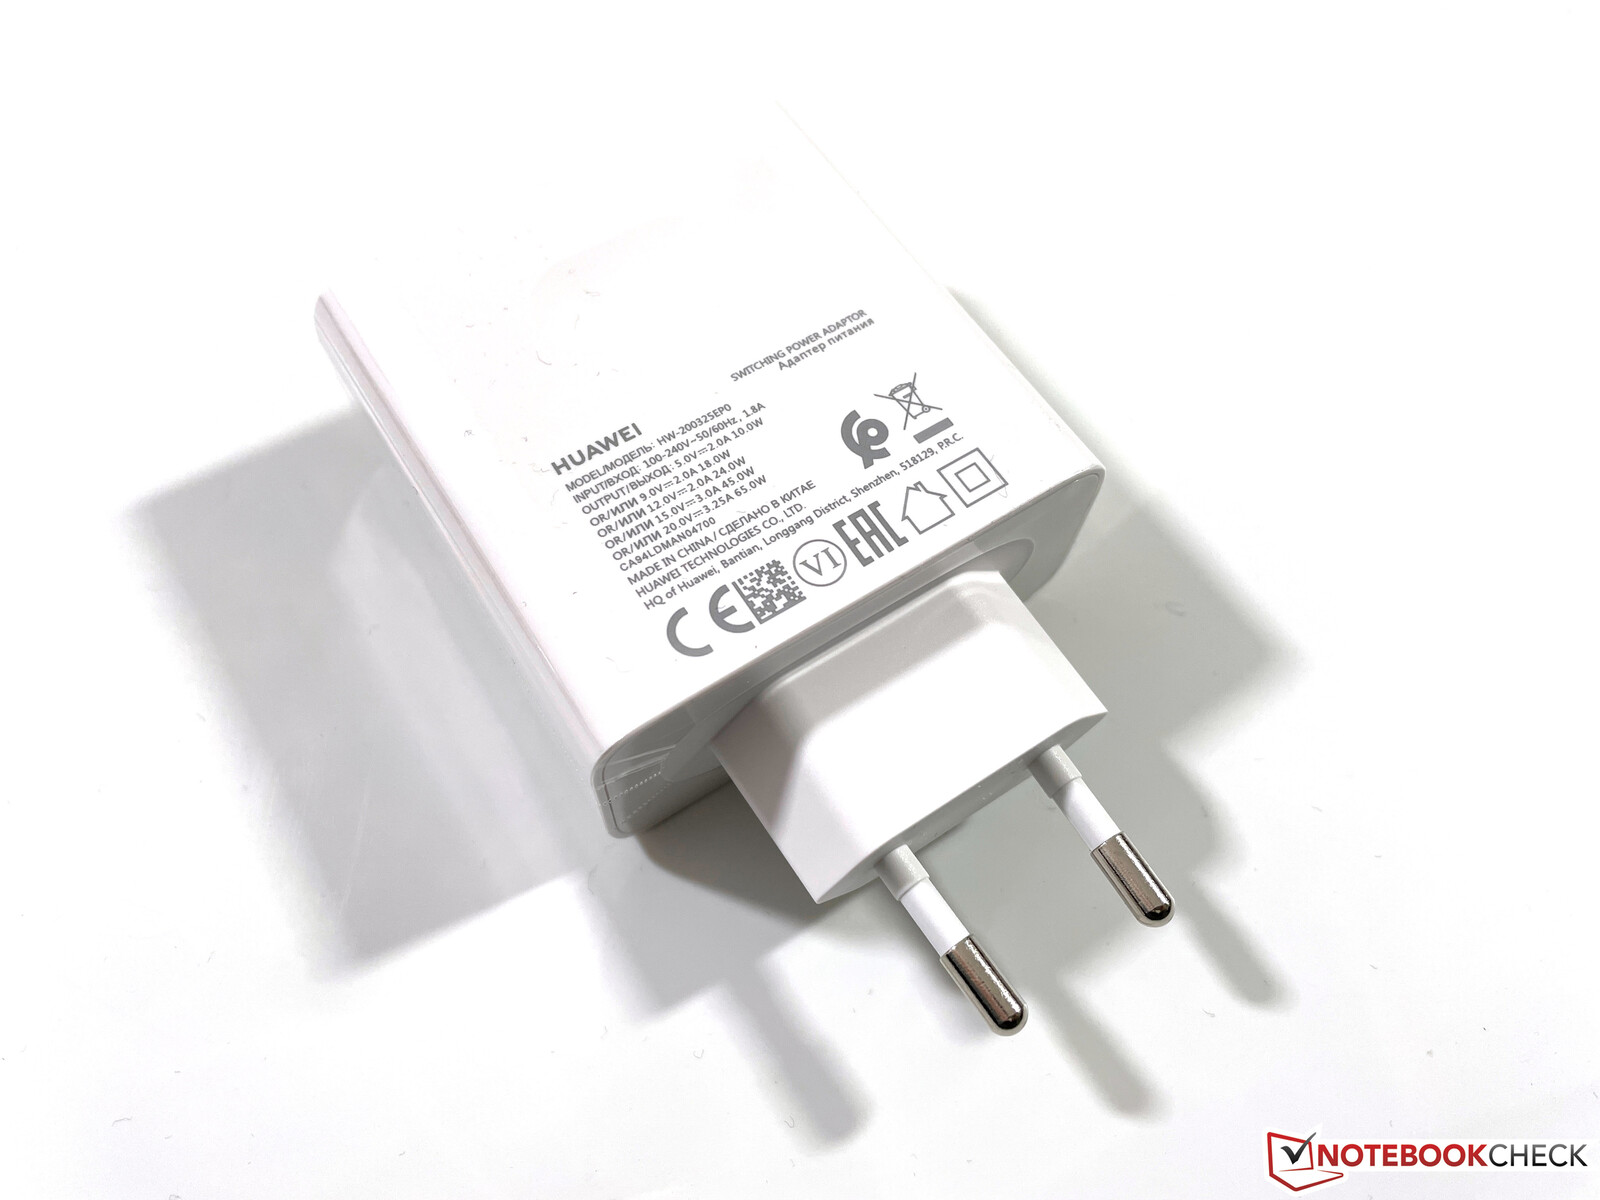
MateBook 13s的3:2纵横比屏幕导致其机箱比竞争对手更深,但更窄。然而,总体而言,竞争对手是相当相似的。重量略高于1.3公斤,电源适配器(含USB-C电缆)的重量为另外200克。
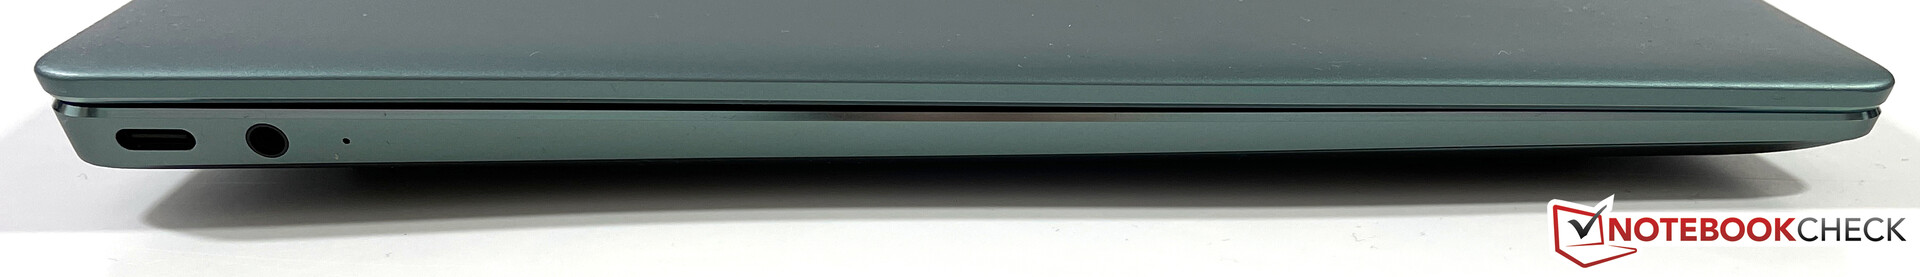
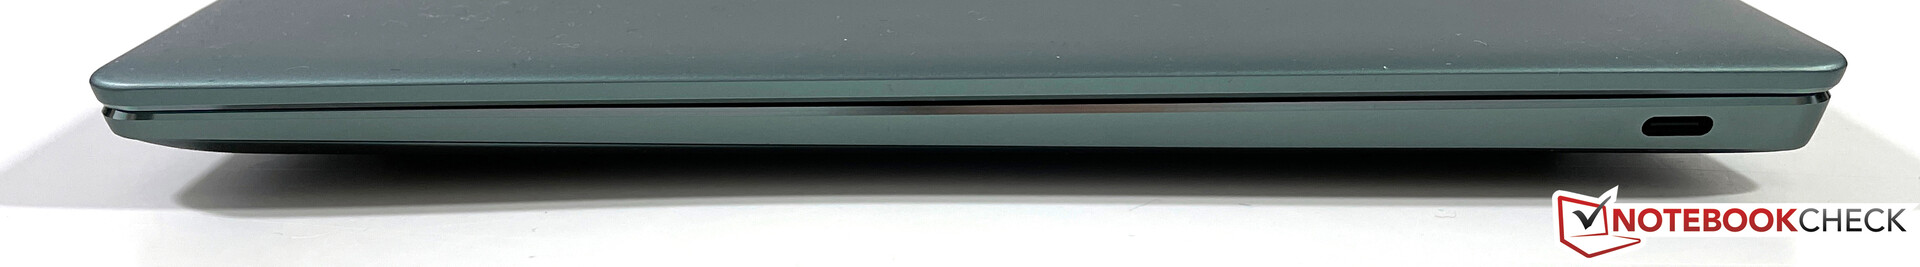
连接性 - 华为不支持Thunderbolt
这一部分我们发现,与其他国家相比,最大的区别在于MateBook 14s因为华为只为较小的MateBook 13s配备了两个USB-C端口,不支持Thunderbolt 4。这没有明显的技术原因,似乎制造商只是想节省许可费。然而,这两个端口都可以用来给电池充电和驱动外部显示器,所以在实践中应该不会有大规模的限制。不过,它不可能连接外部GPU。
沟通
Wi-Fi模块来自英特尔(AX201),支持Wi-Fi 6标准以及蓝牙5.1。我们用参考路由器Netgear RAX120进行的Wi-Fi测试确定了接收数据时非常好的传输率,但传输性能比预期的要低一点。没有WWAN模块(LTE或5G)。无论是使用Wi-Fi 6路由器还是使用FritzBox 7490(Wi-Fi 5),信号质量都很稳定。
网络摄像头
网络摄像头不再隐藏在键盘内,而是回到了显示屏上方的常规位置。这当然不那么安全,也没有机械快门,但网络摄像头的角度不再扭曲。不过它仍然是一个720p的传感器,这意味着图片质量仍然很差。


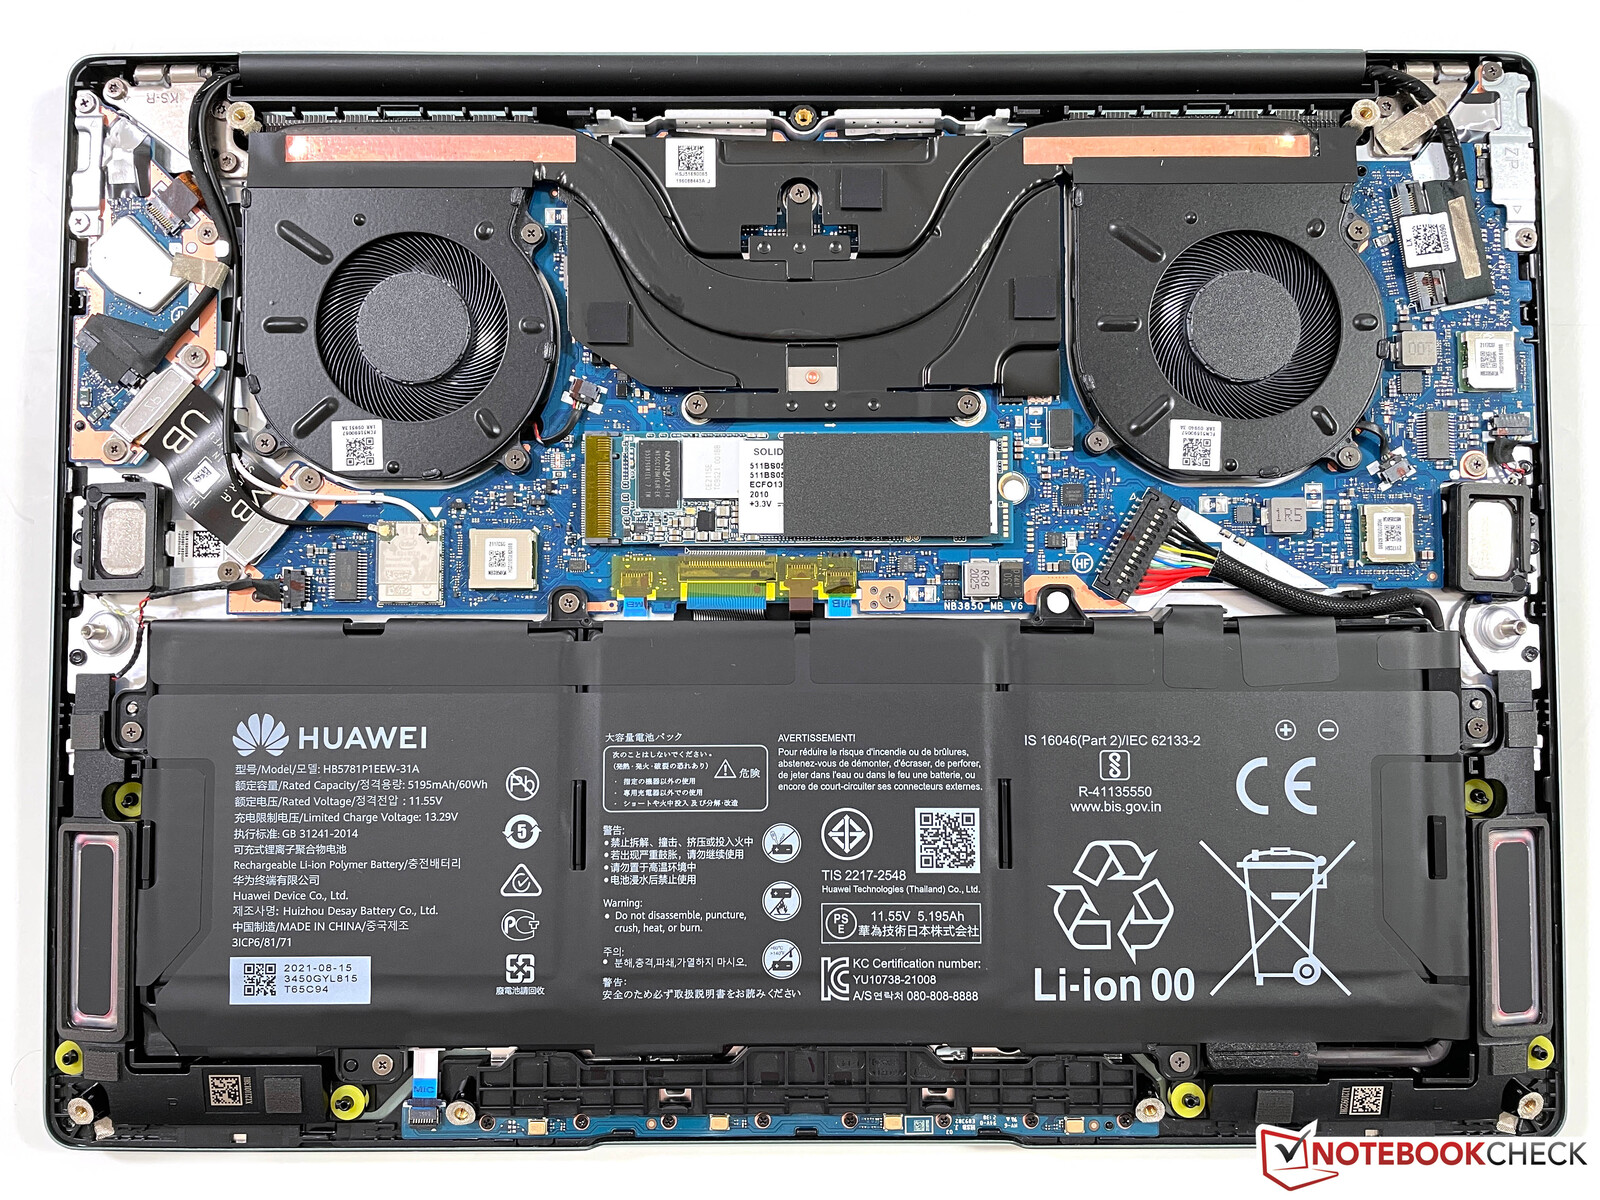
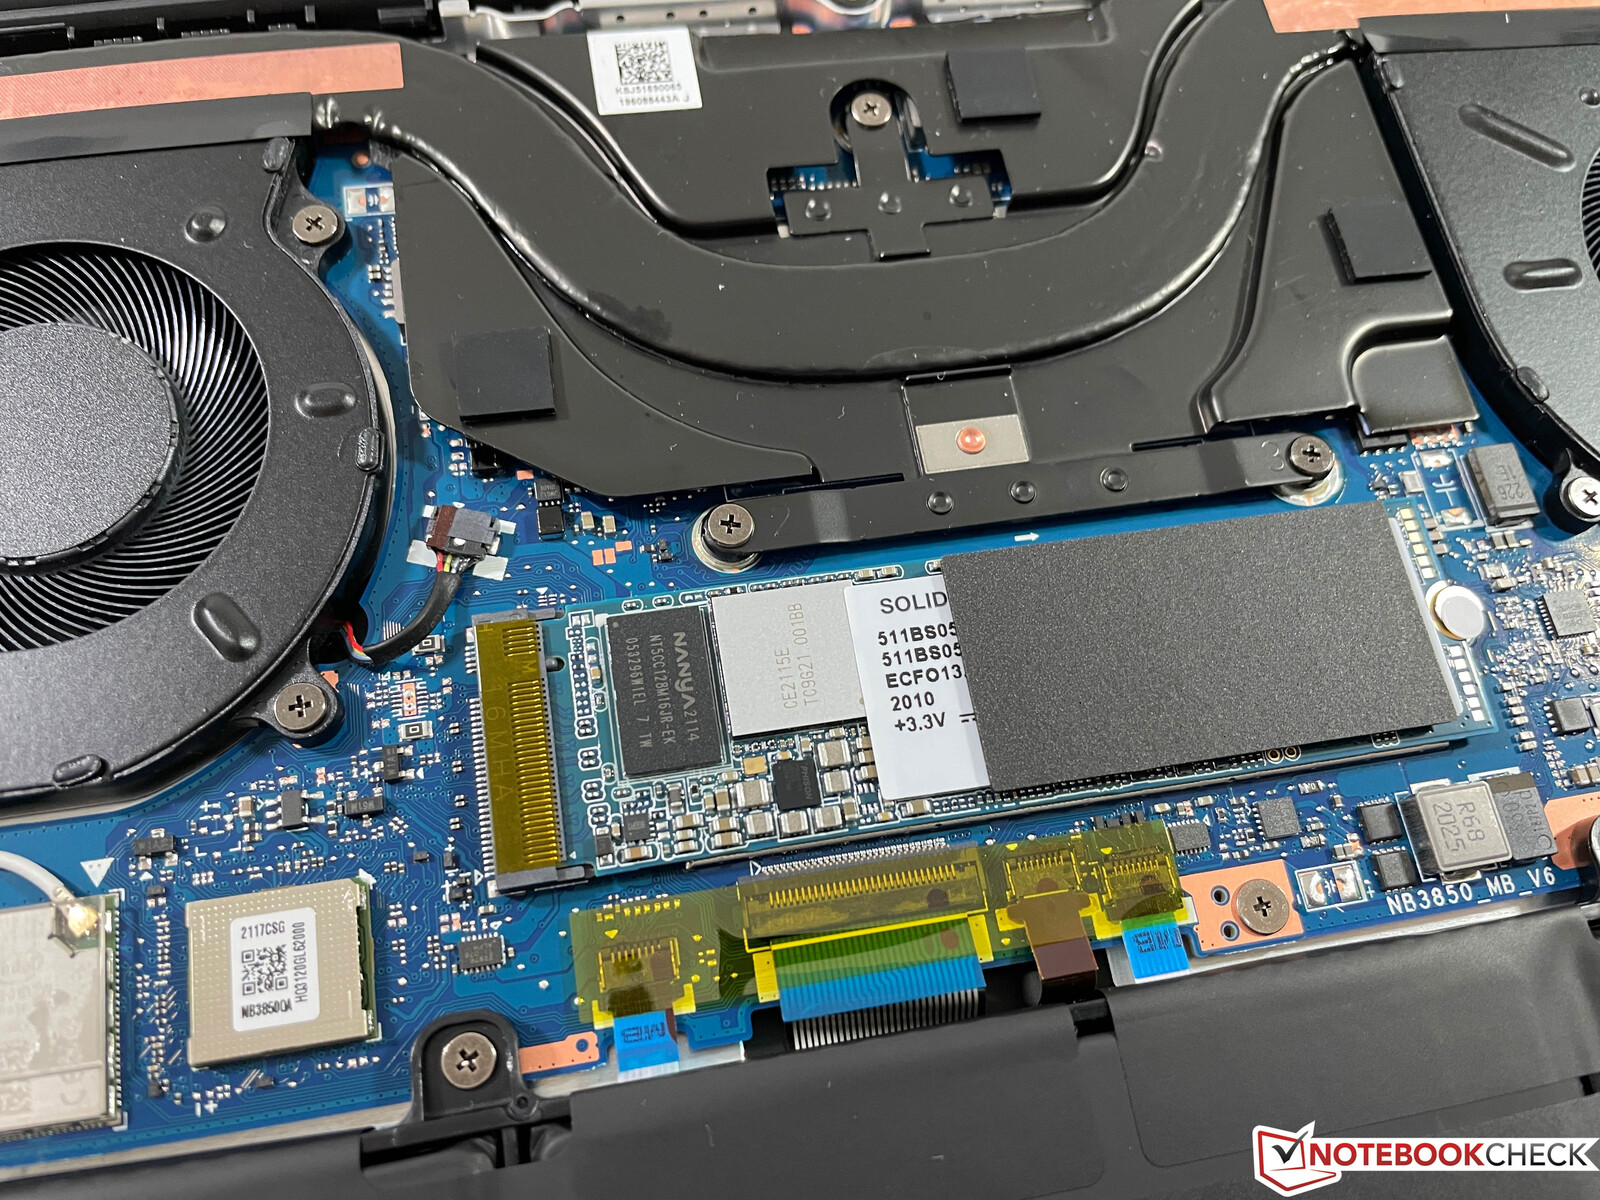
维护
底部机箱面板由多个Torx螺钉(T5)固定,很容易拆卸。然而,许多元件都焊接在主板上,你只能清洁风扇和更换M.2-2280固态硬盘。
输入设备 - MateBook 13s,键程1.5毫米
键盘
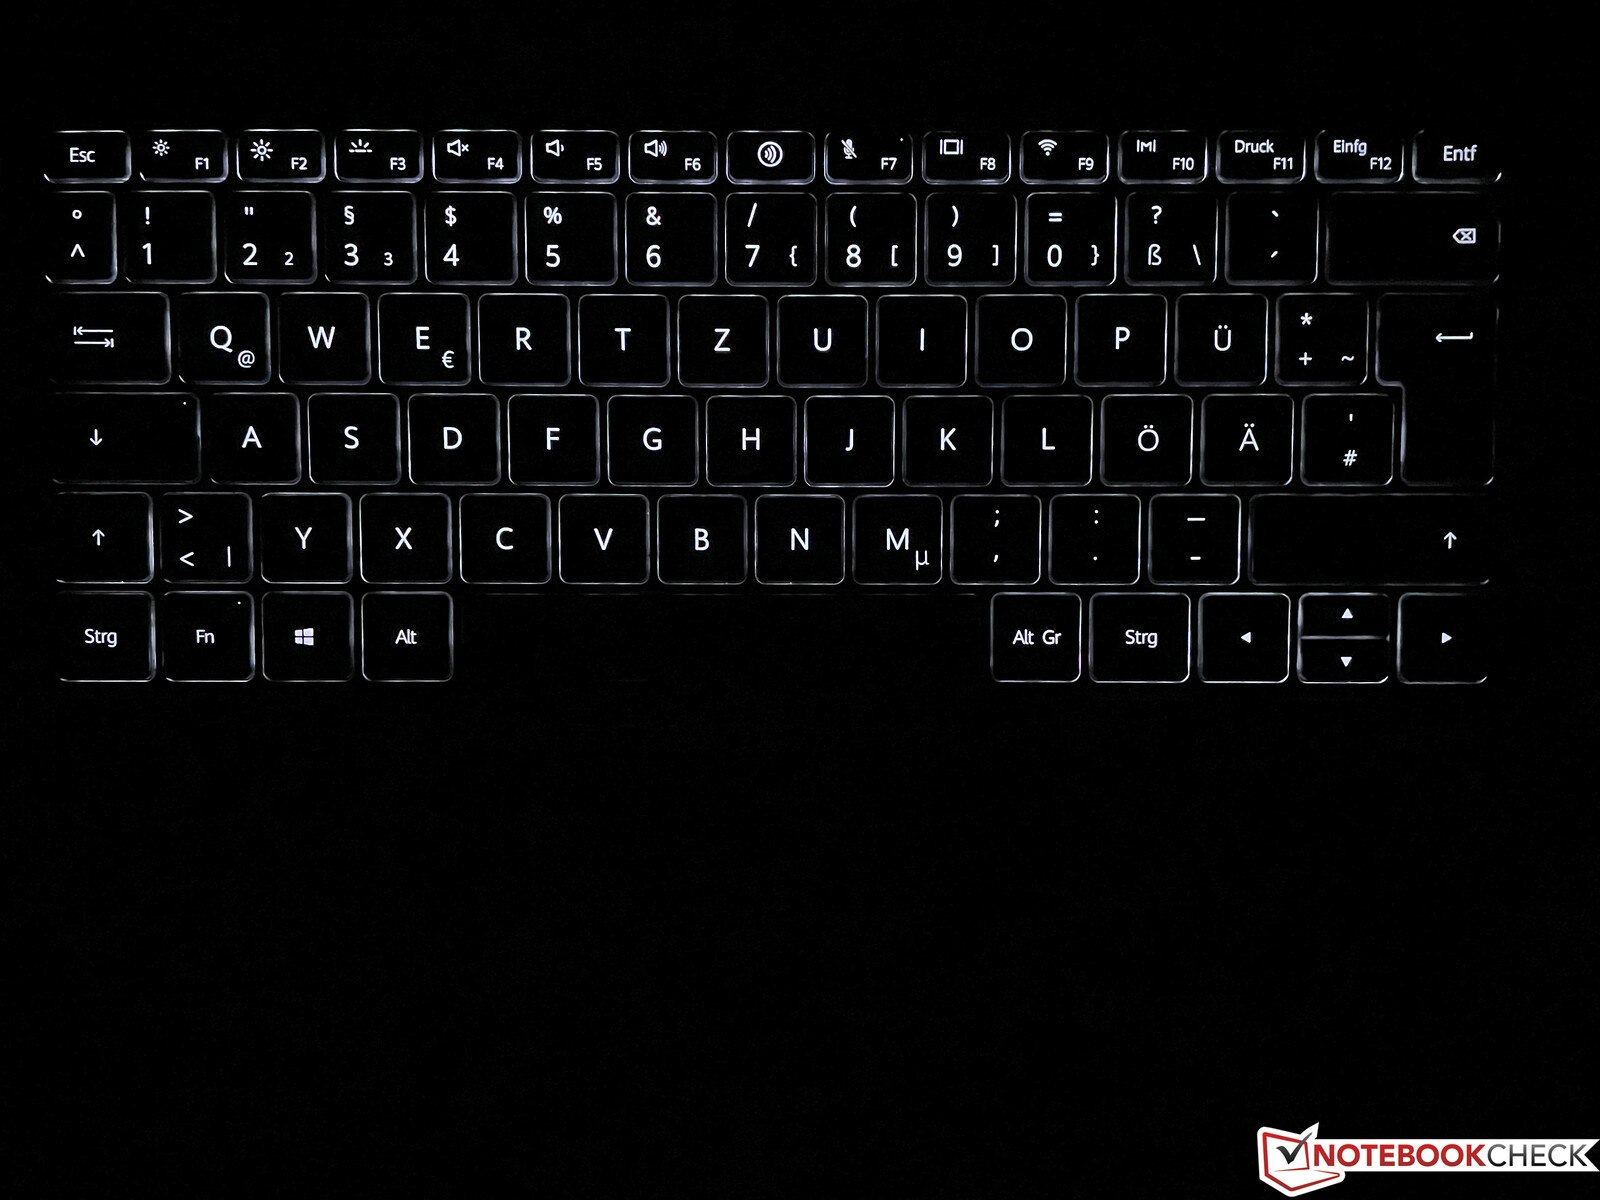
如前所述,该键盘与较大的MateBook 14s因此,较小的13s也获得了1.5毫米的慷慨的键程。结合精确的压力点,打字体验非常舒适,打长文也没有问题。只有空格键有一点颤动,而且垂直方向键相当小,但除此之外,这种布局不需要任何学习期。黑色的按键与白色的字体形成了良好的对比,两级白色照明使你在较暗的环境中也能轻松打字。你可以在华为的PC管理器中舒适地调整持续时间(或停用前的时间)。
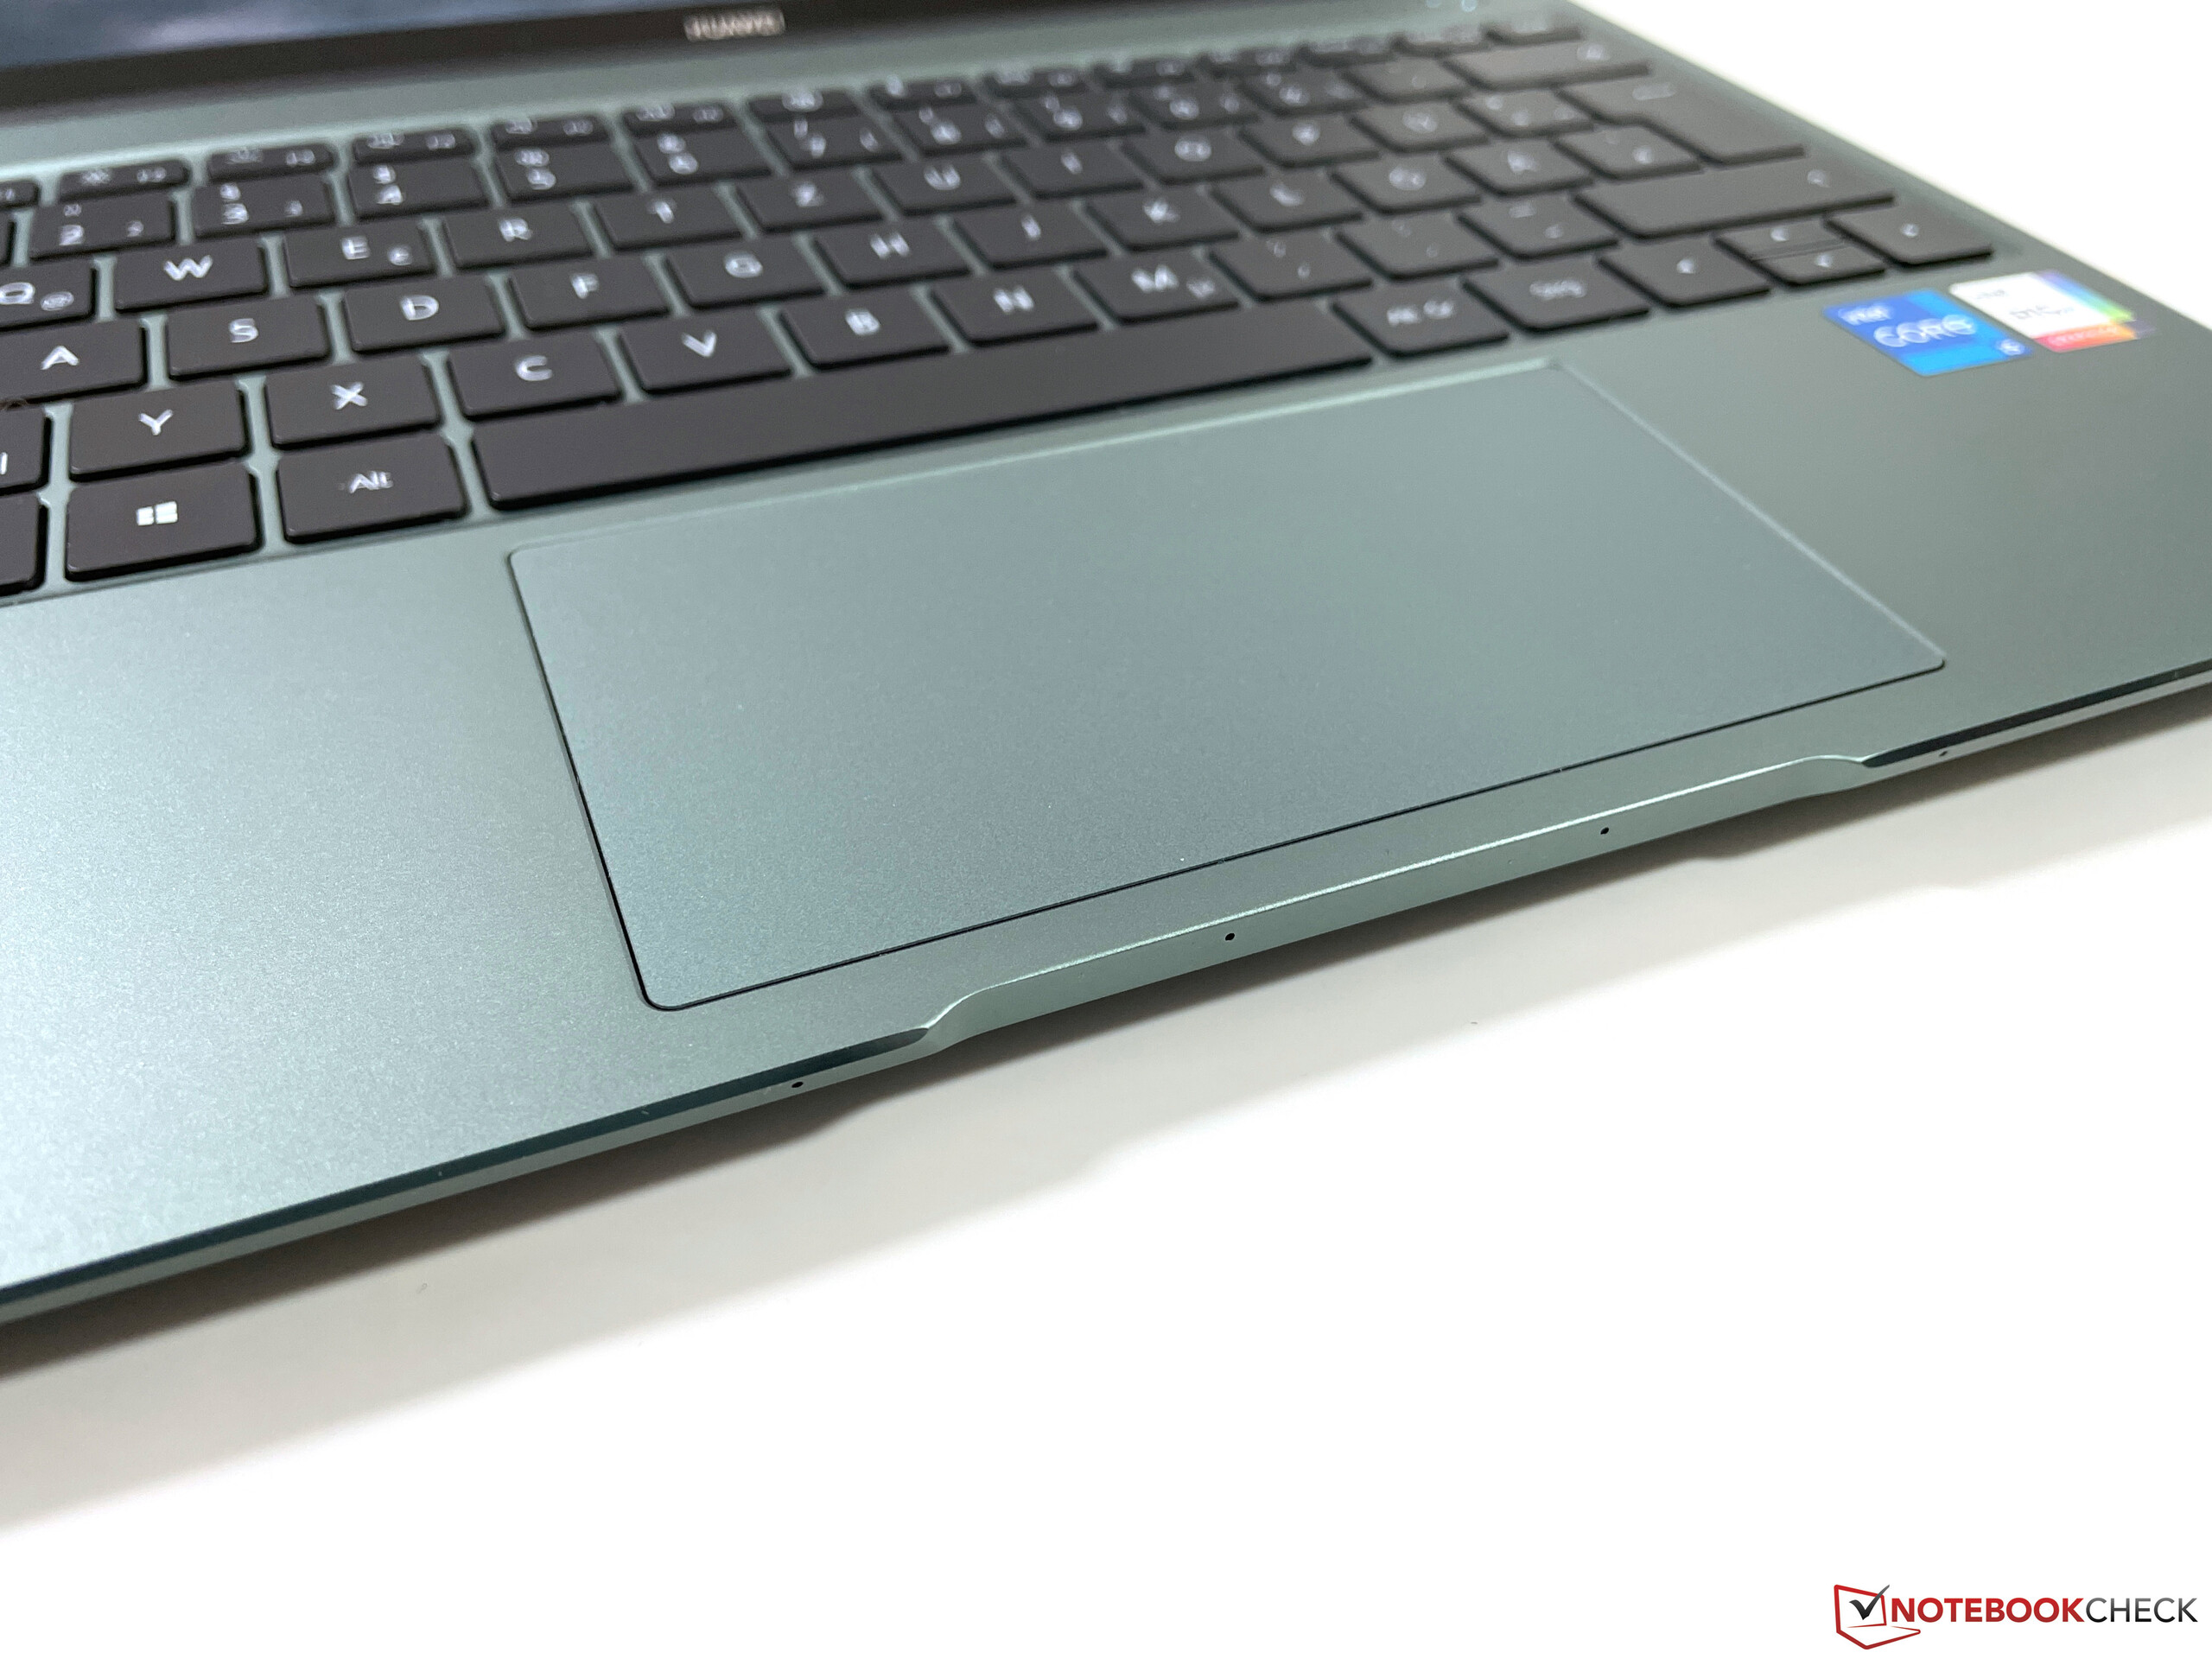
触摸板和触摸屏
由于机箱更加紧凑,点击板的高度比14英寸型号的要小,为12 x 6.4厘米。光滑表面的滑行能力非常好,光标移动效果很好,就像用最多四个手指做手势一样。你可以在下半部分用物理方式点击垫子,但这导致了相当响亮和廉价的点击声。你也可以使用电容式触摸屏进行输入,其效果与预期的一样。
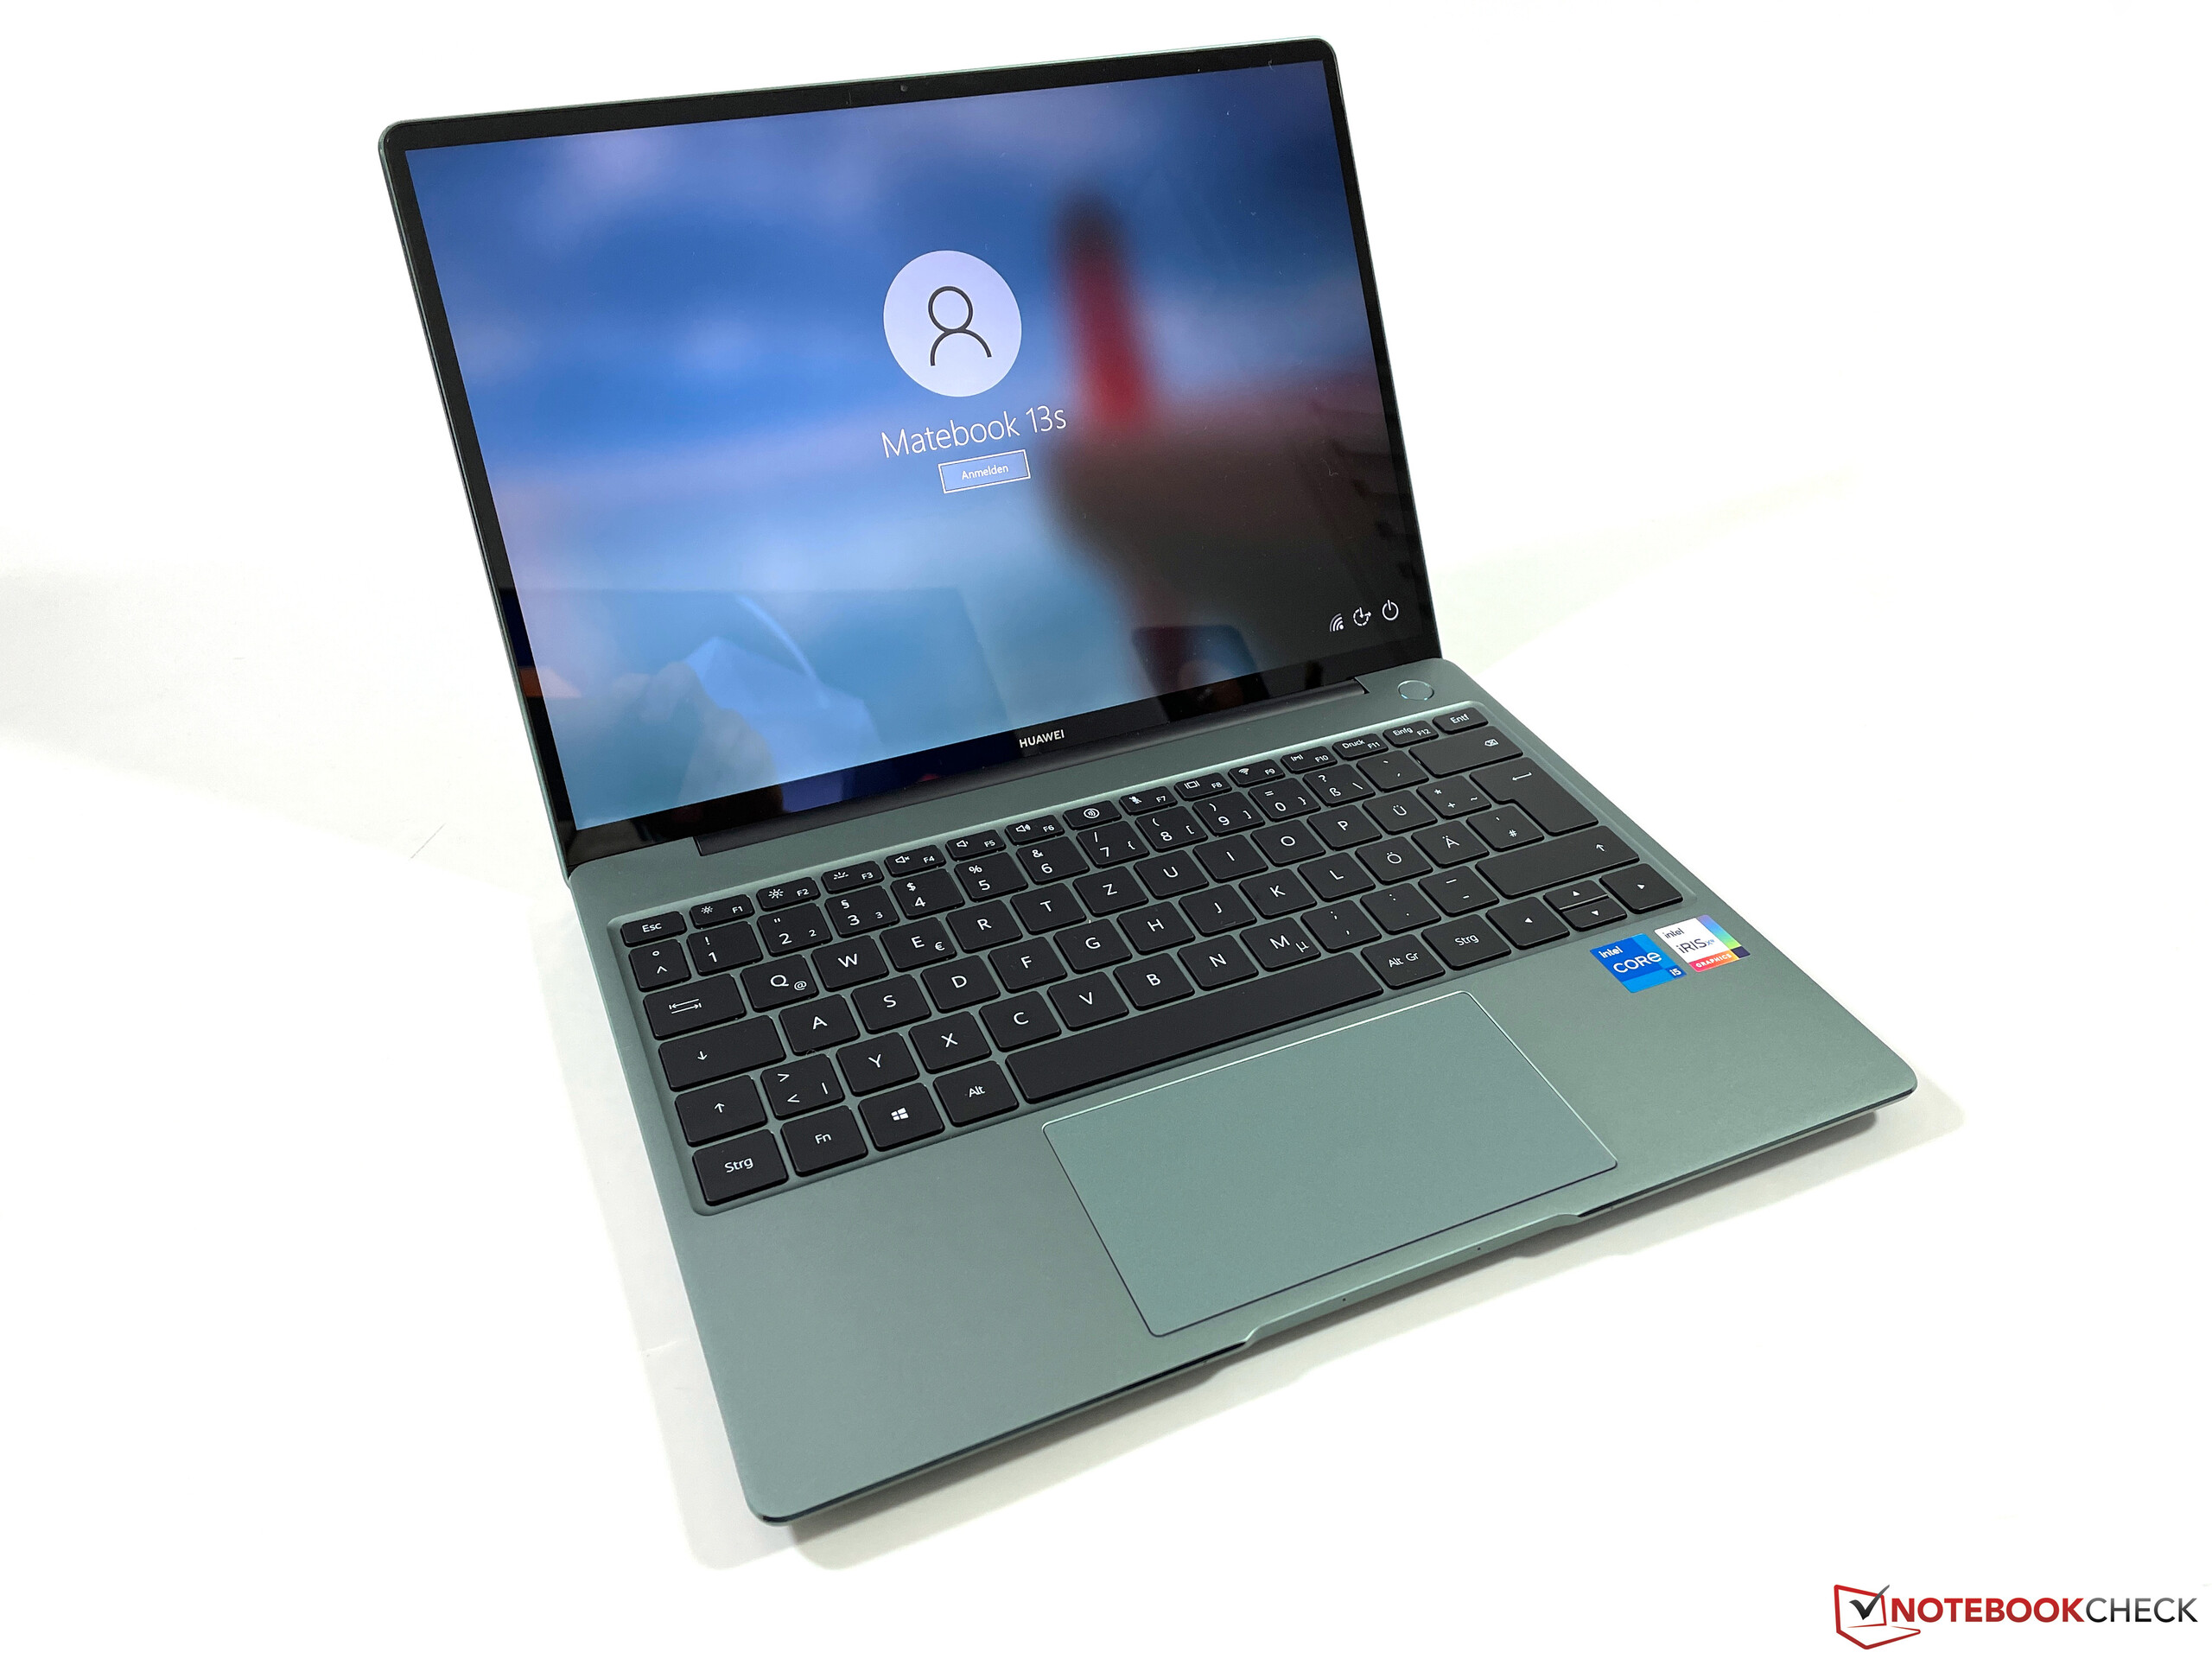
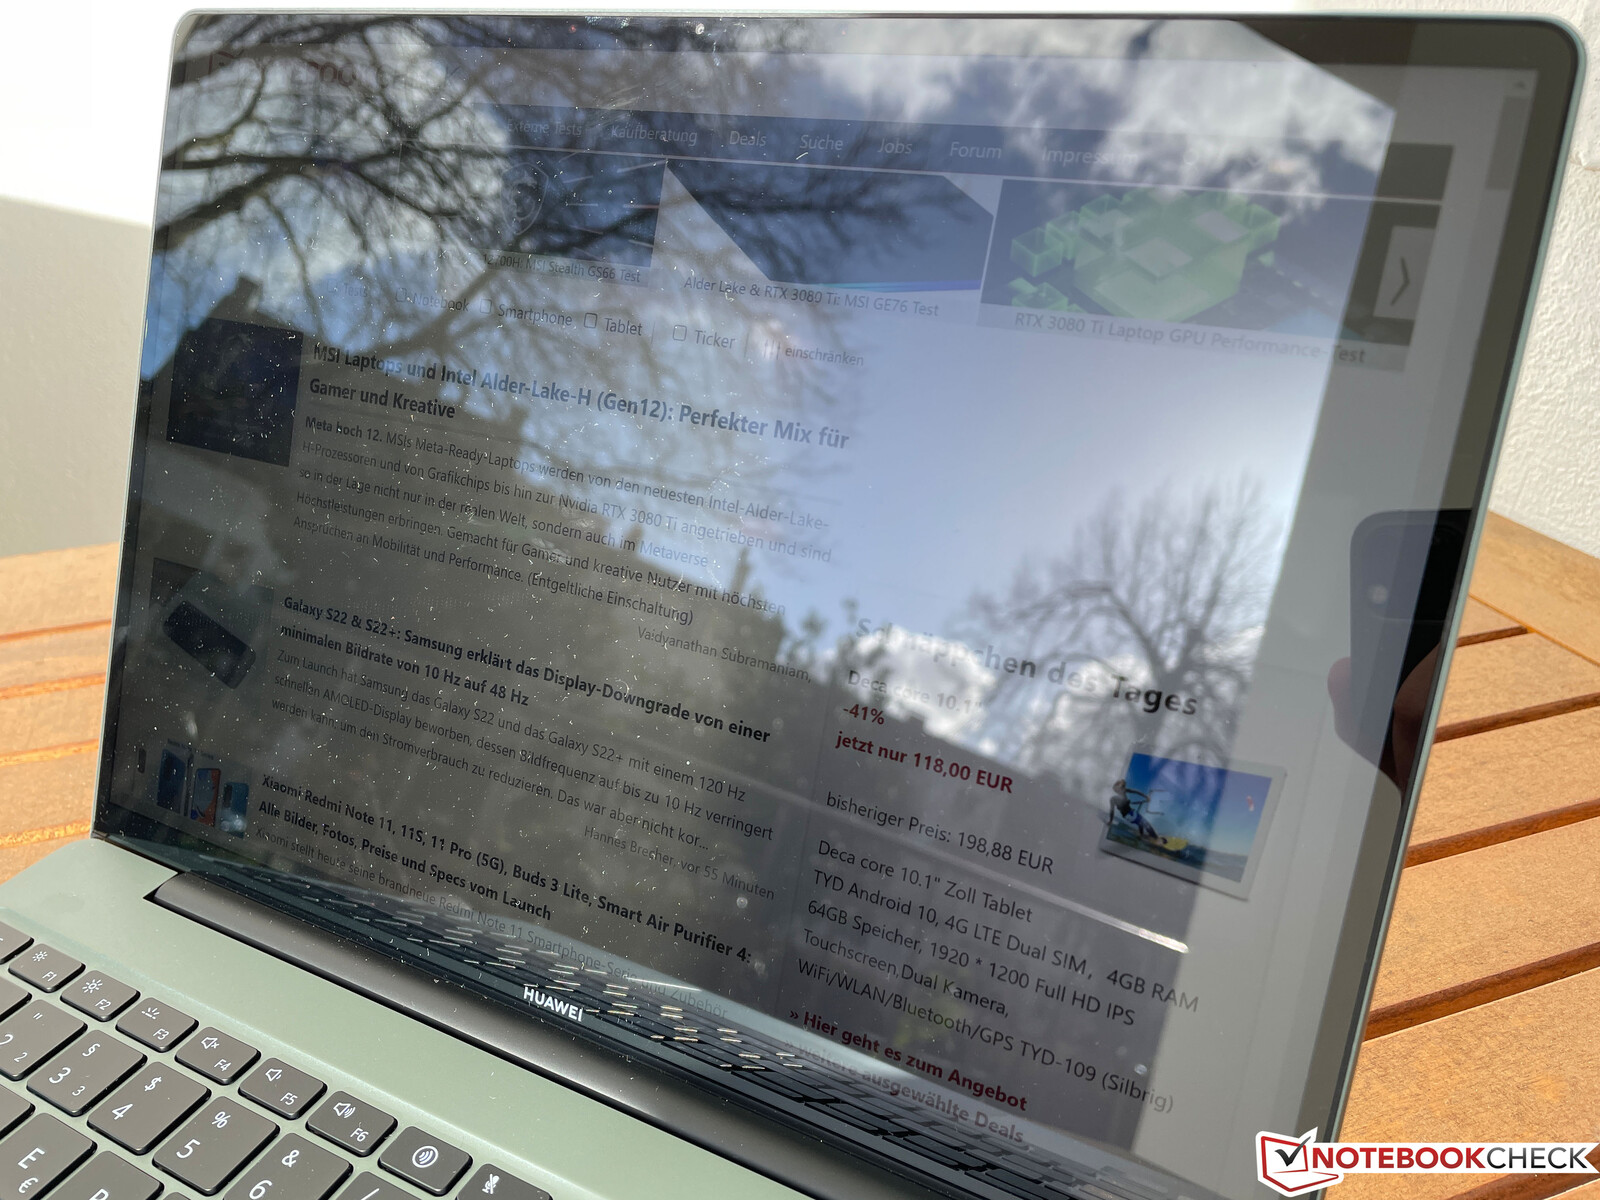
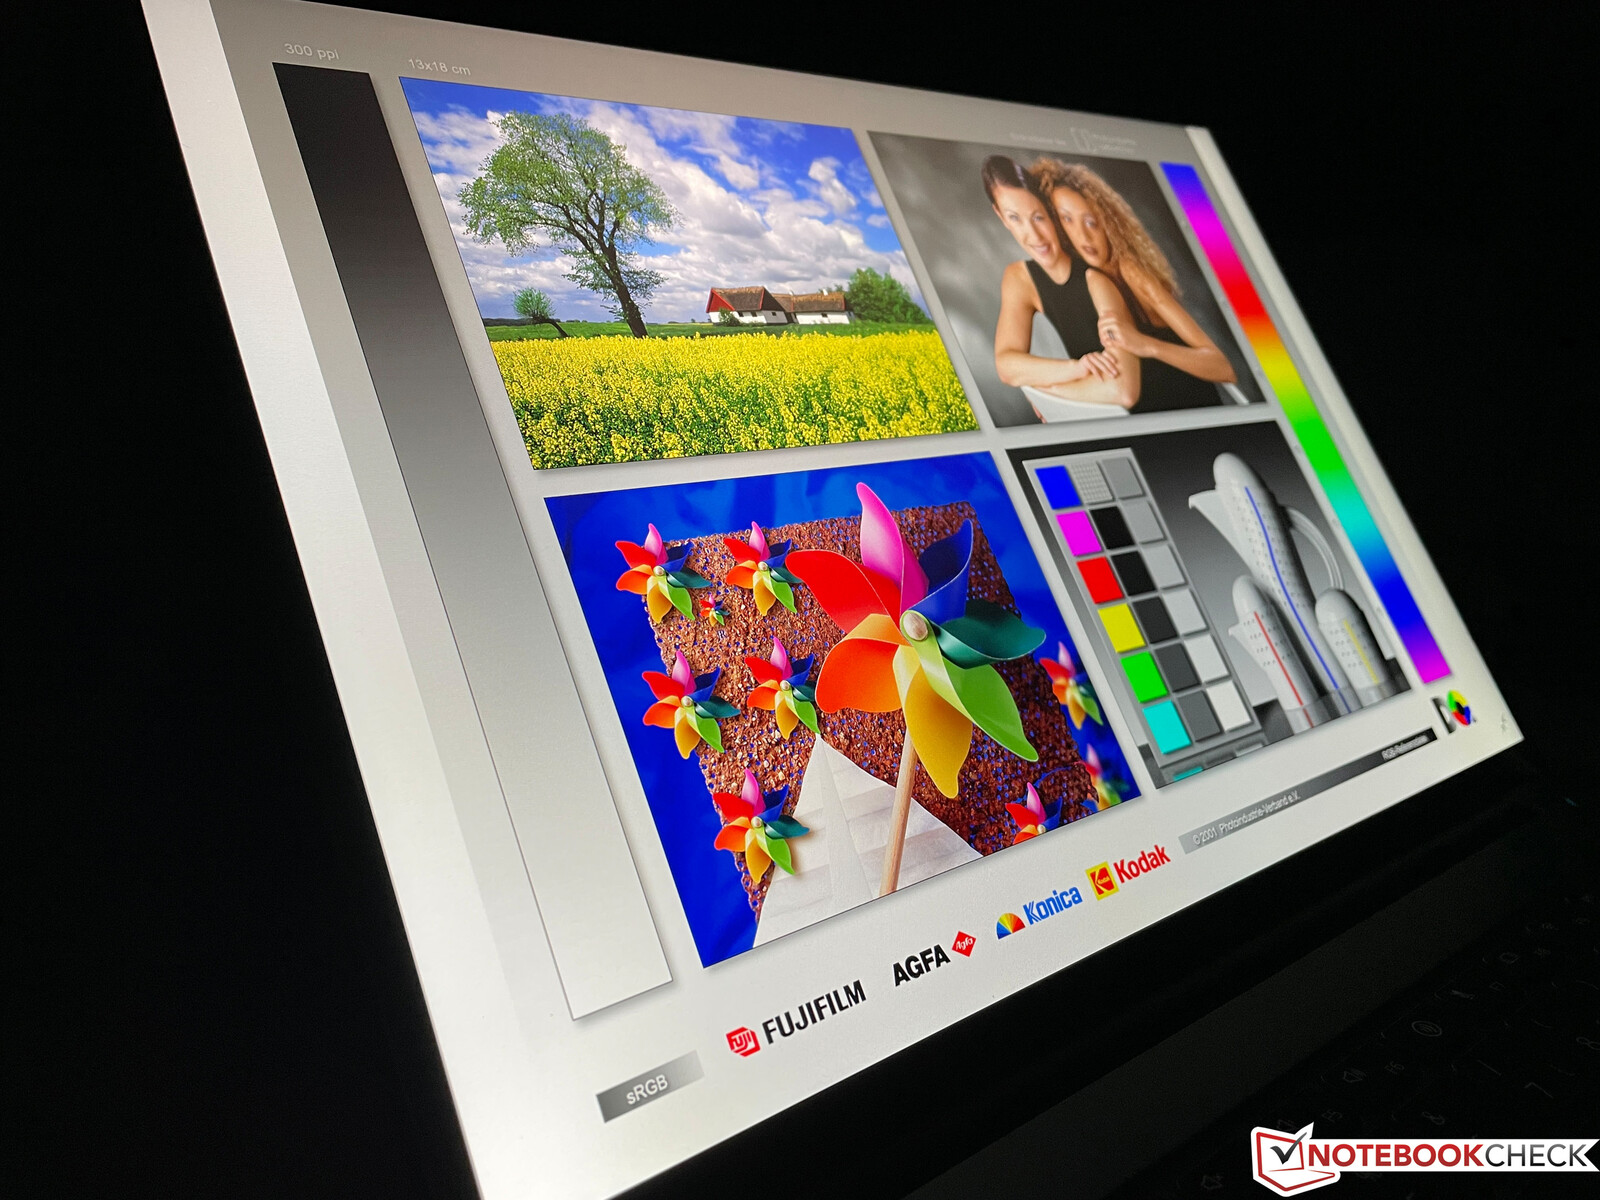
显示屏 - MateBook 13s,90赫兹和3:2长宽比
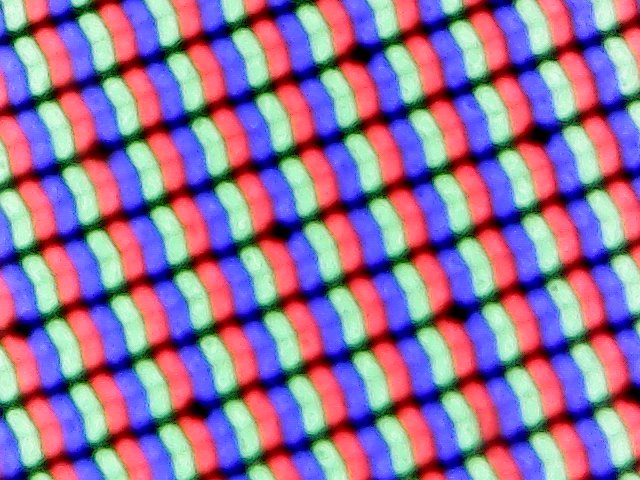
华为使用了所谓的LTPS面板(低温聚硅氧烷),这使得像素密度更高,因此分辨率也更高。纵横比为3:2的13.4英寸屏幕的分辨率为2520 x 1680像素,像素密度为226 ppi。光面屏幕的主观画面印象非常好;所有内容都非常清晰,色彩丰富。由于集成了亮度传感器,亮度可以根据环境照明自动调整。
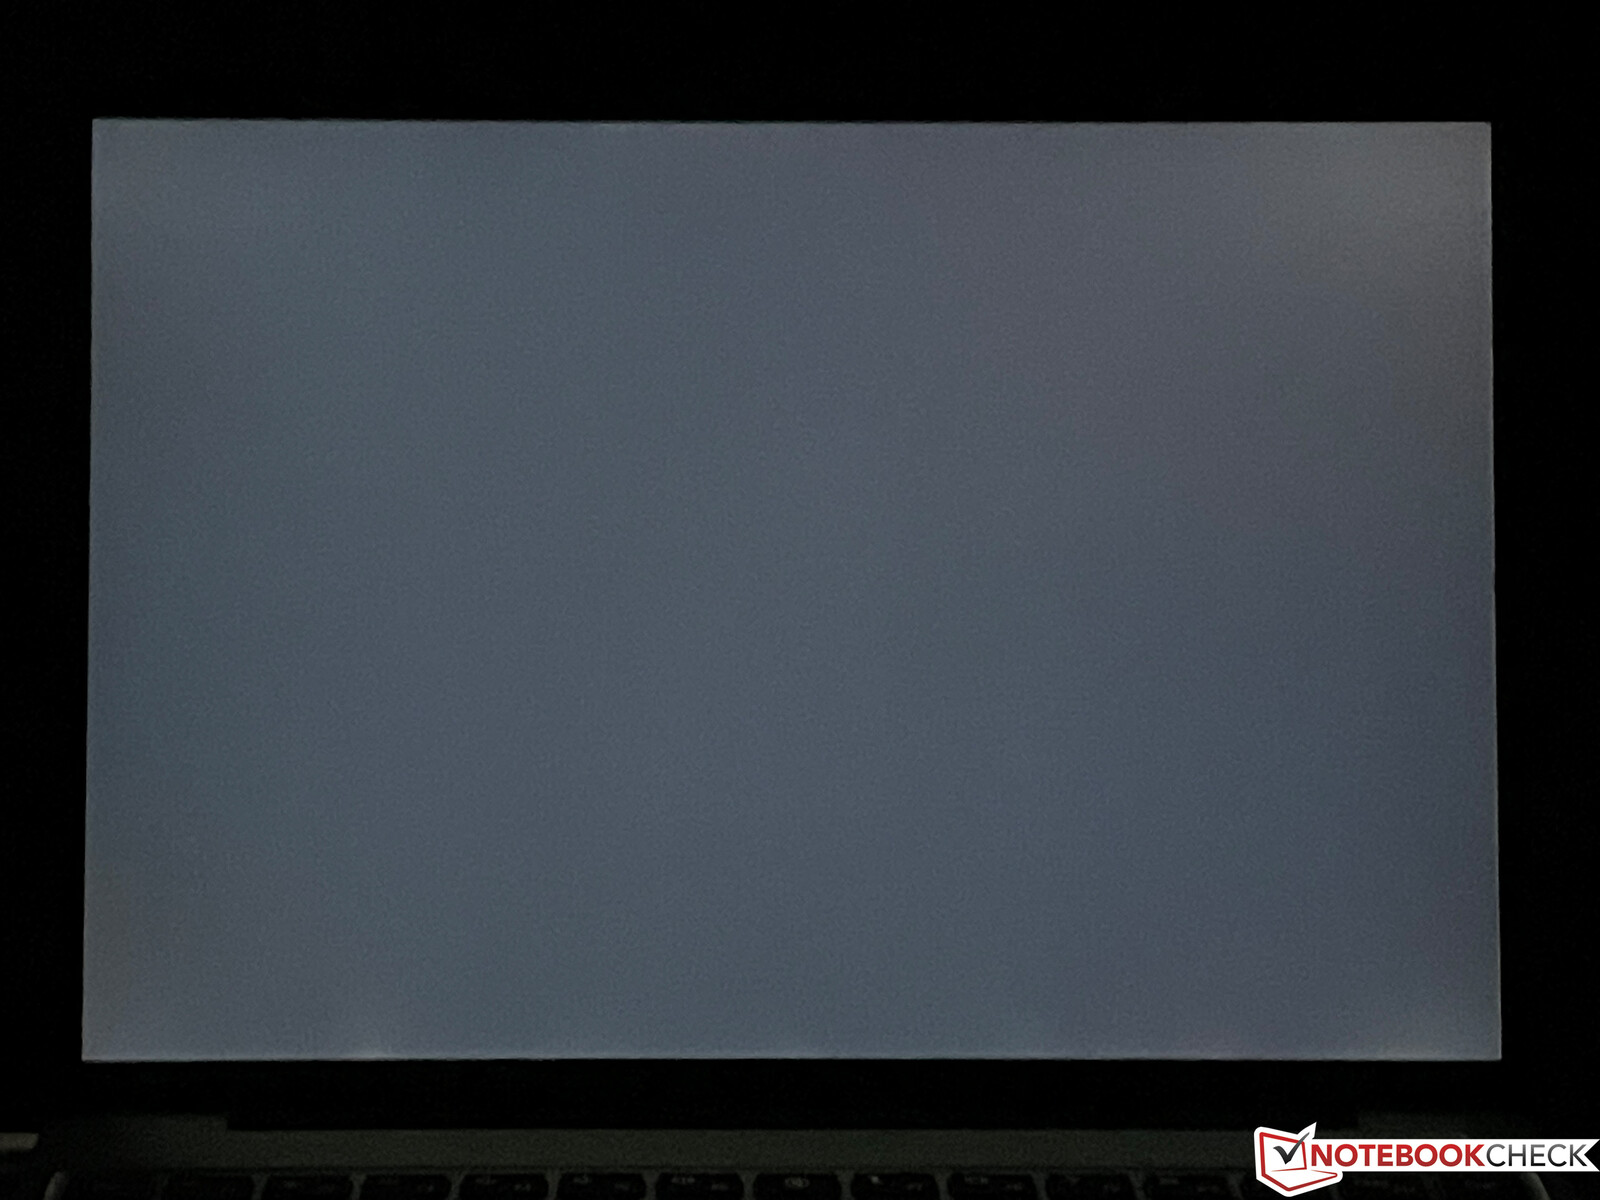
制造商宣传的亮度为400尼特,这显然被我们的评测设备所超越,其平均亮度为450尼特。黑值也很低,导致了2035:1的出色对比度。尽管亮度很高,但背光渗漏是没有问题的,而且响应时间也还可以。我们可以检测到亮度为20%或更低的PWM闪烁(对应的亮度为47尼特),但确定的9.8kHz频率非常高,应该不会造成任何问题。
| |||||||||||||||||||||||||
Brightness Distribution: 92 %
Center on Battery: 468 cd/m²
Contrast: 2035:1 (Black: 0.23 cd/m²)
ΔE ColorChecker Calman: 2 | ∀{0.5-29.43 Ø4.71}
calibrated: 1.5
ΔE Greyscale Calman: 2.6 | ∀{0.09-98 Ø4.96}
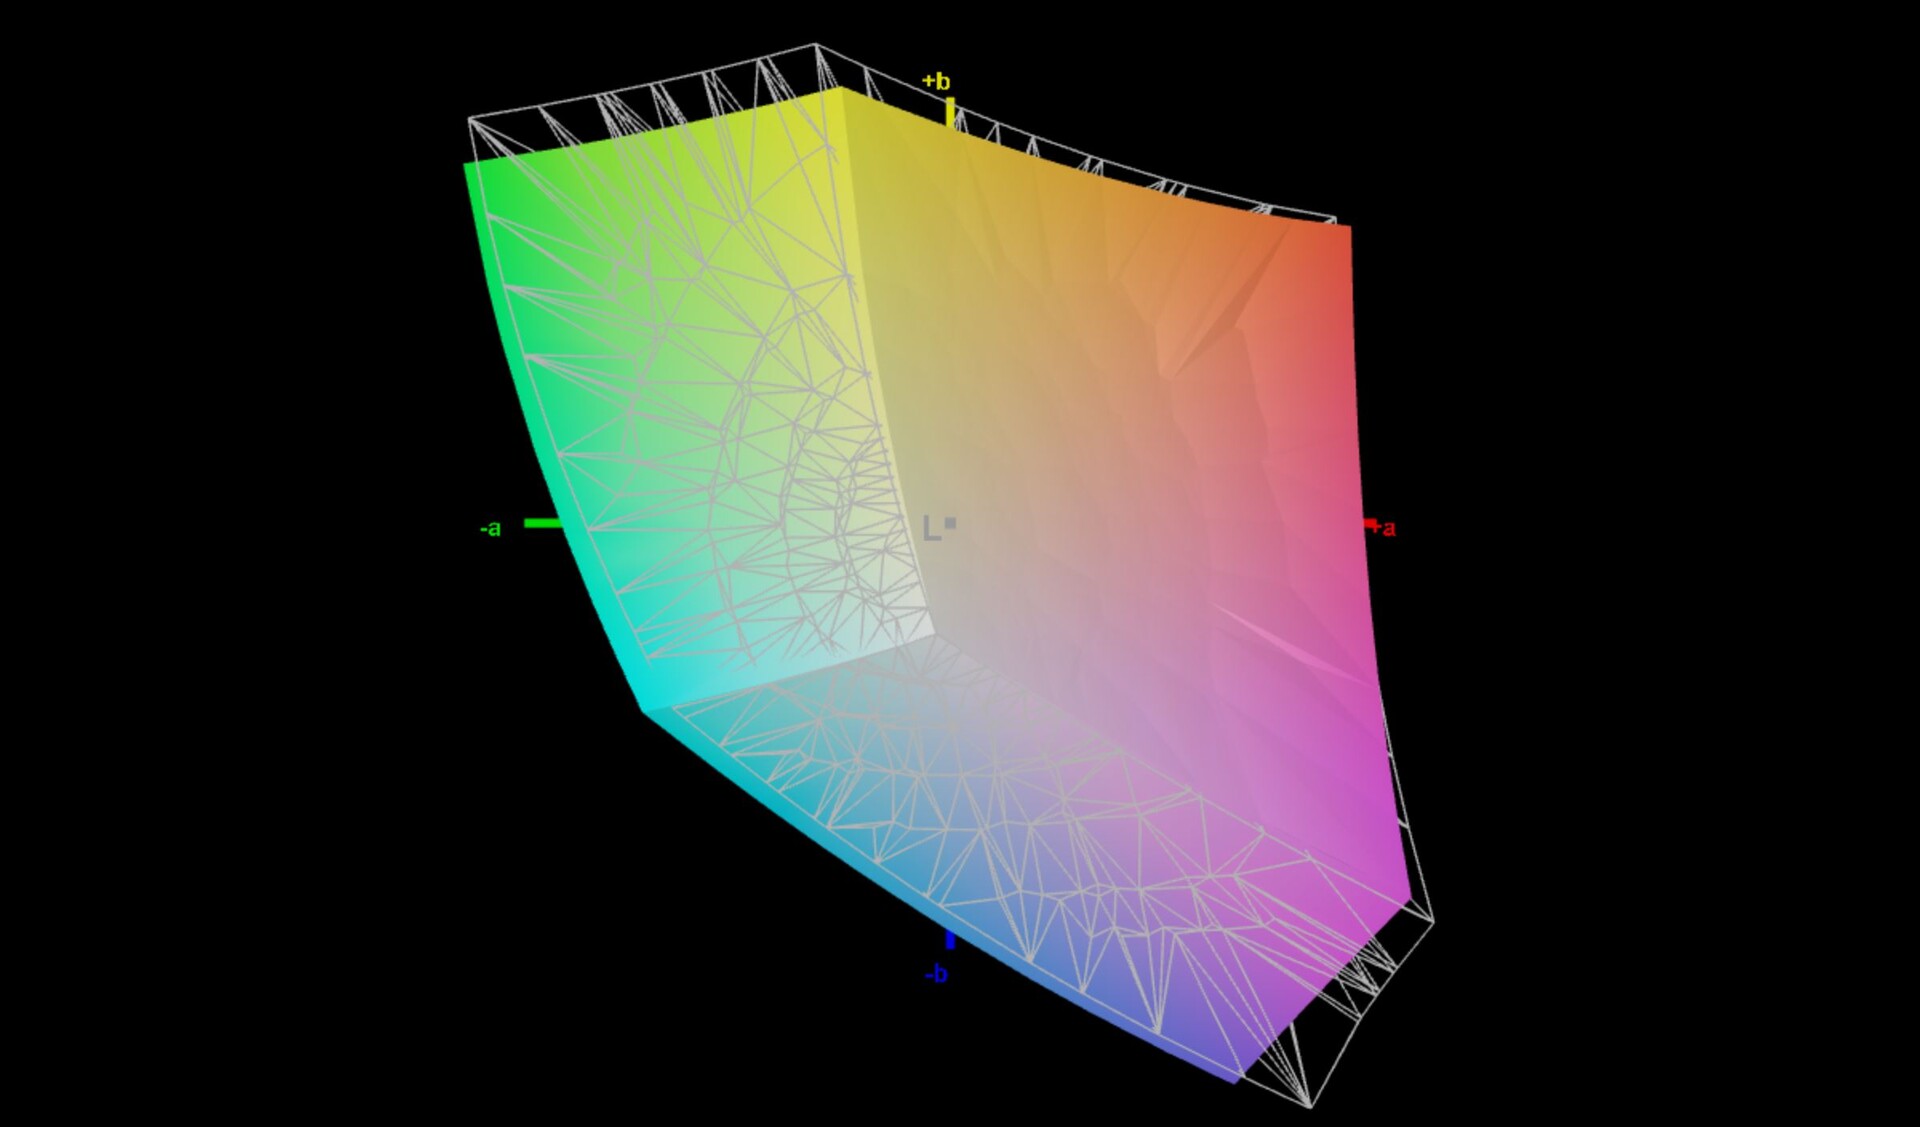
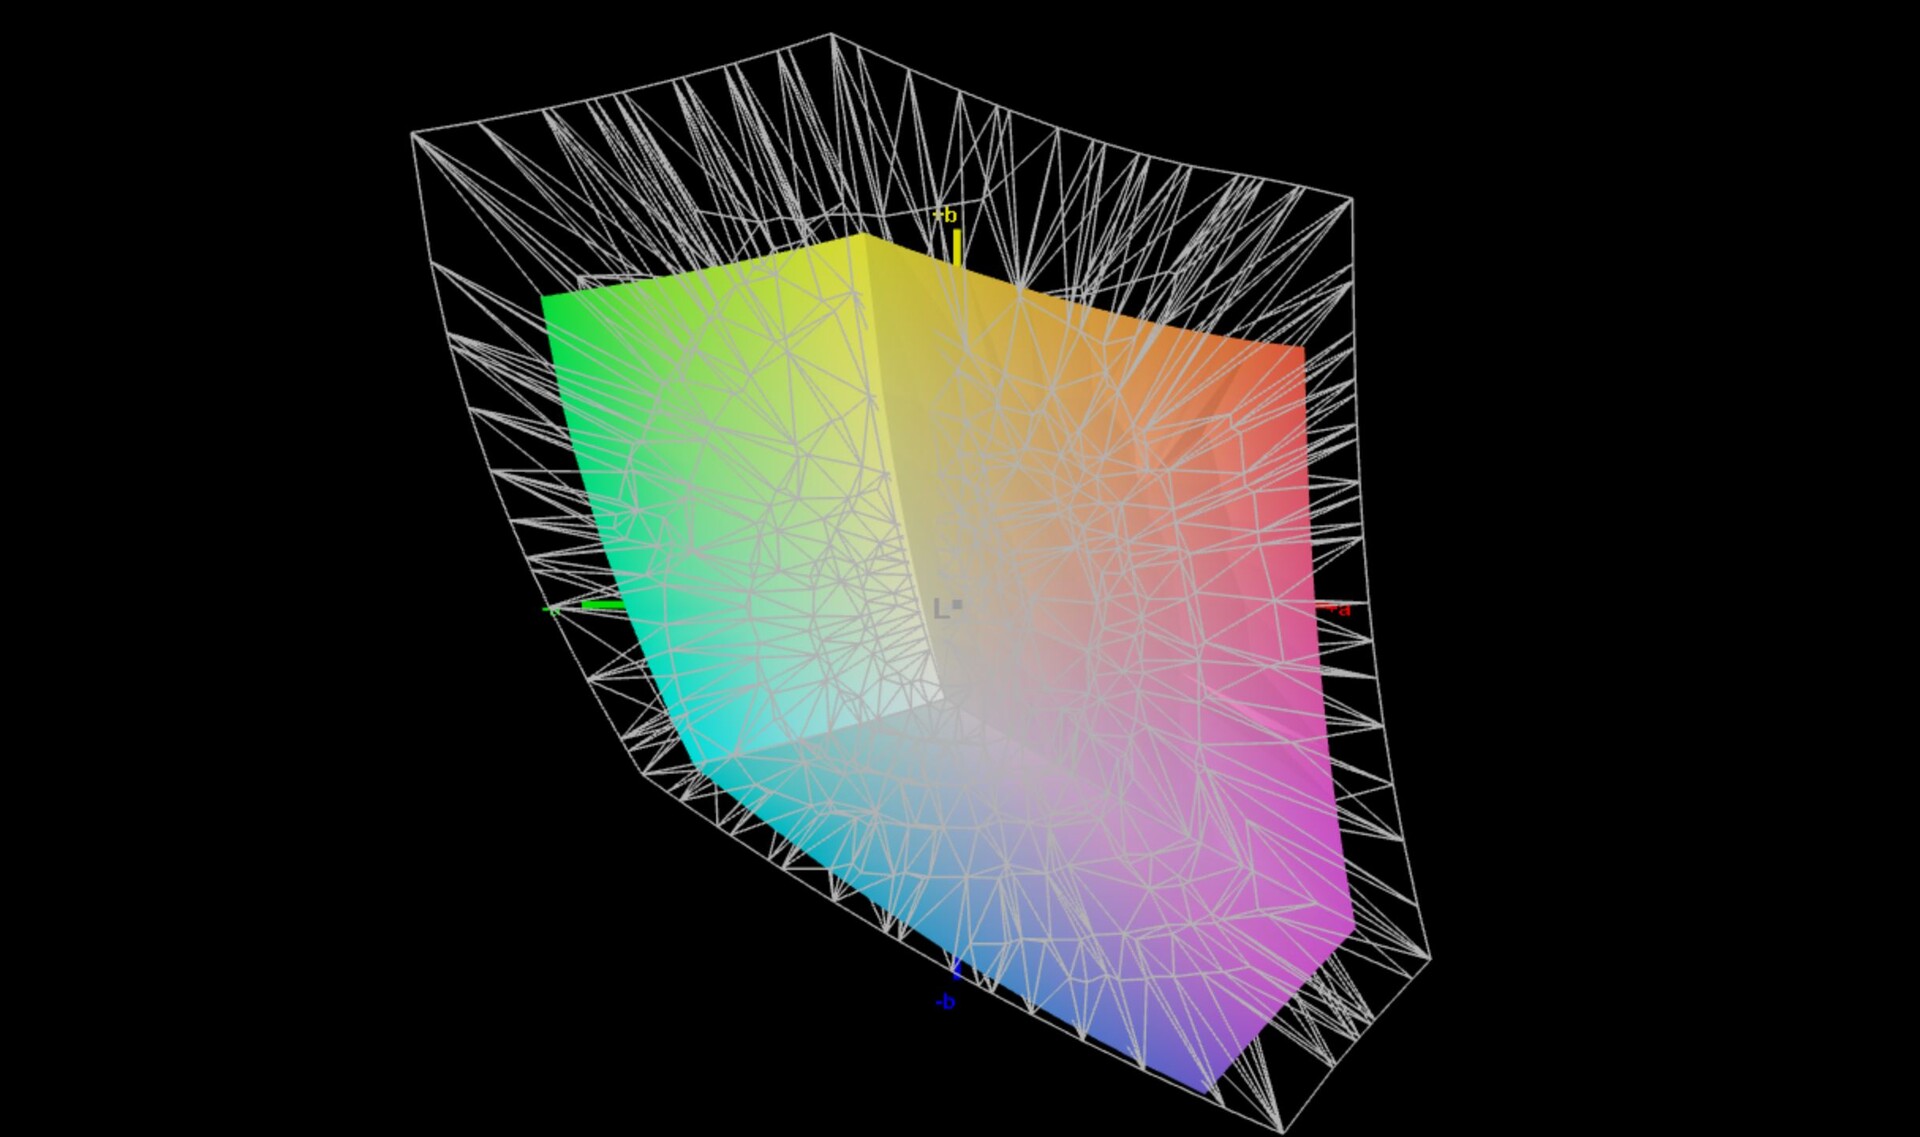
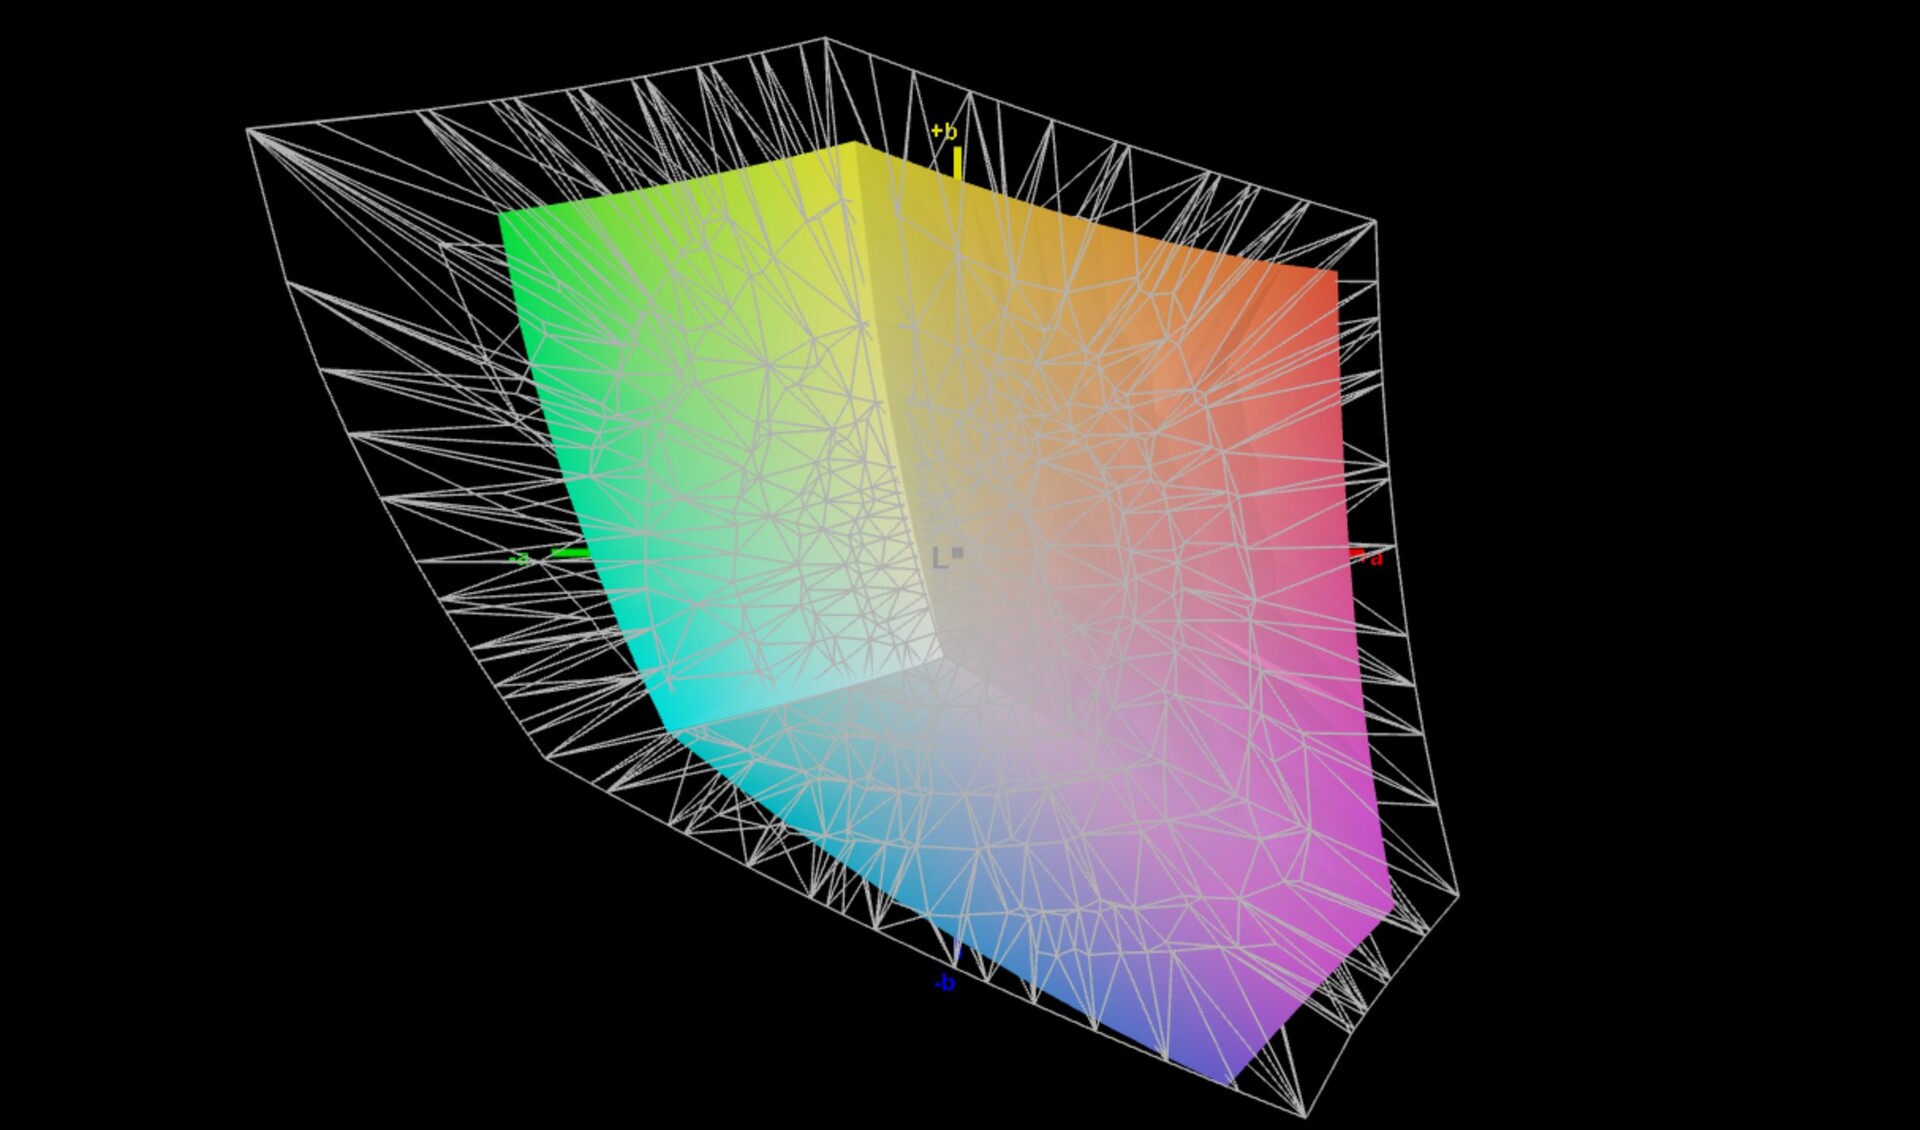
67.5% AdobeRGB 1998 (Argyll 3D)
92% sRGB (Argyll 3D)
65.2% Display P3 (Argyll 3D)
Gamma: 2.17
CCT: 6511 K
| Huawei MateBook 13s i5 11300H TL134GDXP02-0, LTPS, 2520x1680, 13.4" | Lenovo ThinkBook 13s G3 20YA0005GE M133NW4JR0, IPS, 1920x1200, 13.3" | Asus ZenBook 13 UX325EA Samsung SDC4155 (ATNA33XC09-0), OLED, 1920x1080, 13.3" | Apple MacBook Air 2020 M1 Entry IPS, 2560x1600, 13.3" | Microsoft Surface Laptop 4 13 i7 LQ135P1JX51, IPS, 2256x1504, 13.5" | Dell XPS 13 9305 Core i5 FHD Sharp SHP14AE, IPS, 1920x1080, 13.3" | HP Pavilion Aero 13 be0097nr AU Optronics AUO6496, IPS, 1920x1200, 13.3" | |
|---|---|---|---|---|---|---|---|
| Display | 4% | 35% | 29% | 1% | 2% | 11% | |
| Display P3 Coverage (%) | 65.2 | 67.5 4% | 99.9 53% | 98.6 51% | 64.7 -1% | 66.3 2% | 73.4 13% |
| sRGB Coverage (%) | 92 | 97.1 6% | 100 9% | 100 9% | 97.2 6% | 97.1 6% | 99.8 8% |
| AdobeRGB 1998 Coverage (%) | 67.5 | 68.8 2% | 97.5 44% | 85.9 27% | 66.9 -1% | 67.1 -1% | 74.8 11% |
| Response Times | -32% | 94% | 9% | -58% | -21% | -17% | |
| Response Time Grey 50% / Grey 80% * (ms) | 44.8 ? | 53.2 ? -19% | 2 ? 96% | 31 ? 31% | 62.8 ? -40% | 55 ? -23% | 42.4 ? 5% |
| Response Time Black / White * (ms) | 22.8 ? | 32.8 ? -44% | 2 ? 91% | 26.1 ? -14% | 39.8 ? -75% | 27 ? -18% | 31.6 ? -39% |
| PWM Frequency (Hz) | 9804 ? | 60 ? | 118000 ? | 21930 ? | 996 ? | ||
| Screen | 7% | -11% | 4% | -8% | -10% | -16% | |
| Brightness middle (cd/m²) | 468 | 379 -19% | 390 -17% | 417 -11% | 413 -12% | 486 4% | 473.9 1% |
| Brightness (cd/m²) | 450 | 356 -21% | 368 -18% | 395 -12% | 400 -11% | 446 -1% | 458 2% |
| Brightness Distribution (%) | 92 | 88 -4% | 66 -28% | 91 -1% | 94 2% | 77 -16% | 91 -1% |
| Black Level * (cd/m²) | 0.23 | 0.23 -0% | 0.39 -70% | 0.29 -26% | 0.4 -74% | 0.36 -57% | |
| Contrast (:1) | 2035 | 1648 -19% | 1069 -47% | 1424 -30% | 1215 -40% | 1316 -35% | |
| Colorchecker dE 2000 * | 2 | 1.6 20% | 2.03 -1% | 1.12 44% | 2.8 -40% | 2.54 -27% | 2.99 -50% |
| Colorchecker dE 2000 max. * | 5.5 | 2.7 51% | 3.14 43% | 2.71 51% | 7.2 -31% | 4.34 21% | 4.35 21% |
| Colorchecker dE 2000 calibrated * | 1.5 | 1 33% | 3.1 -107% | 0.77 49% | 0.8 47% | 1.04 31% | 1.1 27% |
| Greyscale dE 2000 * | 2.6 | 2 23% | 1.28 51% | 1.7 35% | 1.9 27% | 2.34 10% | 4 -54% |
| Gamma | 2.17 101% | 2.25 98% | 2.4 92% | 2207 0% | 2.12 104% | 2.28 96% | 2.35 94% |
| CCT | 6511 100% | 6835 95% | 6359 102% | 6870 95% | 6510 100% | 6864 95% | 6269 104% |
| Color Space (Percent of AdobeRGB 1998) (%) | 87 | 61.6 | 62 | ||||
| Color Space (Percent of sRGB) (%) | 100 | 97.2 | 97 | ||||
| Total Average (Program / Settings) | -7% /
1% | 39% /
18% | 14% /
10% | -22% /
-13% | -10% /
-9% | -7% /
-11% |
* ... smaller is better
MateBook 13s提供了90赫兹模式,但默认情况下没有激活。你可以通过图形设置或组合键(Fn+R)来激活它。90赫兹模式会带来更流畅的画面印象,特别是在滚动时。
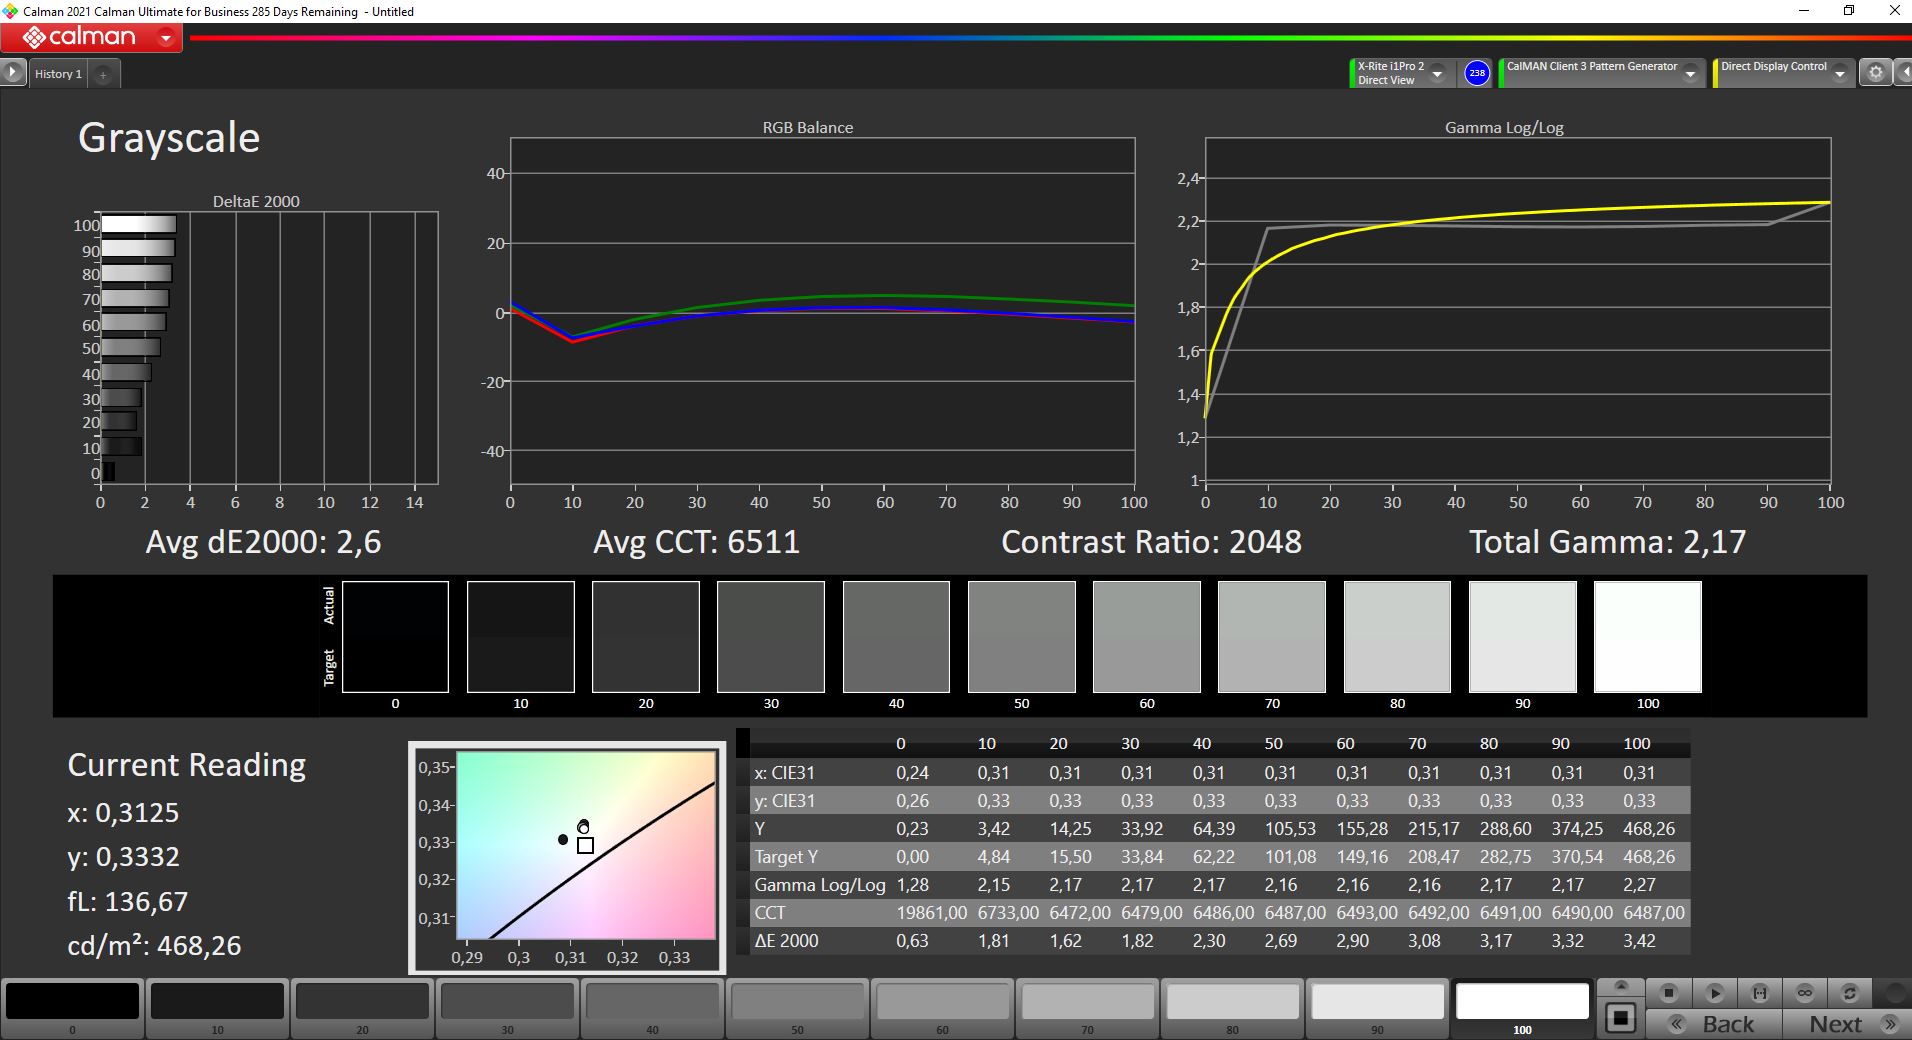
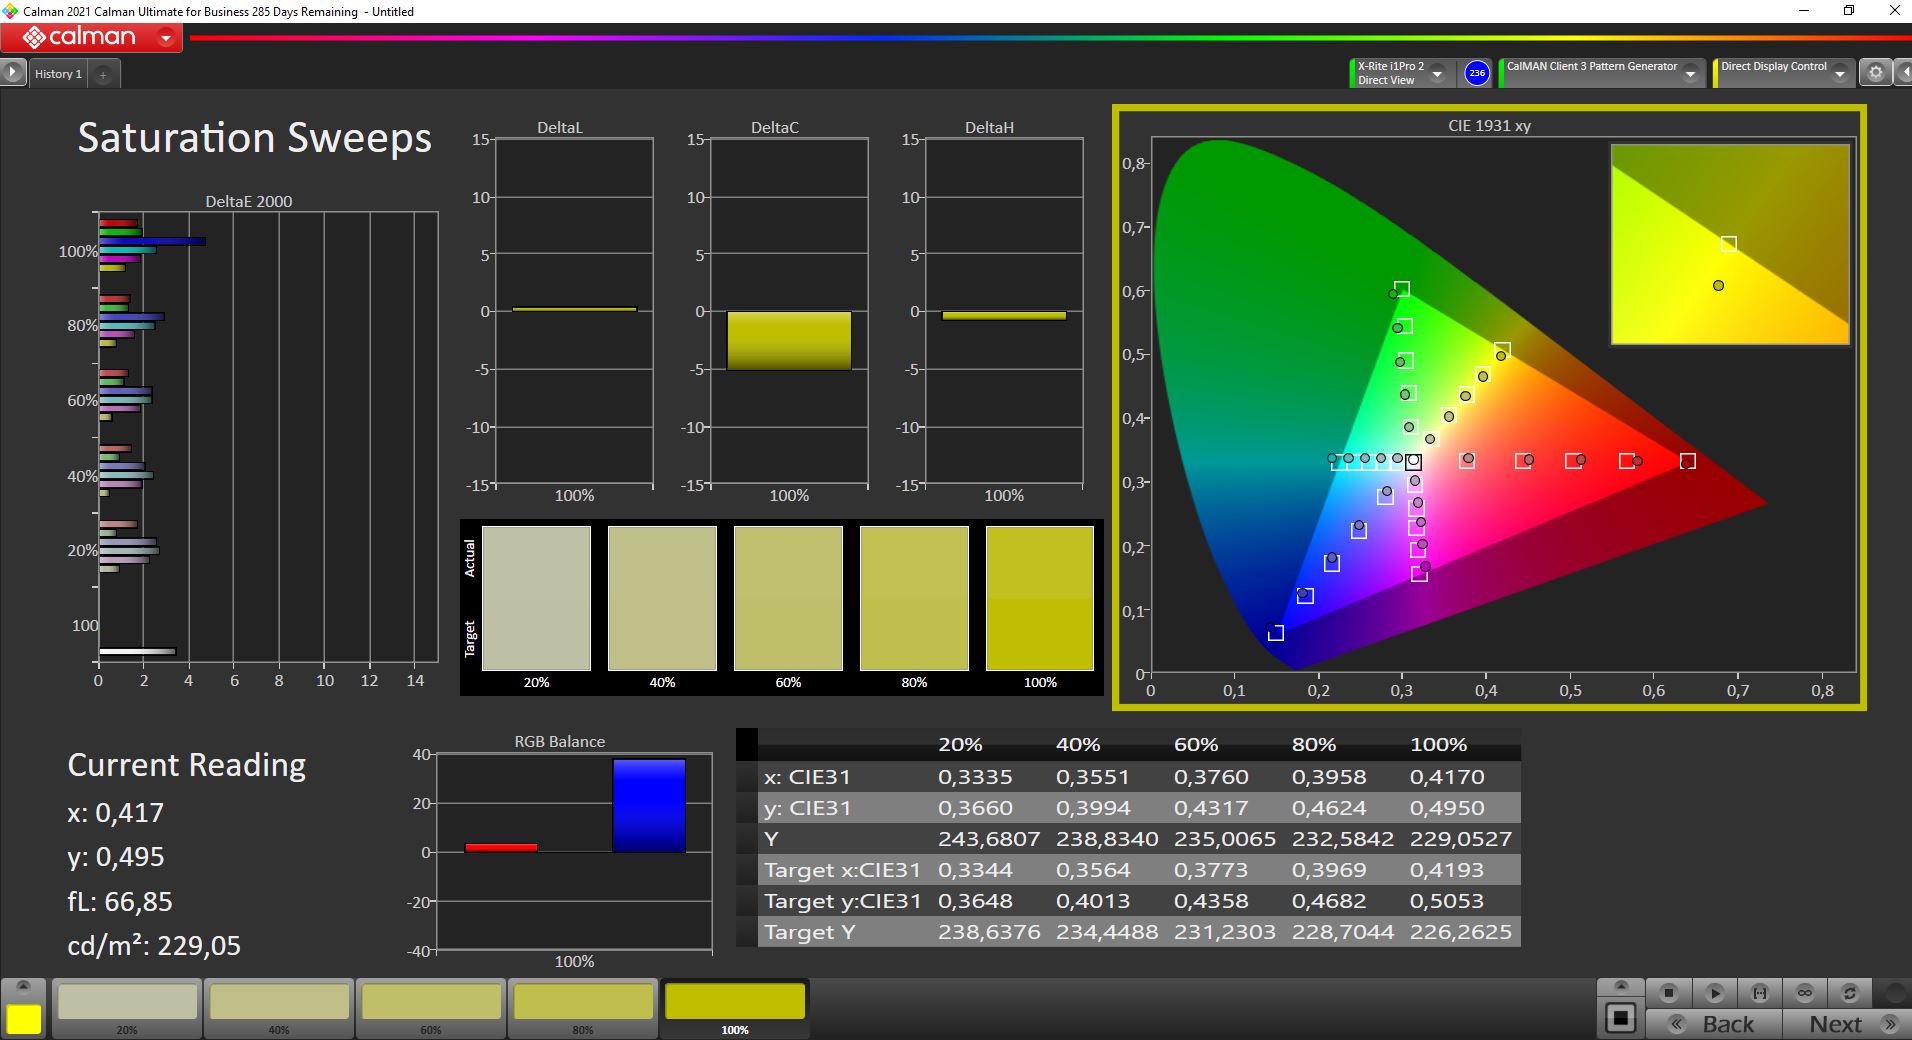
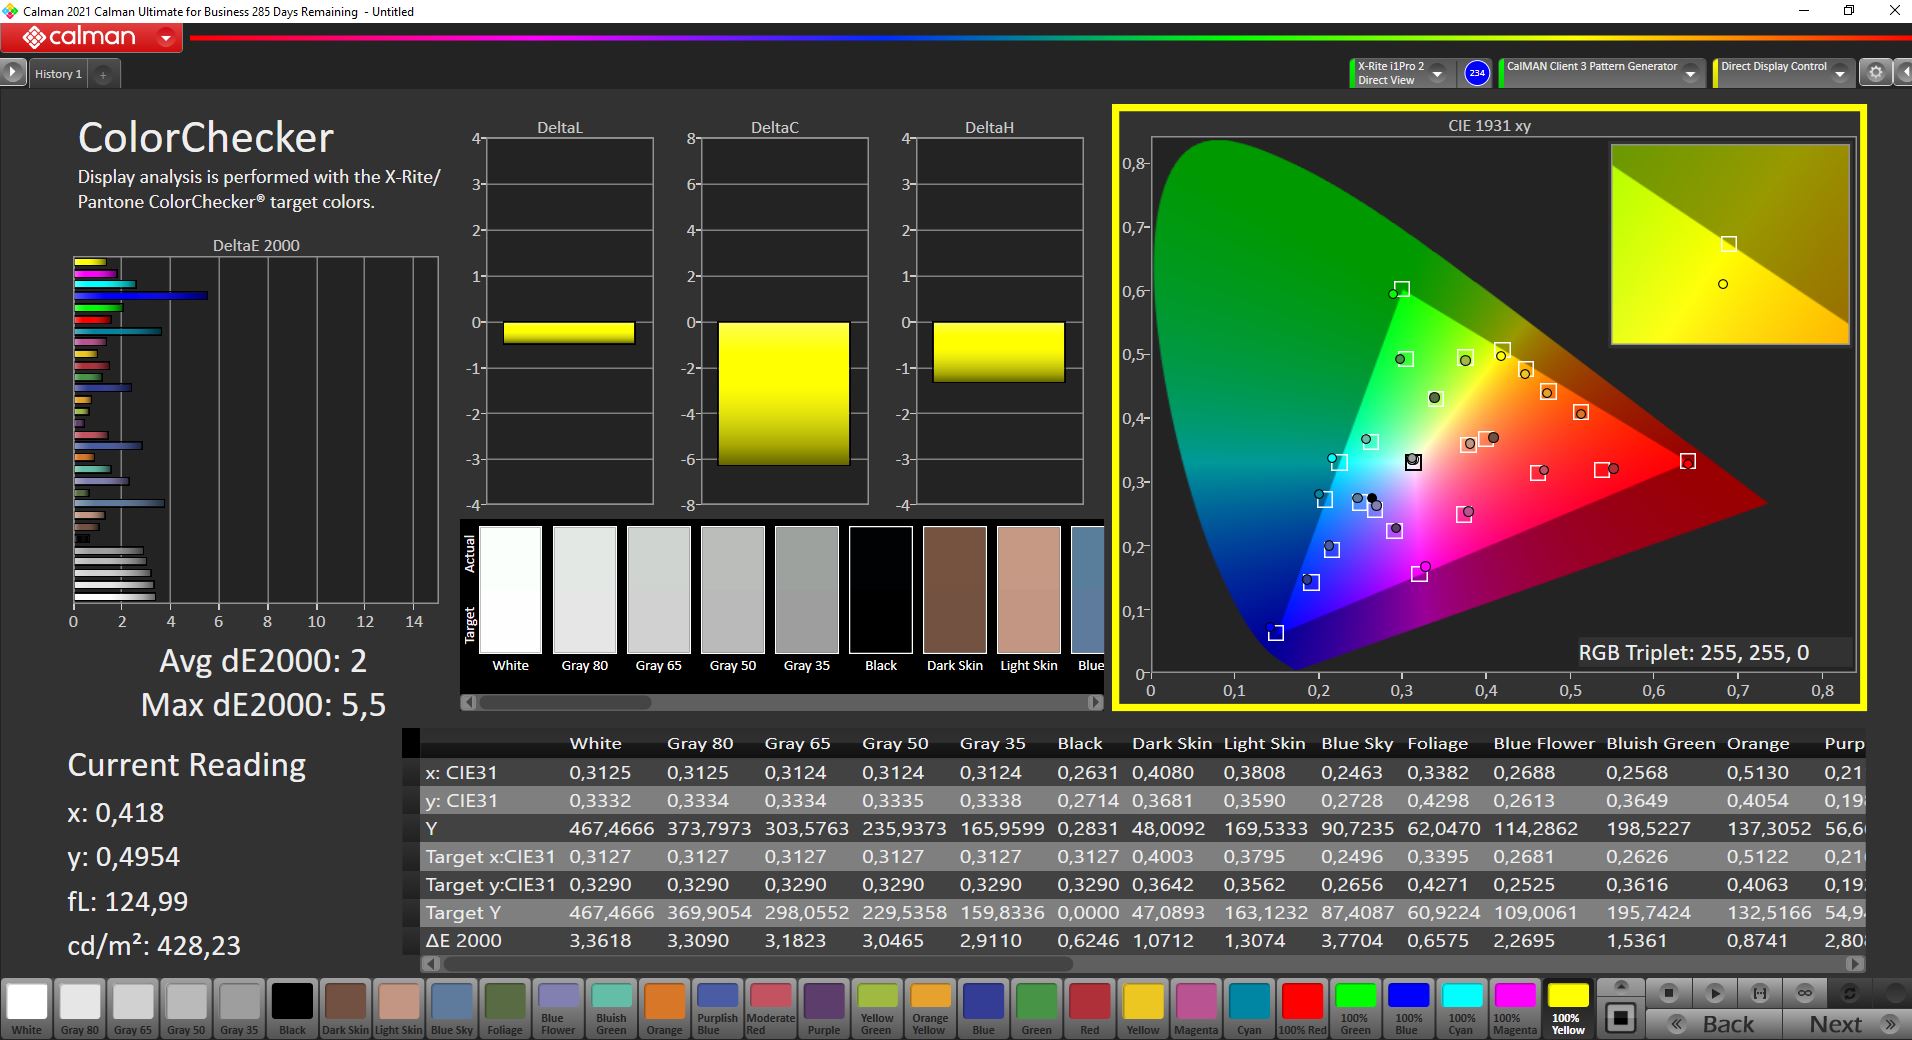
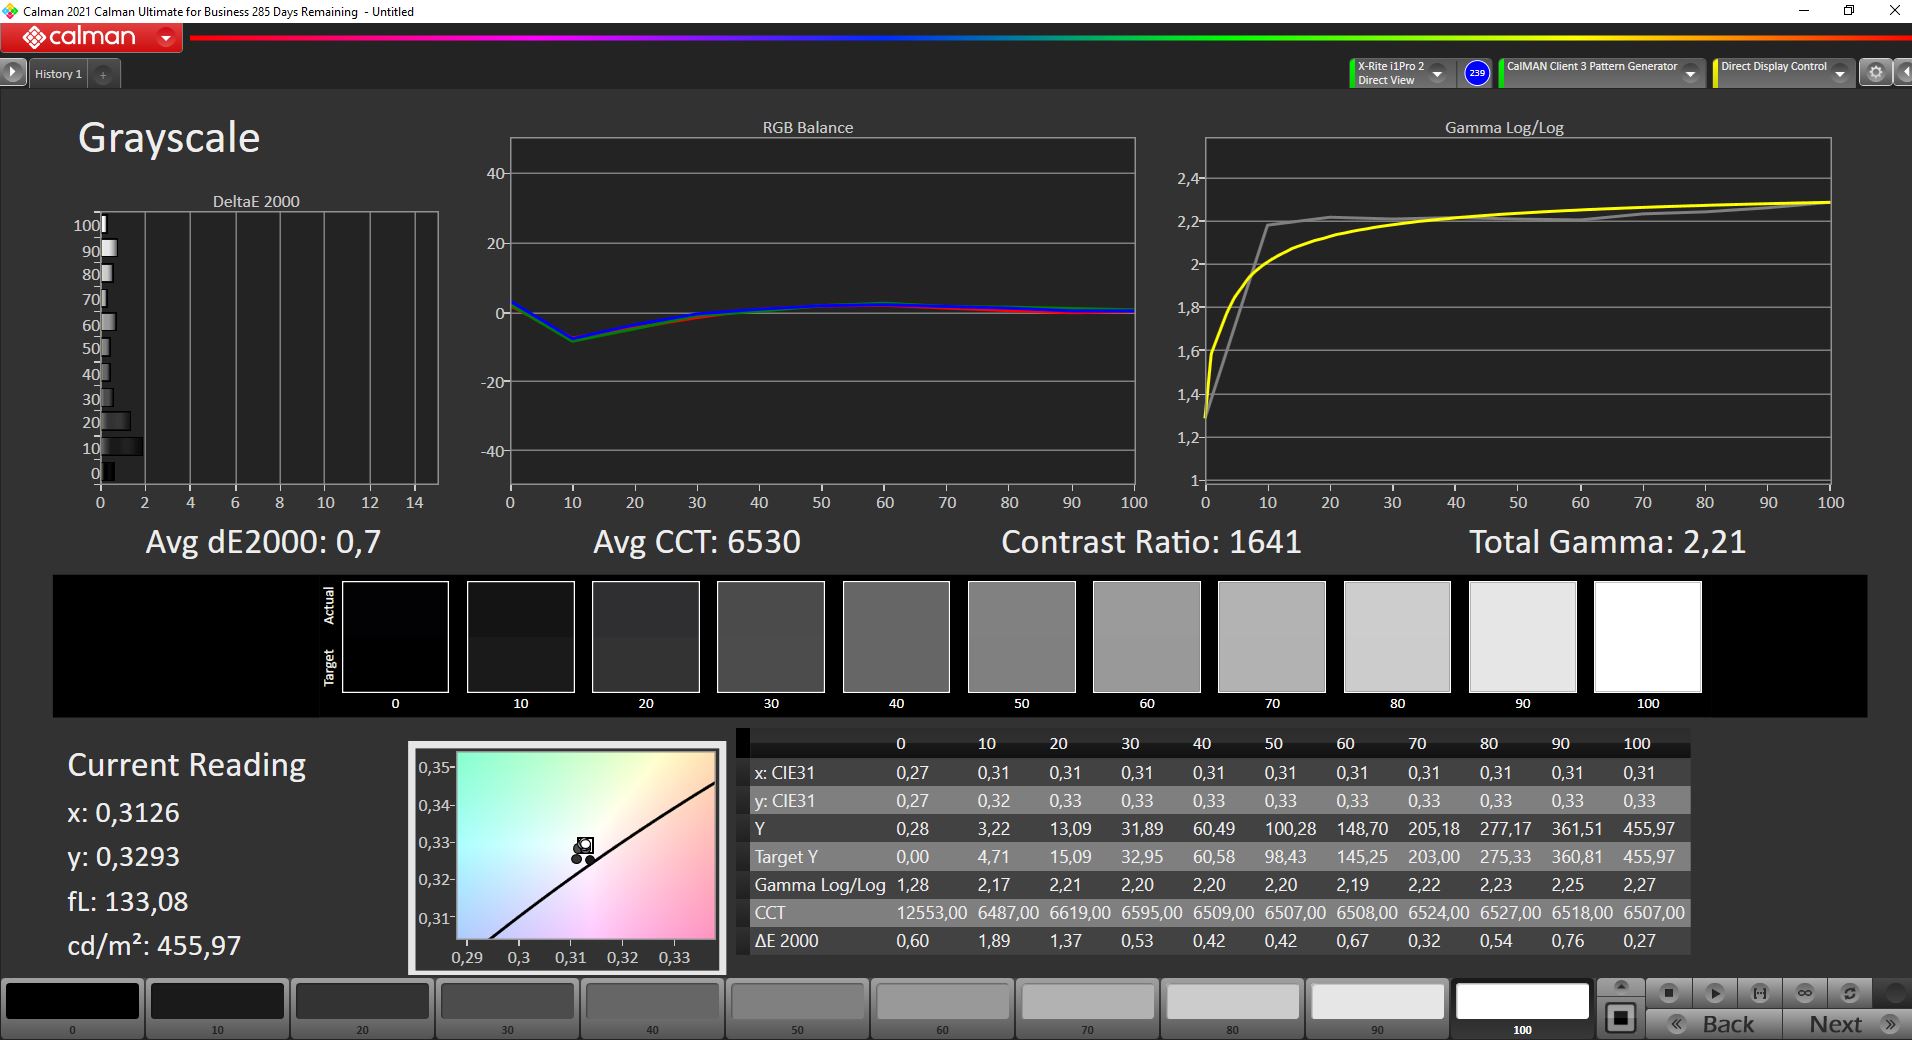

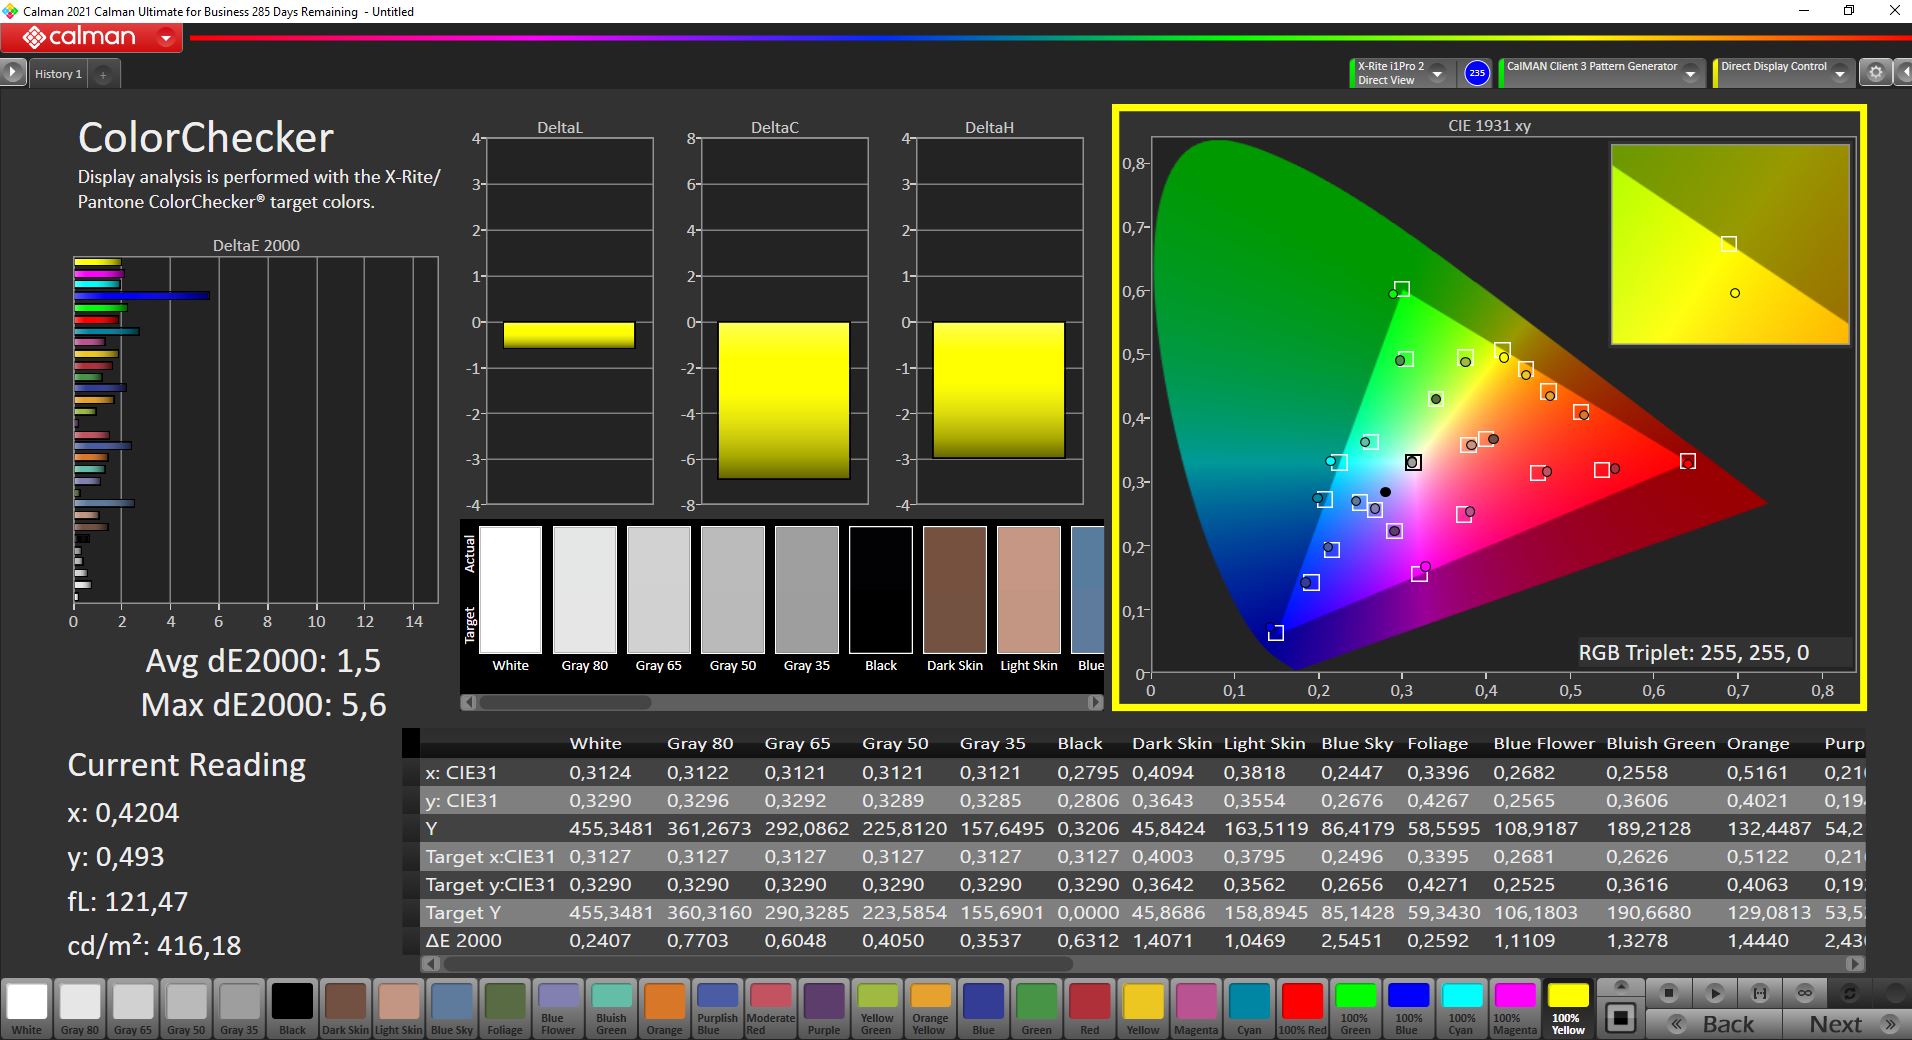
我们用专业的CalMAN软件和X-Rite i1 Pro 2分光光度计分析了显示器。开箱后的画质已经非常好,没有明显的偏色,但有一些蓝色色调的偏差略微升高(高3)。我们自己的校准(配置文件可以在上面的盒子里免费下载)可以改善结果,但100%的蓝色仍然有偏差,所以这只是显示器的一个限制。尽管如此,MateBook 13s还是适合在小型sRGB色彩空间中进行图片编辑,这几乎完全覆盖了。
Display Response Times
| ↔ Response Time Black to White | ||
|---|---|---|
| 22.8 ms ... rise ↗ and fall ↘ combined | ↗ 10.4 ms rise | 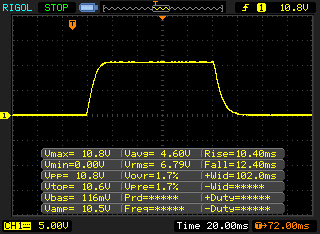 |
| ↘ 12.4 ms fall | ||
| The screen shows good response rates in our tests, but may be too slow for competitive gamers. In comparison, all tested devices range from 0.1 (minimum) to 240 (maximum) ms. » 51 % of all devices are better. This means that the measured response time is worse than the average of all tested devices (19.8 ms). | ||
| ↔ Response Time 50% Grey to 80% Grey | ||
| 44.8 ms ... rise ↗ and fall ↘ combined | ↗ 22 ms rise | 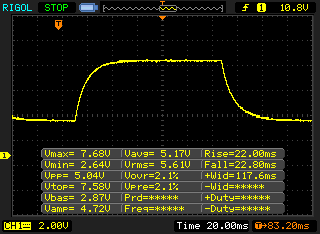 |
| ↘ 22.8 ms fall | ||
| The screen shows slow response rates in our tests and will be unsatisfactory for gamers. In comparison, all tested devices range from 0.165 (minimum) to 636 (maximum) ms. » 76 % of all devices are better. This means that the measured response time is worse than the average of all tested devices (31 ms). | ||
Screen Flickering / PWM (Pulse-Width Modulation)
| Screen flickering / PWM detected | 9804 Hz | ≤ 20 % brightness setting | 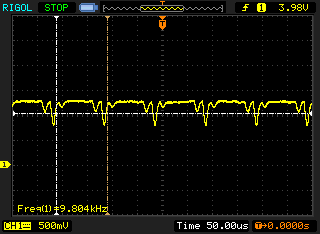 |
| ≤ 47 cd/m² brightness | |||
The display backlight flickers at 9804 Hz (worst case, e.g., utilizing PWM) Flickering detected at a brightness setting of 20 % (47 cd/m²) and below. There should be no flickering or PWM above this brightness setting. The frequency of 9804 Hz is quite high, so most users sensitive to PWM should not notice any flickering. As the flickering occurs only on very low brightness settings, it should not be an issue in typical office settings. Nonetheless, use in low light conditions may be straining to the eyes. In comparison: 52 % of all tested devices do not use PWM to dim the display. If PWM was detected, an average of 7754 (minimum: 5 - maximum: 343500) Hz was measured. | |||
光滑的显示屏在户外是个问题,尽管亮度很高,但在晴天也很难看清显示内容。在阴凉处或阴天会更舒服。视角的稳定性也没有问题。
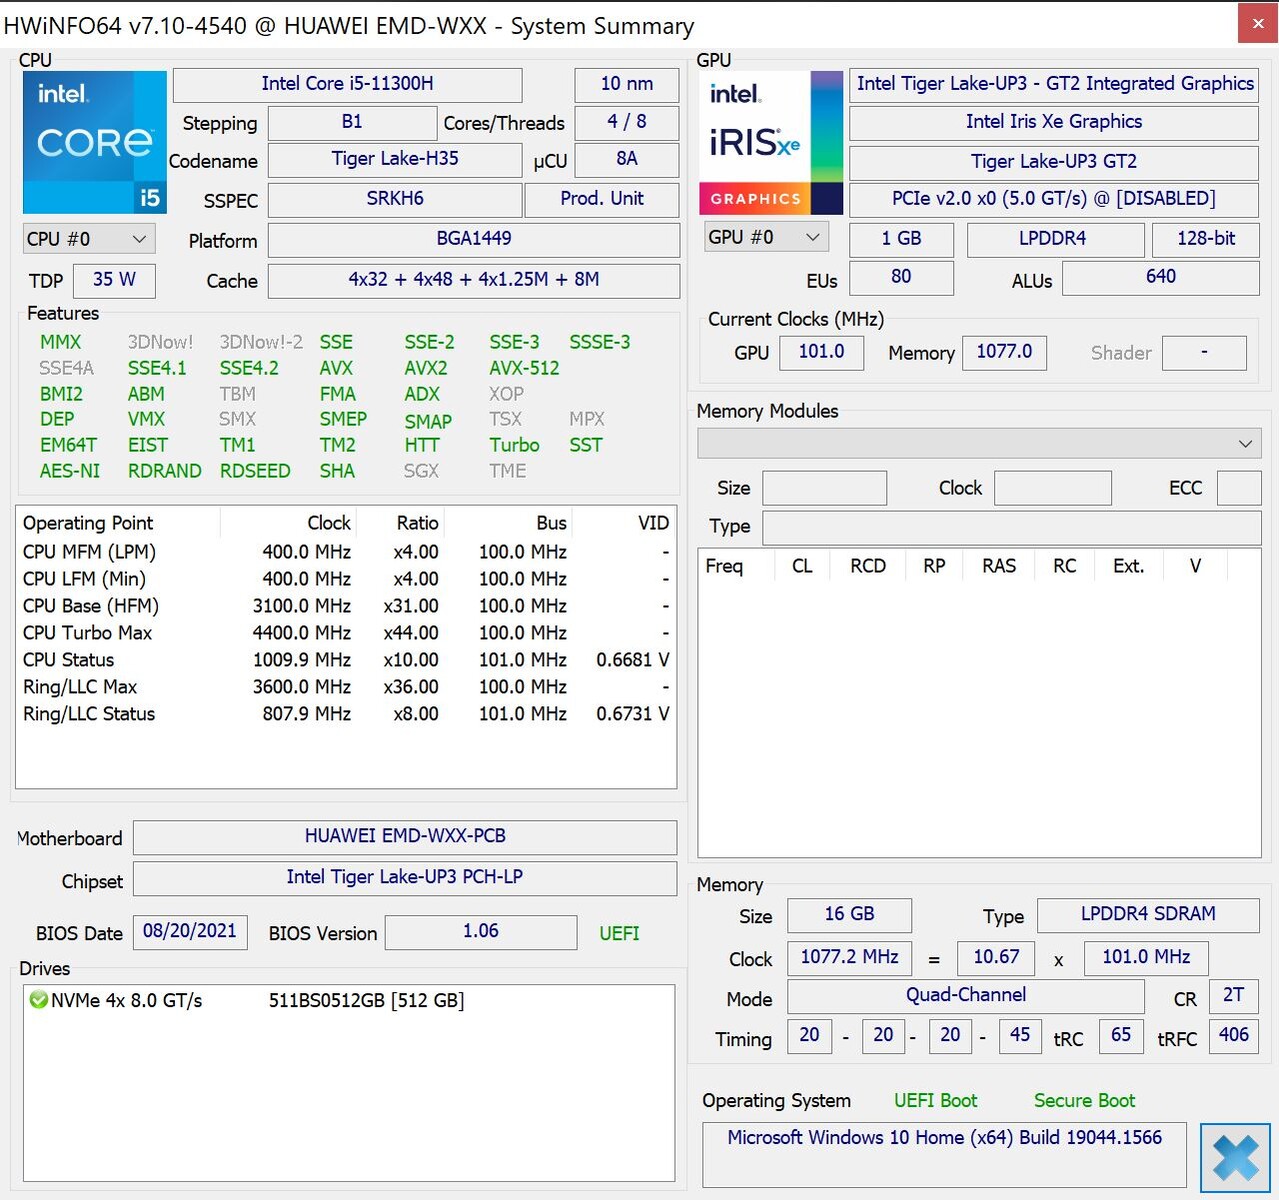
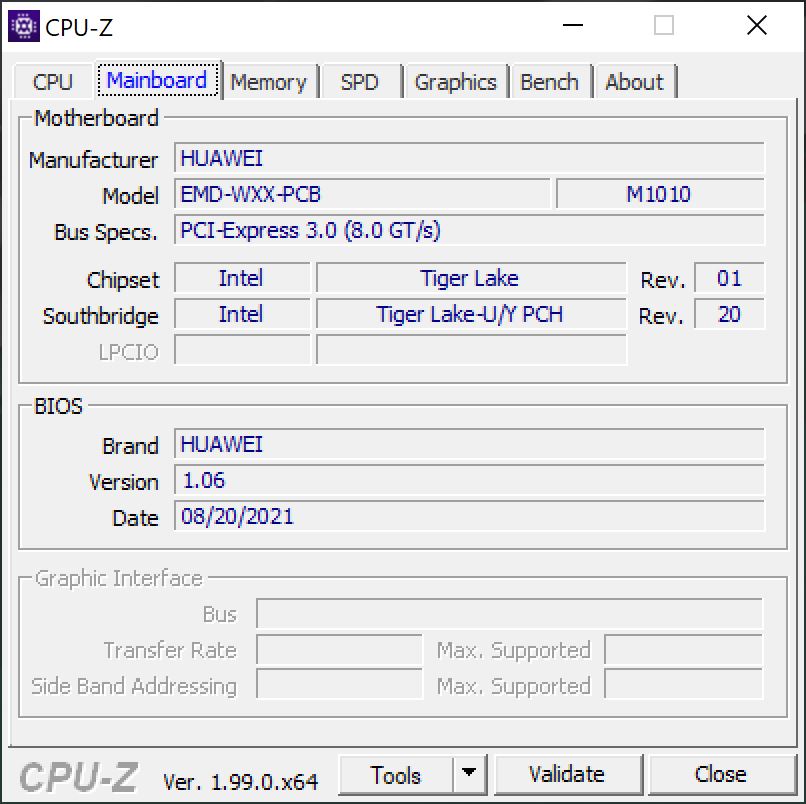
性能 - 华为使用Tiger Lake-H35
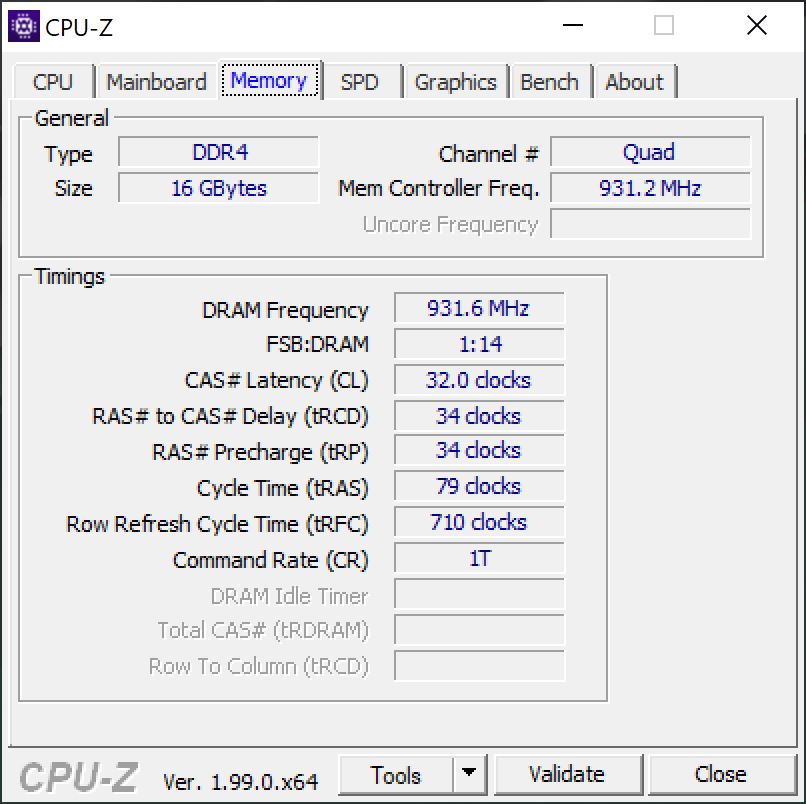
华为只提供MateBook 13s的一种配置。与较大的MateBook 14s,制造商使用35W的CPU,来自英特尔的Tiger Lake 代,但在这种情况下,使用较慢的酷睿i5-11300H以及稍慢的集成版本的英特尔Iris Xe图形G7,80个EUs.结合双通道配置的16GB内存(LPDDR4x-3733),你可以获得足够的性能来完成几乎所有的普通任务。
华为预装的PC管理器提供了两种电源模式;默认的 "平衡 "设置和 "性能",但后者对性能只有很小的影响(在持续工作负荷期间为42瓦特对35瓦特),在日常任务中并没有真正的区别。你也可以通过组合键Fn+P在这两种模式之间进行切换。以下所有的基准测试和测量都是在 "平衡 "模式和Windows电源设置 "最佳性能 "下进行的。
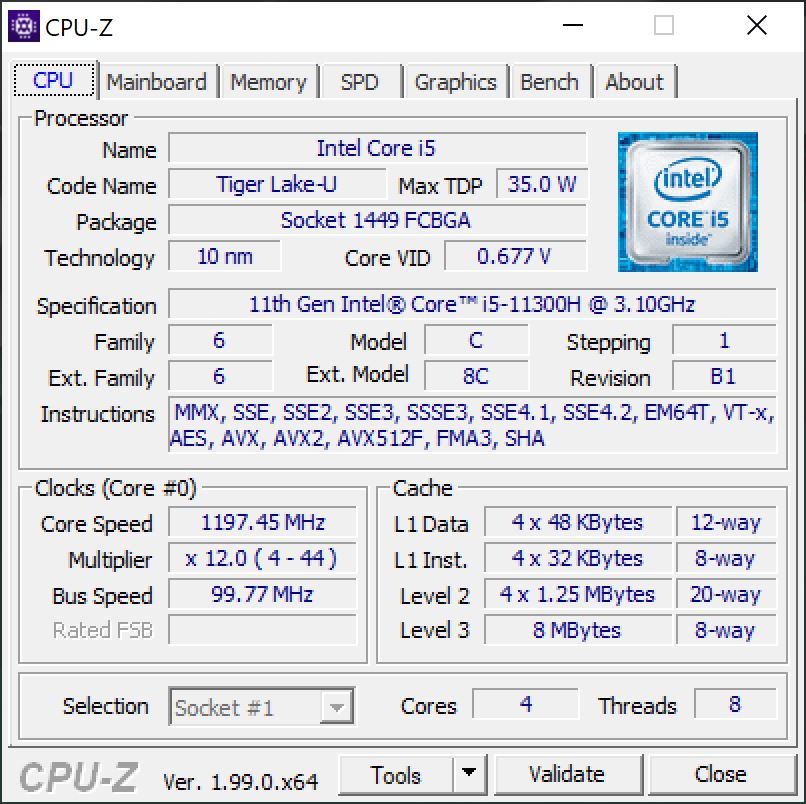
处理器 - 酷睿i5-11300H
英特尔的酷睿i5-11300H是一款Tiger Lake ,有四个核心(8个线程)的CPU,标称TDP为35瓦。这些H35 CPU基本上是普通的Tiger Lake-U处理器,如酷睿i5-1135G7具有更高的功率水平。基准测试结果也相当令人清醒,例如,在Cinebench R23等M1原生测试中,酷睿i5在与AMD U系列处理器以及Apple's M1处理器的竞争中毫无胜算。
Cinebench R15 Multi Loop
Cinebench R15多循环清楚地表明,两种性能模式之间的差异可以忽略不计。如果你需要最大的CPU性能,你当然可以使用性能模式。MateBook 13s的冷却性能很好,因为CPU在测试开始时可以消耗超过40瓦特,然后维持在标称的35瓦特。因此,性能较弱是由Core i5-11300H本身造成的;如果使用目前的AMD芯片或全新的Alder Lake处理器之一,结果会好得多。更大的MateBook 14s配有酷睿i7-11370H可以使用45W,而且速度更快一些,但是在日常场景中的差异再次非常小。
总的来说,CPU性能对于日常任务来说仍然绰绰有余,在可预见的未来也不应该成为瓶颈。在电池电量方面,CPU的性能并没有降低。更多的处理器基准测试可在 我们的技术部分.
Cinebench R23: Multi Core | Single Core
Cinebench R20: CPU (Multi Core) | CPU (Single Core)
Cinebench R15: CPU Multi 64Bit | CPU Single 64Bit
Blender: v2.79 BMW27 CPU
7-Zip 18.03: 7z b 4 | 7z b 4 -mmt1
Geekbench 5.5: Multi-Core | Single-Core
HWBOT x265 Benchmark v2.2: 4k Preset
LibreOffice : 20 Documents To PDF
R Benchmark 2.5: Overall mean
| CPU Performance rating | |
| Average of class Subnotebook | |
| Lenovo ThinkBook 13s G3 20YA0005GE | |
| HP Pavilion Aero 13 be0097nr -2! | |
| Apple MacBook Air 2020 M1 Entry -1! | |
| Huawei MateBook 13s i5 11300H | |
| Average Intel Core i5-11300H | |
| Microsoft Surface Laptop 4 13 Ryzen 5 | |
| Asus ZenBook 13 UX325EA | |
| Dell XPS 13 9305 Core i5 FHD -2! | |
| Cinebench R23 / Multi Core | |
| Average of class Subnotebook (1555 - 21812, n=59, last 2 years) | |
| Lenovo ThinkBook 13s G3 20YA0005GE | |
| HP Pavilion Aero 13 be0097nr | |
| Apple MacBook Air 2020 M1 Entry | |
| Microsoft Surface Laptop 4 13 Ryzen 5 | |
| Average Intel Core i5-11300H (3313 - 6581, n=10) | |
| Dell XPS 13 9305 Core i5 FHD | |
| Huawei MateBook 13s i5 11300H | |
| Asus ZenBook 13 UX325EA | |
| Cinebench R23 / Single Core | |
| Average of class Subnotebook (358 - 2213, n=60, last 2 years) | |
| Apple MacBook Air 2020 M1 Entry | |
| Lenovo ThinkBook 13s G3 20YA0005GE | |
| Asus ZenBook 13 UX325EA | |
| HP Pavilion Aero 13 be0097nr | |
| Average Intel Core i5-11300H (1218 - 1431, n=11) | |
| Dell XPS 13 9305 Core i5 FHD | |
| Huawei MateBook 13s i5 11300H | |
| Microsoft Surface Laptop 4 13 Ryzen 5 | |
| Cinebench R20 / CPU (Multi Core) | |
| Average of class Subnotebook (579 - 8541, n=56, last 2 years) | |
| HP Pavilion Aero 13 be0097nr | |
| Lenovo ThinkBook 13s G3 20YA0005GE | |
| Microsoft Surface Laptop 4 13 Ryzen 5 | |
| Average Intel Core i5-11300H (1300 - 2533, n=10) | |
| Huawei MateBook 13s i5 11300H | |
| Apple MacBook Air 2020 M1 Entry | |
| Dell XPS 13 9305 Core i5 FHD | |
| Asus ZenBook 13 UX325EA | |
| Cinebench R20 / CPU (Single Core) | |
| Average of class Subnotebook (128 - 832, n=56, last 2 years) | |
| Lenovo ThinkBook 13s G3 20YA0005GE | |
| HP Pavilion Aero 13 be0097nr | |
| Asus ZenBook 13 UX325EA | |
| Average Intel Core i5-11300H (431 - 548, n=11) | |
| Dell XPS 13 9305 Core i5 FHD | |
| Microsoft Surface Laptop 4 13 Ryzen 5 | |
| Huawei MateBook 13s i5 11300H | |
| Apple MacBook Air 2020 M1 Entry | |
| Cinebench R15 / CPU Multi 64Bit | |
| Average of class Subnotebook (327 - 3345, n=56, last 2 years) | |
| Lenovo ThinkBook 13s G3 20YA0005GE | |
| Lenovo ThinkBook 13s G3 20YA0005GE | |
| HP Pavilion Aero 13 be0097nr | |
| Microsoft Surface Laptop 4 13 Ryzen 5 | |
| Apple MacBook Air 2020 M1 Entry | |
| Huawei MateBook 13s i5 11300H | |
| Huawei MateBook 13s i5 11300H | |
| Average Intel Core i5-11300H (632 - 990, n=11) | |
| Asus ZenBook 13 UX325EA | |
| Dell XPS 13 9305 Core i5 FHD | |
| Cinebench R15 / CPU Single 64Bit | |
| Average of class Subnotebook (72.4 - 322, n=56, last 2 years) | |
| HP Pavilion Aero 13 be0097nr | |
| Lenovo ThinkBook 13s G3 20YA0005GE | |
| Asus ZenBook 13 UX325EA | |
| Apple MacBook Air 2020 M1 Entry | |
| Huawei MateBook 13s i5 11300H | |
| Average Intel Core i5-11300H (123 - 211, n=8) | |
| Microsoft Surface Laptop 4 13 Ryzen 5 | |
| Blender / v2.79 BMW27 CPU | |
| Asus ZenBook 13 UX325EA | |
| Apple MacBook Air 2020 M1 Entry | |
| Dell XPS 13 9305 Core i5 FHD | |
| Average Intel Core i5-11300H (466 - 862, n=10) | |
| Huawei MateBook 13s i5 11300H | |
| Microsoft Surface Laptop 4 13 Ryzen 5 | |
| Lenovo ThinkBook 13s G3 20YA0005GE | |
| Average of class Subnotebook (159 - 2271, n=57, last 2 years) | |
| HP Pavilion Aero 13 be0097nr | |
| 7-Zip 18.03 / 7z b 4 | |
| Average of class Subnotebook (11668 - 77867, n=56, last 2 years) | |
| HP Pavilion Aero 13 be0097nr | |
| Lenovo ThinkBook 13s G3 20YA0005GE | |
| Apple MacBook Air 2020 M1 Entry | |
| Microsoft Surface Laptop 4 13 Ryzen 5 | |
| Huawei MateBook 13s i5 11300H | |
| Dell XPS 13 9305 Core i5 FHD | |
| Average Intel Core i5-11300H (17573 - 26001, n=10) | |
| Asus ZenBook 13 UX325EA | |
| 7-Zip 18.03 / 7z b 4 -mmt1 | |
| Average of class Subnotebook (2643 - 6699, n=58, last 2 years) | |
| Apple MacBook Air 2020 M1 Entry | |
| HP Pavilion Aero 13 be0097nr | |
| Lenovo ThinkBook 13s G3 20YA0005GE | |
| Asus ZenBook 13 UX325EA | |
| Average Intel Core i5-11300H (4603 - 4969, n=10) | |
| Huawei MateBook 13s i5 11300H | |
| Dell XPS 13 9305 Core i5 FHD | |
| Microsoft Surface Laptop 4 13 Ryzen 5 | |
| Geekbench 5.5 / Multi-Core | |
| Average of class Subnotebook (2557 - 17218, n=48, last 2 years) | |
| Apple MacBook Air 2020 M1 Entry | |
| Lenovo ThinkBook 13s G3 20YA0005GE | |
| Microsoft Surface Laptop 4 13 Ryzen 5 | |
| Asus ZenBook 13 UX325EA | |
| Huawei MateBook 13s i5 11300H | |
| Dell XPS 13 9305 Core i5 FHD | |
| Average Intel Core i5-11300H (3631 - 5499, n=10) | |
| Geekbench 5.5 / Single-Core | |
| Average of class Subnotebook (726 - 2224, n=48, last 2 years) | |
| Apple MacBook Air 2020 M1 Entry | |
| Asus ZenBook 13 UX325EA | |
| Lenovo ThinkBook 13s G3 20YA0005GE | |
| Huawei MateBook 13s i5 11300H | |
| Average Intel Core i5-11300H (1342 - 1462, n=10) | |
| Dell XPS 13 9305 Core i5 FHD | |
| Microsoft Surface Laptop 4 13 Ryzen 5 | |
| HWBOT x265 Benchmark v2.2 / 4k Preset | |
| Average of class Subnotebook (0.97 - 25.1, n=56, last 2 years) | |
| HP Pavilion Aero 13 be0097nr | |
| Lenovo ThinkBook 13s G3 20YA0005GE | |
| Microsoft Surface Laptop 4 13 Ryzen 5 | |
| Huawei MateBook 13s i5 11300H | |
| Average Intel Core i5-11300H (4.32 - 8.38, n=10) | |
| Asus ZenBook 13 UX325EA | |
| LibreOffice / 20 Documents To PDF | |
| Microsoft Surface Laptop 4 13 Ryzen 5 | |
| Dell XPS 13 9305 Core i5 FHD | |
| Average of class Subnotebook (39.9 - 220, n=55, last 2 years) | |
| Asus ZenBook 13 UX325EA | |
| HP Pavilion Aero 13 be0097nr | |
| Lenovo ThinkBook 13s G3 20YA0005GE | |
| Average Intel Core i5-11300H (43.6 - 59.4, n=10) | |
| Huawei MateBook 13s i5 11300H | |
| Apple MacBook Air 2020 M1 Entry | |
| R Benchmark 2.5 / Overall mean | |
| Apple MacBook Air 2020 M1 Entry | |
| Microsoft Surface Laptop 4 13 Ryzen 5 | |
| Dell XPS 13 9305 Core i5 FHD | |
| Huawei MateBook 13s i5 11300H | |
| Average Intel Core i5-11300H (0.6 - 0.644, n=10) | |
| Asus ZenBook 13 UX325EA | |
| Lenovo ThinkBook 13s G3 20YA0005GE | |
| HP Pavilion Aero 13 be0097nr | |
| Average of class Subnotebook (0.4024 - 1.456, n=57, last 2 years) | |
* ... smaller is better
AIDA64: FP32 Ray-Trace | FPU Julia | CPU SHA3 | CPU Queen | FPU SinJulia | FPU Mandel | CPU AES | CPU ZLib | FP64 Ray-Trace | CPU PhotoWorxx
| Performance rating | |
| Lenovo ThinkBook 13s G3 20YA0005GE | |
| Average of class Subnotebook | |
| HP Pavilion Aero 13 be0097nr | |
| Microsoft Surface Laptop 4 13 Ryzen 5 | |
| Huawei MateBook 13s i5 11300H | |
| Average Intel Core i5-11300H | |
| Asus ZenBook 13 UX325EA | |
| AIDA64 / FP32 Ray-Trace | |
| Average of class Subnotebook (1135 - 32888, n=57, last 2 years) | |
| Lenovo ThinkBook 13s G3 20YA0005GE | |
| HP Pavilion Aero 13 be0097nr | |
| Microsoft Surface Laptop 4 13 Ryzen 5 | |
| Huawei MateBook 13s i5 11300H | |
| Average Intel Core i5-11300H (6128 - 8440, n=9) | |
| Asus ZenBook 13 UX325EA | |
| AIDA64 / FPU Julia | |
| Lenovo ThinkBook 13s G3 20YA0005GE | |
| HP Pavilion Aero 13 be0097nr | |
| Average of class Subnotebook (5218 - 123315, n=57, last 2 years) | |
| Microsoft Surface Laptop 4 13 Ryzen 5 | |
| Huawei MateBook 13s i5 11300H | |
| Average Intel Core i5-11300H (25739 - 33986, n=9) | |
| Asus ZenBook 13 UX325EA | |
| AIDA64 / CPU SHA3 | |
| Average of class Subnotebook (444 - 5287, n=57, last 2 years) | |
| Lenovo ThinkBook 13s G3 20YA0005GE | |
| Huawei MateBook 13s i5 11300H | |
| HP Pavilion Aero 13 be0097nr | |
| Average Intel Core i5-11300H (1773 - 2286, n=9) | |
| Asus ZenBook 13 UX325EA | |
| Microsoft Surface Laptop 4 13 Ryzen 5 | |
| AIDA64 / CPU Queen | |
| HP Pavilion Aero 13 be0097nr | |
| Lenovo ThinkBook 13s G3 20YA0005GE | |
| Microsoft Surface Laptop 4 13 Ryzen 5 | |
| Average of class Subnotebook (10579 - 95002, n=48, last 2 years) | |
| Huawei MateBook 13s i5 11300H | |
| Asus ZenBook 13 UX325EA | |
| Average Intel Core i5-11300H (41257 - 49312, n=9) | |
| AIDA64 / FPU SinJulia | |
| Lenovo ThinkBook 13s G3 20YA0005GE | |
| Microsoft Surface Laptop 4 13 Ryzen 5 | |
| HP Pavilion Aero 13 be0097nr | |
| Average of class Subnotebook (744 - 18418, n=57, last 2 years) | |
| Huawei MateBook 13s i5 11300H | |
| Average Intel Core i5-11300H (3925 - 4677, n=9) | |
| Asus ZenBook 13 UX325EA | |
| AIDA64 / FPU Mandel | |
| Lenovo ThinkBook 13s G3 20YA0005GE | |
| HP Pavilion Aero 13 be0097nr | |
| Average of class Subnotebook (3341 - 65433, n=57, last 2 years) | |
| Microsoft Surface Laptop 4 13 Ryzen 5 | |
| Huawei MateBook 13s i5 11300H | |
| Average Intel Core i5-11300H (15820 - 20669, n=9) | |
| Asus ZenBook 13 UX325EA | |
| AIDA64 / CPU AES | |
| Lenovo ThinkBook 13s G3 20YA0005GE | |
| HP Pavilion Aero 13 be0097nr | |
| Huawei MateBook 13s i5 11300H | |
| Average Intel Core i5-11300H (37694 - 71519, n=9) | |
| Asus ZenBook 13 UX325EA | |
| Average of class Subnotebook (638 - 96917, n=57, last 2 years) | |
| Microsoft Surface Laptop 4 13 Ryzen 5 | |
| AIDA64 / CPU ZLib | |
| Average of class Subnotebook (164.9 - 1379, n=57, last 2 years) | |
| Lenovo ThinkBook 13s G3 20YA0005GE | |
| Microsoft Surface Laptop 4 13 Ryzen 5 | |
| HP Pavilion Aero 13 be0097nr | |
| Huawei MateBook 13s i5 11300H | |
| Average Intel Core i5-11300H (269 - 390, n=9) | |
| Asus ZenBook 13 UX325EA | |
| AIDA64 / FP64 Ray-Trace | |
| Average of class Subnotebook (610 - 17495, n=57, last 2 years) | |
| Lenovo ThinkBook 13s G3 20YA0005GE | |
| HP Pavilion Aero 13 be0097nr | |
| Microsoft Surface Laptop 4 13 Ryzen 5 | |
| Huawei MateBook 13s i5 11300H | |
| Average Intel Core i5-11300H (3322 - 4613, n=9) | |
| Asus ZenBook 13 UX325EA | |
| AIDA64 / CPU PhotoWorxx | |
| Average of class Subnotebook (6569 - 85600, n=57, last 2 years) | |
| Asus ZenBook 13 UX325EA | |
| Huawei MateBook 13s i5 11300H | |
| Average Intel Core i5-11300H (9705 - 38002, n=9) | |
| Microsoft Surface Laptop 4 13 Ryzen 5 | |
| Lenovo ThinkBook 13s G3 20YA0005GE | |
| HP Pavilion Aero 13 be0097nr | |
系统性能
MateBook 13s是一个反应非常快的系统,这也是PCIe-SSD的结果,我们在审查期间没有发现任何问题。所有的输入都能快速执行,没有崩溃或停顿。合成基准分数证实了我们的主观印象。
这款笔记本电脑仍以Windows 10 Home系统发货,但你可以免费升级到Windows 11 Home。
CrossMark: Overall | Productivity | Creativity | Responsiveness
| PCMark 10 / Score | |
| Average of class Subnotebook (4920 - 9939, n=45, last 2 years) | |
| Lenovo ThinkBook 13s G3 20YA0005GE | |
| HP Pavilion Aero 13 be0097nr | |
| Huawei MateBook 13s i5 11300H | |
| Average Intel Core i5-11300H, Intel Iris Xe Graphics G7 80EUs (n=1) | |
| Asus ZenBook 13 UX325EA | |
| Microsoft Surface Laptop 4 13 Ryzen 5 | |
| Dell XPS 13 9305 Core i5 FHD | |
| PCMark 10 / Essentials | |
| Average of class Subnotebook (8552 - 11646, n=45, last 2 years) | |
| Lenovo ThinkBook 13s G3 20YA0005GE | |
| HP Pavilion Aero 13 be0097nr | |
| Asus ZenBook 13 UX325EA | |
| Huawei MateBook 13s i5 11300H | |
| Average Intel Core i5-11300H, Intel Iris Xe Graphics G7 80EUs (n=1) | |
| Dell XPS 13 9305 Core i5 FHD | |
| Microsoft Surface Laptop 4 13 Ryzen 5 | |
| PCMark 10 / Productivity | |
| Average of class Subnotebook (5435 - 16606, n=45, last 2 years) | |
| Lenovo ThinkBook 13s G3 20YA0005GE | |
| HP Pavilion Aero 13 be0097nr | |
| Asus ZenBook 13 UX325EA | |
| Microsoft Surface Laptop 4 13 Ryzen 5 | |
| Huawei MateBook 13s i5 11300H | |
| Average Intel Core i5-11300H, Intel Iris Xe Graphics G7 80EUs (n=1) | |
| Dell XPS 13 9305 Core i5 FHD | |
| PCMark 10 / Digital Content Creation | |
| Average of class Subnotebook (5722 - 13779, n=45, last 2 years) | |
| Lenovo ThinkBook 13s G3 20YA0005GE | |
| HP Pavilion Aero 13 be0097nr | |
| Huawei MateBook 13s i5 11300H | |
| Average Intel Core i5-11300H, Intel Iris Xe Graphics G7 80EUs (n=1) | |
| Microsoft Surface Laptop 4 13 Ryzen 5 | |
| Dell XPS 13 9305 Core i5 FHD | |
| Asus ZenBook 13 UX325EA | |
| CrossMark / Overall | |
| Average of class Subnotebook (365 - 2356, n=59, last 2 years) | |
| Apple MacBook Air 2020 M1 Entry | |
| Huawei MateBook 13s i5 11300H | |
| Average Intel Core i5-11300H, Intel Iris Xe Graphics G7 80EUs (n=1) | |
| Lenovo ThinkBook 13s G3 20YA0005GE | |
| CrossMark / Productivity | |
| Average of class Subnotebook (364 - 2277, n=59, last 2 years) | |
| Huawei MateBook 13s i5 11300H | |
| Average Intel Core i5-11300H, Intel Iris Xe Graphics G7 80EUs (n=1) | |
| Lenovo ThinkBook 13s G3 20YA0005GE | |
| Apple MacBook Air 2020 M1 Entry | |
| CrossMark / Creativity | |
| Average of class Subnotebook (372 - 2743, n=59, last 2 years) | |
| Apple MacBook Air 2020 M1 Entry | |
| Lenovo ThinkBook 13s G3 20YA0005GE | |
| Huawei MateBook 13s i5 11300H | |
| Average Intel Core i5-11300H, Intel Iris Xe Graphics G7 80EUs (n=1) | |
| CrossMark / Responsiveness | |
| Huawei MateBook 13s i5 11300H | |
| Average Intel Core i5-11300H, Intel Iris Xe Graphics G7 80EUs (n=1) | |
| Average of class Subnotebook (312 - 1854, n=59, last 2 years) | |
| Lenovo ThinkBook 13s G3 20YA0005GE | |
| Apple MacBook Air 2020 M1 Entry | |
| PCMark 10 Score | 4950 points | |
Help | ||
| AIDA64 / Memory Copy | |
| Average of class Subnotebook (14554 - 131023, n=57, last 2 years) | |
| Asus ZenBook 13 UX325EA | |
| Huawei MateBook 13s i5 11300H | |
| Microsoft Surface Laptop 4 13 Ryzen 5 | |
| Average Intel Core i5-11300H (19947 - 60141, n=9) | |
| Lenovo ThinkBook 13s G3 20YA0005GE | |
| HP Pavilion Aero 13 be0097nr | |
| AIDA64 / Memory Read | |
| Average of class Subnotebook (15948 - 127174, n=57, last 2 years) | |
| Asus ZenBook 13 UX325EA | |
| Huawei MateBook 13s i5 11300H | |
| Microsoft Surface Laptop 4 13 Ryzen 5 | |
| Average Intel Core i5-11300H (22688 - 62684, n=9) | |
| HP Pavilion Aero 13 be0097nr | |
| Lenovo ThinkBook 13s G3 20YA0005GE | |
| AIDA64 / Memory Write | |
| Average of class Subnotebook (15709 - 135141, n=57, last 2 years) | |
| Asus ZenBook 13 UX325EA | |
| Huawei MateBook 13s i5 11300H | |
| Average Intel Core i5-11300H (20959 - 65245, n=9) | |
| Microsoft Surface Laptop 4 13 Ryzen 5 | |
| Lenovo ThinkBook 13s G3 20YA0005GE | |
| HP Pavilion Aero 13 be0097nr | |
| AIDA64 / Memory Latency | |
| Microsoft Surface Laptop 4 13 Ryzen 5 | |
| Lenovo ThinkBook 13s G3 20YA0005GE | |
| Average of class Subnotebook (6.1 - 159.9, n=55, last 2 years) | |
| HP Pavilion Aero 13 be0097nr | |
| Huawei MateBook 13s i5 11300H | |
| Asus ZenBook 13 UX325EA | |
| Average Intel Core i5-11300H (76.3 - 93.6, n=9) | |
* ... smaller is better
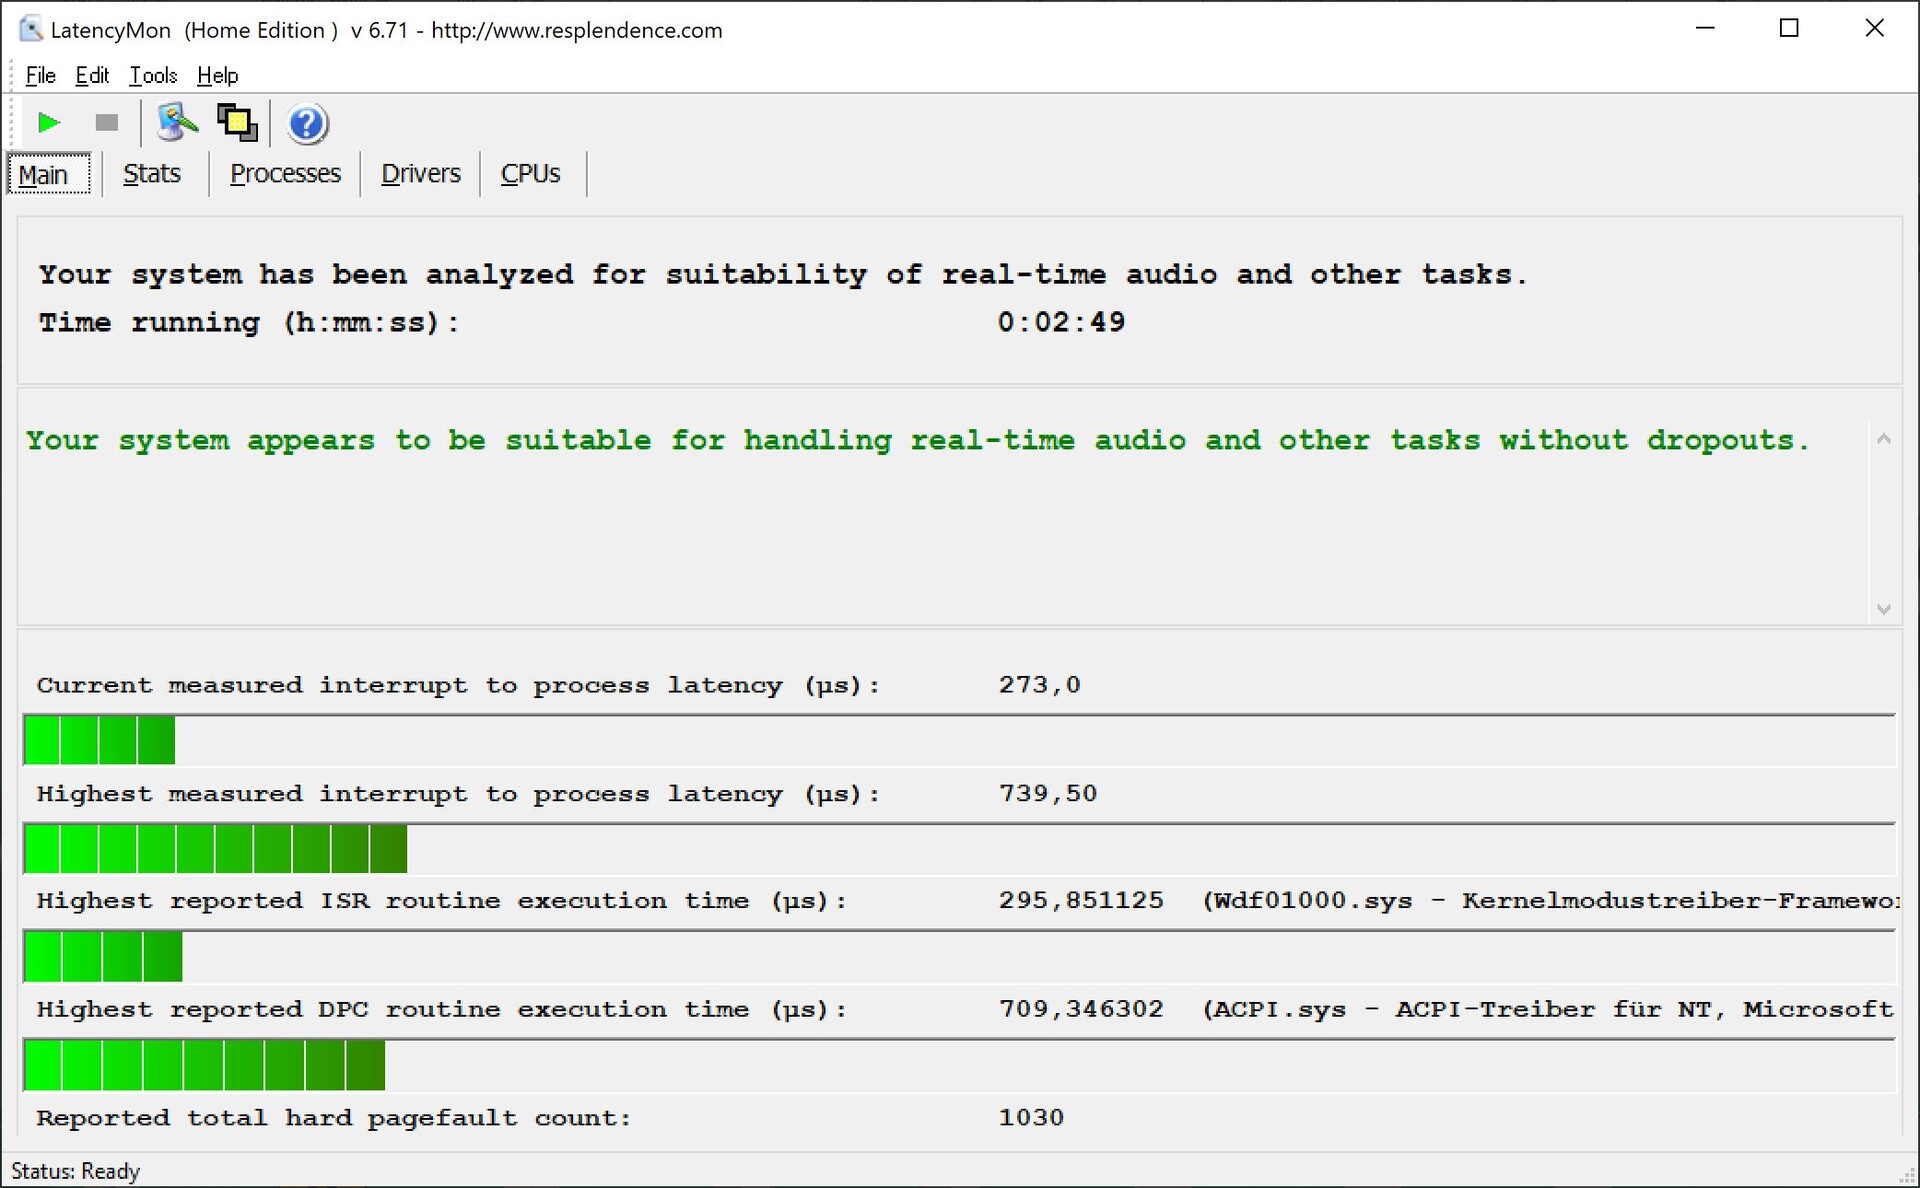
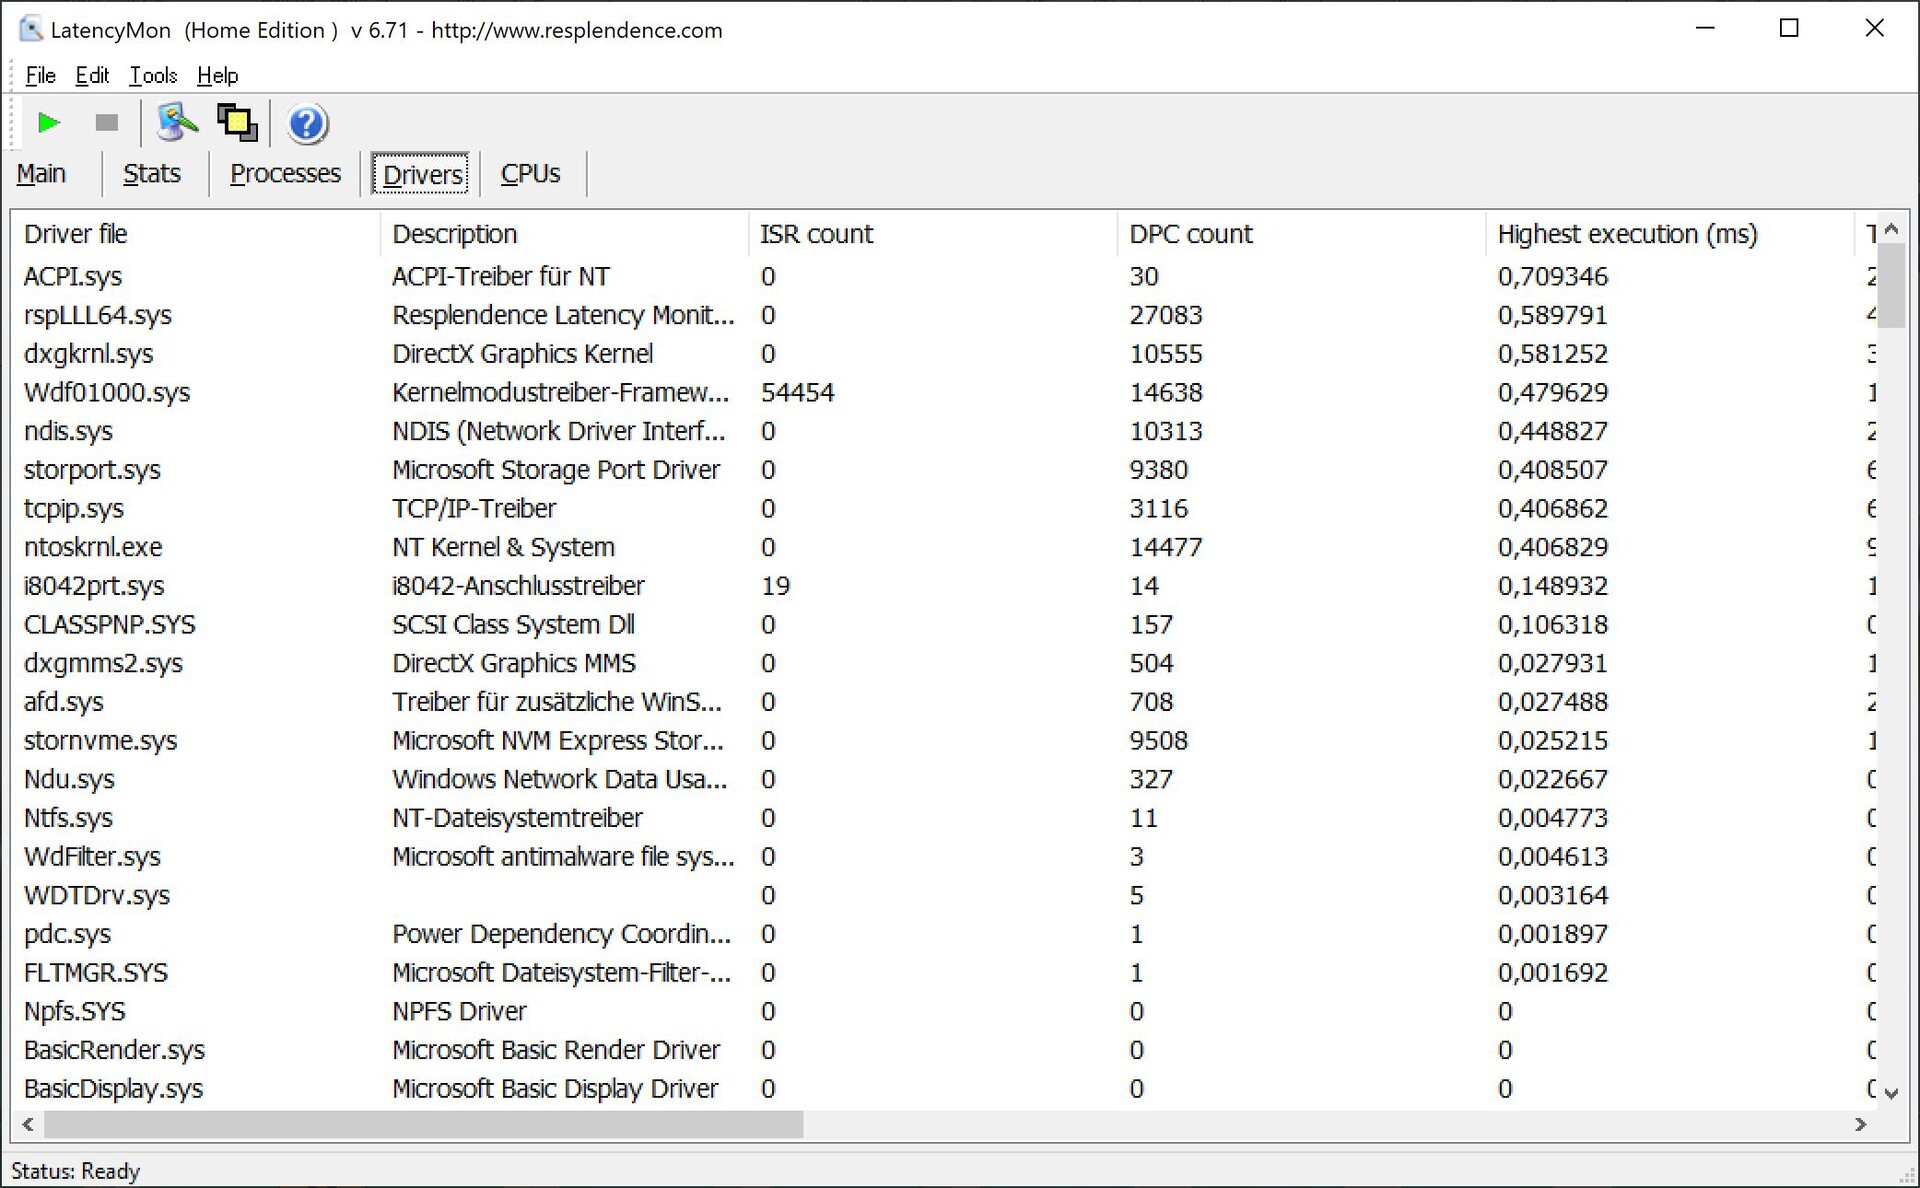
DPC延时
我们的标准化延迟测试(YouTube、网页浏览、CPU负载)没有发现MateBook 13s的任何延迟问题,但我们在播放4K YouTube视频时注意到一些丢帧。
| DPC Latencies / LatencyMon - interrupt to process latency (max), Web, Youtube, Prime95 | |
| Asus ZenBook 13 UX325EA | |
| HP Pavilion Aero 13 be0097nr | |
| Microsoft Surface Laptop 4 13 Ryzen 5 | |
| Huawei MateBook 13s i5 11300H | |
| Lenovo ThinkBook 13s G3 20YA0005GE | |
| Dell XPS 13 9305 Core i5 FHD | |
* ... smaller is better
存储设备
华为没有实现现代PCIe 4.0接口,但来自Phison Electronics的PCIe 3.0 x4固态硬盘的性能仍然非常好。你得到的存储容量为512GB,初始设置后有409GB可以免费使用,但与其他华为笔记本电脑类似,有两个分区。系统驱动器的容量被限制在70GB多一点,这意味着如果你在安装应用程序或下载文件时不注意,很快就会出现问题。这种分区在实践中是非常恼人的,我们只能希望华为在未来的设备中不要使用这种分区。更多的SSD基准测试可在 这里.

| Drive Performance rating - Percent | |
| Huawei MateBook 13s i5 11300H | |
| Average Phison Electronics PS5012 | |
| Average of class Subnotebook | |
| Asus ZenBook 13 UX325EA | |
| Dell XPS 13 9305 Core i5 FHD | |
| Lenovo ThinkBook 13s G3 20YA0005GE | |
| HP Pavilion Aero 13 be0097nr | |
| Microsoft Surface Laptop 4 13 Ryzen 5 | |
* ... smaller is better
Disk throttling: DiskSpd Read Loop, Queue Depth 8
GPU性能
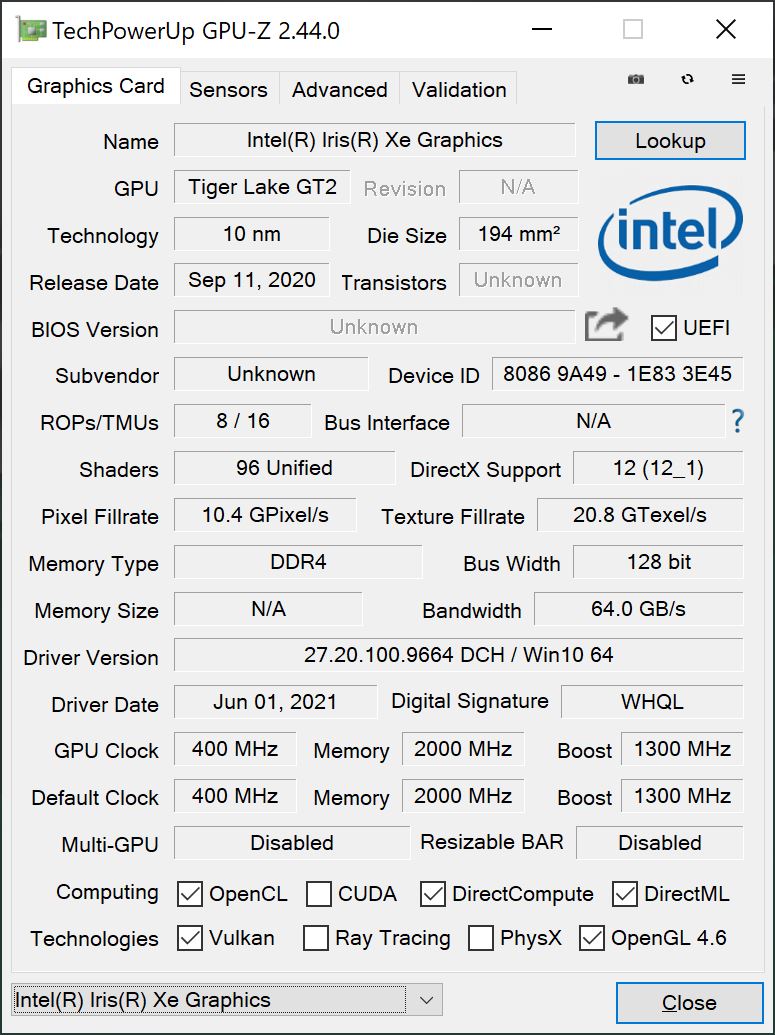
所有的图形计算都由集成的Iris Xe Graphics G7,但它是两个版本中较慢的,只有80个EU。但它是两个版本中较慢的一个,只有80个EUs。iGPU得益于双通道内存配置,其性能达到了预期水平,大约比拥有96个EU的Xe Graphics G7慢20%。Xe Graphics G7的96个EUs(在i7 CPU中),但仍然领先于AMD Radeon RX Vega 8 iGPU在Ryzen 5000 CPU中。
由于集成了视频解码器,Xe Graphics G7是日常多媒体任务的一个非常好的选择。性能也很稳定,甚至苛刻的Time Spy 压力测试也能轻松通过,达到99.6%。新的Alder Lake CPU仍然配备了Xe iGPU,所以在这方面不会有很大的优势。
图形性能在电池电量上不会降低。更多的GPU基准测试被列在 我们的技术部分.
| 3DMark Performance rating - Percent | |
| Average of class Subnotebook | |
| Asus ZenBook 13 UX325EA | |
| Dell XPS 13 9305 Core i5 FHD -1! | |
| Lenovo ThinkBook 13s G3 20YA0005GE | |
| Huawei MateBook 13s i5 11300H | |
| HP Pavilion Aero 13 be0097nr | |
| Average Intel Iris Xe Graphics G7 80EUs | |
| Microsoft Surface Laptop 4 13 Ryzen 5 -1! | |
| 3DMark 11 - 1280x720 Performance GPU | |
| Average of class Subnotebook (995 - 18489, n=54, last 2 years) | |
| Asus ZenBook 13 UX325EA | |
| Lenovo ThinkBook 13s G3 20YA0005GE | |
| Dell XPS 13 9305 Core i5 FHD | |
| HP Pavilion Aero 13 be0097nr | |
| Huawei MateBook 13s i5 11300H | |
| Average Intel Iris Xe Graphics G7 80EUs (2246 - 6579, n=112) | |
| Microsoft Surface Laptop 4 13 Ryzen 5 | |
| 3DMark 11 Performance | 6225 points | |
| 3DMark Cloud Gate Standard Score | 16115 points | |
| 3DMark Fire Strike Score | 3868 points | |
| 3DMark Time Spy Score | 1512 points | |
Help | ||
游戏性能
Witcher 3 FPS Chart
| low | med. | high | ultra | |
|---|---|---|---|---|
| GTA V (2015) | 102 | 88.8 | 24.9 | 9.73 |
| The Witcher 3 (2015) | 84 | 54 | 28 | 12.2 |
| Dota 2 Reborn (2015) | 119 | 89.9 | 57.2 | 52.6 |
| Final Fantasy XV Benchmark (2018) | 40.4 | 22.1 | 15.7 | |
| X-Plane 11.11 (2018) | 41.3 | 33.8 | 30.9 | |
| Far Cry 5 (2018) | 53 | 25 | 23 | 22 |
| Strange Brigade (2018) | 81.9 | 34.5 | 27.5 | 22.3 |
| F1 2020 (2020) | 76 | 42 | 31 | 20 |
排放 - MateBook是一个安静的伴侣
系统噪音
MateBook 13s的冷却解决方案包括两个风扇和一个热管。总而言之,这是一台非常安静的笔记本电脑,最大的风扇噪音没有达到40dB(A)的标准。风扇的杂音也不烦人,也不高调。在轻度工作负荷下,笔记本电脑通常是安静的,我们没有注意到任何其他电子噪音。
Noise level
| Idle |
| 24.5 / 24.5 / 28 dB(A) |
| Load |
| 35.9 / 38.6 dB(A) |
 | ||
30 dB silent 40 dB(A) audible 50 dB(A) loud |
||
min: | ||
| Huawei MateBook 13s i5 11300H Iris Xe G7 80EUs, i5-11300H, Phison Electronics PS5012 | Lenovo ThinkBook 13s G3 20YA0005GE Vega 8, R7 5800U, WDC PC SN530 SDBPNPZ-512G | Microsoft Surface Laptop 4 13 Ryzen 5 Vega 7, R5 4680U, Samsung PM991 MZ9LQ256HBJQ | Asus ZenBook 13 UX325EA Iris Xe G7 96EUs, i7-1165G7, SK Hynix HFM001TD3JX013N | Apple MacBook Air 2020 M1 Entry M1 7-Core GPU, M1, Apple SSD AP0256Q | Dell XPS 13 9305 Core i5 FHD Iris Xe G7 80EUs, i5-1135G7, Samsung PM9A1 MZVL2512HCJQ | HP Pavilion Aero 13 be0097nr Vega 8, R7 5800U, Intel SSD 660p SSDPEKNW512G8 | |
|---|---|---|---|---|---|---|---|
| Noise | -9% | 0% | -11% | 2% | 6% | ||
| off / environment * (dB) | 24.5 | 24.7 -1% | 24.6 -0% | 26 -6% | 26 -6% | 23.9 2% | |
| Idle Minimum * (dB) | 24.5 | 24.7 -1% | 24.6 -0% | 26 -6% | 26 -6% | 23.9 2% | |
| Idle Average * (dB) | 24.5 | 27 -10% | 24.6 -0% | 26 -6% | 26 -6% | 23.9 2% | |
| Idle Maximum * (dB) | 28 | 29.8 -6% | 24.6 12% | 30.5 -9% | 26 7% | 23.9 15% | |
| Load Average * (dB) | 35.9 | 42.4 -18% | 39.5 -10% | 43.9 -22% | 33.5 7% | 32.2 10% | |
| Witcher 3 ultra * (dB) | 35.9 | 42.4 -18% | 33.5 7% | 34.7 3% | |||
| Load Maximum * (dB) | 38.6 | 42.4 -10% | 39.5 -2% | 43.9 -14% | 33.5 13% | 34.8 10% |
* ... smaller is better
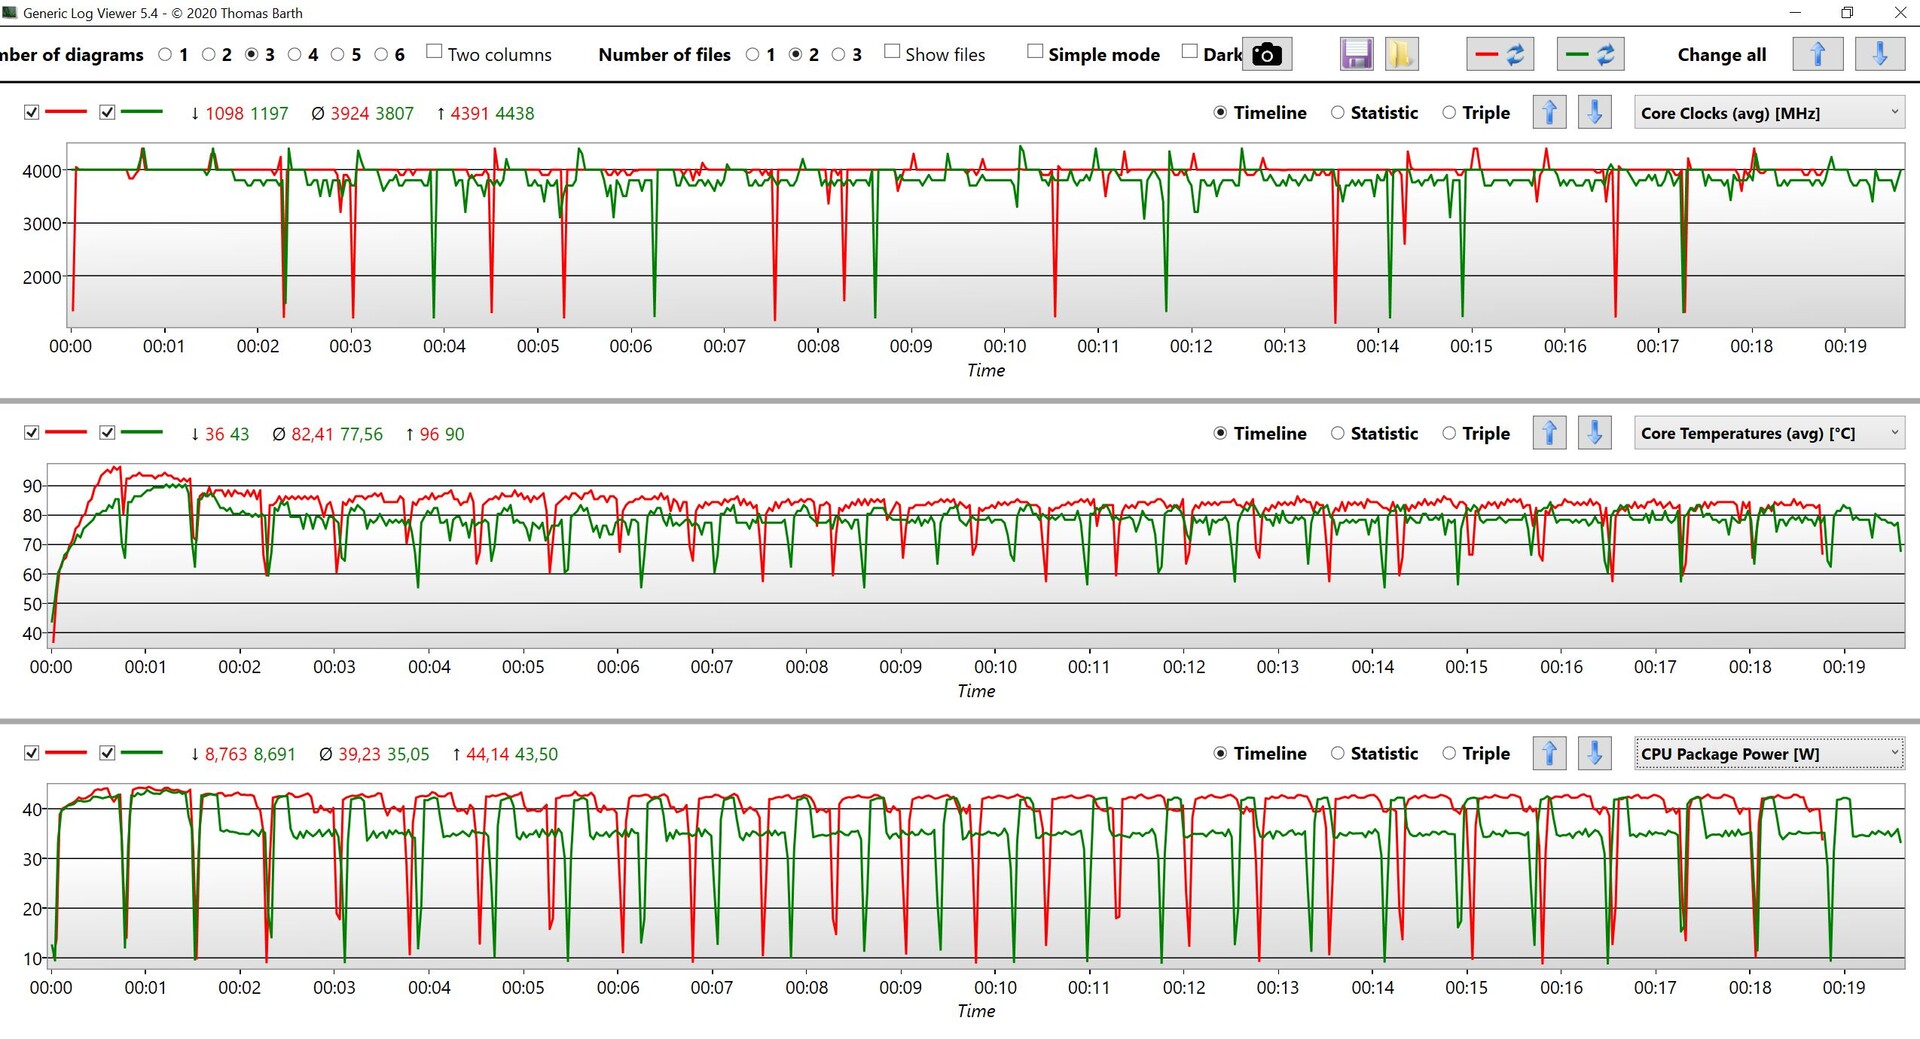
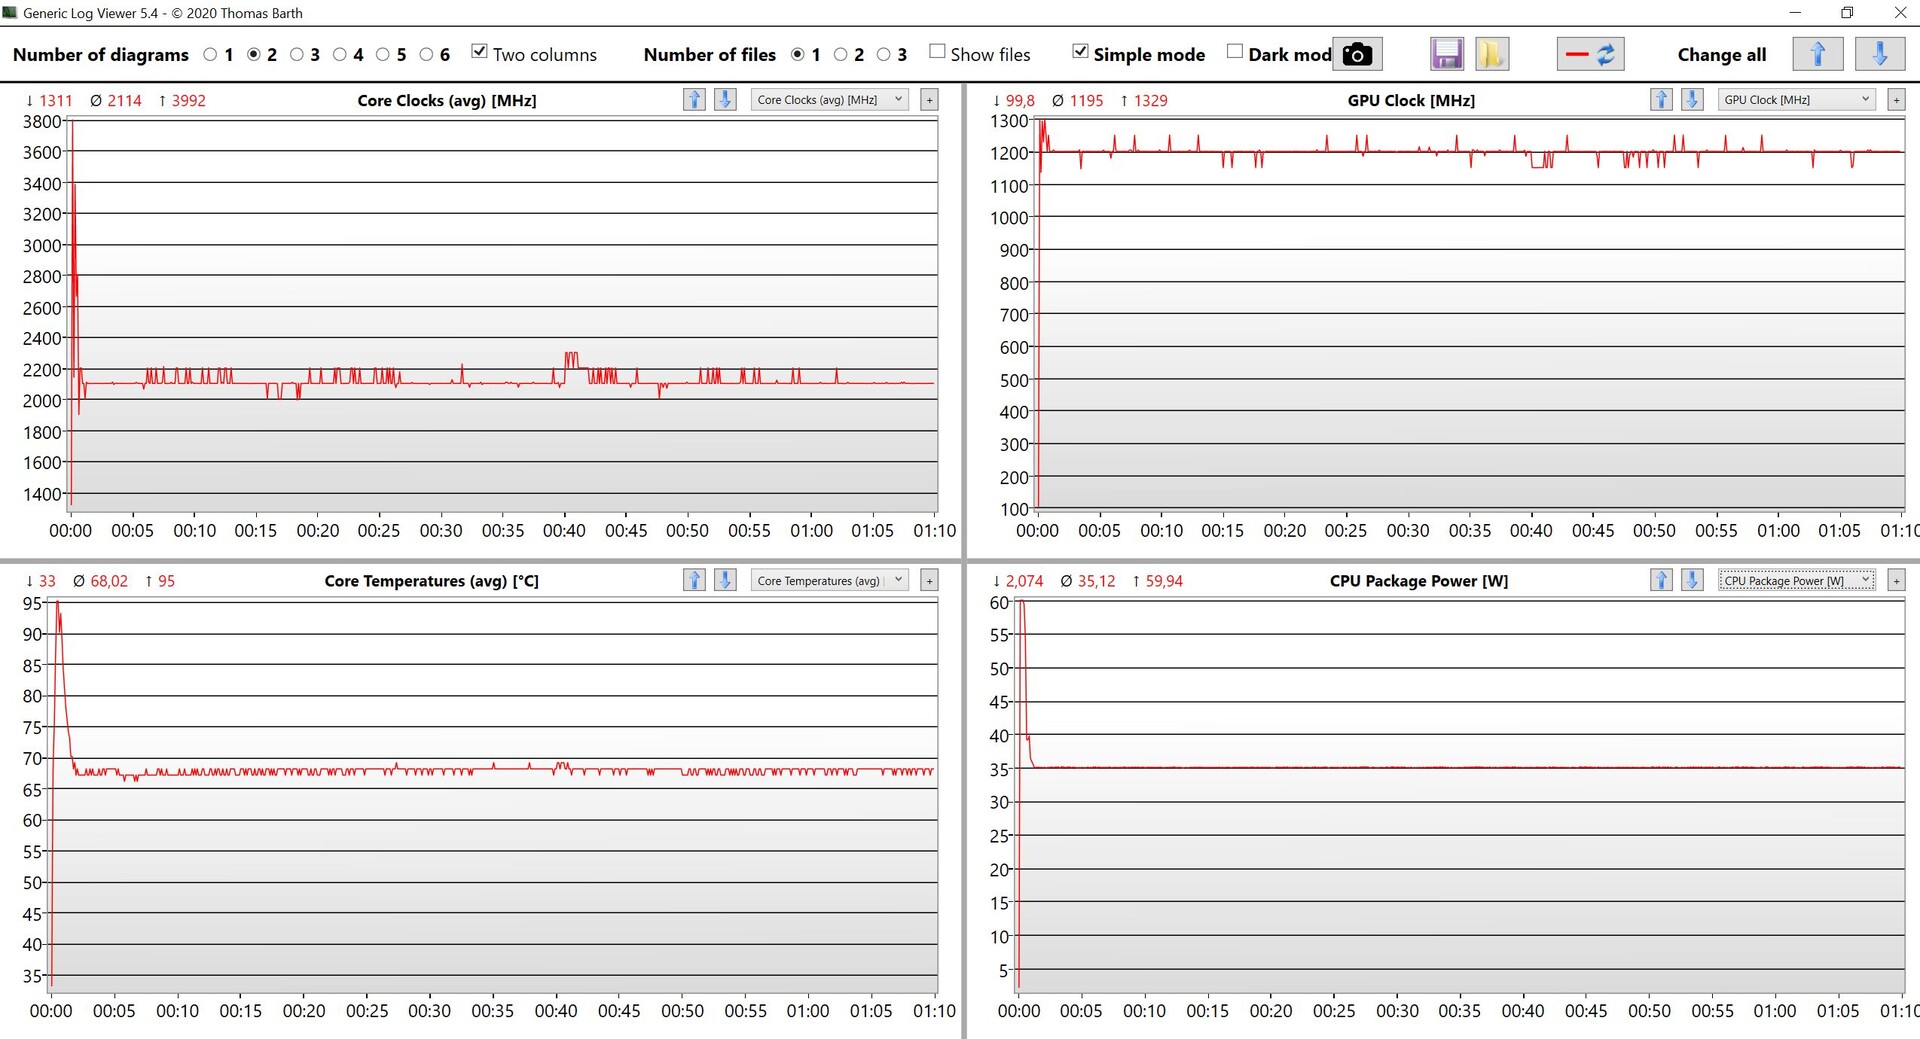
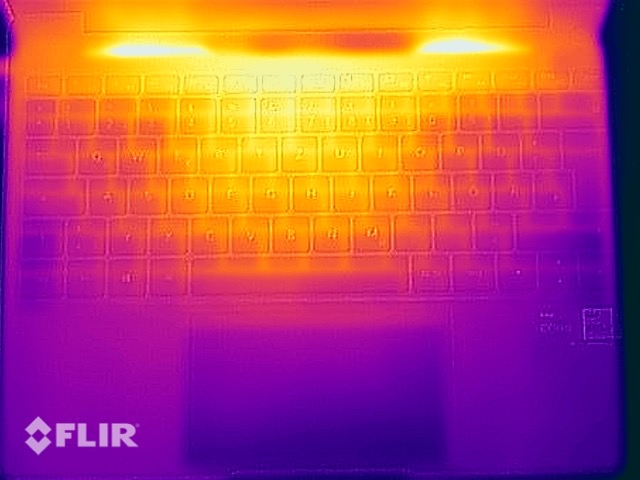
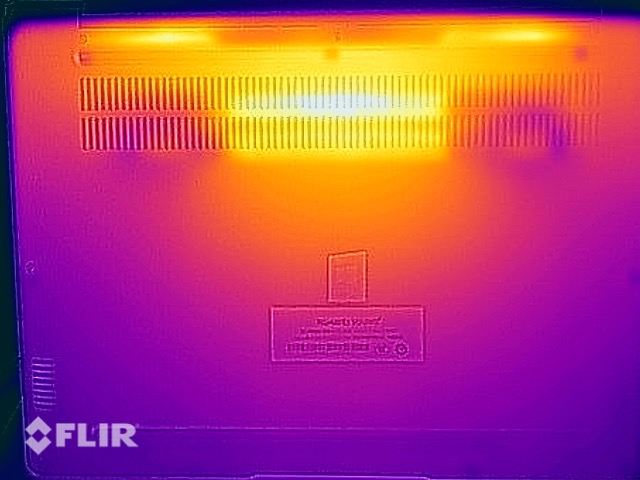
温度
MateBook 13s的表面温度完全不挑剔。在网页浏览或视频播放等轻度工作负荷中,该设备几乎没有发热,在压力测试中,基本单元的顶部和底部只有一个热点,但高达46℃的温度绝不是问题。在游戏过程中,这款笔记本保持了一定的温度,你可以轻松地把它放在腿上。
在压力测试开始时,功耗上升到60瓦,然后迅速稳定在35瓦并保持在那里。我们没有注意到压力测试后立即出现的性能下降。
(±) The maximum temperature on the upper side is 42.8 °C / 109 F, compared to the average of 35.9 °C / 97 F, ranging from 21.4 to 59 °C for the class Subnotebook.
(-) The bottom heats up to a maximum of 46.9 °C / 116 F, compared to the average of 39.2 °C / 103 F
(+) In idle usage, the average temperature for the upper side is 24.2 °C / 76 F, compared to the device average of 30.8 °C / 87 F.
(±) Playing The Witcher 3, the average temperature for the upper side is 33.7 °C / 93 F, compared to the device average of 30.8 °C / 87 F.
(+) The palmrests and touchpad are cooler than skin temperature with a maximum of 27.7 °C / 81.9 F and are therefore cool to the touch.
(±) The average temperature of the palmrest area of similar devices was 28.2 °C / 82.8 F (+0.5 °C / 0.9 F).
| Huawei MateBook 13s i5 11300H Intel Core i5-11300H, Intel Iris Xe Graphics G7 80EUs | Lenovo ThinkBook 13s G3 20YA0005GE AMD Ryzen 7 5800U, AMD Radeon RX Vega 8 (Ryzen 4000/5000) | Microsoft Surface Laptop 4 13 Ryzen 5 AMD Ryzen 5 4680U, AMD Radeon RX Vega 7 | Asus ZenBook 13 UX325EA Intel Core i7-1165G7, Intel Iris Xe Graphics G7 96EUs | Apple MacBook Air 2020 M1 Entry Apple M1, Apple M1 7-Core GPU | Dell XPS 13 9305 Core i5 FHD Intel Core i5-1135G7, Intel Iris Xe Graphics G7 80EUs | HP Pavilion Aero 13 be0097nr AMD Ryzen 7 5800U, AMD Radeon RX Vega 8 (Ryzen 4000/5000) | |
|---|---|---|---|---|---|---|---|
| Heat | 10% | -1% | -1% | -2% | -1% | 2% | |
| Maximum Upper Side * (°C) | 42.8 | 36.5 15% | 45.8 -7% | 39.3 8% | 44 -3% | 43.5 -2% | 35.6 17% |
| Maximum Bottom * (°C) | 46.9 | 39.6 16% | 45.5 3% | 47.3 -1% | 44 6% | 44.8 4% | 38.6 18% |
| Idle Upper Side * (°C) | 25.2 | 24.5 3% | 24.9 1% | 25.9 -3% | 27 -7% | 26.2 -4% | 29.6 -17% |
| Idle Bottom * (°C) | 26 | 25 4% | 25.7 1% | 27.8 -7% | 27 -4% | 26.4 -2% | 29 -12% |
* ... smaller is better
发言人
华为实现了4个扬声器模块,结合音频软件提供了非常好的音质,其结果相当接近于MacBook Air M1.对于一个紧凑的设备来说,性能是非常好的,外部扬声器并不是真的需要。由于结构的原因,没有多少真正的低音,但这也是竞争对手的情况。基本单元的前缘有四个麦克风,我们的测试录音很清晰,没有明显的噪音。
Huawei MateBook 13s i5 11300H audio analysis
(+) | speakers can play relatively loud (85.4 dB)
Bass 100 - 315 Hz
(±) | reduced bass - on average 7.6% lower than median
(±) | linearity of bass is average (7.6% delta to prev. frequency)
Mids 400 - 2000 Hz
(±) | higher mids - on average 5.4% higher than median
(+) | mids are linear (4.1% delta to prev. frequency)
Highs 2 - 16 kHz
(+) | balanced highs - only 3.6% away from median
(+) | highs are linear (5.5% delta to prev. frequency)
Overall 100 - 16.000 Hz
(+) | overall sound is linear (10.5% difference to median)
Compared to same class
» 8% of all tested devices in this class were better, 3% similar, 89% worse
» The best had a delta of 5%, average was 18%, worst was 53%
Compared to all devices tested
» 5% of all tested devices were better, 1% similar, 93% worse
» The best had a delta of 4%, average was 23%, worst was 134%
Apple MacBook Air 2020 M1 Entry audio analysis
(±) | speaker loudness is average but good (79.6 dB)
Bass 100 - 315 Hz
(±) | reduced bass - on average 7.1% lower than median
(±) | linearity of bass is average (9.5% delta to prev. frequency)
Mids 400 - 2000 Hz
(+) | balanced mids - only 2.2% away from median
(+) | mids are linear (5.3% delta to prev. frequency)
Highs 2 - 16 kHz
(+) | balanced highs - only 2.3% away from median
(+) | highs are linear (4% delta to prev. frequency)
Overall 100 - 16.000 Hz
(+) | overall sound is linear (8.7% difference to median)
Compared to same class
» 3% of all tested devices in this class were better, 1% similar, 96% worse
» The best had a delta of 5%, average was 18%, worst was 53%
Compared to all devices tested
» 3% of all tested devices were better, 1% similar, 97% worse
» The best had a delta of 4%, average was 23%, worst was 134%
能源管理 - 良好的耐力
消耗功率
闲置时,MateBook 13s需要的电量比对手多一点,但你必须考虑更高的分辨率以及亮度。负载下的功耗非常稳定;你可以预期在游戏时约为40W,负载下高达68W,但这一数值很快就在50W左右趋于平稳,并保持在那里(与处理器的功耗类似)。待机和设备关闭时的结果还可以。
| Off / Standby | |
| Idle | |
| Load |
|
Key:
min: | |
| Huawei MateBook 13s i5 11300H i5-11300H, Iris Xe G7 80EUs, Phison Electronics PS5012, LTPS, 2520x1680, 13.4" | Lenovo ThinkBook 13s G3 20YA0005GE R7 5800U, Vega 8, WDC PC SN530 SDBPNPZ-512G, IPS, 1920x1200, 13.3" | Microsoft Surface Laptop 4 13 Ryzen 5 R5 4680U, Vega 7, Samsung PM991 MZ9LQ256HBJQ, IPS, 2256x1504, 13.5" | Asus ZenBook 13 UX325EA i7-1165G7, Iris Xe G7 96EUs, SK Hynix HFM001TD3JX013N, OLED, 1920x1080, 13.3" | Apple MacBook Air 2020 M1 Entry M1, M1 7-Core GPU, Apple SSD AP0256Q, IPS, 2560x1600, 13.3" | Dell XPS 13 9305 Core i5 FHD i5-1135G7, Iris Xe G7 80EUs, Samsung PM9A1 MZVL2512HCJQ, IPS, 1920x1080, 13.3" | HP Pavilion Aero 13 be0097nr R7 5800U, Vega 8, Intel SSD 660p SSDPEKNW512G8, IPS, 1920x1200, 13.3" | Average Intel Iris Xe Graphics G7 80EUs | Average of class Subnotebook | |
|---|---|---|---|---|---|---|---|---|---|
| Power Consumption | -3% | 14% | 25% | 39% | 15% | 15% | 4% | 9% | |
| Idle Minimum * (Watt) | 4.2 | 5 -19% | 3.4 19% | 3.6 14% | 1.9 55% | 3.2 24% | 3.4 19% | 4.49 ? -7% | 3.73 ? 11% |
| Idle Average * (Watt) | 8.1 | 8.2 -1% | 6.3 22% | 6.3 22% | 6.4 21% | 6.7 17% | 6.9 15% | 7.4 ? 9% | 6.51 ? 20% |
| Idle Maximum * (Watt) | 9 | 9 -0% | 8.1 10% | 7.6 16% | 7 22% | 10.5 -17% | 8 11% | 9.26 ? -3% | 7.88 ? 12% |
| Load Average * (Watt) | 41.7 | 45 -8% | 36.2 13% | 31 26% | 25 40% | 28.5 32% | 42.6 -2% | 36.6 ? 12% | 42.3 ? -1% |
| Witcher 3 ultra * (Watt) | 40.1 | 45.1 -12% | 28.5 29% | 35.2 12% | |||||
| Load Maximum * (Watt) | 68 | 51.2 25% | 64.1 6% | 36 47% | 30.3 55% | 64 6% | 43.1 37% | 61.7 ? 9% | 64.8 ? 5% |
* ... smaller is better
Power consumption Witcher 3 / Stress test
Power consumption external screen
电池运行时间
尽管分辨率高、亮度高,但LTPS显示屏非常高效,60Wh的电池能够实现长时间的电池运行。华为宣传的时间长达11.5小时,我们几乎可以确认这个数值。在150尼特的调整亮度下(占我们测试设备最大亮度的47%),我们的视频测试运行了11小时,Wi-Fi测试运行了9.5小时。当我们用90赫兹模式重复这两项测试时,我们无法注意到运行时间的减少。当你使用全面板亮度时,Wi-Fi的运行时间下降到6.5小时。电池充满电大约需要75分钟。
这些结果是好的,但对手(通常采用较低的显示分辨率)表现得更好,尤其是MacBook Air M1效率极高,在Wi-Fi测试中可持续使用16小时。
| Huawei MateBook 13s i5 11300H i5-11300H, Iris Xe G7 80EUs, 60 Wh | Lenovo ThinkBook 13s G3 20YA0005GE R7 5800U, Vega 8, 56 Wh | Microsoft Surface Laptop 4 13 Ryzen 5 R5 4680U, Vega 7, 47.4 Wh | Asus ZenBook 13 UX325EA i7-1165G7, Iris Xe G7 96EUs, 67 Wh | Apple MacBook Air 2020 M1 Entry M1, M1 7-Core GPU, 49.9 Wh | Dell XPS 13 9305 Core i5 FHD i5-1135G7, Iris Xe G7 80EUs, 52 Wh | HP Pavilion Aero 13 be0097nr R7 5800U, Vega 8, 43 Wh | Average of class Subnotebook | |
|---|---|---|---|---|---|---|---|---|
| Battery runtime | 17% | 16% | 32% | 70% | 40% | 5% | 38% | |
| H.264 (h) | 11 | 10.2 -7% | 15.3 ? 39% | |||||
| WiFi v1.3 (h) | 9.4 | 11 17% | 10.9 16% | 10.7 14% | 16 70% | 9.2 -2% | 9 -4% | 14 ? 49% |
| Load (h) | 1.6 | 3 88% | 2.9 81% | 1.8 13% | 1.998 ? 25% | |||
| Witcher 3 ultra (h) | 3.2 | |||||||
| Reader / Idle (h) | 25.4 | 18.9 | 28.6 ? |
Pros
Cons
结论 - MateBook 13s没有任何真正的缺点
MateBook 13s在我们的审查中留下了非常好的印象,华为设法提供了一个伟大的整体包装,没有任何真正的缺点。你从一个日常伴侣那里得到了几乎所有你可能想要的东西,包括一个复杂而紧凑的机箱,良好的键盘,伟大的显示器,良好的系统性能,安静的风扇,良好的扬声器,以及体面的电池运行时间。
你必须仔细观察才能发现任何缺点。不好的网络摄像头当然是一个方面,但它现在至少是在正确的位置。霹雳4和PCIe 4.0也没有,但这对大多数用户来说应该不重要。系统驱动器容量有限的SSD分区更令人讨厌。由于光泽的触摸屏,它也不适合在户外使用。
一个伟大的包装,没有任何真正的缺点。华为MateBook 13s是一款非常好的副笔记本,不必躲在MacBook Air等对手的后面。
如果你现在正在寻找一款副笔记本,你肯定应该把MateBook 13s列入候选名单。如果你需要更多的CPU性能,你目前只能选择配备AMD CPU的笔记本电脑,如ThinkBook 13s或Pavilion Aero 13,至少在我们得到采用英特尔最新Alder Lake芯片的副笔记本之前。微软自己的笔记本电脑已经开始感觉过时了,而华硕ZenBook 13提供了一个具有更广泛色域的OLED屏幕。戴尔的XPS 13 9305也有点过时了,因为它采用了16:9的显示屏,而较新的型号XPS 13 9310只是比MateBook 13s更贵。最后,还有目前的MacBook Air,由于采用了M1处理器,效率极高,而且完全被动冷却(静音操作)。
Huawei MateBook 13s i5 11300H
- 02/19/2022 v7 (old)
Andreas Osthoff
Price comparison

