Apple MacBook Pro 15 (2016年末, 2.6 GHz i7) 笔记本电脑简短评测


| Networking | |
| iperf3 transmit AX12 | |
| Apple MacBook Pro 15 2016 (2.6 GHz, 450) (Klaus I211) | |
| Apple MacBook Pro Retina 13 inch 2013-10 (Klaus I211) | |
| Apple MacBook Pro 13 2016 (Klaus I211) | |
| Acer Spin 7 SP714-51-M09D (jseb) | |
| Dell XPS 13 9360 QHD+ i7 | |
| Lenovo ThinkPad T460s-20FA003GGE | |
| iperf3 receive AX12 | |
| Apple MacBook Pro 15 2016 (2.6 GHz, 450) (Klaus I211) | |
| Apple MacBook Pro Retina 13 inch 2013-10 (Klaus I211) | |
| Apple MacBook Pro 13 2016 (Klaus I211) | |
| Dell XPS 13 9360 QHD+ i7 | |
| Lenovo ThinkPad T460s-20FA003GGE | |
| Acer Spin 7 SP714-51-M09D (jseb) | |
| |||||||||||||||||||||||||
Brightness Distribution: 92 %
Center on Battery: 483 cd/m²
Contrast: 1464:1 (Black: 0.33 cd/m²)
ΔE ColorChecker Calman: 1.4 | ∀{0.5-29.43 Ø4.72}
ΔE Greyscale Calman: 1.5 | ∀{0.09-98 Ø4.97}
Gamma: 2.34
CCT: 6650 K
| Apple MacBook Pro 15 2016 (2.6 GHz, 450) 2880x1800, 15.4" | Apple MacBook Pro 13 2016 APPA034, , 2560x1600, 13.3" | Apple MacBook Pro Retina 15 inch 2015-05 APPA02E, , 2880x1800, 15.4" | Dell XPS 15 9550 i7 FHD 1920x1080, 15.6" | Asus Zenbook UX510UW-CN044T LG Philips LP156WF6-SPB6, , 1920x1080, 15.6" | |
|---|---|---|---|---|---|
| Display | |||||
| Display P3 Coverage (%) | 97.1 | 61.4 | 68.5 | 61.5 | |
| sRGB Coverage (%) | 99.8 | 90.8 | 97.2 | 80.4 | |
| AdobeRGB 1998 Coverage (%) | 86.7 | 62.9 | 70.4 | 58.8 | |
| Response Times | -33% | -48% | 16% | ||
| Response Time Grey 50% / Grey 80% * (ms) | 47.3 ? | 47.2 ? -0% | 64 ? -35% | 40 ? 15% | |
| Response Time Black / White * (ms) | 31.2 ? | 51.6 ? -65% | 50 ? -60% | 26 ? 17% | |
| PWM Frequency (Hz) | 117000 ? | ||||
| Screen | -12% | -24% | -119% | -114% | |
| Brightness middle (cd/m²) | 483 | 600 24% | 341 -29% | 371.5 -23% | 326 -33% |
| Brightness (cd/m²) | 465 | 564 21% | 315 -32% | 356 -23% | 316 -32% |
| Brightness Distribution (%) | 92 | 89 -3% | 82 -11% | 92 0% | 80 -13% |
| Black Level * (cd/m²) | 0.33 | 0.57 -73% | 0.34 -3% | 0.252 24% | 0.35 -6% |
| Contrast (:1) | 1464 | 1053 -28% | 1003 -31% | 1474 1% | 931 -36% |
| Colorchecker dE 2000 * | 1.4 | 1.5 -7% | 2.07 -48% | 5.55 -296% | 5.49 -292% |
| Colorchecker dE 2000 max. * | 3 | 2.9 3% | 3.27 -9% | 10.95 -265% | 11.36 -279% |
| Greyscale dE 2000 * | 1.5 | 2 -33% | 1.9 -27% | 7.1 -373% | 4.84 -223% |
| Gamma | 2.34 94% | 2.27 97% | 2.62 84% | 2.1 105% | 2.23 99% |
| CCT | 6650 98% | 6855 95% | 6514 100% | 5971 109% | |
| Color Space (Percent of AdobeRGB 1998) (%) | 77 | 58 | 63.4 | 53 | |
| Color Space (Percent of sRGB) (%) | 92 | 91 | 97.9 | 80 | |
| Total Average (Program / Settings) | -23% /
-16% | -24% /
-24% | -84% /
-105% | -49% /
-88% |
* ... smaller is better
Display Response Times
| ↔ Response Time Black to White | ||
|---|---|---|
| 31.2 ms ... rise ↗ and fall ↘ combined | ↗ 16.7 ms rise | 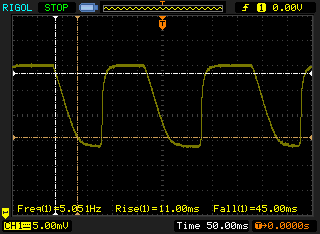 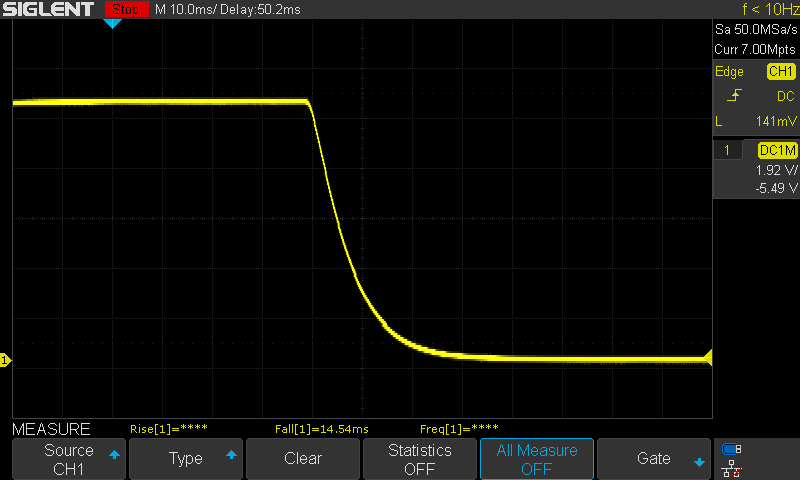 |
| ↘ 14.5 ms fall | ||
| The screen shows slow response rates in our tests and will be unsatisfactory for gamers. In comparison, all tested devices range from 0.1 (minimum) to 240 (maximum) ms. » 84 % of all devices are better. This means that the measured response time is worse than the average of all tested devices (19.8 ms). | ||
| ↔ Response Time 50% Grey to 80% Grey | ||
| 47.3 ms ... rise ↗ and fall ↘ combined | ↗ 22.1 ms rise | 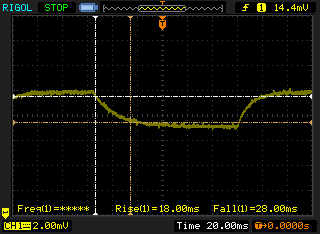 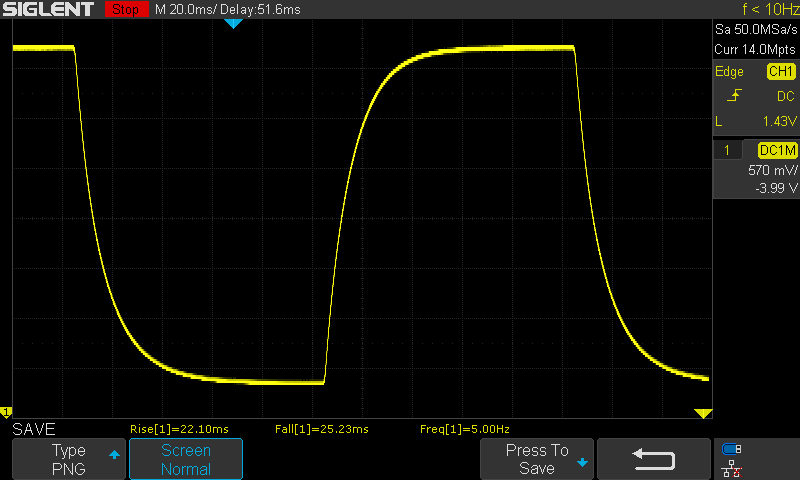 |
| ↘ 25.2 ms fall | ||
| The screen shows slow response rates in our tests and will be unsatisfactory for gamers. In comparison, all tested devices range from 0.165 (minimum) to 636 (maximum) ms. » 82 % of all devices are better. This means that the measured response time is worse than the average of all tested devices (31 ms). | ||
Screen Flickering / PWM (Pulse-Width Modulation)
| Screen flickering / PWM detected | 117000 Hz | ≤ 80 % brightness setting | 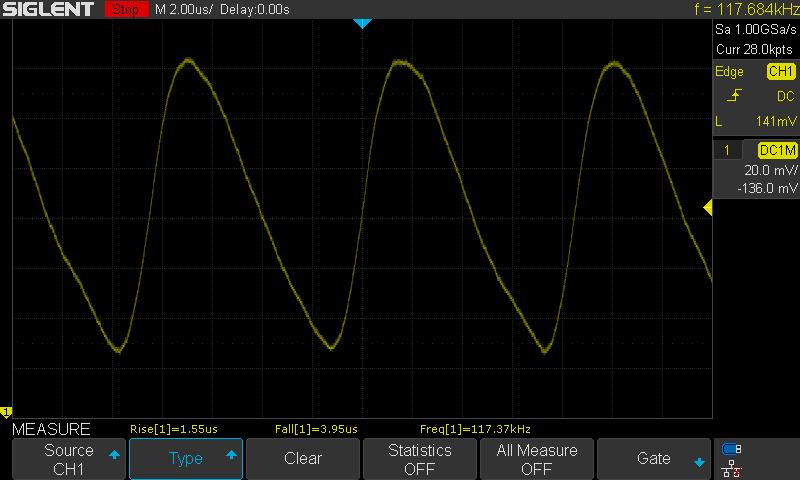 |
| ≤ 200 cd/m² brightness | |||
The display backlight flickers at 117000 Hz (worst case, e.g., utilizing PWM) Flickering detected at a brightness setting of 80 % (200 cd/m²) and below. There should be no flickering or PWM above this brightness setting. The frequency of 117000 Hz is quite high, so most users sensitive to PWM should not notice any flickering. Flickering occurs even at high brightness setting and may have an effect on the user during everyday use. In comparison: 52 % of all tested devices do not use PWM to dim the display. If PWM was detected, an average of 7753 (minimum: 5 - maximum: 343500) Hz was measured. | |||
| PCMark 8 Home Score Accelerated v2 | 3637 points | |
| PCMark 8 Work Score Accelerated v2 | 4426 points | |
Help | ||
| 3DMark 11 - 1280x720 Performance | |
| HP Omen 15-ax007ng | |
| Apple MacBook Pro 15 2016 (2.9 GHz, 460) | |
| Apple MacBook Pro 15 2016 (2.6 GHz, 450) | |
| Asus Zenbook UX510UW-CN044T | |
| Asus N552VX-FY103T | |
| Apple MacBook Pro Retina 15 inch 2015-05 | |
| Apple MacBook Pro 13 2016 | |
| 3DMark - 1920x1080 Fire Strike Score | |
| HP Omen 15-ax007ng | |
| Apple MacBook Pro 15 2016 (2.9 GHz, 460) | |
| Dell XPS 15 9550 i7 FHD | |
| Asus Zenbook UX510UW-CN044T | |
| Apple MacBook Pro 15 2016 (2.6 GHz, 450) | |
| Asus N552VX-FY103T | |
| Apple MacBook Pro Retina 15 inch 2015-05 | |
| Apple MacBook Pro 13 2016 | |
| Unigine Valley 1.0 - 1920x1080 Extreme HD Preset OpenGL AA:x8 | |
| Apple MacBook Pro 15 2016 (2.9 GHz, 460) | |
| Apple MacBook Pro 15 2016 (2.9 GHz, 460) | |
| Apple MacBook Pro 15 2016 (2.6 GHz, 450) | |
| Apple MacBook Pro 13 2016 | |
| 3DMark 06 Standard Score | 24189 points | |
| 3DMark Vantage P Result | 14245 points | |
| 3DMark 11 Performance | 4914 points | |
| 3DMark Cloud Gate Standard Score | 14305 points | |
| 3DMark Fire Strike Score | 3027 points | |
| 3DMark Fire Strike Extreme Score | 1440 points | |
| 3DMark Time Spy Score | 1074 points | |
Help | ||
| Fallout 4 | |
| 1280x720 Low Preset AA:FX | |
| Apple MacBook Pro 15 2016 (2.6 GHz, 450) | |
| Apple MacBook Pro 13 2016 | |
| Acer Spin 7 SP714-51-M09D | |
| Apple MacBook 12 (Early 2016) 1.1 GHz | |
| 1920x1080 High Preset AA:T AF:16x | |
| Dell XPS 15 9550 i7 FHD | |
| Apple MacBook Pro 15 2016 (2.6 GHz, 450) | |
| XCOM 2 - 1920x1080 Medium Preset AA:FX AF:2x | |
| Apple MacBook Pro 15 2016 (2.6 GHz, 450) | |
| Deus Ex Mankind Divided | |
| 1280x720 Low Preset AF:1x | |
| Apple MacBook Pro 15 2016 (2.6 GHz, 450) | |
| Asus Zenbook UX510UW-CN044T | |
| Acer Aspire E5-575G-549D | |
| Apple MacBook Pro 13 2016 | |
| Apple MacBook Pro 13 2016 | |
| Acer Spin 7 SP714-51-M09D | |
| 1920x1080 High Preset AF:4x | |
| Apple MacBook Pro 15 2016 (2.6 GHz, 450) | |
| Apple MacBook Pro 15 2016 (2.6 GHz, 450) | |
| Asus Zenbook UX510UW-CN044T | |
| Acer Aspire E5-575G-549D | |
| low | med. | high | ultra | 4K | |
|---|---|---|---|---|---|
| The Witcher 3 (2015) | 40.9 | 20.3 | |||
| Dota 2 Reborn (2015) | 67.2 | ||||
| World of Warships (2015) | 44.6 | ||||
| Anno 2205 (2015) | 87 | 18.3 | |||
| Fallout 4 (2015) | 70 | 24.1 | |||
| Rainbow Six Siege (2015) | 39.6 | 34.1 | |||
| Rise of the Tomb Raider (2016) | 66.6 | 20.7 | |||
| XCOM 2 (2016) | 63.7 | 24.2 | 15.5 | 5.6 | |
| Far Cry Primal (2016) | 29 | 26 | 17 | ||
| The Division (2016) | 77 | 21.6 | 15.8 | ||
| Doom (2016) | 53.4 | 20.4 | |||
| Overwatch (2016) | 153 | 57 | 39.5 | ||
| Deus Ex Mankind Divided (2016) | 51.2 | 18.3 | 7.5 | ||
| Mafia 3 (2016) | 28.3 | ||||
| Battlefield 1 (2016) | 101 | 24.2 | 21.7 | ||
| Civilization 6 (2016) | 61 | 25.8 | |||
| Farming Simulator 17 (2016) | 63.4 | 24.7 | |||
| Call of Duty Infinite Warfare (2016) | 58.7 | 36 | |||
| Dishonored 2 (2016) | 29.5 | ||||
| Watch Dogs 2 (2016) | 47.4 | 17.6 | |||
| For Honor (2017) | 82.3 | 29.3 | 27.9 | 19.4 | |
| Ghost Recon Wildlands (2017) | 48.2 | 21.3 | 18.5 | 8 | |
| Mass Effect Andromeda (2017) | 68.2 | 26.5 | 16.4 | ||
| Rocket League (2017) | 47.5 | 19.3 | |||
| Playerunknown's Battlegrounds (PUBG) (2017) | 63.3 | ||||
| F1 2017 (2017) | 95 | 41 | 33 | ||
| Ark Survival Evolved (2017) | 38.9 | 12 |
Noise level
| Idle |
| 30.6 / 30.6 / 30.6 dB(A) |
| Load |
| 34.7 / 46.3 dB(A) |
 | ||
30 dB silent 40 dB(A) audible 50 dB(A) loud |
||
min: | ||
(±) The maximum temperature on the upper side is 43 °C / 109 F, compared to the average of 36.8 °C / 98 F, ranging from 21 to 71 °C for the class Multimedia.
(±) The bottom heats up to a maximum of 40 °C / 104 F, compared to the average of 39.1 °C / 102 F
(+) In idle usage, the average temperature for the upper side is 24.8 °C / 77 F, compared to the device average of 31.3 °C / 88 F.
(+) The palmrests and touchpad are cooler than skin temperature with a maximum of 28 °C / 82.4 F and are therefore cool to the touch.
(±) The average temperature of the palmrest area of similar devices was 28.7 °C / 83.7 F (+0.7 °C / 1.3 F).
Apple MacBook Pro 15 2016 (2.6 GHz, 450) audio analysis
(+) | speakers can play relatively loud (86 dB)
Bass 100 - 315 Hz
(±) | reduced bass - on average 6.9% lower than median
(±) | linearity of bass is average (12.7% delta to prev. frequency)
Mids 400 - 2000 Hz
(±) | higher mids - on average 5% higher than median
(±) | linearity of mids is average (9.5% delta to prev. frequency)
Highs 2 - 16 kHz
(+) | balanced highs - only 2% away from median
(+) | highs are linear (4.3% delta to prev. frequency)
Overall 100 - 16.000 Hz
(+) | overall sound is linear (9.7% difference to median)
Compared to same class
» 13% of all tested devices in this class were better, 1% similar, 85% worse
» The best had a delta of 5%, average was 17%, worst was 45%
Compared to all devices tested
» 4% of all tested devices were better, 1% similar, 95% worse
» The best had a delta of 4%, average was 23%, worst was 134%
Apple MacBook 12 (Early 2016) 1.1 GHz audio analysis
(+) | speakers can play relatively loud (83.6 dB)
Bass 100 - 315 Hz
(±) | reduced bass - on average 11.3% lower than median
(±) | linearity of bass is average (14.2% delta to prev. frequency)
Mids 400 - 2000 Hz
(+) | balanced mids - only 2.4% away from median
(+) | mids are linear (5.5% delta to prev. frequency)
Highs 2 - 16 kHz
(+) | balanced highs - only 2% away from median
(+) | highs are linear (4.5% delta to prev. frequency)
Overall 100 - 16.000 Hz
(+) | overall sound is linear (10.2% difference to median)
Compared to same class
» 7% of all tested devices in this class were better, 2% similar, 91% worse
» The best had a delta of 5%, average was 18%, worst was 53%
Compared to all devices tested
» 5% of all tested devices were better, 1% similar, 94% worse
» The best had a delta of 4%, average was 23%, worst was 134%
Apple MacBook Pro 13 2016 audio analysis
(+) | speakers can play relatively loud (83.2 dB)
Bass 100 - 315 Hz
(±) | reduced bass - on average 8.4% lower than median
(-) | bass is not linear (16.7% delta to prev. frequency)
Mids 400 - 2000 Hz
(+) | balanced mids - only 4.7% away from median
(+) | mids are linear (6.3% delta to prev. frequency)
Highs 2 - 16 kHz
(+) | balanced highs - only 1.1% away from median
(+) | highs are linear (2.6% delta to prev. frequency)
Overall 100 - 16.000 Hz
(+) | overall sound is linear (9.8% difference to median)
Compared to same class
» 6% of all tested devices in this class were better, 2% similar, 92% worse
» The best had a delta of 5%, average was 18%, worst was 53%
Compared to all devices tested
» 4% of all tested devices were better, 1% similar, 95% worse
» The best had a delta of 4%, average was 23%, worst was 134%
| Off / Standby | |
| Idle | |
| Load |
|
Key:
min: | |
| Apple MacBook Pro 15 2016 (2.6 GHz, 450) 6700HQ, Radeon Pro 450, Apple SSD SM0256L, IPS, 2880x1800, 15.4" | Apple MacBook Pro 13 2016 6360U, Iris Graphics 540, Apple SSD AP0256, , 2560x1600, 13.3" | Apple MacBook Pro 13 2016 (2.9 GHz) 6267U, Iris Graphics 550, Apple SSD AP0256, , 2560x1600, 13.3" | Apple MacBook Pro Retina 15 inch 2015-05 4870HQ, Radeon R9 M370X, Apple SSD SM0512G, IPS-Panel, 2880x1800, 15.4" | Apple MacBook Pro Retina 13 inch 2015-03 5257U, Iris Graphics 6100, Apple SSD SM0128G, IPS-Panel, 2560x1600, 13.3" | Dell XPS 15-9550 i7 6700HQ, GeForce GTX 960M, Samsung PM951 NVMe 512 GB, IGZO WLED 330 cd/m² 1000:1 Hard Coating 3H, 3840x2160, 15.6" | |
|---|---|---|---|---|---|---|
| Power Consumption | 21% | 23% | -40% | 18% | -127% | |
| Idle Minimum * (Watt) | 2.9 | 3 -3% | 2.1 28% | 6 -107% | 2.8 3% | 12.5 -331% |
| Idle Average * (Watt) | 9.7 | 8.9 8% | 7.6 22% | 12.8 -32% | 7.8 20% | 19.6 -102% |
| Idle Maximum * (Watt) | 10.1 | 8.9 12% | 8.2 19% | 13.3 -32% | 8.1 20% | 22.8 -126% |
| Load Average * (Watt) | 65 | 43.4 33% | 56.4 13% | 82.4 -27% | 52.4 19% | 102 -57% |
| Load Maximum * (Watt) | 89.5 | 42.1 53% | 59.8 33% | 91.8 -3% | 62.8 30% | 107 -20% |
* ... smaller is better
| Apple MacBook Pro 15 2016 (2.6 GHz, 450) 6700HQ, Radeon Pro 450, 76 Wh | Apple MacBook Pro 13 2016 6360U, Iris Graphics 540, 54 Wh | Apple MacBook Pro Retina 15 inch 2015-05 4870HQ, Radeon R9 M370X, 100 Wh | Dell XPS 15 9550 i7 FHD 6700HQ, GeForce GTX 960M, 84 Wh | Asus Zenbook UX510UW-CN044T 6500U, GeForce GTX 960M, 48 Wh | |
|---|---|---|---|---|---|
| Battery runtime | 41% | 17% | 46% | 11% | |
| H.264 (h) | 8.6 | 10.3 20% | 6.9 -20% | 7.1 -17% | |
| WiFi v1.3 (h) | 10 | 11.4 14% | 7.2 -28% | 9.1 -9% | 7.2 -28% |
| Load (h) | 0.9 | 1.7 89% | 1.8 100% | 1.8 100% | 1.6 78% |
| Reader / Idle (h) | 42.6 | 17.3 | 16.3 | 13.6 |
Pros
Cons
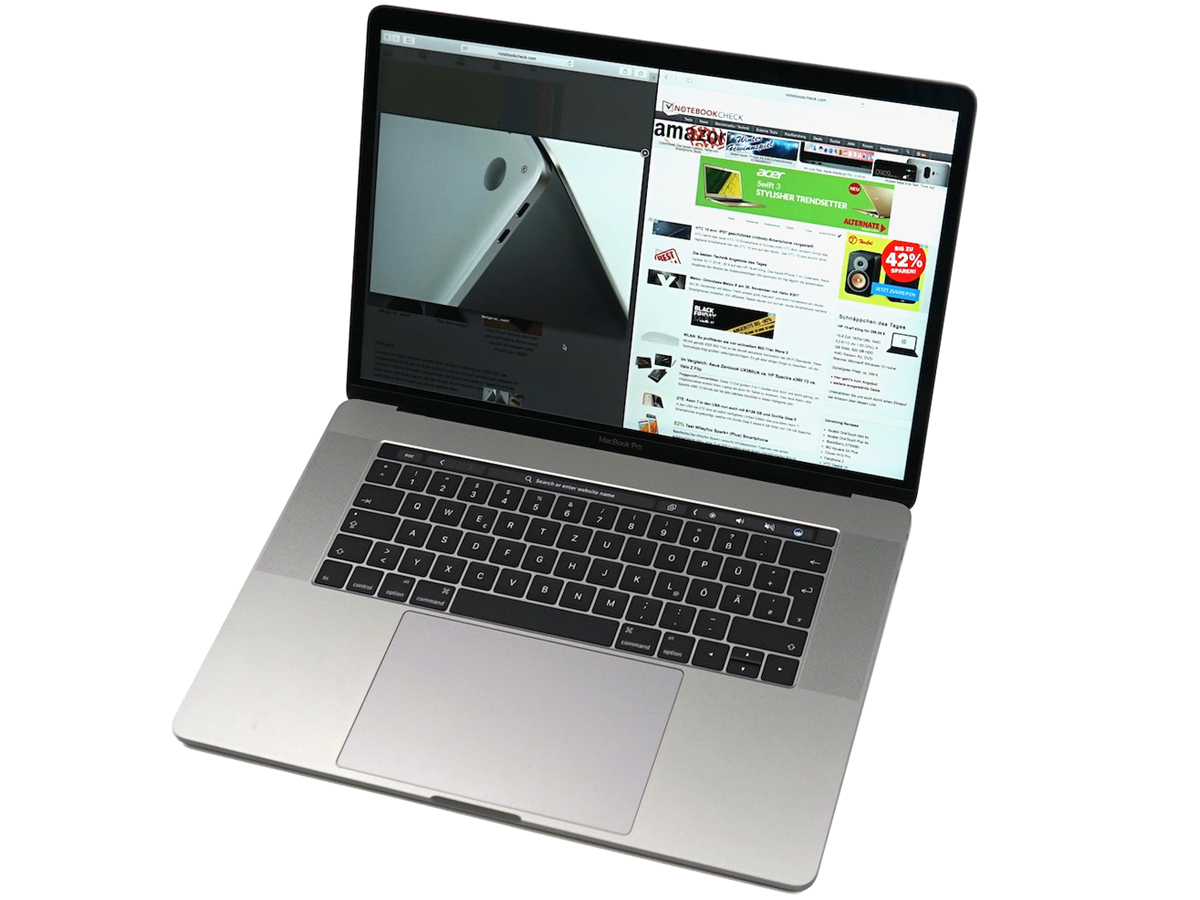
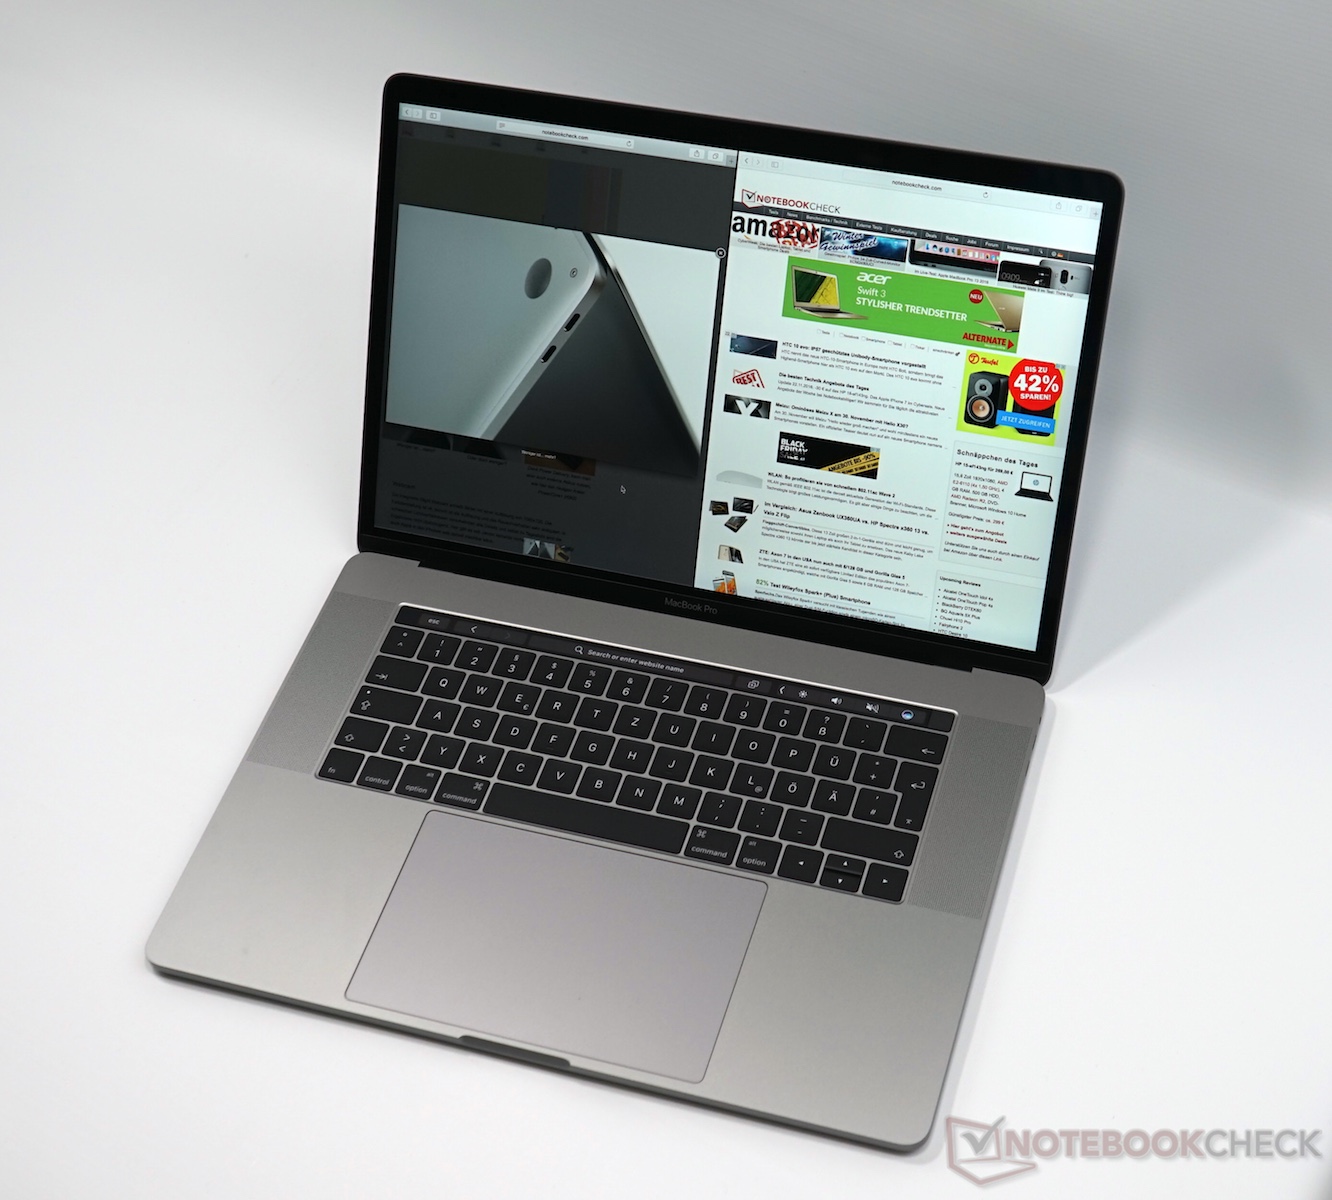
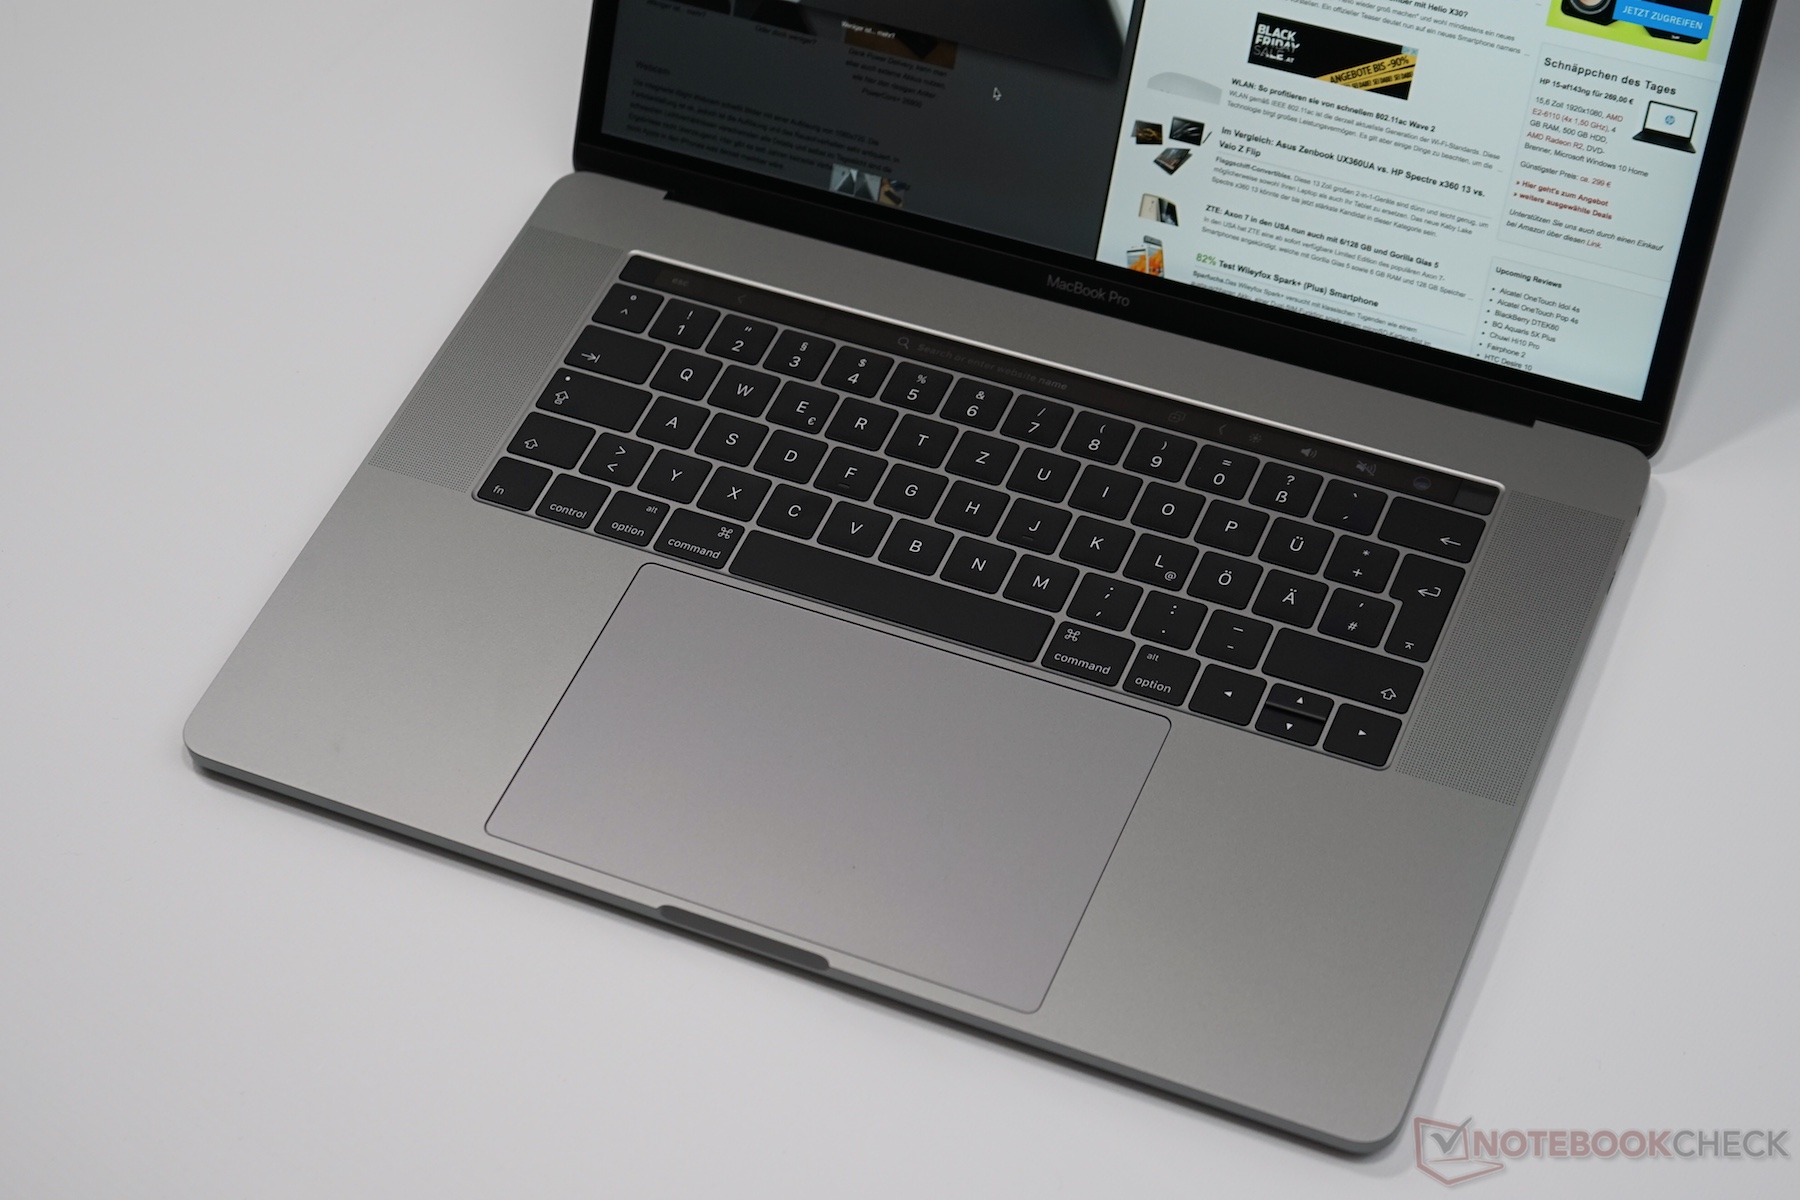
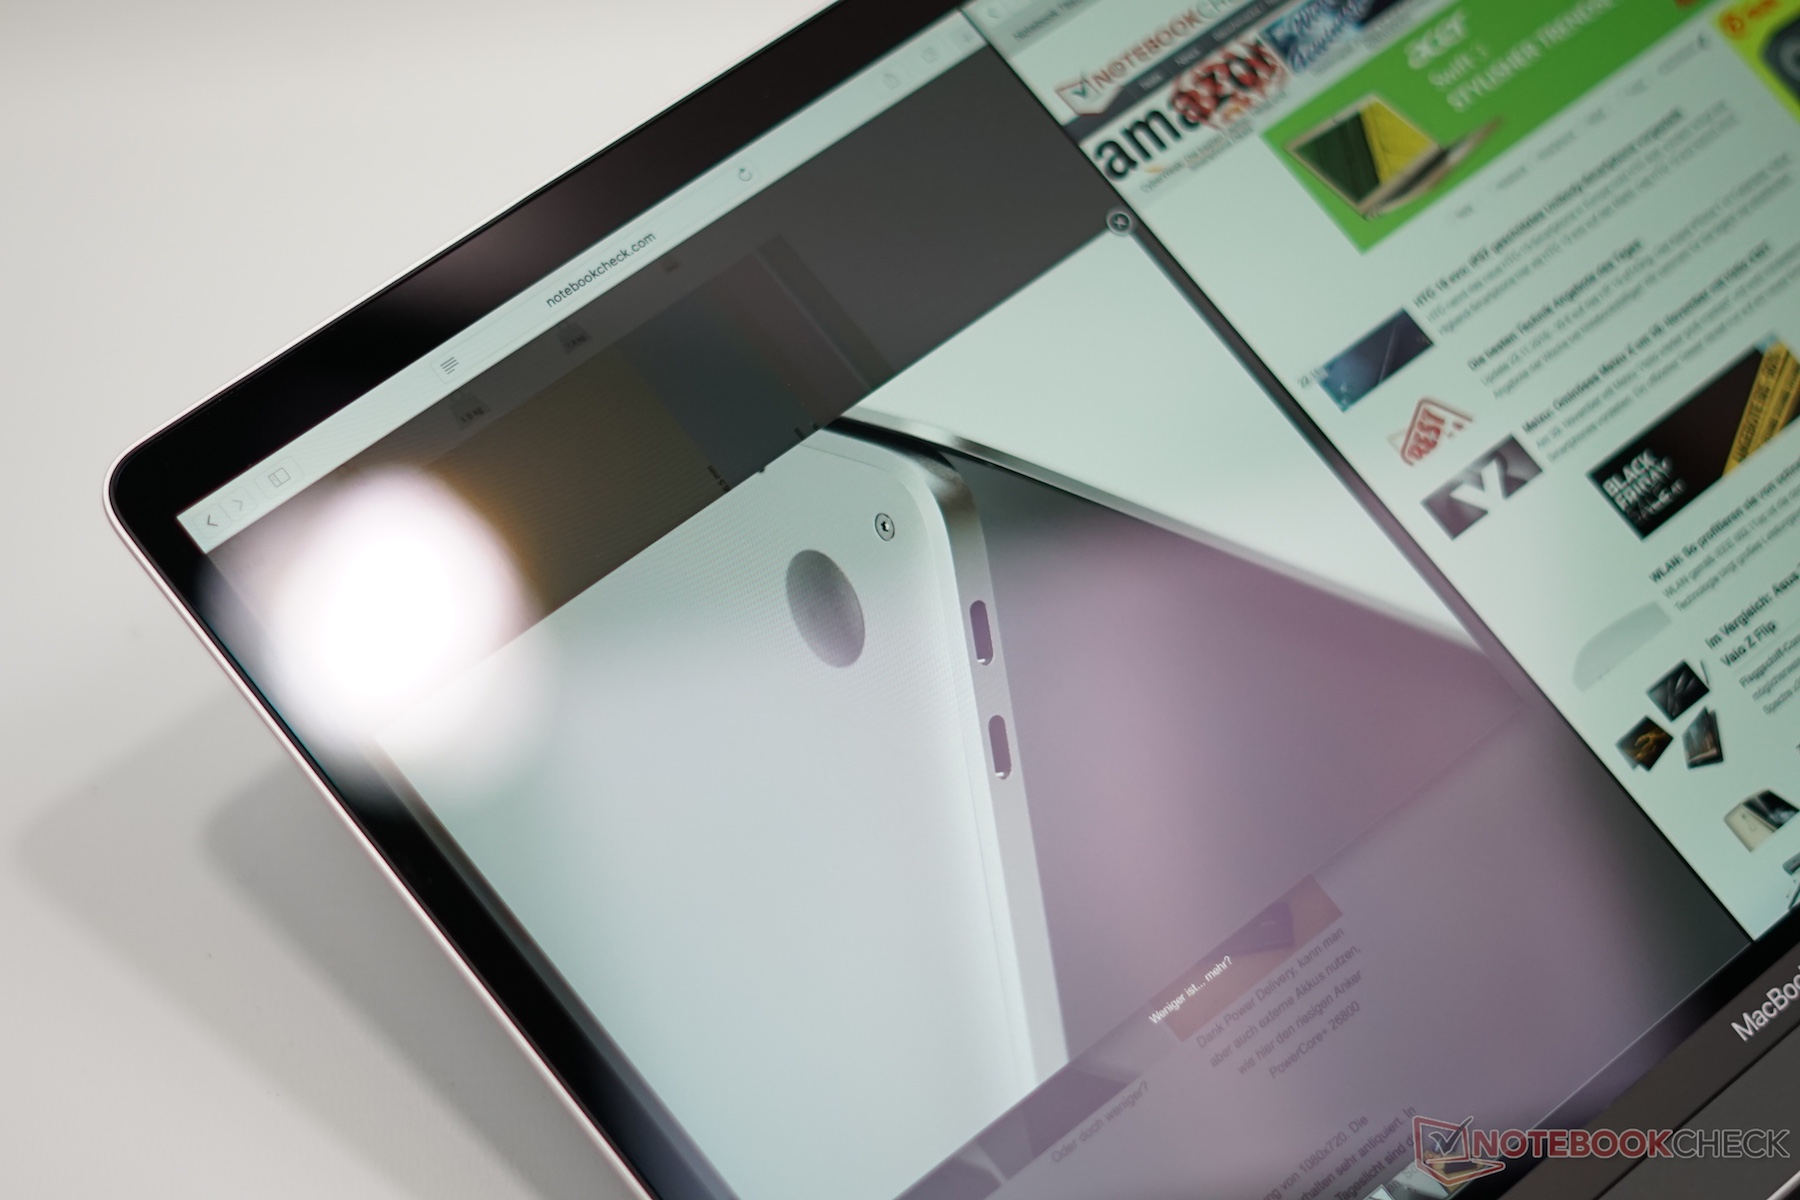
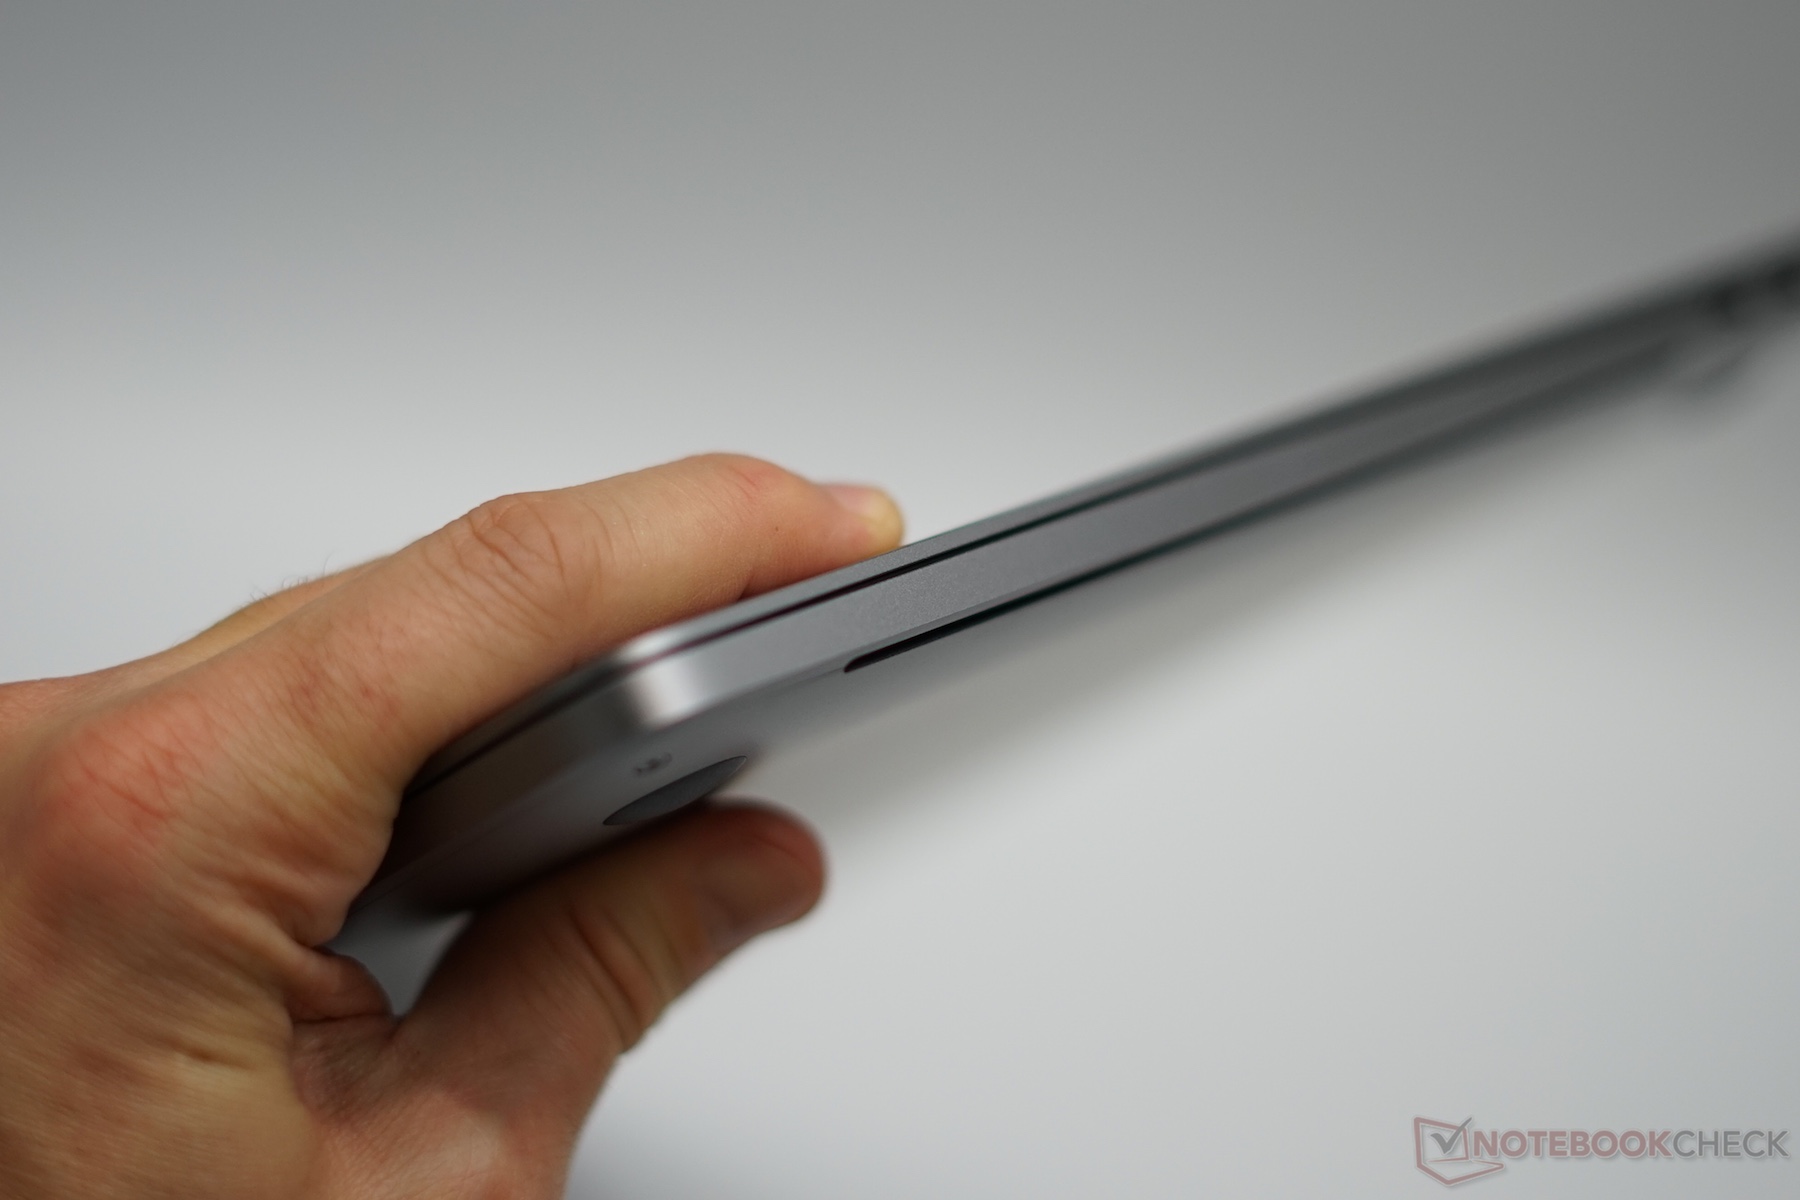
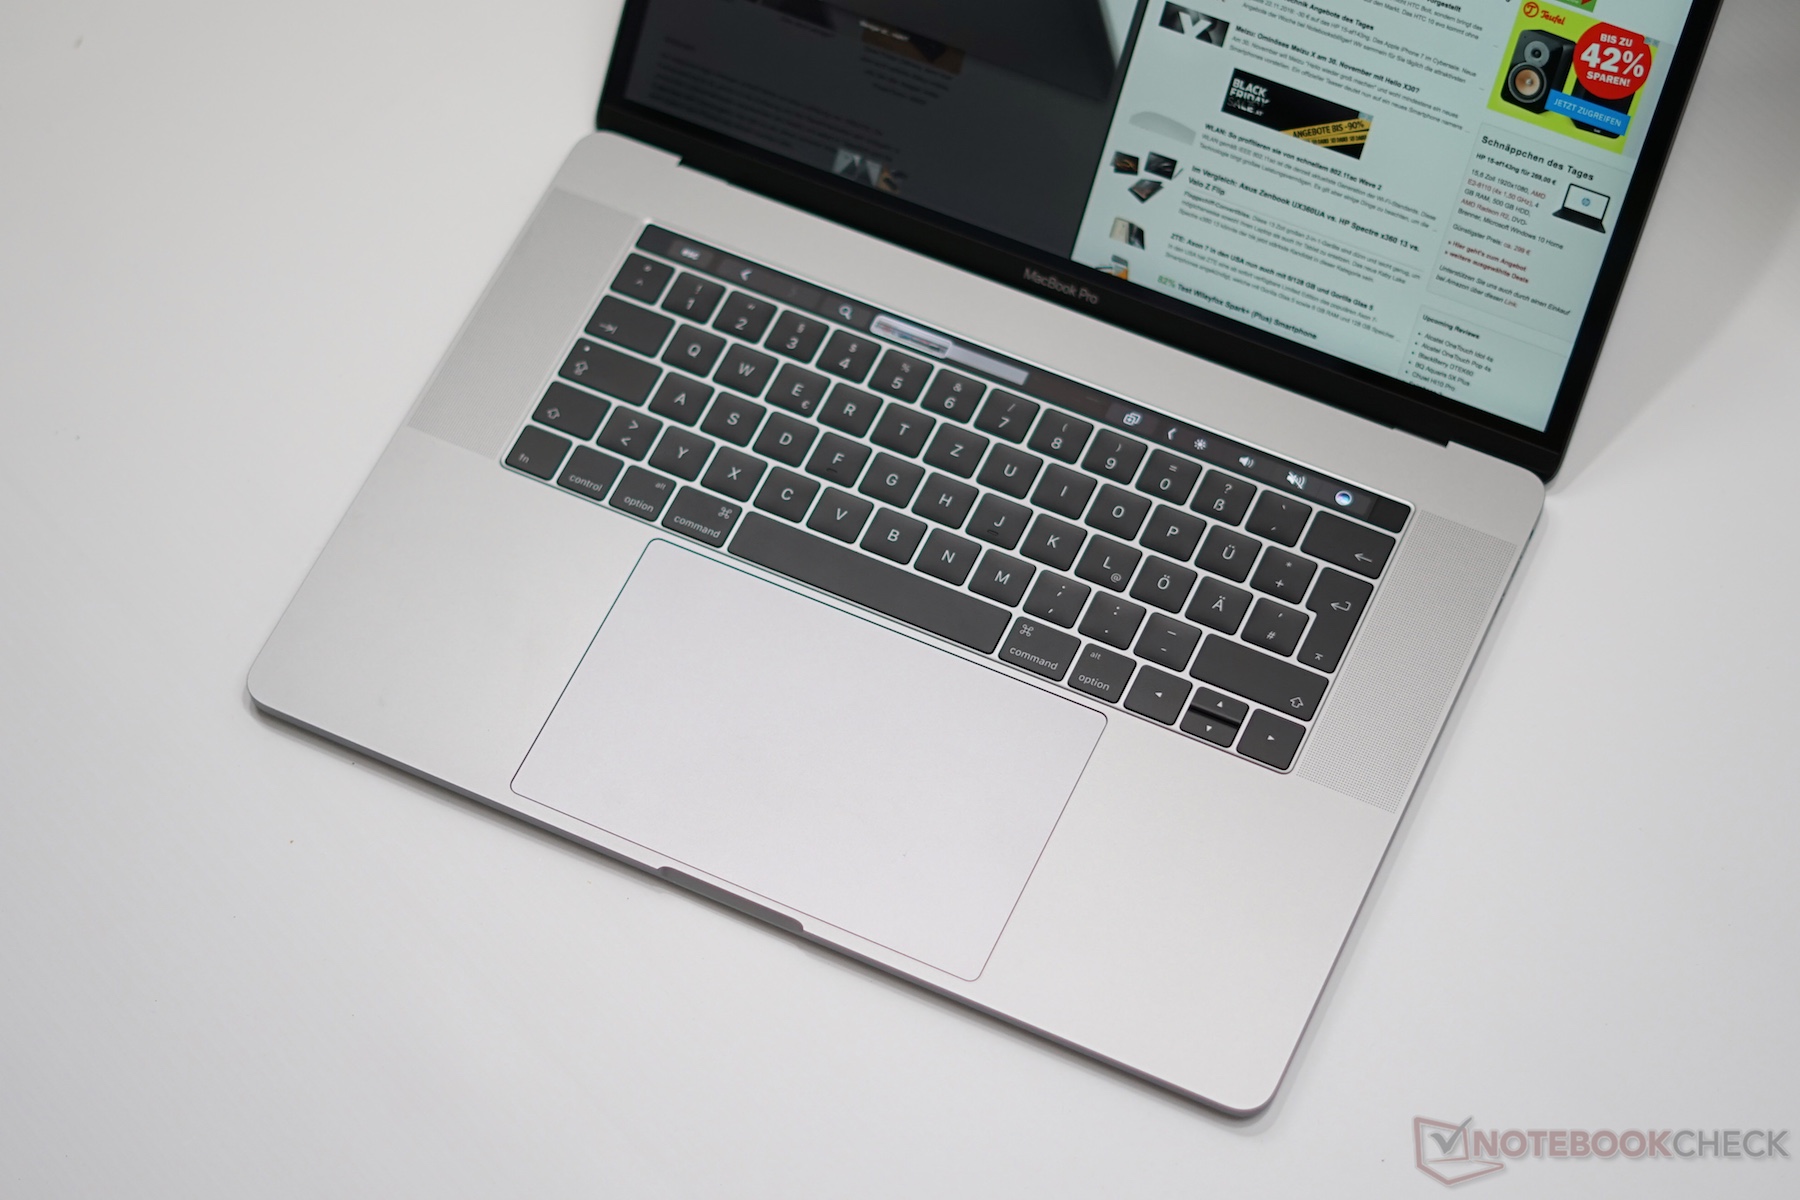
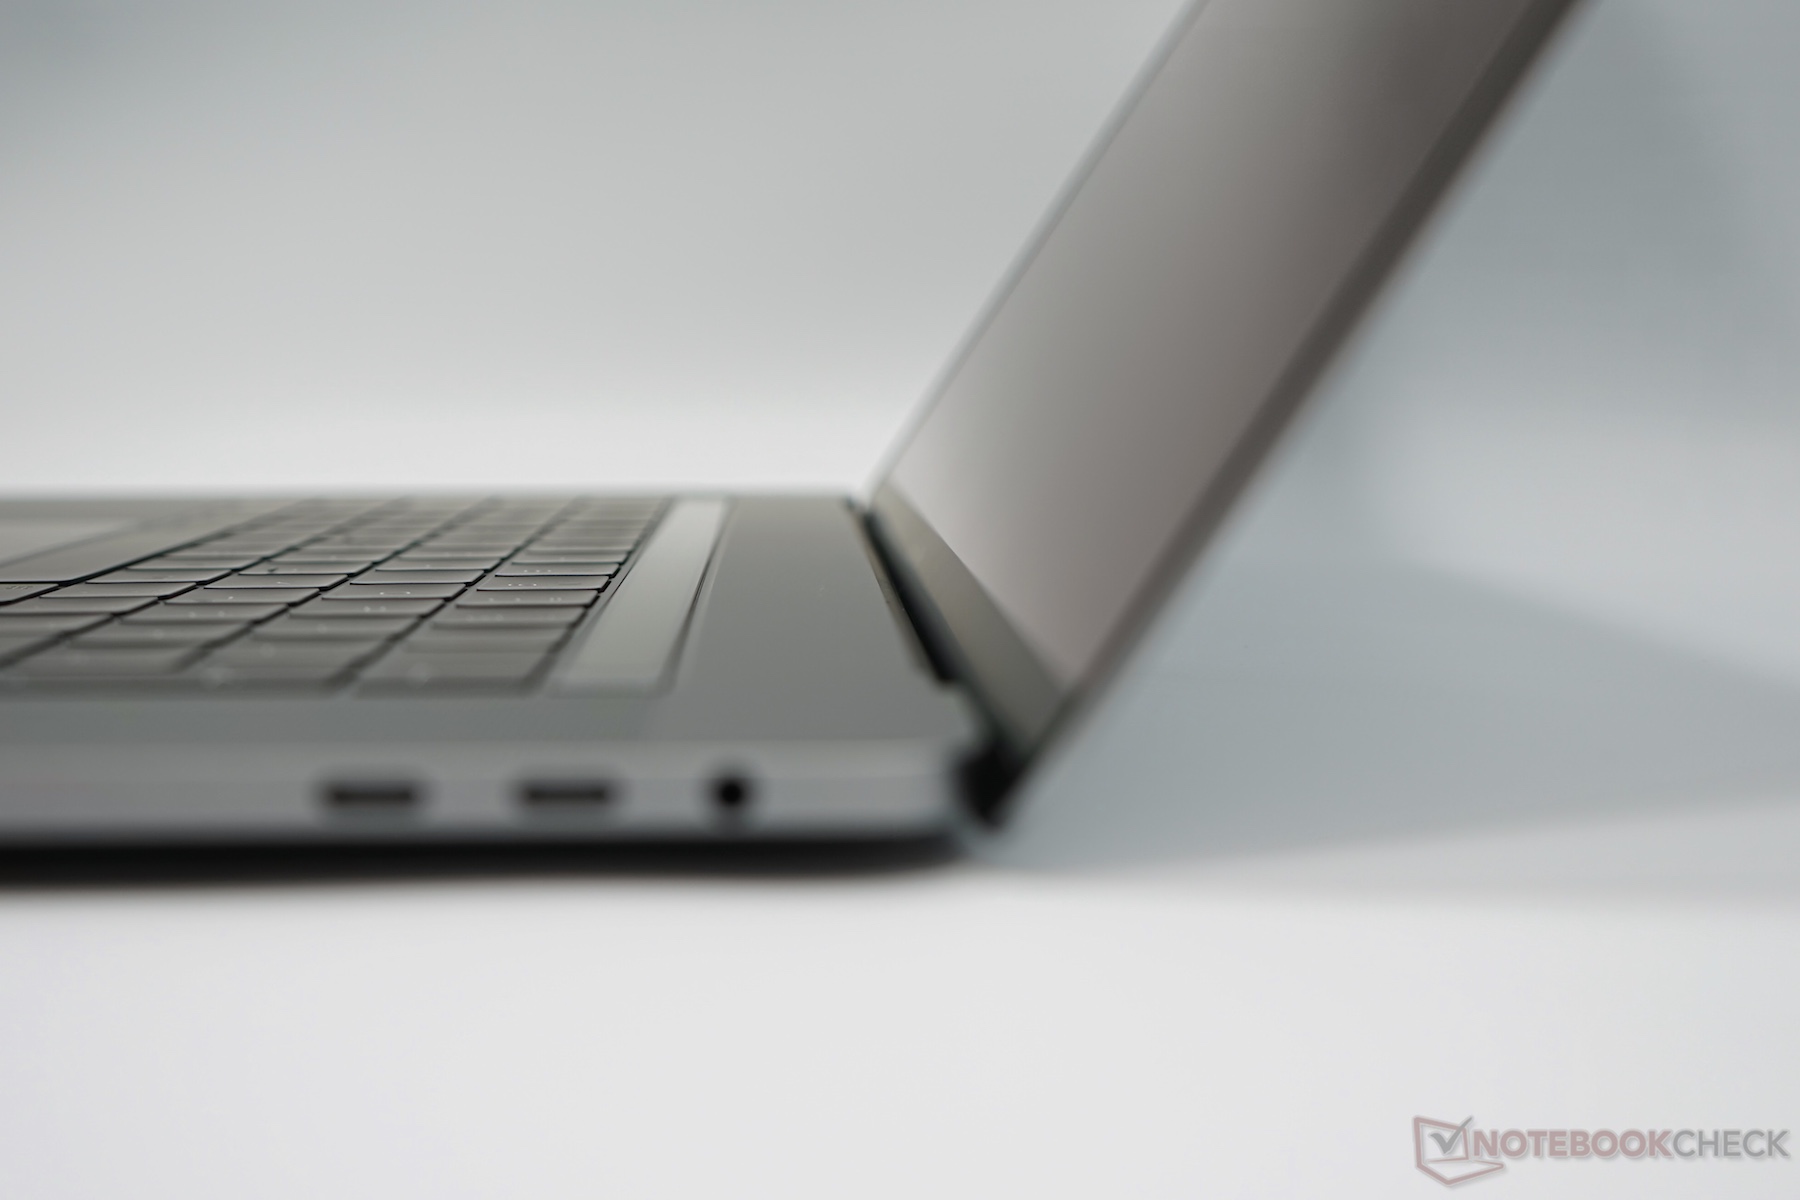
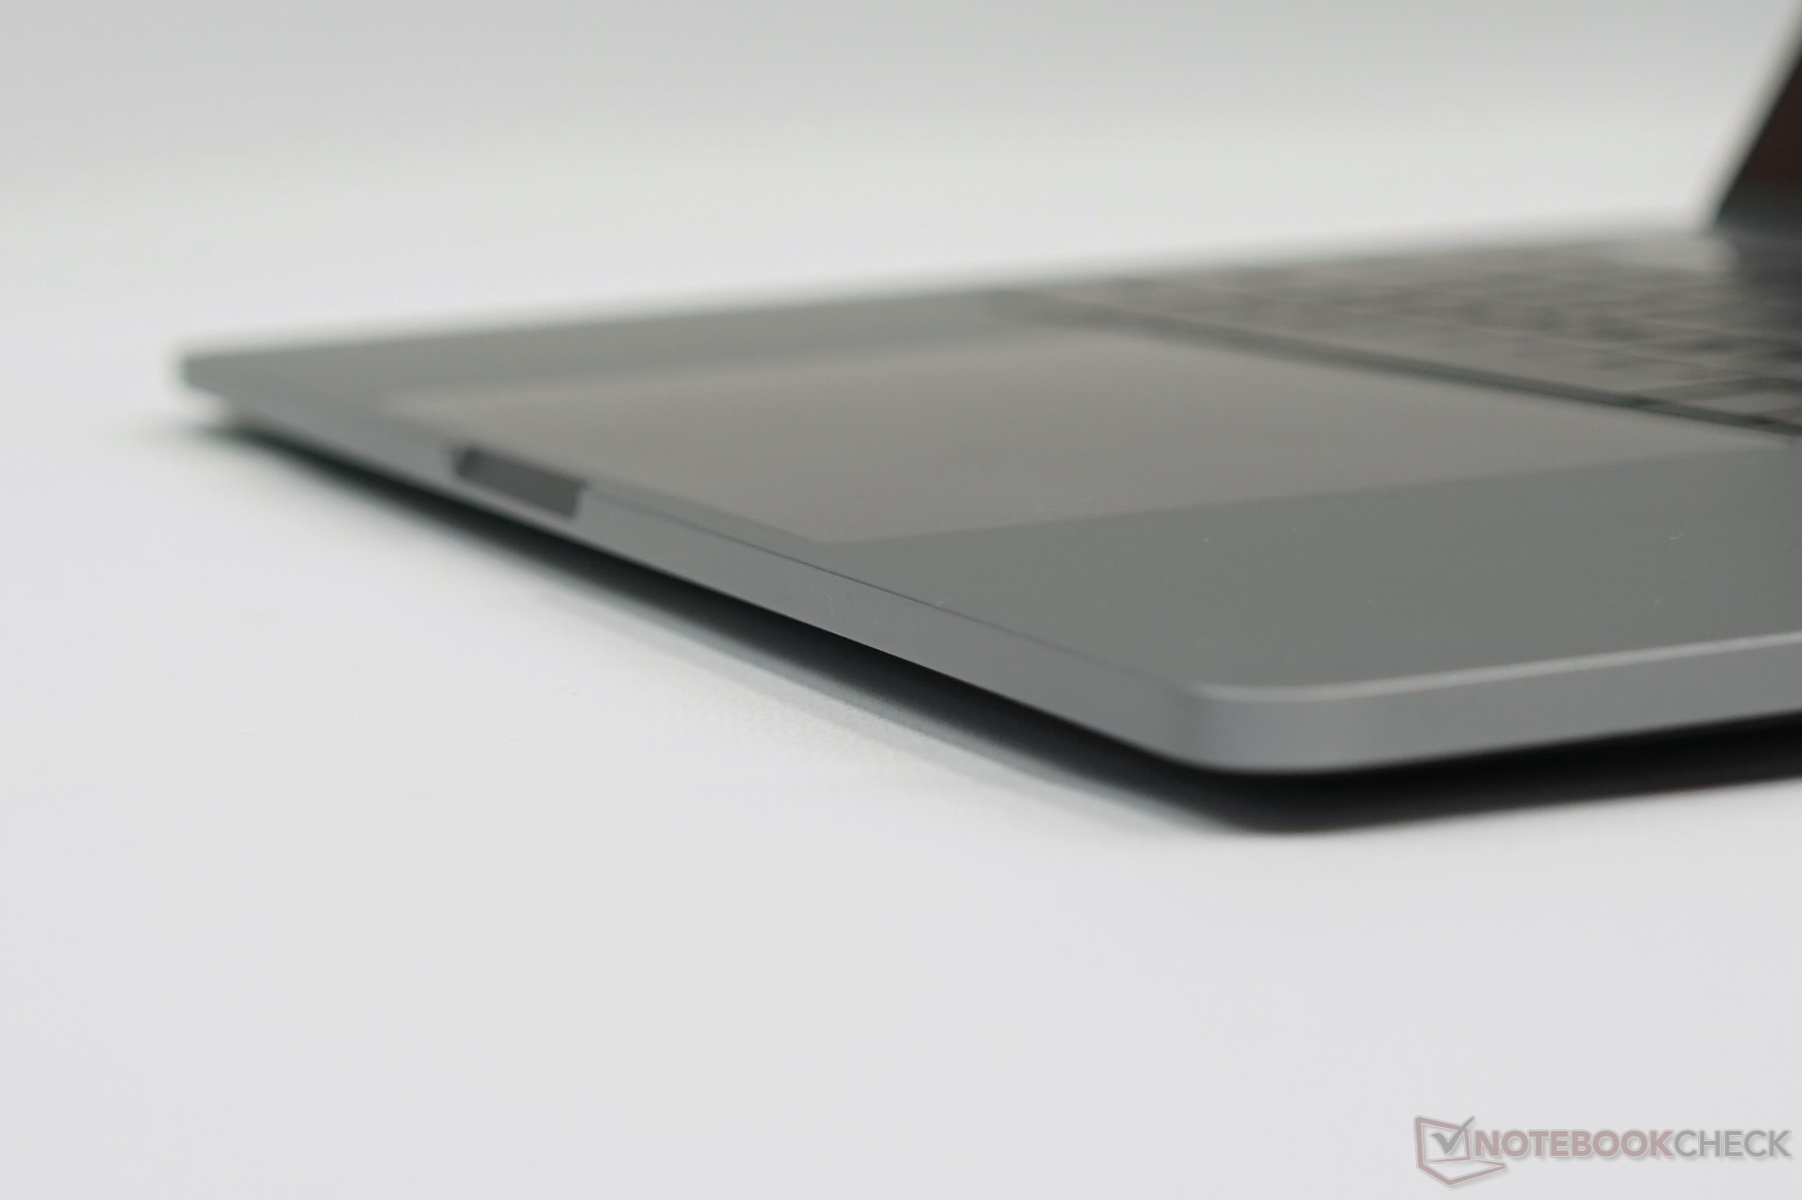
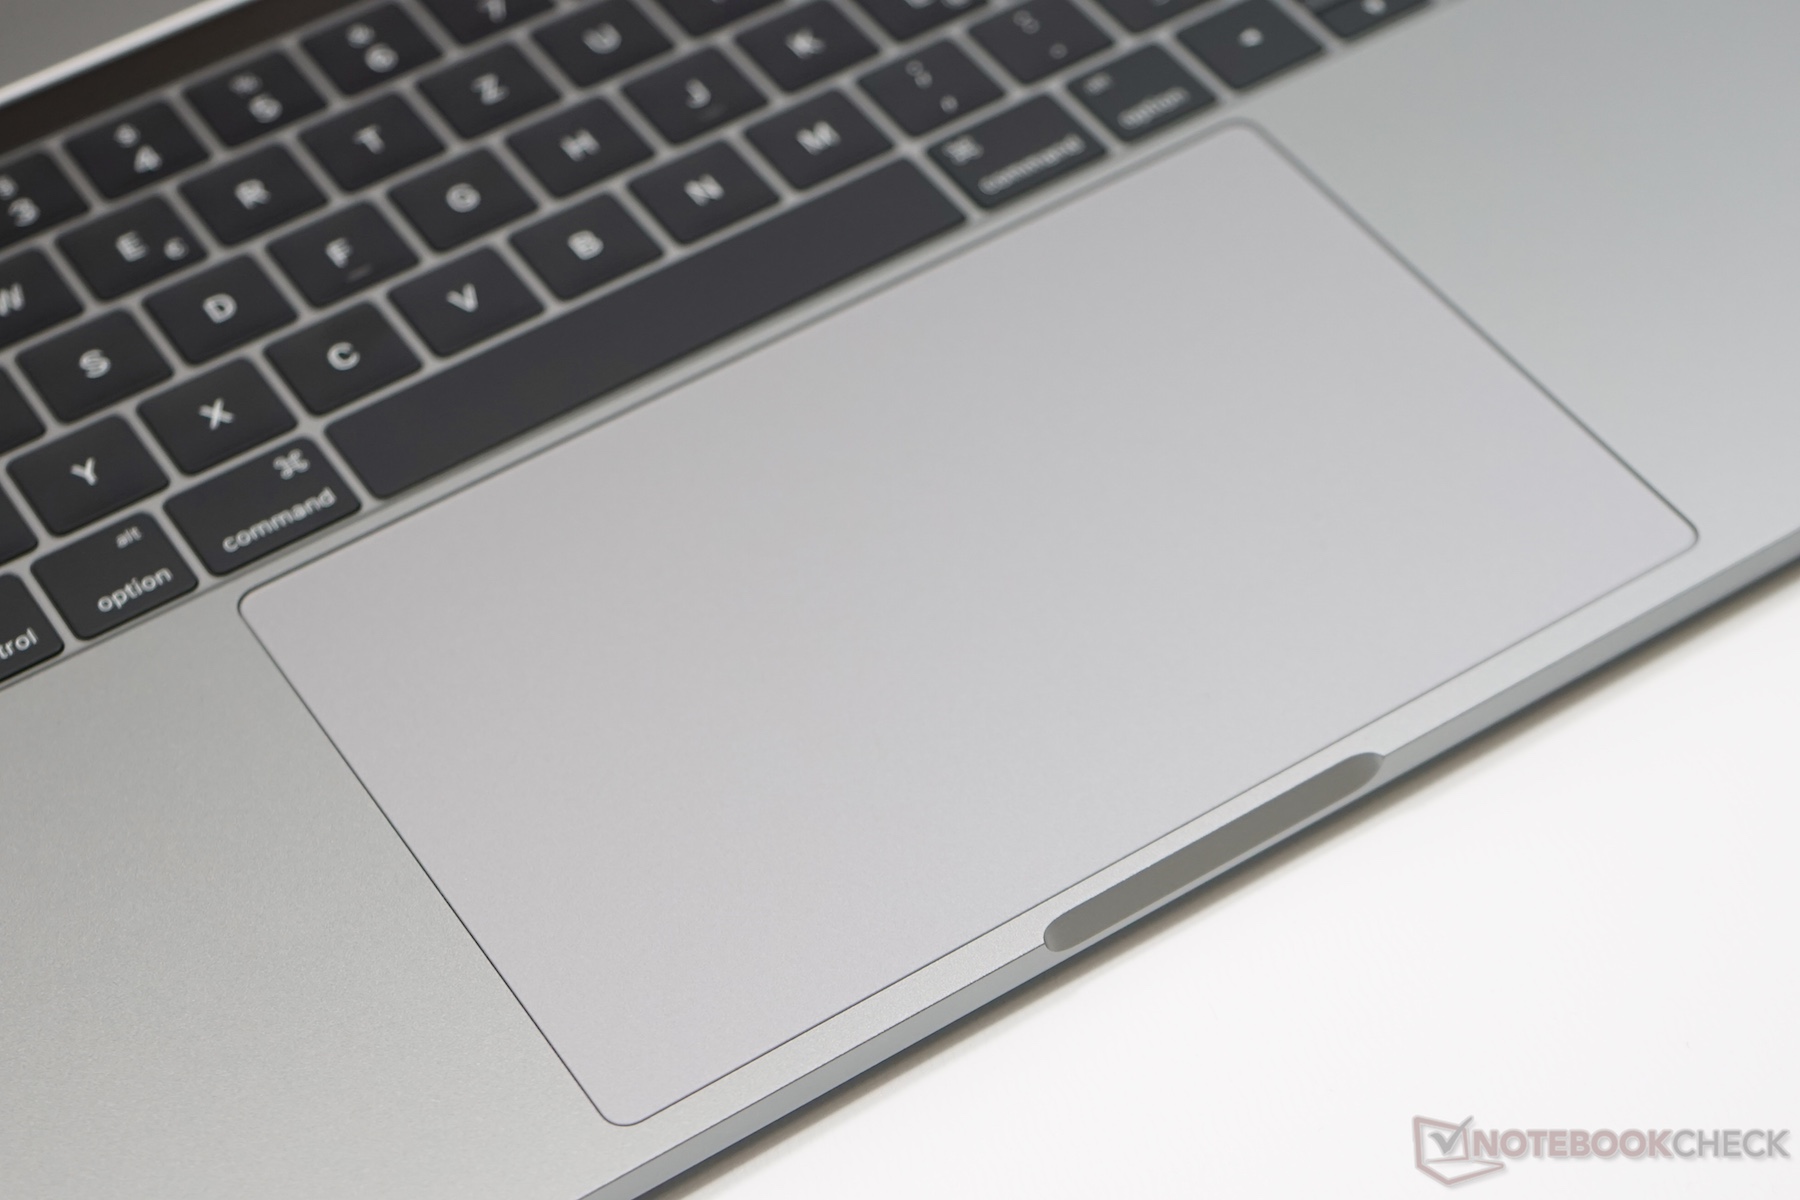
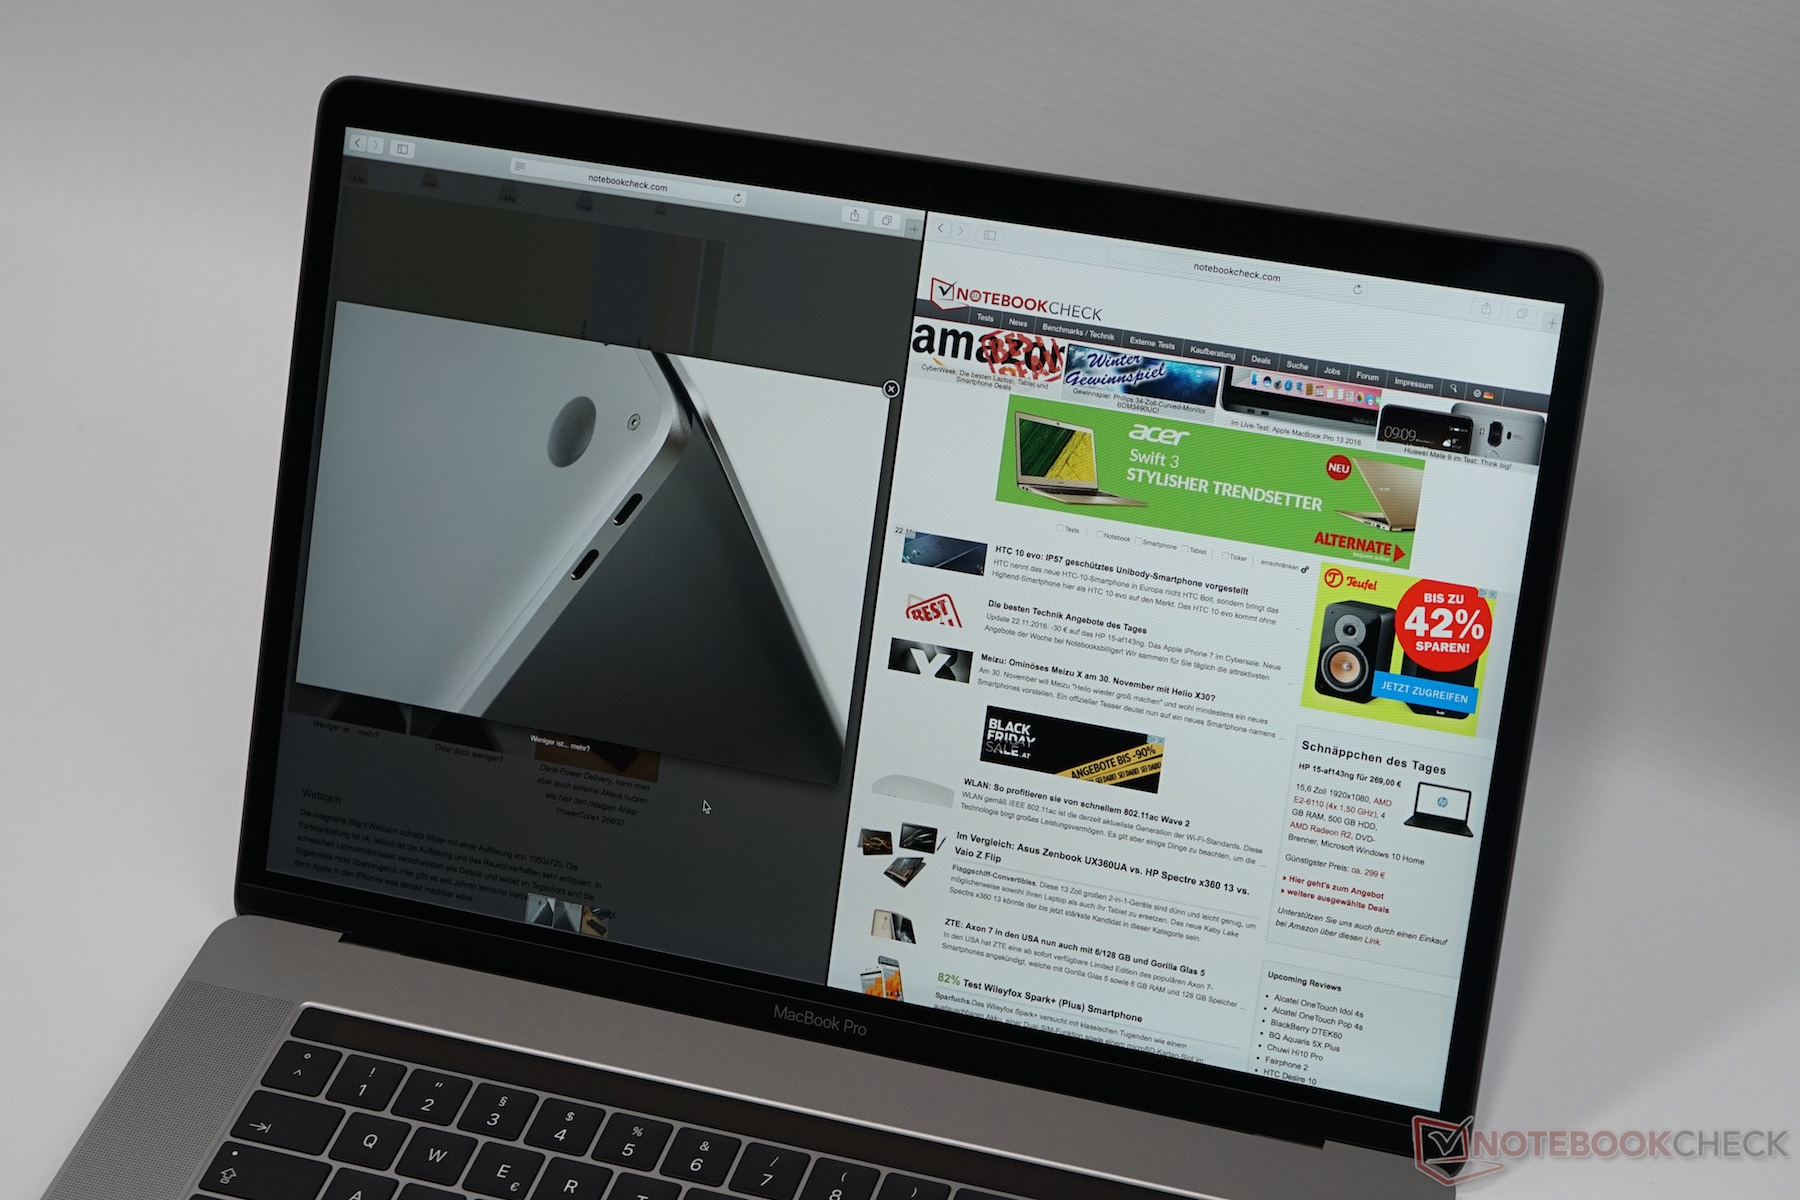
最新的Apple MacBook Pro 15延续了前代机型的一些优势,在很多方面都是目前能够买到的最优秀的设备之一。很明显这包括了出色的机身,尺寸上的减肥并没有影响品质和稳定性。Apple也进一步优化了它的屏幕品质,在不少方面超过了前代机型的表现。它的触控版尺寸也得到的大幅提高,在使用感受上也仍然优于Windows竞争设备。
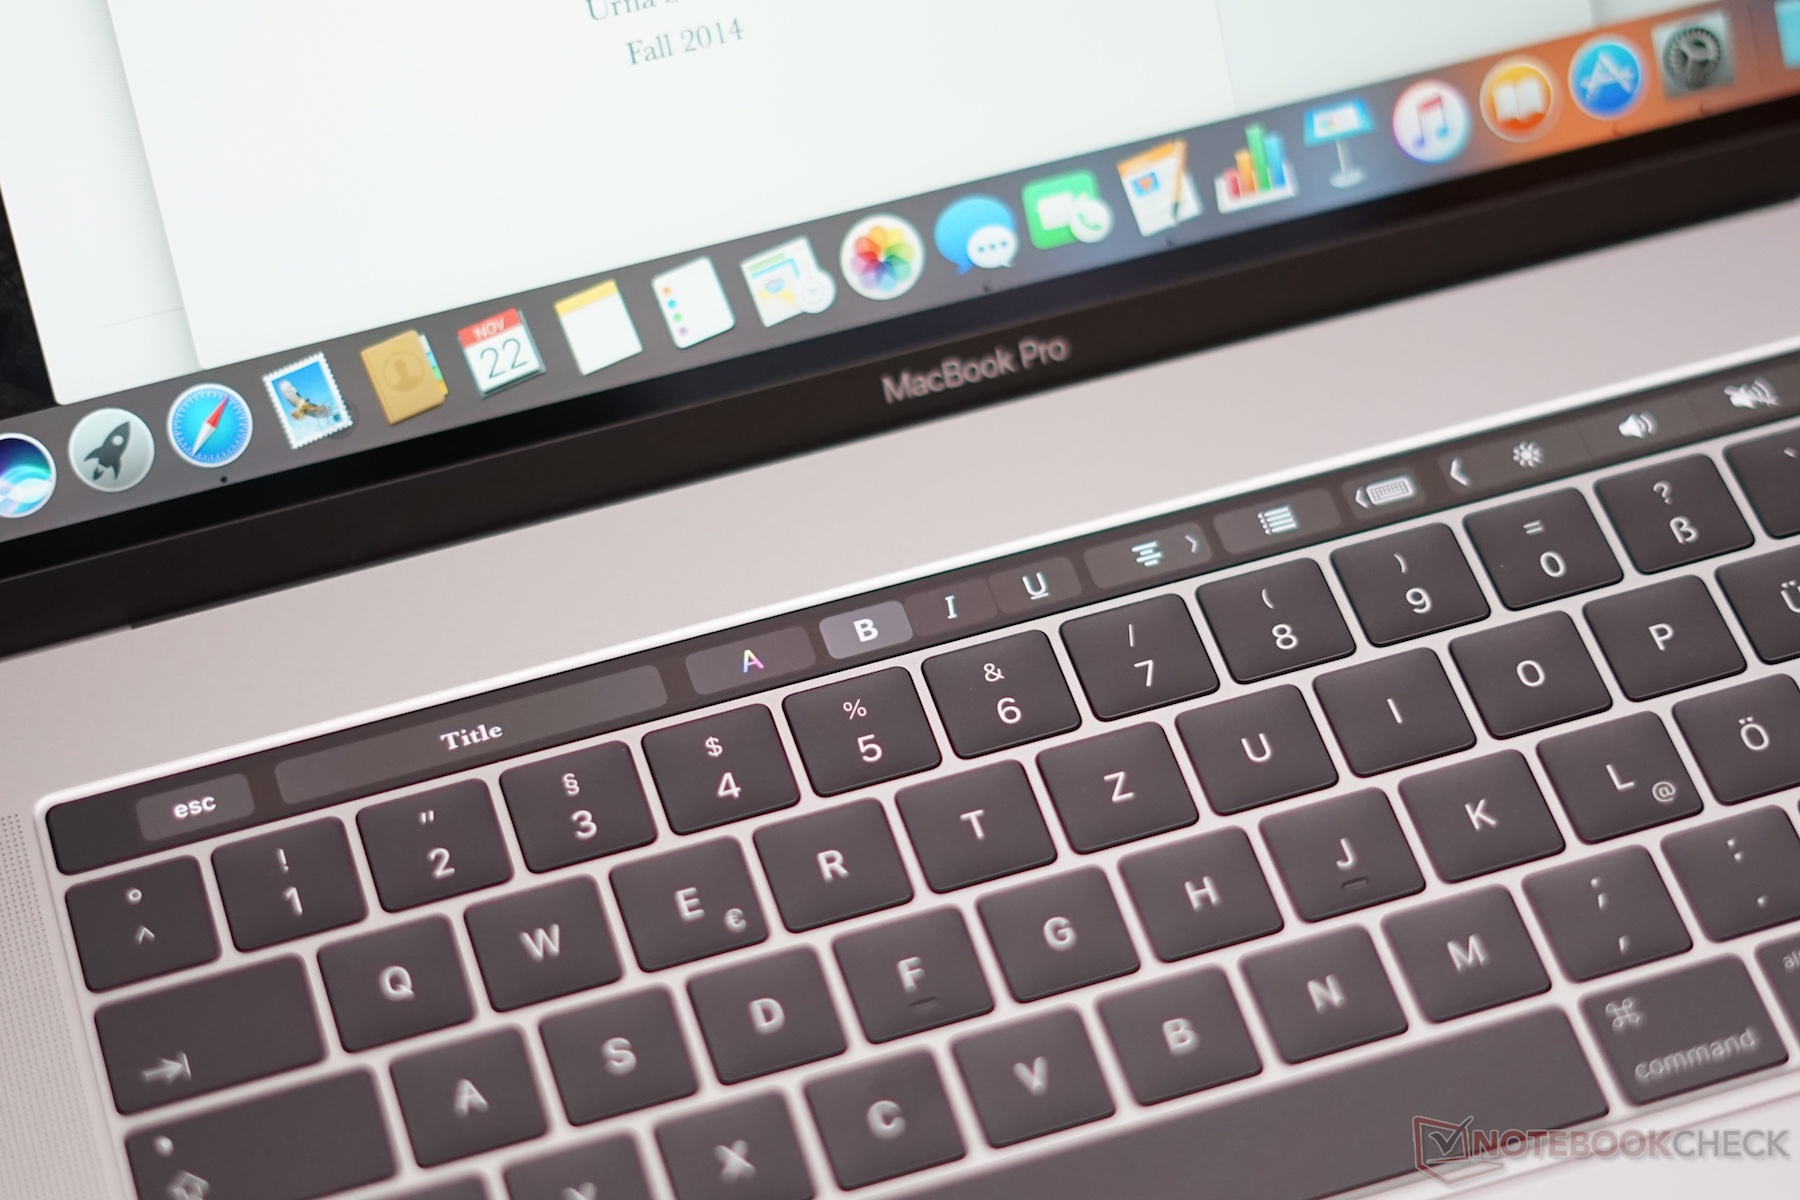
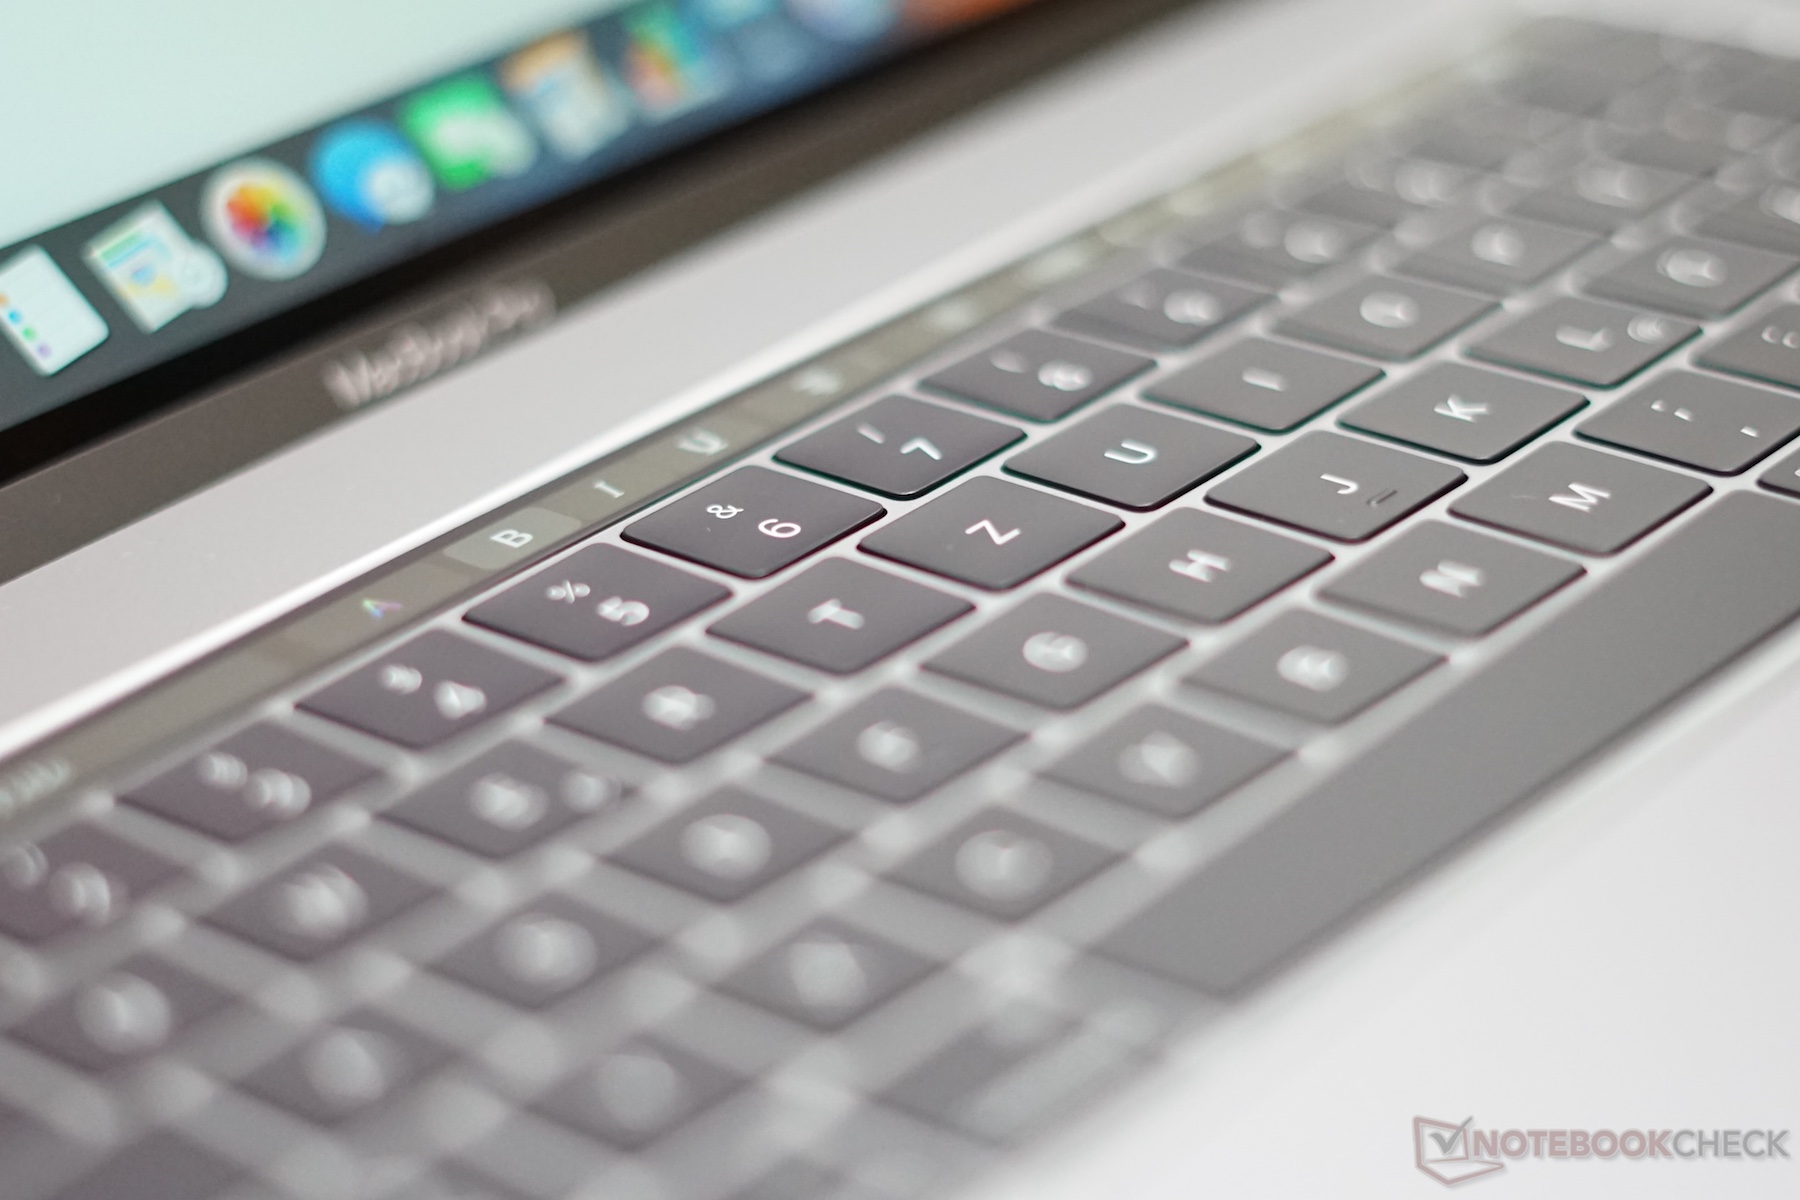
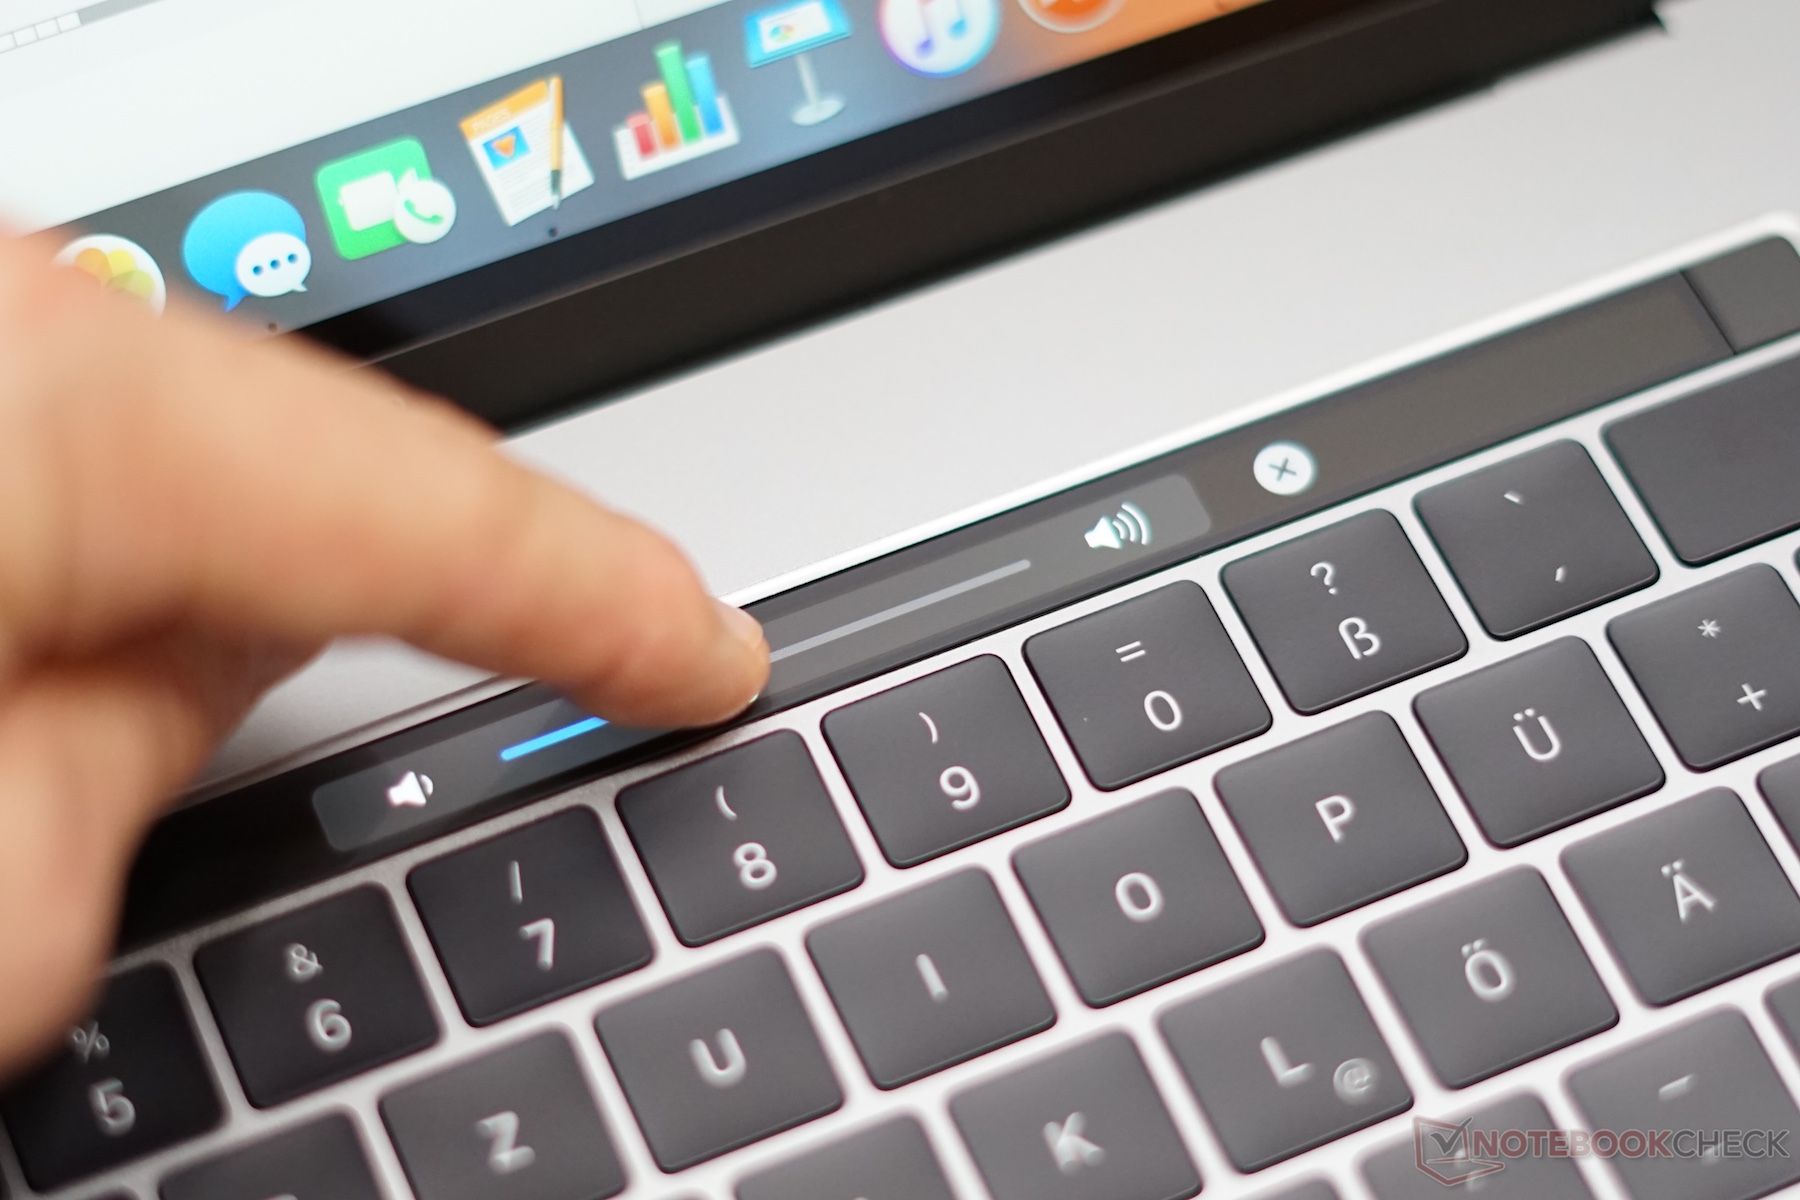
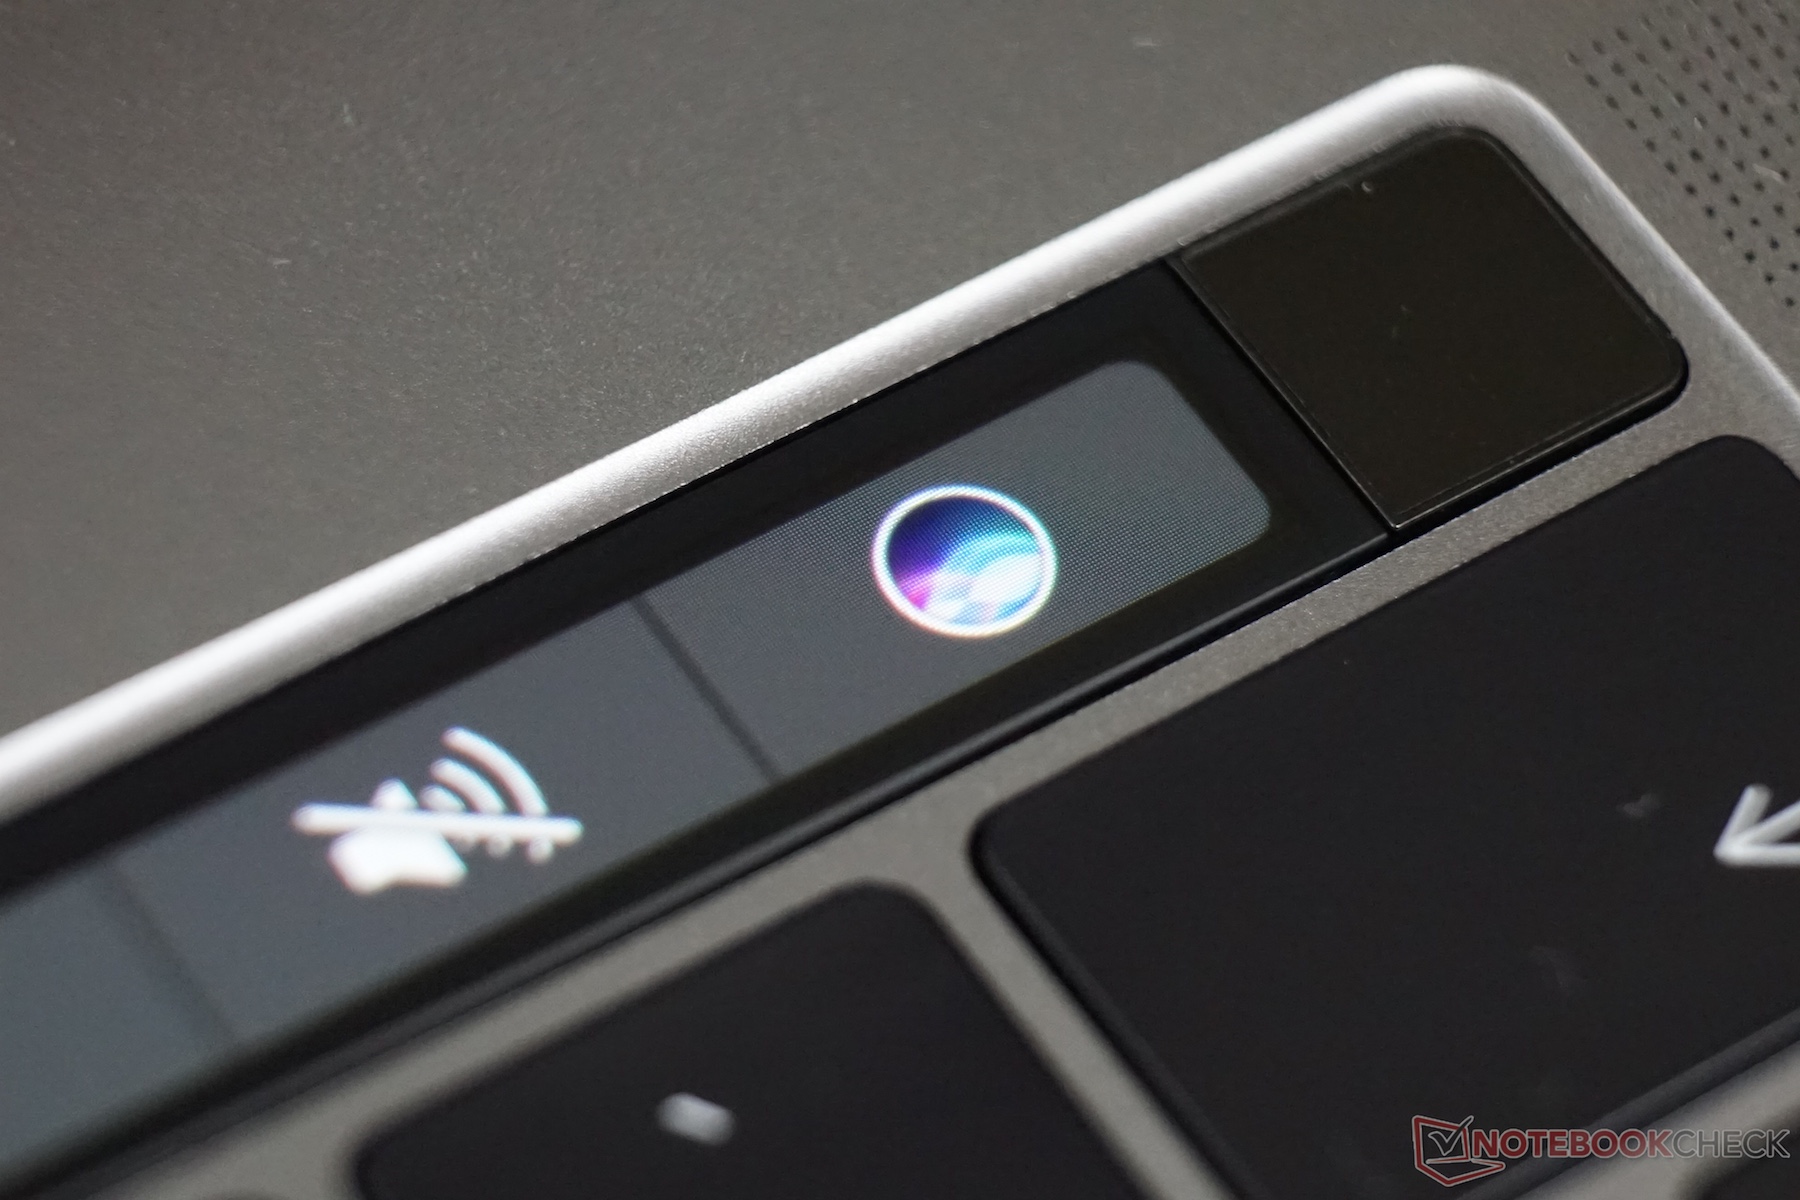
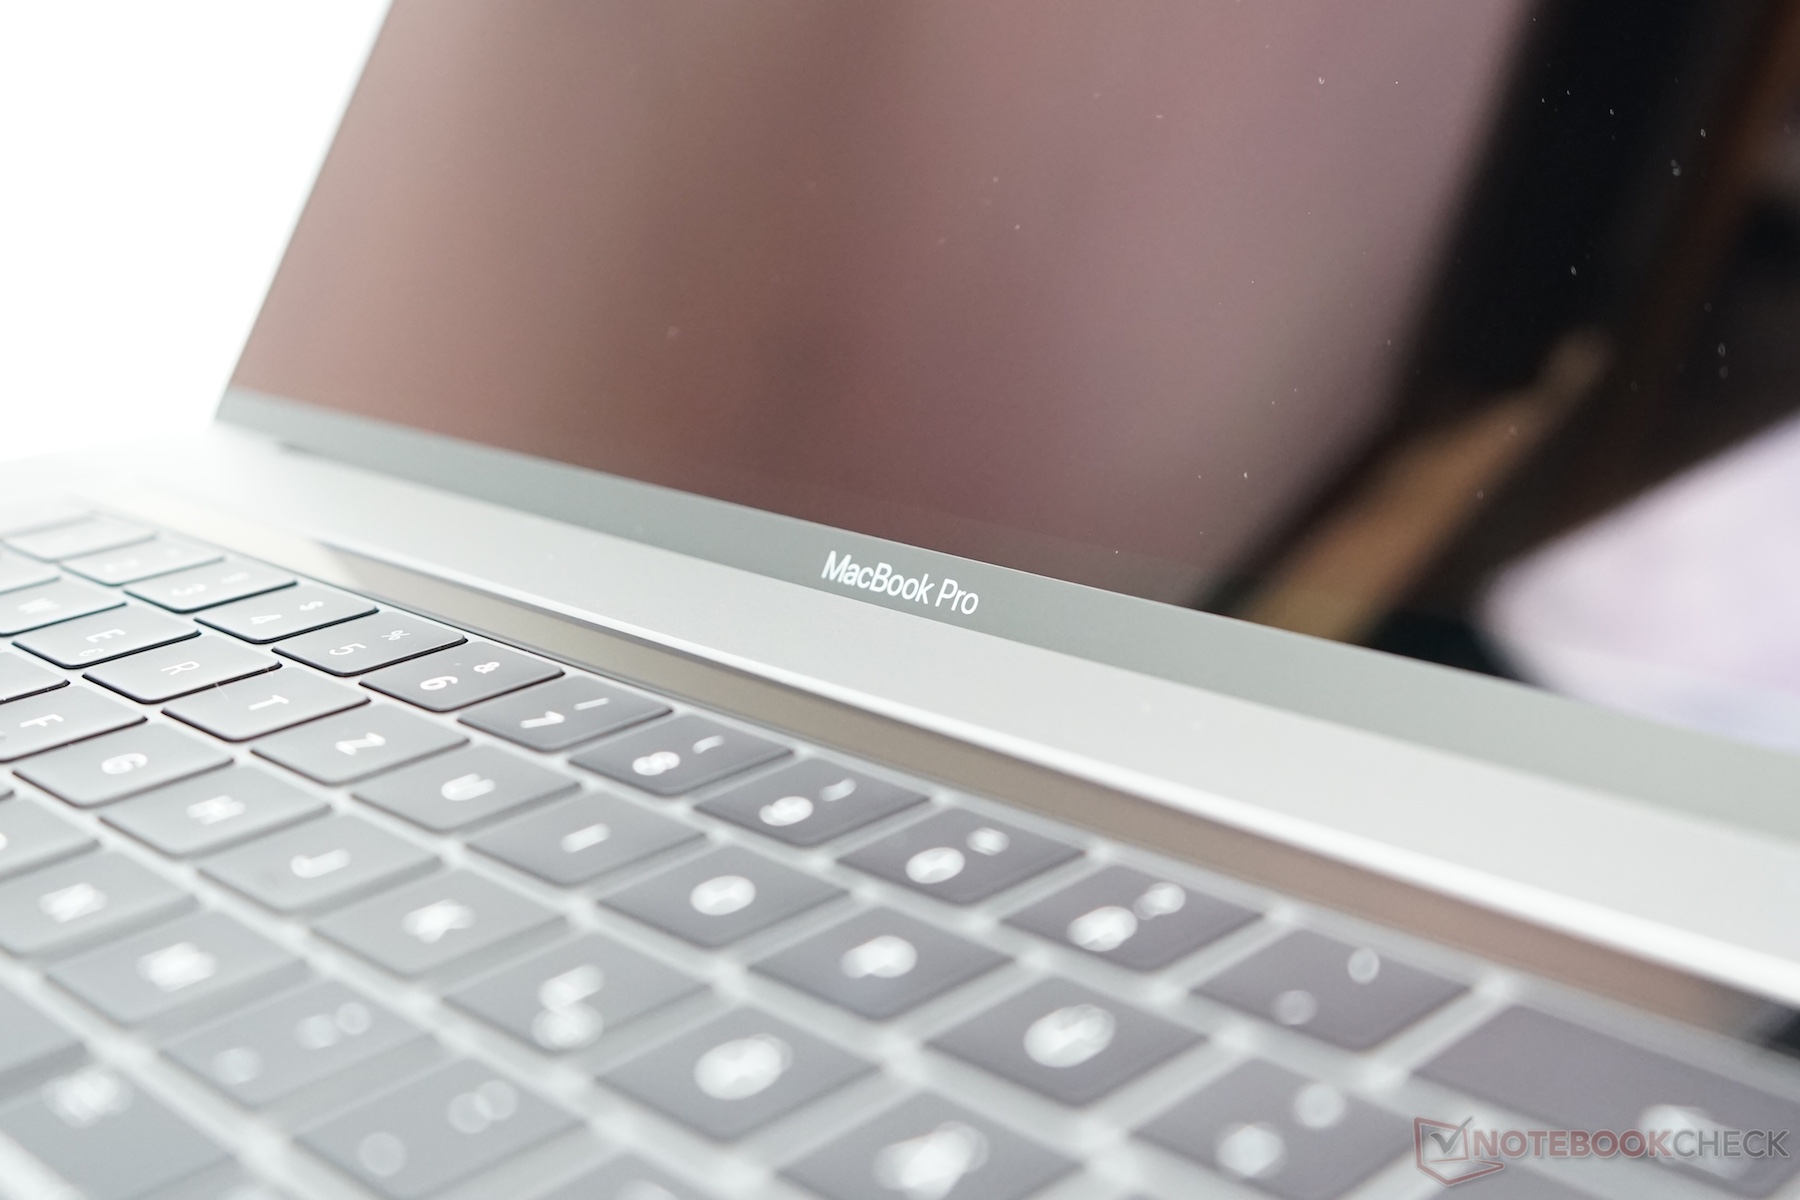
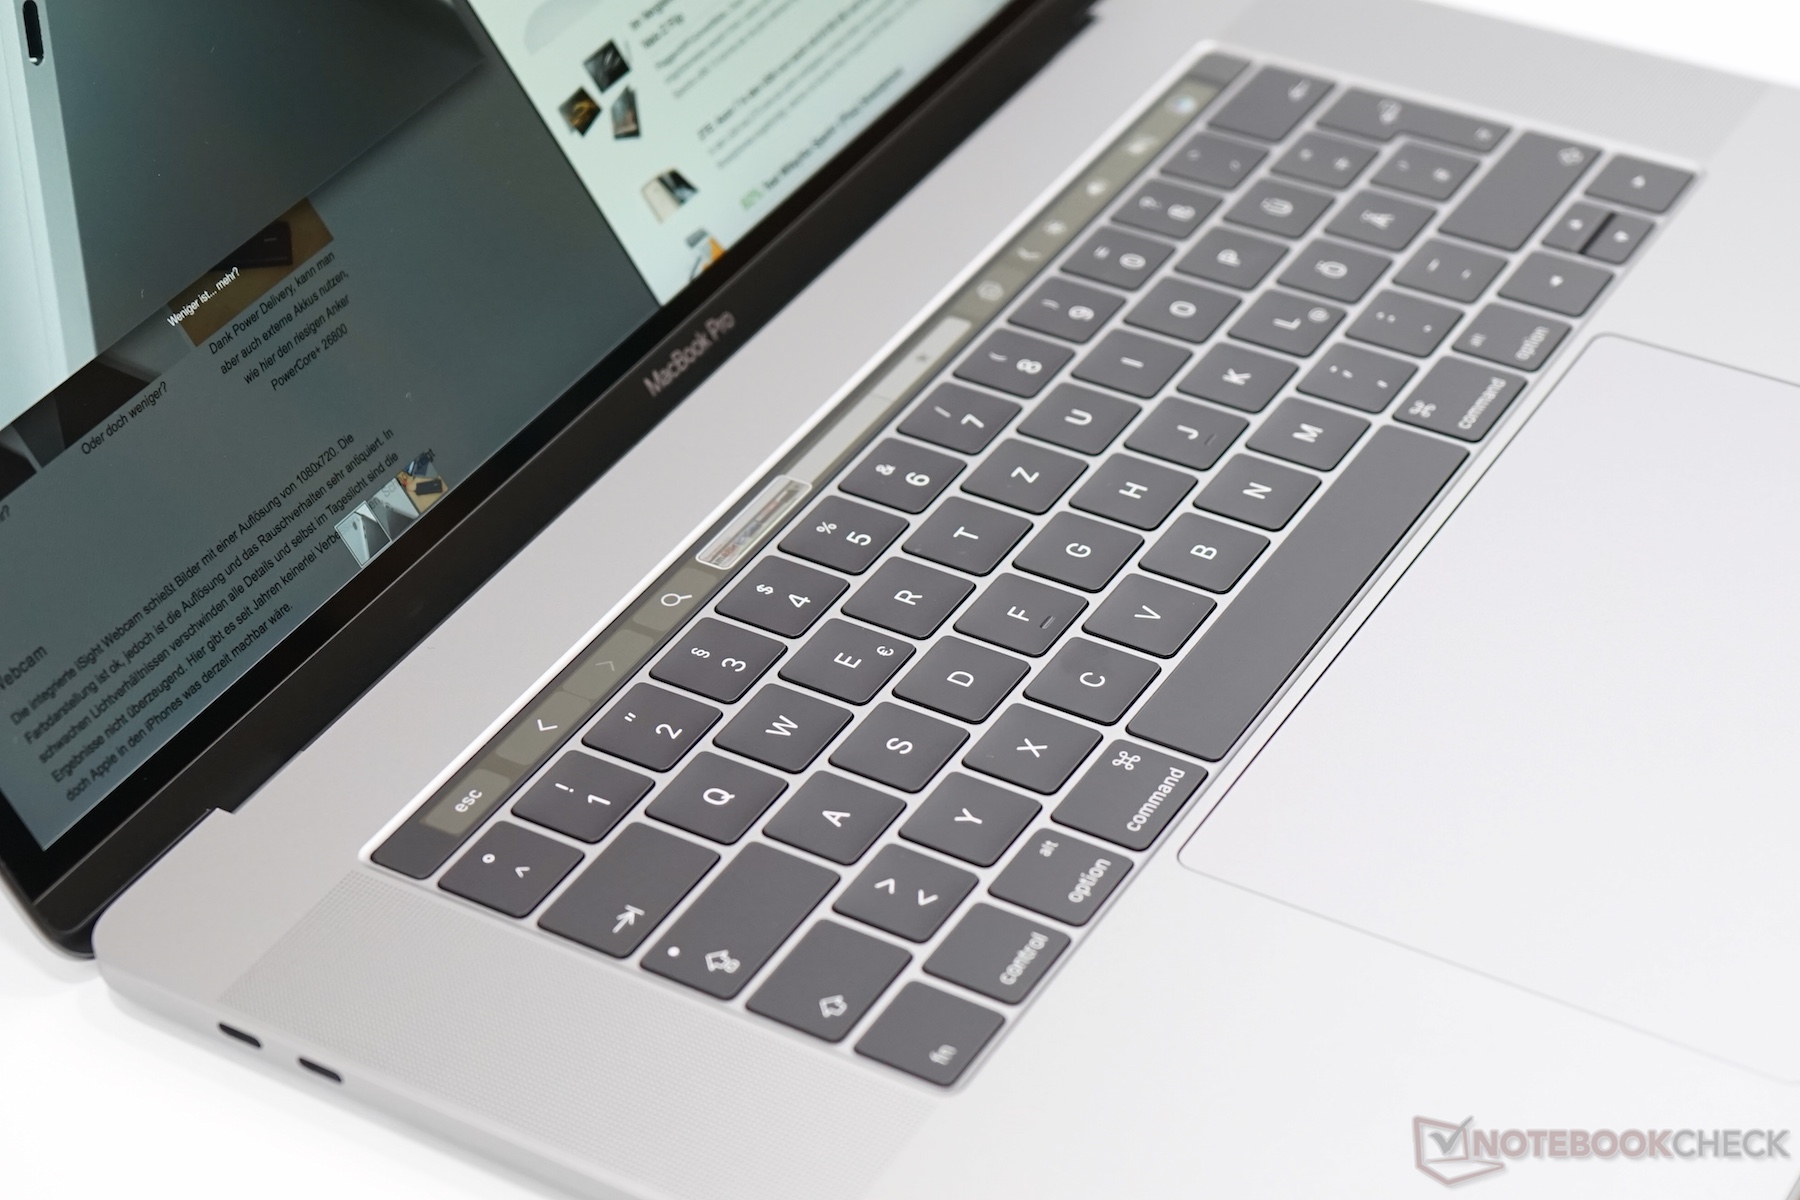
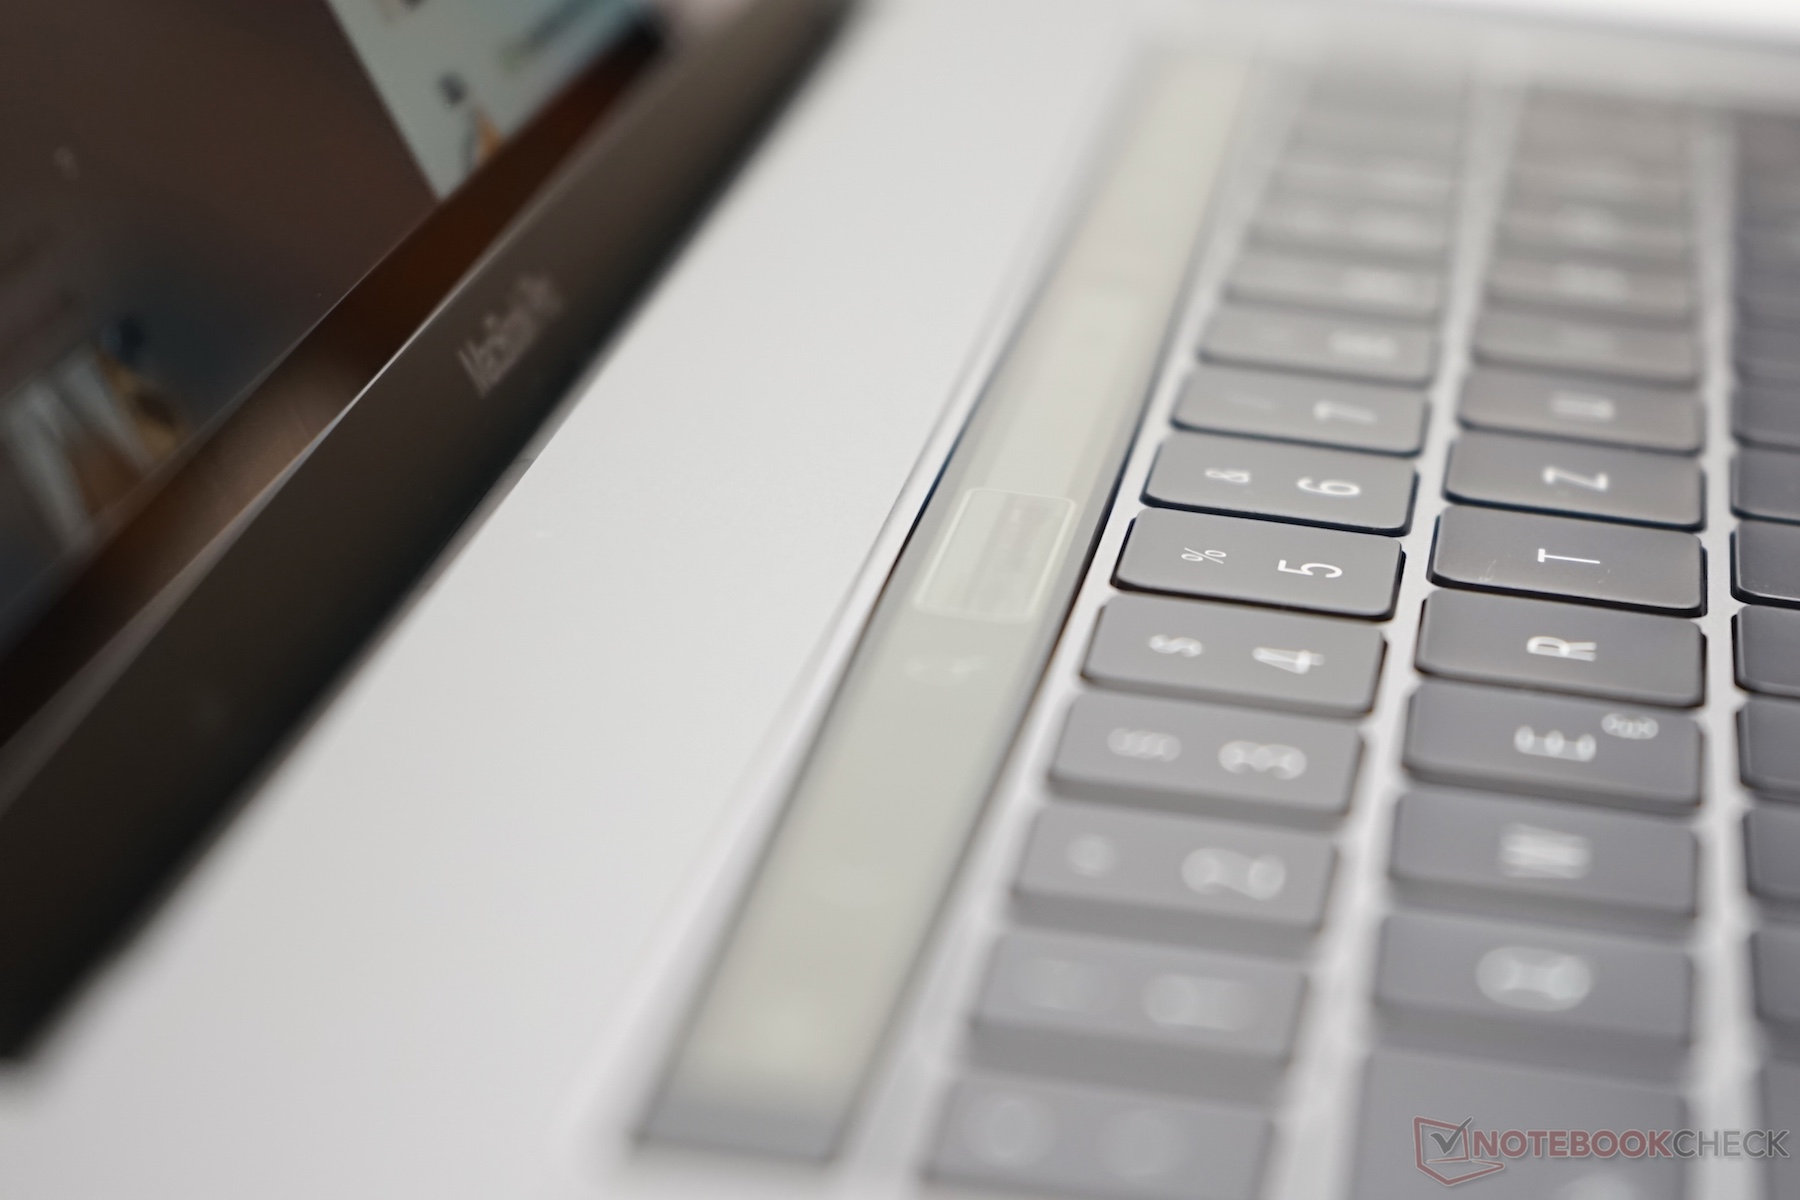
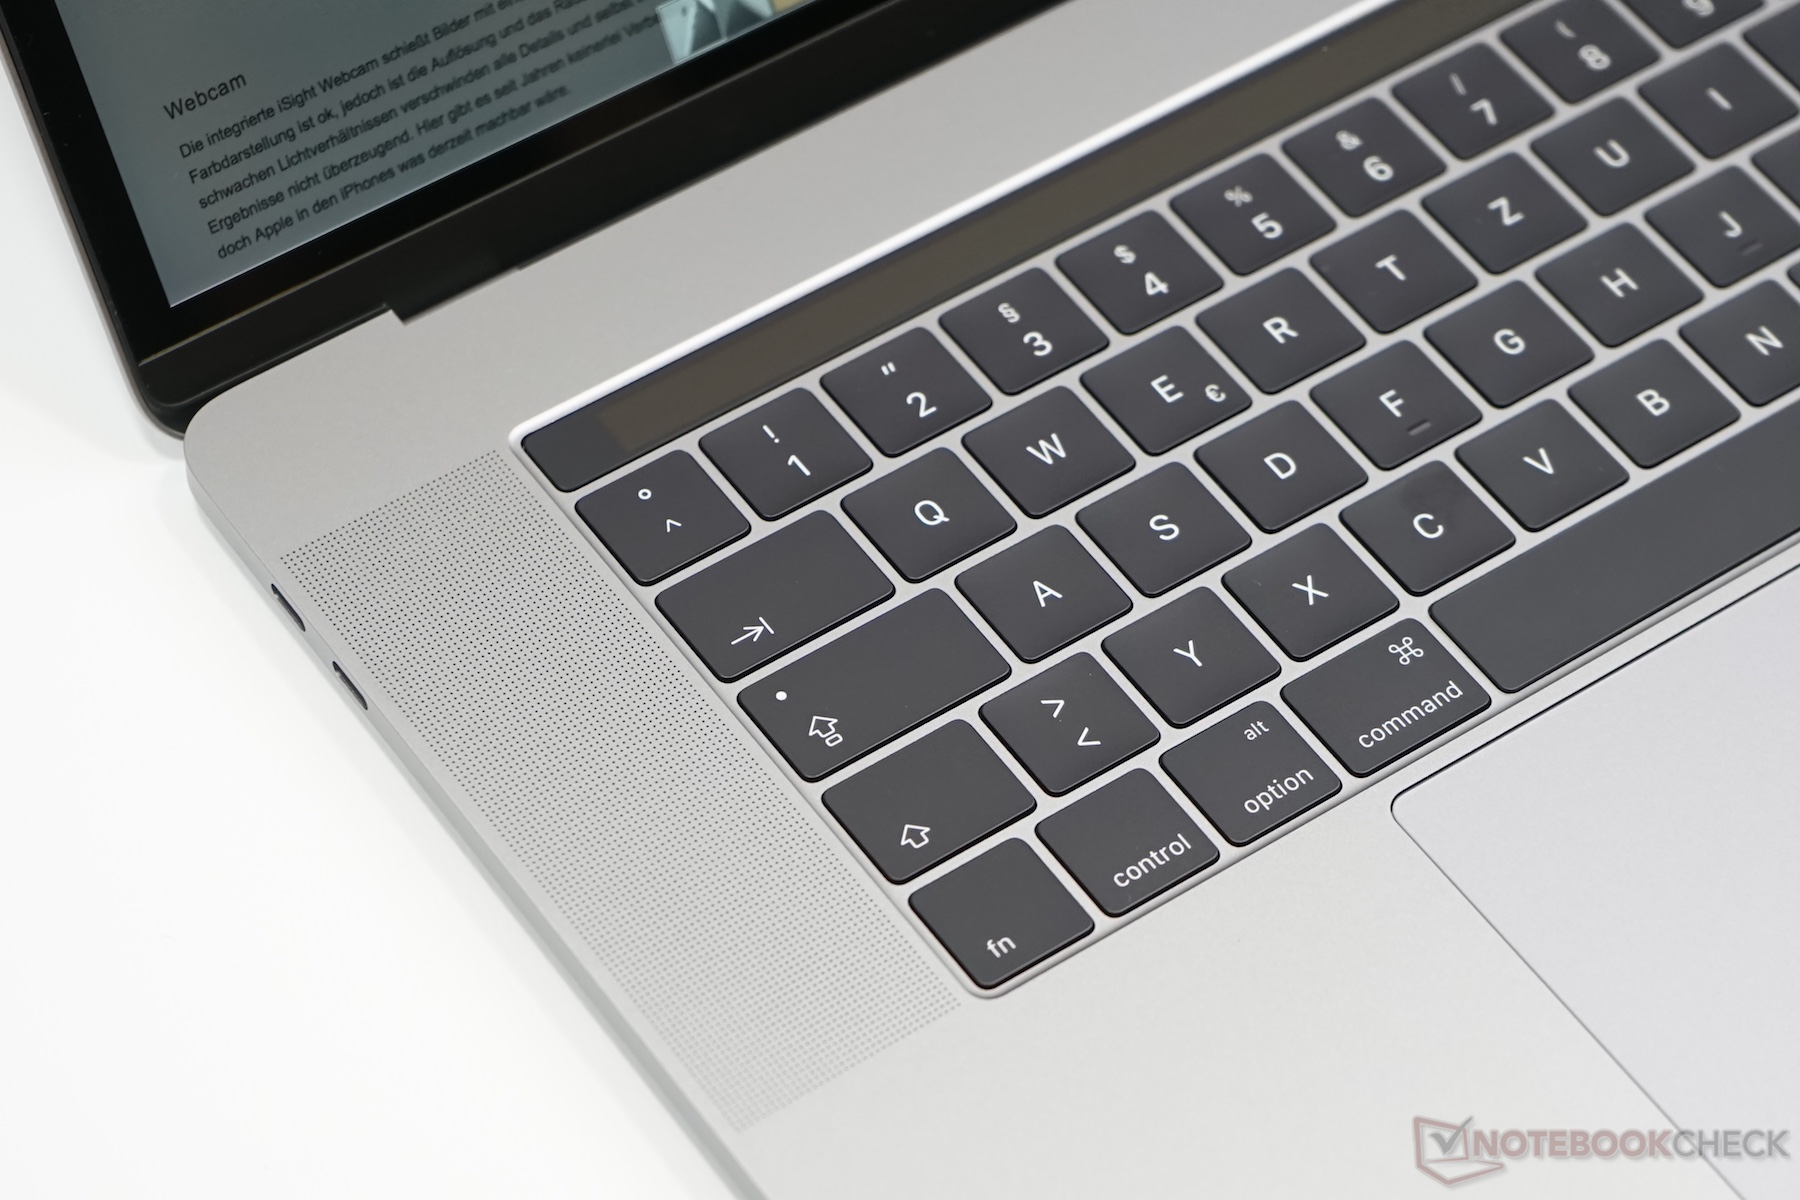
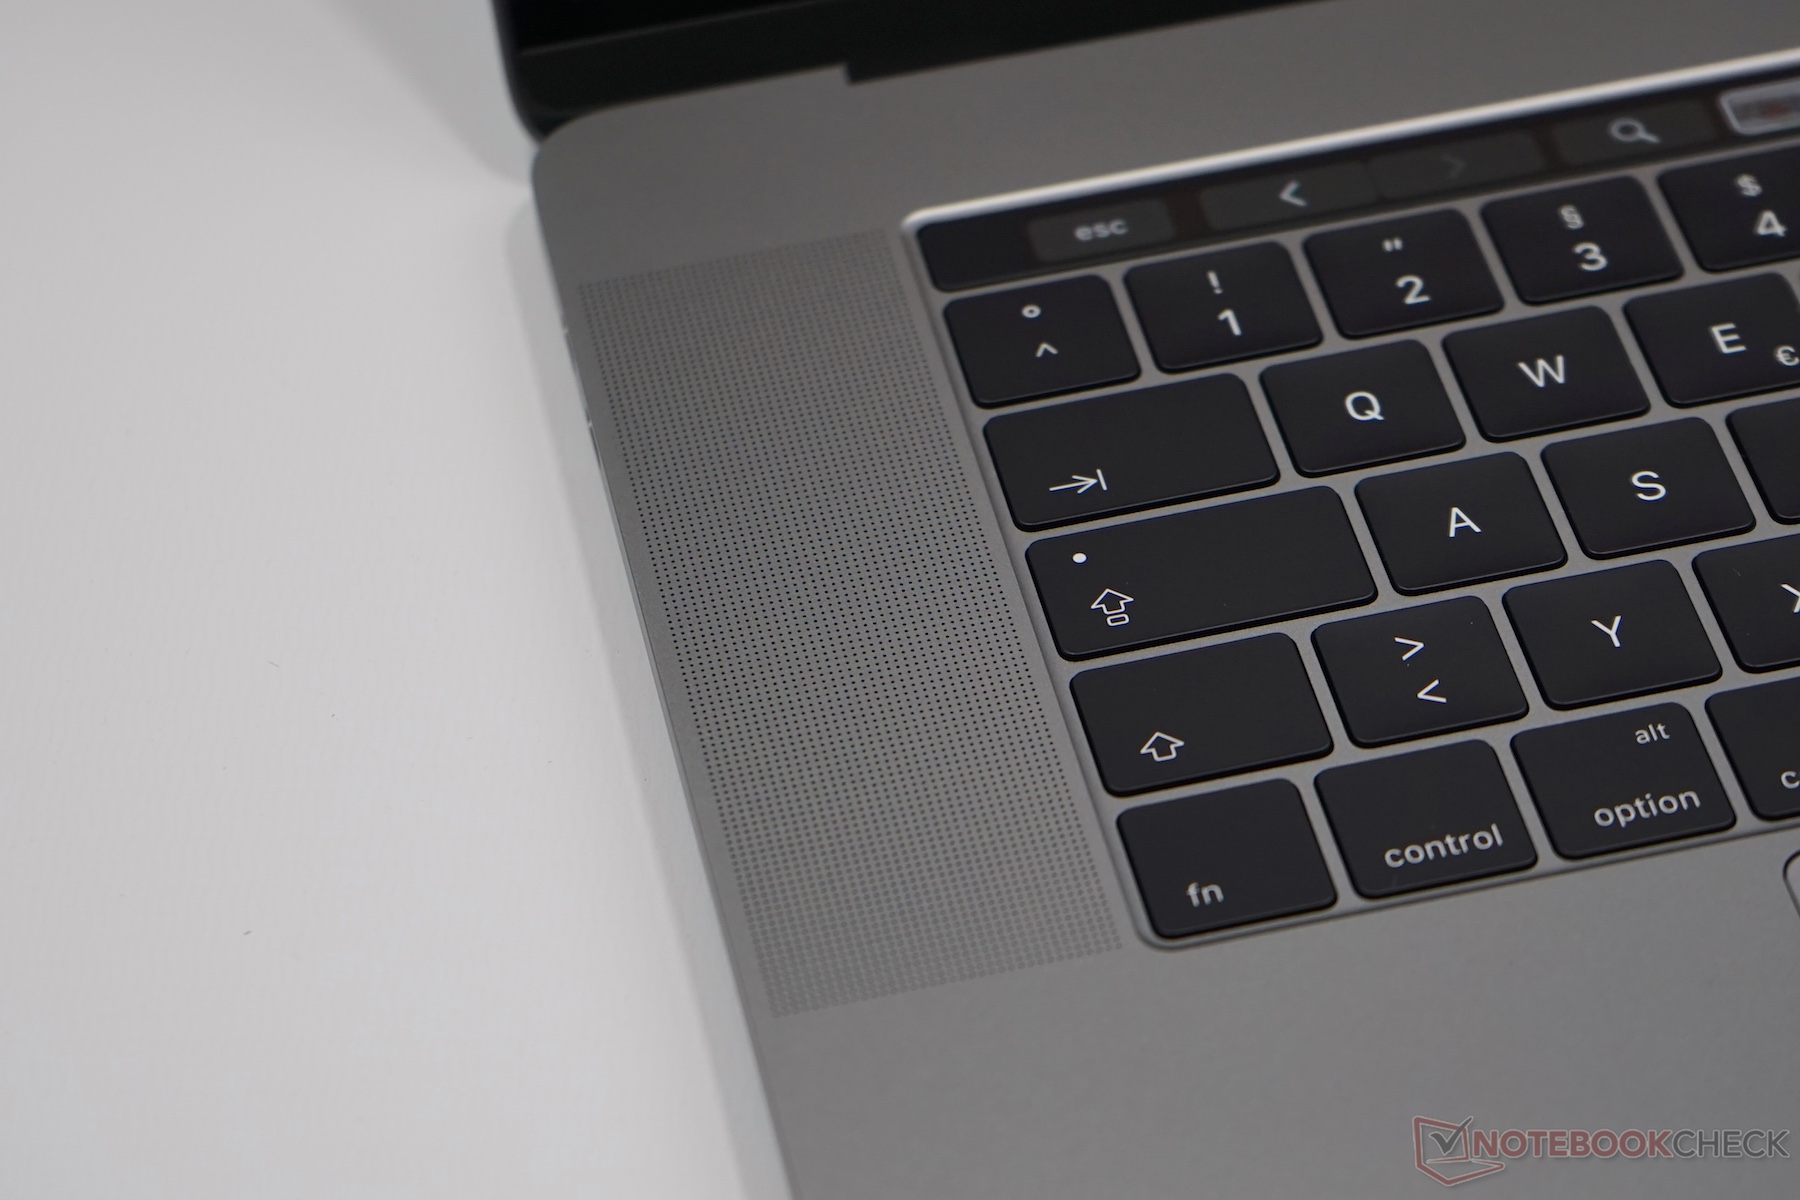
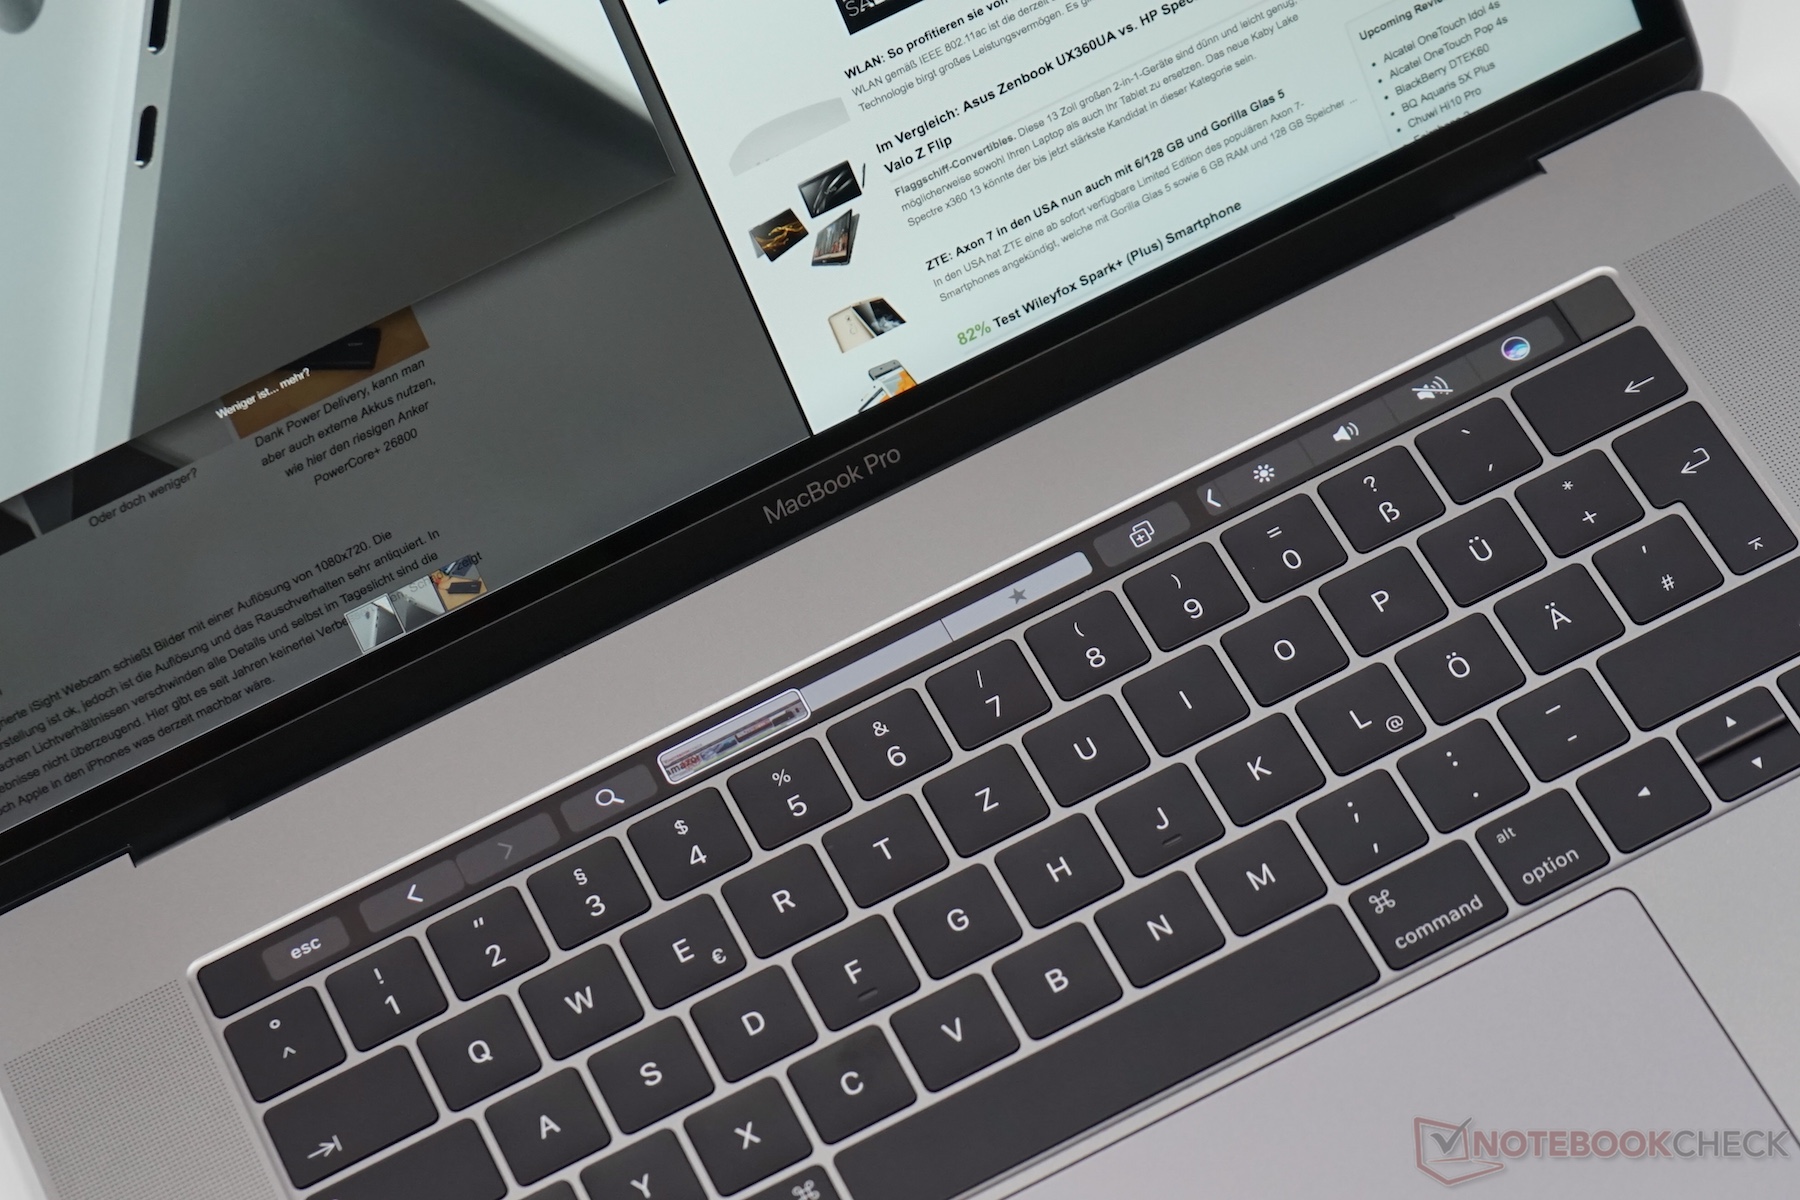
相比之下,如何评价它的键盘和触控功能条则相比更加困难了。和两台13寸机型一样,Apple为它搭配了第二代的蝴蝶机制按键。这带来了准确的按键反馈,不过较短的键程则需要用一些时间适应。我们非常喜欢它集成于电源键中的指纹感应器。作为宣传重点的Touch Bar得到了不错的设计,它的实用性将取决于软件支持。不过在实际使用中它可能会让一些常用功能(如如亮度和音量控制)变得更复杂。我们认为它在目前更大程度上是个营销噱头。
在性能方面,Apple为它采用了高端组件,包括了移动四核处理器和主流水平显卡。不过,相应的Kaby Lake架构处理器和帕斯卡架构显卡也已经上市,这样MacBook Pro 15将会很快在配置上落后。显然这并不是个好消息,特别是对于一台售价至少2399美元(约16689人民币)的设备来说。我们十分惊喜的是它较小的电池也得到了从系统方面的很好补偿。在高负载下它的电池会很快用光,不过在实际使用情况下,它的续航时间相比前代机型甚至有所提高。
我们认为,它除了售价之外的最大问题是接口配备和一些系统缺陷。目前它的2.4GHz无线网络连接会受到接入的USB-C设备的干扰。和13寸同门师弟一样,我们因此为它减去了2%的总分。如果你使用BootCamp安装Windows的话,它的扬声器也会遇到一些驱动问题(我们的测试机)同时显卡也会遇到错误。Apple称这两个问题会在未来的软件更新中得到解决。
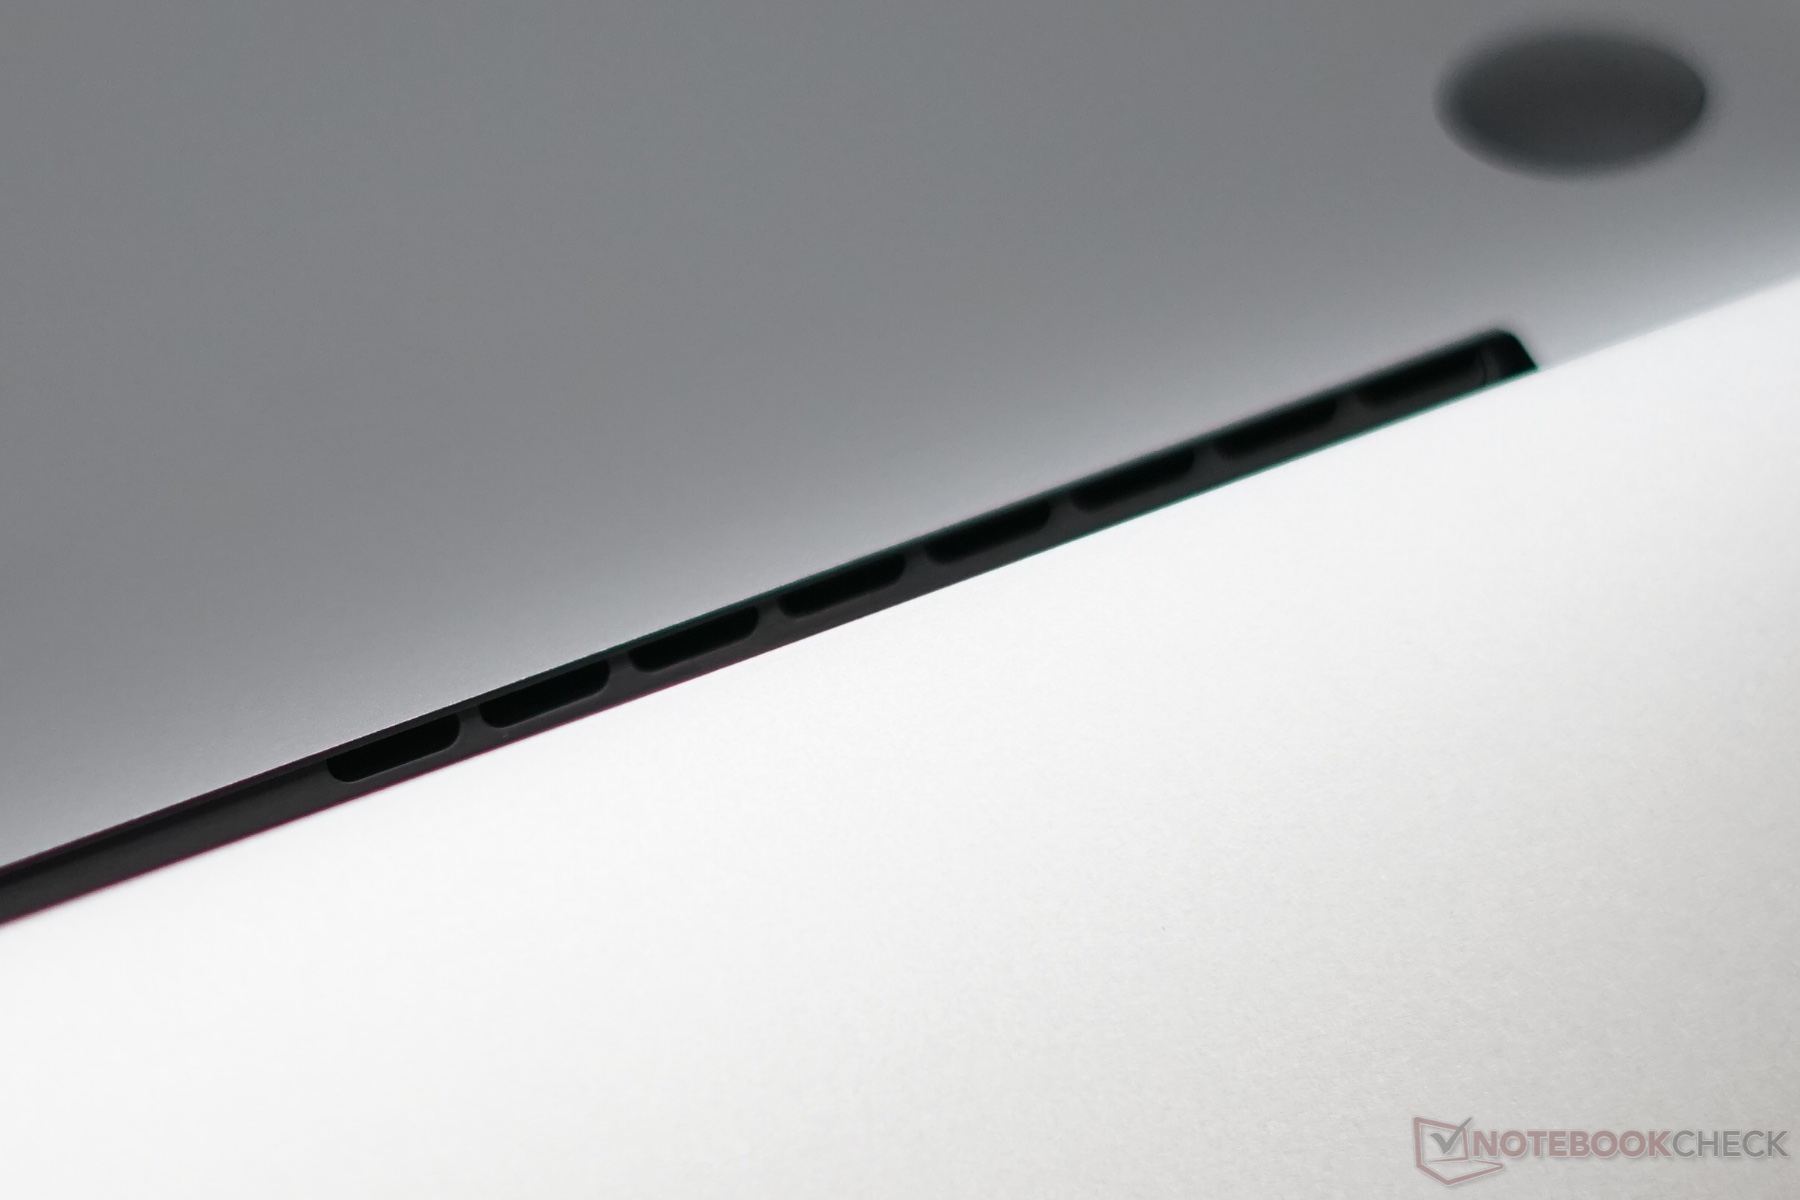
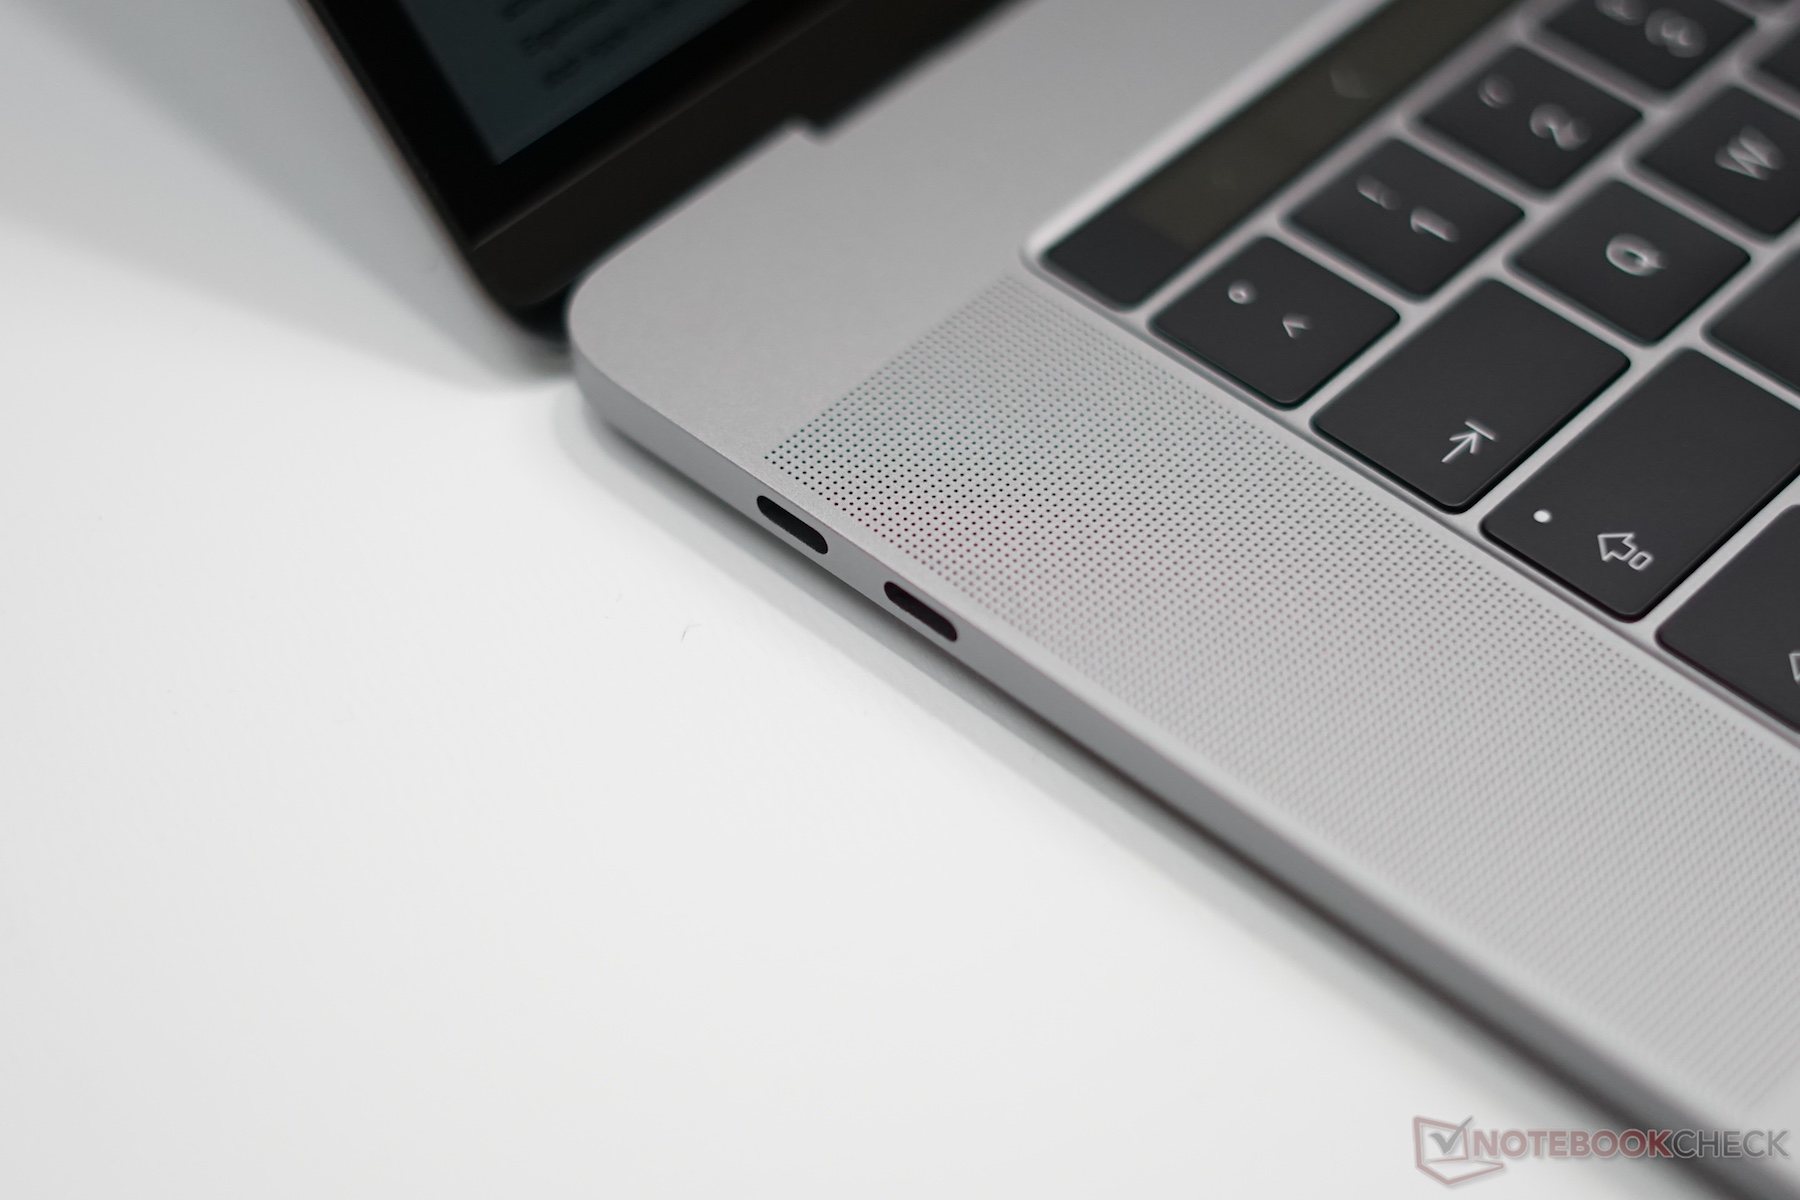
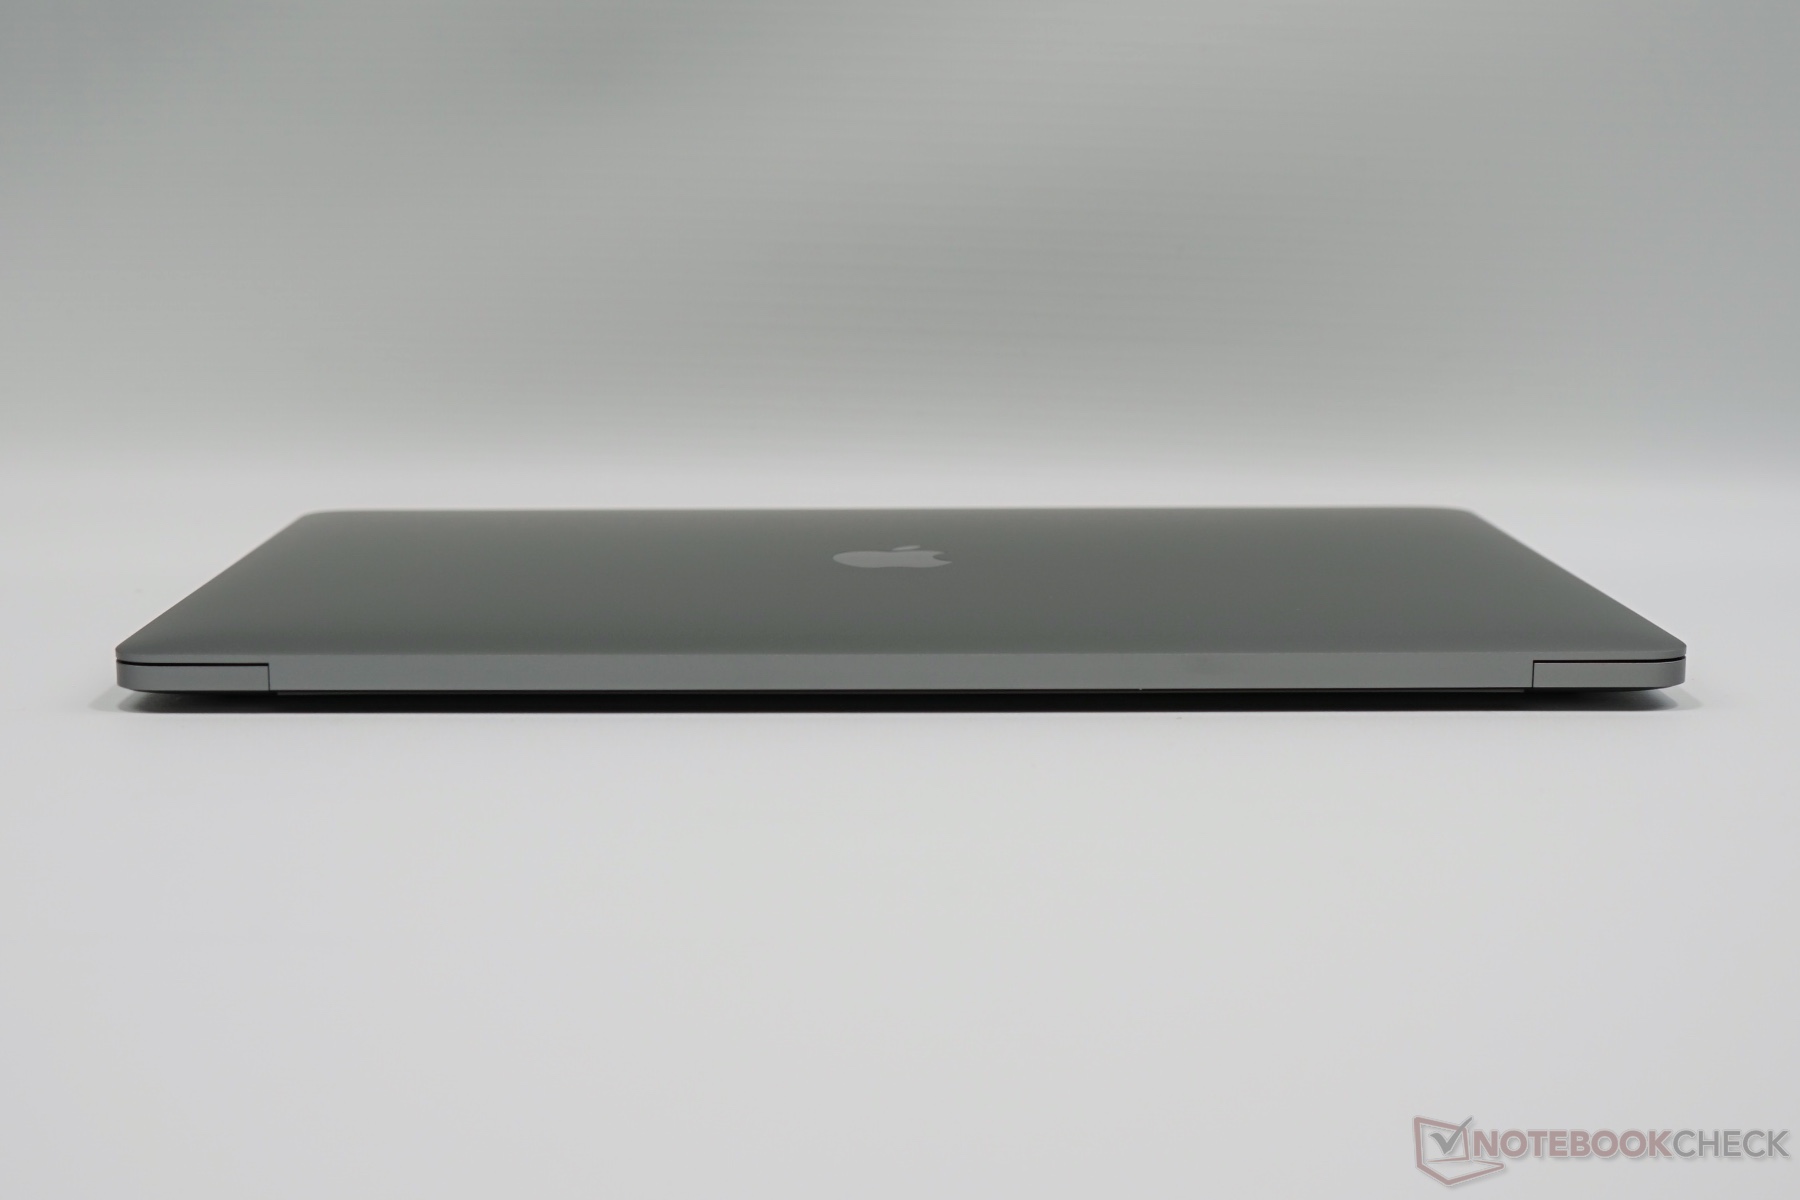
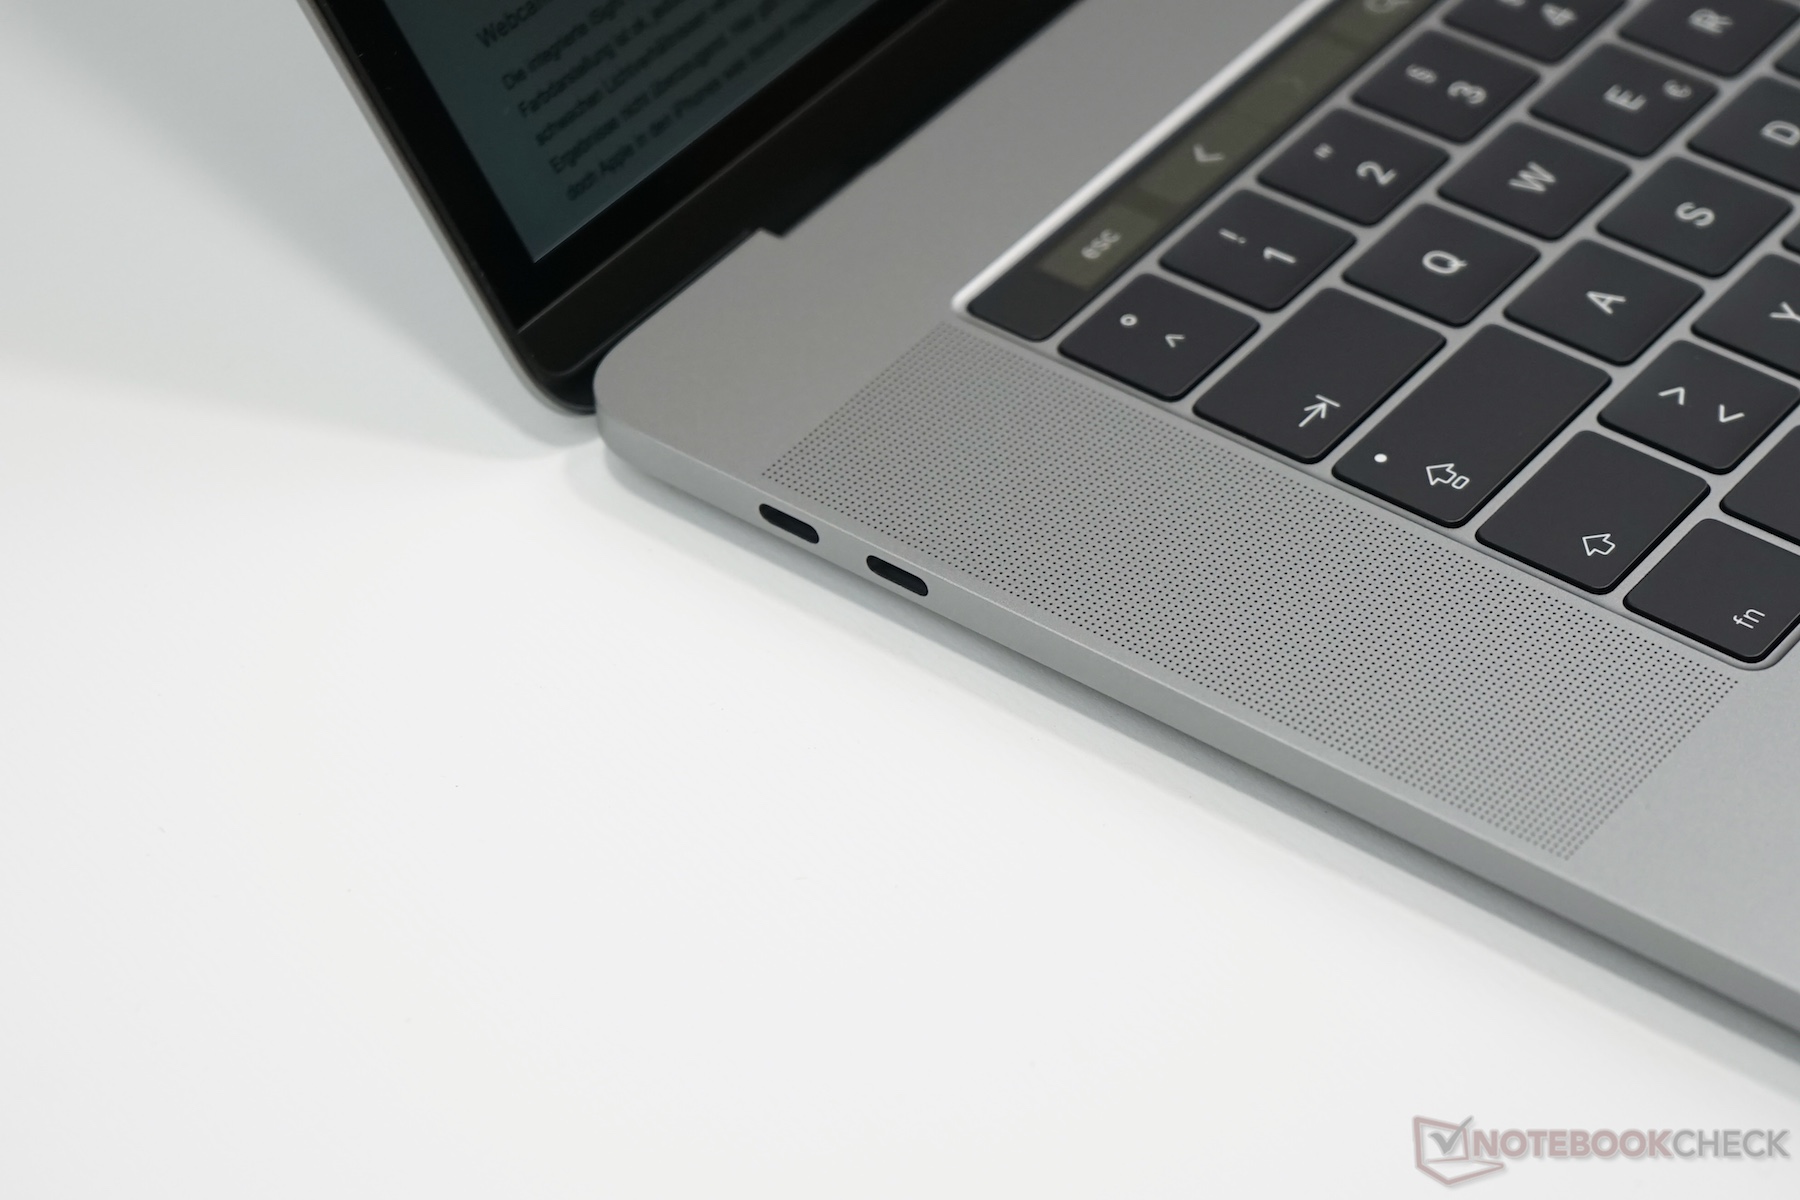
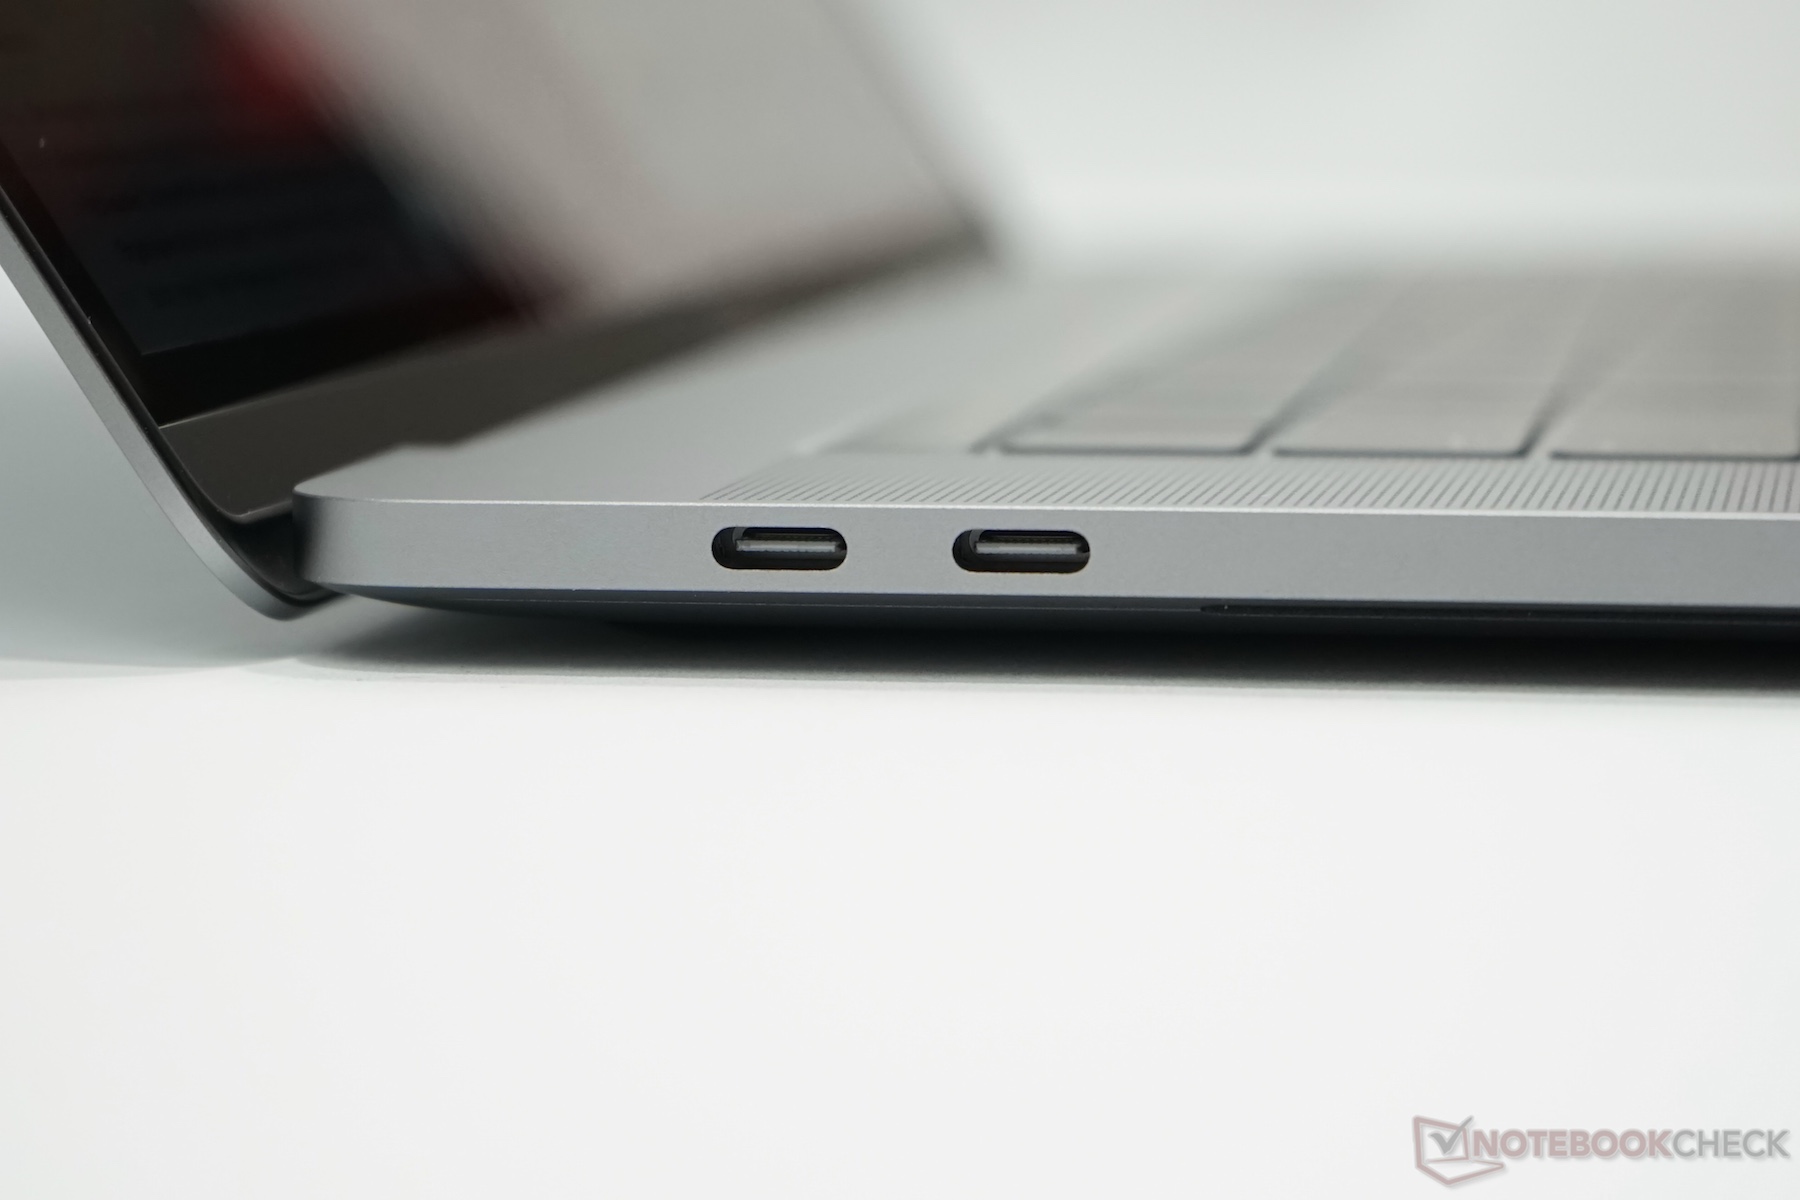
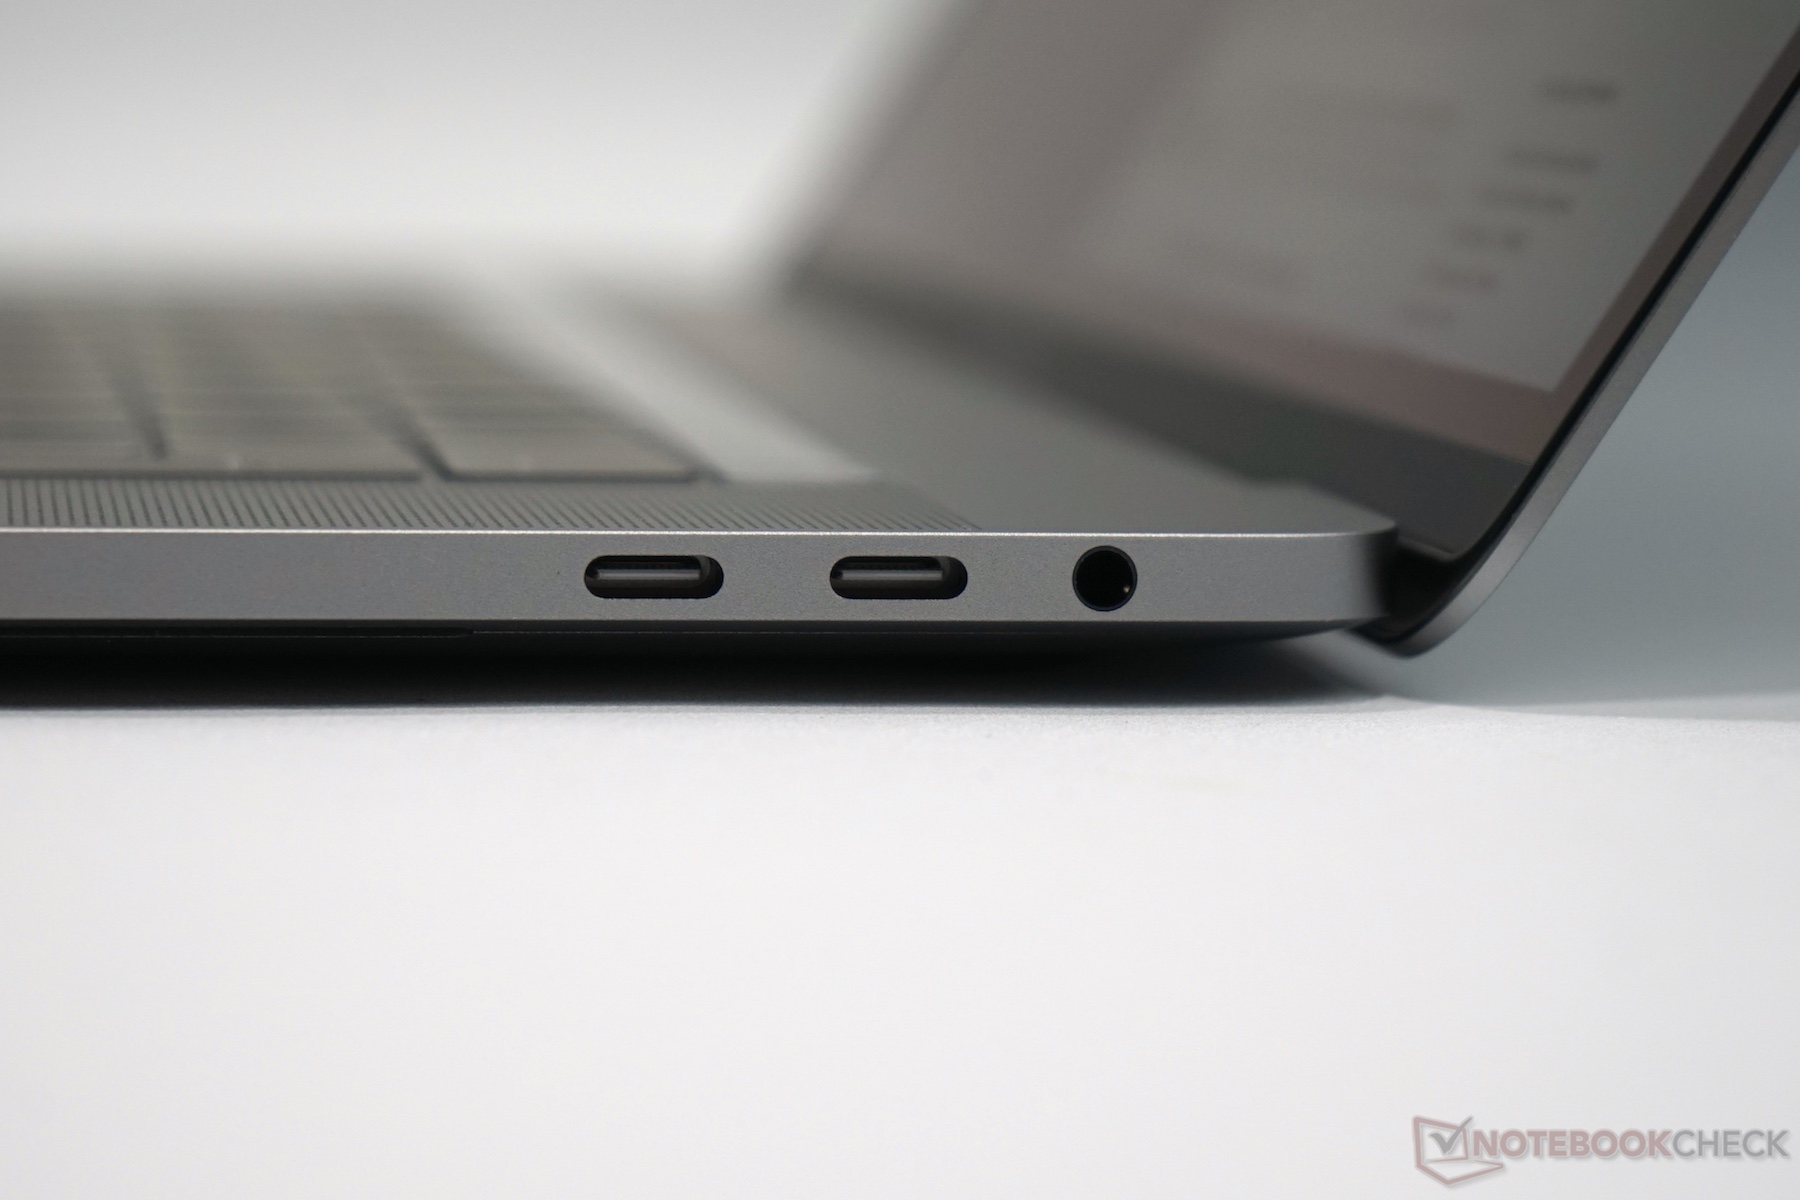
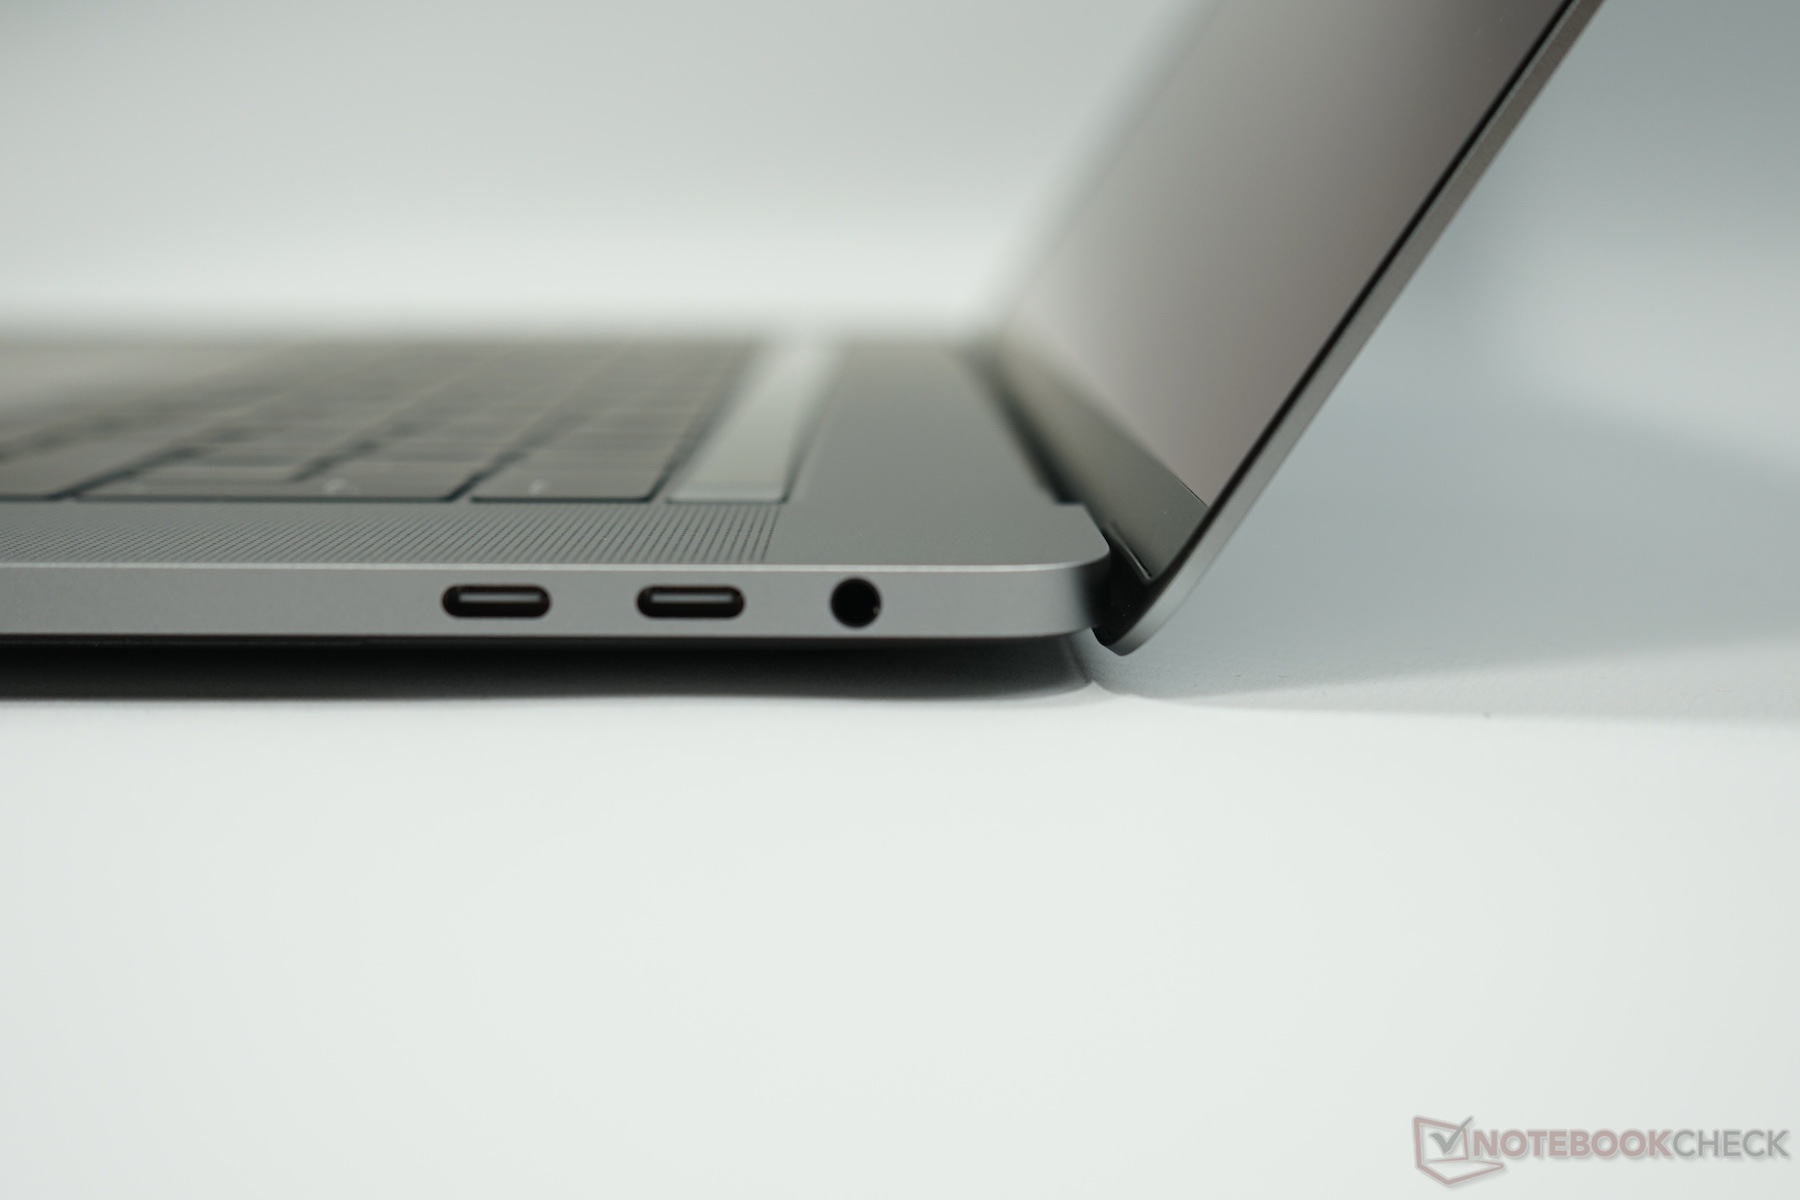
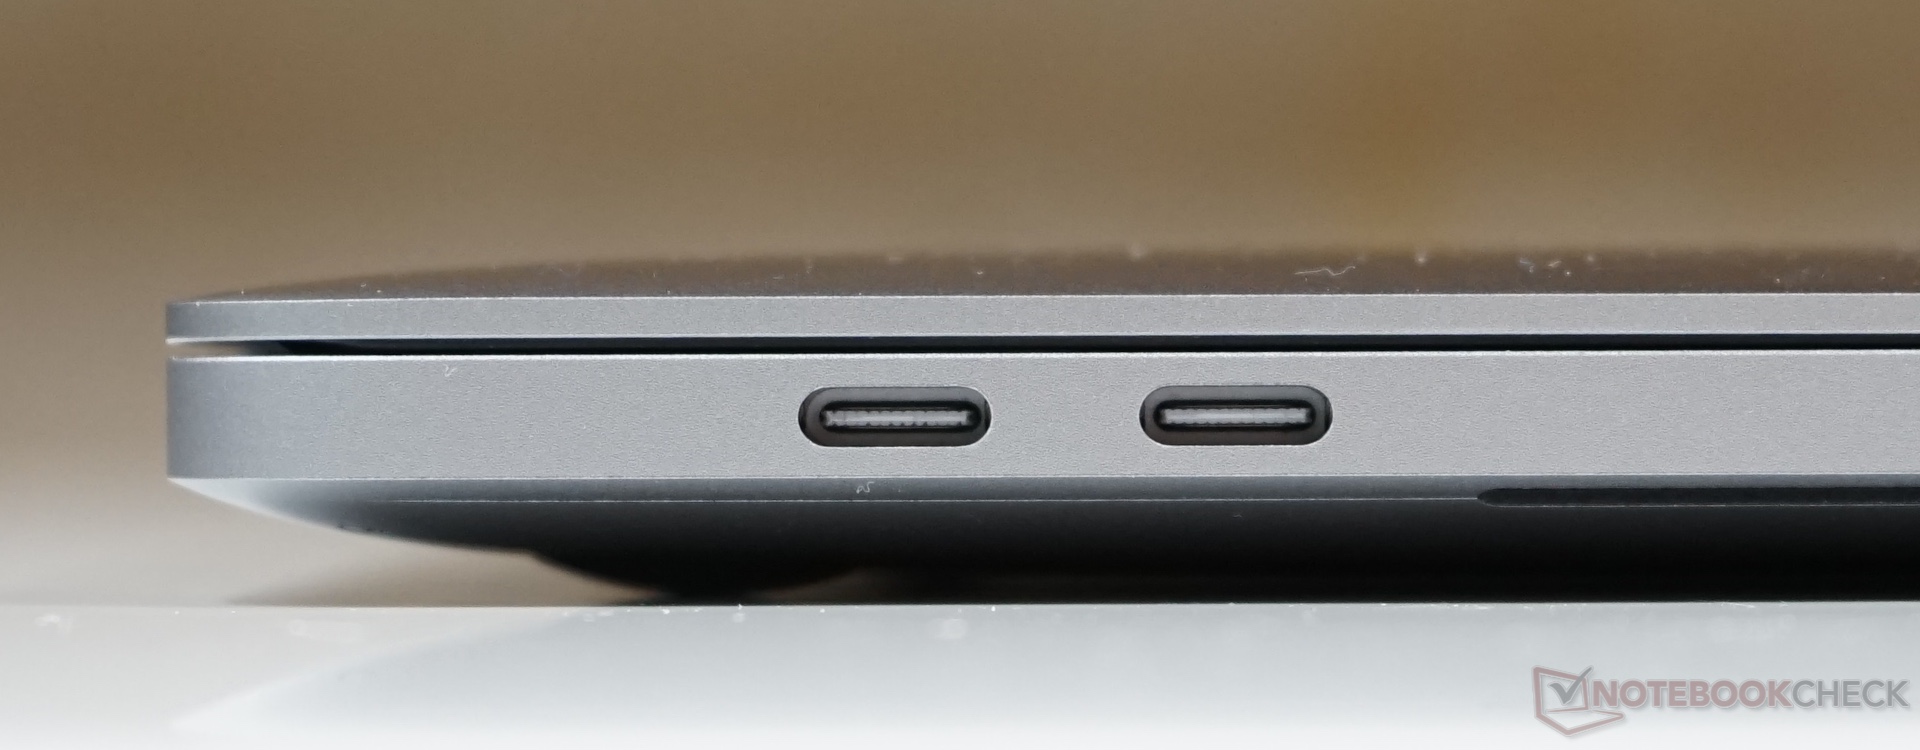
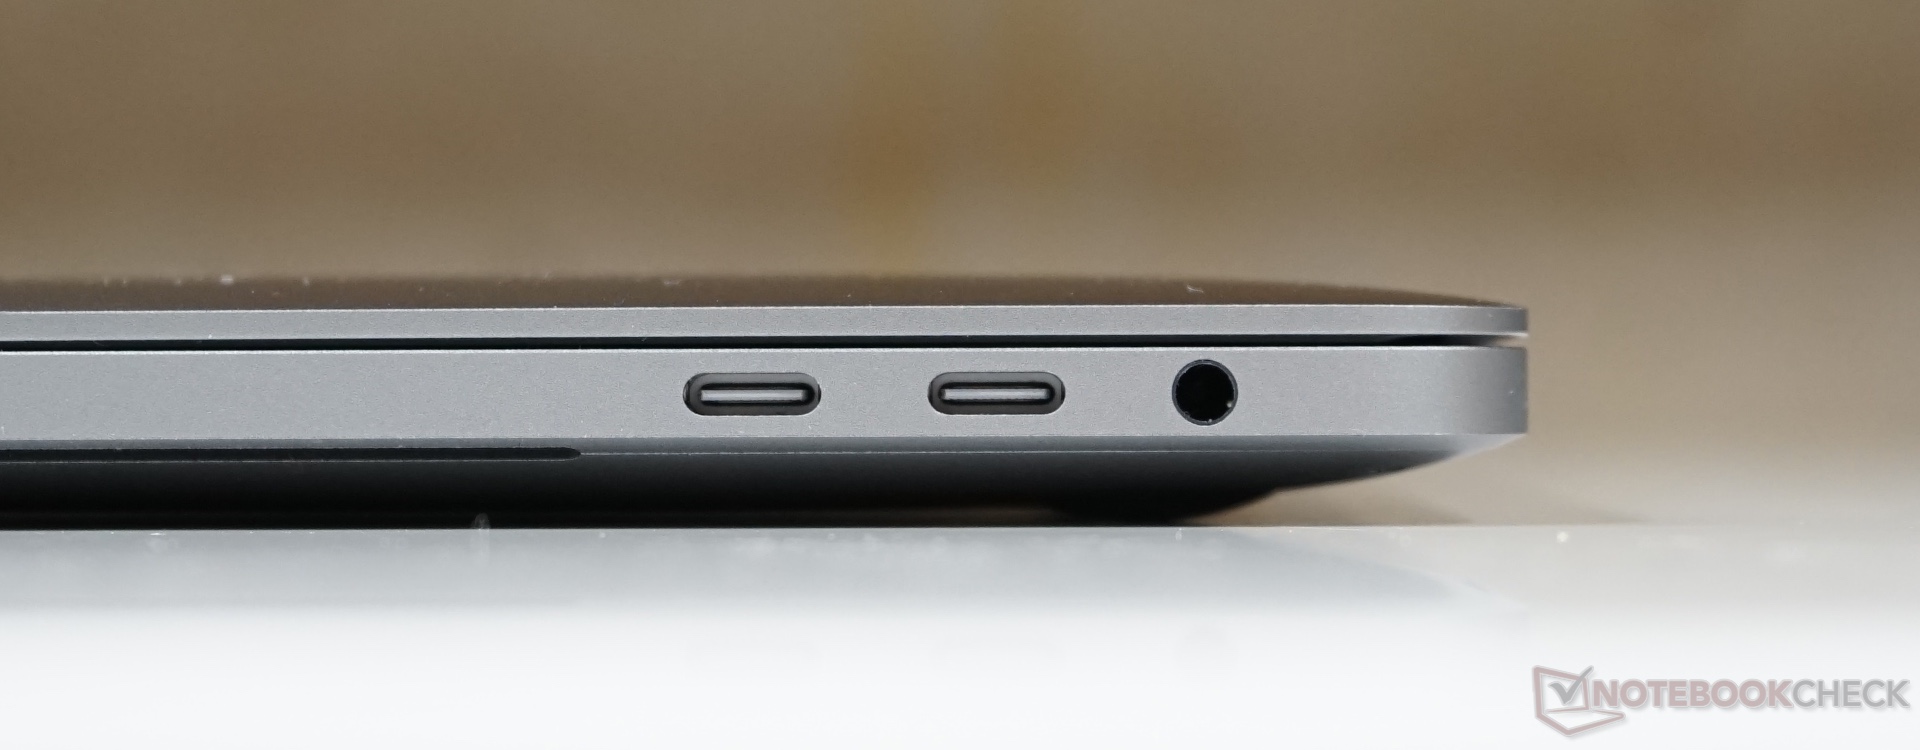
不过无法通过软件更新得到解决的是接口的问题。它的四个Thunderbolt 3接口——和13寸机型不同的是它们都支持最大带宽——十分通用且可以满足未来需要,但是这个极端的设计为目前的实际使用带来了很多不便,用户需要使用相应的转接器使用目前的外设。我们认为Apple应该可以为用户找到一个相对更好的解决方案。
整体上,最新的MacBook Pro 15让我们感觉像是个未完成产品。现在,它得到了一些新设计和一些改变,而下一代机型(很可能)将会改进现存的问题并带来更高的性能。MacBook仍然是一台非常优秀的多媒体笔记本电脑,许多用户将会对它十分满意,不过如果你并不是急需一台新电脑的话,我们认为等待它下次的更新会是更好的选择。
注:本文是基于完整评测的缩减版本,阅读完整的英文评测,请点击这里。
Apple MacBook Pro 15 2016 (2.6 GHz, 450)
- 12/09/2016 v6 (old)
J. Simon Leitner, Klaus A. Hinum, Andreas Osthoff
Price comparison
