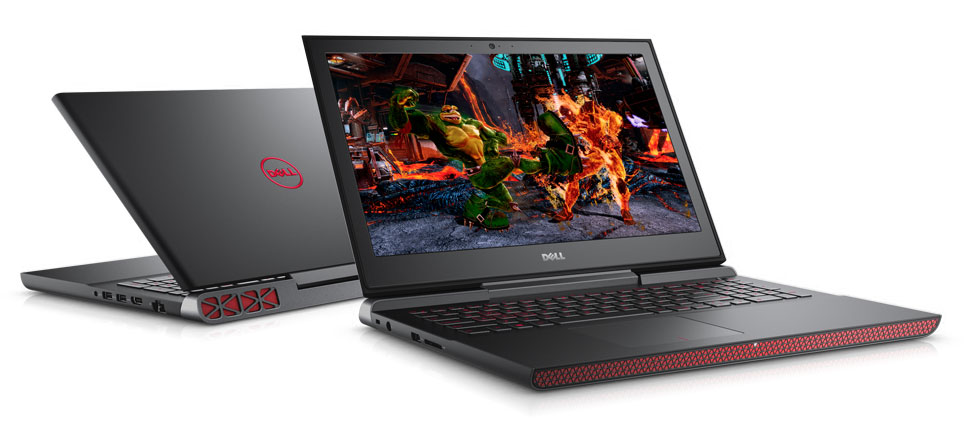
戴尔 Inspiron 15 7000 7567 游戏笔记本电脑简短评测

| SD Card Reader | |
| average JPG Copy Test (av. of 3 runs) | |
| Asus Strix GL502VM-DS74 | |
| Dell Inspiron 15 7559 | |
| MSI GE72 7RE-046 | |
| Acer Aspire VX5-591G-D0DD | |
| Dell Inspiron 15 7000 7567 | |
| maximum AS SSD Seq Read Test (1GB) | |
| Asus Strix GL502VM-DS74 | |
| Dell Inspiron 15 7559 | |
| Acer Aspire VX5-591G-D0DD | |
| MSI GE72 7RE-046 | |
| Dell Inspiron 15 7000 7567 | |
| Networking | |
| iperf3 transmit AX12 | |
| Acer Aspire VX5-591G-D0DD | |
| Asus Strix GL502VM-DS74 | |
| Dell Inspiron 15 7000 7567 (jseb) | |
| MSI GE72 7RE-046 | |
| iperf3 receive AX12 | |
| Acer Aspire VX5-591G-D0DD | |
| MSI GE72 7RE-046 | |
| Asus Strix GL502VM-DS74 | |
| Dell Inspiron 15 7000 7567 (jseb) | |
| |||||||||||||||||||||||||
Brightness Distribution: 75 %
Center on Battery: 286 cd/m²
Contrast: 447:1 (Black: 0.55 cd/m²)
ΔE ColorChecker Calman: 10.97 | ∀{0.5-29.43 Ø4.71}
ΔE Greyscale Calman: 14.25 | ∀{0.09-98 Ø4.96}
55% sRGB (Argyll 1.6.3 3D)
35% AdobeRGB 1998 (Argyll 1.6.3 3D)
37.62% AdobeRGB 1998 (Argyll 3D)
54.9% sRGB (Argyll 3D)
36.42% Display P3 (Argyll 3D)
Gamma: 1.83
CCT: 11200 K
| Dell Inspiron 15 7000 7567 AU Optronics AUO38ED B156HTN 28H80, , 1920x1080, 15.6" | MSI GE72 7RE-046 N173HHE-G32 (CMN1747), , 1920x1080, 17.3" | Dell Inspiron 15 7559 LG Philips LGD04D9 / 156UD2 / Dell P/N: 53FC4, , 3840x2160, 15.6" | Asus Strix GL502VM-DS74 1920x1080, 15.6" | |
|---|---|---|---|---|
| Display | 119% | 70% | 66% | |
| Display P3 Coverage (%) | 36.42 | 90.7 149% | 63.4 74% | 64.8 78% |
| sRGB Coverage (%) | 54.9 | 99.9 82% | 90 64% | 84.9 55% |
| AdobeRGB 1998 Coverage (%) | 37.62 | 85.2 126% | 64.6 72% | 62 65% |
| Response Times | 50% | 20% | -4% | |
| Response Time Grey 50% / Grey 80% * (ms) | 36 ? | 27 ? 25% | 32 ? 11% | 42 ? -17% |
| Response Time Black / White * (ms) | 36 ? | 9 ? 75% | 26 ? 28% | 32.8 ? 9% |
| PWM Frequency (Hz) | ||||
| Screen | 57% | 26% | 52% | |
| Brightness middle (cd/m²) | 246 | 253 3% | 276 12% | 307.8 25% |
| Brightness (cd/m²) | 235 | 230 -2% | 273 16% | 301 28% |
| Brightness Distribution (%) | 75 | 86 15% | 85 13% | 88 17% |
| Black Level * (cd/m²) | 0.55 | 0.24 56% | 0.78 -42% | 0.33 40% |
| Contrast (:1) | 447 | 1054 136% | 354 -21% | 933 109% |
| Colorchecker dE 2000 * | 10.97 | 5.01 54% | 4.05 63% | 4.5 59% |
| Greyscale dE 2000 * | 14.25 | 7.26 49% | 4.68 67% | 2.9 80% |
| Gamma | 1.83 120% | 2.09 105% | 2.55 86% | 2.22 99% |
| CCT | 11200 58% | 6329 103% | 6871 95% | 1136 572% |
| Color Space (Percent of AdobeRGB 1998) (%) | 35 | 76 117% | 58 66% | 55.4 58% |
| Color Space (Percent of sRGB) (%) | 55 | 100 82% | 90 64% | 84.8 54% |
| Colorchecker dE 2000 max. * | 10.4 | 10 | ||
| Total Average (Program / Settings) | 75% /
69% | 39% /
35% | 38% /
47% |
* ... smaller is better
Display Response Times
| ↔ Response Time Black to White | ||
|---|---|---|
| 36 ms ... rise ↗ and fall ↘ combined | ↗ 19 ms rise | 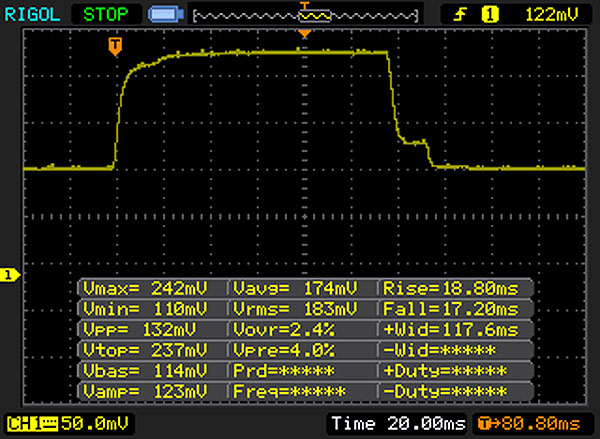 |
| ↘ 17 ms fall | ||
| The screen shows slow response rates in our tests and will be unsatisfactory for gamers. In comparison, all tested devices range from 0.1 (minimum) to 240 (maximum) ms. » 94 % of all devices are better. This means that the measured response time is worse than the average of all tested devices (19.8 ms). | ||
| ↔ Response Time 50% Grey to 80% Grey | ||
| 36 ms ... rise ↗ and fall ↘ combined | ↗ 17 ms rise | 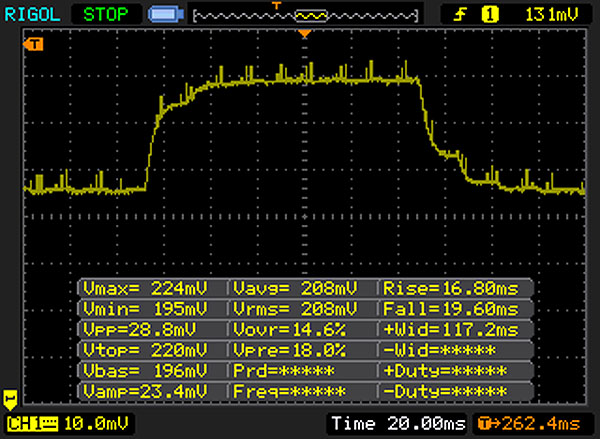 |
| ↘ 19 ms fall | ||
| The screen shows slow response rates in our tests and will be unsatisfactory for gamers. In comparison, all tested devices range from 0.165 (minimum) to 636 (maximum) ms. » 51 % of all devices are better. This means that the measured response time is worse than the average of all tested devices (31 ms). | ||
Screen Flickering / PWM (Pulse-Width Modulation)
| Screen flickering / PWM not detected | ||
In comparison: 52 % of all tested devices do not use PWM to dim the display. If PWM was detected, an average of 7757 (minimum: 5 - maximum: 343500) Hz was measured. | ||
| Cinebench R15 | |
| CPU Single 64Bit | |
| Dell Inspiron 15 7000 7567 | |
| Asus Strix GL502VM-DS74 | |
| Acer Aspire VX5-591G-D0DD | |
| Dell Inspiron 15 7559 | |
| Dell XPS 15 2017 9560 (7300HQ, Full-HD) | |
| MSI GE72 7RE-046 | |
| Lenovo IdeaPad Z50-75 | |
| CPU Multi 64Bit | |
| Asus Strix GL502VM-DS74 | |
| MSI GE72 7RE-046 | |
| Dell Inspiron 15 7000 7567 | |
| Acer Aspire VX5-591G-D0DD | |
| Dell Inspiron 15 7559 | |
| Dell XPS 15 2017 9560 (7300HQ, Full-HD) | |
| Lenovo IdeaPad Z50-75 | |
| PCMark 8 Home Score Accelerated v2 | 3850 points | |
| PCMark 8 Work Score Accelerated v2 | 5068 points | |
Help | ||
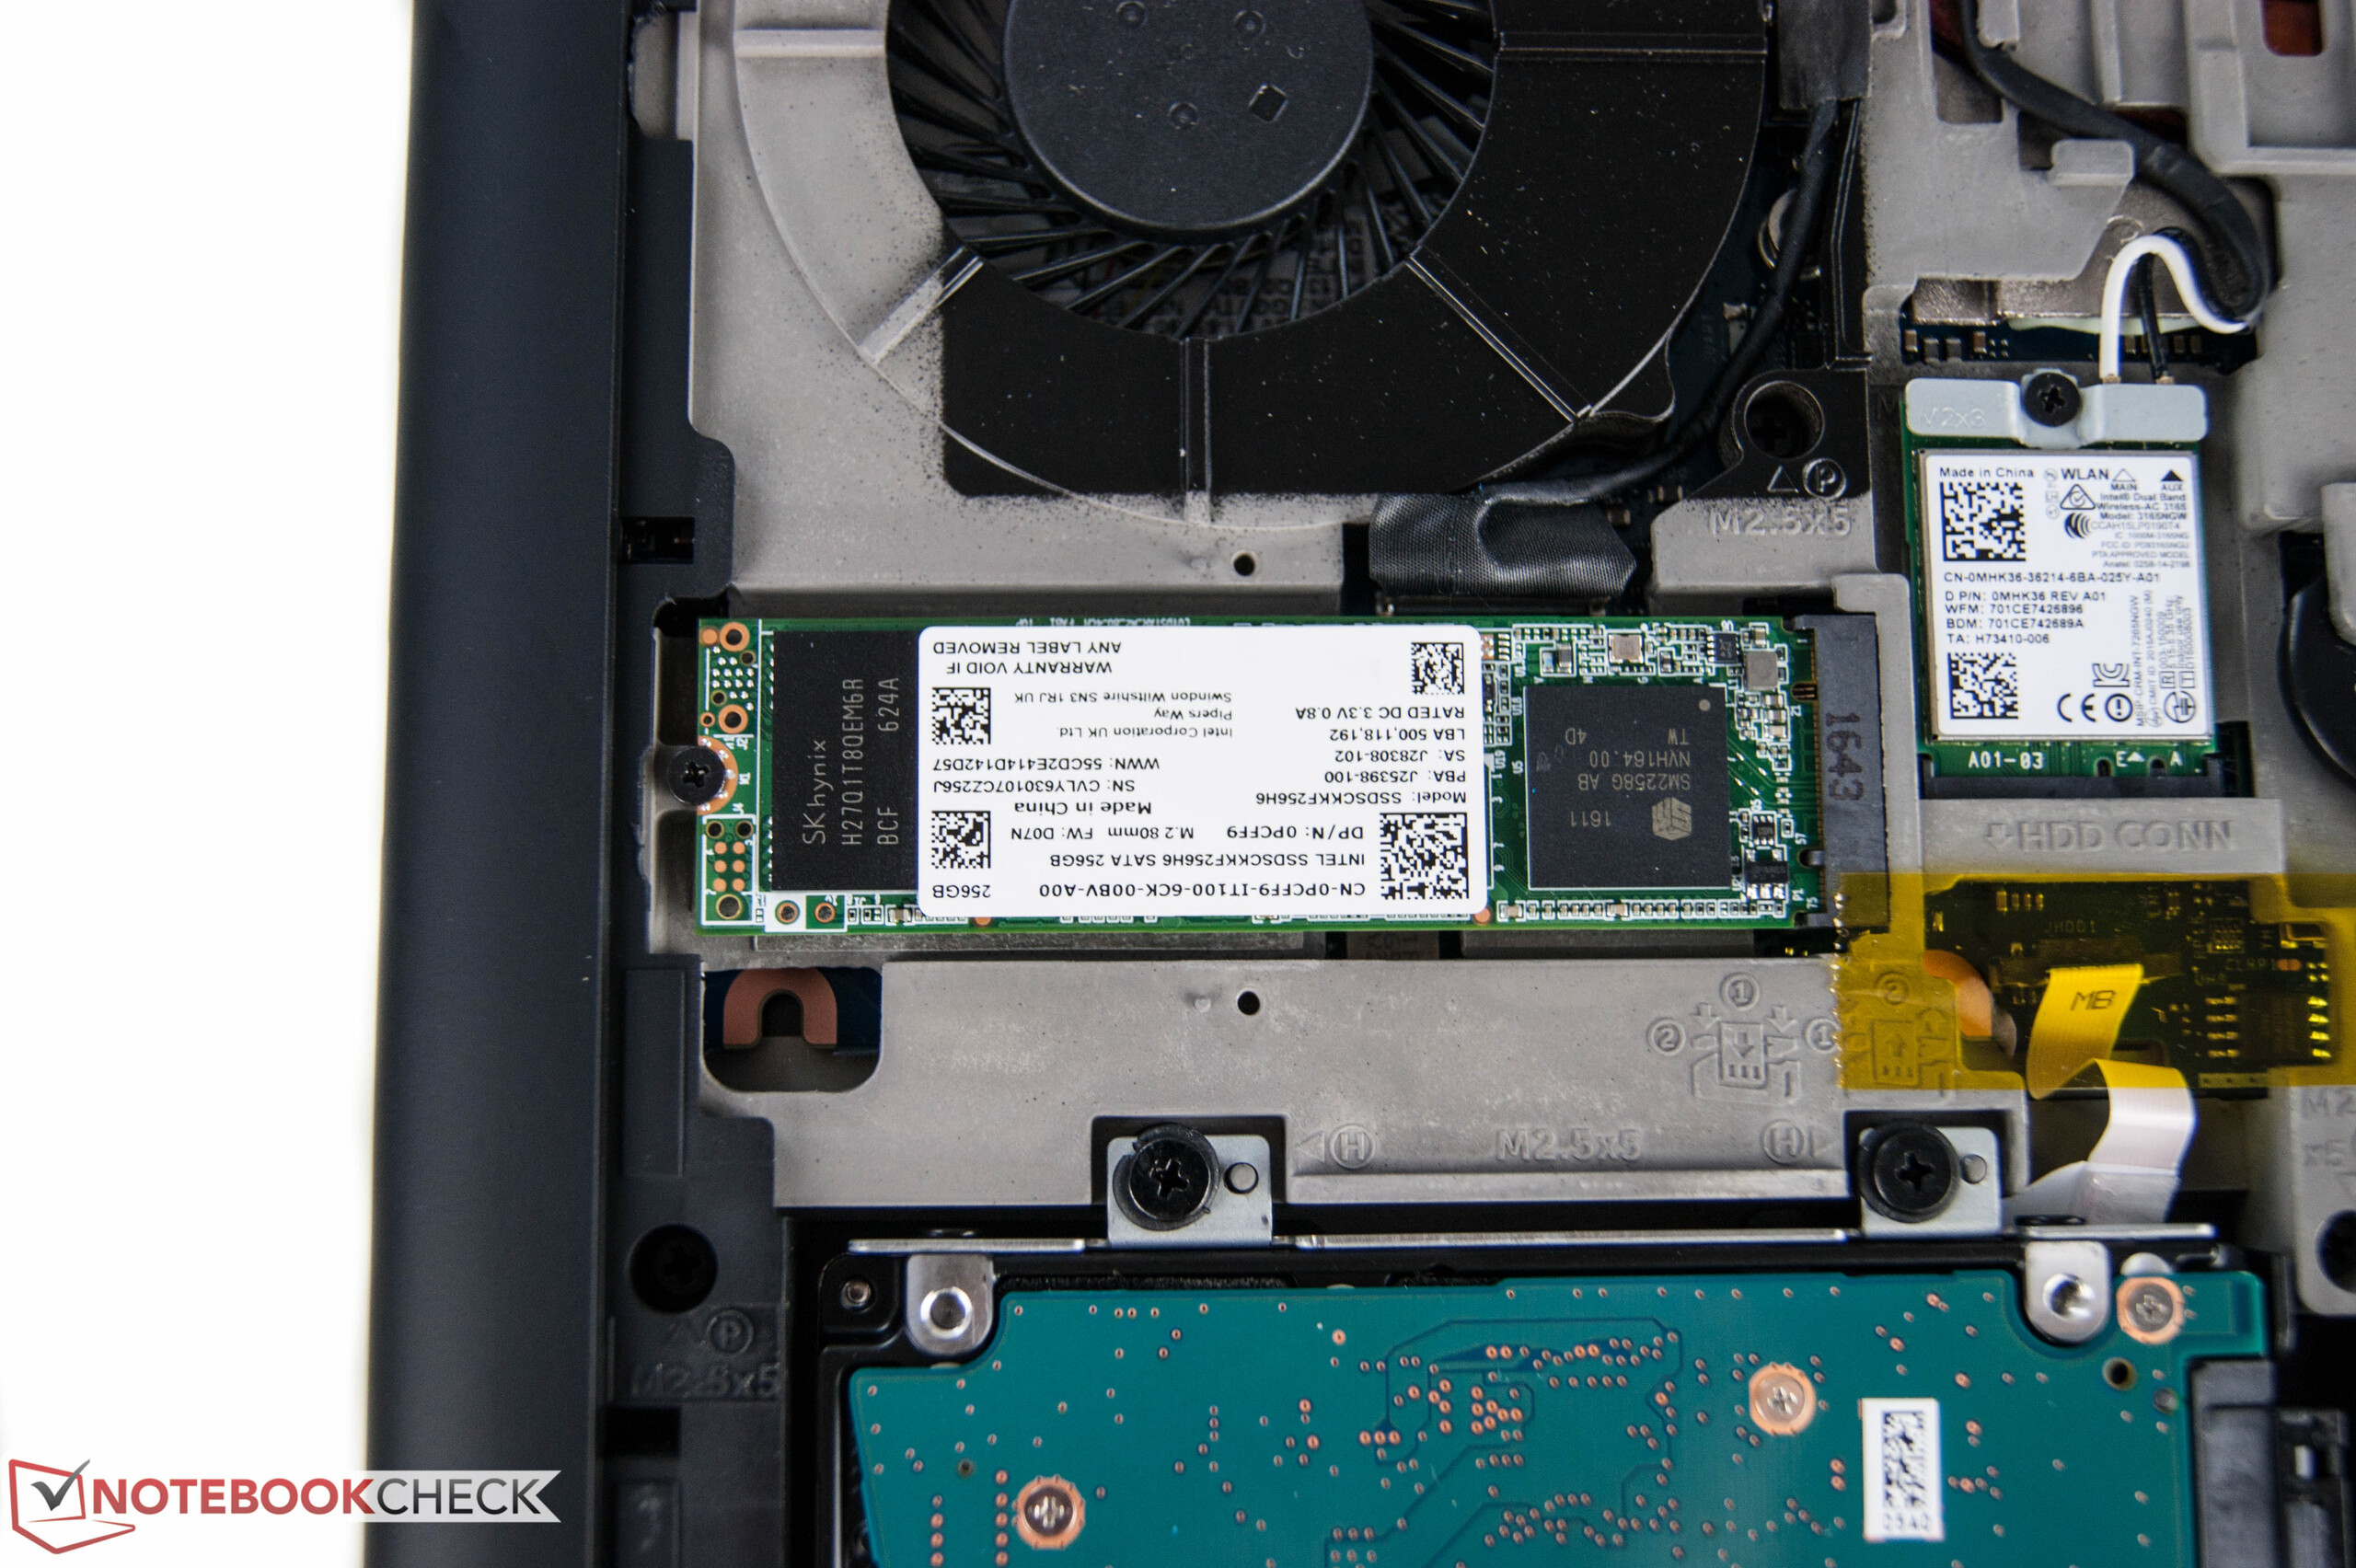
| Dell Inspiron 15 7000 7567 Intel SSDSCKKF256H6 | MSI GE72 7RE-046 Toshiba HG6 THNSNJ256G8NY | Dell Inspiron 15 7559 SK hynix SC300 M.2 | Asus Strix GL502VM-DS74 Samsung SSD 960 Evo 250GB m.2 NVMe | Acer Aspire VX5-591G-D0DD SK Hynix Canvas SC300 512GB M.2 (HFS512G39MND) | |
|---|---|---|---|---|---|
| CrystalDiskMark 3.0 | 19% | -11% | 171% | 3% | |
| Read Seq (MB/s) | 485.8 | 540 11% | 489.9 1% | 1747 260% | 494.2 2% |
| Write Seq (MB/s) | 422.8 | 495.7 17% | 205.1 -51% | 1477 249% | 449.6 6% |
| Read 512 (MB/s) | 338.9 | 455.1 34% | 354.3 5% | 863 155% | 348.1 3% |
| Write 512 (MB/s) | 304 | 481.4 58% | 211.5 -30% | 1115 267% | 418.2 38% |
| Read 4k (MB/s) | 27.11 | 22.7 -16% | 27.84 3% | 56.8 110% | 16.97 -37% |
| Write 4k (MB/s) | 85.4 | 112.9 32% | 68 -20% | 152.4 78% | 38.36 -55% |
| Read 4k QD32 (MB/s) | 279.6 | 372.5 33% | 348.2 25% | 652 133% | 394.9 41% |
| Write 4k QD32 (MB/s) | 255.1 | 212.9 -17% | 198.4 -22% | 542 112% | 317.4 24% |

| 3DMark 11 Performance | 8992 points | |
| 3DMark Cloud Gate Standard Score | 21998 points | |
| 3DMark Fire Strike Score | 6709 points | |
Help | ||
| Rise of the Tomb Raider | |
| 1920x1080 High Preset AA:FX AF:4x | |
| Asus Strix GL502VT-DS74 | |
| MSI GE72 7RE-046 | |
| Acer Aspire VX5-591G-D0DD | |
| Dell Inspiron 15 7000 7567 | |
| MSI GL62M 7RD-077 | |
| Asus Strix GL753VD-GC045T | |
| 1920x1080 Very High Preset AA:FX AF:16x | |
| Asus Strix GL502VM-DS74 | |
| Asus Strix GL502VT-DS74 | |
| MSI GE72 7RE-046 | |
| Acer Aspire VX5-591G-D0DD | |
| Dell Inspiron 15 7000 7567 | |
| MSI GL62M 7RD-077 | |
| Asus Strix GL753VD-GC045T | |
| BioShock Infinite | |
| 1366x768 High Preset | |
| MSI GL62M 7RD-077 | |
| Dell Inspiron 15 7000 7567 | |
| Asus Strix GL502VT-DS74 | |
| Dell Inspiron 15 7559 | |
| Lenovo IdeaPad Z50-75 | |
| 1920x1080 Ultra Preset, DX11 (DDOF) | |
| Asus Strix GL502VM-DS74 | |
| Dell Inspiron 15 7000 7567 | |
| Asus Strix GL502VT-DS74 | |
| MSI GL62M 7RD-077 | |
| Dell Inspiron 15 7559 | |
| Lenovo IdeaPad Z50-75 | |
| Titanfall 2 | |
| 1920x1080 High / Enabled AA:TS AF:8x | |
| Dell Inspiron 15 7000 7567 | |
| Acer Aspire VX5-591G-D0DD | |
| MSI GE72 7RE-046 | |
| Asus Strix GL753VD-GC045T | |
| MSI GL62M 7RD-077 | |
| Dell XPS 15 2017 9560 (7300HQ, Full-HD) | |
| 1920x1080 Very High (Insane Texture Quality) / Enabled AA:TS AF:16x | |
| Dell Inspiron 15 7000 7567 | |
| Acer Aspire VX5-591G-D0DD | |
| Asus Strix GL753VD-GC045T | |
| MSI GE72 7RE-046 | |
| Dell XPS 15 2017 9560 (7300HQ, Full-HD) | |
| MSI GL62M 7RD-077 | |
| low | med. | high | ultra | |
|---|---|---|---|---|
| BioShock Infinite (2013) | 182.1 | 154.1 | 147 | 72.8 |
| GTA V (2015) | 135 | 118.8 | 60.3 | 36.1 |
| Metal Gear Solid V (2015) | 60 | 60 | 60 | 60 |
| Rise of the Tomb Raider (2016) | 117.5 | 86.6 | 46.6 | 38.3 |
| Doom (2016) | 117 | 105.3 | 69.1 | 67.5 |
| Mafia 3 (2016) | 61.3 | 44.3 | 28.6 | |
| Battlefield 1 (2016) | 114.7 | 99.7 | 56.9 | 51.2 |
| Farming Simulator 17 (2016) | 169.8 | 148.5 | 124.6 | 116 |
| Titanfall 2 (2016) | 143.4 | 131.9 | 75.8 | 66.7 |
| Call of Duty Infinite Warfare (2016) | 113.8 | 102 | 67.8 | 59 |
| Dishonored 2 (2016) | 87.9 | 72.2 | 46.3 | 39.9 |
| Watch Dogs 2 (2016) | 82.5 | 74.3 | 44.5 | 31.4 |
| Resident Evil 7 (2017) | 245.5 | 126.8 | 68.5 | 25.6 |
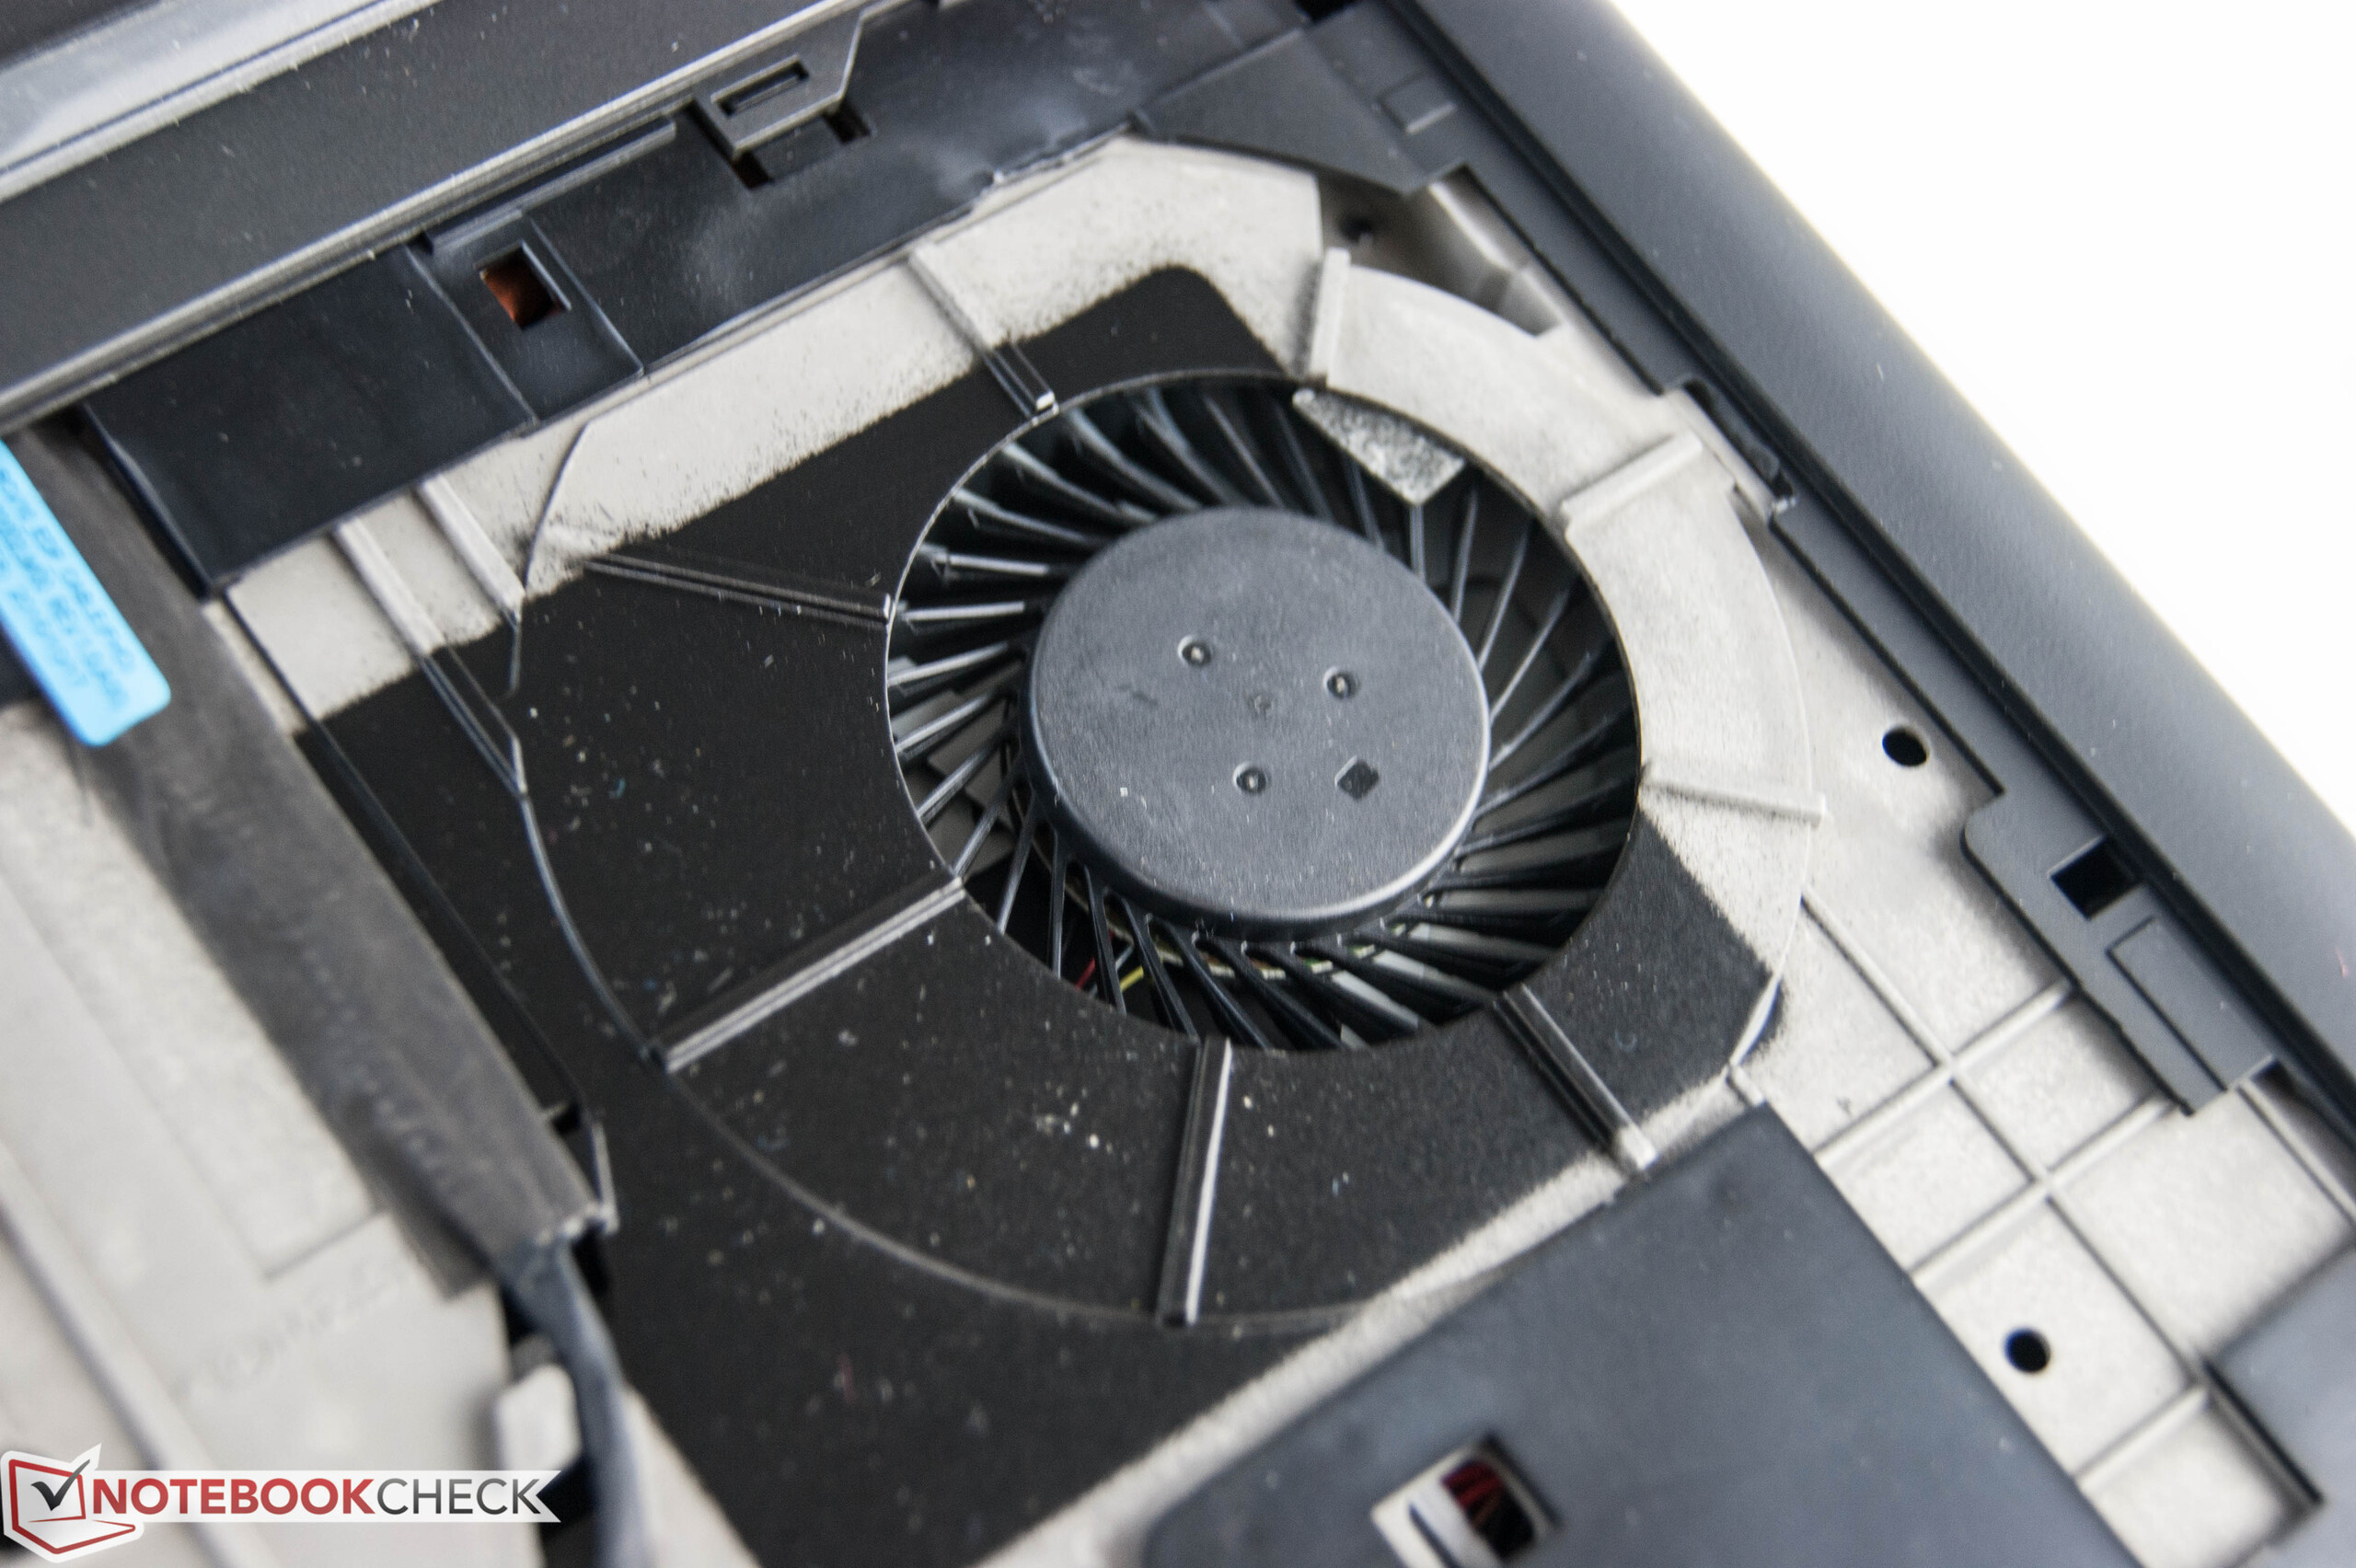
Noise level
| Idle |
| 30.9 / 30.9 / 31 dB(A) |
| HDD |
| 31.2 dB(A) |
| Load |
| 46.5 / 46.8 dB(A) |
 | ||
30 dB silent 40 dB(A) audible 50 dB(A) loud |
||
min: | ||
(±) The maximum temperature on the upper side is 43.4 °C / 110 F, compared to the average of 40.4 °C / 105 F, ranging from 21.2 to 68.8 °C for the class Gaming.
(+) The bottom heats up to a maximum of 37.7 °C / 100 F, compared to the average of 43.2 °C / 110 F
(+) In idle usage, the average temperature for the upper side is 23.1 °C / 74 F, compared to the device average of 33.9 °C / 93 F.
(+) The palmrests and touchpad are cooler than skin temperature with a maximum of 26.6 °C / 79.9 F and are therefore cool to the touch.
(+) The average temperature of the palmrest area of similar devices was 28.8 °C / 83.8 F (+2.2 °C / 3.9 F).
Dell Inspiron 15 7000 7567 audio analysis
(±) | speaker loudness is average but good (74 dB)
Bass 100 - 315 Hz
(±) | reduced bass - on average 12.6% lower than median
(±) | linearity of bass is average (13.2% delta to prev. frequency)
Mids 400 - 2000 Hz
(+) | balanced mids - only 1.8% away from median
(+) | mids are linear (4.3% delta to prev. frequency)
Highs 2 - 16 kHz
(+) | balanced highs - only 4% away from median
(+) | highs are linear (3.9% delta to prev. frequency)
Overall 100 - 16.000 Hz
(+) | overall sound is linear (12% difference to median)
Compared to same class
» 12% of all tested devices in this class were better, 4% similar, 84% worse
» The best had a delta of 6%, average was 18%, worst was 132%
Compared to all devices tested
» 9% of all tested devices were better, 2% similar, 88% worse
» The best had a delta of 4%, average was 23%, worst was 134%
Apple MacBook 12 (Early 2016) 1.1 GHz audio analysis
(+) | speakers can play relatively loud (83.6 dB)
Bass 100 - 315 Hz
(±) | reduced bass - on average 11.3% lower than median
(±) | linearity of bass is average (14.2% delta to prev. frequency)
Mids 400 - 2000 Hz
(+) | balanced mids - only 2.4% away from median
(+) | mids are linear (5.5% delta to prev. frequency)
Highs 2 - 16 kHz
(+) | balanced highs - only 2% away from median
(+) | highs are linear (4.5% delta to prev. frequency)
Overall 100 - 16.000 Hz
(+) | overall sound is linear (10.2% difference to median)
Compared to same class
» 7% of all tested devices in this class were better, 2% similar, 90% worse
» The best had a delta of 5%, average was 18%, worst was 53%
Compared to all devices tested
» 5% of all tested devices were better, 1% similar, 94% worse
» The best had a delta of 4%, average was 23%, worst was 134%
| Off / Standby | |
| Idle | |
| Load |
|
Key:
min: | |
| Dell Inspiron 15 7000 7567 i7-7700HQ, GeForce GTX 1050 Ti Mobile, Intel SSDSCKKF256H6, TN, 1920x1080, 15.6" | MSI GE72 7RE-046 i7-7700HQ, GeForce GTX 1050 Ti Mobile, Toshiba HG6 THNSNJ256G8NY, TN LED, 1920x1080, 17.3" | Dell Inspiron 15 7559 6700HQ, GeForce GTX 960M, SK hynix SC300 M.2, IPS, 3840x2160, 15.6" | Asus Strix GL502VM-DS74 i7-7700HQ, GeForce GTX 1060 Mobile, Samsung SSD 960 Evo 250GB m.2 NVMe, IPS, 1920x1080, 15.6" | |
|---|---|---|---|---|
| Power Consumption | -124% | -65% | -347% | |
| Idle Minimum * (Watt) | 4.4 | 14 -218% | 9.4 -114% | 38.3 -770% |
| Idle Average * (Watt) | 6.8 | 20 -194% | 14.4 -112% | 40.5 -496% |
| Idle Maximum * (Watt) | 8.3 | 25 -201% | 15 -81% | 42.2 -408% |
| Load Average * (Watt) | 81 | 82 -1% | 102 -26% | 110.4 -36% |
| Load Maximum * (Watt) | 127 | 135 -6% | 120 6% | 155.7 -23% |
* ... smaller is better
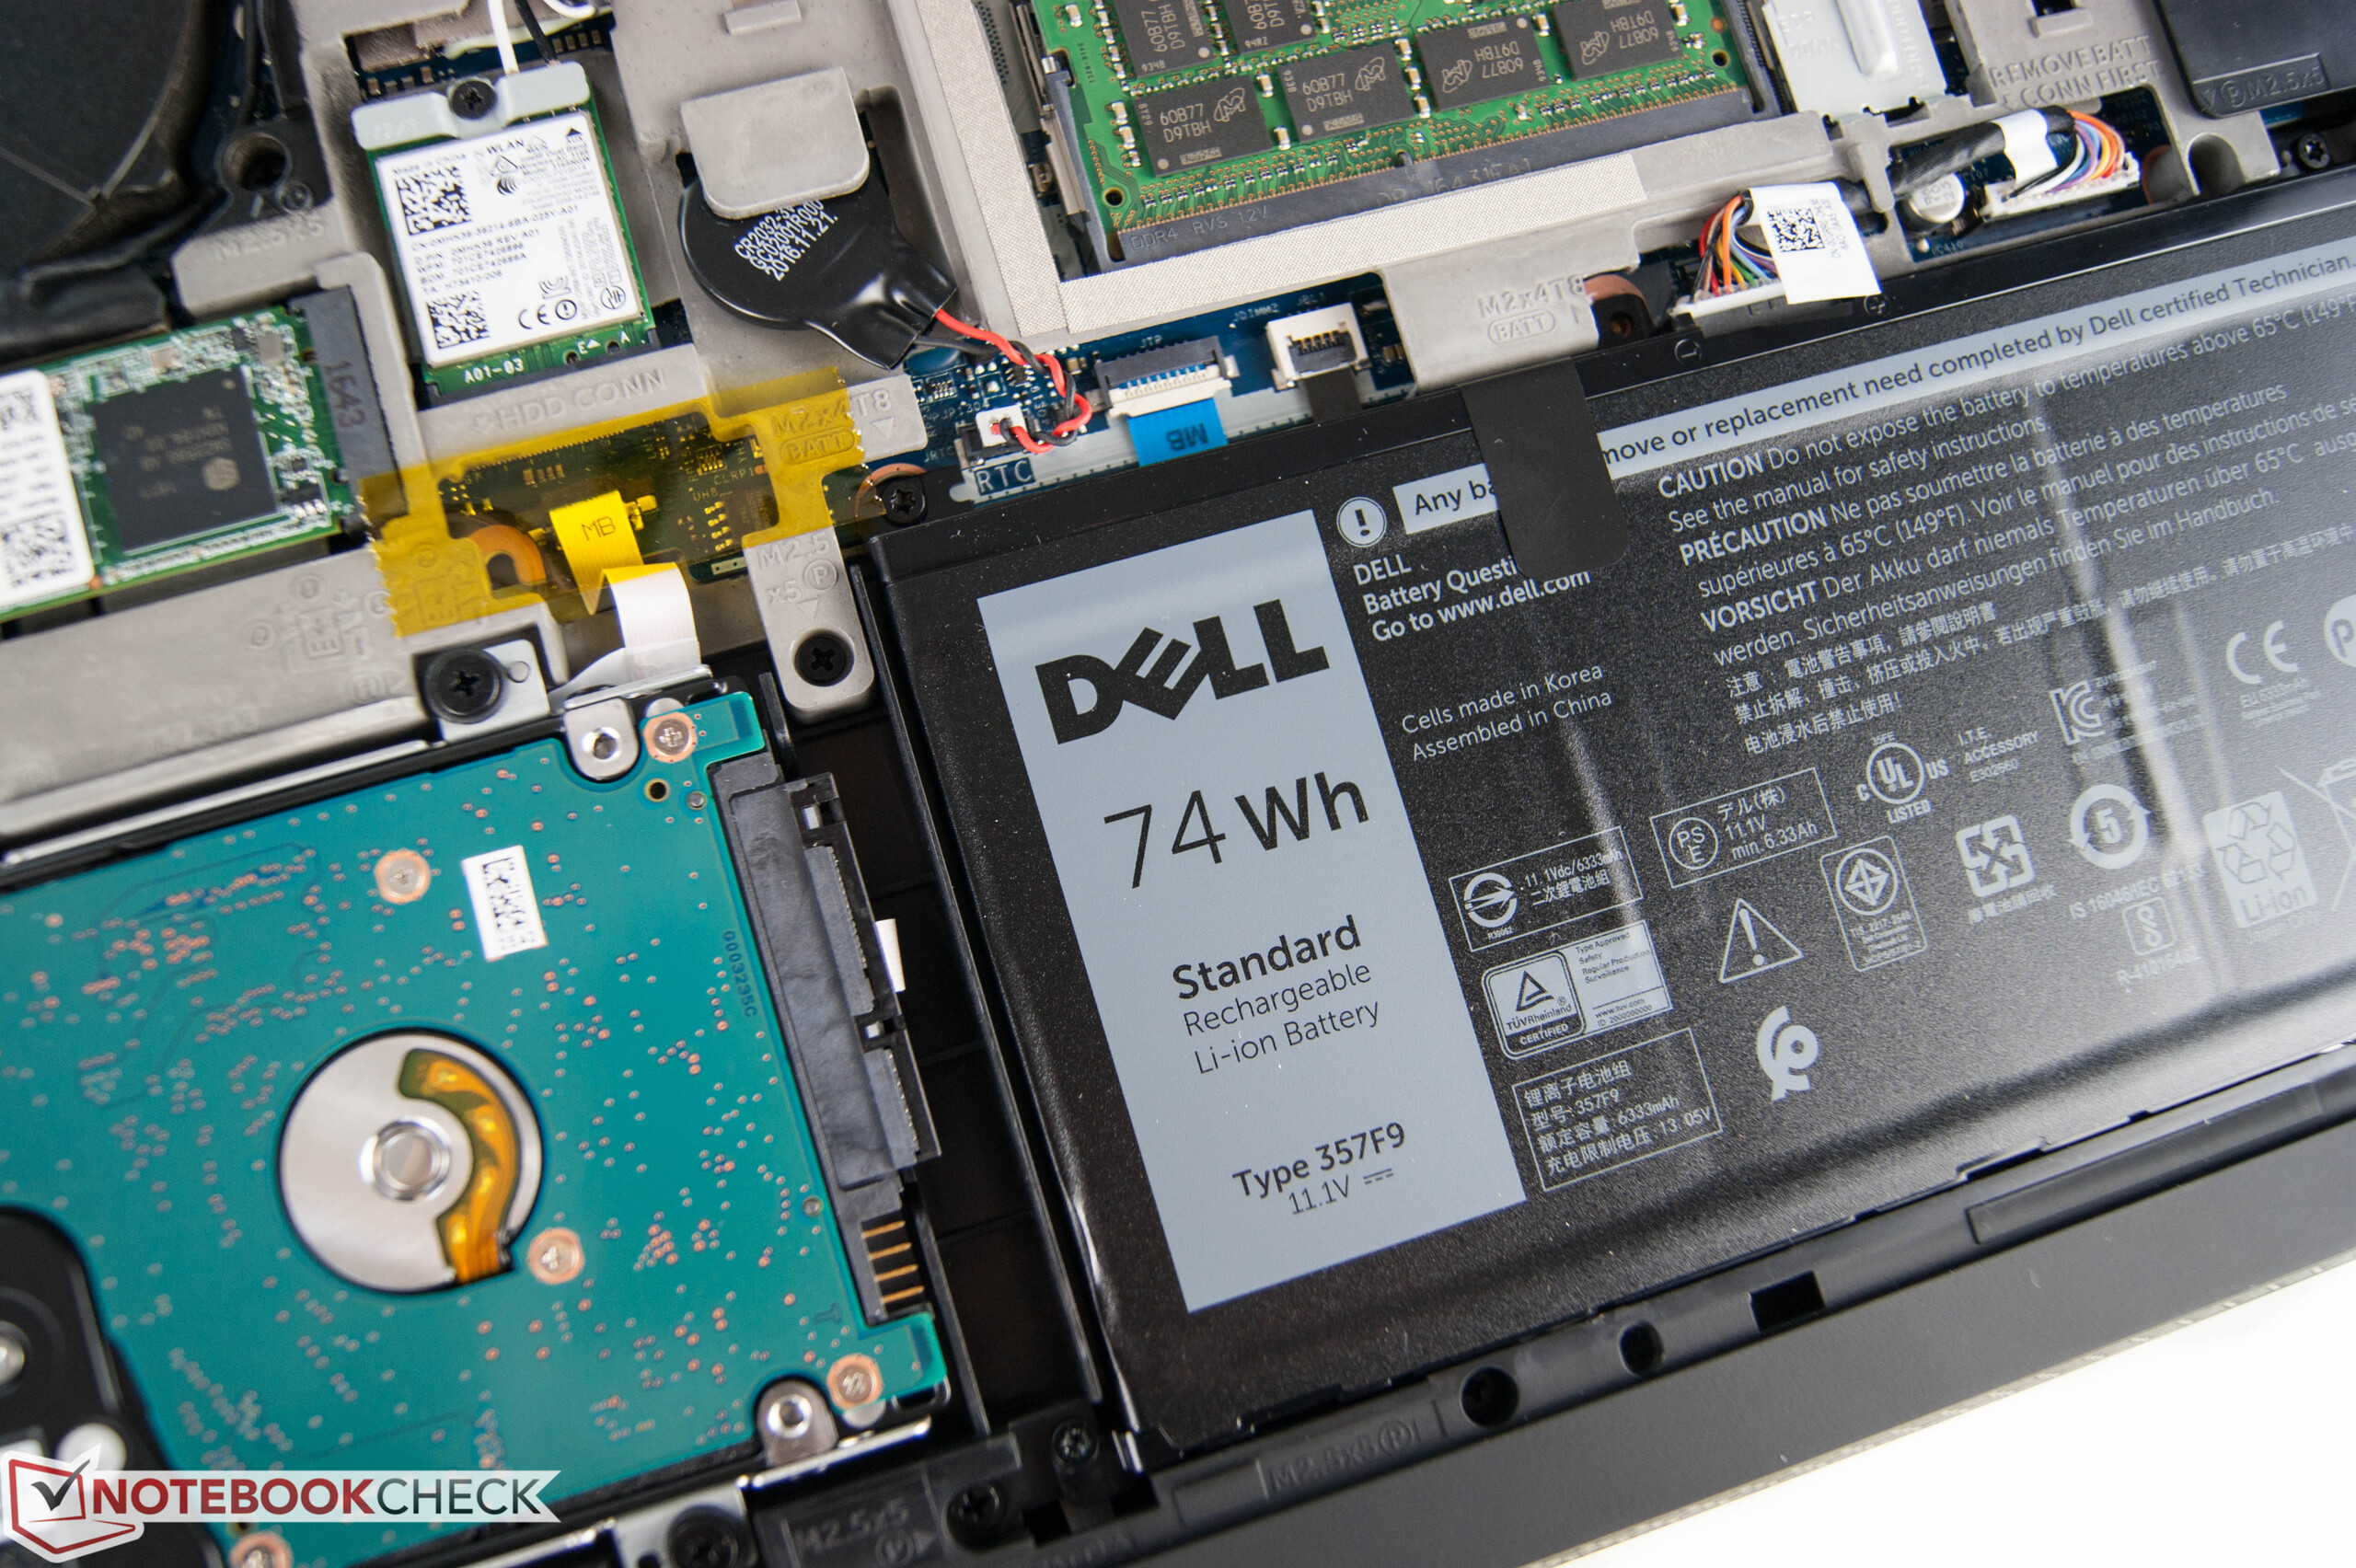
| Dell Inspiron 15 7000 7567 i7-7700HQ, GeForce GTX 1050 Ti Mobile, 74 Wh | MSI GE72 7RE-046 i7-7700HQ, GeForce GTX 1050 Ti Mobile, 51.4 Wh | Dell Inspiron 15 7559 6700HQ, GeForce GTX 960M, 74 Wh | Asus Strix GL502VM-DS74 i7-7700HQ, GeForce GTX 1060 Mobile, 64 Wh | Acer Aspire VX5-591G-D0DD i7-7700HQ, GeForce GTX 1050 Ti Mobile, 52 Wh | |
|---|---|---|---|---|---|
| Battery runtime | -64% | -36% | -69% | -41% | |
| Reader / Idle (h) | 19.6 | 11.8 -40% | 1.7 -91% | ||
| H.264 (h) | 7.6 | 3.3 -57% | |||
| WiFi v1.3 (h) | 10.4 | 3.1 -70% | 3.9 -62% | 1.5 -86% | 6.1 -41% |
| Load (h) | 1.4 | 1.3 -7% | 1 -29% |
Pros
Cons
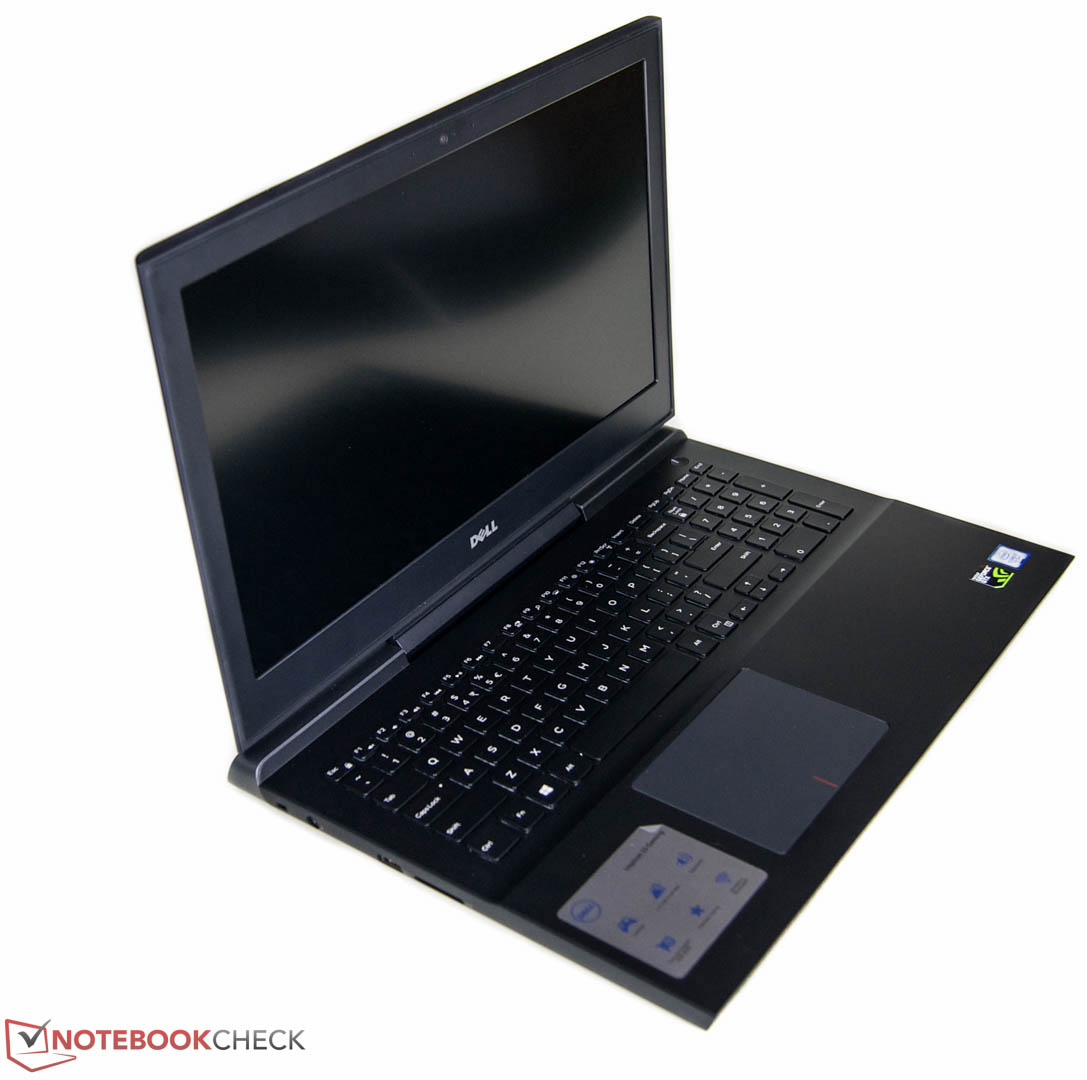
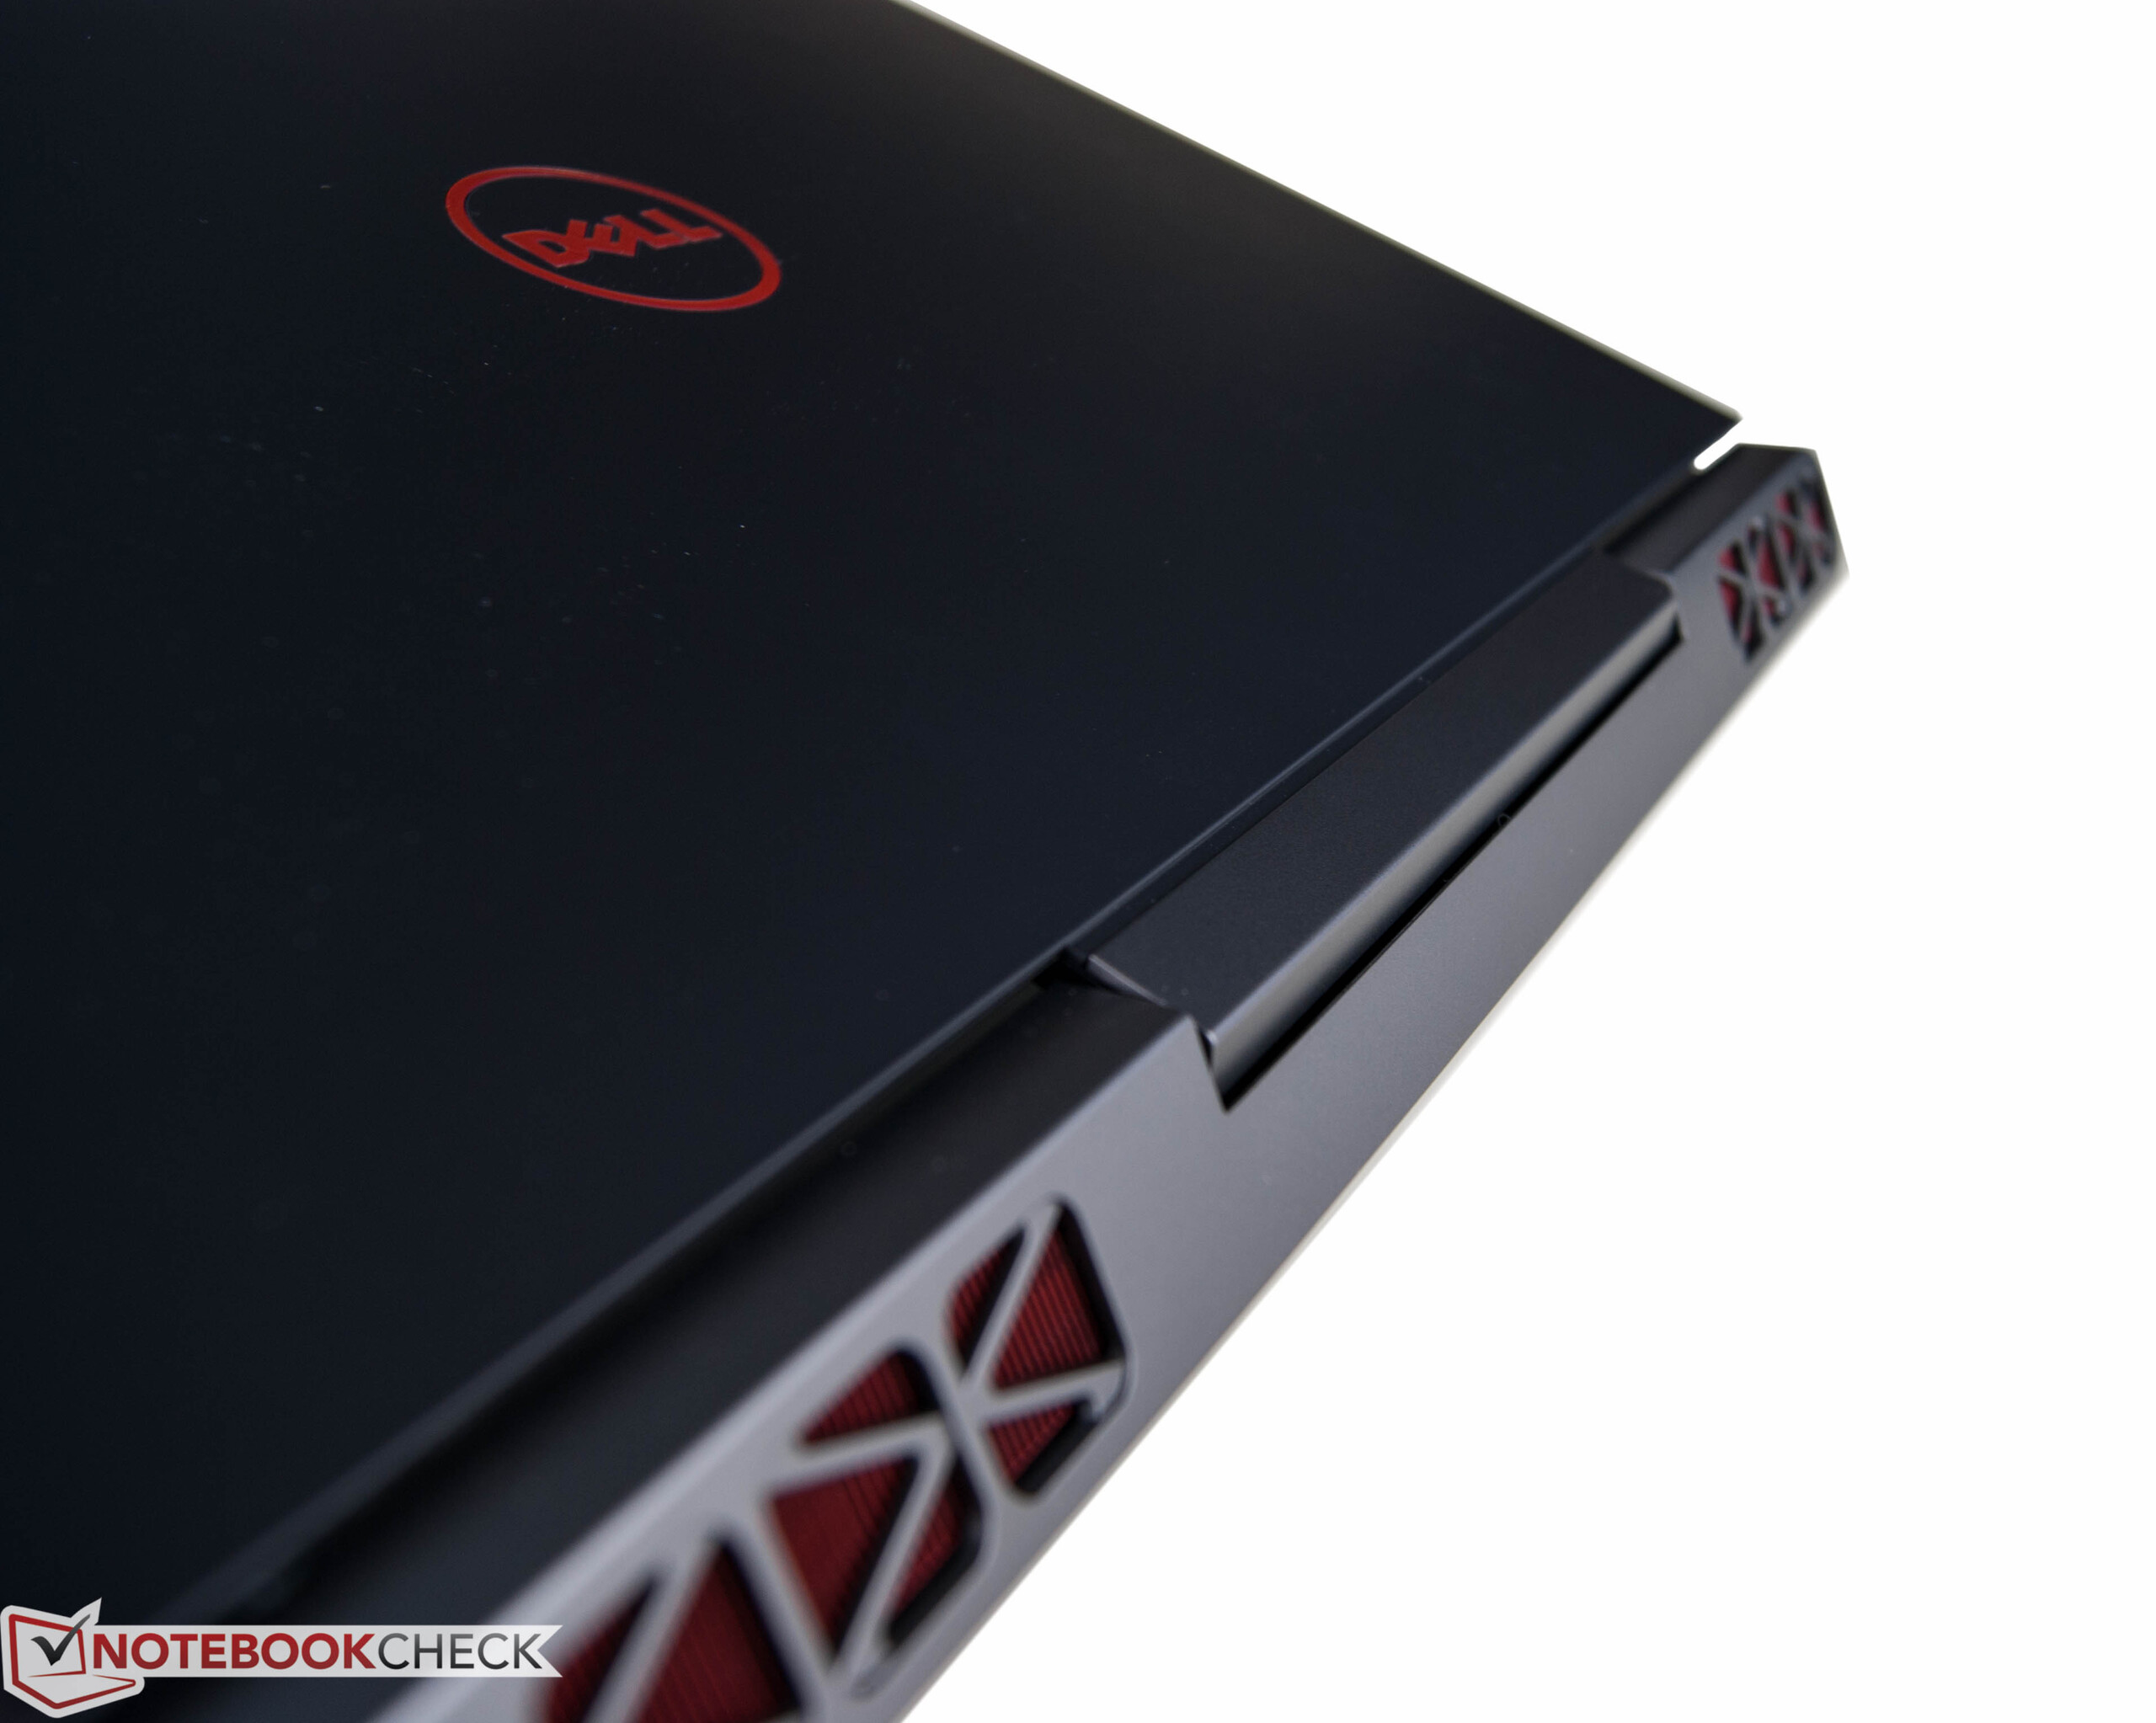
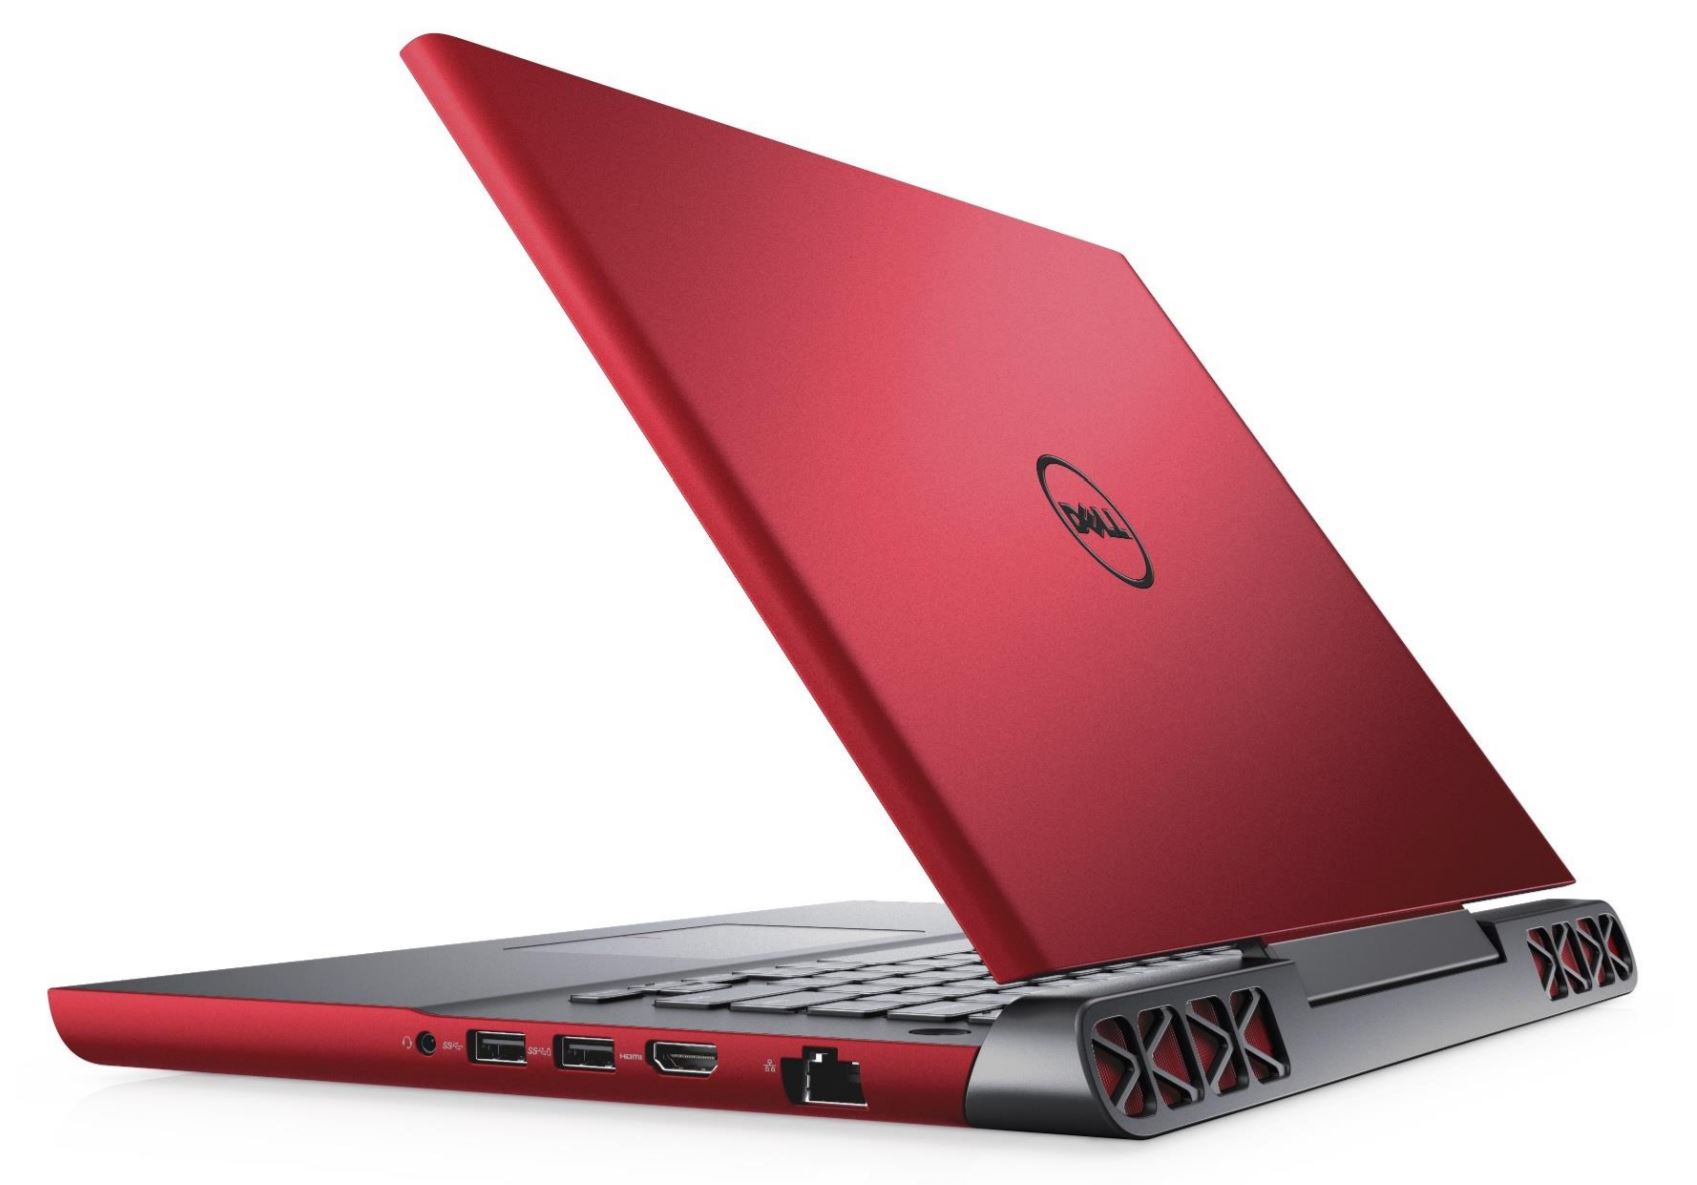
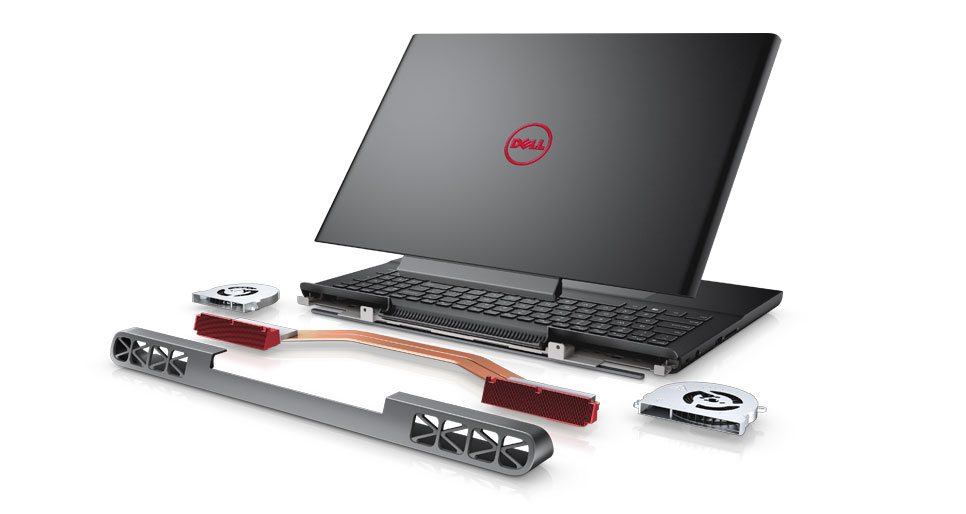
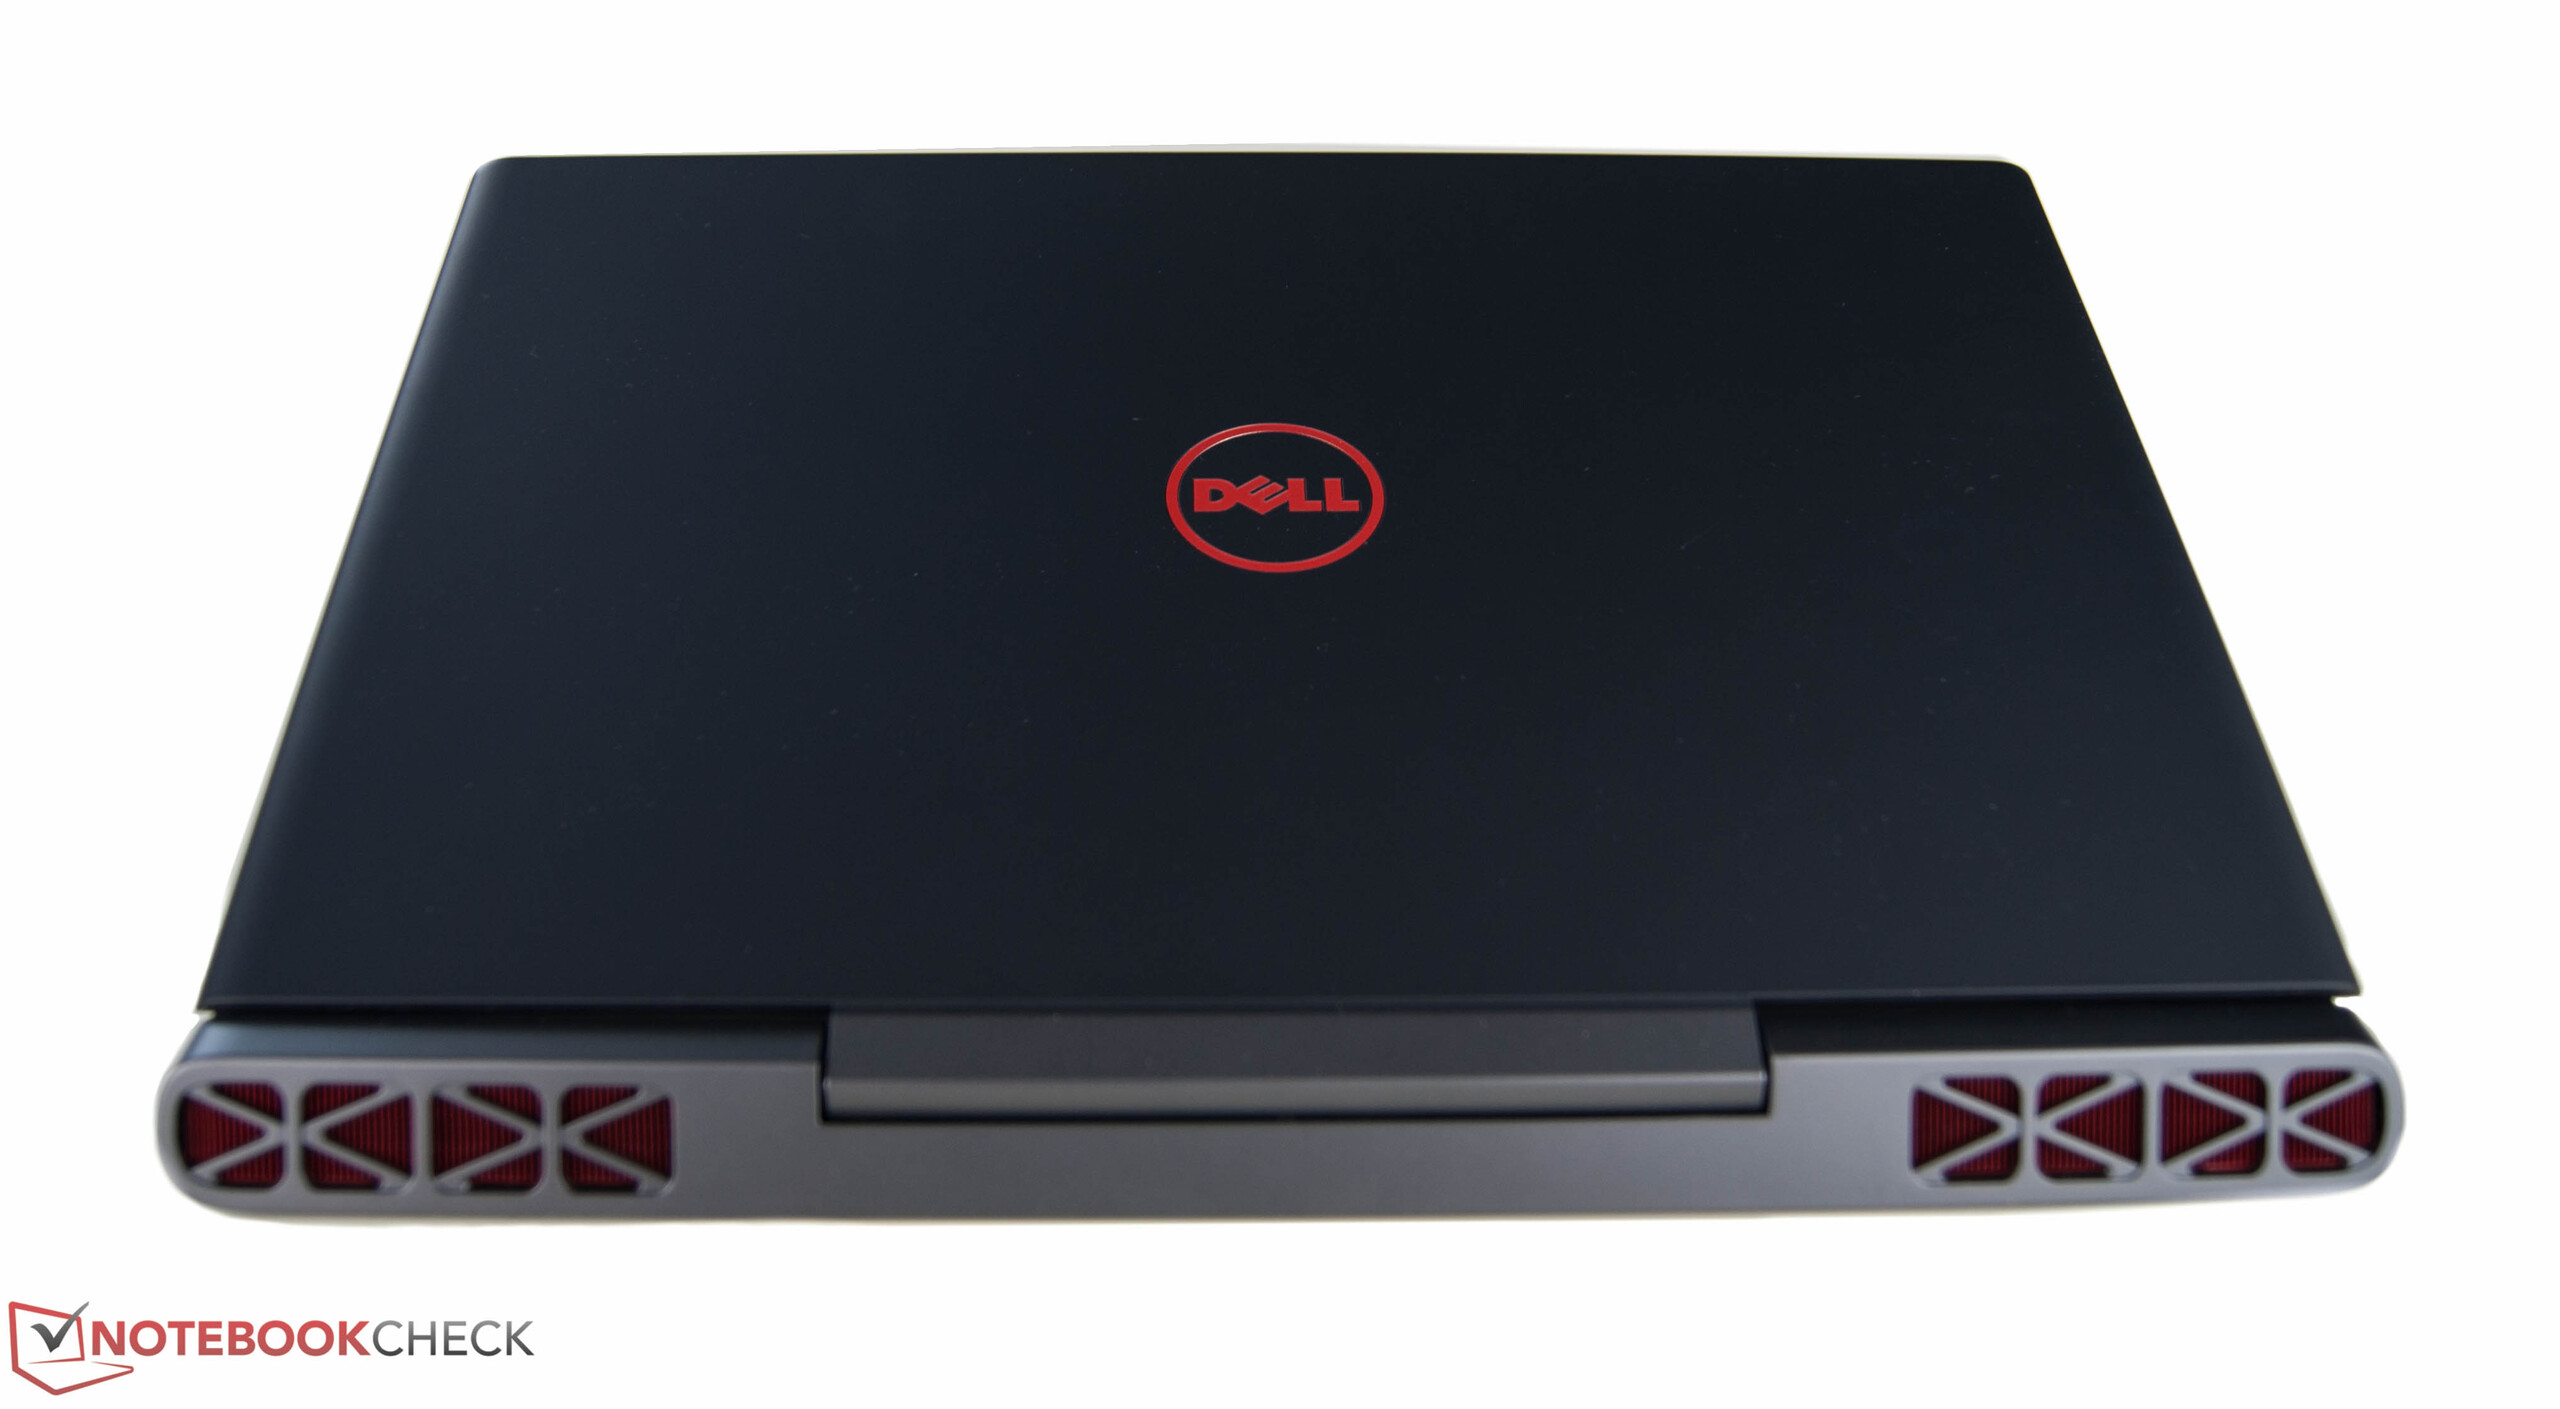
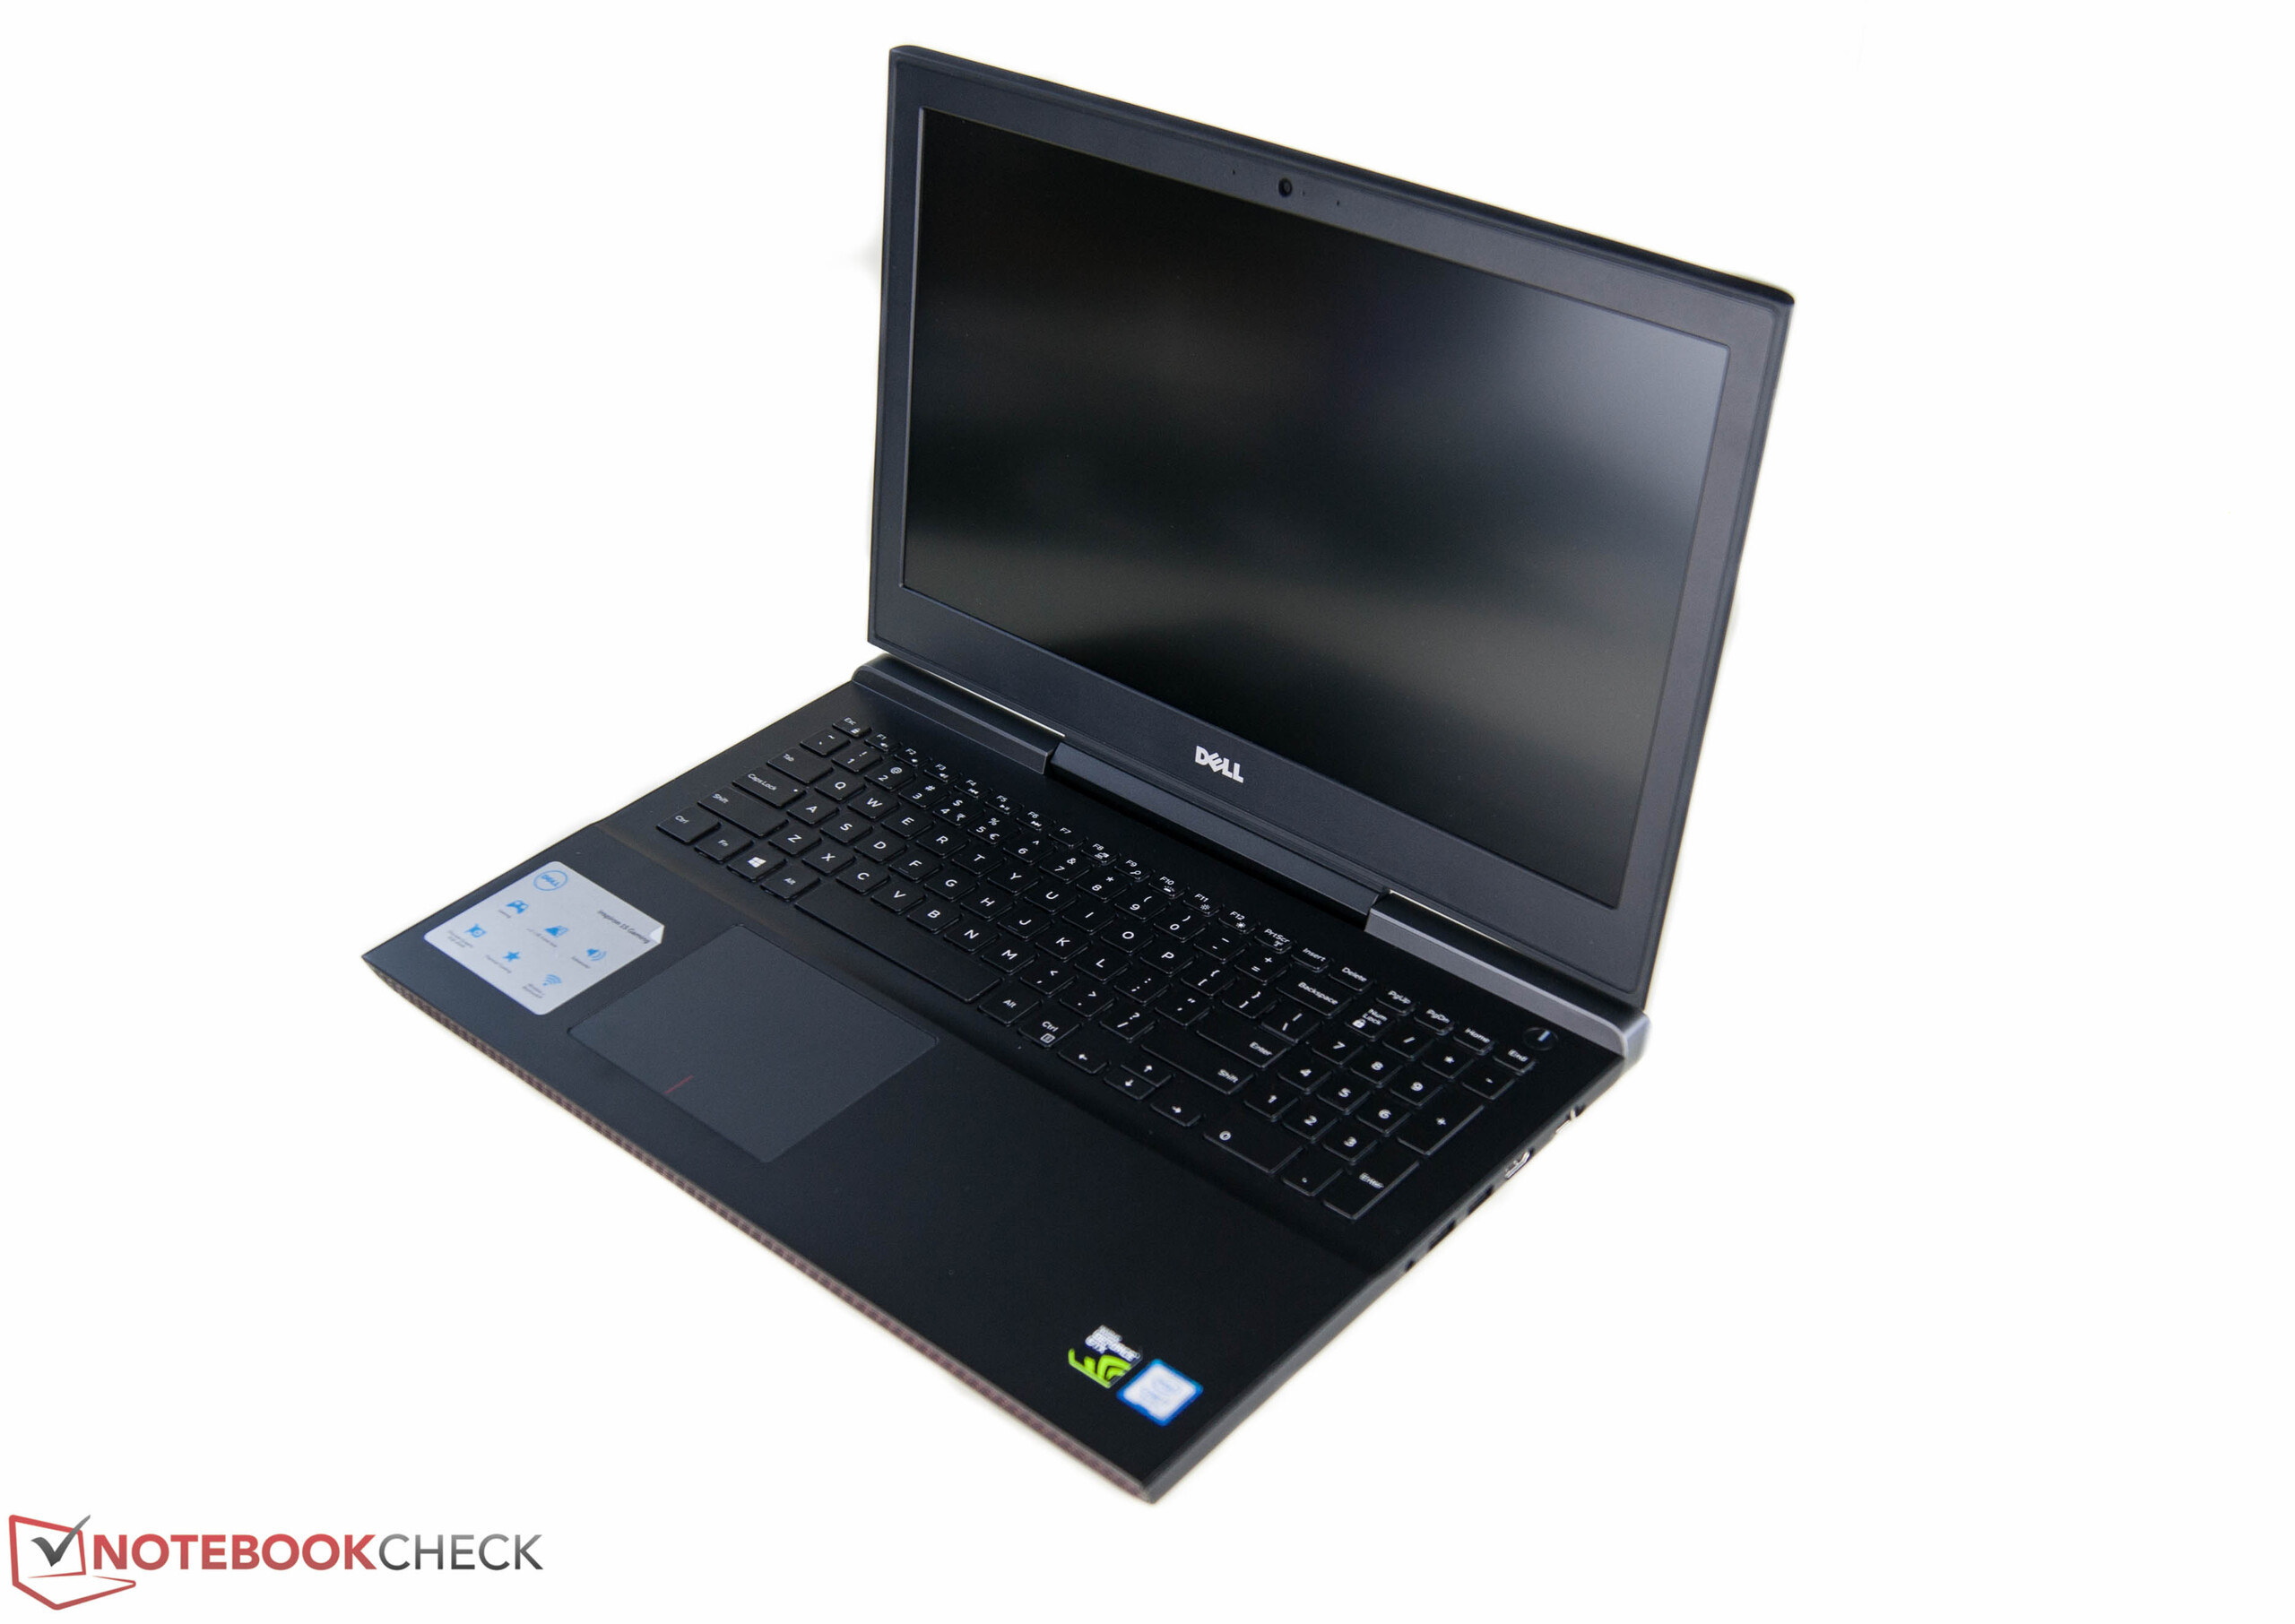
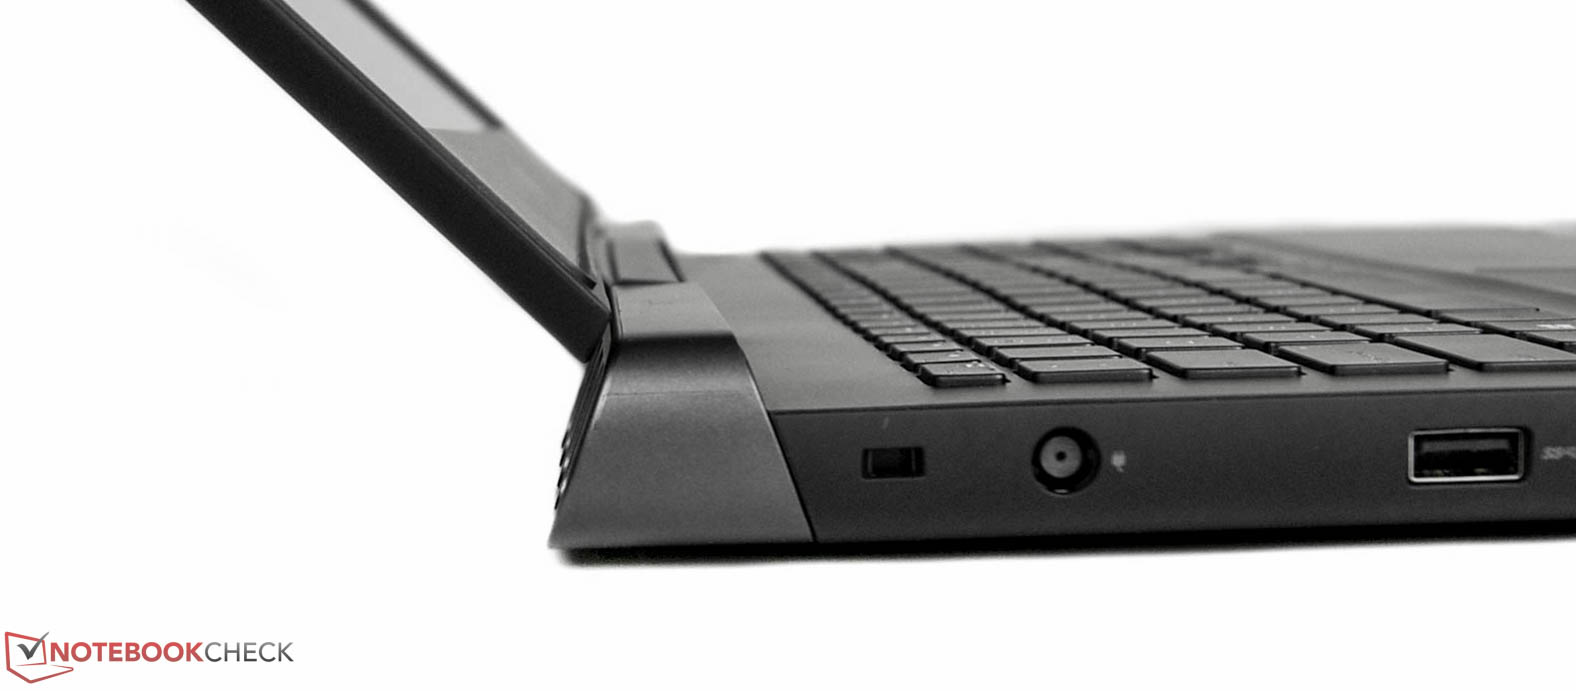
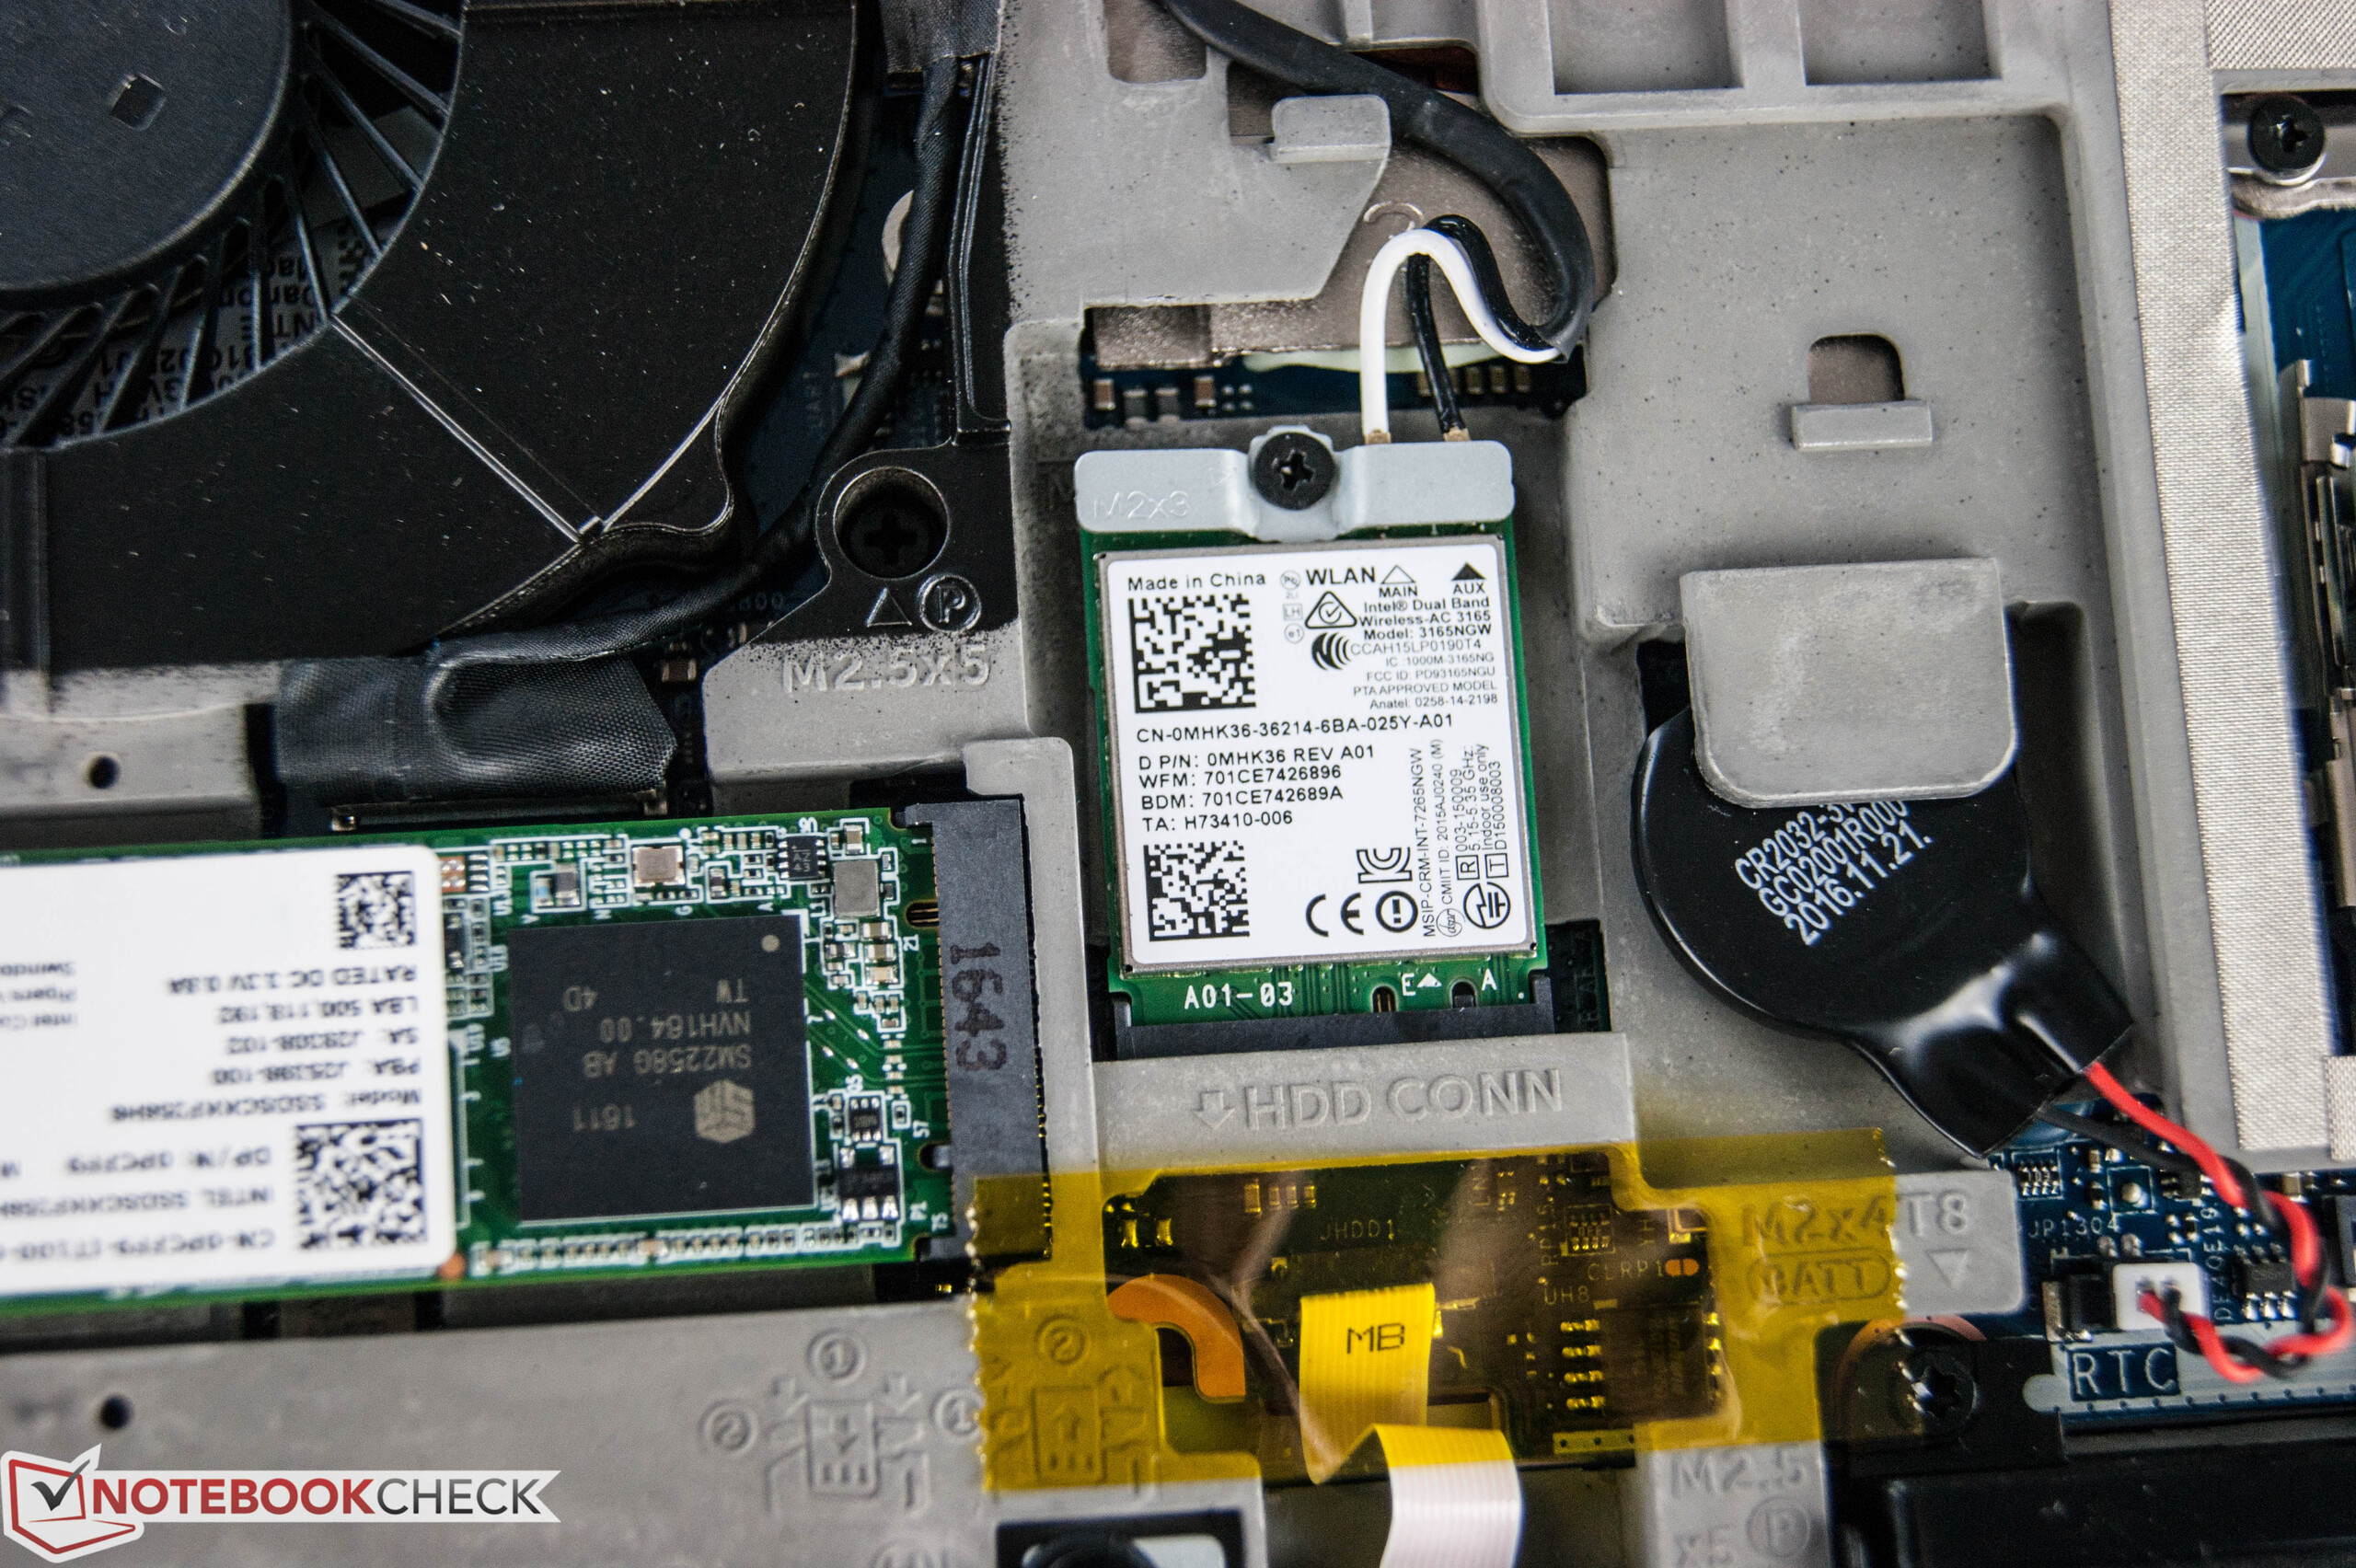
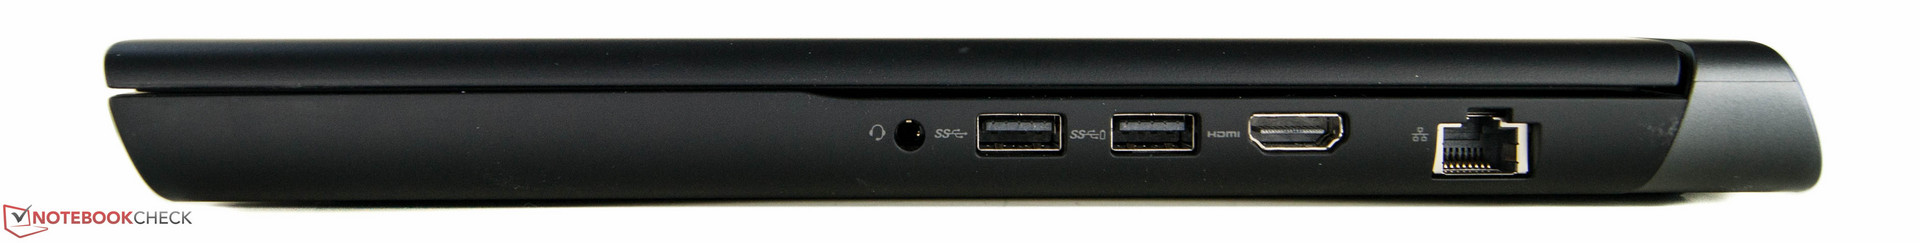
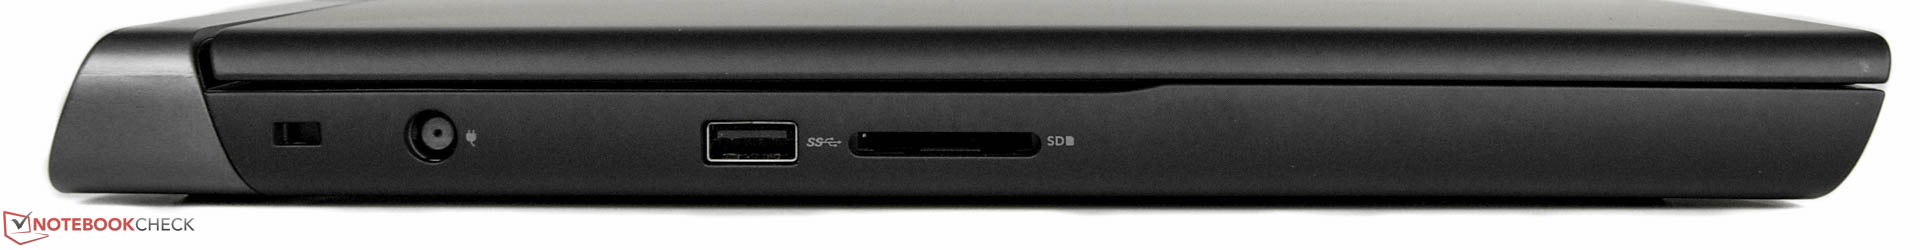
一台适合日常使用的游戏笔记本电脑。戴尔的最新Inspiron 15 7000系列证明了它在游戏本市场中生存的实力。首先,它搭配了优质的机身,给用户带来了升级维护空间。不过,作为一台15寸设备它的接口数量却较少。另外,它的SD读卡器的速度也相当迟缓。作为补偿,生产商提供了不错的输入设备。它的键盘甚至提供了背光功能和数字键盘区,还防溅水。不过,我们不太喜欢它较小的方向键,它在赛车游戏中特别不方便。Inspiron 15最大的弱点我们认为是它的全高清TN屏幕,不仅在可视角度范围上较窄,它的色彩也偏蓝。戴尔至少应该为用户提供IPS屏幕选项。
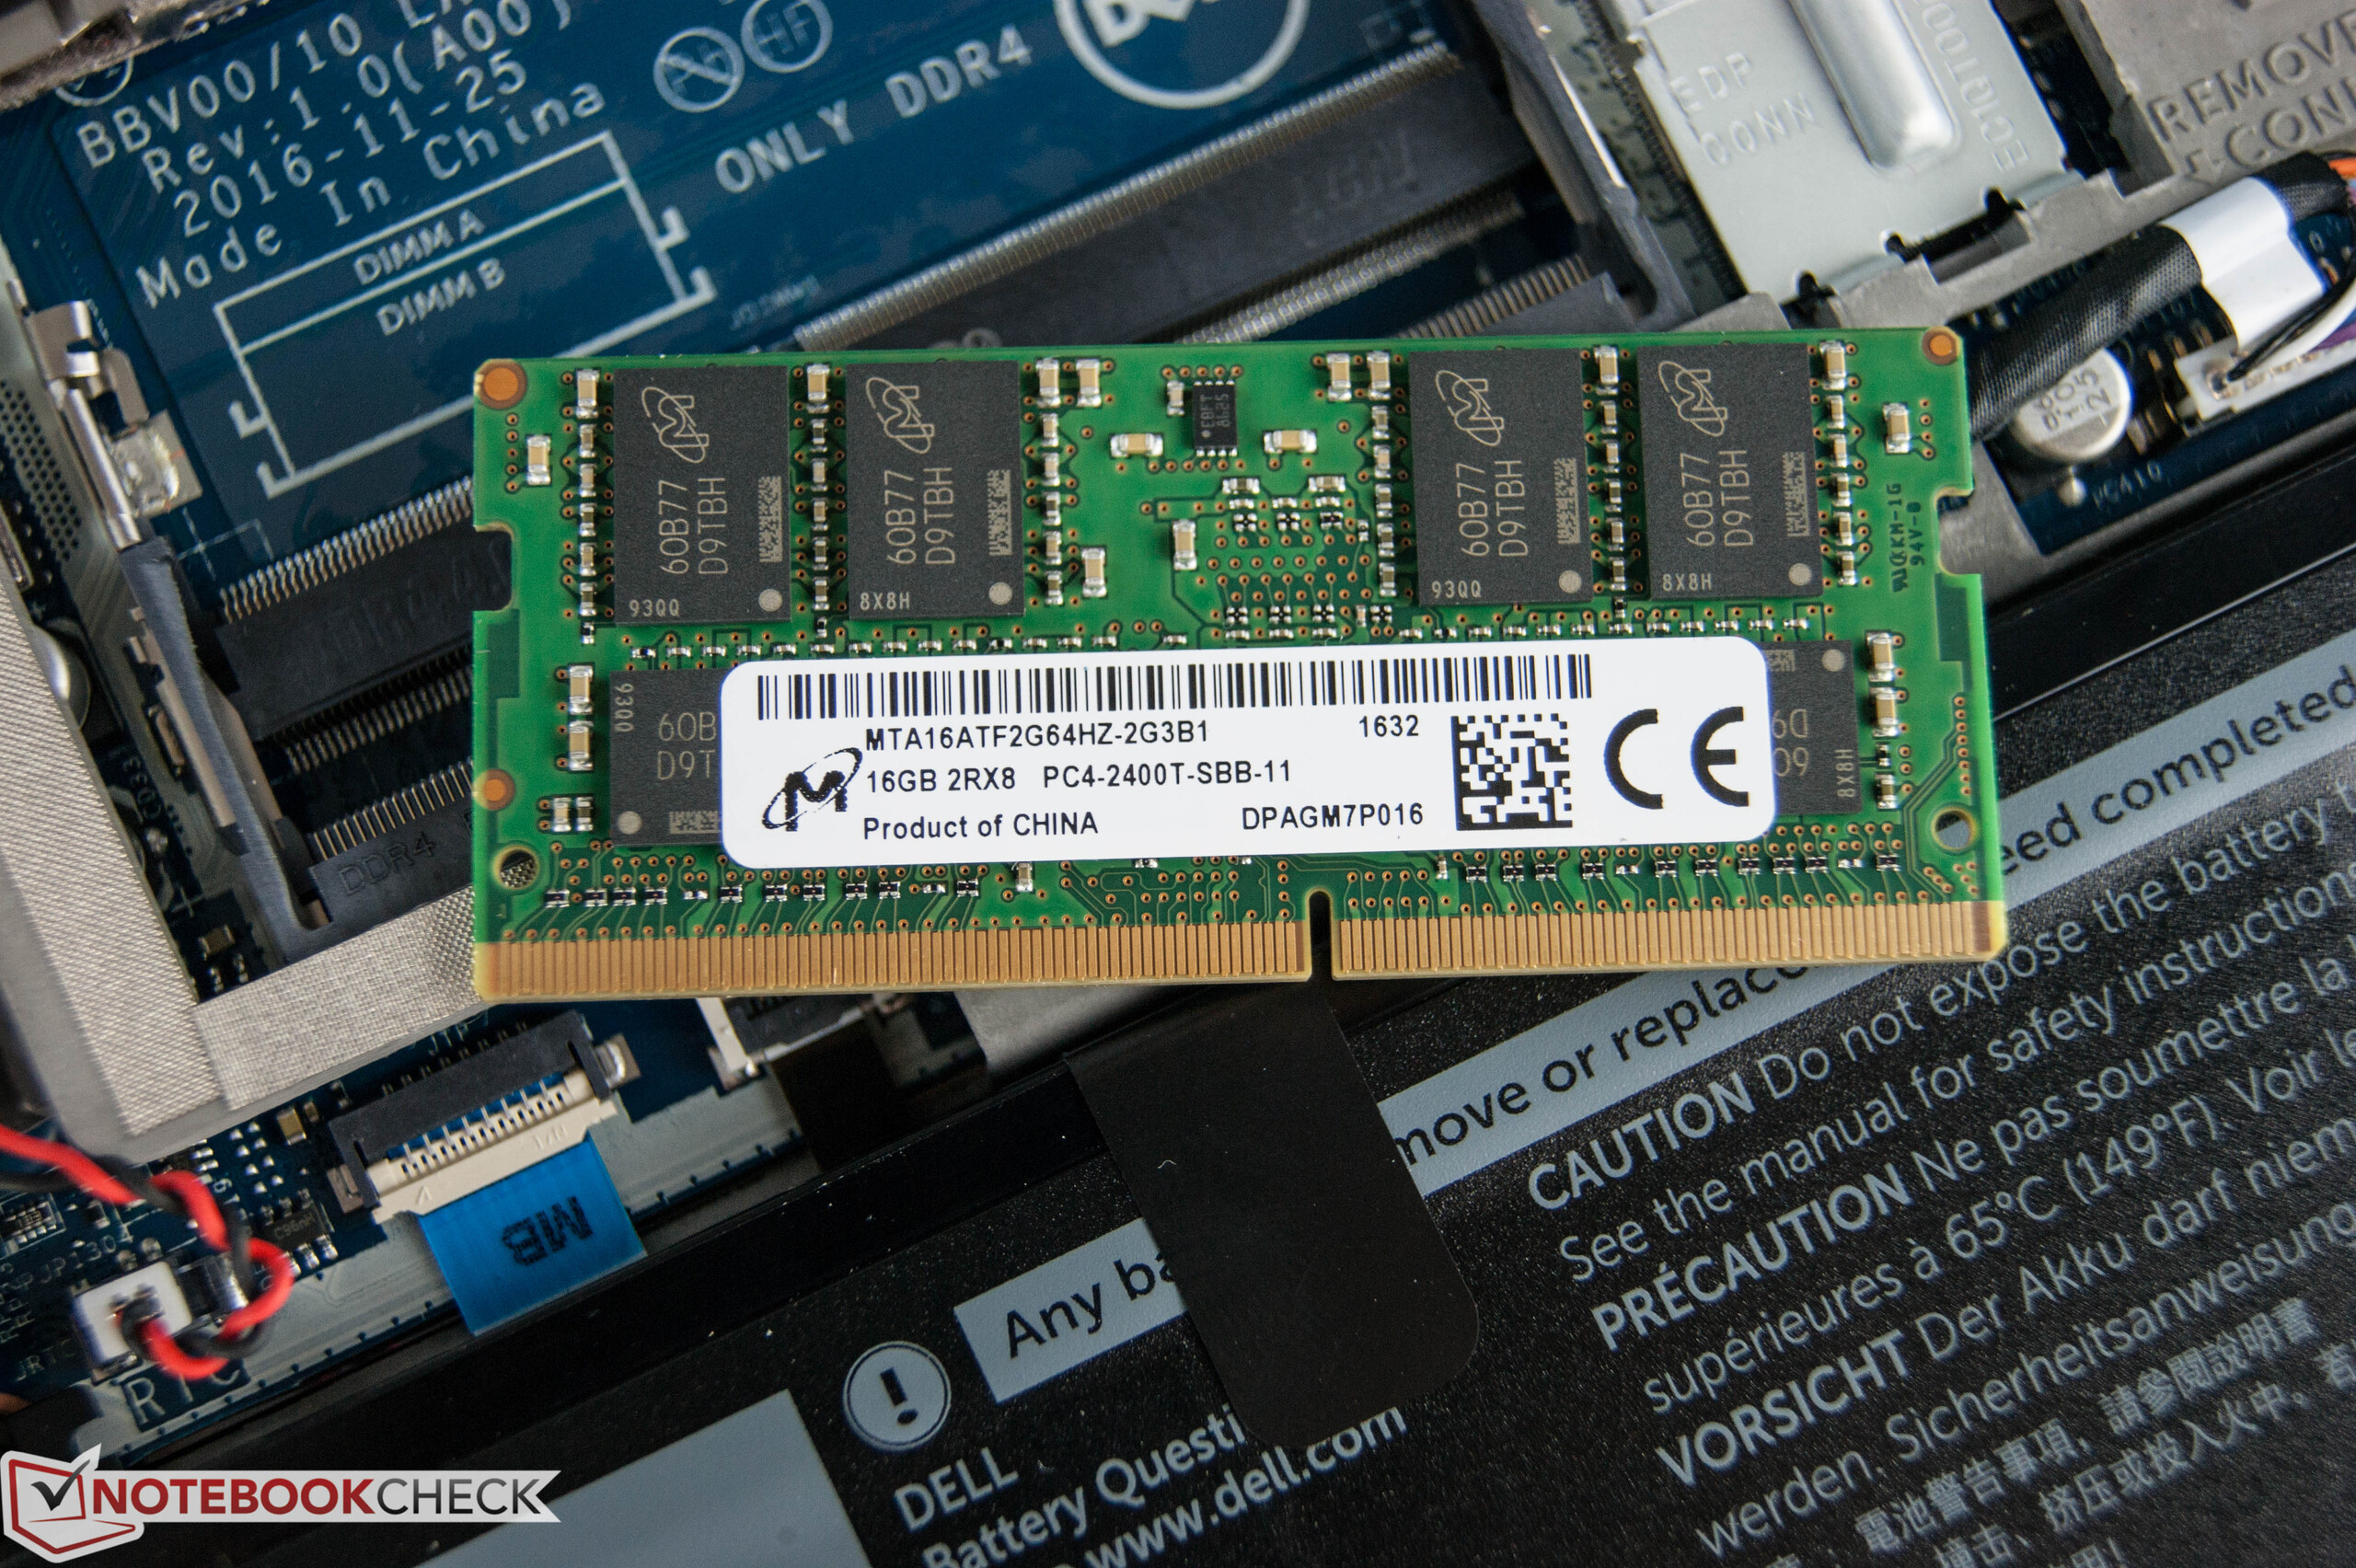
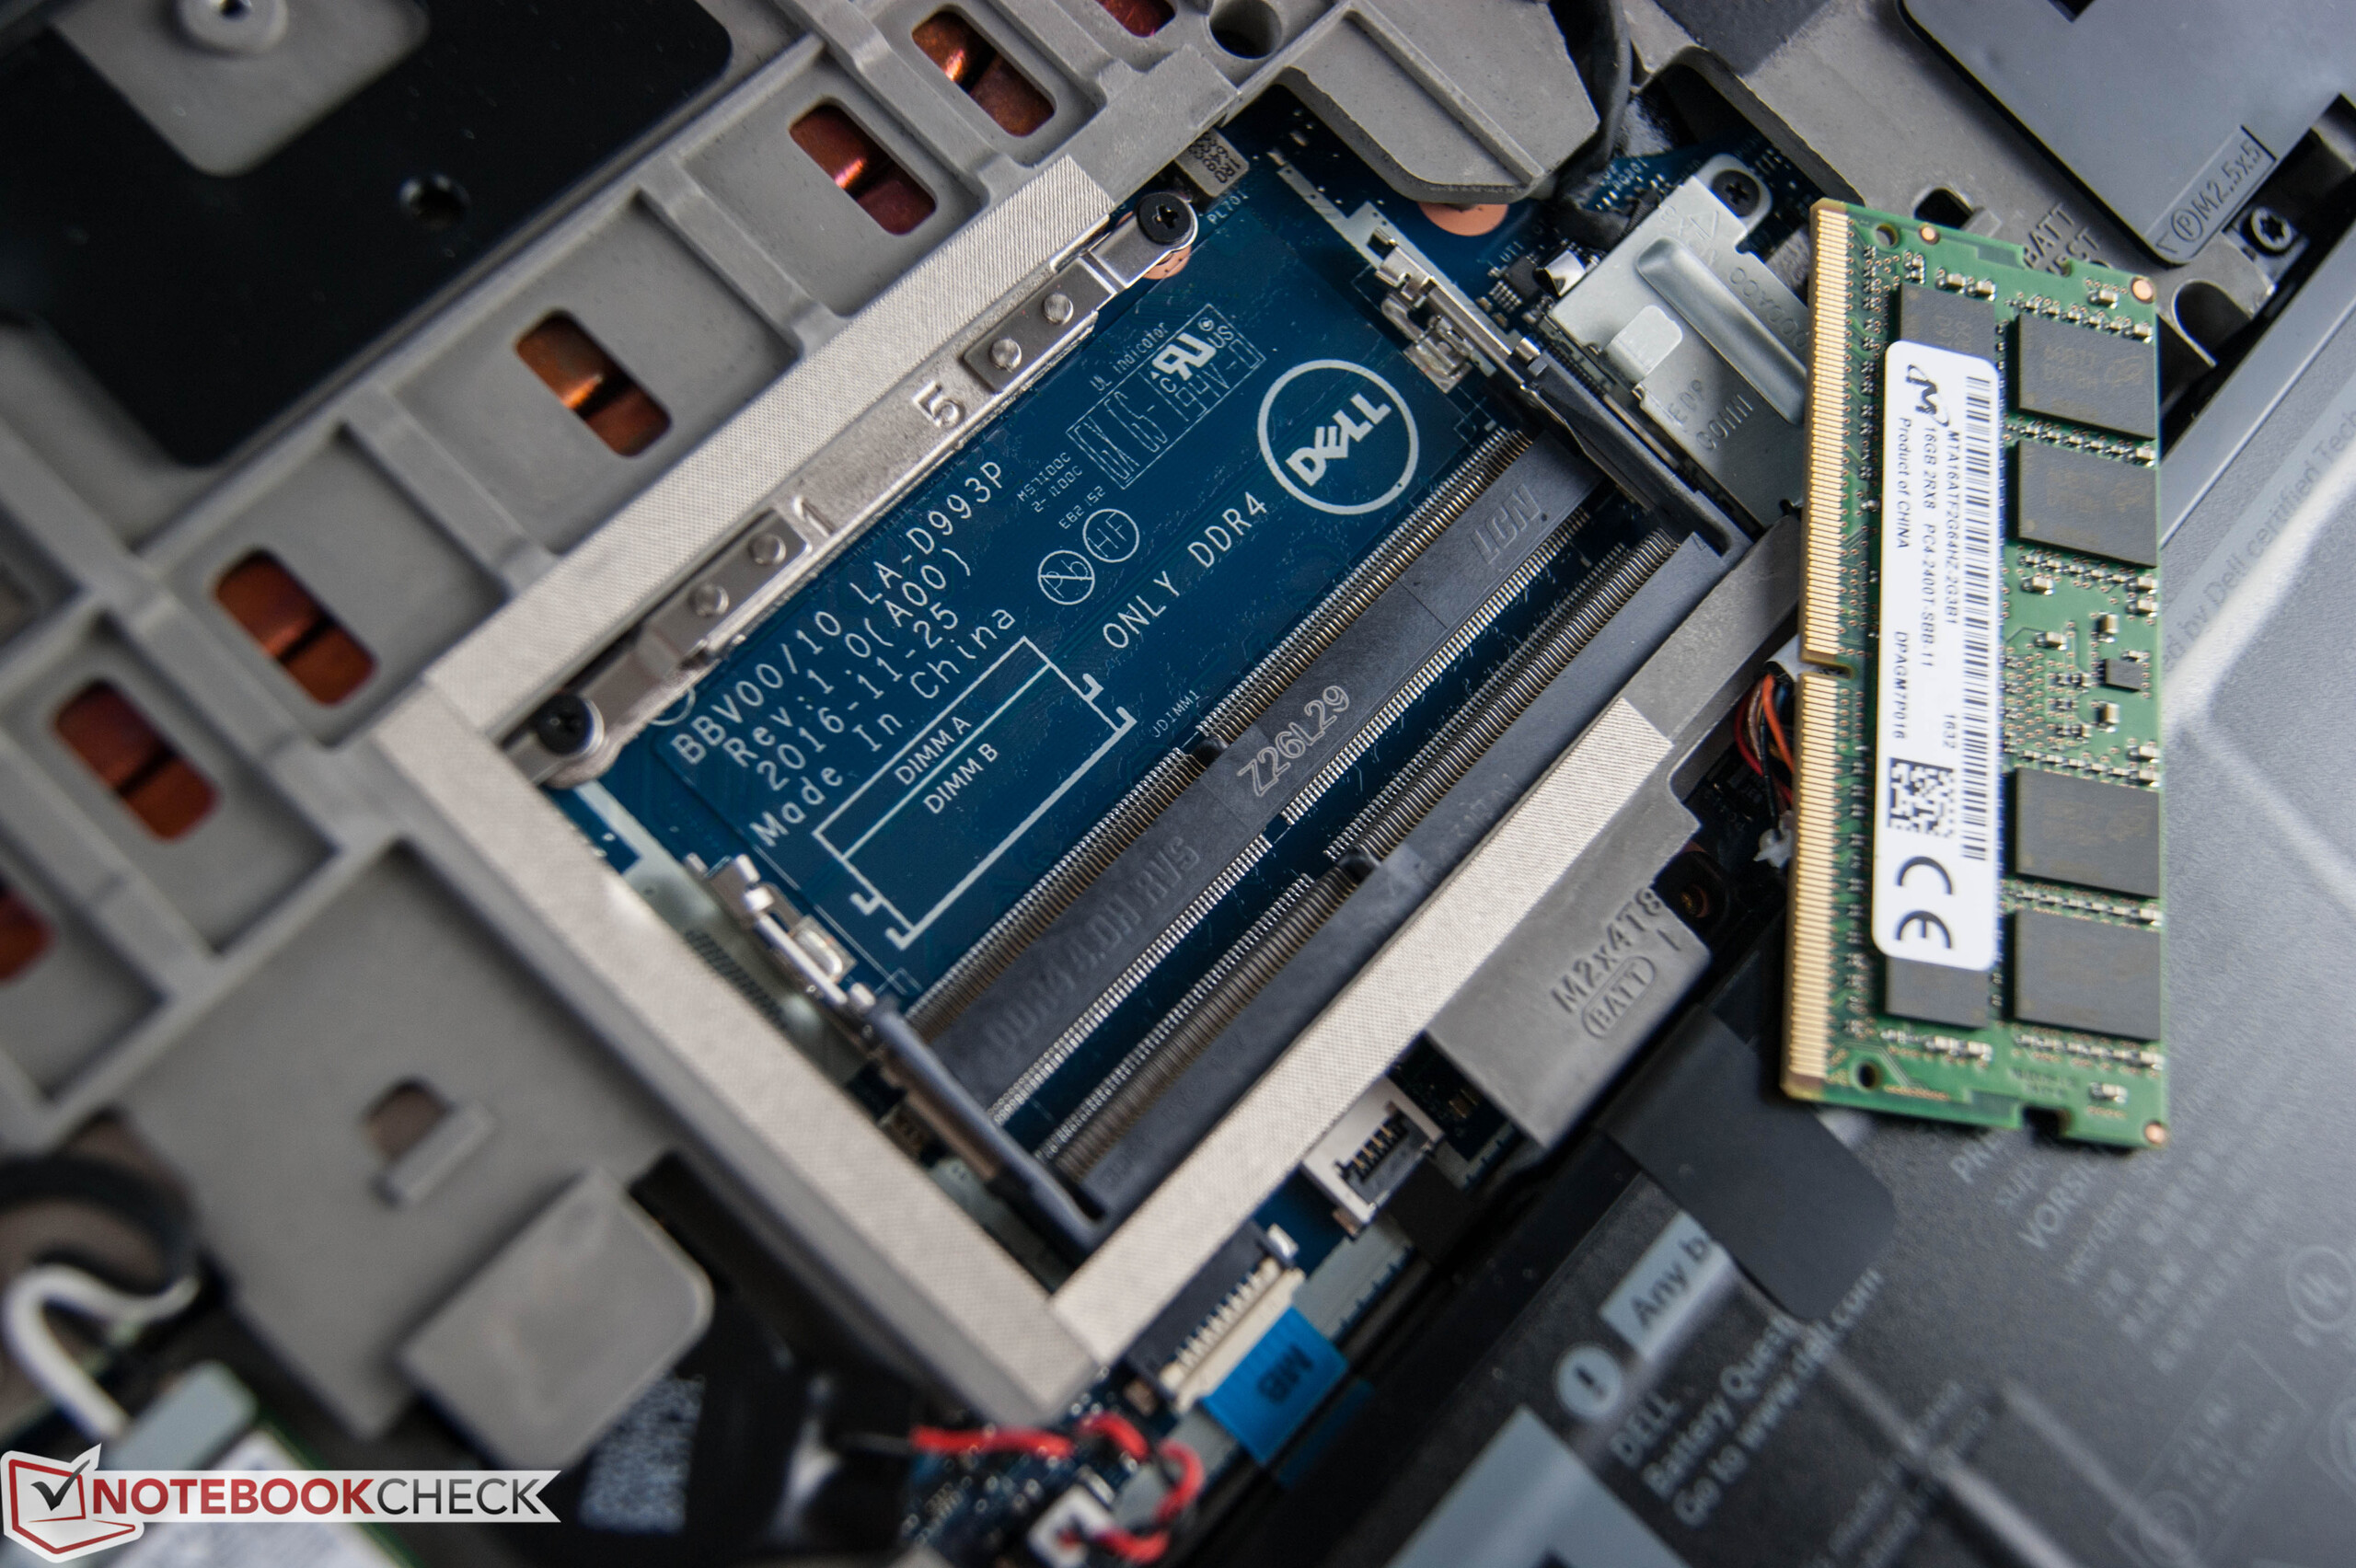
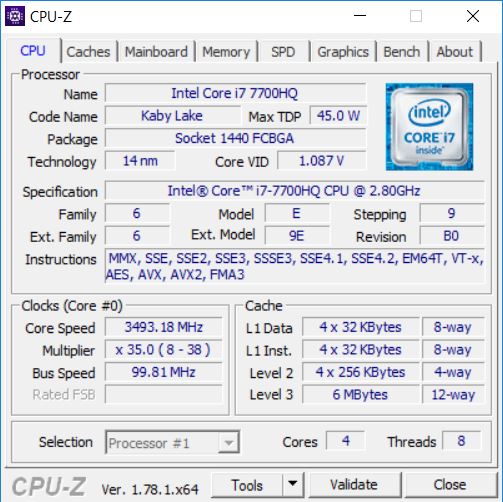
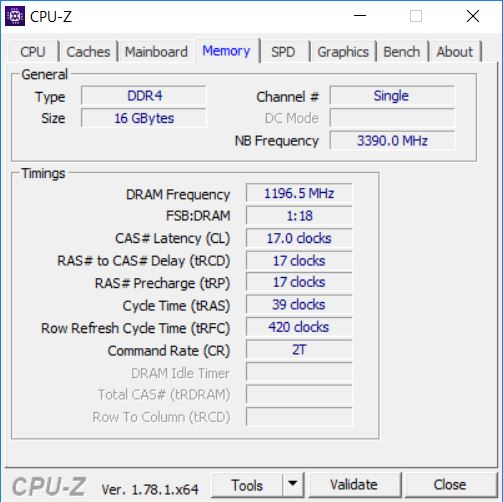
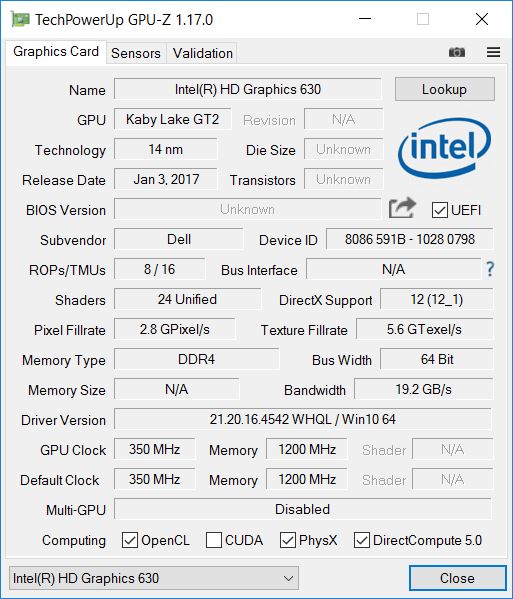
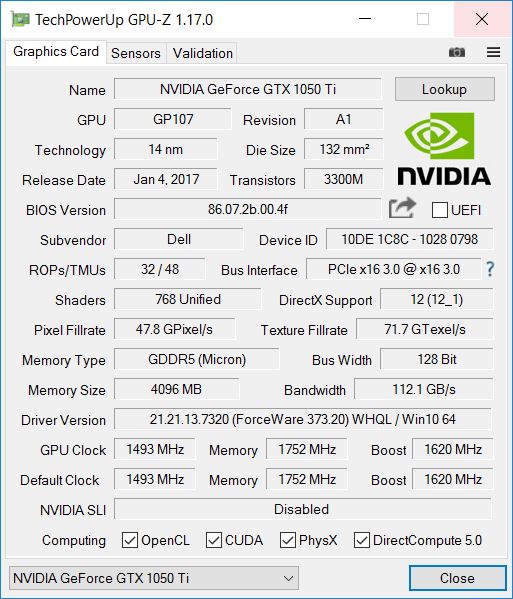
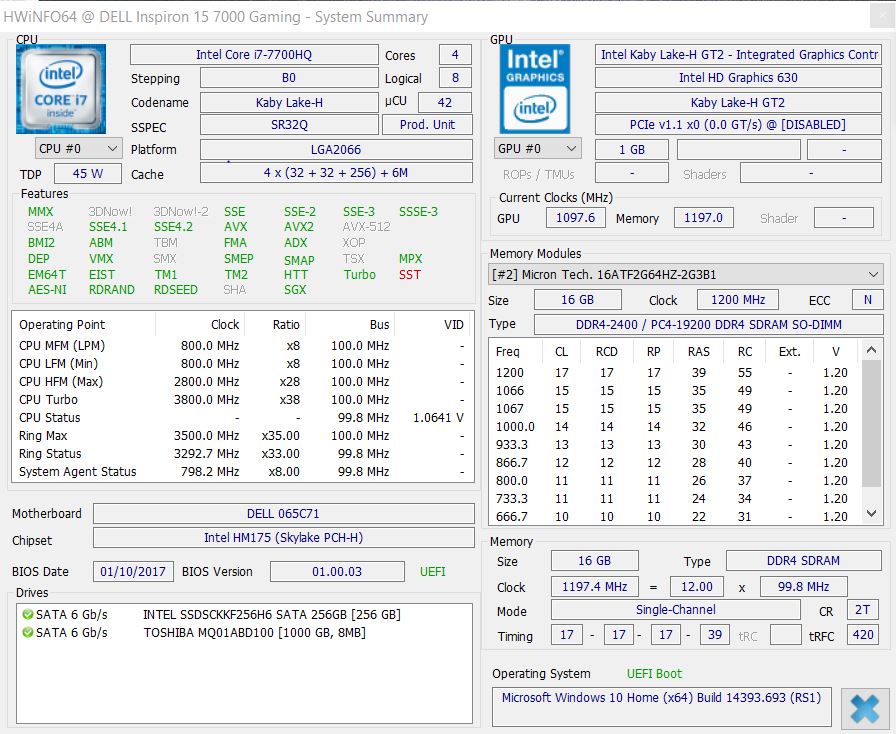
在进一步的测试中,这台戴尔的最新游戏本开始展现出了强项:英特尔酷睿i7处理器和英伟达GeForce GTX 1050 Ti显卡,高速固态硬盘和16GB DDR4内存。不过,Inspiron 15在应用程序性能上也毫不逊色。在正常使用中,它几乎不会发出什么噪音,发热量也不算过分。不过,这台游戏笔记本电脑可能很少会被用户作为移动设备使用,因为在重量和厚度上它都不算便携,不过电池续航倒是有不错的表现。这台测试机相比一些便携亚笔记本电脑都具有更强的续航能力。
戴尔的这台售价1000欧元(约7259人民币)的游戏笔记本表现十分优秀,它甚至可以与一些售价更高的机型相抗衡。
对它的屏幕不满意的用户可以考虑搭配UHD屏幕的机型。不过我们还需要等待看看德国市场的Inspiron 15机型是否会搭配IPS屏幕。不论如何,它的竞争机型也不容忽视。需要更强劲游戏性能和一块IPS屏幕的用户可以考虑华硕 ROG Strix GL502VM。
注:本文是基于完整评测的缩减版本,阅读完整的英文评测,请点击这里。
Dell Inspiron 15 7000 7567
- 02/07/2017 v6 (old)
Nino Ricchizzi