戴尔 XPS 13 9360 全高清 i5 笔记本电脑简短评测
| SD Card Reader | |
| average JPG Copy Test (av. of 3 runs) | |
| Dell XPS 13 9360 QHD+ i7 | |
| Dell XPS 13 9360 FHD i5 | |
| Lenovo IdeaPad 710S-13ISK | |
| Asus Zenbook UX330UA-FC059T | |
| maximum AS SSD Seq Read Test (1GB) | |
| Dell XPS 13 9360 FHD i5 | |
| Dell XPS 13 9360 QHD+ i7 | |
| Lenovo IdeaPad 710S-13ISK | |
| Asus Zenbook UX330UA-FC059T | |
| |||||||||||||||||||||||||
Brightness Distribution: 89 %
Center on Battery: 328 cd/m²
Contrast: 1801:1 (Black: 0.195 cd/m²)
ΔE ColorChecker Calman: 7.4 | ∀{0.5-29.43 Ø4.72}
ΔE Greyscale Calman: 6.71 | ∀{0.09-98 Ø4.97}
73.31% sRGB (Argyll 1.6.3 3D)
50.48% AdobeRGB 1998 (Argyll 1.6.3 3D)
50.5% AdobeRGB 1998 (Argyll 3D)
73.3% sRGB (Argyll 3D)
48.94% Display P3 (Argyll 3D)
Gamma: 2.74
CCT: 7222 K
| Dell XPS 13 9360 FHD i5 Sharp SHP1449 LQ133M1, IPS, 13.3", 1920x1080 | Dell XPS 13 2016 9350 (FHD, i7-6560U) Sharp SHP1449 LQ133M1, IPS, 13.3", 1920x1080 | Asus Zenbook UX330UA-FC059T AU Optronics AUO272D / B133HAN02.7, IPS, 13.3", 1920x1080 | Dell XPS 13 9360 QHD+ i7 Sharp SHP144A, IPS, 13.3", 3200x1800 | Lenovo IdeaPad 710S-13ISK Sharp SHP 1447 / LQ133M1JW15, IPS, 13.3", 1920x1080 | HP Spectre 13 IPS UWVA, 13.3", 1920x1080 | Acer Aspire S 13 S5-371-71QZ AUO B133HAN04.1, IPS, 13.3", 1920x1080 | Razer Blade Stealth QHD i7-7500U Sharp SHP142F (LQ125T1JW02), , 12.5", 2560x1440 | |
|---|---|---|---|---|---|---|---|---|
| Display | 12% | 28% | 26% | 35% | 32% | 36% | ||
| Display P3 Coverage (%) | 48.94 | 54.8 12% | 64.2 31% | 62.8 28% | 66.4 36% | 65.6 34% | 68.7 40% | |
| sRGB Coverage (%) | 73.3 | 82.3 12% | 90.6 24% | 89.4 22% | 97.5 33% | 94.7 29% | 95.8 31% | |
| AdobeRGB 1998 Coverage (%) | 50.5 | 56.6 12% | 65.3 29% | 64.6 28% | 68.4 35% | 67.5 34% | 69.9 38% | |
| Response Times | -3% | 14% | -11% | -16% | -28% | -21% | -7% | |
| Response Time Grey 50% / Grey 80% * (ms) | 32.8 ? | 42.8 ? -30% | 32 ? 2% | 43.6 ? -33% | 52.4 ? -60% | 50.8 ? -55% | 50 ? -52% | 37 ? -13% |
| Response Time Black / White * (ms) | 33.2 ? | 24.8 ? 25% | 25 ? 25% | 29.2 ? 12% | 23.6 ? 29% | 33.2 ? -0% | 29.6 ? 11% | 33.4 ? -1% |
| PWM Frequency (Hz) | 200 ? | 220 ? | 200 ? | |||||
| Screen | 19% | 6% | 10% | -5% | 18% | -2% | 1% | |
| Brightness middle (cd/m²) | 351.2 | 385 10% | 360 3% | 396.2 13% | 344 -2% | 300.5 -14% | 375 7% | 402 14% |
| Brightness (cd/m²) | 325 | 350 8% | 337 4% | 357 10% | 326 0% | 305 -6% | 358 10% | 382 18% |
| Brightness Distribution (%) | 89 | 86 -3% | 86 -3% | 84 -6% | 87 -2% | 76 -15% | 87 -2% | 88 -1% |
| Black Level * (cd/m²) | 0.195 | 0.17 13% | 0.22 -13% | 0.266 -36% | 0.36 -85% | 0.184 6% | 0.39 -100% | 0.45 -131% |
| Contrast (:1) | 1801 | 2265 26% | 1636 -9% | 1489 -17% | 956 -47% | 1633 -9% | 962 -47% | 893 -50% |
| Colorchecker dE 2000 * | 7.4 | 4.17 44% | 5.21 30% | 3.9 47% | 6.09 18% | 2.64 64% | 4.6 38% | 3.6 51% |
| Colorchecker dE 2000 max. * | 9.08 | 7.61 16% | 8.85 3% | 7.58 17% | 10 -10% | 5.06 44% | 8.8 3% | 7.5 17% |
| Greyscale dE 2000 * | 6.71 | 5.39 20% | 6.23 7% | 4.16 38% | 5.36 20% | 2.8 58% | 4 40% | 4.3 36% |
| Gamma | 2.74 80% | 2.12 104% | 2.5 88% | 2.31 95% | 2.01 109% | 2.16 102% | 2.34 94% | 2.1 105% |
| CCT | 7222 90% | 7404 88% | 6506 100% | 6514 100% | 7230 90% | 6999 93% | 7304 89% | 6572 99% |
| Color Space (Percent of AdobeRGB 1998) (%) | 50.48 | 62.7 24% | 59 17% | 57.5 14% | 62.25 23% | 60.9 21% | 57.9 15% | 62.3 23% |
| Color Space (Percent of sRGB) (%) | 73.31 | 99.8 36% | 90 23% | 88.7 21% | 97.54 33% | 94.3 29% | 88.7 21% | 95.7 31% |
| Total Average (Program / Settings) | 9% /
15% | 16% /
12% | 8% /
11% | 5% /
1% | 7% /
15% | -12% /
-5% | 10% /
7% |
* ... smaller is better
Display Response Times
| ↔ Response Time Black to White | ||
|---|---|---|
| 33.2 ms ... rise ↗ and fall ↘ combined | ↗ 10.8 ms rise | 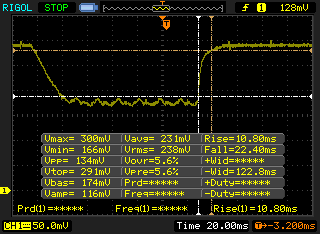 |
| ↘ 22.4 ms fall | ||
| The screen shows slow response rates in our tests and will be unsatisfactory for gamers. In comparison, all tested devices range from 0.1 (minimum) to 240 (maximum) ms. » 90 % of all devices are better. This means that the measured response time is worse than the average of all tested devices (19.8 ms). | ||
| ↔ Response Time 50% Grey to 80% Grey | ||
| 32.8 ms ... rise ↗ and fall ↘ combined | ↗ 16 ms rise | 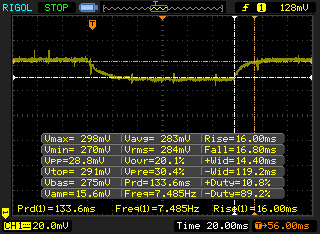 |
| ↘ 16.8 ms fall | ||
| The screen shows slow response rates in our tests and will be unsatisfactory for gamers. In comparison, all tested devices range from 0.165 (minimum) to 636 (maximum) ms. » 44 % of all devices are better. This means that the measured response time is similar to the average of all tested devices (31 ms). | ||
Screen Flickering / PWM (Pulse-Width Modulation)
| Screen flickering / PWM not detected | 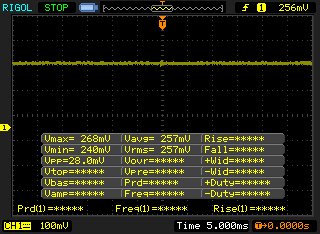 | ||
In comparison: 52 % of all tested devices do not use PWM to dim the display. If PWM was detected, an average of 7778 (minimum: 5 - maximum: 343500) Hz was measured. | |||
| Cinebench R10 | |
| Rendering Multiple CPUs 32Bit | |
| Dell XPS 13 9360 QHD+ i7 | |
| Dell XPS 13 9360 FHD i5 | |
| HP Spectre 13 | |
| Rendering Single 32Bit | |
| Dell XPS 13 9360 QHD+ i7 | |
| Dell XPS 13 9360 FHD i5 | |
| HP Spectre 13 | |
| wPrime 2.10 - 1024m | |
| Dell XPS 13 9360 QHD+ i5 | |
| HP Spectre 13 | |
| Dell XPS 13 9360 QHD+ i7 | |
| Super Pi Mod 1.5 XS 32M - 32M | |
| HP Spectre 13 | |
| Dell XPS 13 9360 FHD i5 | |
| Dell XPS 13 9360 QHD+ i7 | |
* ... smaller is better
| PCMark 8 Home Score Accelerated v2 | 3535 points | |
| PCMark 8 Creative Score Accelerated v2 | 4211 points | |
| PCMark 8 Work Score Accelerated v2 | 4568 points | |
Help | ||
| Dell XPS 13 9360 FHD i5 Toshiba NVMe THNSN5256GPUK | HP Spectre 13 Samsung PM951 NVMe MZVLV256 | Acer Aspire S 13 S5-371-71QZ LiteOn CV1-8B512 | Asus Zenbook UX330UA-FC059T SanDisk SD8SNAT256G1002 | Lenovo IdeaPad 710S-13ISK Samsung PM951 NVMe MZVLV256 | Razer Blade Stealth QHD i7-7500U Samsung PM951 NVMe MZVLV256 | Dell XPS 13 9360 QHD+ i7 Toshiba NVMe THNSN5256GPUK | |
|---|---|---|---|---|---|---|---|
| CrystalDiskMark 3.0 | -9% | -31% | -46% | -1% | -0% | 1% | |
| Read Seq (MB/s) | 1233 | 1322 7% | 502 -59% | 447.6 -64% | 1193 -3% | 1178 -4% | 1214 -2% |
| Write Seq (MB/s) | 733 | 305.5 -58% | 418.9 -43% | 309.4 -58% | 309.6 -58% | 305.4 -58% | 655 -11% |
| Read 512 (MB/s) | 1036 | 621 -40% | 341.3 -67% | 265.9 -74% | 613 -41% | 638 -38% | 1019 -2% |
| Write 512 (MB/s) | 439.9 | 306 -30% | 389.7 -11% | 275.2 -37% | 311 -29% | 305.7 -31% | 445.7 1% |
| Read 4k (MB/s) | 29.31 | 40.09 37% | 29.69 1% | 18.89 -36% | 42.43 45% | 38.54 31% | 35.55 21% |
| Write 4k (MB/s) | 116.9 | 119 2% | 86.8 -26% | 75.1 -36% | 144.9 24% | 153.4 31% | 130 11% |
| Read 4k QD32 (MB/s) | 479.2 | 513 7% | 301.3 -37% | 142.2 -70% | 549 15% | 614 28% | 537 12% |
| Write 4k QD32 (MB/s) | 218.3 | 231.5 6% | 211.2 -3% | 228.9 5% | 311.3 43% | 302.7 39% | 173.8 -20% |

| 3DMark | |
| 1280x720 Cloud Gate Standard Graphics | |
| Lenovo IdeaPad 710S-13ISK | |
| Dell XPS 13 2016 9350 (FHD, i7-6560U) | |
| Dell XPS 13 9360 FHD i5 | |
| Dell XPS 13 9360 QHD+ i7 | |
| Asus Zenbook UX330UA-FC059T | |
| HP Spectre 13 | |
| Dell XPS 13 9360 QHD+ i5 | |
| 1920x1080 Fire Strike Graphics | |
| Dell XPS 13 2016 9350 (FHD, i7-6560U) | |
| Dell XPS 13 9360 FHD i5 | |
| Dell XPS 13 9360 QHD+ i7 | |
| Dell XPS 13 9360 QHD+ i5 | |
| HP Spectre 13 | |
| 3DMark 11 Performance | 1699 points | |
| 3DMark Ice Storm Standard Score | 64297 points | |
| 3DMark Cloud Gate Standard Score | 6349 points | |
| 3DMark Fire Strike Score | 892 points | |
| 3DMark Fire Strike Extreme Score | 405 points | |
Help | ||
| Tomb Raider | |
| 1024x768 Low Preset (sort by value) | |
| Dell XPS 13 9360 FHD i5 | |
| 1366x768 Normal Preset AA:FX AF:4x (sort by value) | |
| Dell XPS 13 9360 FHD i5 | |
| 1366x768 High Preset AA:FX AF:8x (sort by value) | |
| Dell XPS 13 9360 FHD i5 | |
| 1920x1080 Ultra Preset AA:FX AF:16x (sort by value) | |
| Dell XPS 13 9360 FHD i5 | |
| low | med. | high | ultra | |
|---|---|---|---|---|
| Tomb Raider (2013) | 83.8 | 42.6 | 25.9 | 12 |
| GRID 2 (2013) | 79.7 | 46.4 | 33.7 | 12.5 |
Noise level
| Idle |
| 28.9 / 28.9 / 28.9 dB(A) |
| Load |
| 30.9 / 33.5 dB(A) |
 | ||
30 dB silent 40 dB(A) audible 50 dB(A) loud |
||
min: | ||
| Dell XPS 13 9360 FHD i5 HD Graphics 620, i5-7200U, Toshiba NVMe THNSN5256GPUK | HP Spectre 13 HD Graphics 520, 6500U, Samsung PM951 NVMe MZVLV256 | Acer Aspire S 13 S5-371-71QZ HD Graphics 520, 6500U, LiteOn CV1-8B512 | Asus Zenbook UX330UA-FC059T HD Graphics 520, 6500U, SanDisk SD8SNAT256G1002 | Lenovo IdeaPad 710S-13ISK Iris Graphics 540, 6560U, Samsung PM951 NVMe MZVLV256 | Razer Blade Stealth QHD i7-7500U HD Graphics 620, i7-7500U, Samsung PM951 NVMe MZVLV256 | Dell XPS 13 2016 9350 (FHD, i7-6560U) Iris Graphics 540, 6560U, Samsung PM951 NVMe MZ-VLV256D | Dell XPS 13 9360 QHD+ i5 HD Graphics 620, i5-7200U, Toshiba NVMe THNSN5256GPUK | |
|---|---|---|---|---|---|---|---|---|
| Noise | -13% | -10% | -14% | -11% | -11% | -9% | -8% | |
| Idle Minimum * (dB) | 28.9 | 28.5 1% | 31.2 -8% | 31.2 -8% | 30.1 -4% | 31 -7% | 30 -4% | 30.6 -6% |
| Idle Average * (dB) | 28.9 | 30.9 -7% | 31.2 -8% | 31.2 -8% | 30.1 -4% | 31 -7% | 30 -4% | 30.6 -6% |
| Idle Maximum * (dB) | 28.9 | 31.6 -9% | 31.5 -9% | 31.2 -8% | 30.1 -4% | 31 -7% | 30 -4% | 32.2 -11% |
| Load Average * (dB) | 30.9 | 38.8 -26% | 35.7 -16% | 37.4 -21% | 39.2 -27% | 35 -13% | 36.5 -18% | 32.2 -4% |
| Load Maximum * (dB) | 33.5 | 41.4 -24% | 35.8 -7% | 41.4 -24% | 39.3 -17% | 40.5 -21% | 38.3 -14% | 38.5 -15% |
| off / environment * (dB) | 28.5 | 31.2 | 31.2 | 29 | 31 | 30 | 30.3 |
* ... smaller is better
(±) The maximum temperature on the upper side is 43.4 °C / 110 F, compared to the average of 35.9 °C / 97 F, ranging from 21.4 to 59 °C for the class Subnotebook.
(-) The bottom heats up to a maximum of 49.2 °C / 121 F, compared to the average of 39.2 °C / 103 F
(+) In idle usage, the average temperature for the upper side is 25.1 °C / 77 F, compared to the device average of 30.8 °C / 87 F.
(+) The palmrests and touchpad are cooler than skin temperature with a maximum of 29.4 °C / 84.9 F and are therefore cool to the touch.
(±) The average temperature of the palmrest area of similar devices was 28.2 °C / 82.8 F (-1.2 °C / -2.1 F).
Dell XPS 13 9360 FHD i5 audio analysis
(-) | not very loud speakers (70.3 dB)
Bass 100 - 315 Hz
(±) | reduced bass - on average 6.9% lower than median
(±) | linearity of bass is average (10.5% delta to prev. frequency)
Mids 400 - 2000 Hz
(+) | balanced mids - only 3.7% away from median
(+) | mids are linear (4% delta to prev. frequency)
Highs 2 - 16 kHz
(+) | balanced highs - only 2% away from median
(±) | linearity of highs is average (10.3% delta to prev. frequency)
Overall 100 - 16.000 Hz
(±) | linearity of overall sound is average (18.3% difference to median)
Compared to same class
» 53% of all tested devices in this class were better, 7% similar, 40% worse
» The best had a delta of 5%, average was 18%, worst was 53%
Compared to all devices tested
» 40% of all tested devices were better, 8% similar, 52% worse
» The best had a delta of 4%, average was 24%, worst was 134%
Apple MacBook 12 (Early 2016) 1.1 GHz audio analysis
(+) | speakers can play relatively loud (83.6 dB)
Bass 100 - 315 Hz
(±) | reduced bass - on average 11.3% lower than median
(±) | linearity of bass is average (14.2% delta to prev. frequency)
Mids 400 - 2000 Hz
(+) | balanced mids - only 2.4% away from median
(+) | mids are linear (5.5% delta to prev. frequency)
Highs 2 - 16 kHz
(+) | balanced highs - only 2% away from median
(+) | highs are linear (4.5% delta to prev. frequency)
Overall 100 - 16.000 Hz
(+) | overall sound is linear (10.2% difference to median)
Compared to same class
» 7% of all tested devices in this class were better, 2% similar, 91% worse
» The best had a delta of 5%, average was 18%, worst was 53%
Compared to all devices tested
» 5% of all tested devices were better, 1% similar, 94% worse
» The best had a delta of 4%, average was 24%, worst was 134%
| Off / Standby | |
| Idle | |
| Load |
|
Key:
min: | |
| Dell XPS 13 9360 FHD i5 i5-7200U, HD Graphics 620, Toshiba NVMe THNSN5256GPUK, IPS, 1920x1080, 13.3" | HP Spectre 13 6500U, HD Graphics 520, Samsung PM951 NVMe MZVLV256, IPS UWVA, 1920x1080, 13.3" | Acer Aspire S 13 S5-371-71QZ 6500U, HD Graphics 520, LiteOn CV1-8B512, IPS, 1920x1080, 13.3" | Asus Zenbook UX330UA-FC059T 6500U, HD Graphics 520, SanDisk SD8SNAT256G1002, IPS, 1920x1080, 13.3" | Lenovo IdeaPad 710S-13ISK 6560U, Iris Graphics 540, Samsung PM951 NVMe MZVLV256, IPS, 1920x1080, 13.3" | Razer Blade Stealth QHD i7-7500U i7-7500U, HD Graphics 620, Samsung PM951 NVMe MZVLV256, , 2560x1440, 12.5" | Dell XPS 13 9360 QHD+ i7 i7-7500U, HD Graphics 620, Toshiba NVMe THNSN5256GPUK, IPS, 3200x1800, 13.3" | Dell XPS 13 2016 9350 (FHD, i7-6560U) 6560U, Iris Graphics 540, Samsung PM951 NVMe MZ-VLV256D, IPS, 1920x1080, 13.3" | Dell XPS 13 9360 QHD+ i5 i5-7200U, HD Graphics 620, Toshiba NVMe THNSN5256GPUK, , 3200x1800, 13.3" | |
|---|---|---|---|---|---|---|---|---|---|
| Power Consumption | -94% | -32% | -28% | -46% | -50% | -36% | -46% | -21% | |
| Idle Minimum * (Watt) | 4.1 | 8.6 -110% | 4.1 -0% | 3 27% | 3.3 20% | 4.4 -7% | 6.4 -56% | 5.8 -41% | 3.7 10% |
| Idle Average * (Watt) | 4.2 | 11 -162% | 6.7 -60% | 6.3 -50% | 7.4 -76% | 5.8 -38% | 6.6 -57% | 7.3 -74% | 6.1 -45% |
| Idle Maximum * (Watt) | 5.1 | 11.3 -122% | 7.4 -45% | 7.5 -47% | 8.2 -61% | 8.6 -69% | 6.8 -33% | 8.5 -67% | 6.5 -27% |
| Load Average * (Watt) | 22.1 | 33.8 -53% | 32.4 -47% | 36 -63% | 36.5 -65% | 35.2 -59% | 27.5 -24% | 30.6 -38% | 29.5 -33% |
| Load Maximum * (Watt) | 29.4 | 36.2 -23% | 32.4 -10% | 31.5 -7% | 43.7 -49% | 52 -77% | 32.4 -10% | 32.5 -11% | 33 -12% |
* ... smaller is better
| Dell XPS 13 9360 FHD i5 i5-7200U, HD Graphics 620, 60 Wh | HP Spectre 13 6500U, HD Graphics 520, 38 Wh | Acer Aspire S 13 S5-371-71QZ 6500U, HD Graphics 520, 45 Wh | Asus Zenbook UX330UA-FC059T 6500U, HD Graphics 520, 57 Wh | Lenovo IdeaPad 710S-13ISK 6560U, Iris Graphics 540, 46 Wh | Razer Blade Stealth QHD i7-7500U i7-7500U, HD Graphics 620, 53.6 Wh | Dell XPS 13 9360 QHD+ i7 i7-7500U, HD Graphics 620, 60 Wh | Dell XPS 13 9360 QHD+ i5 i5-7200U, HD Graphics 620, 60 Wh | |
|---|---|---|---|---|---|---|---|---|
| Battery runtime | -48% | -29% | -14% | -39% | -32% | -19% | -17% | |
| Reader / Idle (h) | 21.6 | 11.9 -45% | 17.1 -21% | 20.4 -6% | 13.5 -37% | 13.6 -37% | 17.6 -19% | |
| WiFi v1.3 (h) | 11.3 | 5.6 -50% | 7.9 -30% | 10.2 -10% | 7 -38% | 8.3 -27% | 8.6 -24% | 8.8 -22% |
| Load (h) | 2.6 | 1.3 -50% | 1.7 -35% | 1.9 -27% | 1.5 -42% | 1.8 -31% | 2.2 -15% | 2.3 -12% |
Pros
Cons
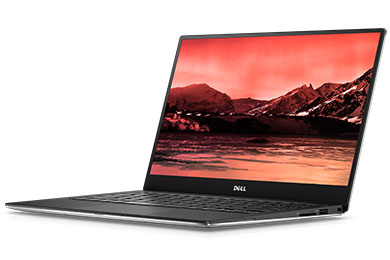
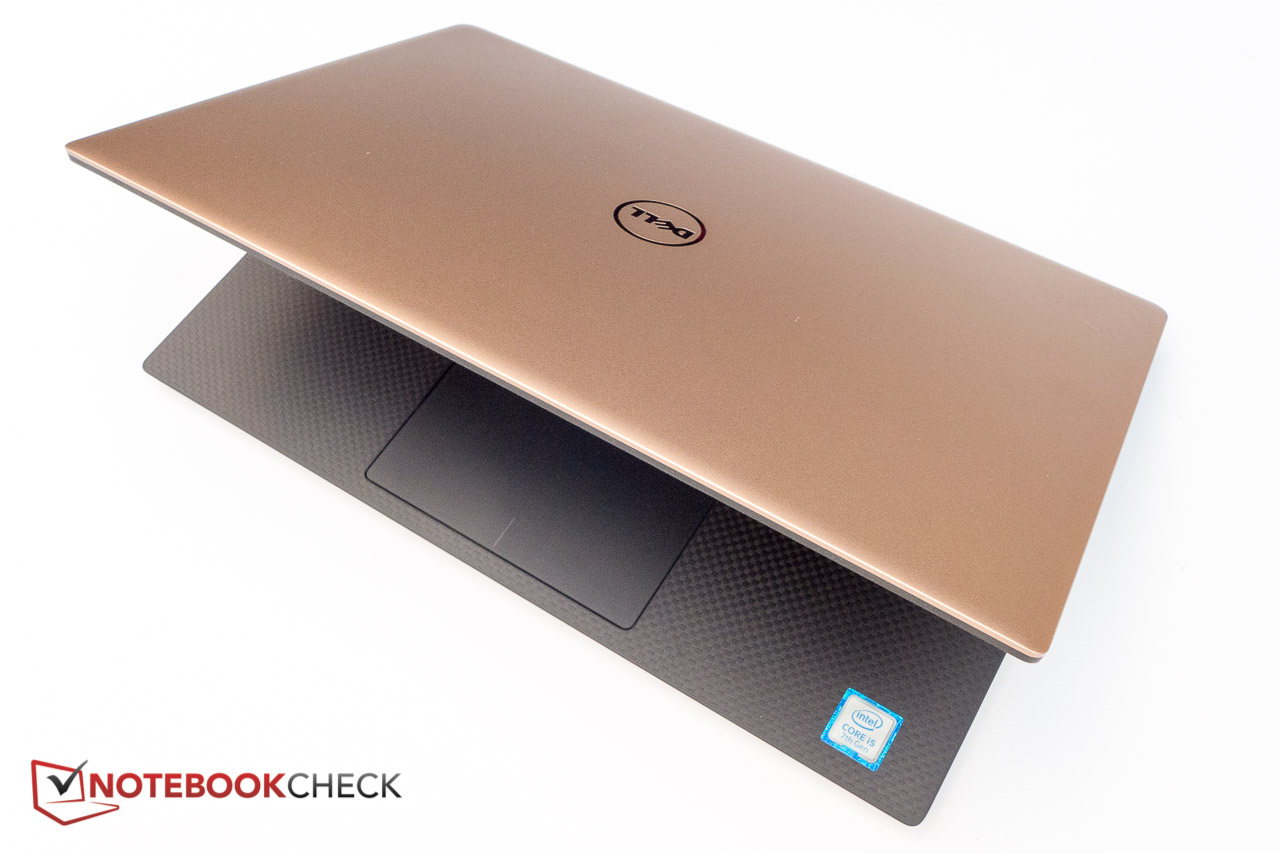
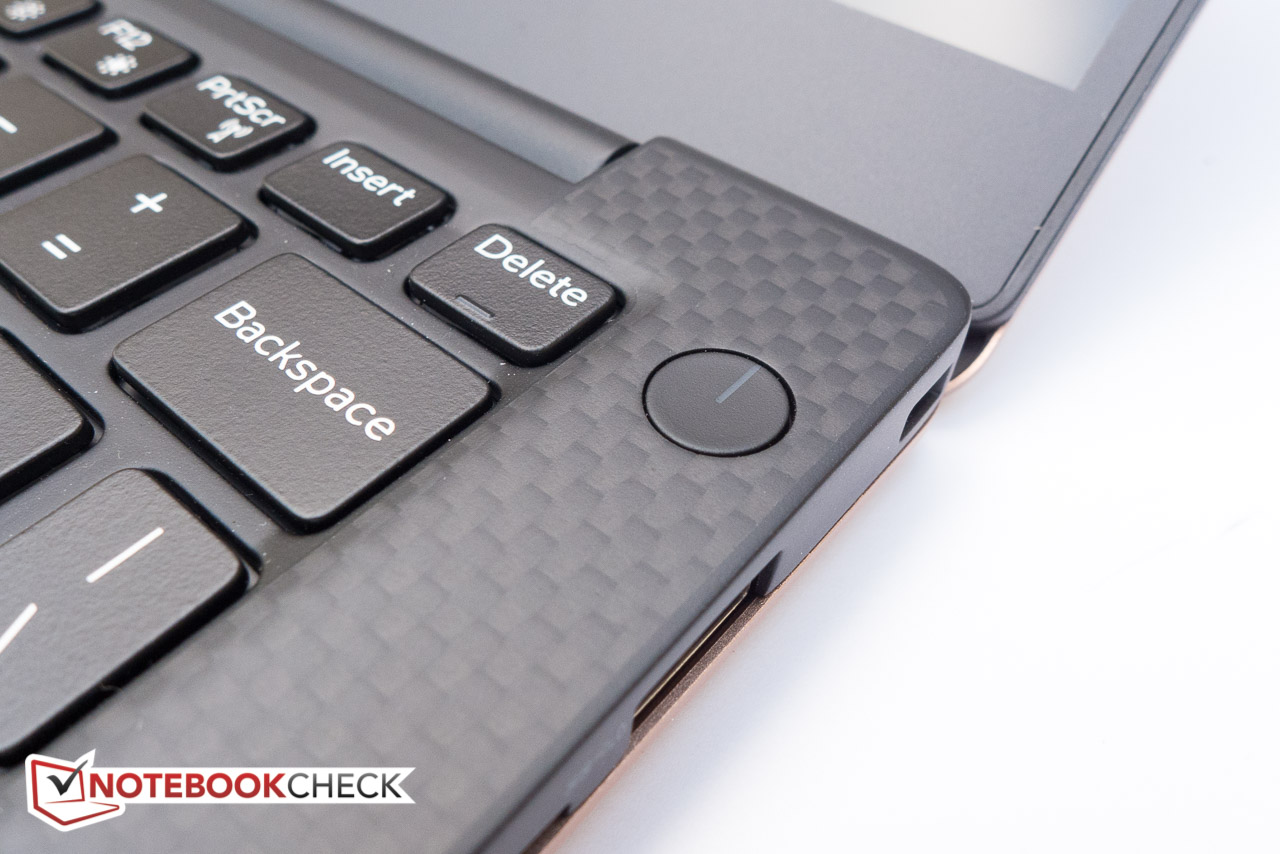
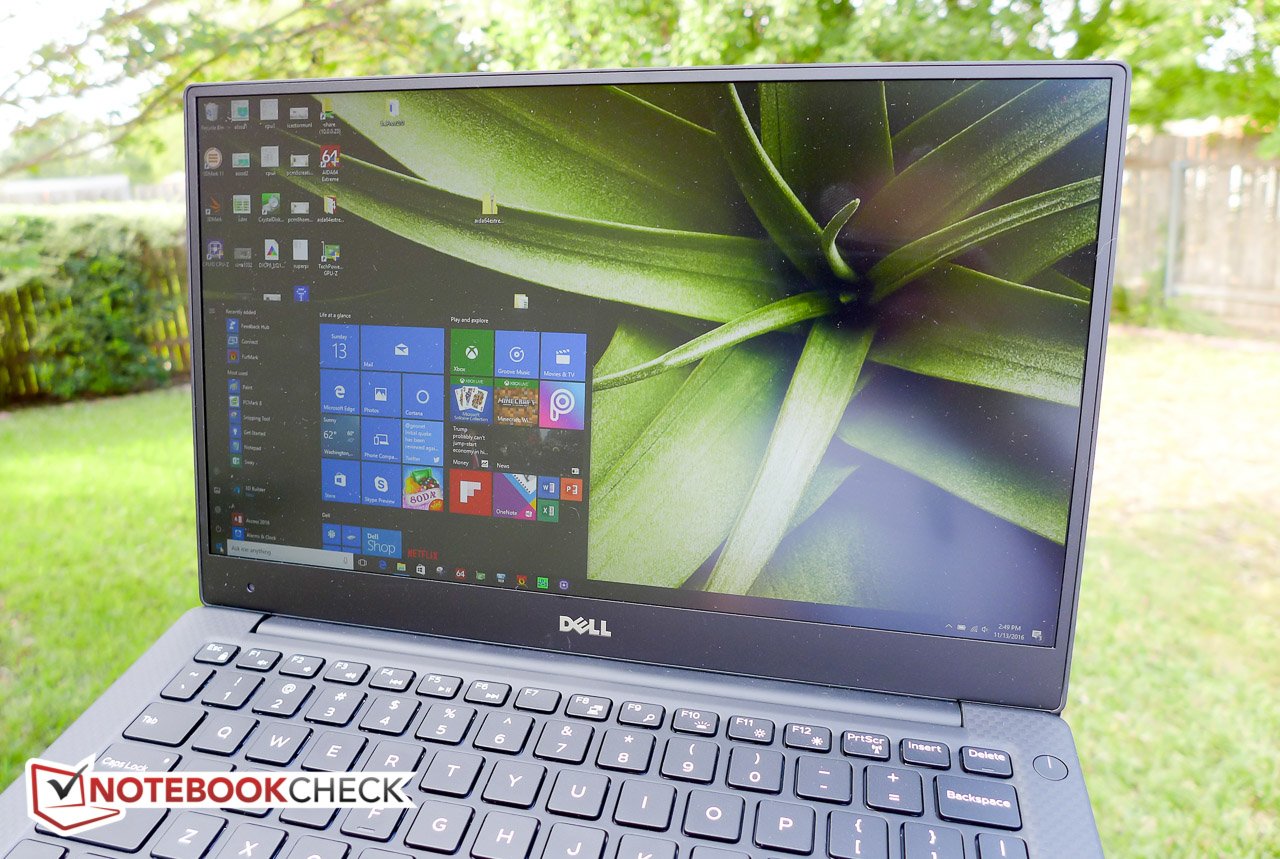
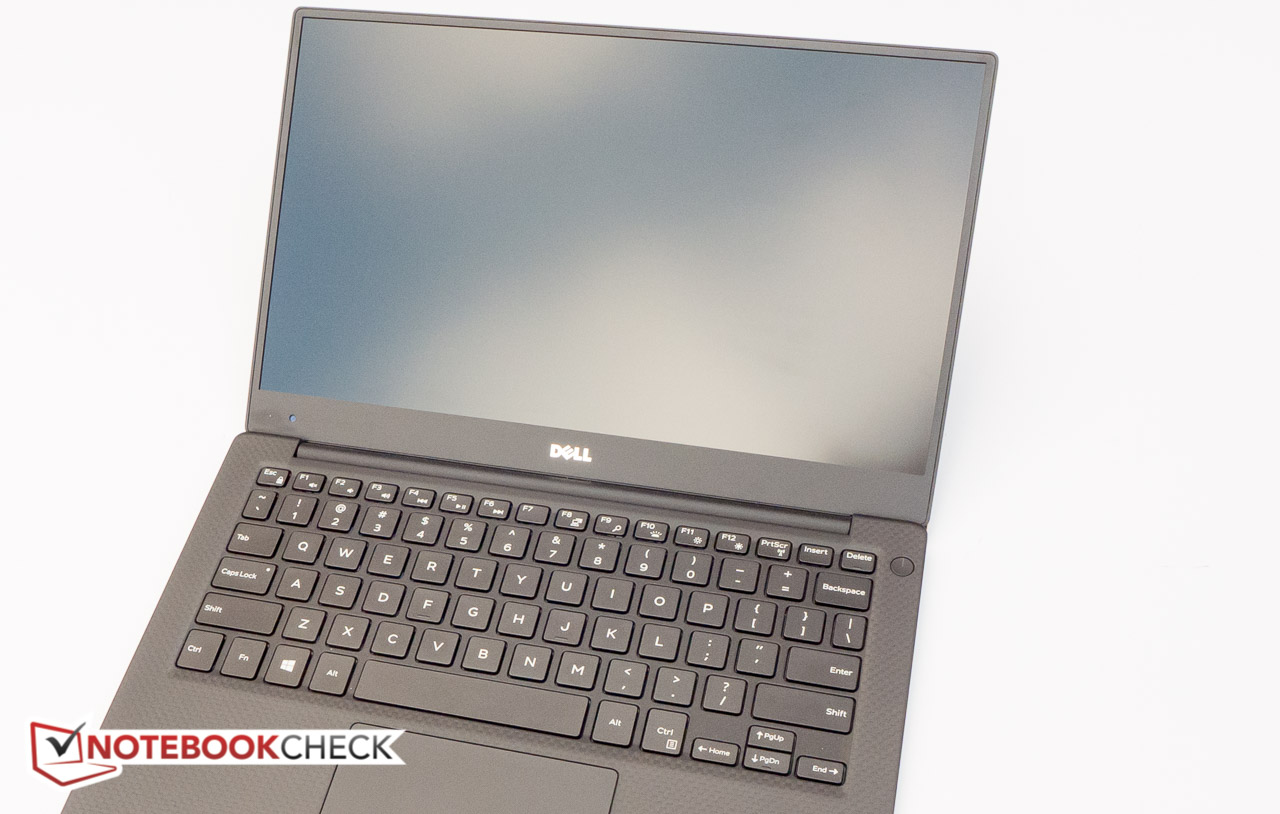
全高清版戴尔XPS 13 9360搭配了第七代i5处理器,接棒前代机型。Kaby Lake平台带来了和我们预期相当的流畅高速运行,在大部分极端情况下这台设备都可以顺畅运行。最新的i5处理器提供了前代(Skylake)i7处理器水平的性能。高出200美元(约1377人民币)的最新i7机型并不会带来太多的性能优势——特别是它没有集成英特尔Iris显卡。对于大部分用户来说,这台搭配i5-7200U, 8 GB内存和256 NVMe固态硬盘的测试机型会十分值得考虑。QHD+屏幕升级可以满足需要更高分辨率和触控屏幕的用户,主观上我们对这块全高清屏幕十分满意。它的实际使用电池续航可以达到近12小时,超过了一些竞争对手一倍之多。它也留给了我们很少的刺可挑:我们希望它的屏幕可以提供更好的色彩准确度和更高的亮度,它在负载下温度会较高,同时我们的测试机偶尔会发出电流声。它的摄像机位于屏幕左下边缘的设计也可能对一些用户来说不太方便。
XPS 13在很多方面的表现都十分优秀。它的屏幕可能在超便携设备的竞争中无法占据优势,不过这也只是我们的吹毛求疵而已。
我们评测中提到的其他设备也各有各的优势,都是不错的选择。尽管已经到了第四代更新,XPS 13凭借超窄边框和在便携性、设计、性能和性价比间的平衡依然是一台独一无二的设备。它在同类产品中依然是最值得考虑的选择之一。
注:本文是基于完整评测的缩减版本,阅读完整的英文评测,请点击这里。
Dell XPS 13 9360 FHD i5
- 12/07/2016 v6 (old)
Bernhard Pechlaner
Price comparison
