戴尔 XPS 13 9360 QHD+ i7-7500U 笔记本电脑简短评测


| SD Card Reader | |
| average JPG Copy Test (av. of 3 runs) | |
| MSI GT73VR 6RF | |
| Dell XPS 13 9360 QHD+ i7 | |
| Asus Zenbook UX360UA-C4159T | |
| maximum AS SSD Seq Read Test (1GB) | |
| Dell XPS 13 9360 QHD+ i7 | |
| MSI GT73VR 6RF | |
| Asus Zenbook UX360UA-C4159T | |
| Networking | |
| Wi-Fi Client 1m 512KB | |
| Wi-Fi Server 1m 512KB |
| |||||||||||||||||||||||||
Brightness Distribution: 84 %
Center on Battery: 396.2 cd/m²
Contrast: 1489:1 (Black: 0.266 cd/m²)
ΔE ColorChecker Calman: 3.9 | ∀{0.5-29.43 Ø4.71}
ΔE Greyscale Calman: 4.16 | ∀{0.09-98 Ø4.96}
88.7% sRGB (Argyll 1.6.3 3D)
57.5% AdobeRGB 1998 (Argyll 1.6.3 3D)
64.6% AdobeRGB 1998 (Argyll 3D)
89.4% sRGB (Argyll 3D)
62.8% Display P3 (Argyll 3D)
Gamma: 2.31
CCT: 6514 K
| Dell XPS 13 9360 QHD+ i7 Sharp SHP144A, IPS, 13.3", 3200x1800 | HP Spectre x360 13-w023dx Chi Mei CMN1367, IPS, 13.3", 1920x1080 | HP EliteBook 1030 G1-X2F03EA Sharp SHP1465, IPS, 13.3", 3200x1800 | Asus Zenbook UX360UA-C4159T AU Optronics AOU272D / B133HAN02.7, IPS, 13.3", 1920x1080 | Apple MacBook Air 13 inch 2015-03 Apple APP9CF0, TN LED, 13.3", 1440x900 | |
|---|---|---|---|---|---|
| Display | 2% | 7% | 3% | -35% | |
| Display P3 Coverage (%) | 62.8 | 65.4 4% | 67.6 8% | 64.8 3% | 40.1 -36% |
| sRGB Coverage (%) | 89.4 | 90.4 1% | 94.7 6% | 93.1 4% | 59.8 -33% |
| AdobeRGB 1998 Coverage (%) | 64.6 | 65.8 2% | 69 7% | 66 2% | 41.51 -36% |
| Response Times | 14% | 8% | 34% | ||
| Response Time Grey 50% / Grey 80% * (ms) | 43.6 ? | 33.2 ? 24% | 42.4 ? 3% | 29 ? 33% | |
| Response Time Black / White * (ms) | 29.2 ? | 28 ? 4% | 25.6 ? 12% | 19 ? 35% | |
| PWM Frequency (Hz) | 50 ? | ||||
| Screen | -28% | -1% | -16% | -18% | |
| Brightness middle (cd/m²) | 396.2 | 334.6 -16% | 401 1% | 344 -13% | 329 -17% |
| Brightness (cd/m²) | 357 | 319 -11% | 369 3% | 326 -9% | 310 -13% |
| Brightness Distribution (%) | 84 | 90 7% | 85 1% | 86 2% | 82 -2% |
| Black Level * (cd/m²) | 0.266 | 0.336 -26% | 0.35 -32% | 0.27 -2% | 0.405 -52% |
| Contrast (:1) | 1489 | 996 -33% | 1146 -23% | 1274 -14% | 812 -45% |
| Colorchecker dE 2000 * | 3.9 | 6.21 -59% | 3.5 10% | 5.53 -42% | 3.96 -2% |
| Colorchecker dE 2000 max. * | 7.58 | 12 -58% | 6.33 16% | 10.01 -32% | 7.51 1% |
| Greyscale dE 2000 * | 4.16 | 7.71 -85% | 4.13 1% | 6.67 -60% | 3.51 16% |
| Gamma | 2.31 95% | 2.36 93% | 2.28 96% | 2.43 91% | 3.83 57% |
| CCT | 6514 100% | 6458 101% | 6508 100% | 7012 93% | 6711 97% |
| Color Space (Percent of AdobeRGB 1998) (%) | 57.5 | 58.6 2% | 61.56 7% | 60 4% | 38.4 -33% |
| Color Space (Percent of sRGB) (%) | 88.7 | 90 1% | 94.64 7% | 93 5% | 59.8 -33% |
| Total Average (Program / Settings) | -4% /
-16% | 5% /
2% | 7% /
-6% | -27% /
-22% |
* ... smaller is better
Display Response Times
| ↔ Response Time Black to White | ||
|---|---|---|
| 29.2 ms ... rise ↗ and fall ↘ combined | ↗ 9.2 ms rise | 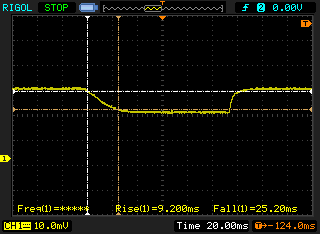 |
| ↘ 20 ms fall | ||
| The screen shows relatively slow response rates in our tests and may be too slow for gamers. In comparison, all tested devices range from 0.1 (minimum) to 240 (maximum) ms. » 78 % of all devices are better. This means that the measured response time is worse than the average of all tested devices (19.8 ms). | ||
| ↔ Response Time 50% Grey to 80% Grey | ||
| 43.6 ms ... rise ↗ and fall ↘ combined | ↗ 13.6 ms rise | 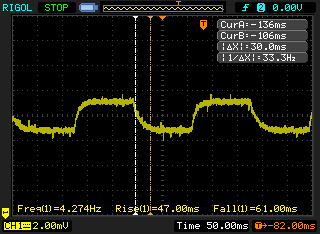 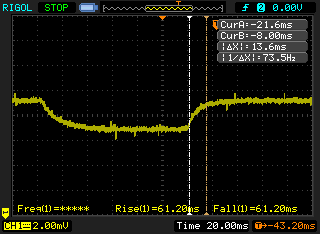 |
| ↘ 30 ms fall | ||
| The screen shows slow response rates in our tests and will be unsatisfactory for gamers. In comparison, all tested devices range from 0.165 (minimum) to 636 (maximum) ms. » 73 % of all devices are better. This means that the measured response time is worse than the average of all tested devices (31 ms). | ||
Screen Flickering / PWM (Pulse-Width Modulation)
| Screen flickering / PWM not detected | 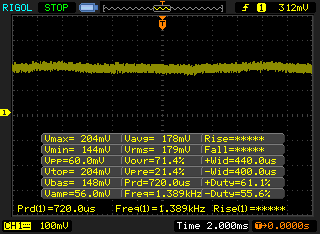 | ||
In comparison: 52 % of all tested devices do not use PWM to dim the display. If PWM was detected, an average of 7757 (minimum: 5 - maximum: 343500) Hz was measured. | |||
| Cinebench R15 | |
| CPU Single 64Bit | |
| MSI CX72-7QL | |
| Intel Skull Canyon NUC6i7KYK | |
| Dell XPS 13 9360 QHD+ i7 | |
| Acer Aspire E5-774G-78NA | |
| Lenovo U31-70 80M5003EGE | |
| Dell XPS 13 9360 QHD+ i5 | |
| Lenovo Y40-59423035 | |
| HP EliteBook 1030 G1-X2F03EA | |
| CPU Multi 64Bit | |
| Intel Skull Canyon NUC6i7KYK | |
| MSI CX72-7QL | |
| Dell XPS 13 9360 QHD+ i7 | |
| Acer Aspire E5-774G-78NA | |
| Dell XPS 13 9360 QHD+ i5 | |
| HP EliteBook 1030 G1-X2F03EA | |
| Lenovo U31-70 80M5003EGE | |
| Lenovo Y40-59423035 | |
| Cinebench R11.5 | |
| CPU Single 64Bit | |
| MSI CX72-7QL | |
| Dell XPS 13 9360 QHD+ i7 | |
| Intel Skull Canyon NUC6i7KYK | |
| Acer Aspire E5-774G-78NA | |
| Lenovo U31-70 80M5003EGE | |
| Dell XPS 13 9360 QHD+ i5 | |
| HP EliteBook 1030 G1-X2F03EA | |
| Lenovo Y40-59423035 | |
| CPU Multi 64Bit | |
| Intel Skull Canyon NUC6i7KYK | |
| MSI CX72-7QL | |
| Dell XPS 13 9360 QHD+ i7 | |
| Acer Aspire E5-774G-78NA | |
| Dell XPS 13 9360 QHD+ i5 | |
| HP EliteBook 1030 G1-X2F03EA | |
| Lenovo U31-70 80M5003EGE | |
| Lenovo Y40-59423035 | |
| Cinebench R10 | |
| Rendering Multiple CPUs 32Bit | |
| Intel Skull Canyon NUC6i7KYK | |
| MSI CX72-7QL | |
| Dell XPS 13 9360 QHD+ i7 | |
| Acer Aspire E5-774G-78NA | |
| Lenovo U31-70 80M5003EGE | |
| Rendering Single 32Bit | |
| MSI CX72-7QL | |
| Dell XPS 13 9360 QHD+ i7 | |
| Intel Skull Canyon NUC6i7KYK | |
| Acer Aspire E5-774G-78NA | |
| Lenovo U31-70 80M5003EGE | |
| wPrime 2.10 - 1024m | |
| Lenovo Y40-59423035 | |
| Dell XPS 13 9360 QHD+ i5 | |
| Dell XPS 13 9360 QHD+ i7 | |
| MSI CX72-7QL | |
| Intel Skull Canyon NUC6i7KYK | |
| Super Pi Mod 1.5 XS 32M - 32M | |
| Lenovo Y40-59423035 | |
| Dell XPS 13 9360 QHD+ i7 | |
| MSI CX72-7QL | |
| Intel Skull Canyon NUC6i7KYK | |
* ... smaller is better
| PCMark 8 | |
| Home Score Accelerated v2 | |
| Intel Skull Canyon NUC6i7KYK | |
| HP Spectre x360 13-w023dx | |
| HP Spectre 13 | |
| Asus Zenbook UX360UA-C4159T | |
| Dell XPS 13 9360 QHD+ i7 | |
| Dell XPS 13 9360 QHD+ i5 | |
| Work Score Accelerated v2 | |
| Intel Skull Canyon NUC6i7KYK | |
| HP Spectre x360 13-w023dx | |
| HP Spectre 13 | |
| Asus Zenbook UX360UA-C4159T | |
| Dell XPS 13 9360 QHD+ i7 | |
| Creative Score Accelerated v2 | |
| Intel Skull Canyon NUC6i7KYK | |
| HP Spectre x360 13-w023dx | |
| HP Spectre 13 | |
| Dell XPS 13 9360 QHD+ i7 | |
| PCMark 8 Home Score Accelerated v2 | 2855 points | |
| PCMark 8 Creative Score Accelerated v2 | 4172 points | |
| PCMark 8 Work Score Accelerated v2 | 4176 points | |
Help | ||
| Dell XPS 13 9360 QHD+ i7 Toshiba NVMe THNSN5256GPUK | HP Spectre x360 13-w023dx Samsung PM951 NVMe MZVLV512 | HP EliteBook 1030 G1-X2F03EA Sandisk X300 SD7SN6S-512G-1006 | Apple MacBook Air 13 inch 2015-03 Apple SSD SD0256F | Dell XPS 13 9360 QHD+ i5 Toshiba NVMe THNSN5256GPUK | |
|---|---|---|---|---|---|
| CrystalDiskMark 3.0 | 16% | -38% | 18% | -1% | |
| Read Seq (MB/s) | 1214 | 1376 13% | 387.5 -68% | 1352 11% | 1168 -4% |
| Write Seq (MB/s) | 655 | 571 -13% | 348.7 -47% | 1111 70% | 329 -50% |
| Read 512 (MB/s) | 1019 | 679 -33% | 239.9 -76% | 880 -14% | 1015 0% |
| Write 512 (MB/s) | 445.7 | 571 28% | 335.3 -25% | 1023 130% | 307 -31% |
| Read 4k (MB/s) | 35.55 | 42.66 20% | 30.34 -15% | 21.93 -38% | 33 -7% |
| Write 4k (MB/s) | 130 | 137.9 6% | 75.9 -42% | 30.94 -76% | 132 2% |
| Read 4k QD32 (MB/s) | 537 | 535 0% | 311.3 -42% | 339.5 -37% | 525 -2% |
| Write 4k QD32 (MB/s) | 173.8 | 361.2 108% | 192.8 11% | 342.9 97% | 325 87% |

| 3DMark | |
| 1280x720 Cloud Gate Standard Graphics | |
| Intel Skull Canyon NUC6i7KYK | |
| MSI CX72-7QL | |
| Dell XPS 13 9360 QHD+ i7 | |
| Asus X302UV-FN016T | |
| Dell XPS 13 9360 QHD+ i5 | |
| Lenovo Ideapad 510S-13ISK | |
| HP Pavilion x2 12-b000ng | |
| Dell Vostro 3546 JAN15HSW1601_1K9_Win | |
| Lenovo B50-50 80S2000QGE | |
| 1920x1080 Fire Strike Graphics | |
| Intel Skull Canyon NUC6i7KYK | |
| Asus X302UV-FN016T | |
| MSI CX72-7QL | |
| Dell XPS 13 9360 QHD+ i7 | |
| Dell XPS 13 9360 QHD+ i5 | |
| Lenovo Ideapad 510S-13ISK | |
| HP Pavilion x2 12-b000ng | |
| Lenovo B50-50 80S2000QGE | |
| Dell Vostro 3546 JAN15HSW1601_1K9_Win | |
| 3DMark 11 | |
| 1280x720 Performance GPU | |
| Intel Skull Canyon NUC6i7KYK | |
| Asus X302UV-FN016T | |
| MSI CX72-7QL | |
| Dell XPS 13 9360 QHD+ i7 | |
| Dell XPS 13 9360 QHD+ i5 | |
| Lenovo Ideapad 510S-13ISK | |
| HP Pavilion x2 12-b000ng | |
| Lenovo B50-50 80S2000QGE | |
| Dell Vostro 3546 JAN15HSW1601_1K9_Win | |
| 1280x720 Performance Combined | |
| Intel Skull Canyon NUC6i7KYK | |
| MSI CX72-7QL | |
| Asus X302UV-FN016T | |
| Dell XPS 13 9360 QHD+ i7 | |
| Dell XPS 13 9360 QHD+ i5 | |
| Lenovo Ideapad 510S-13ISK | |
| HP Pavilion x2 12-b000ng | |
| Lenovo B50-50 80S2000QGE | |
| Dell Vostro 3546 JAN15HSW1601_1K9_Win | |
| 3DMark 06 Standard Score | 9655 points | |
| 3DMark 11 Performance | 1771 points | |
| 3DMark Ice Storm Standard Score | 55532 points | |
| 3DMark Cloud Gate Standard Score | 6460 points | |
| 3DMark Fire Strike Score | 876 points | |
| 3DMark Fire Strike Extreme Score | 401 points | |
Help | ||
| BioShock Infinite | |
| 1280x720 Very Low Preset | |
| Acer TravelMate P278-MG-76L2 | |
| Acer Aspire E5-574-53YZ | |
| MSI CX72-7QL | |
| Dell XPS 13 9360 QHD+ i7 | |
| Lenovo ThinkPad Yoga 12 20DK002EPB | |
| HP ProBook 650 G2 V1A44ET | |
| 1366x768 Medium Preset | |
| Acer TravelMate P278-MG-76L2 | |
| Acer Aspire E5-574-53YZ | |
| MSI CX72-7QL | |
| Dell XPS 13 9360 QHD+ i7 | |
| Lenovo ThinkPad Yoga 12 20DK002EPB | |
| HP ProBook 650 G2 V1A44ET | |
| 1366x768 High Preset | |
| Acer TravelMate P278-MG-76L2 | |
| Acer Aspire E5-574-53YZ | |
| MSI CX72-7QL | |
| Dell XPS 13 9360 QHD+ i7 | |
| Lenovo ThinkPad Yoga 12 20DK002EPB | |
| HP ProBook 650 G2 V1A44ET | |
| low | med. | high | ultra | |
|---|---|---|---|---|
| BioShock Infinite (2013) | 55 | 28.2 | 26.1 | 8.3 |
| The Witcher 3 (2015) | 15.7 | |||
| Dota 2 Reborn (2015) | 59.6 | 50.7 | 27 | 24.2 |
| Rise of the Tomb Raider (2016) | 21.8 | 12.5 | 6.2 | |
| Overwatch (2016) | 49.7 | 34.8 | 16.4 | |
| FIFA 17 (2016) | 56 severe graphical problems (flickering and slowdowns) | |||
| Battlefield 1 (2016) | 30.3 | |||
| Titanfall 2 (2016) | 36.6 | 24.9 |
Noise level
| Idle |
| 28.8 / 28.8 / 30.8 dB(A) |
| Load |
| 34.8 / 34.8 dB(A) |
 | ||
30 dB silent 40 dB(A) audible 50 dB(A) loud |
||
min: | ||
| Dell XPS 13 9360 QHD+ i7 HD Graphics 620, i7-7500U, Toshiba NVMe THNSN5256GPUK | HP Spectre x360 13-w023dx HD Graphics 620, i7-7500U, Samsung PM951 NVMe MZVLV512 | HP Spectre 13 HD Graphics 520, 6500U, Samsung PM951 NVMe MZVLV256 | Apple MacBook Air 13 inch 2015-03 HD Graphics 6000, 5650U, Apple SSD SD0256F | Dell XPS 13 9360 QHD+ i5 HD Graphics 620, i5-7200U, Toshiba NVMe THNSN5256GPUK | |
|---|---|---|---|---|---|
| Noise | -4% | -6% | -9% | -4% | |
| off / environment * (dB) | 28.8 | 29.1 -1% | 28.5 1% | 30.3 -5% | |
| Idle Minimum * (dB) | 28.8 | 29.1 -1% | 28.5 1% | 29.2 -1% | 30.6 -6% |
| Idle Average * (dB) | 28.8 | 29.1 -1% | 30.9 -7% | 29.2 -1% | 30.6 -6% |
| Idle Maximum * (dB) | 30.8 | 31.2 -1% | 31.6 -3% | 29.2 5% | 32.2 -5% |
| Load Average * (dB) | 34.8 | 37.3 -7% | 38.8 -11% | 40.2 -16% | 32.2 7% |
| Load Maximum * (dB) | 34.8 | 39.6 -14% | 41.4 -19% | 46.3 -33% | 38.5 -11% |
* ... smaller is better
(-) The maximum temperature on the upper side is 50.8 °C / 123 F, compared to the average of 35.9 °C / 97 F, ranging from 21.4 to 59 °C for the class Subnotebook.
(-) The bottom heats up to a maximum of 50.8 °C / 123 F, compared to the average of 39.2 °C / 103 F
(+) In idle usage, the average temperature for the upper side is 25.7 °C / 78 F, compared to the device average of 30.8 °C / 87 F.
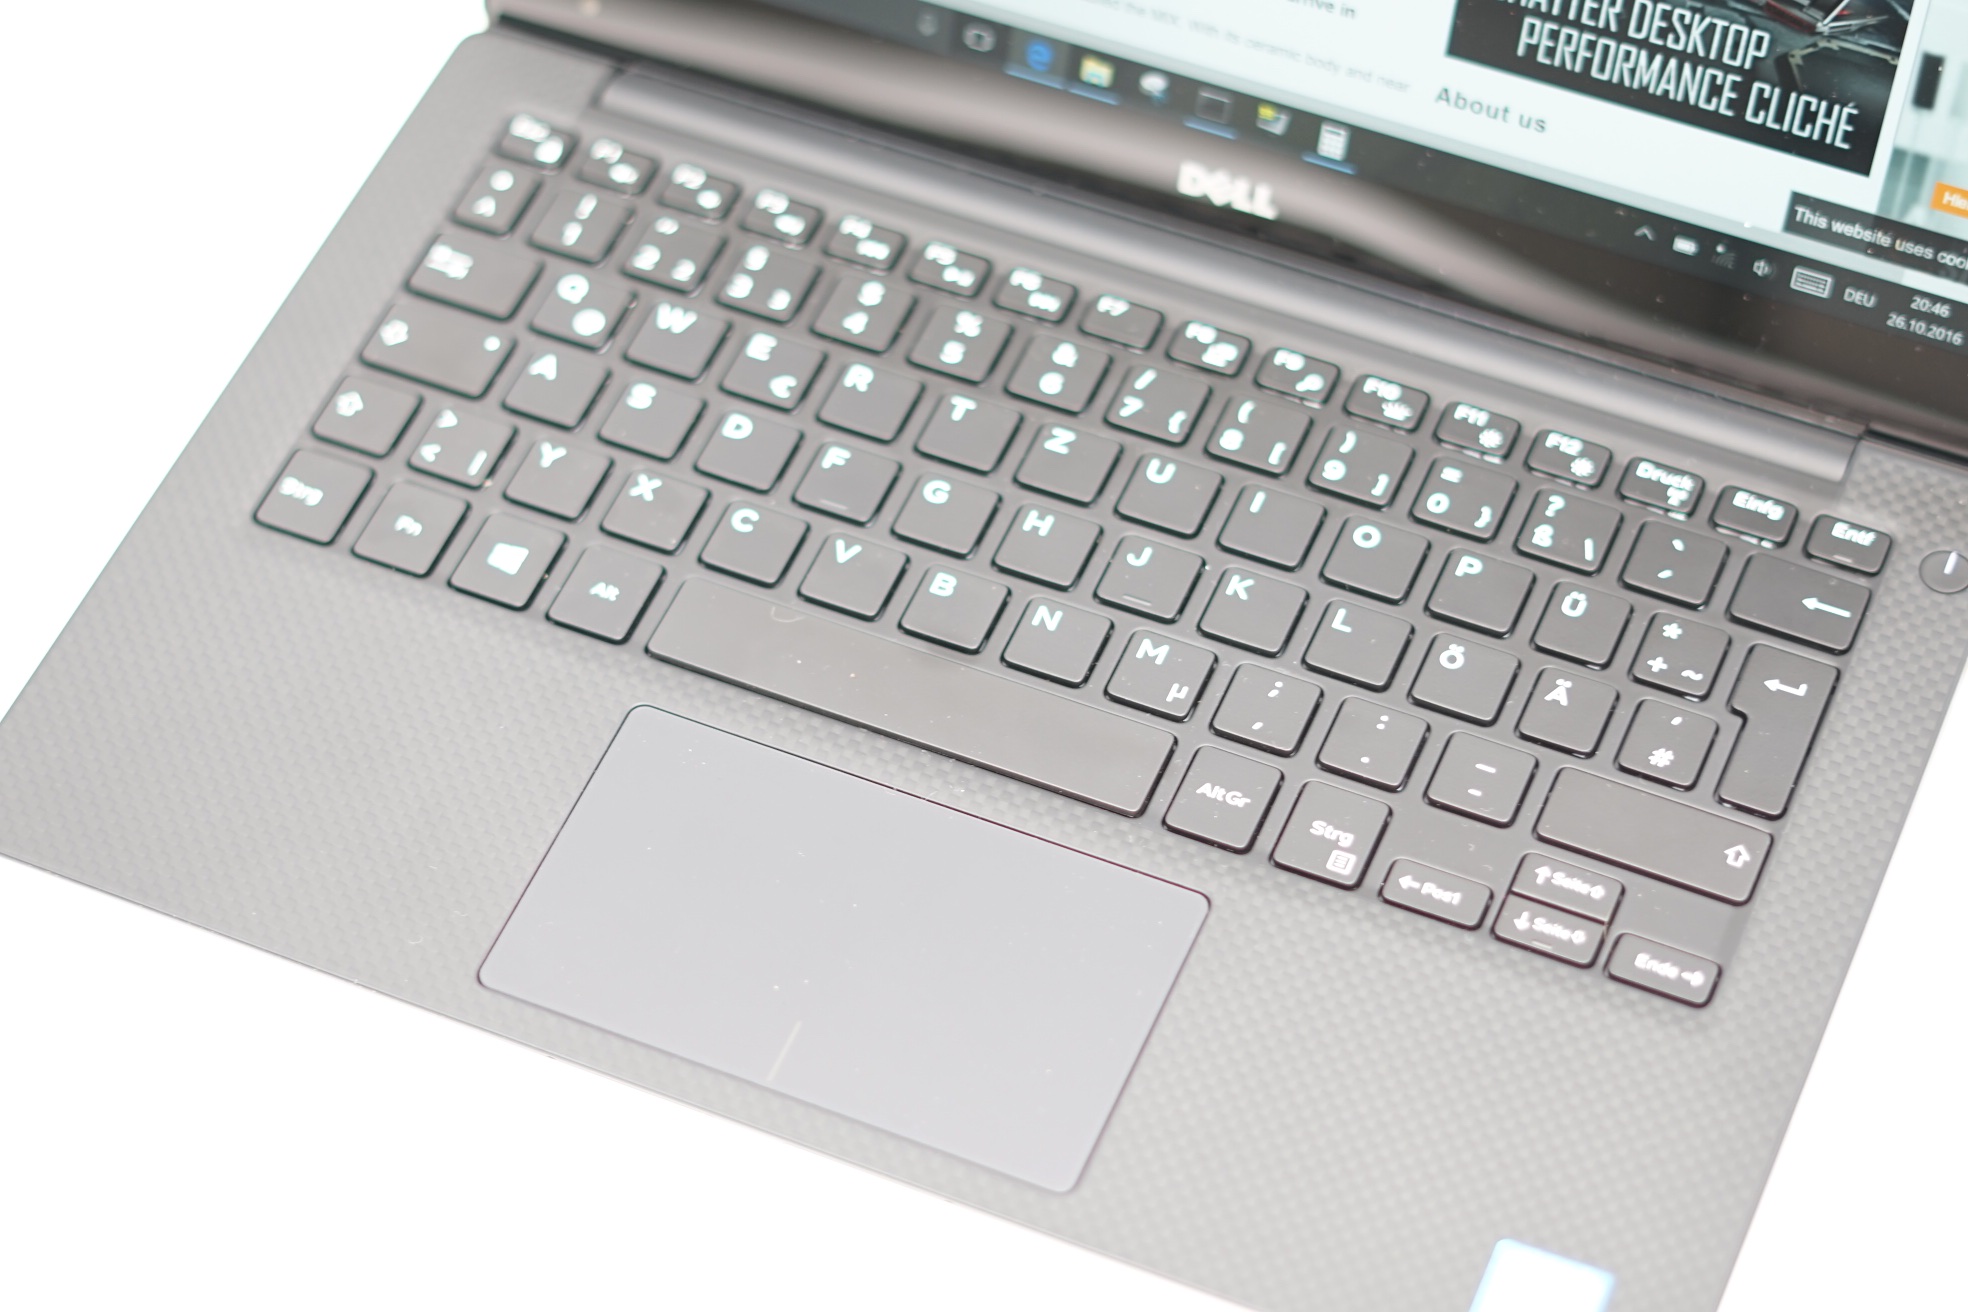
(+) The palmrests and touchpad are cooler than skin temperature with a maximum of 31 °C / 87.8 F and are therefore cool to the touch.
(-) The average temperature of the palmrest area of similar devices was 28.2 °C / 82.8 F (-2.8 °C / -5 F).
Dell XPS 13 9360 QHD+ i7 audio analysis
(±) | speaker loudness is average but good (72.4 dB)
Bass 100 - 315 Hz
(±) | reduced bass - on average 6.5% lower than median
(±) | linearity of bass is average (12.6% delta to prev. frequency)
Mids 400 - 2000 Hz
(+) | balanced mids - only 4.6% away from median
(+) | mids are linear (6.9% delta to prev. frequency)
Highs 2 - 16 kHz
(+) | balanced highs - only 3.4% away from median
(-) | highs are not linear (18.9% delta to prev. frequency)
Overall 100 - 16.000 Hz
(±) | linearity of overall sound is average (20.8% difference to median)
Compared to same class
» 68% of all tested devices in this class were better, 7% similar, 25% worse
» The best had a delta of 5%, average was 18%, worst was 53%
Compared to all devices tested
» 56% of all tested devices were better, 8% similar, 36% worse
» The best had a delta of 4%, average was 23%, worst was 134%
Apple MacBook 12 (Early 2016) 1.1 GHz audio analysis
(+) | speakers can play relatively loud (83.6 dB)
Bass 100 - 315 Hz
(±) | reduced bass - on average 11.3% lower than median
(±) | linearity of bass is average (14.2% delta to prev. frequency)
Mids 400 - 2000 Hz
(+) | balanced mids - only 2.4% away from median
(+) | mids are linear (5.5% delta to prev. frequency)
Highs 2 - 16 kHz
(+) | balanced highs - only 2% away from median
(+) | highs are linear (4.5% delta to prev. frequency)
Overall 100 - 16.000 Hz
(+) | overall sound is linear (10.2% difference to median)
Compared to same class
» 7% of all tested devices in this class were better, 2% similar, 90% worse
» The best had a delta of 5%, average was 18%, worst was 53%
Compared to all devices tested
» 5% of all tested devices were better, 1% similar, 94% worse
» The best had a delta of 4%, average was 23%, worst was 134%
| Off / Standby | |
| Idle | |
| Load |
|
Key:
min: | |
| Dell XPS 13 9360 QHD+ i7 i7-7500U, HD Graphics 620, Toshiba NVMe THNSN5256GPUK, IPS, 3200x1800, 13.3" | HP Spectre x360 13-w023dx i7-7500U, HD Graphics 620, Samsung PM951 NVMe MZVLV512, IPS, 1920x1080, 13.3" | HP EliteBook 1030 G1-X2F03EA 6Y75, HD Graphics 515, Sandisk X300 SD7SN6S-512G-1006, IPS, 3200x1800, 13.3" | Apple MacBook Air 13 inch 2015-03 5650U, HD Graphics 6000, Apple SSD SD0256F, TN LED, 1440x900, 13.3" | Dell XPS 13 9360 QHD+ i5 i5-7200U, HD Graphics 620, Toshiba NVMe THNSN5256GPUK, , 3200x1800, 13.3" | |
|---|---|---|---|---|---|
| Power Consumption | -4% | -3% | 11% | 9% | |
| Idle Minimum * (Watt) | 6.4 | 5.5 14% | 4 37% | 2.7 58% | 3.7 42% |
| Idle Average * (Watt) | 6.6 | 6.7 -2% | 8 -21% | 5.7 14% | 6.1 8% |
| Idle Maximum * (Watt) | 6.8 | 7.1 -4% | 8.6 -26% | 6 12% | 6.5 4% |
| Load Average * (Watt) | 27.5 | 33.1 -20% | 26.5 4% | 32.1 -17% | 29.5 -7% |
| Load Maximum * (Watt) | 32.4 | 35.2 -9% | 34.8 -7% | 36.2 -12% | 33 -2% |
* ... smaller is better
| Dell XPS 13 9360 QHD+ i7 i7-7500U, HD Graphics 620, 60 Wh | HP Spectre x360 13-w023dx i7-7500U, HD Graphics 620, 57.8 Wh | HP EliteBook 1030 G1-X2F03EA 6Y75, HD Graphics 515, 40 Wh | Apple MacBook Air 13 inch 2015-03 5650U, HD Graphics 6000, 54 Wh | Dell XPS 13 9360 QHD+ i5 i5-7200U, HD Graphics 620, 60 Wh | |
|---|---|---|---|---|---|
| Battery runtime | 5% | -24% | 14% | 4% | |
| Reader / Idle (h) | 17.6 | 20.6 17% | 10.3 -41% | 26.2 49% | |
| WiFi v1.3 (h) | 8.6 | 9.3 8% | 5.1 -41% | 10.3 20% | 8.8 2% |
| Load (h) | 2.2 | 2 -9% | 2.4 9% | 1.6 -27% | 2.3 5% |
Pros
Cons
对于大部分用户来说,Kaby Lake XPS 13 9360更新最重要的一个方面将会是Skylake XPS 13 9350的降价。这两款几乎完全相同的笔记本电脑的性能差别极小,对于主要用途为办公、上网或多媒体的用户来说几乎无法感受到Kaby Lake带来的改进。实际上,搭配Iris Graphics显卡的XPS 13 9350在图形性能上可以超过最新的Kaby Lake机型。
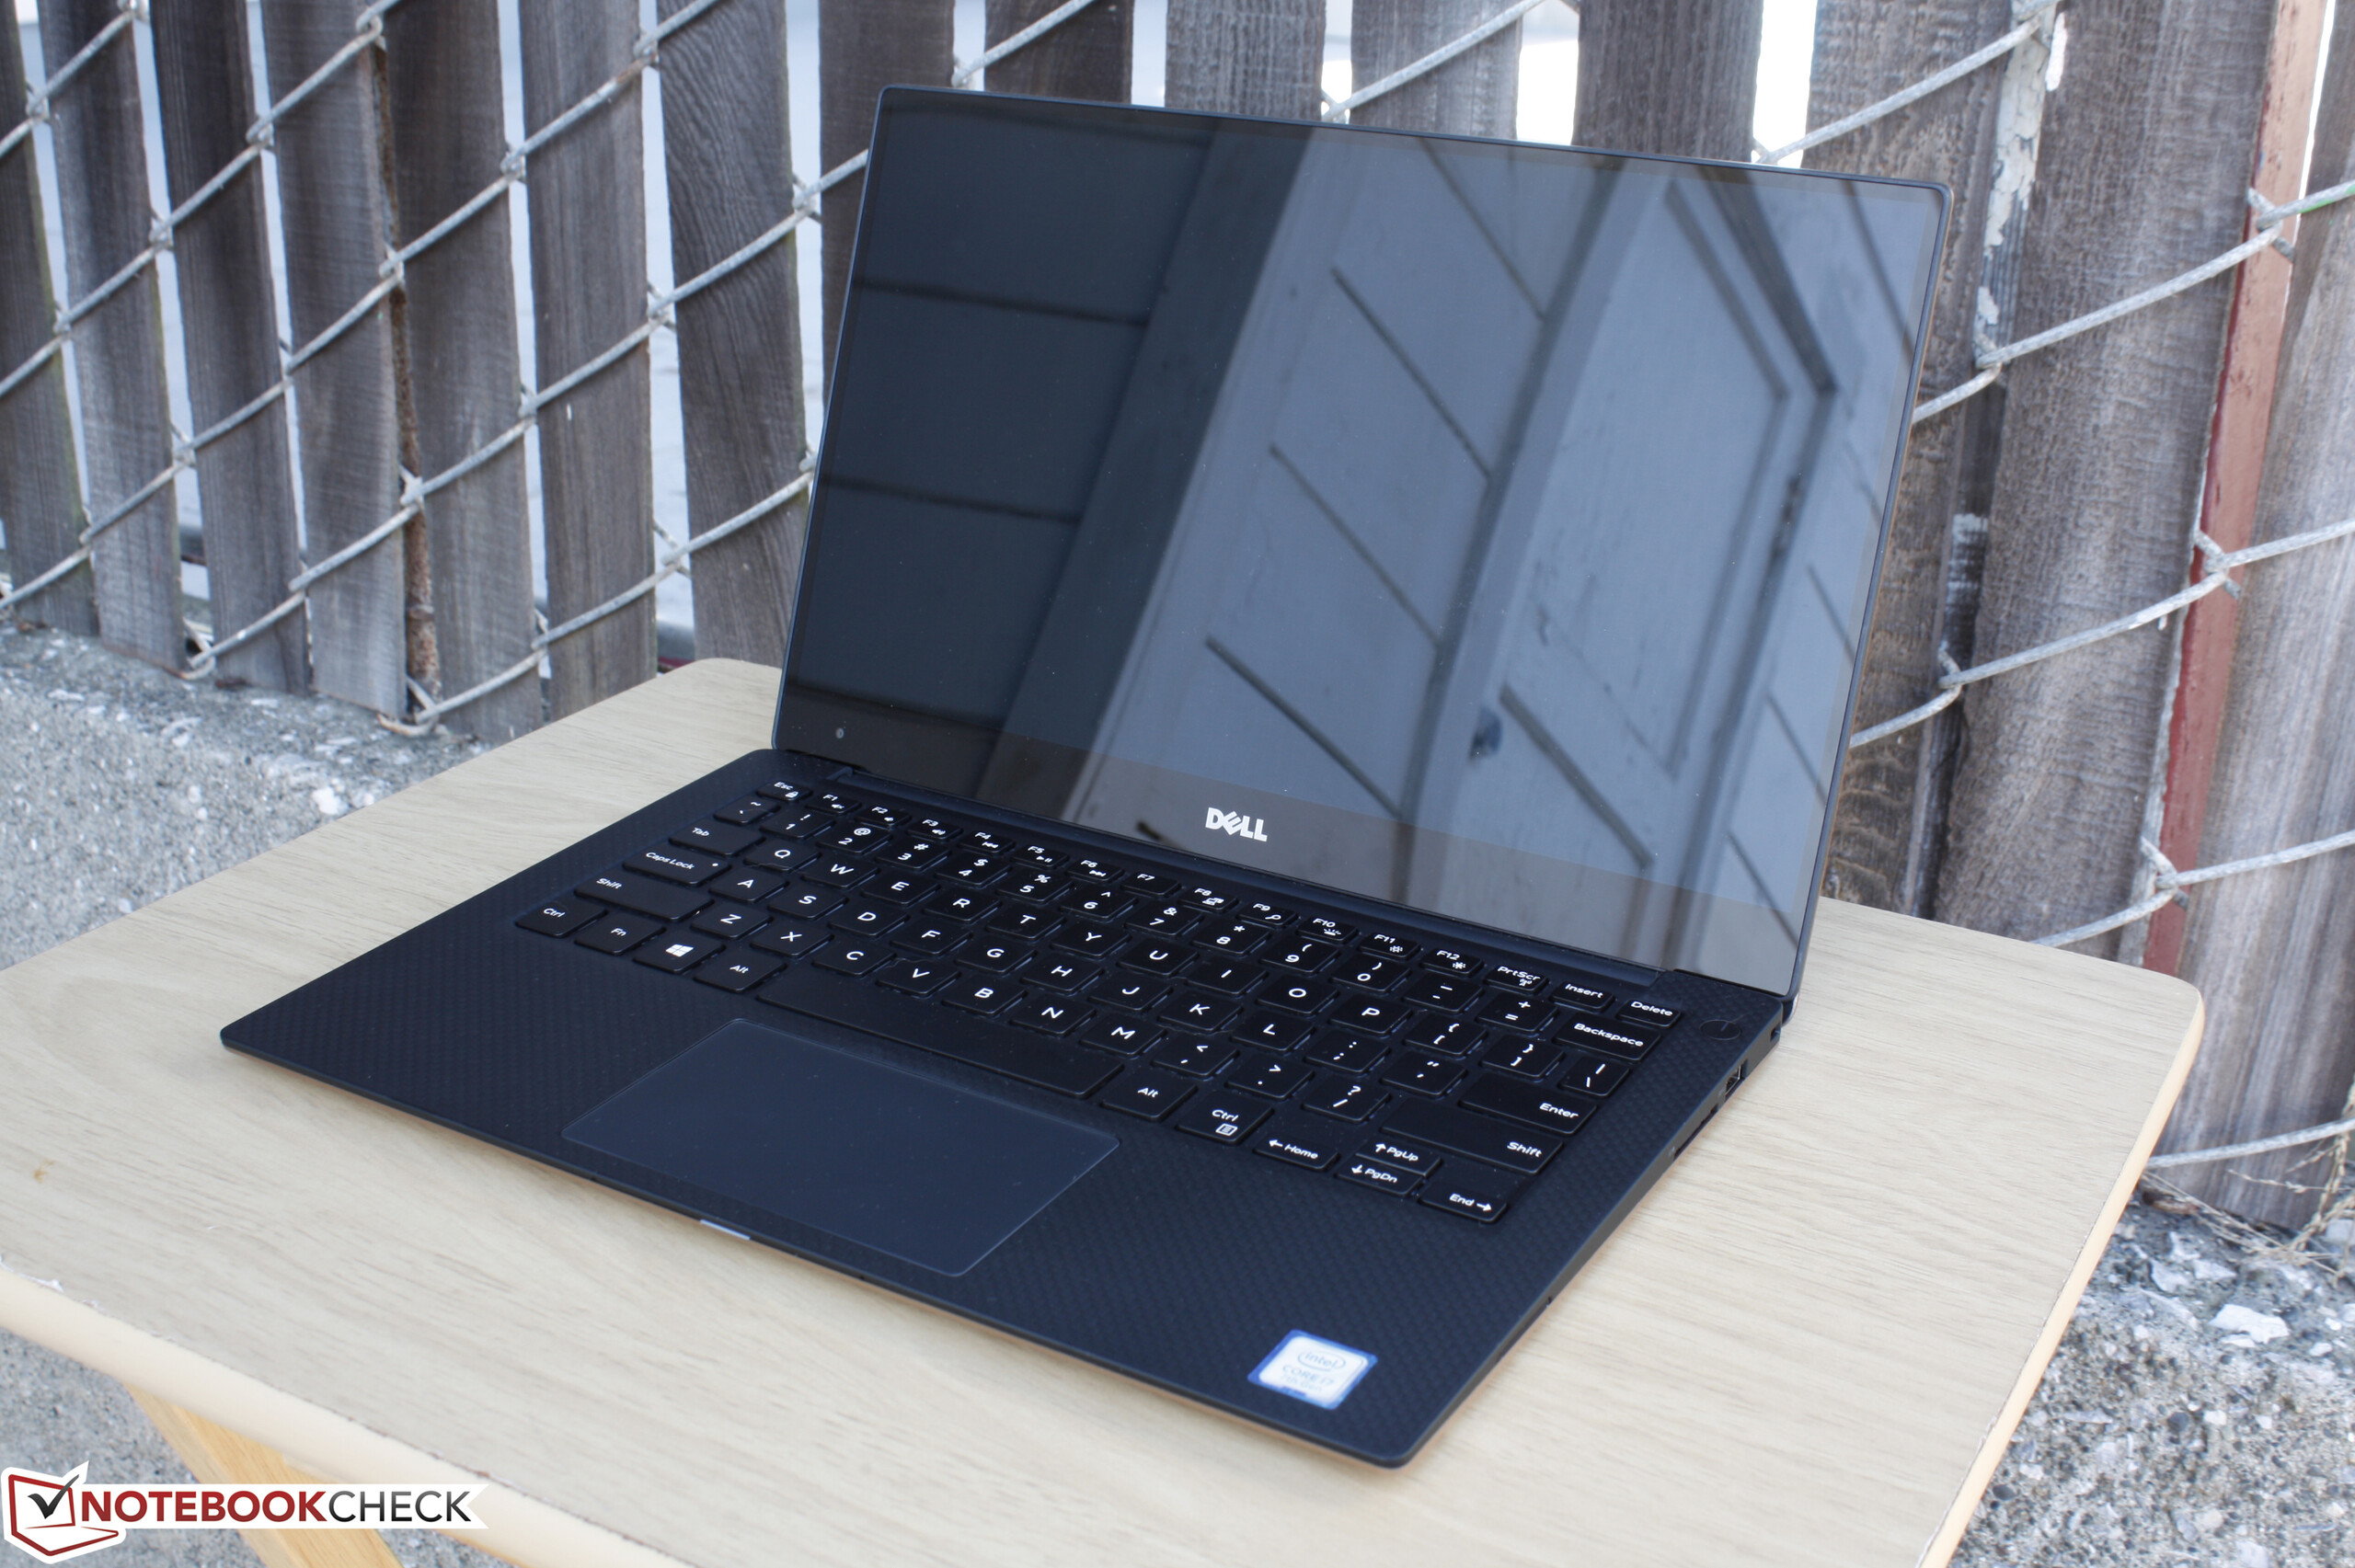
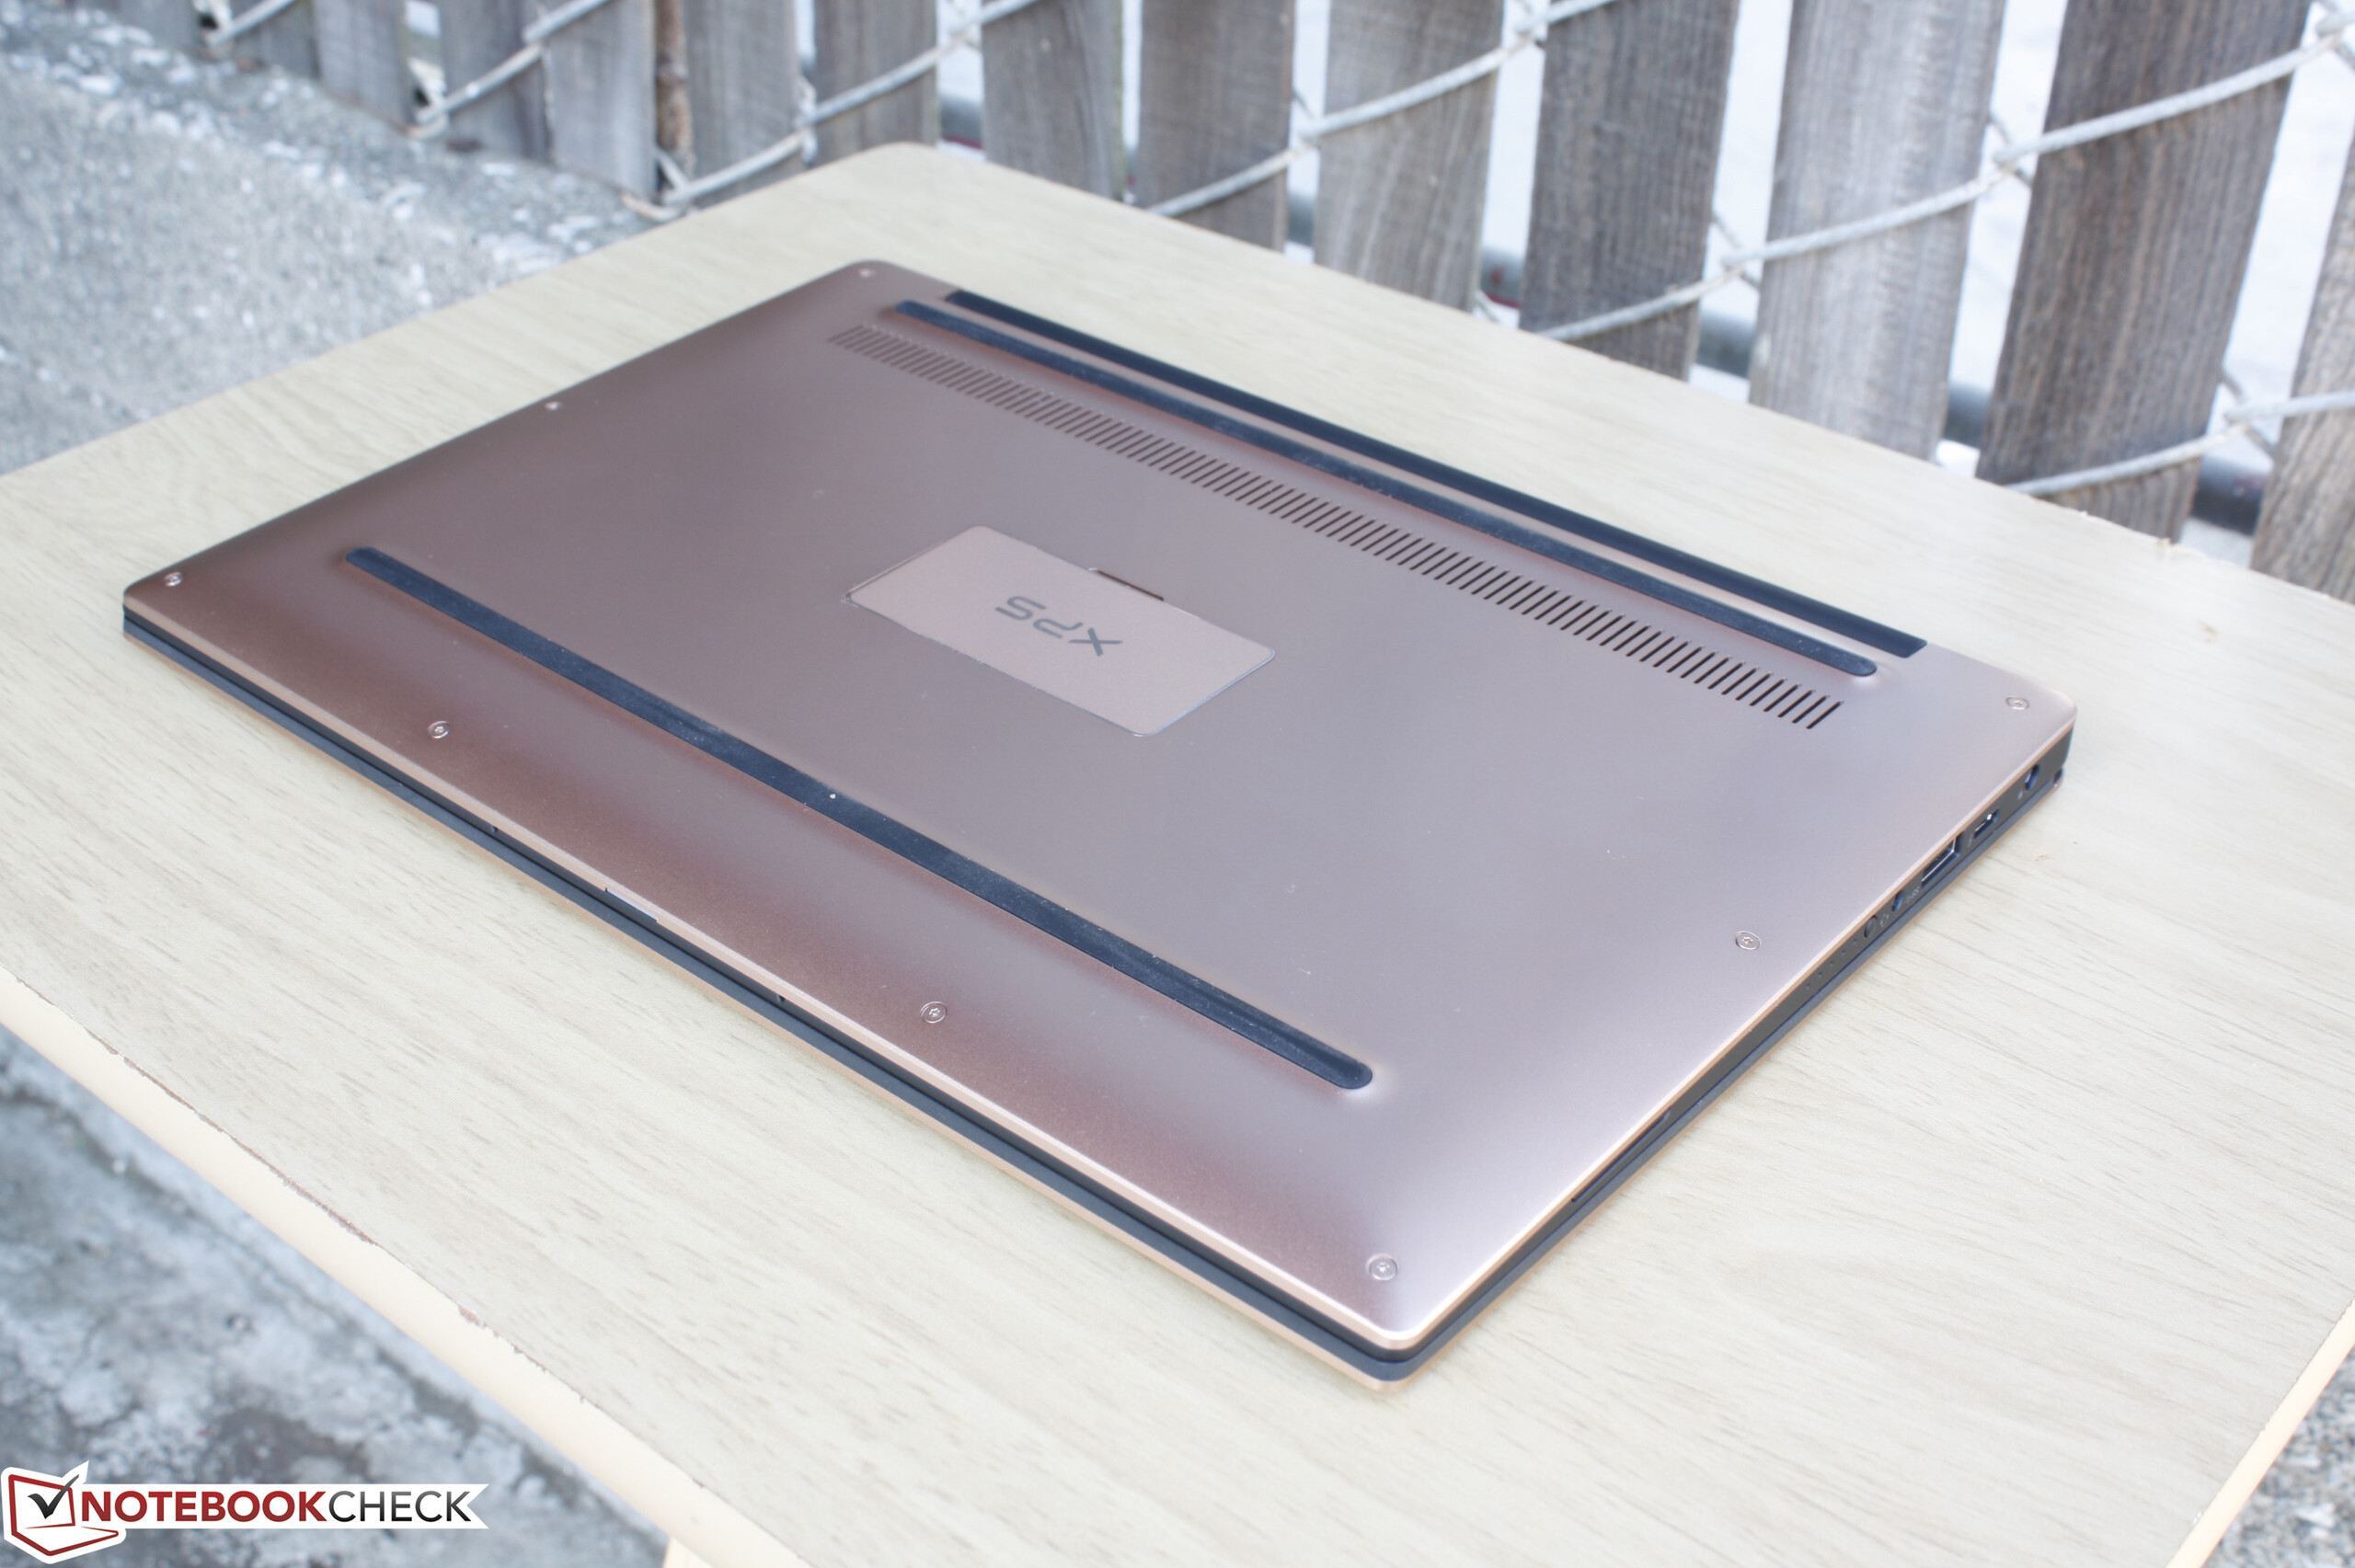
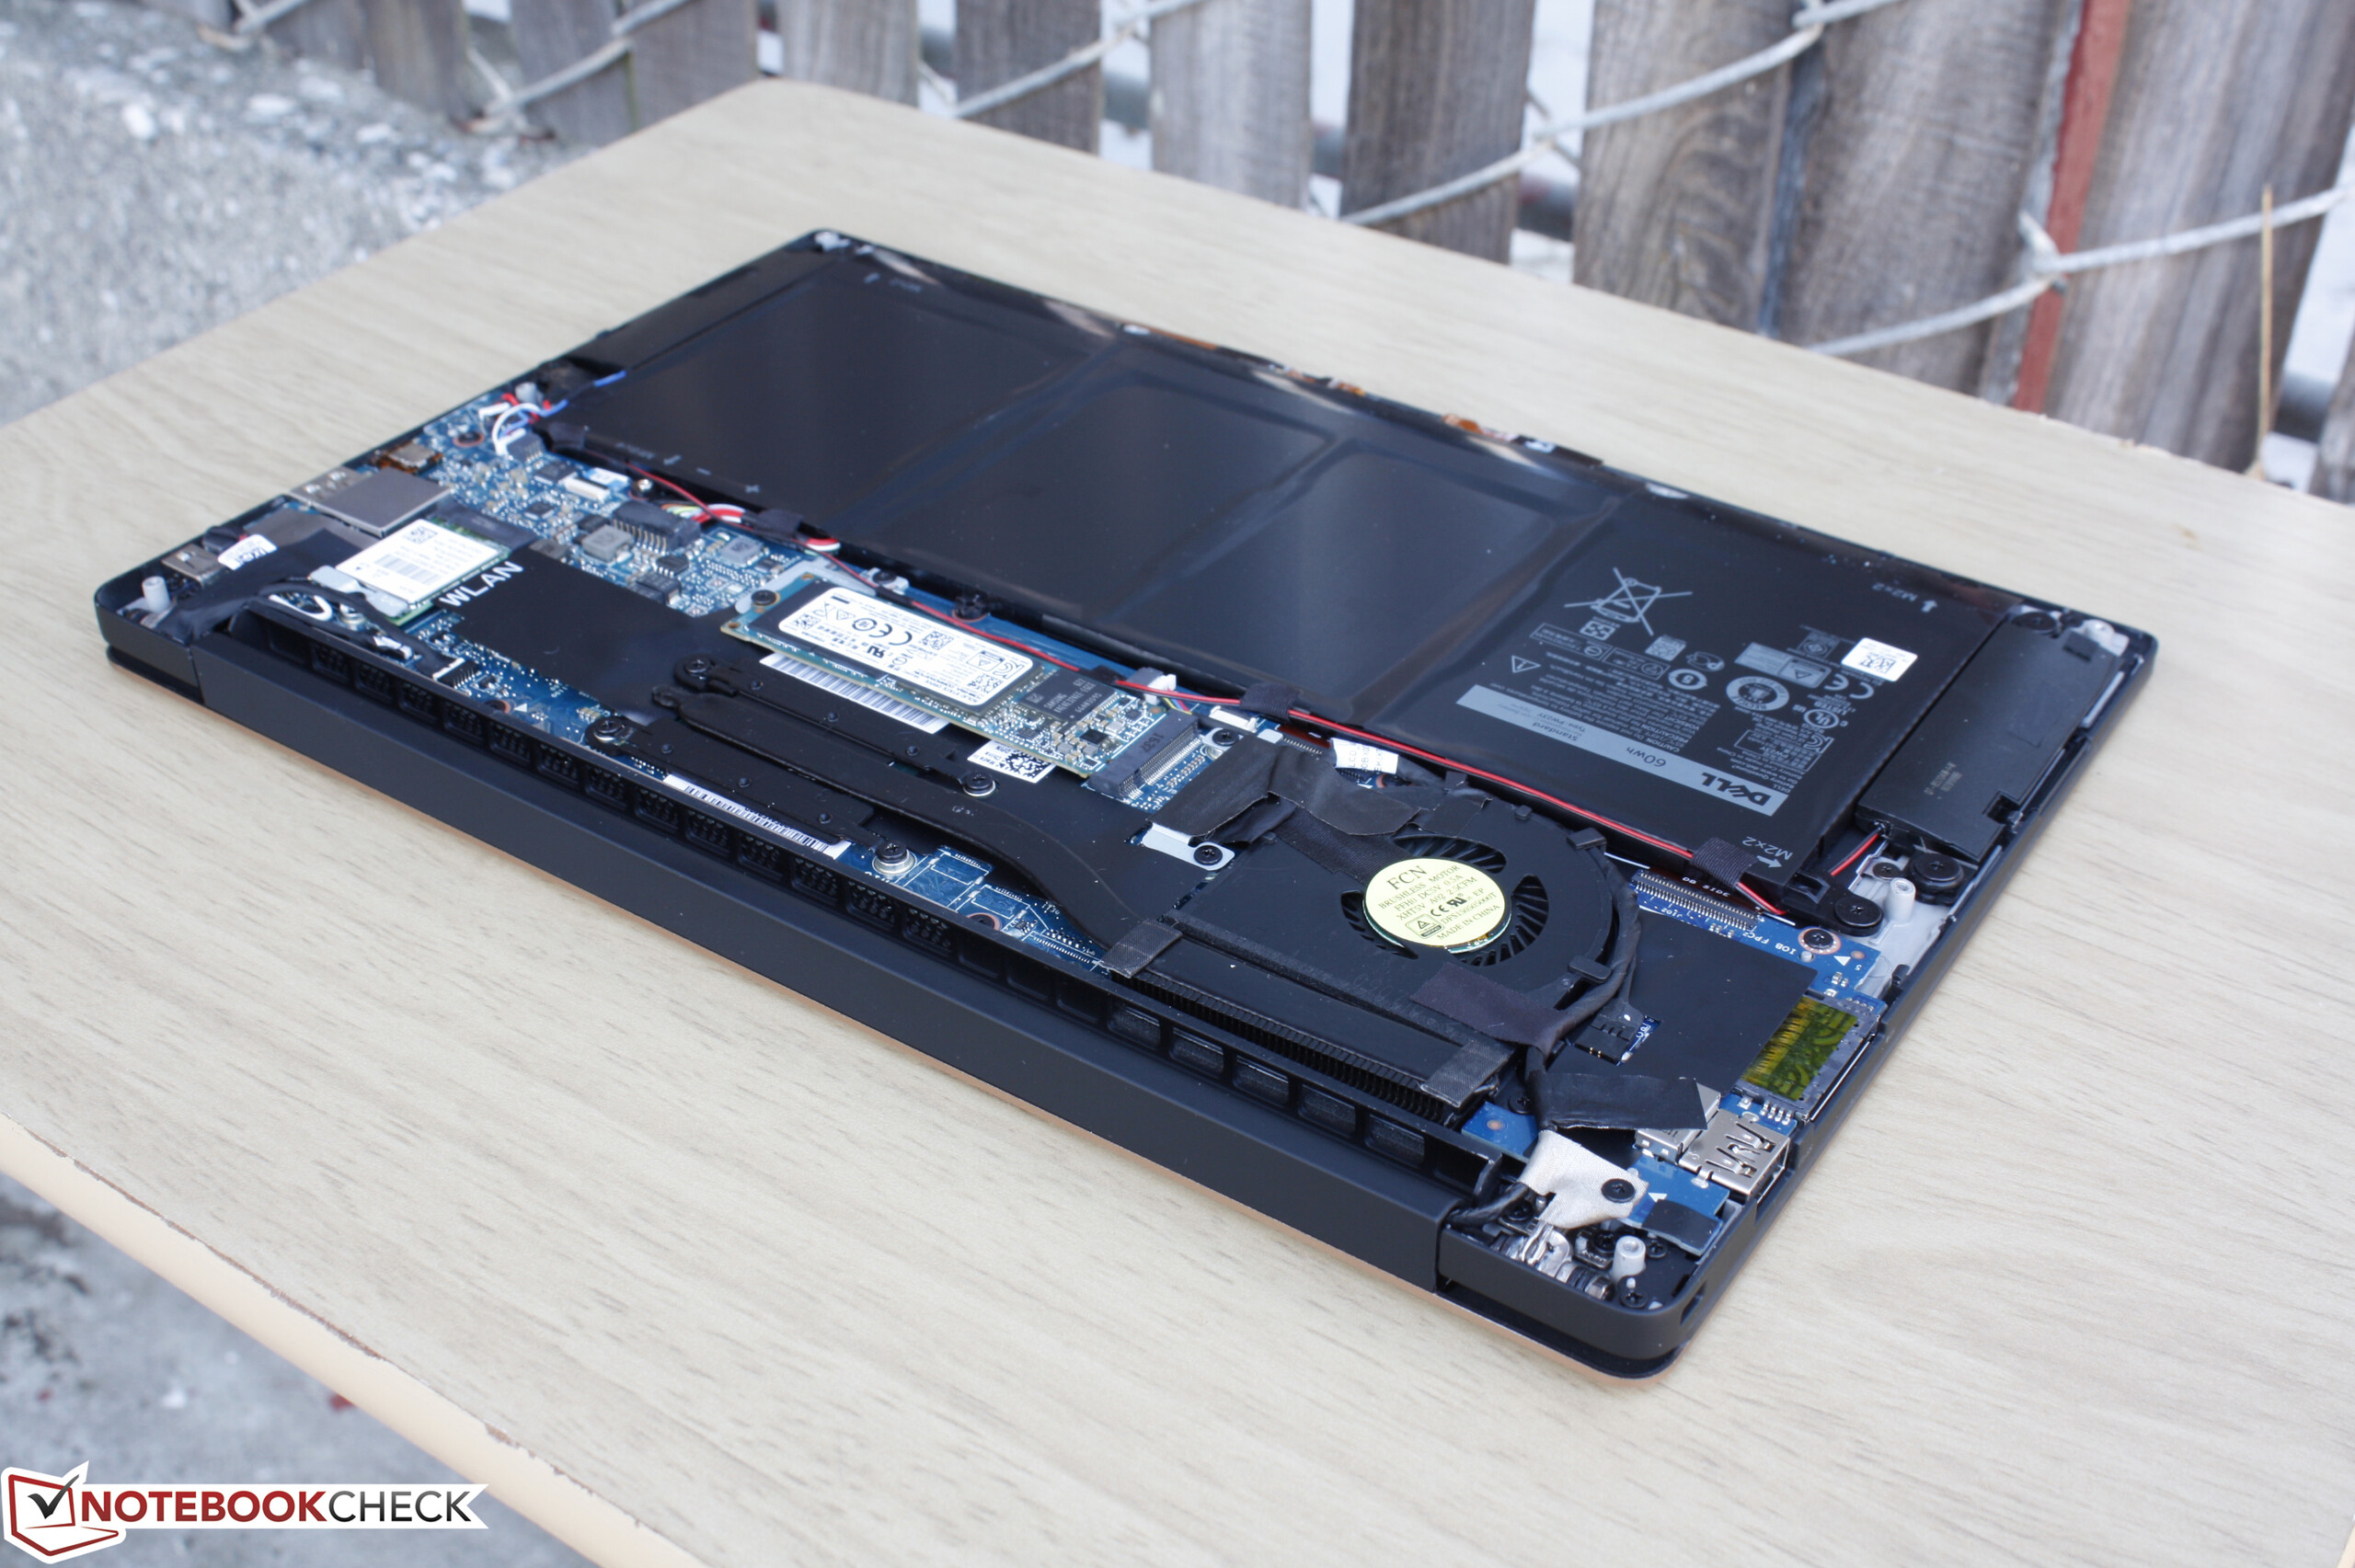
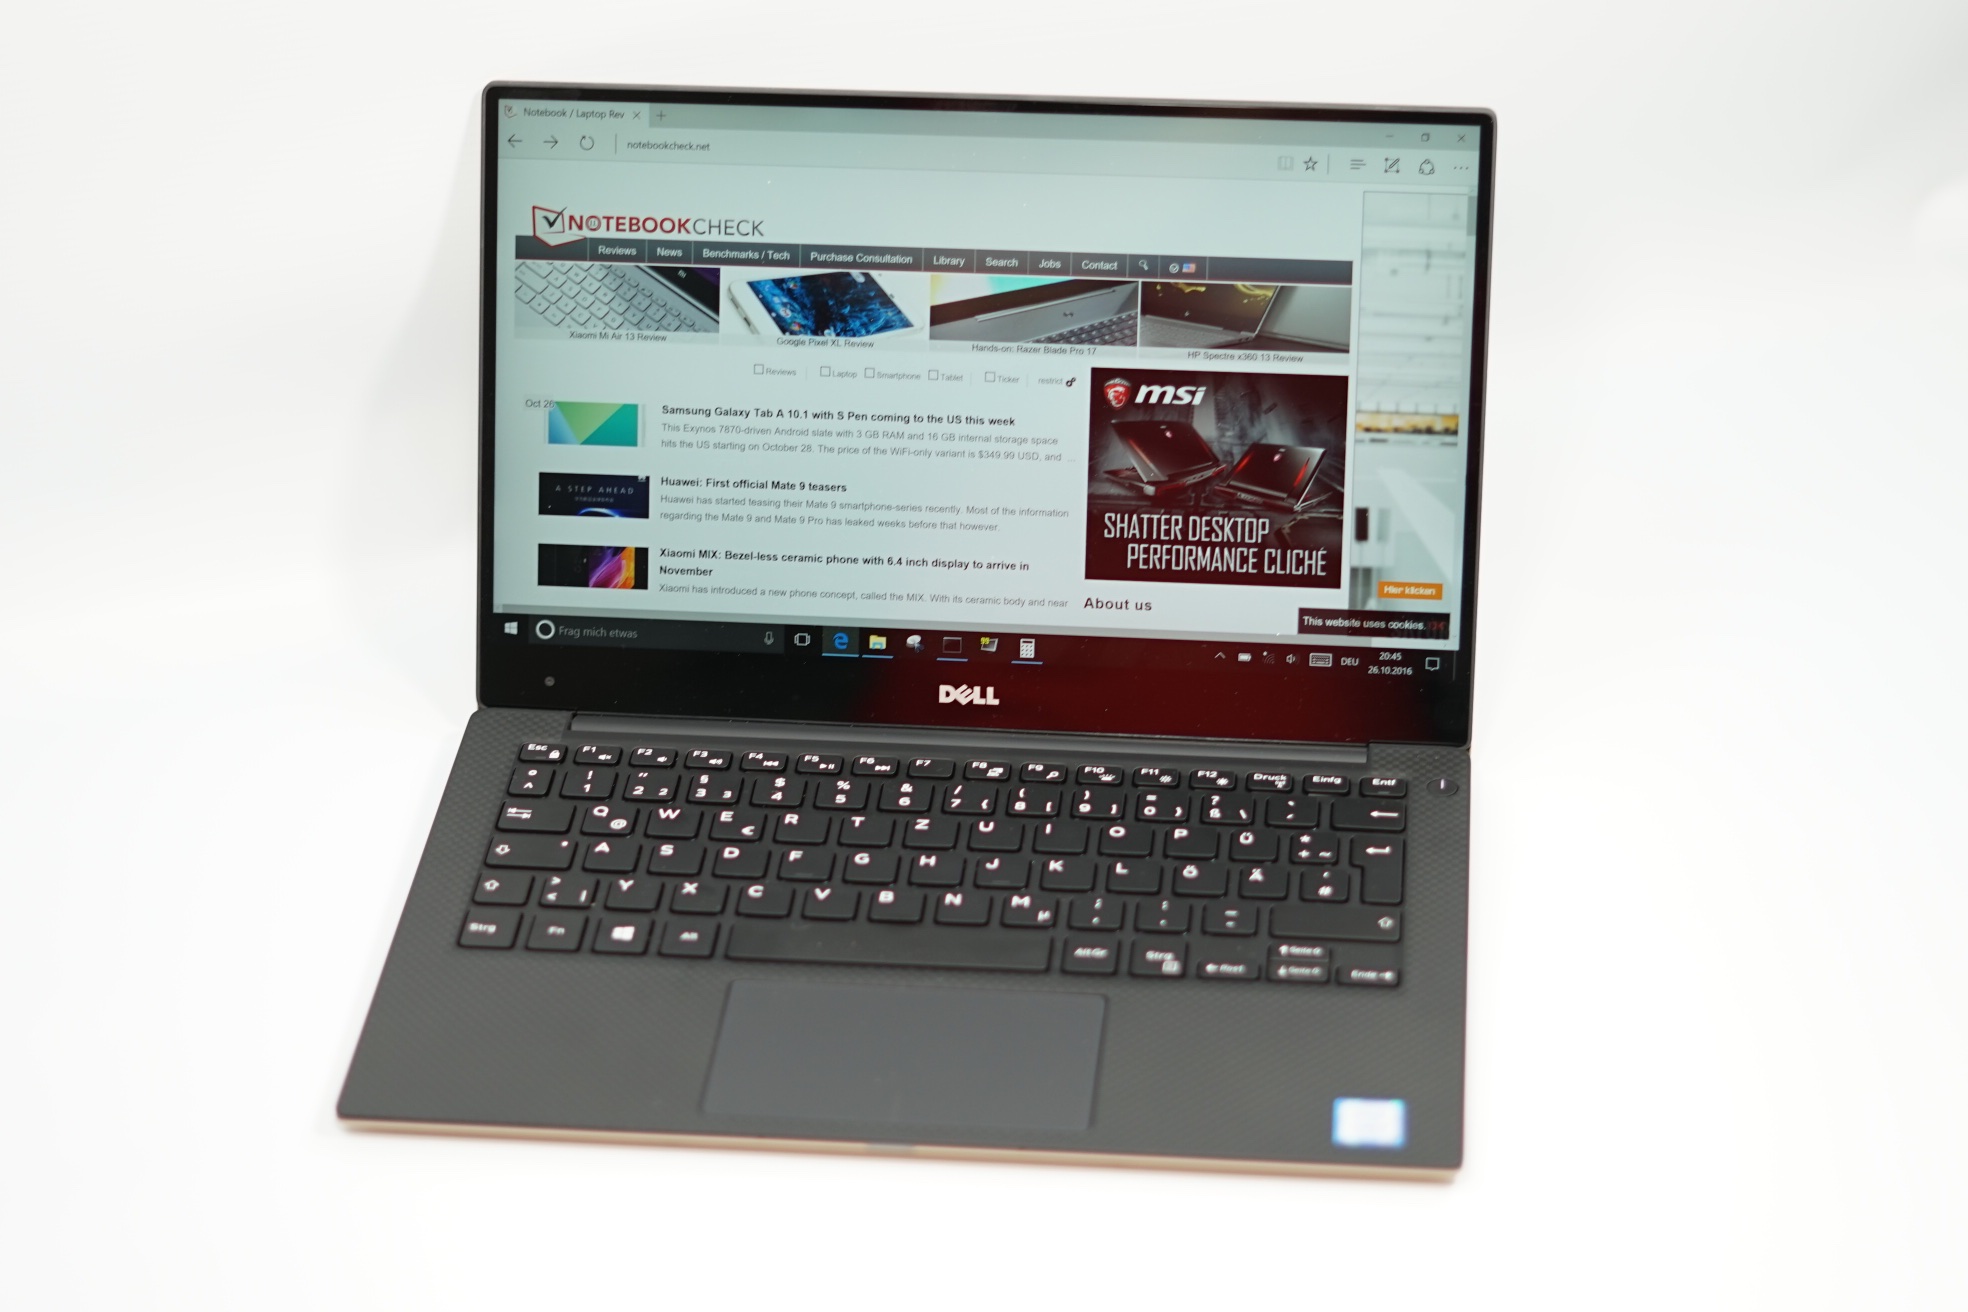
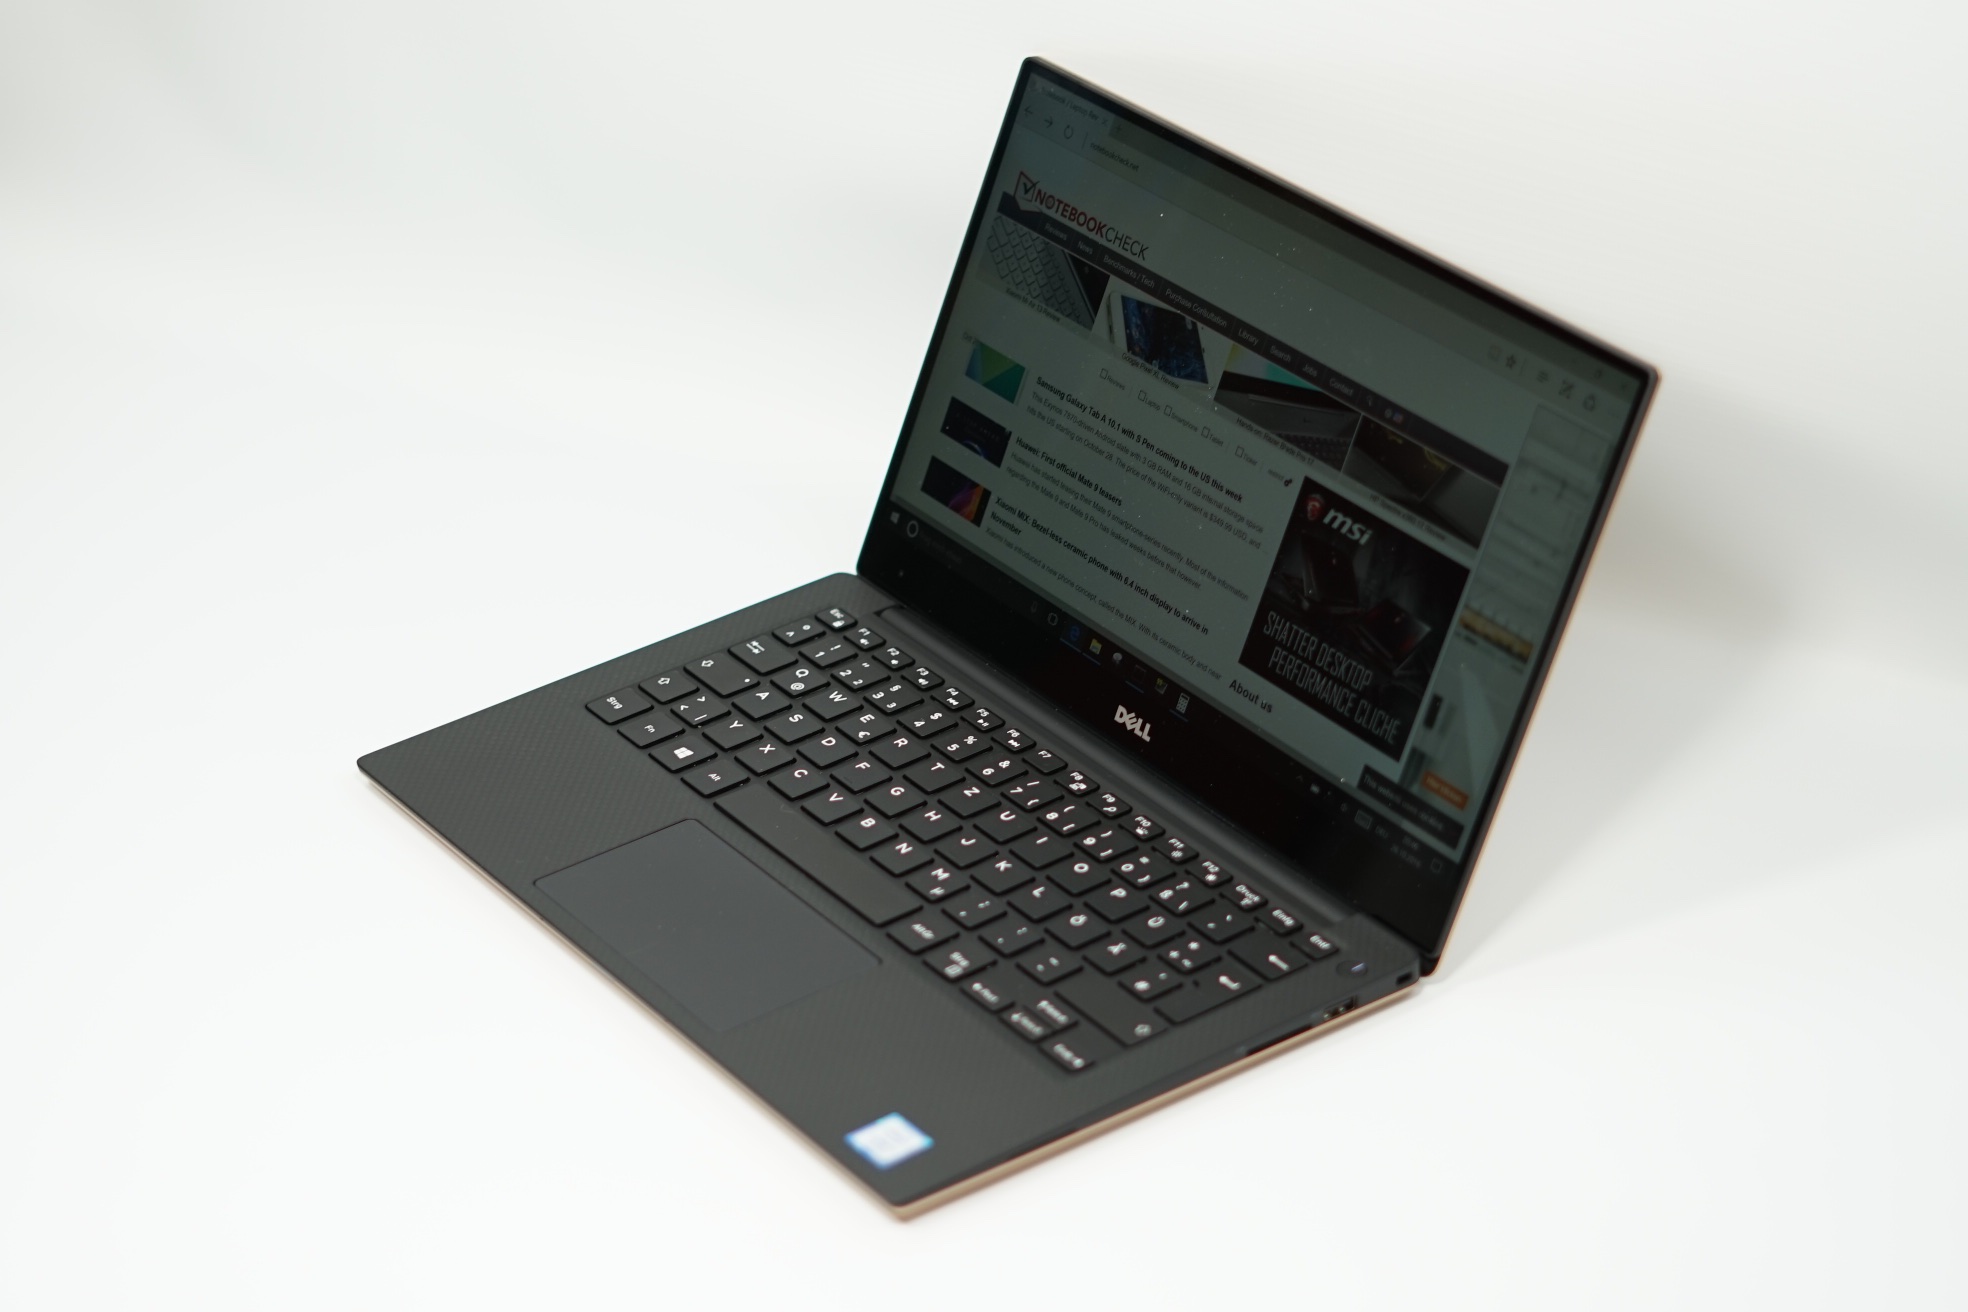
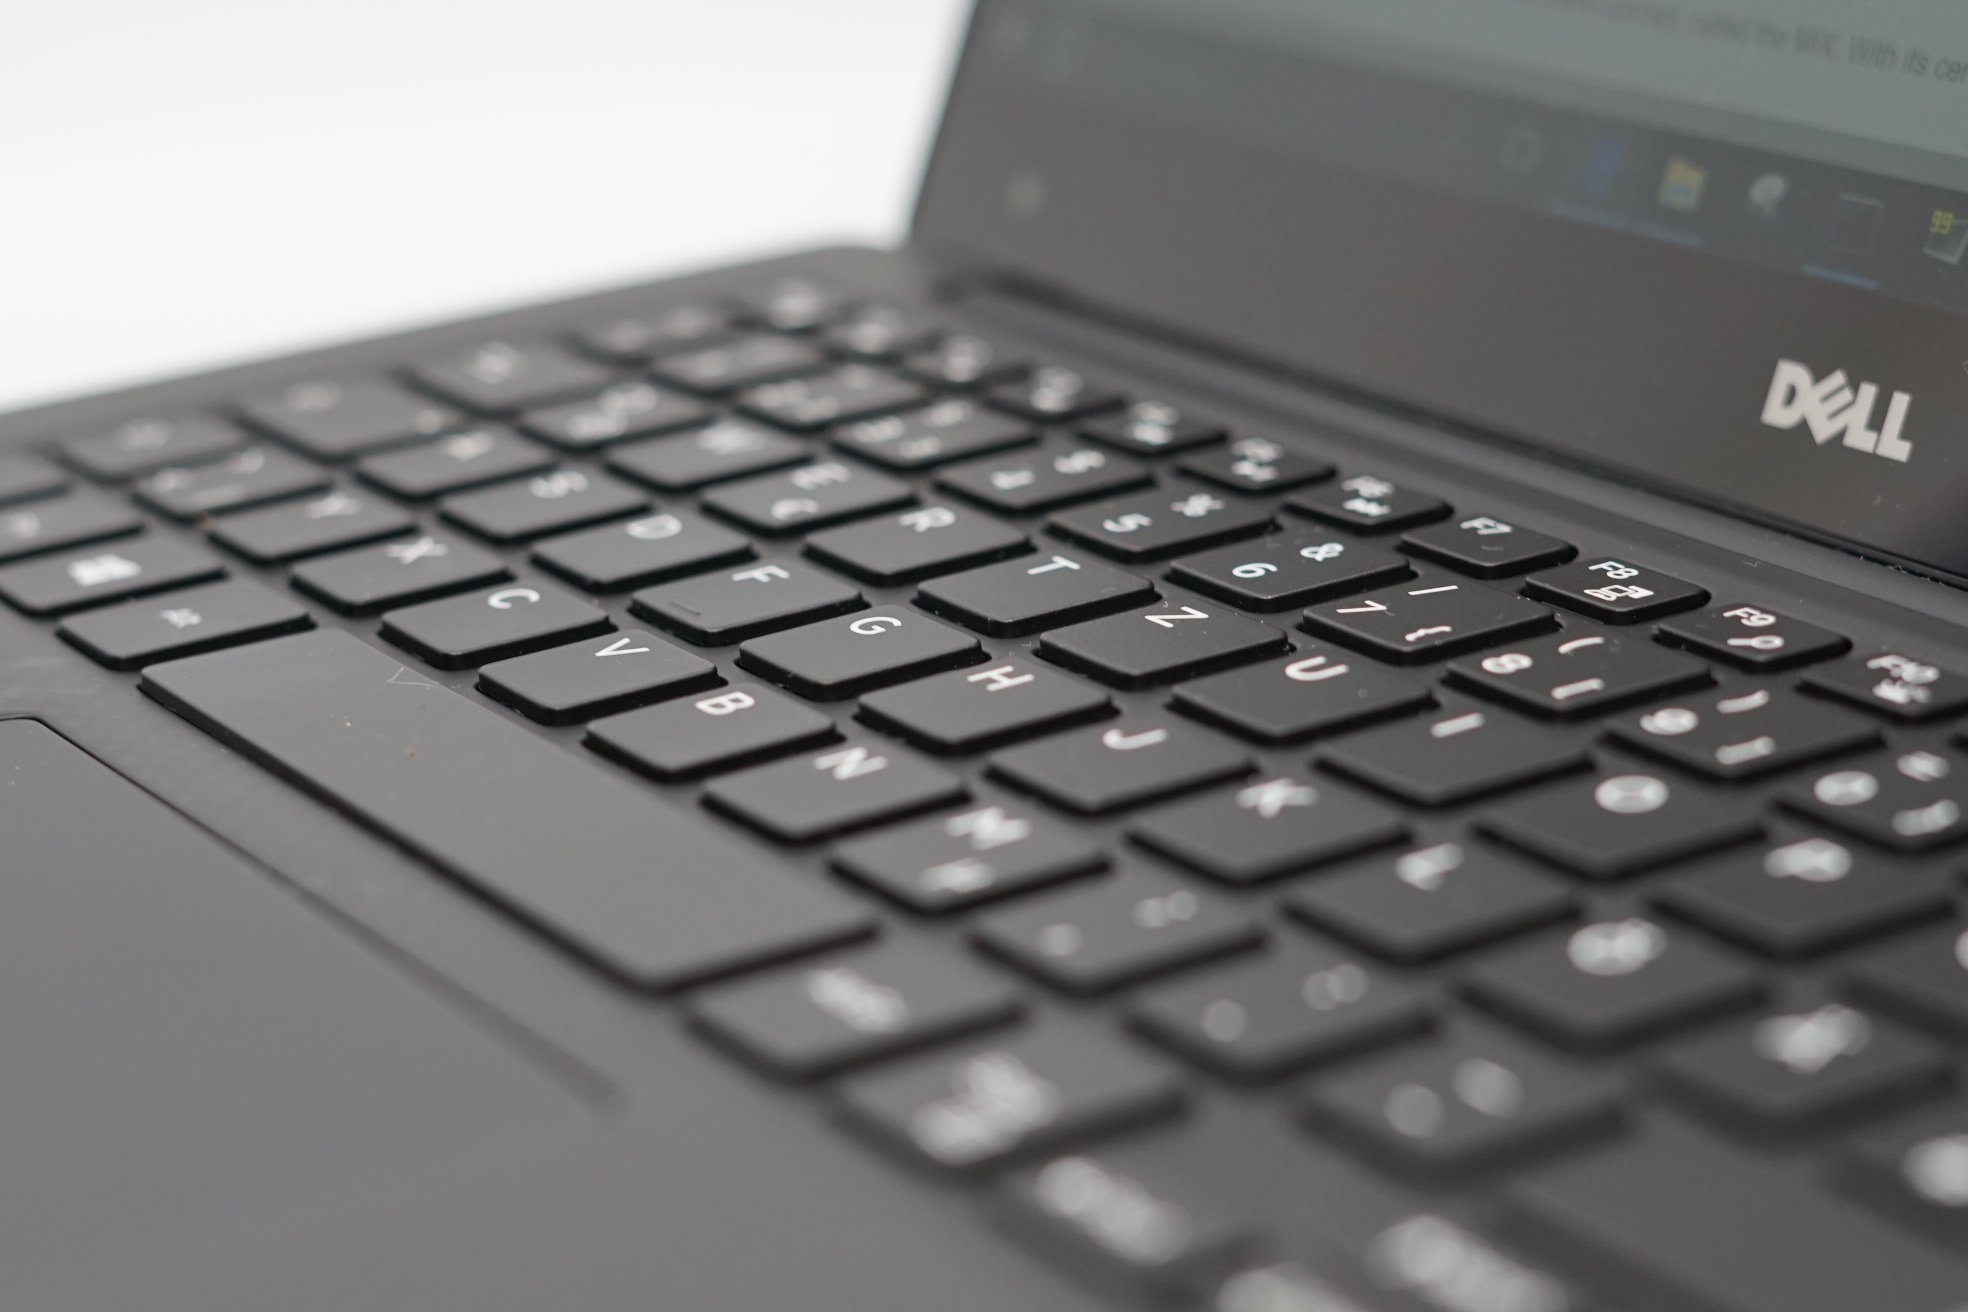
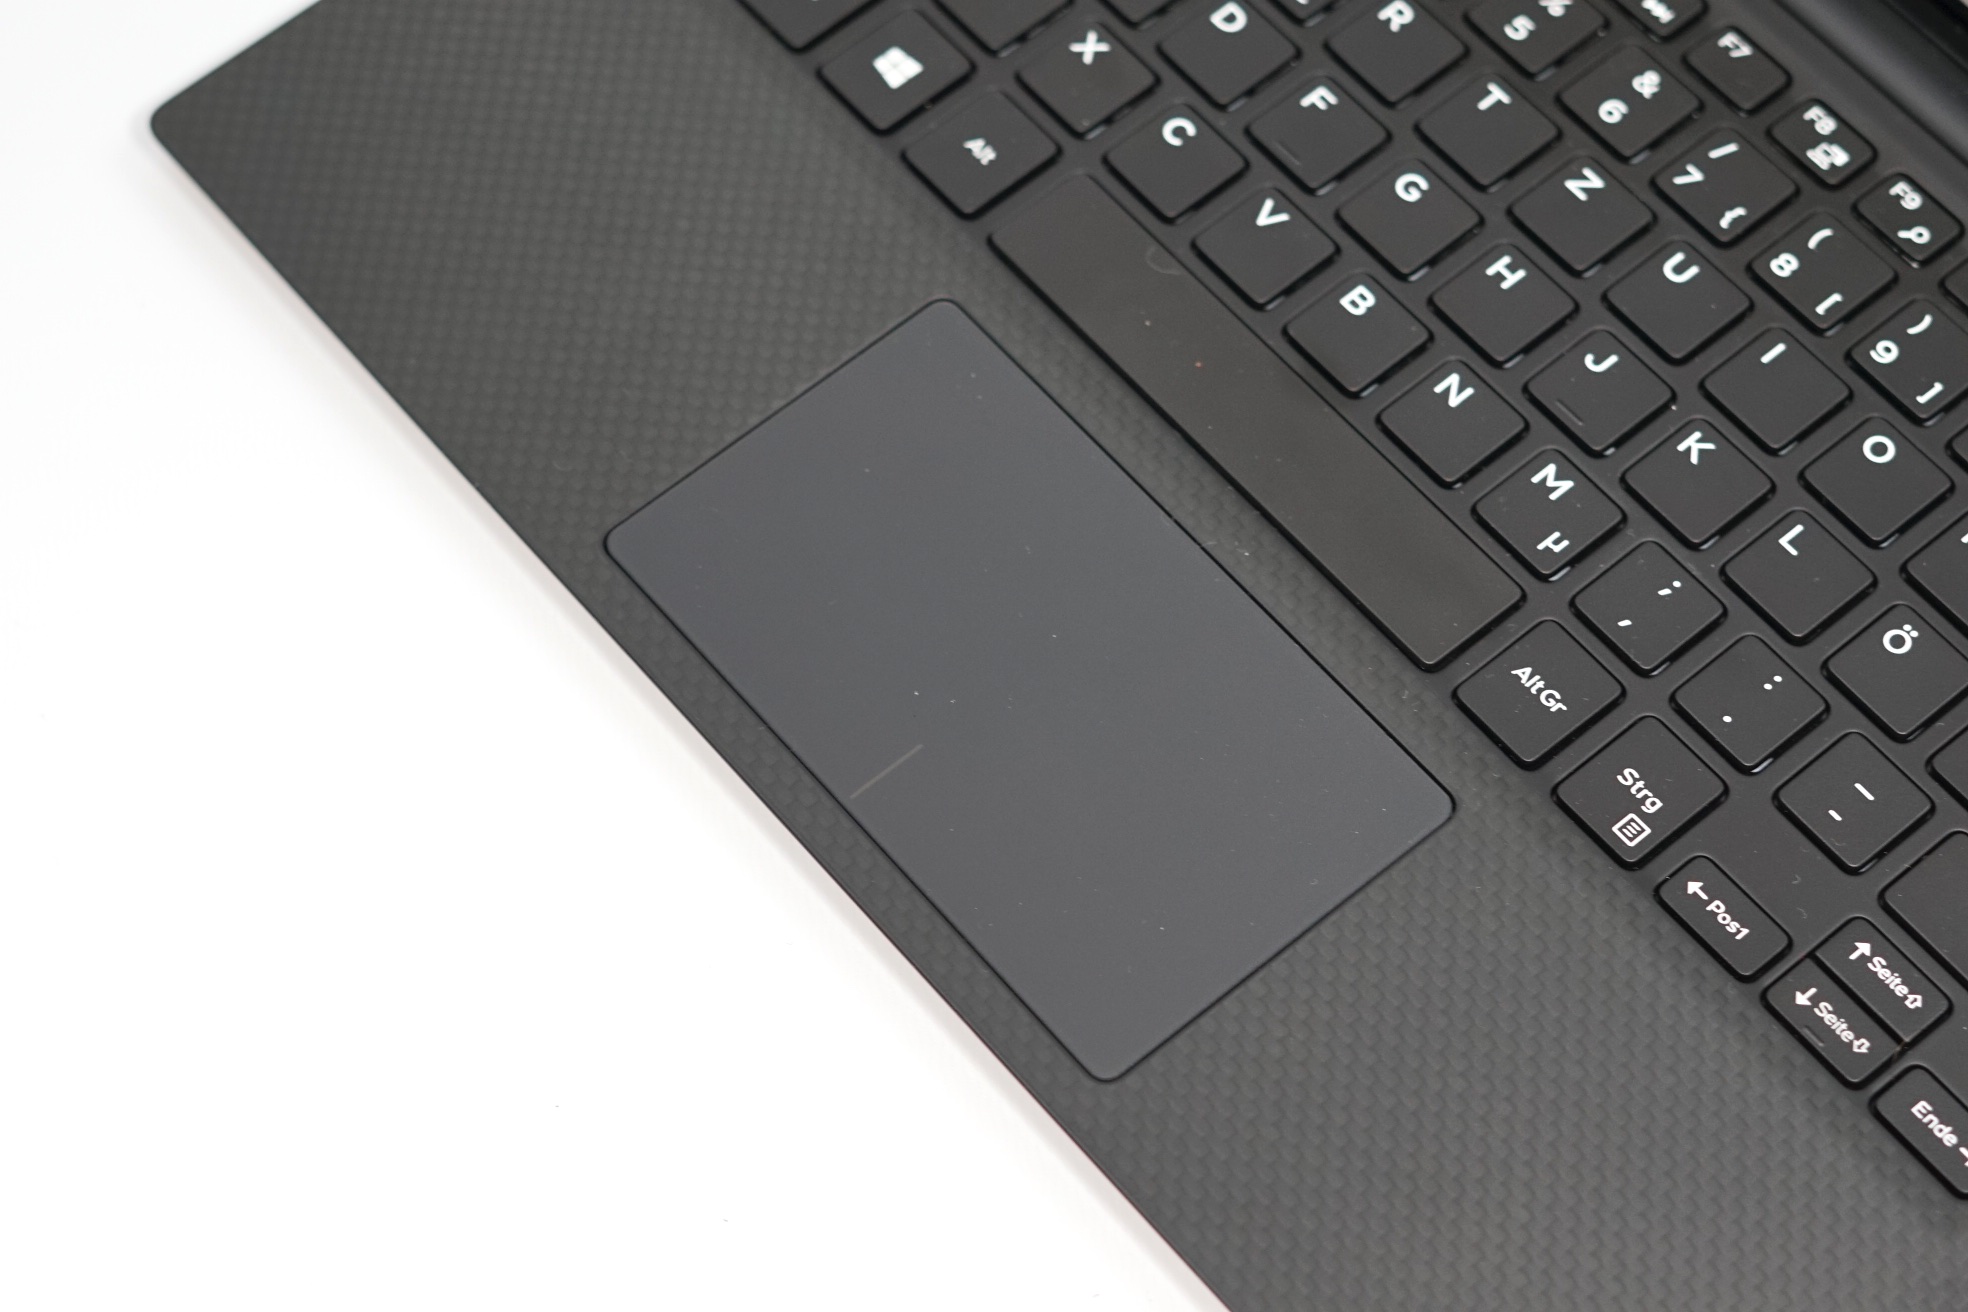
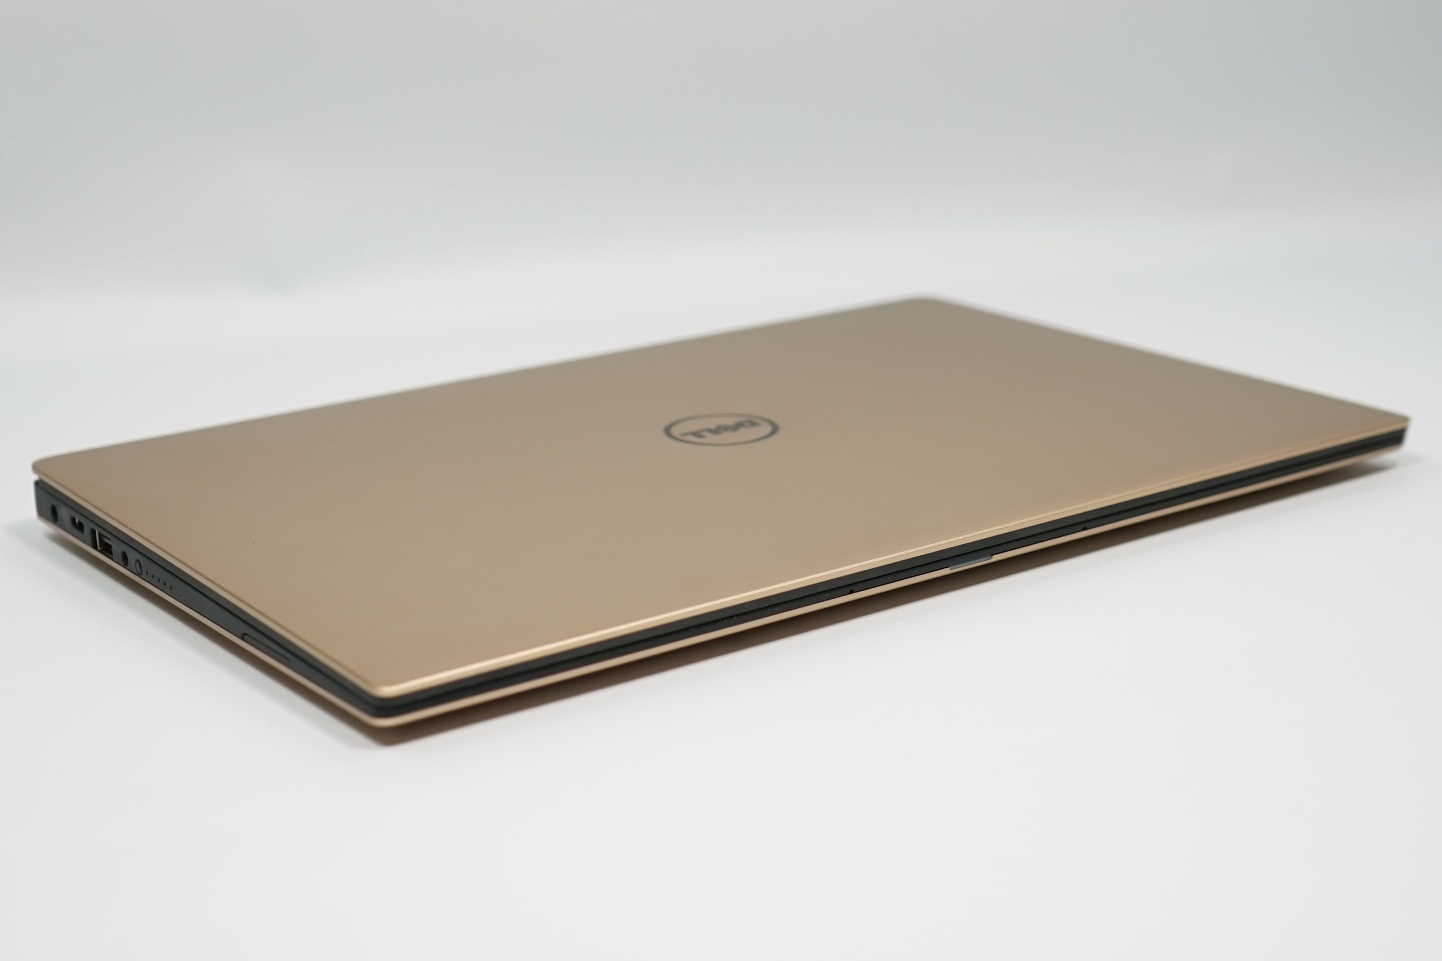
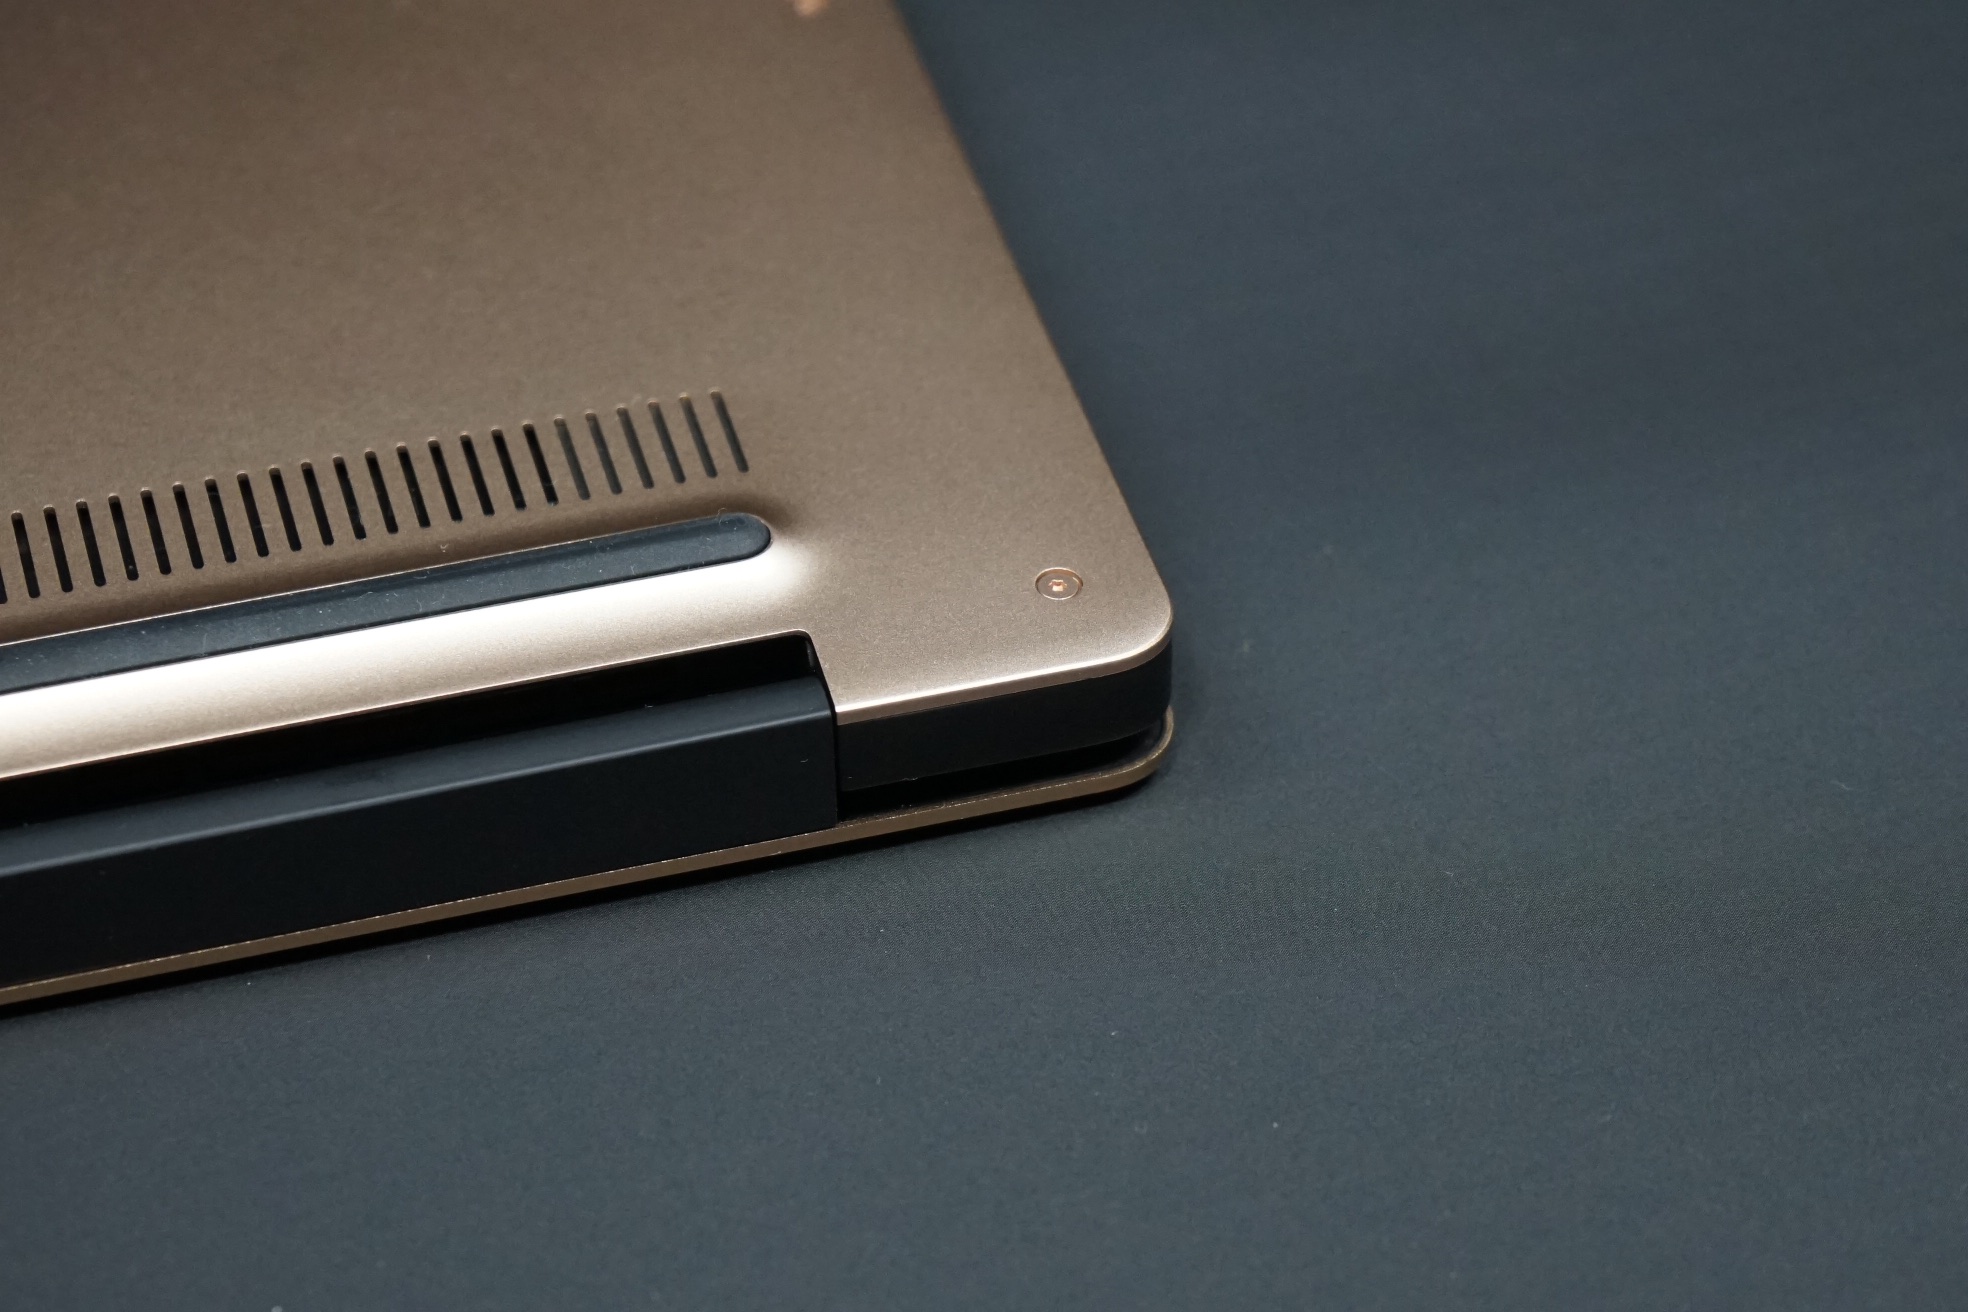
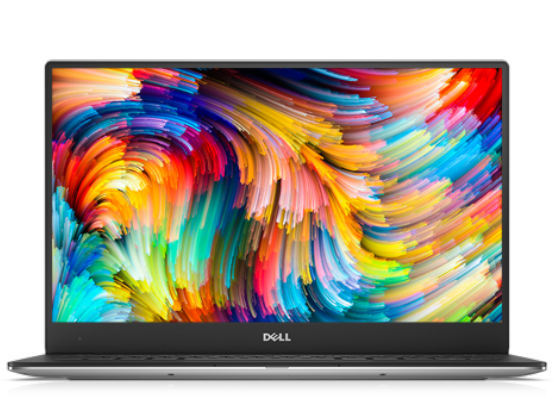
如果用户对360度旋屏幕或可拆卸设计不感冒的话,XPS 13依然是目前最优秀的13寸传统超极本之一。相对小巧的尺寸和高品质设计都是不容小觑的优势,同时超窄边框设计也得到了其他厂商的争相效仿,如即将上市的Yoga 910。尽管XPS 13没有什么变化,但它依然会是圣诞前市场上最有实力产品其中之一。
愿意为Kaby Lake XPS 13拿出更高预算的用户将会得到稍高的性能和电池续航。另一方面,即将退出市场的Skylake XPS 13则有更好的性价比。
注:本文是基于完整评测的缩减版本,阅读完整的英文评测,请点击这里。
Dell XPS 13 9360 QHD+ i7
- 11/22/2016 v5.1 (old)
Allen Ngo, Klaus Hinum
Price comparison
