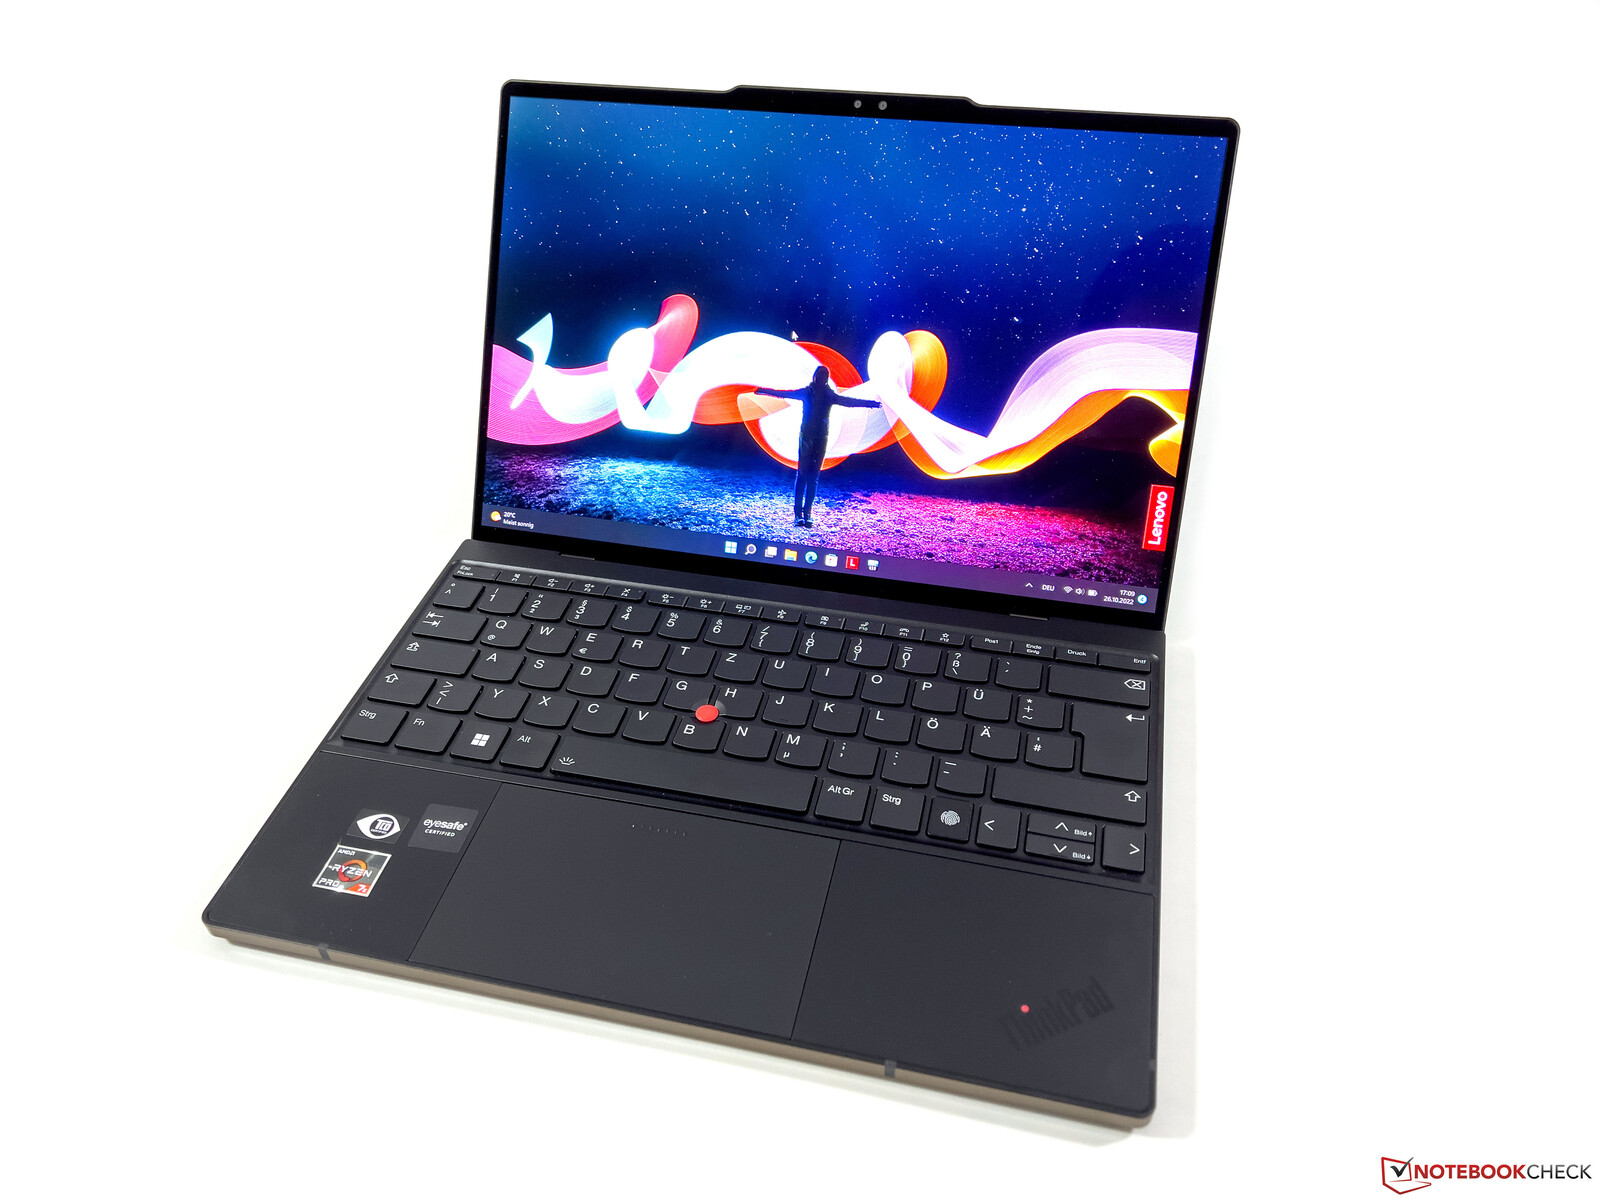
联想ThinkPad Z13 G1 OLED评测--配备AMD Ryzen 7 Pro 6860Z的商务笔记本电脑
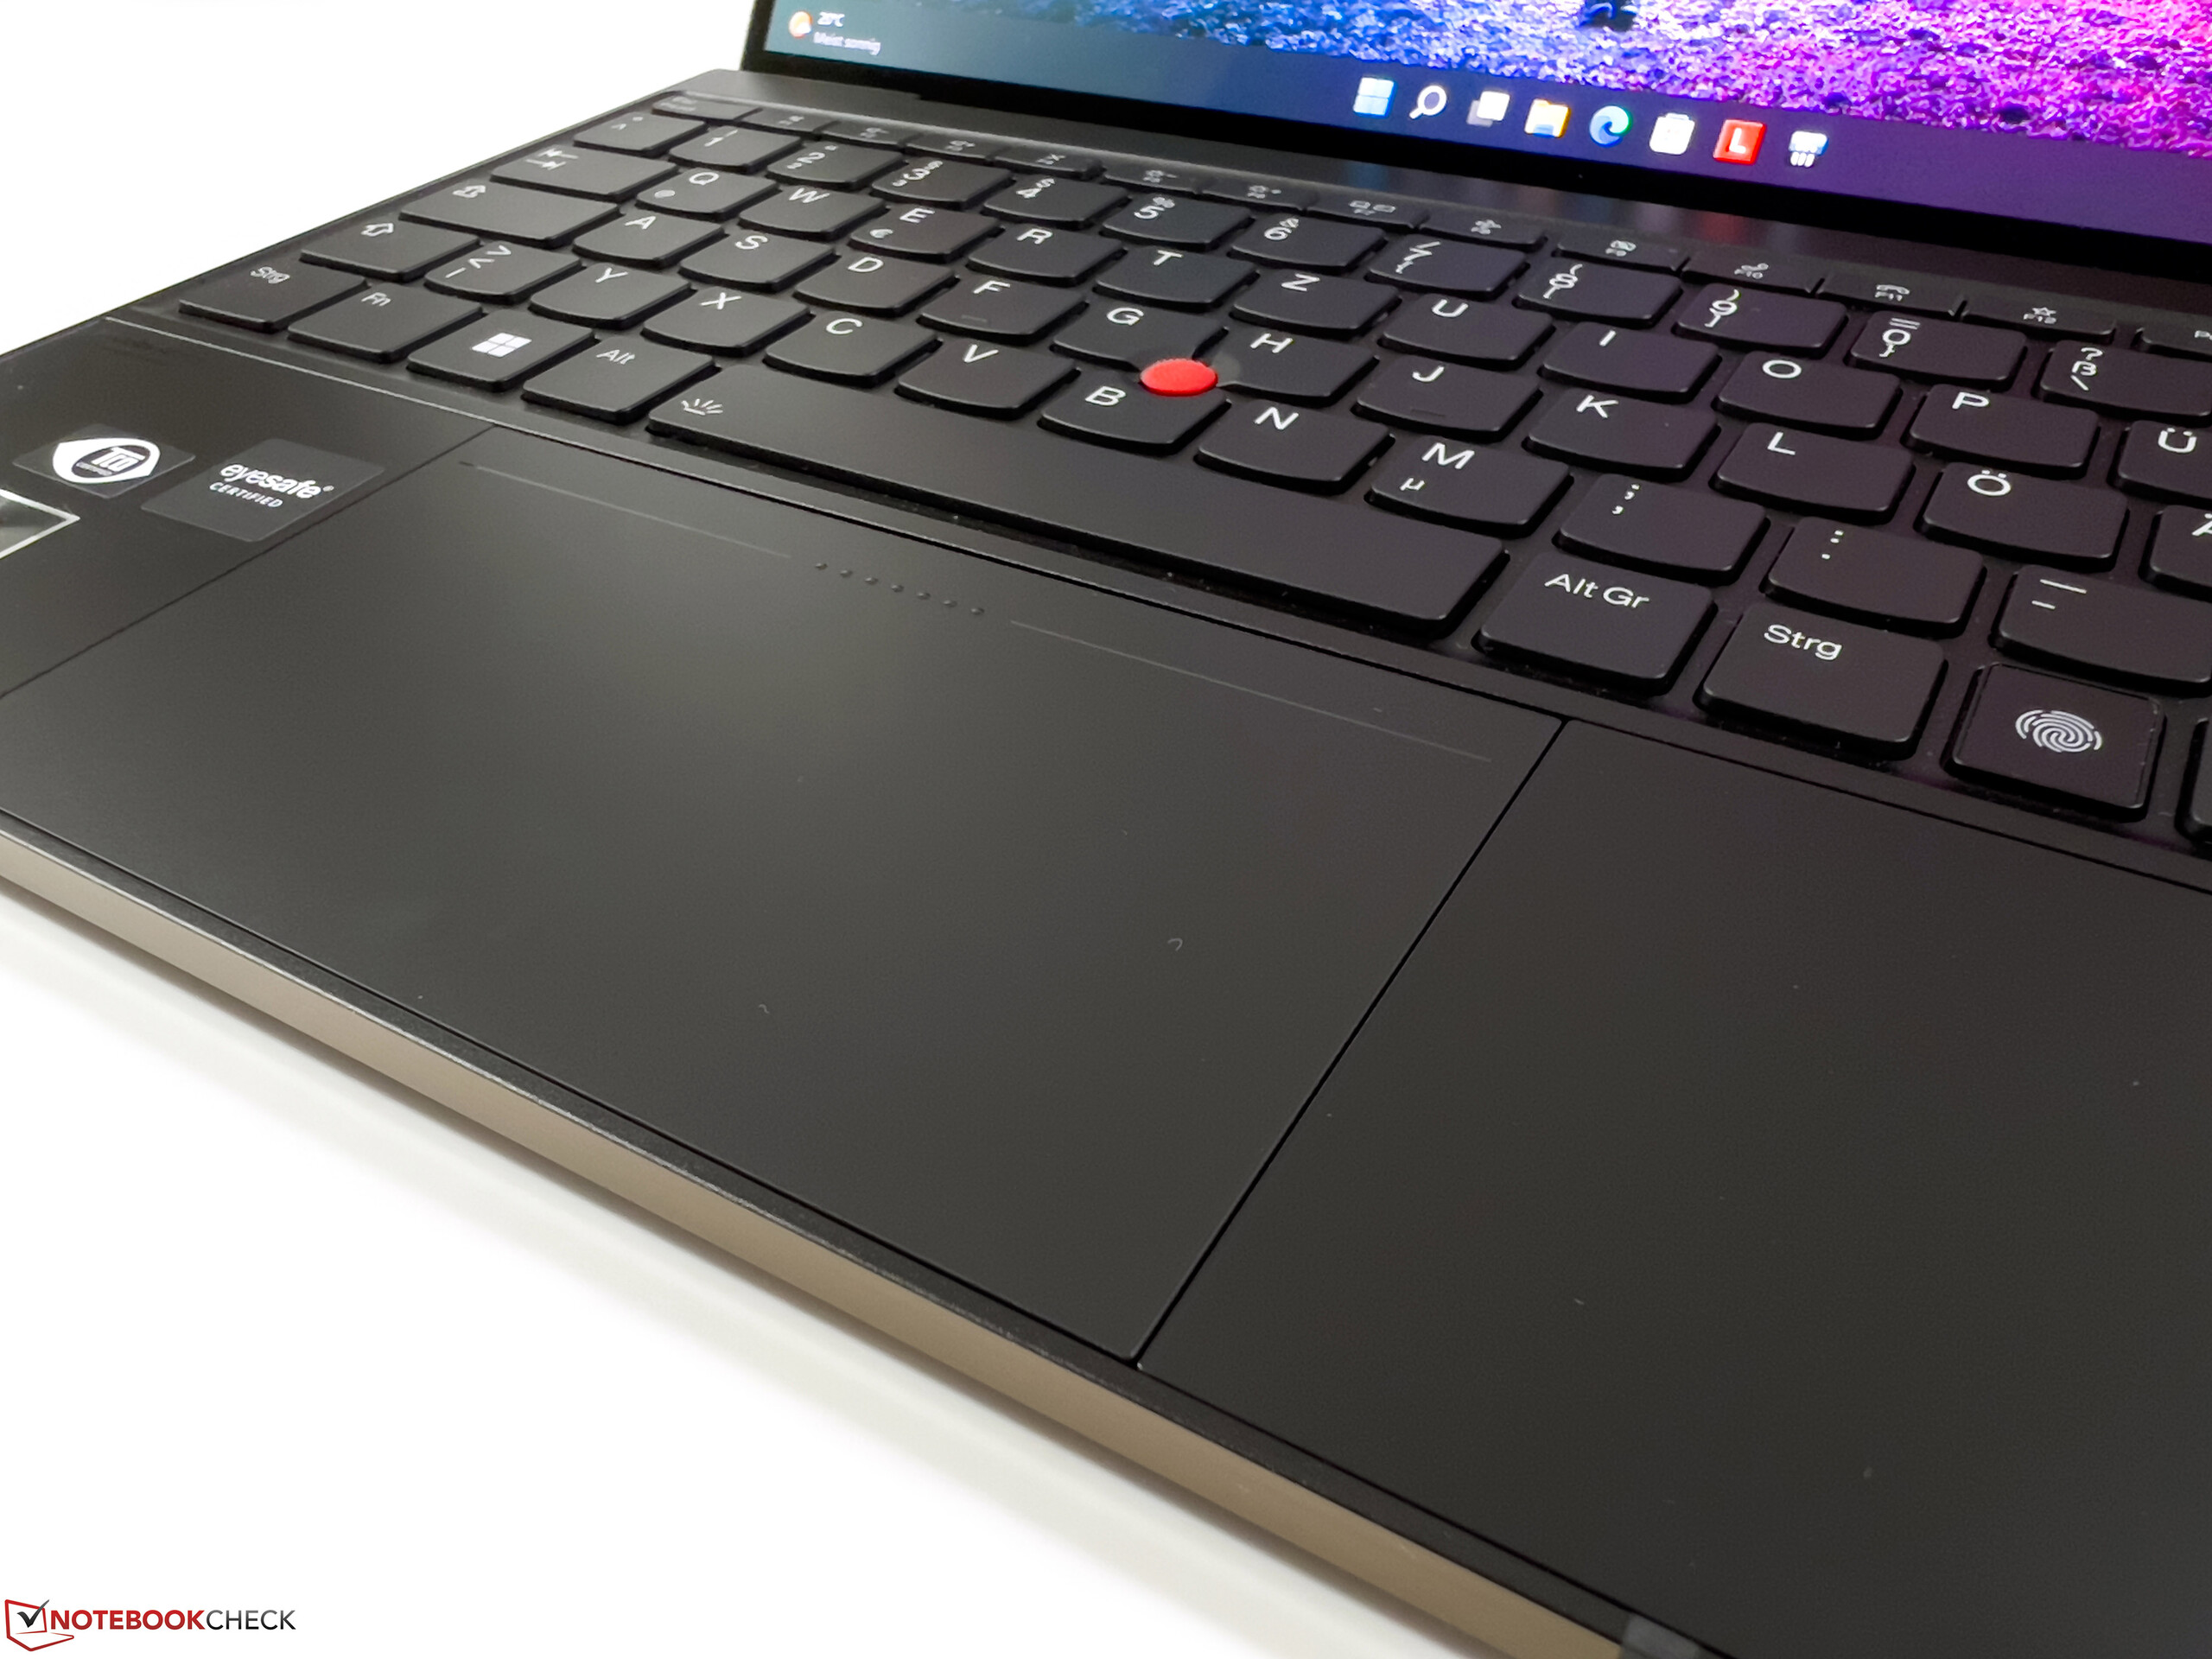
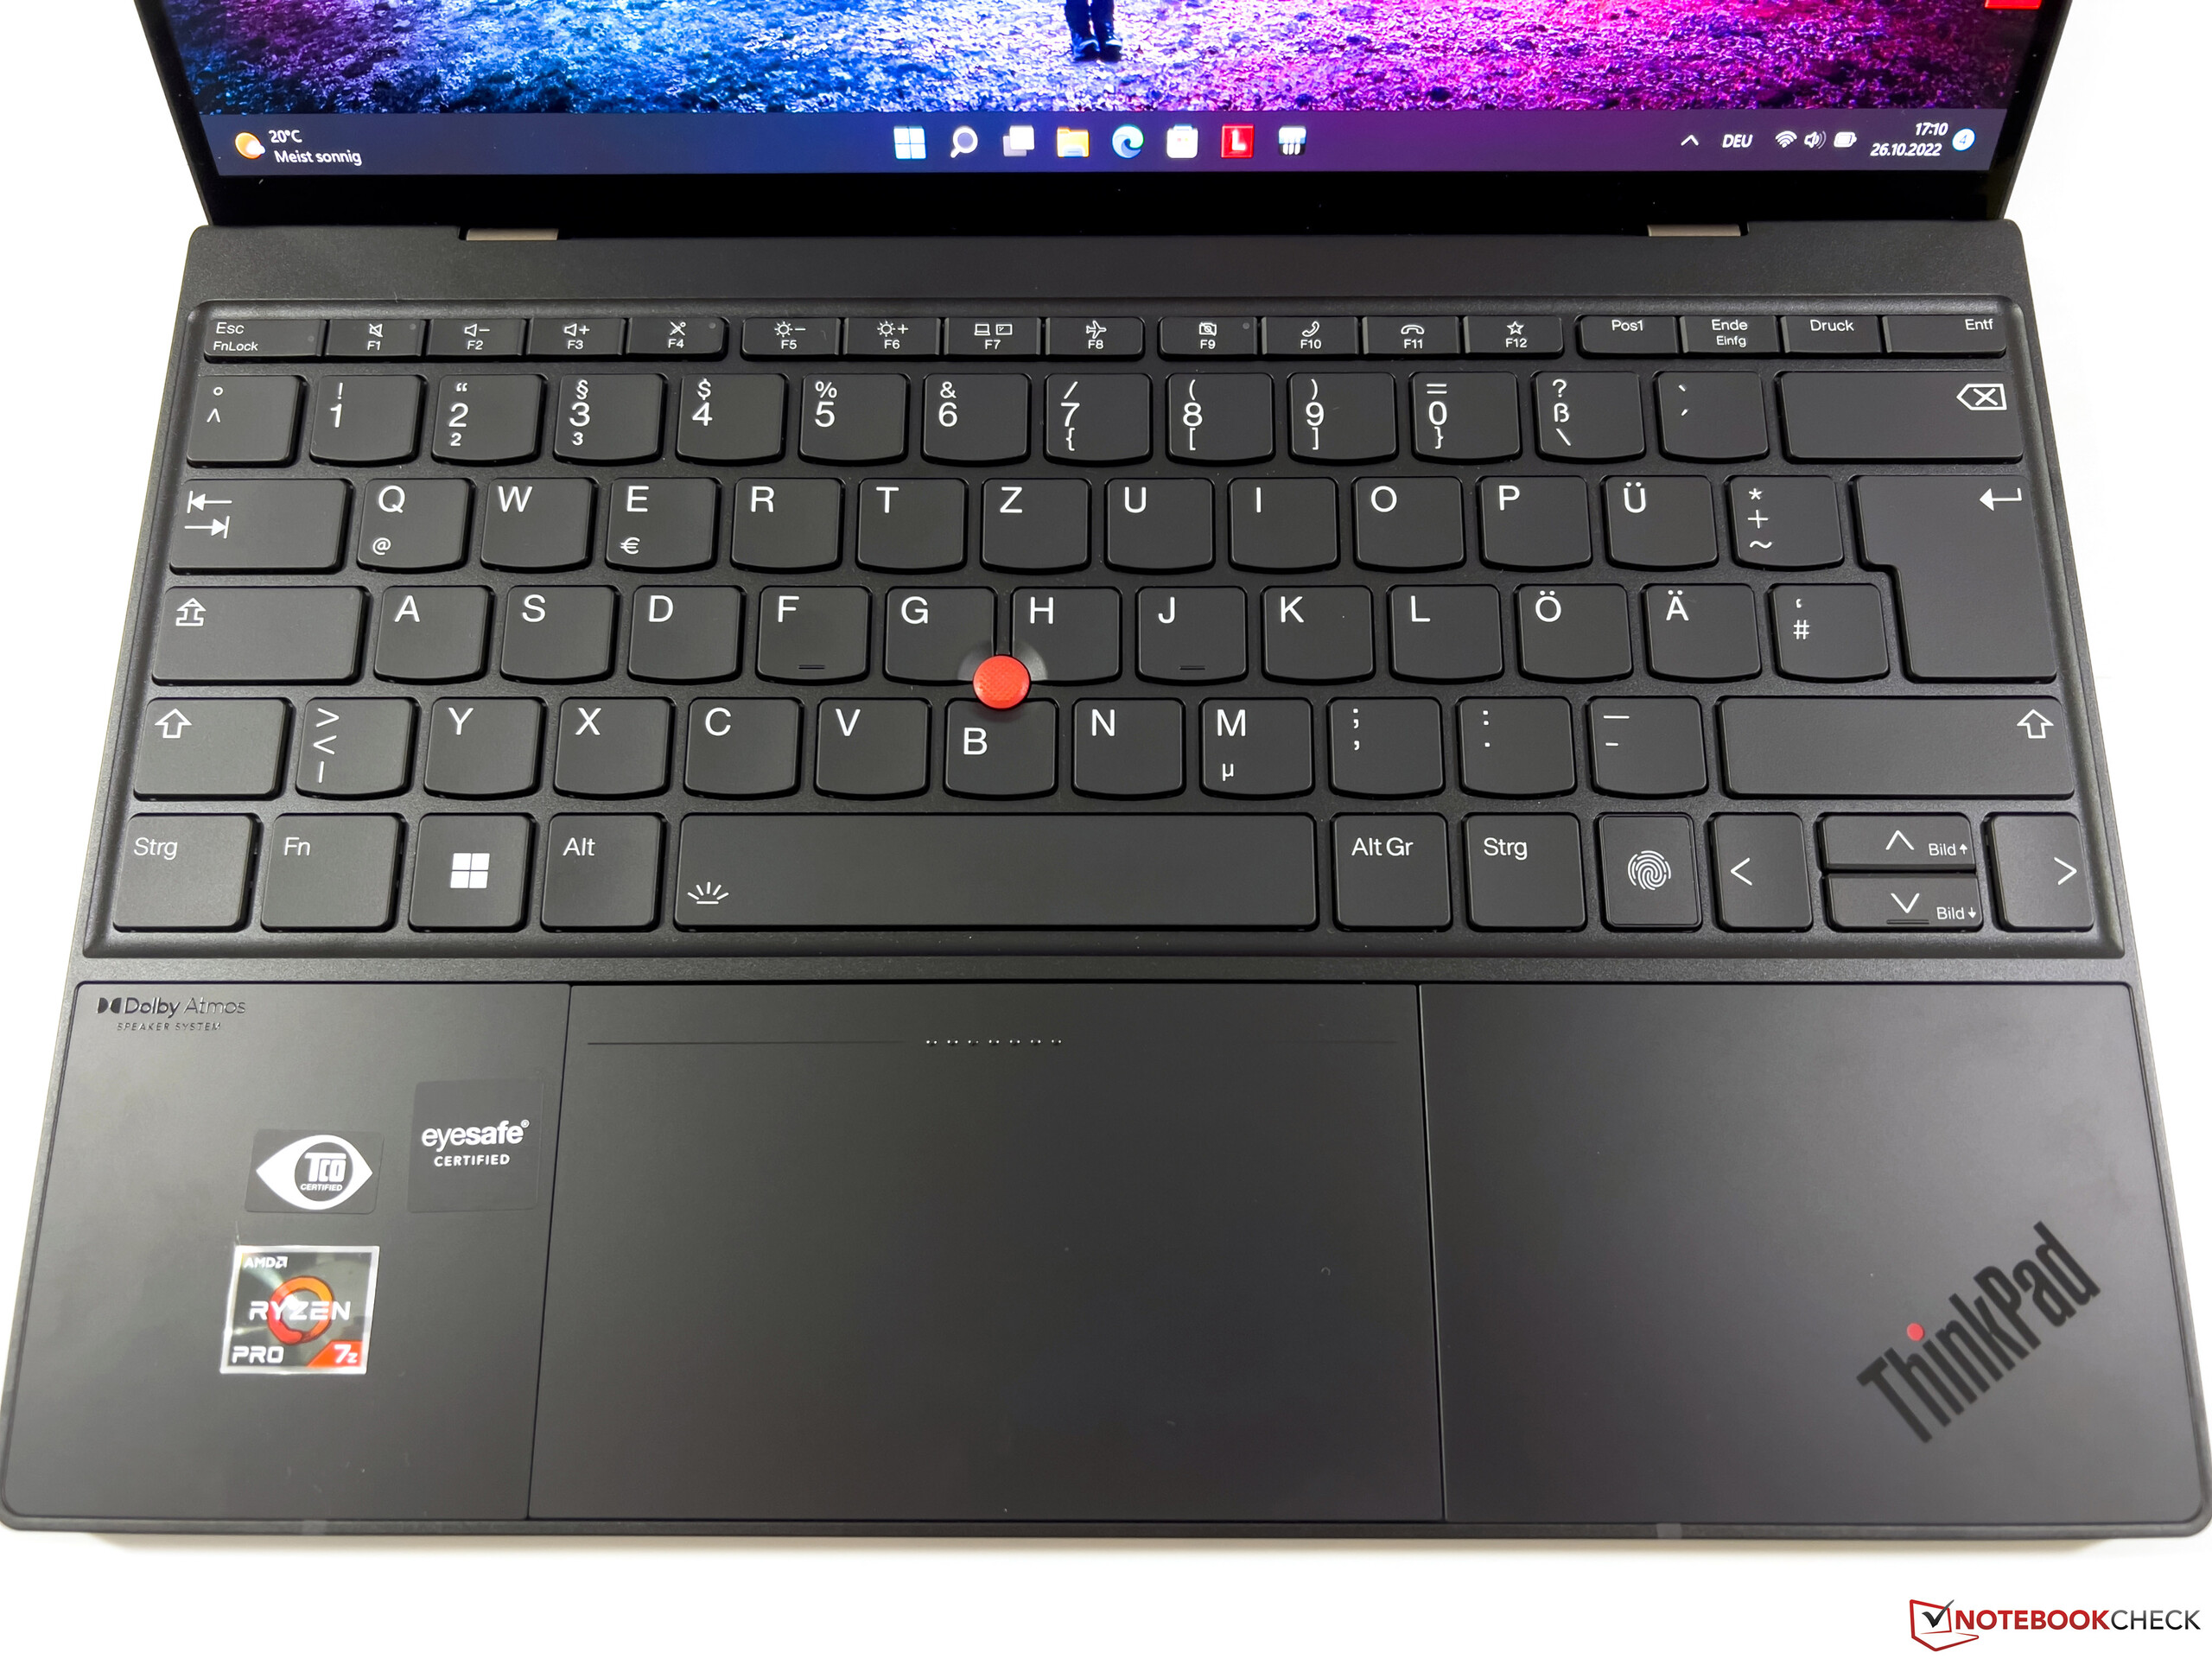
凭借其ThinkPad Z系列,联想几个月前就为其AMD机型建立了专门的产品系列。我们已经广泛地测试了 入门级型号的ThinkPad Z13配备Ryzen 5 Pro和普通全高清IPS面板。全新的设计提供了一些新的方法,ThinkPad的老用户将不得不适应一些变化(TrackPoint没有专用键,铰链只能打开到135度,Fn键的位置重新调整,没有Kensington锁)。
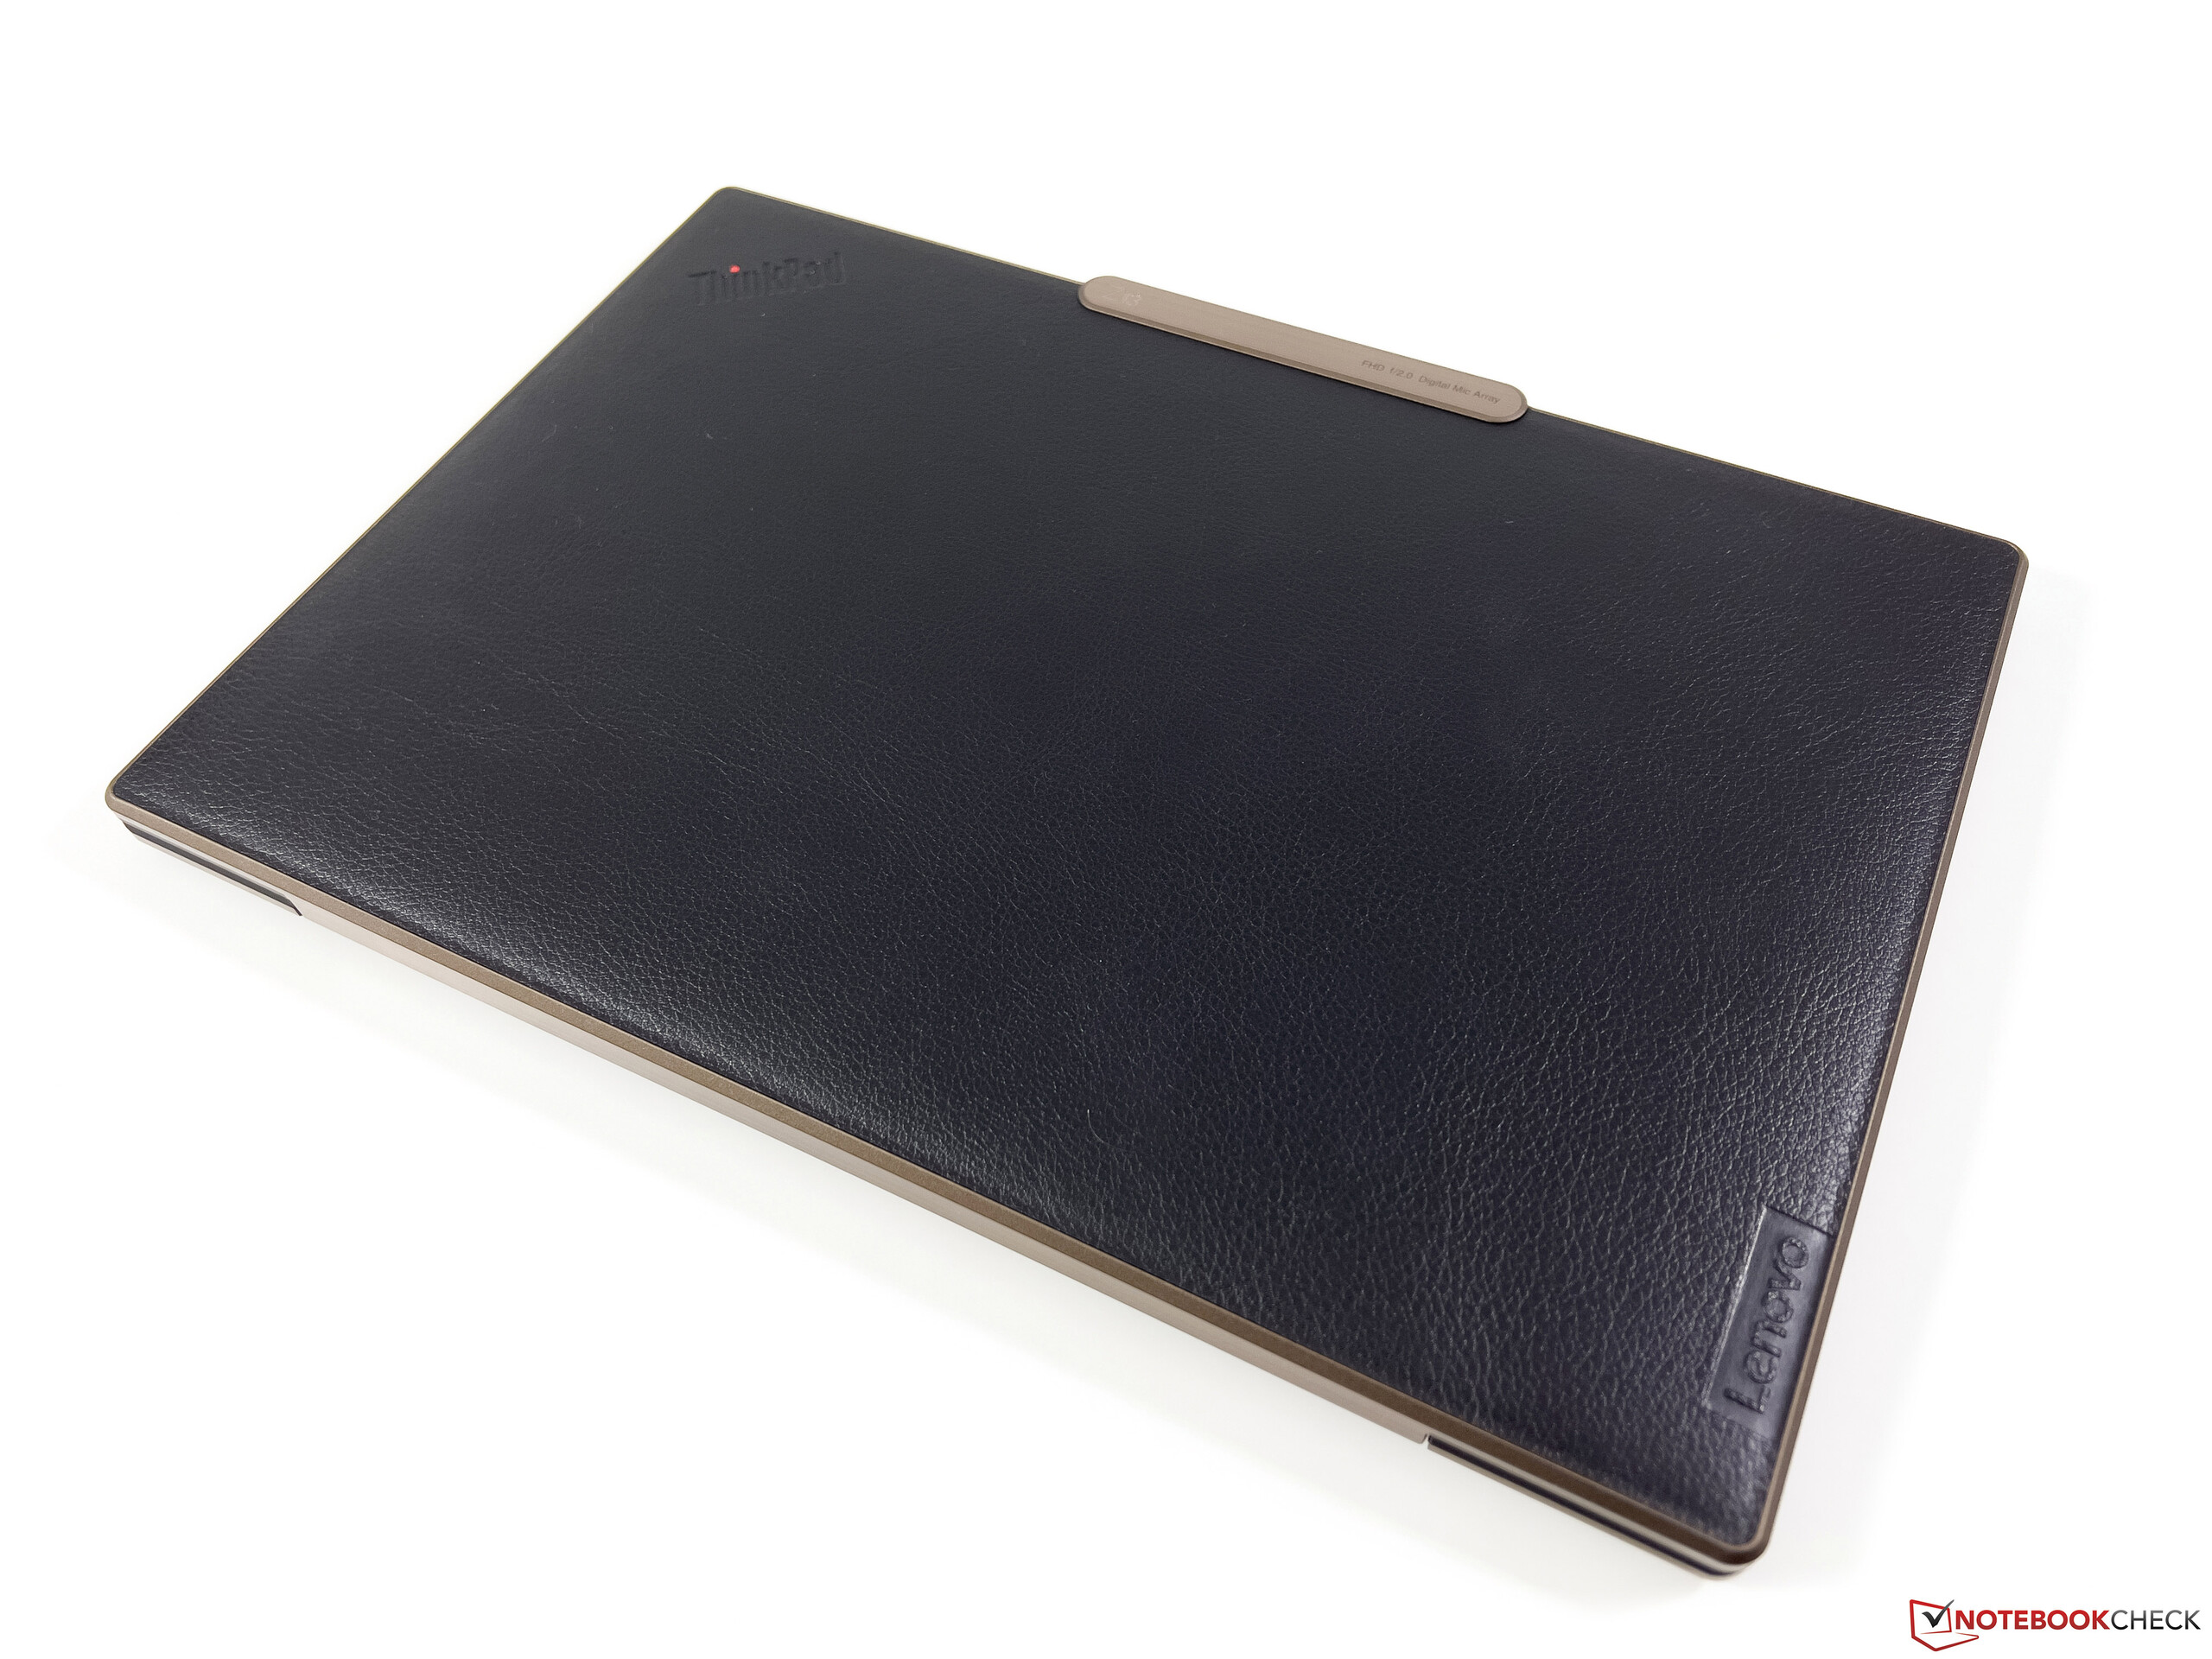
今天我们来看看ThinkPad Z13的高端型号,它的型号是 AMD Ryzen 7 Pro 6860Z这是在ThinkPad Z13中独家提供的。这个配置有一个OLED屏幕,一个LTE模块和一个特殊的设计,带有青铜色亮点的仿皮屏幕盖子。在本报告中,我们主要关注与入门级机型的区别,而不会去讨论它们的相似之处。相关信息可以在我们对ThinkPad Z13的详细评测中找到,该机配备了 Ryzen 5 Pro 6650U:
- 联想ThinkPad Z13笔记本电脑评测:AMD的高端ThinkPad,电池寿命长
- 联想ThinkPad Z16 G1笔记本电脑评测:强大的AMD旗舰产品,有一个小插曲
潜在的竞争对手比较
Rating | Date | Model | Weight | Height | Size | Resolution | Price |
|---|---|---|---|---|---|---|---|
| 88.8 % v7 (old) | 10 / 2022 | Lenovo ThinkPad Z13 G1-21D20016GE R7 PRO 6860Z, Radeon 680M | 1.3 kg | 14 mm | 13.30" | 2880x1800 | |
| 90.1 % v7 (old) | 07 / 2022 | Asus Zenbook S 13 OLED R7 6800U, Radeon 680M | 1.1 kg | 14.9 mm | 13.30" | 2880x1800 | |
| 87.3 % v7 (old) | 09 / 2022 | Dell XPS 13 Plus 9320 i7-1280P OLED i7-1280P, Iris Xe G7 96EUs | 1.3 kg | 15.28 mm | 13.40" | 3456x2160 | |
| 92 % v7 (old) | 08 / 2022 | Apple MacBook Air M2 10C GPU M2, M2 10-Core GPU | 1.2 kg | 11.3 mm | 13.60" | 2560x1664 | |
| 90.5 % v7 (old) | 08 / 2022 | Lenovo ThinkPad Z13 21D2CTO1WW R5 PRO 6650U, Radeon 660M | 1.2 kg | 13.99 mm | 13.30" | 1920x1200 |
案例
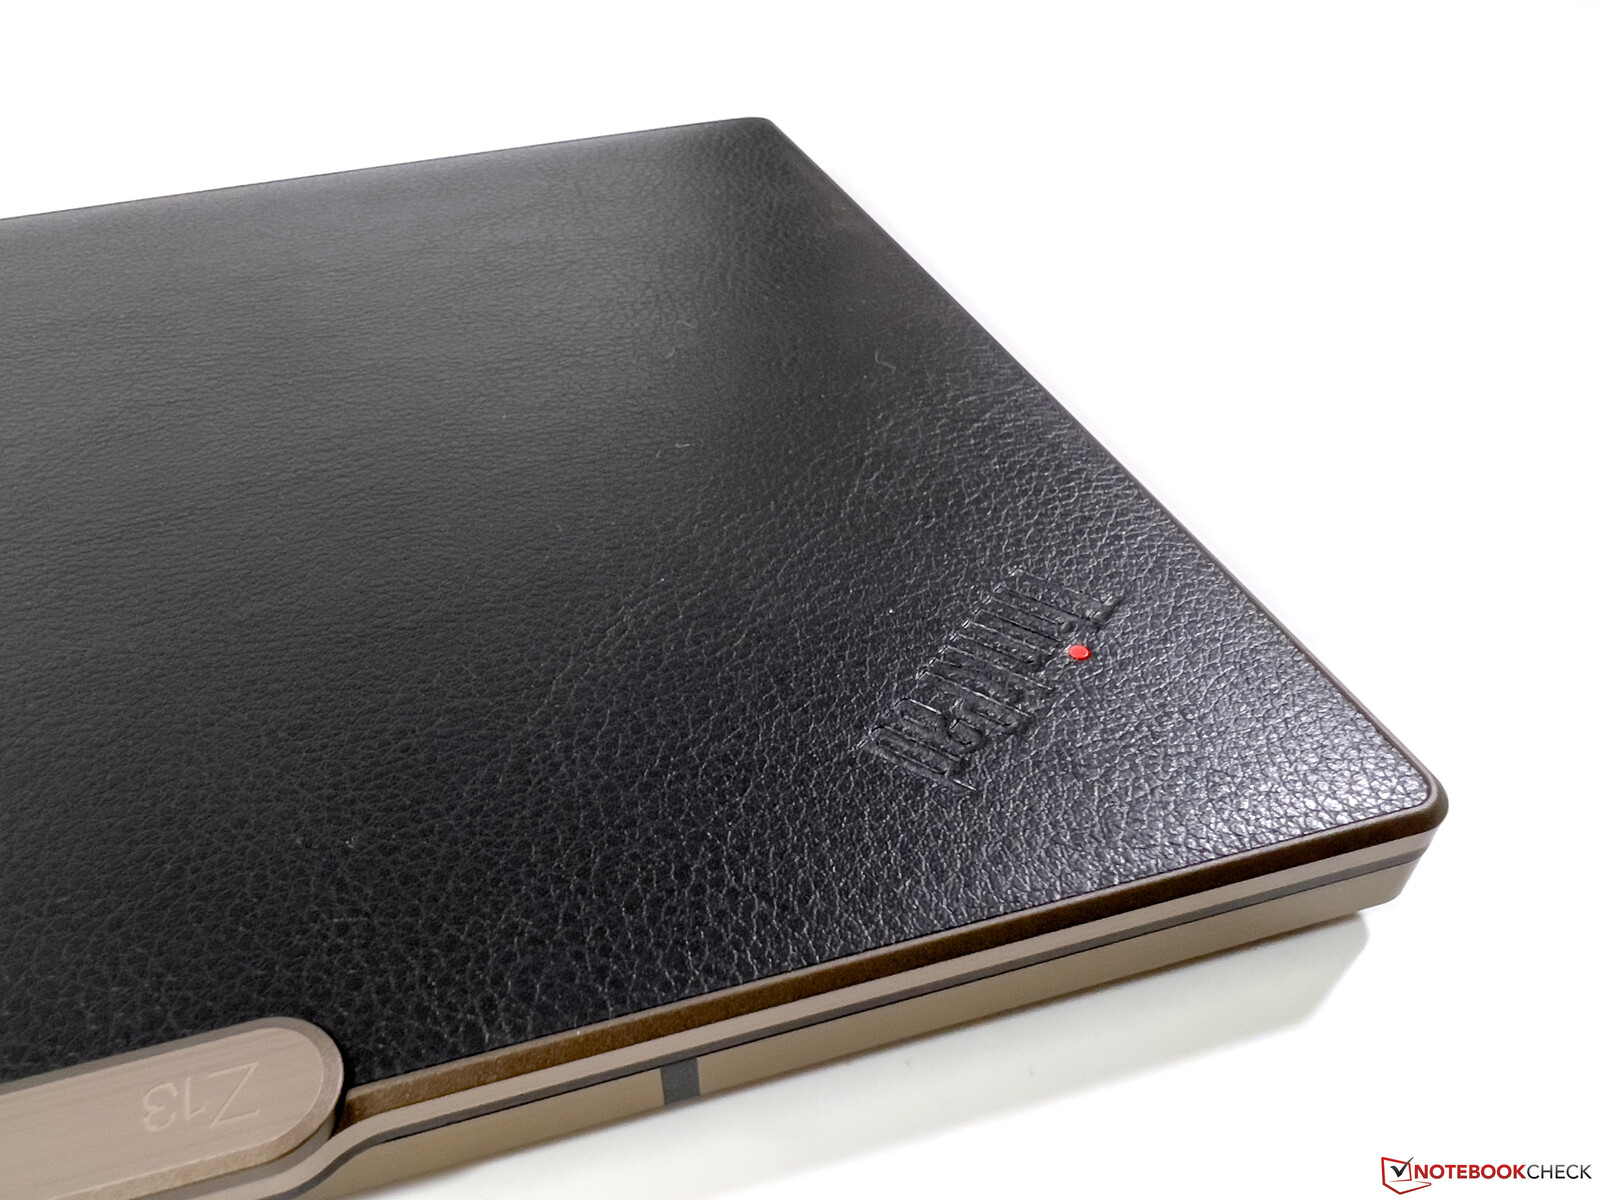
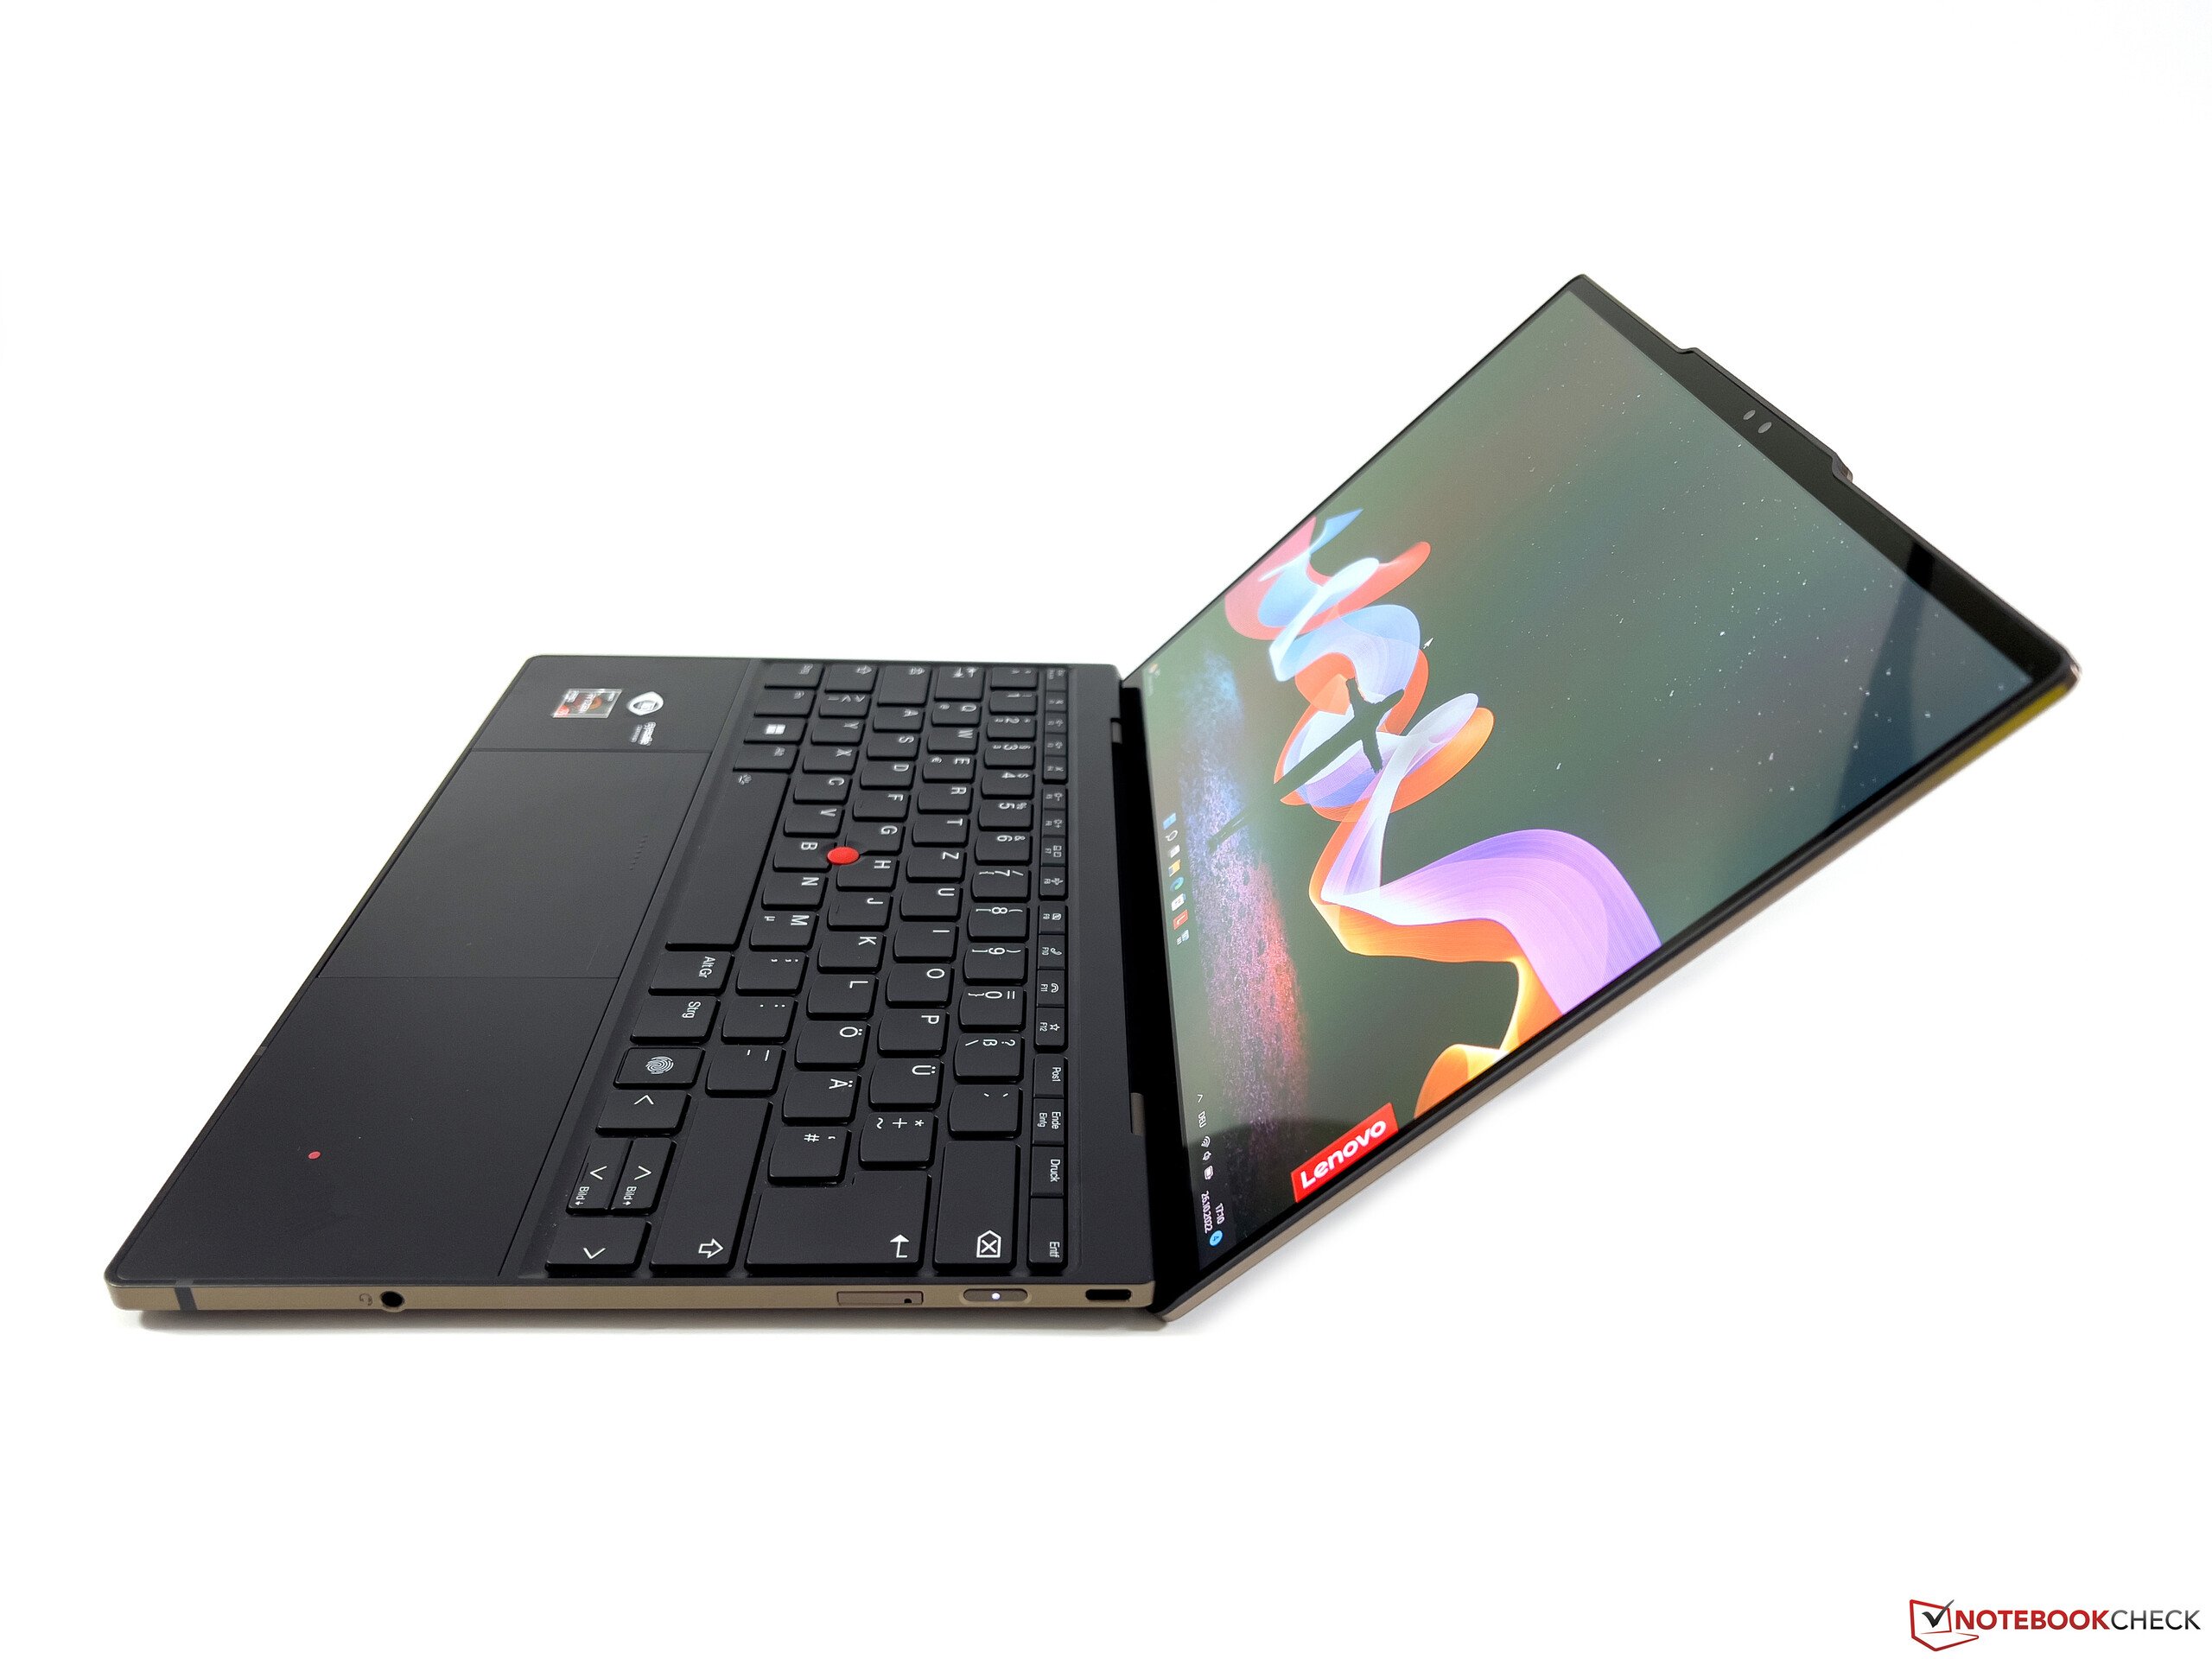
这款机箱基本上与 入门级型号的ThinkPad Z13基本相同。但在高端版本中,有一个黑色仿皮表面的屏幕盖子,上面有青铜色的亮点。这无疑是一个个人品味的问题,联想确实提供了替代品,但与手提包的比较难以避免。目前的Z13是否已经成为更多的时尚物品,或者在视觉上仍然适合商务环境,这是一个个人选择的问题。不过,从质量的角度来看,这款机箱没有任何问题,ThinkPad Z13确实具有极高的质量。
连接性 - 带有Wi-Fi 6E和LTE的Z13
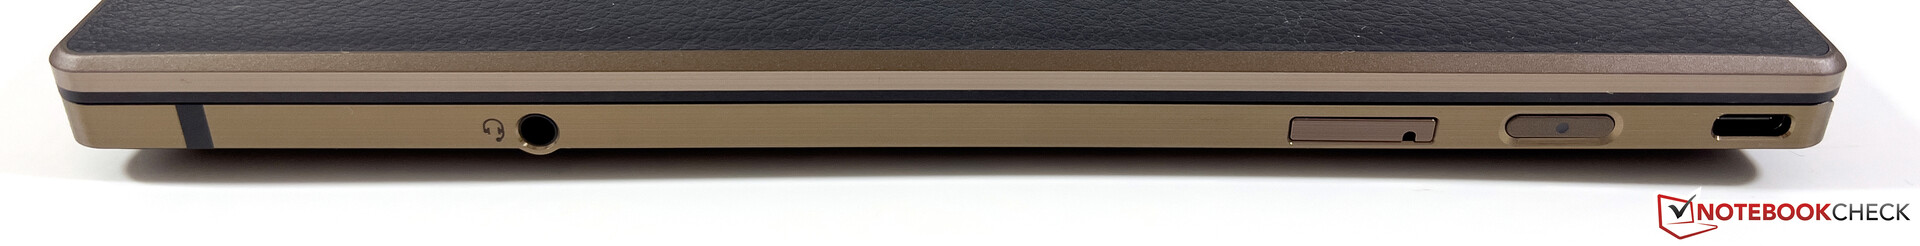
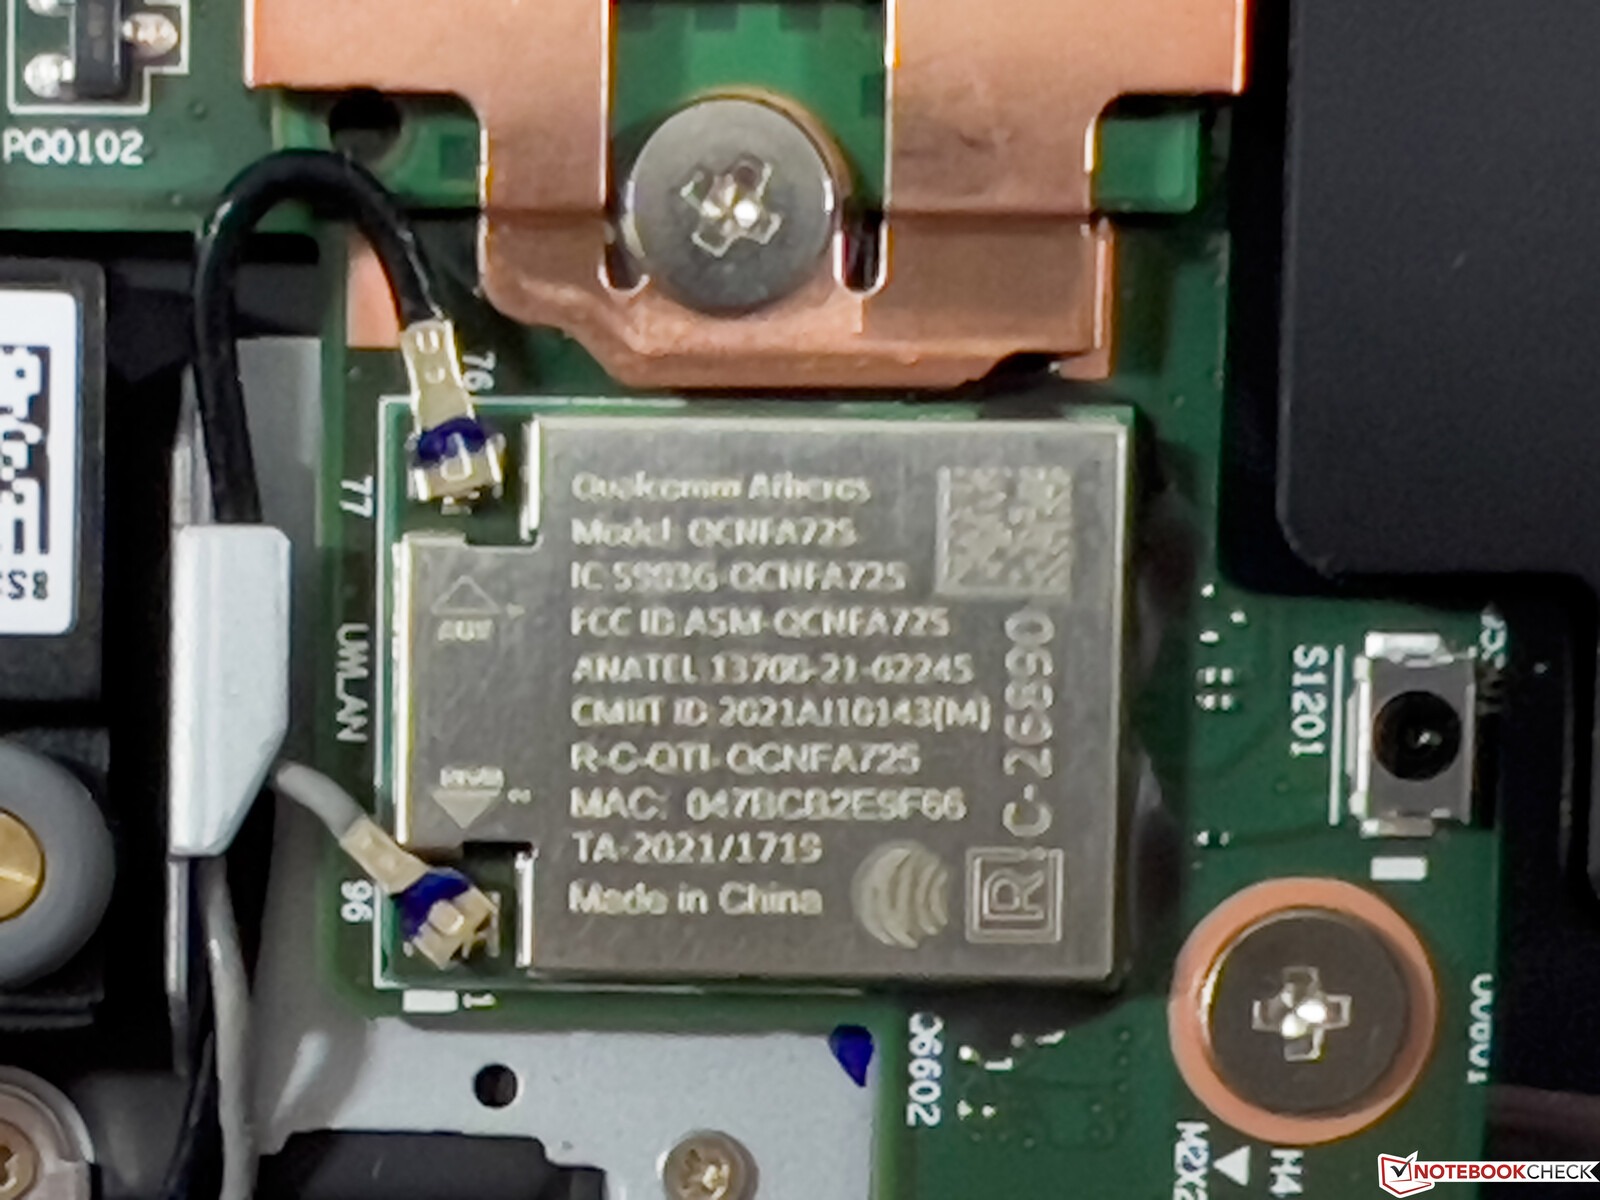
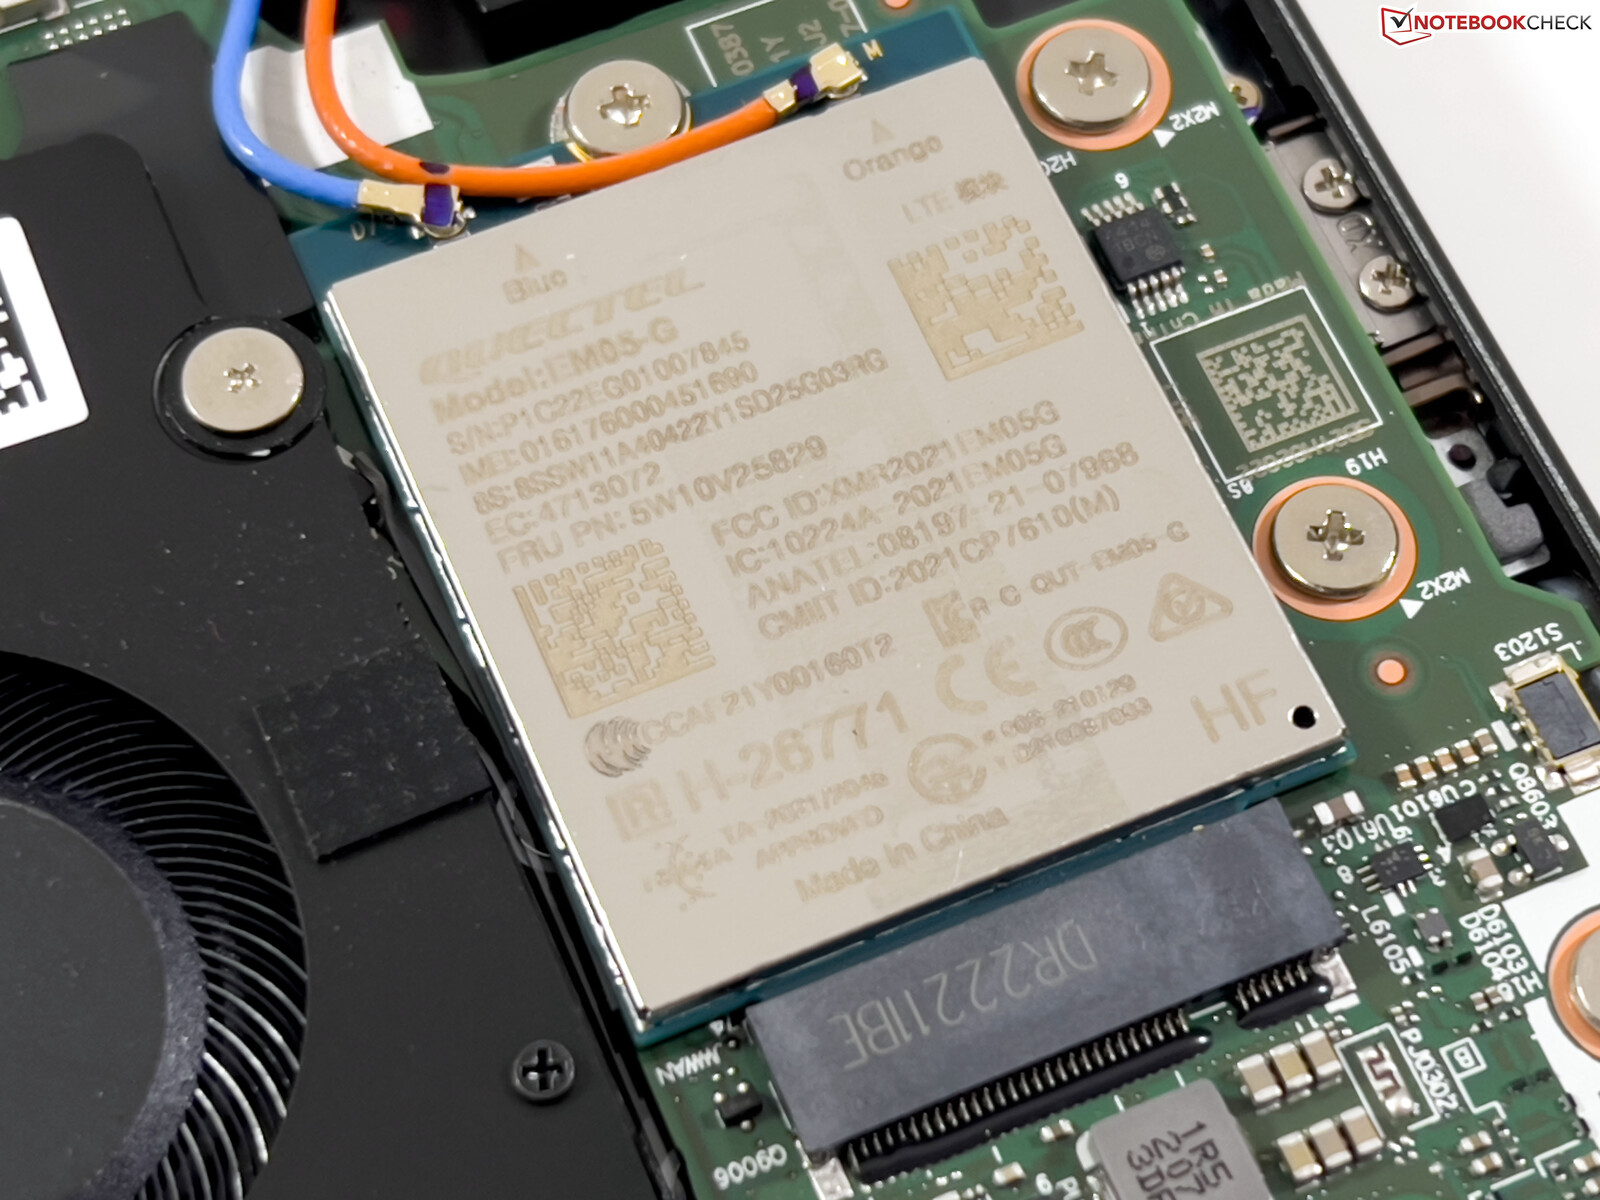
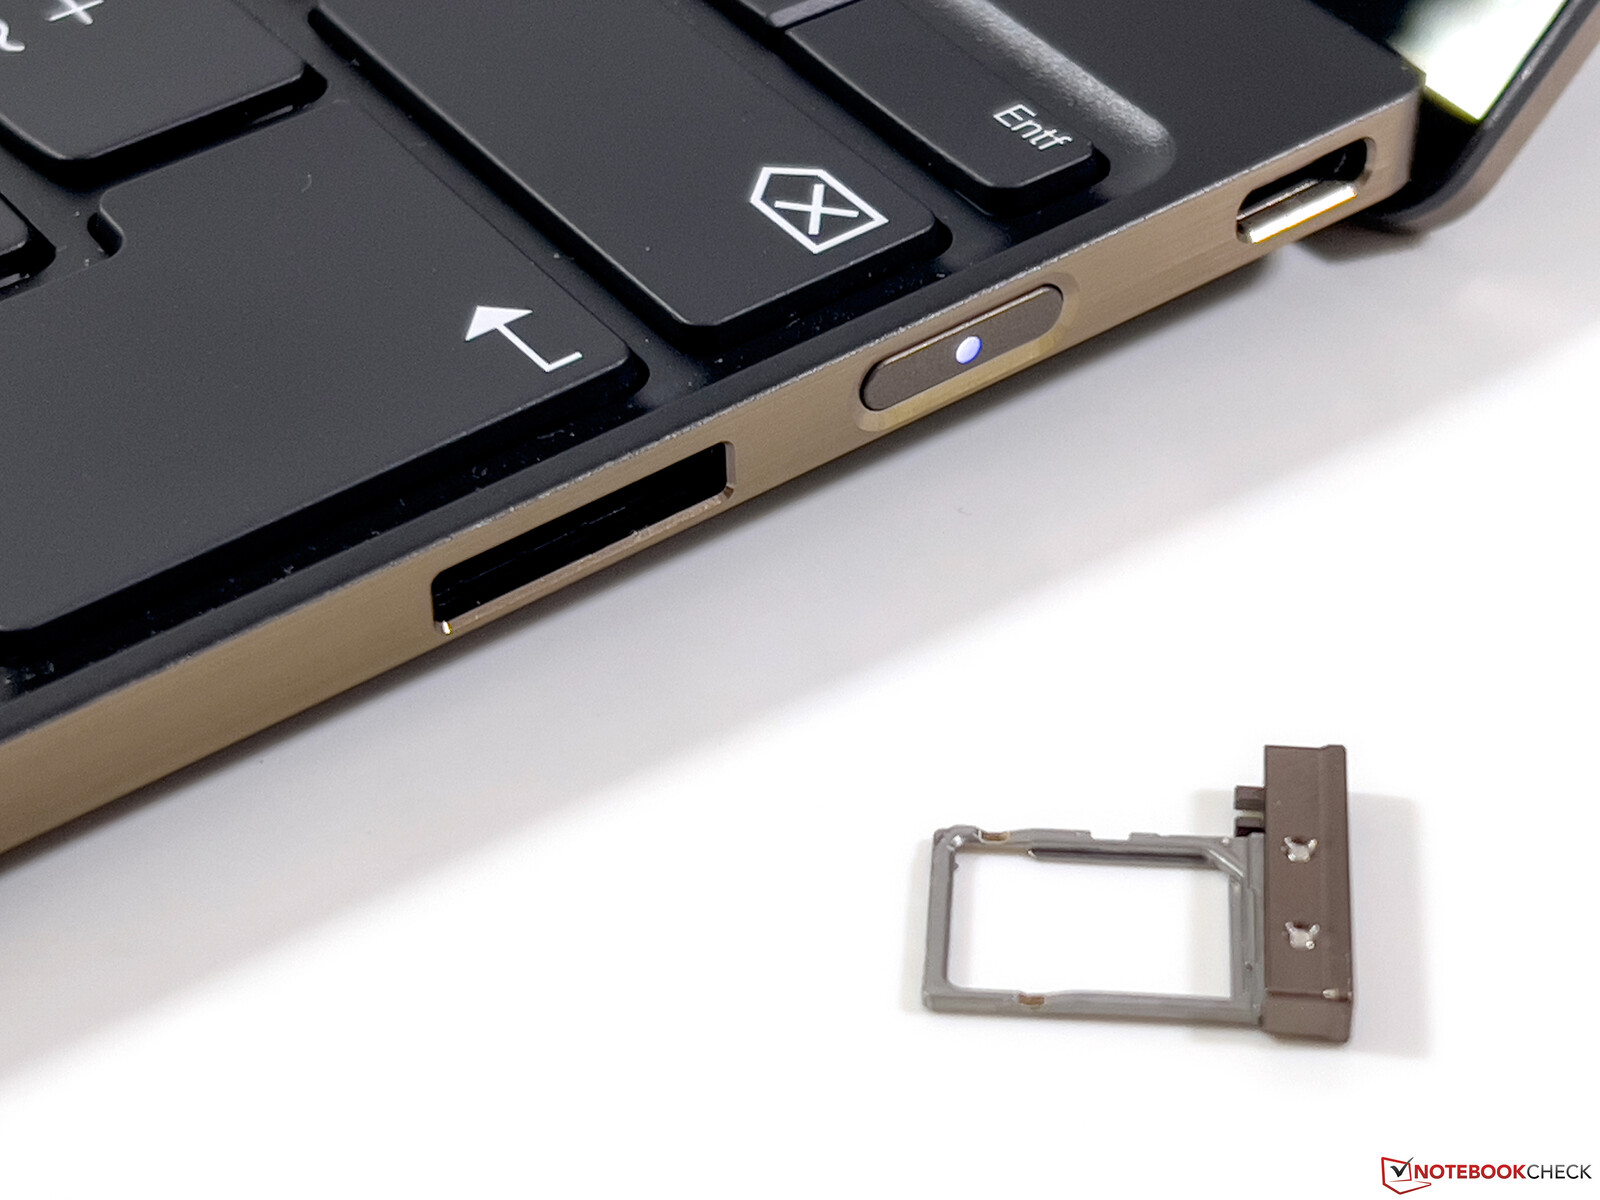
我们的评测设备配备了Wi-Fi 6E模块(高通公司WCN685x),我们能够轻松连接到华硕参考路由器的6GHz网络。测试中的传输率非常高,也很稳定。测试设备中还安装了一个来自Quectel的WWAN模块,它只支持LTE Cat.4。除了eSIM,在右边的边缘还可以插入一个nano-SIM卡。我们能够在LTE网络中使用Telekom(德国)的SIM卡,没有问题。然而,5G模块是不可用的。
| Networking | |
| Lenovo ThinkPad Z13 G1-21D20016GE | |
| iperf3 receive AXE11000 6GHz | |
| iperf3 transmit AXE11000 6GHz | |
| Asus Zenbook S 13 OLED | |
| iperf3 receive AXE11000 | |
| iperf3 transmit AXE11000 | |
| Lenovo ThinkPad Z13 21D2CTO1WW | |
| iperf3 receive AXE11000 6GHz | |
| iperf3 transmit AXE11000 6GHz | |
| Apple MacBook Air M2 Entry | |
| iperf3 receive AXE11000 | |
| iperf3 transmit AXE11000 | |
| Dell XPS 13 Plus 9320 4K | |
| iperf3 receive AXE11000 | |
| iperf3 transmit AXE11000 | |
| Average Qualcomm WCN685x | |
| iperf3 receive AXE11000 6GHz | |
| iperf3 transmit AXE11000 6GHz | |
| iperf3 receive AXE11000 | |
| iperf3 transmit AXE11000 | |


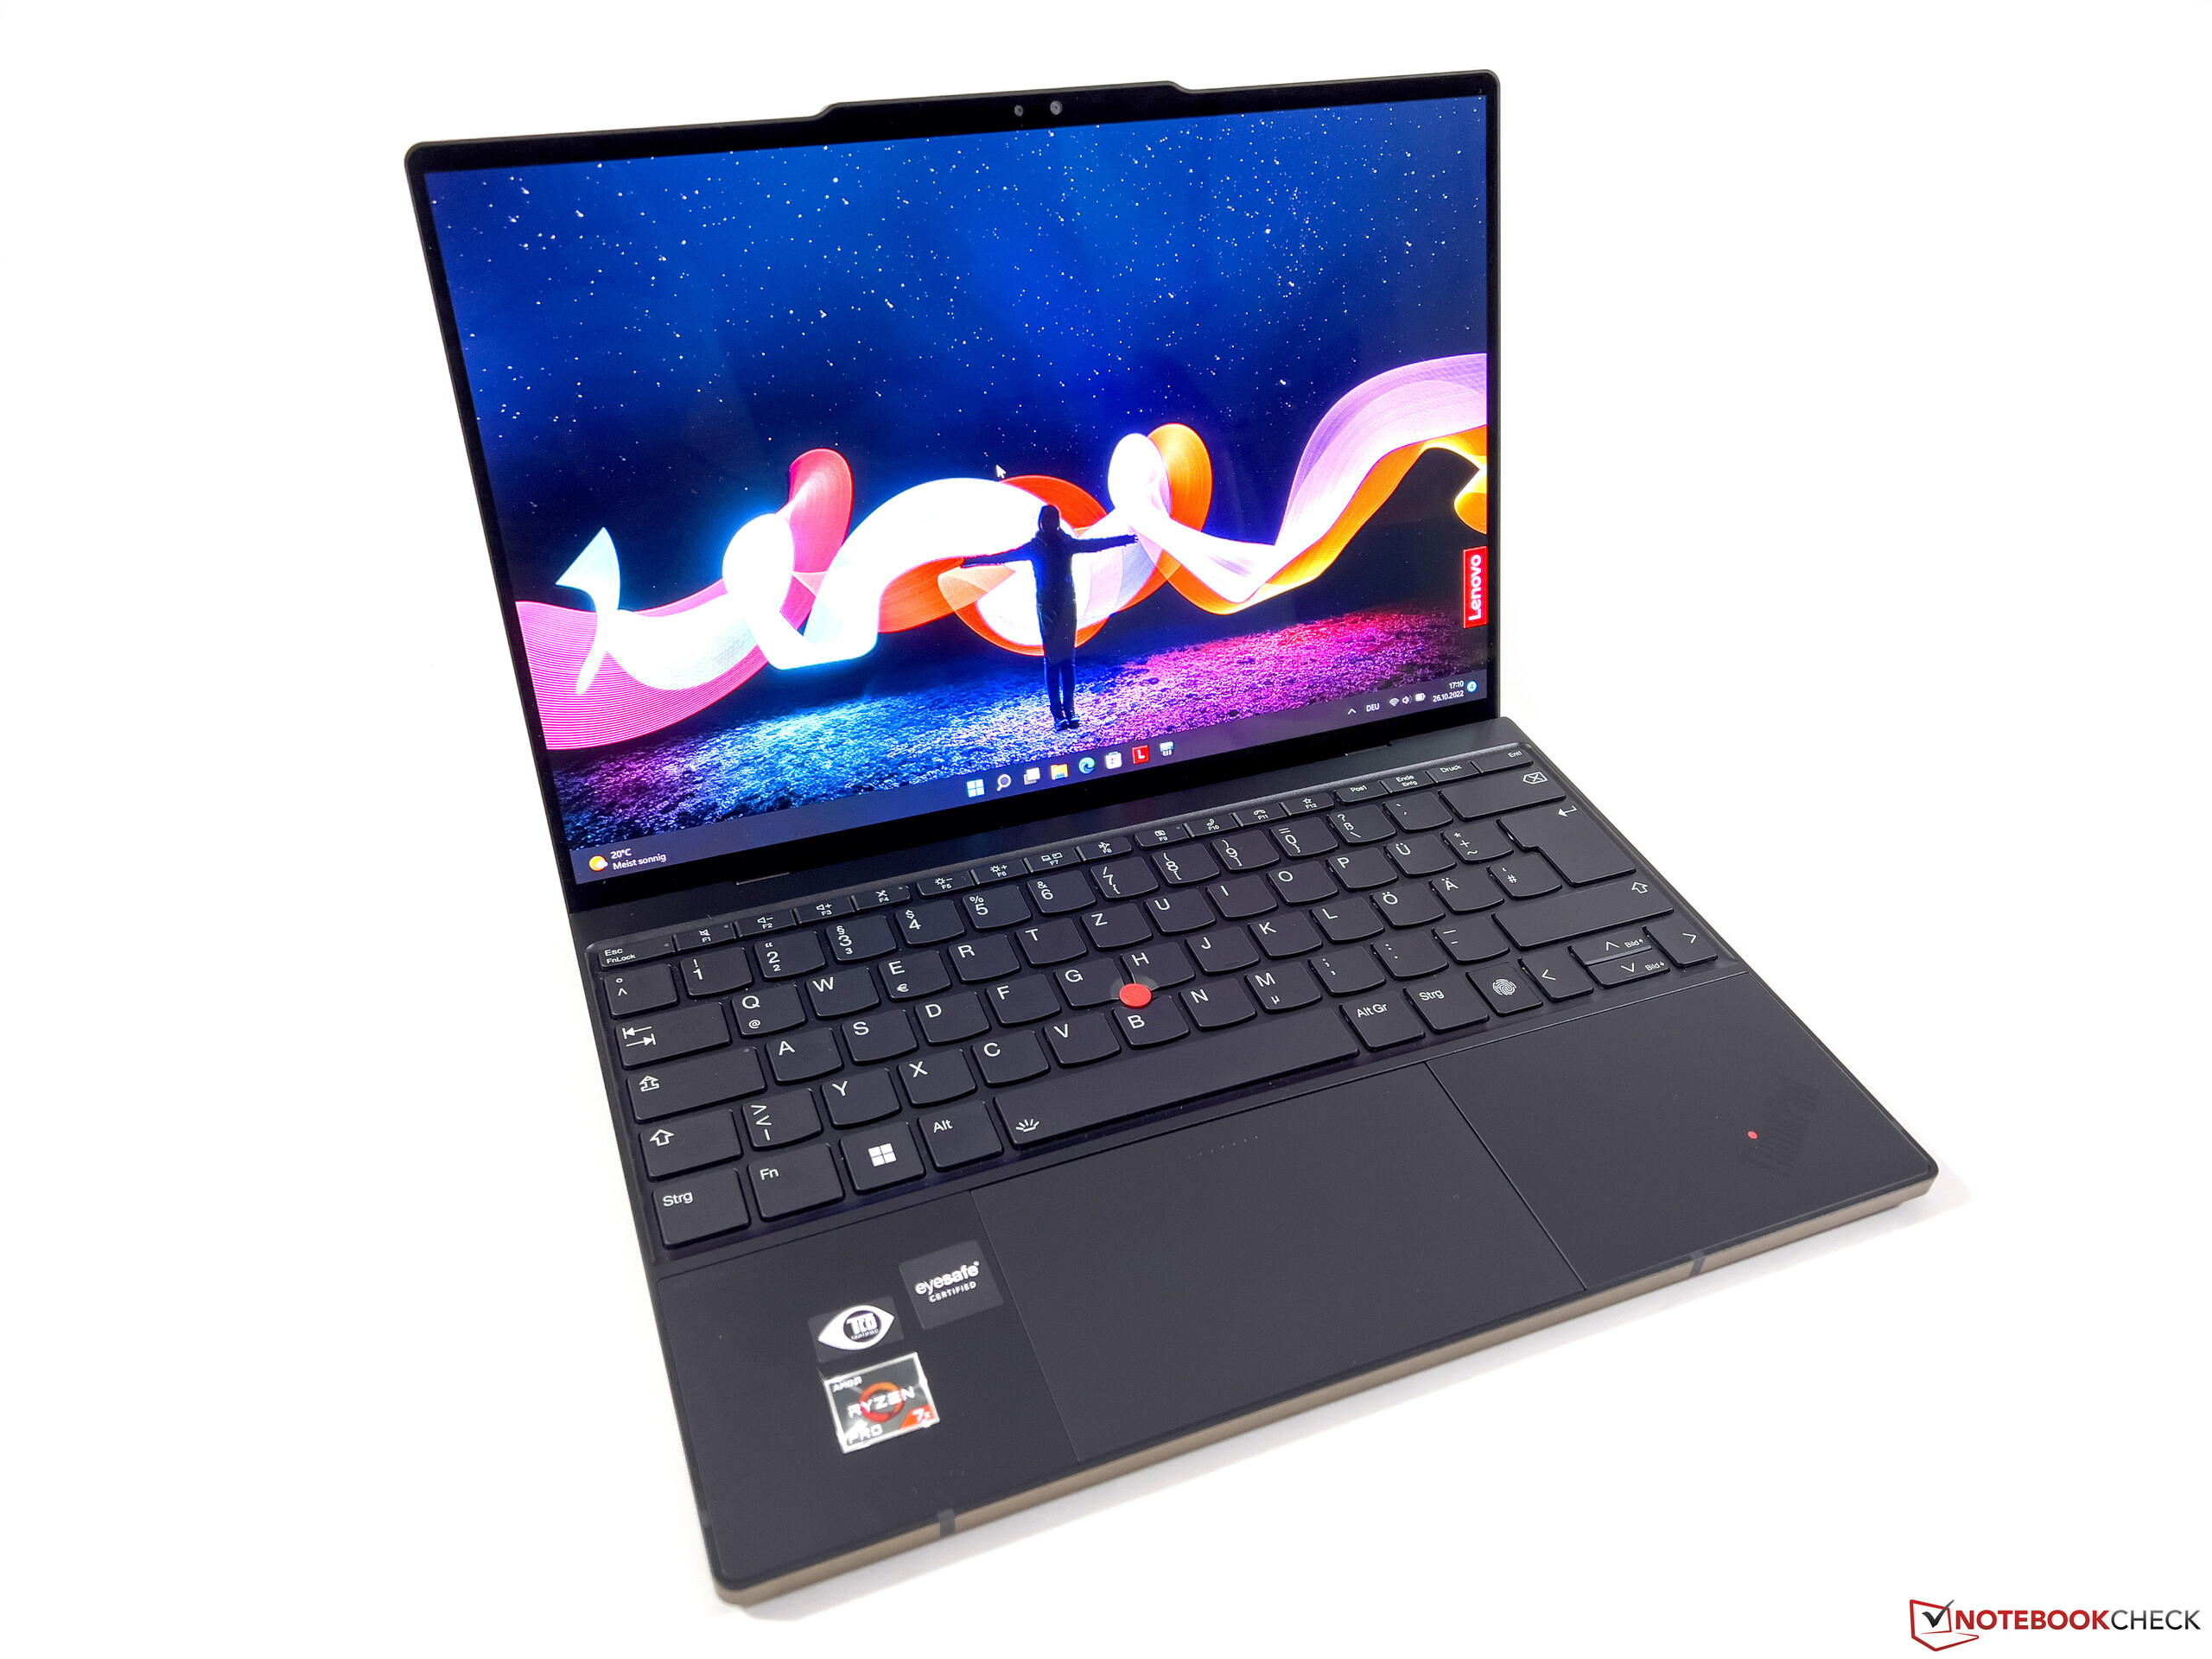
显示器 - 2.8K OLED触摸屏
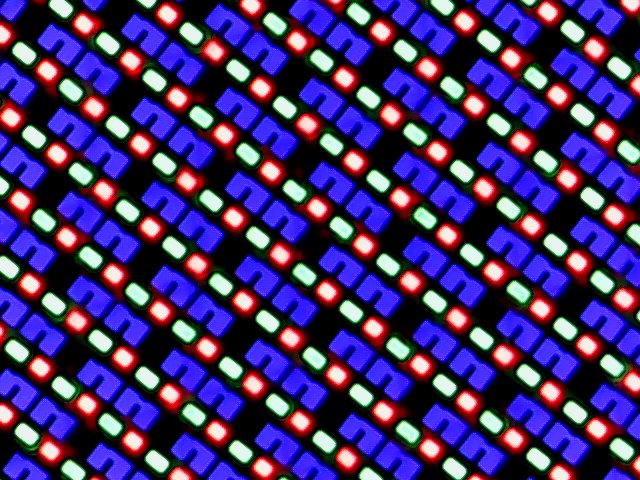
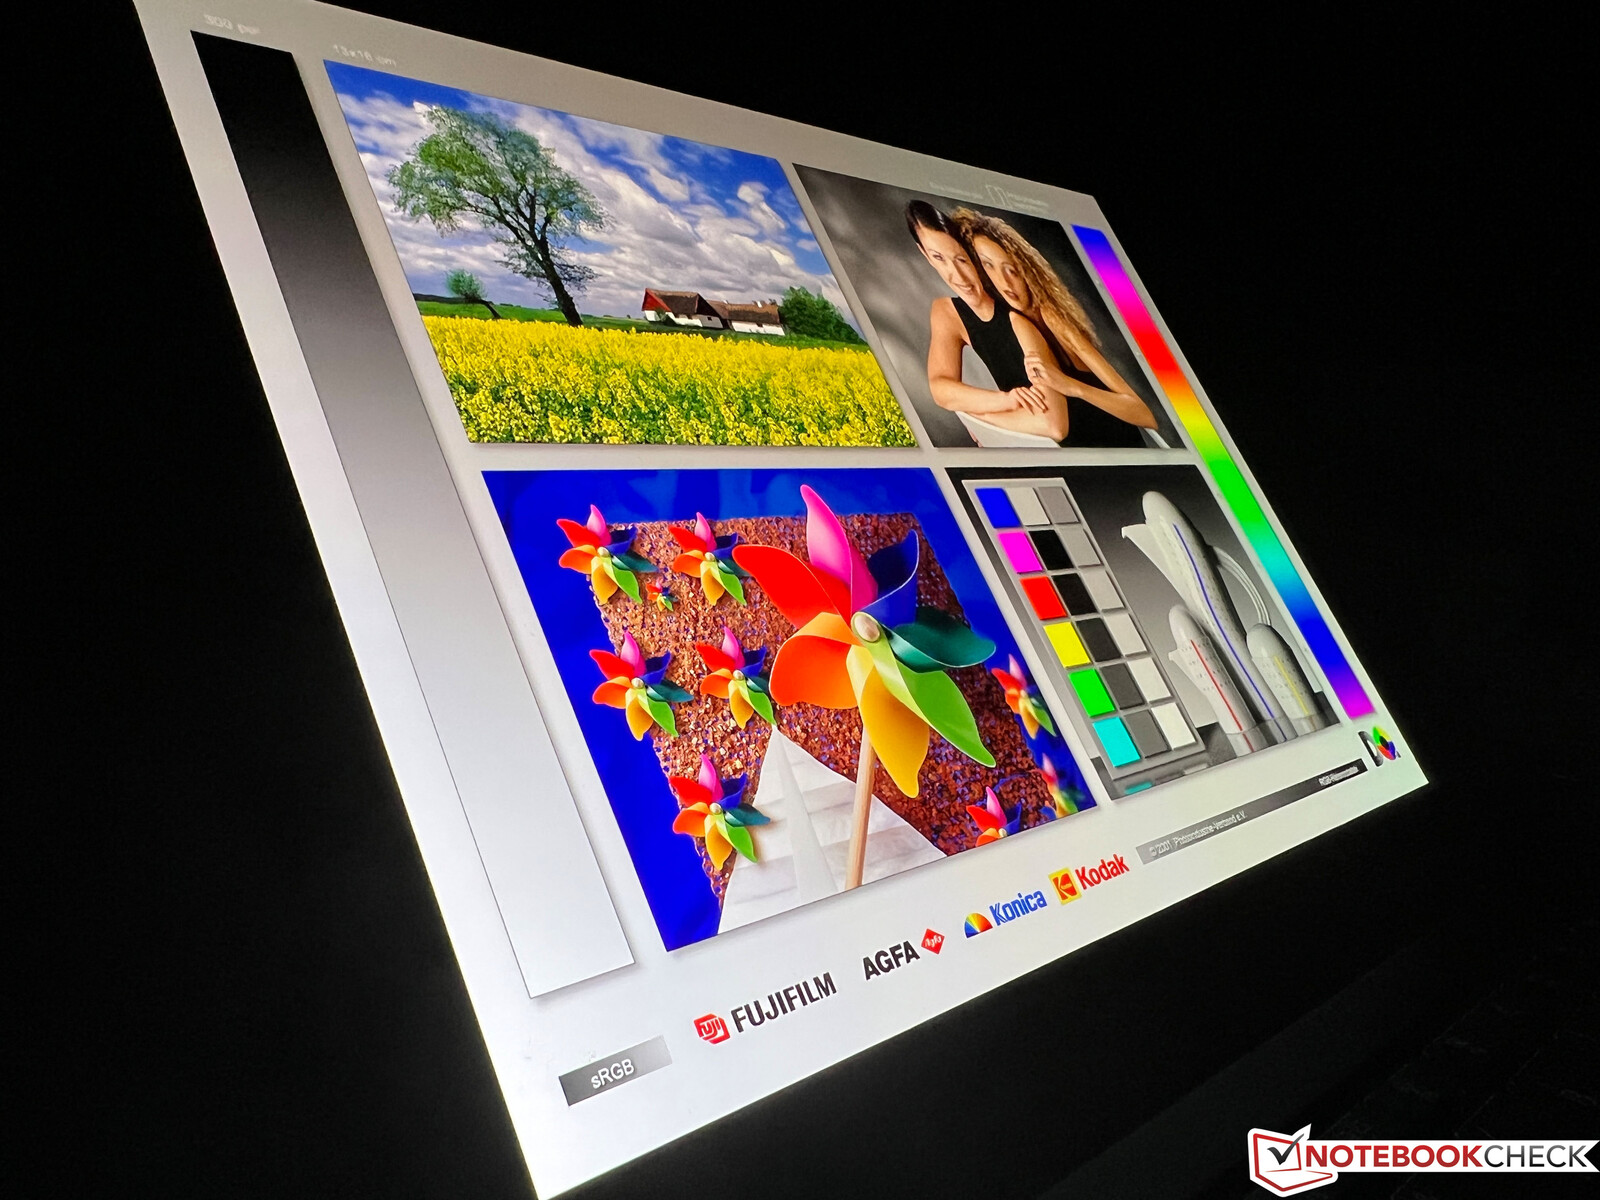
我们的测试设备使用可选的13.3英寸OLED触摸屏,分辨率为2880×1800像素。从主观上讲,反射面板的图像原则上给人留下了良好的印象。内容显示得非常清晰,色彩也非常强烈。然而,对于明亮的内容,网格效应(摩尔纹效应)是可见的,并要求人们坐在相对靠近显示器的地方。Windows默认使用其深色模式以节省电力,因此在实践中,这种效果并不明显。
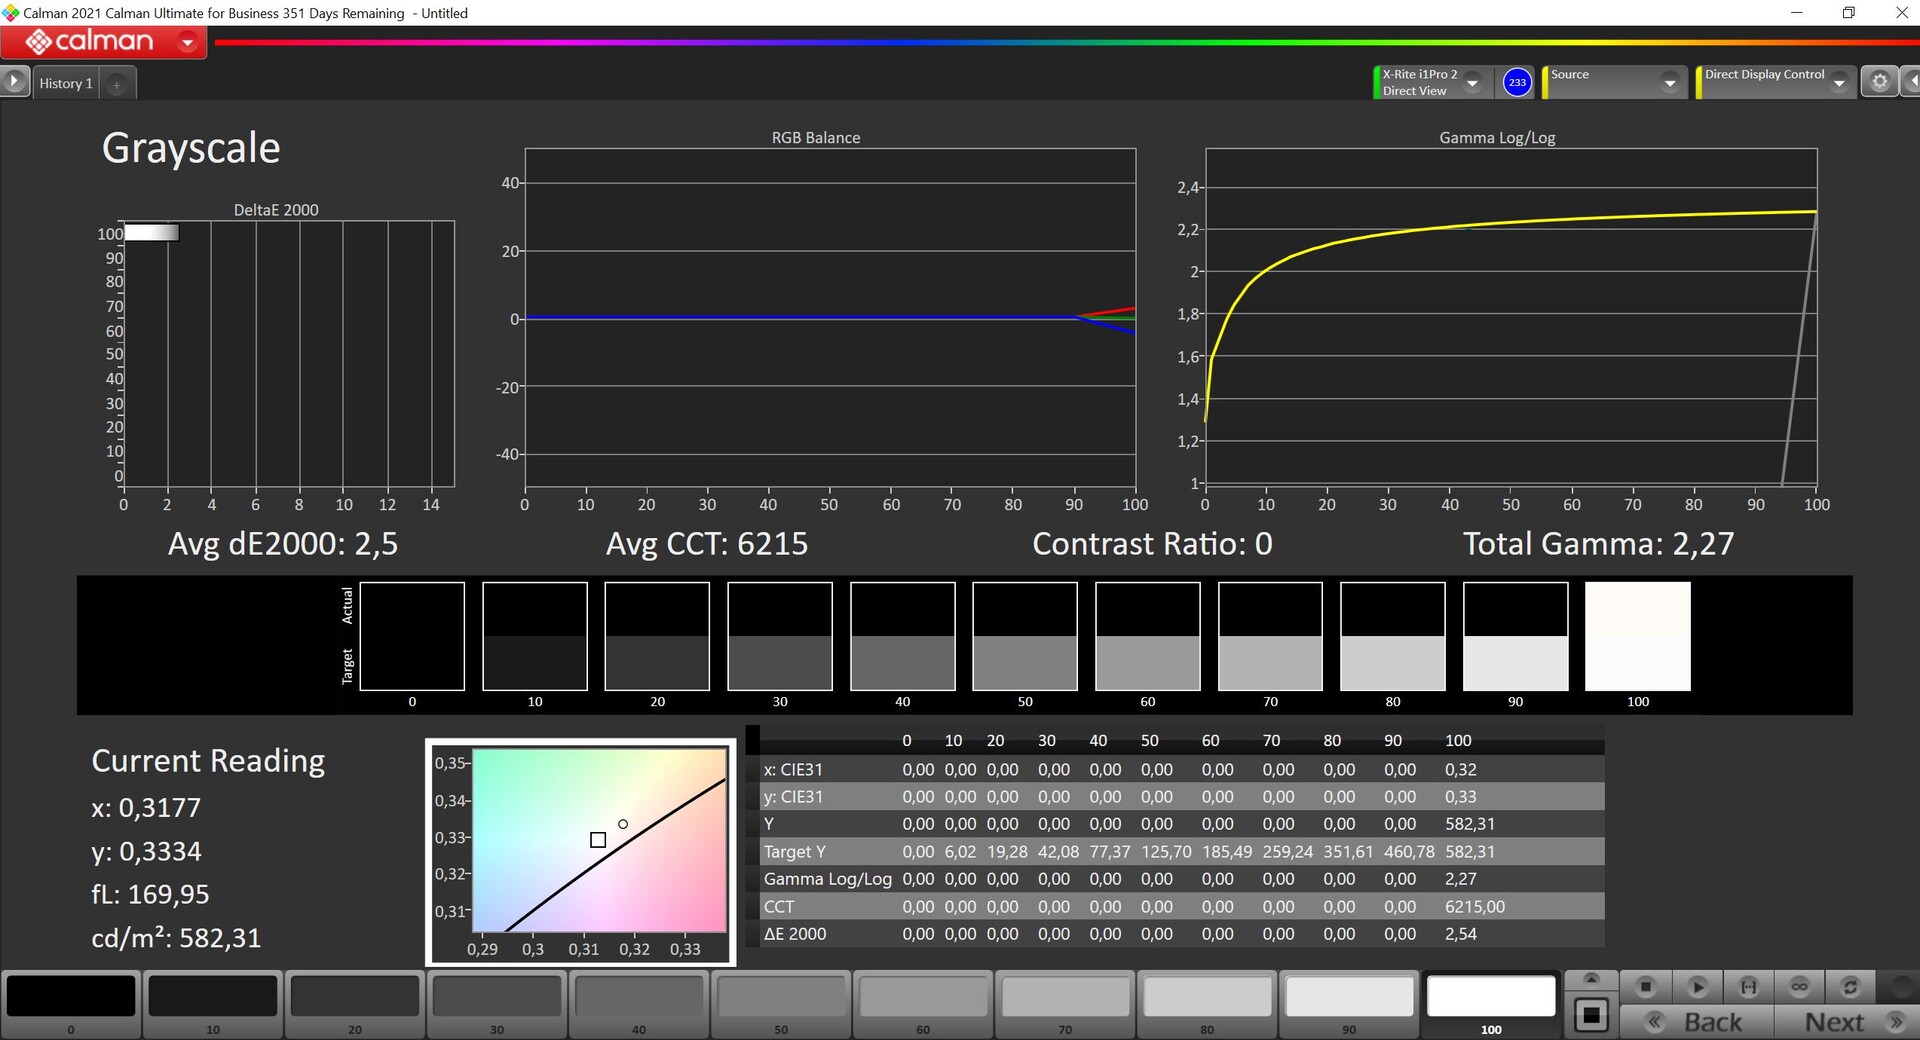
联想宣传的亮度为400cd/m²,因此在这里必须区分SDR和HDR内容(正如OLED面板的标准)。在正常的SDR模式下,我们确定亮度约为380cd/m²,加上极低的黑电平,可以获得极高的对比度。在HDR模式下(必须手动激活),对于小的图像部分,它达到了最高的582cd/m²,对于几乎完全明亮的图像,它达到了大约470cd/m²。视角的稳定性非常好,响应时间也非常快。OLED面板上没有光晕。
| |||||||||||||||||||||||||
Brightness Distribution: 98 %
Center on Battery: 373 cd/m²
Contrast: 9275:1 (Black: 0.04 cd/m²)
ΔE ColorChecker Calman: 2.5 | ∀{0.5-29.43 Ø4.71}
calibrated: 1.9
ΔE Greyscale Calman: 2 | ∀{0.09-98 Ø4.96}
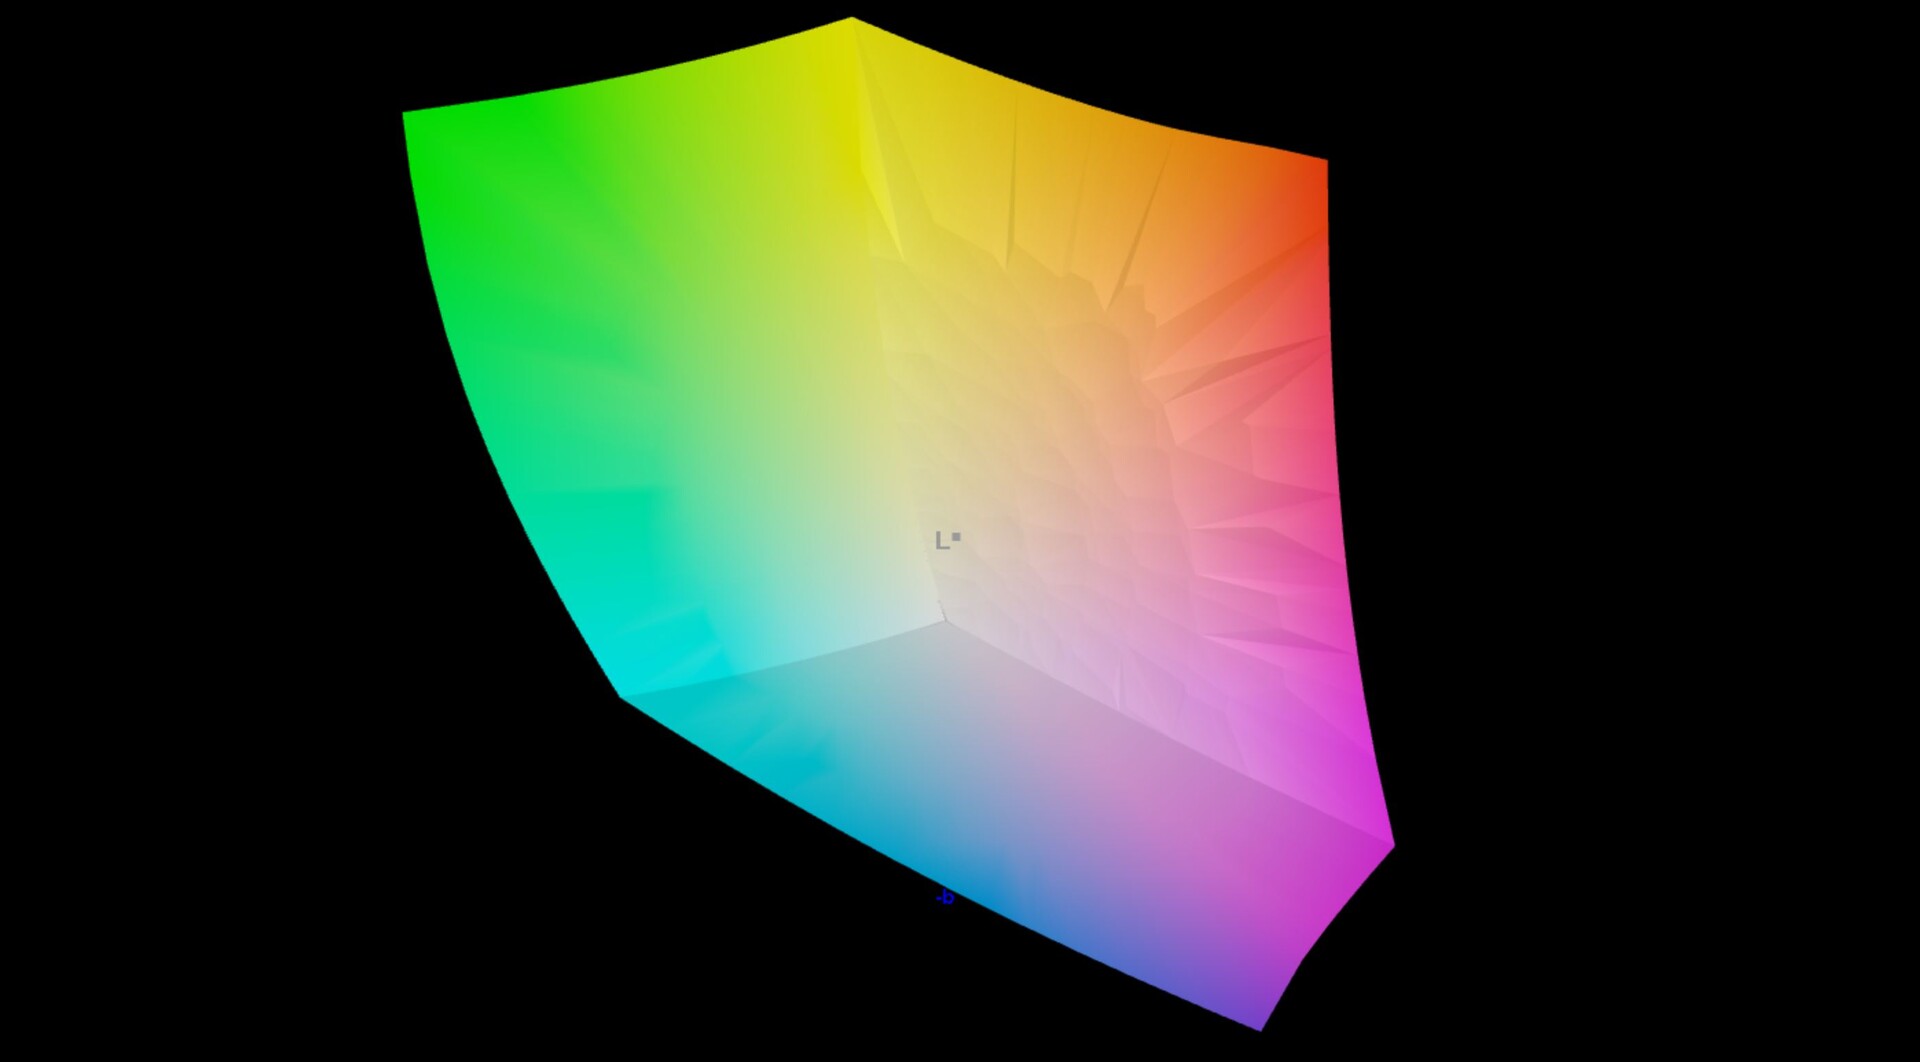
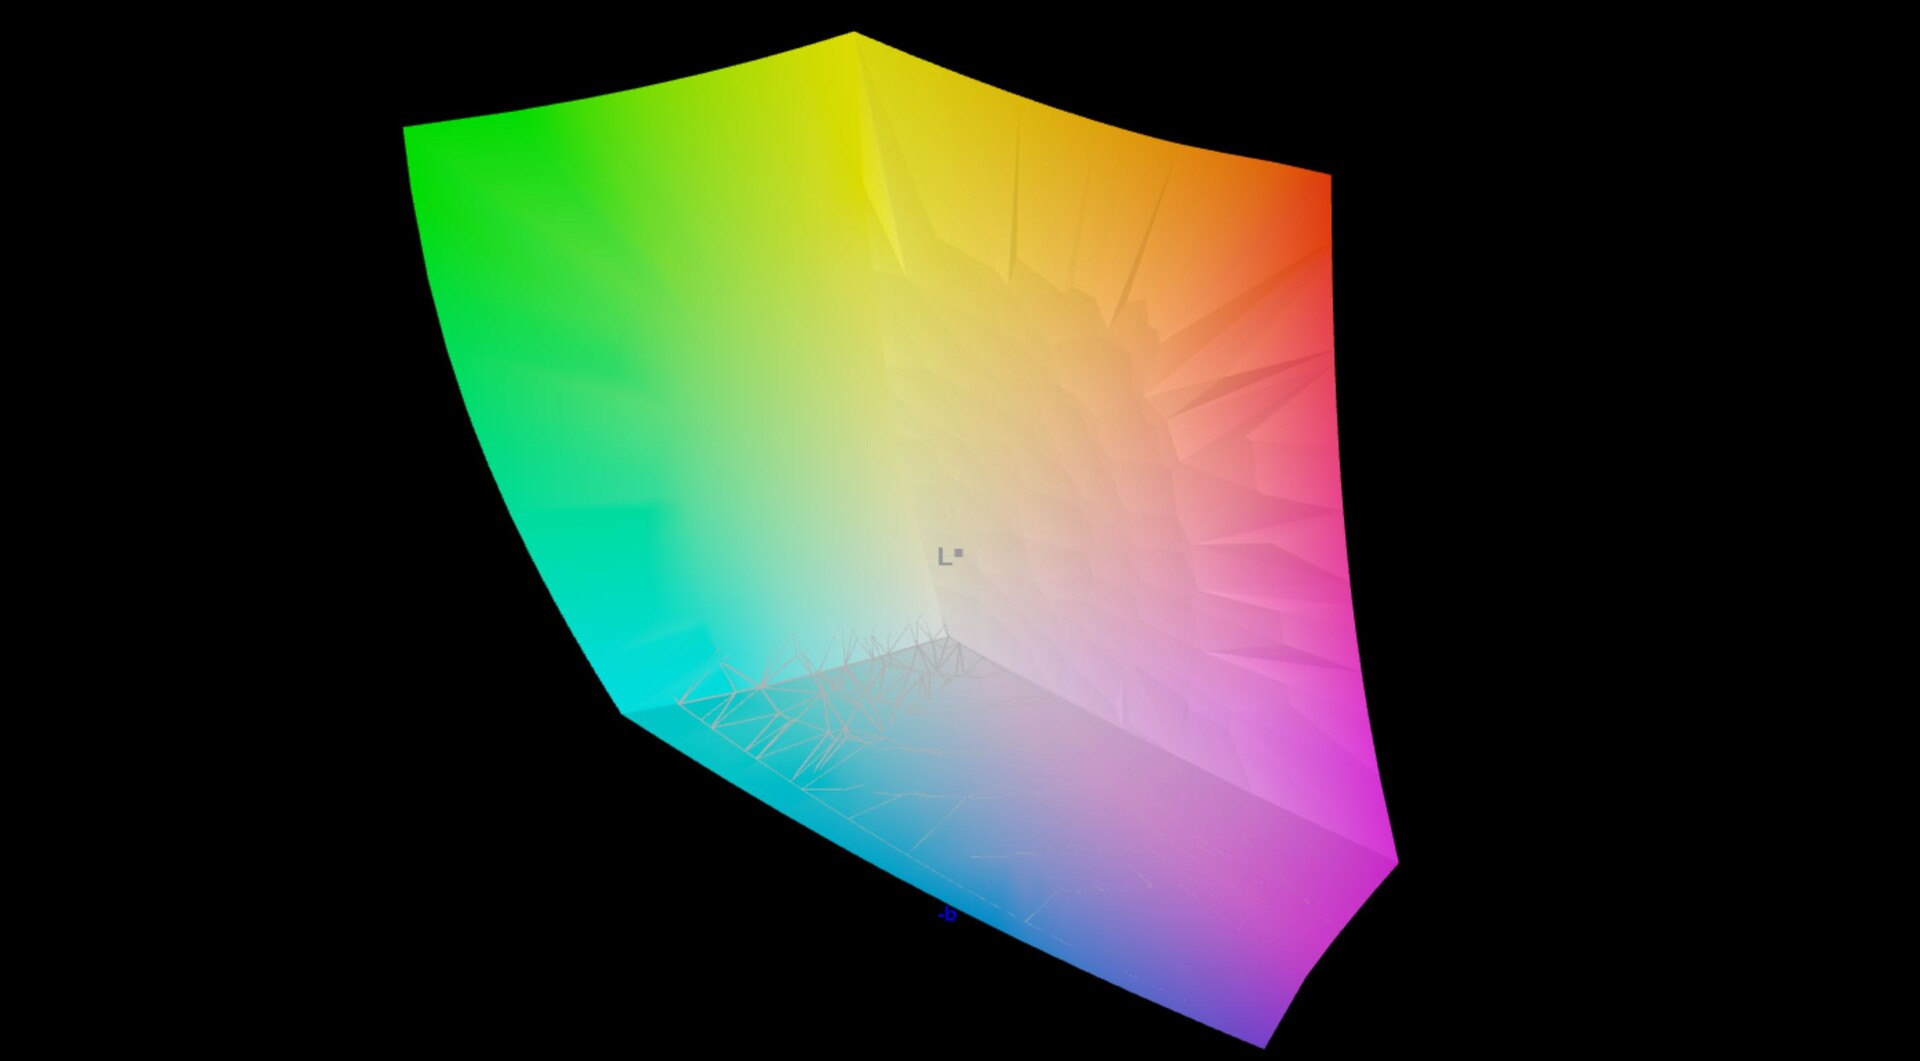
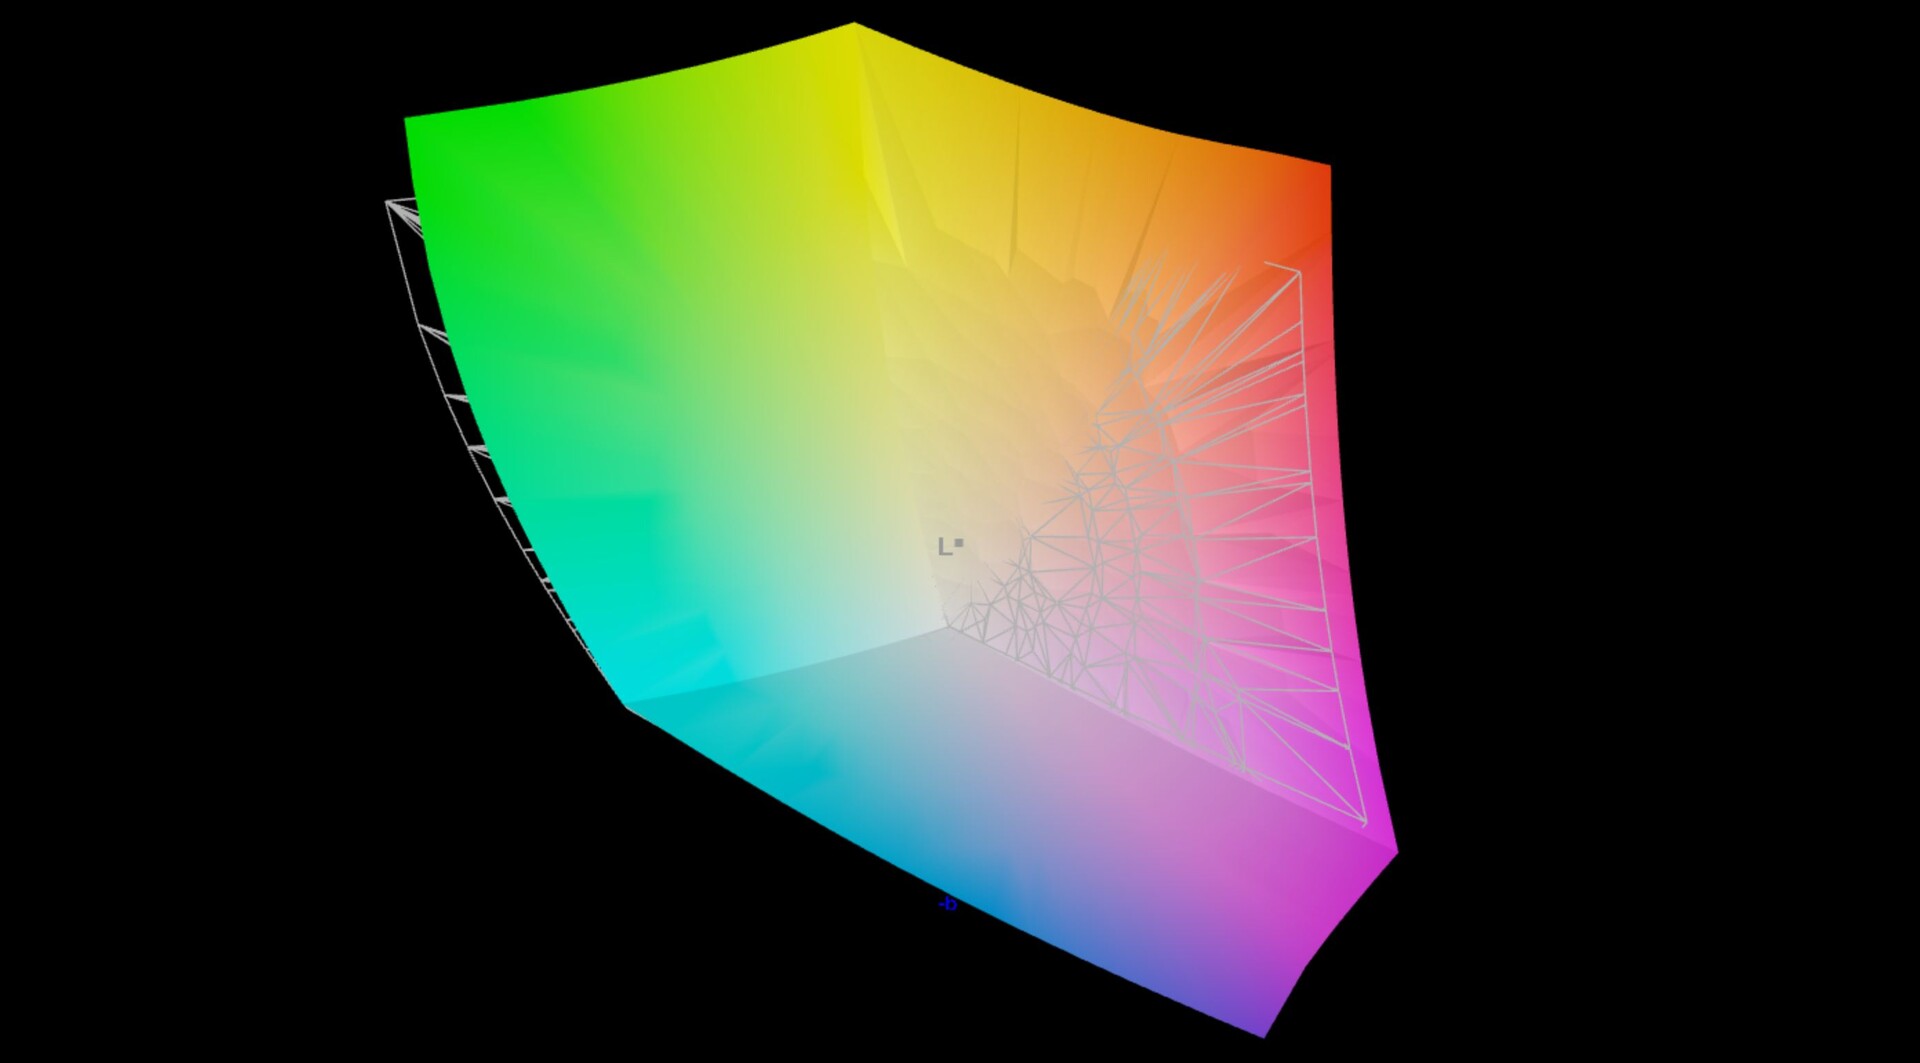
97.5% AdobeRGB 1998 (Argyll 3D)
100% sRGB (Argyll 3D)
99.9% Display P3 (Argyll 3D)
Gamma: 2.17
CCT: 6228 K
| Lenovo ThinkPad Z13 G1-21D20016GE ATNA33AA02-0, OLED, 2880x1800, 13.3" | Asus Zenbook S 13 OLED SDC4172, OLED, 2880x1800, 13.3" | Dell XPS 13 Plus 9320 i7-1280P OLED Samsung 134XK04, OLED, 3456x2160, 13.4" | Lenovo ThinkPad Z13 21D2CTO1WW NV133WUM-N63, IPS LED, 1920x1200, 13.3" | Apple MacBook Air M2 Entry IPS, 2560x1664, 13.6" | |
|---|---|---|---|---|---|
| Display | 0% | 0% | -21% | -4% | |
| Display P3 Coverage (%) | 99.9 | 99.8 0% | 99.5 0% | 67.7 -32% | 98.4 -2% |
| sRGB Coverage (%) | 100 | 100 0% | 100 0% | 96.5 -3% | 99.9 0% |
| AdobeRGB 1998 Coverage (%) | 97.5 | 97.8 0% | 98.4 1% | 69.7 -29% | 87.6 -10% |
| Response Times | -8% | -34% | -1909% | -1544% | |
| Response Time Grey 50% / Grey 80% * (ms) | 1.9 ? | 2.1 ? -11% | 2.6 ? -37% | 49 ? -2479% | 32.9 ? -1632% |
| Response Time Black / White * (ms) | 1.6 ? | 1.68 ? -5% | 2.1 ? -31% | 23 ? -1338% | 24.9 ? -1456% |
| PWM Frequency (Hz) | 240 ? | 240.4 ? | 59.5 | ||
| Screen | 24% | -6% | -81% | -81% | |
| Brightness middle (cd/m²) | 371 | 336 -9% | 371.8 0% | 418 13% | 526 42% |
| Brightness (cd/m²) | 378 | 338 -11% | 374 -1% | 379 0% | 486 29% |
| Brightness Distribution (%) | 98 | 99 1% | 98 0% | 81 -17% | 87 -11% |
| Black Level * (cd/m²) | 0.04 | 0.02 50% | 0.33 -725% | 0.38 -850% | |
| Contrast (:1) | 9275 | 16800 81% | 1267 -86% | 1384 -85% | |
| Colorchecker dE 2000 * | 2.5 | 1.8 28% | 2.37 5% | 1.7 32% | 1.3 48% |
| Colorchecker dE 2000 max. * | 4.4 | 3.8 14% | 6.1 -39% | 3.3 25% | 2.7 39% |
| Colorchecker dE 2000 calibrated * | 1.9 | 1.8 5% | 1.1 42% | 0.7 63% | |
| Greyscale dE 2000 * | 2 | 0.9 55% | 2 -0% | 2.3 -15% | 2 -0% |
| Gamma | 2.17 101% | 2.22 99% | 2.29 96% | 2.14 103% | 2.25 98% |
| CCT | 6228 104% | 6580 99% | 6261 104% | 6499 100% | 6858 95% |
| Total Average (Program / Settings) | 5% /
14% | -13% /
-9% | -670% /
-329% | -543% /
-273% |
* ... smaller is better
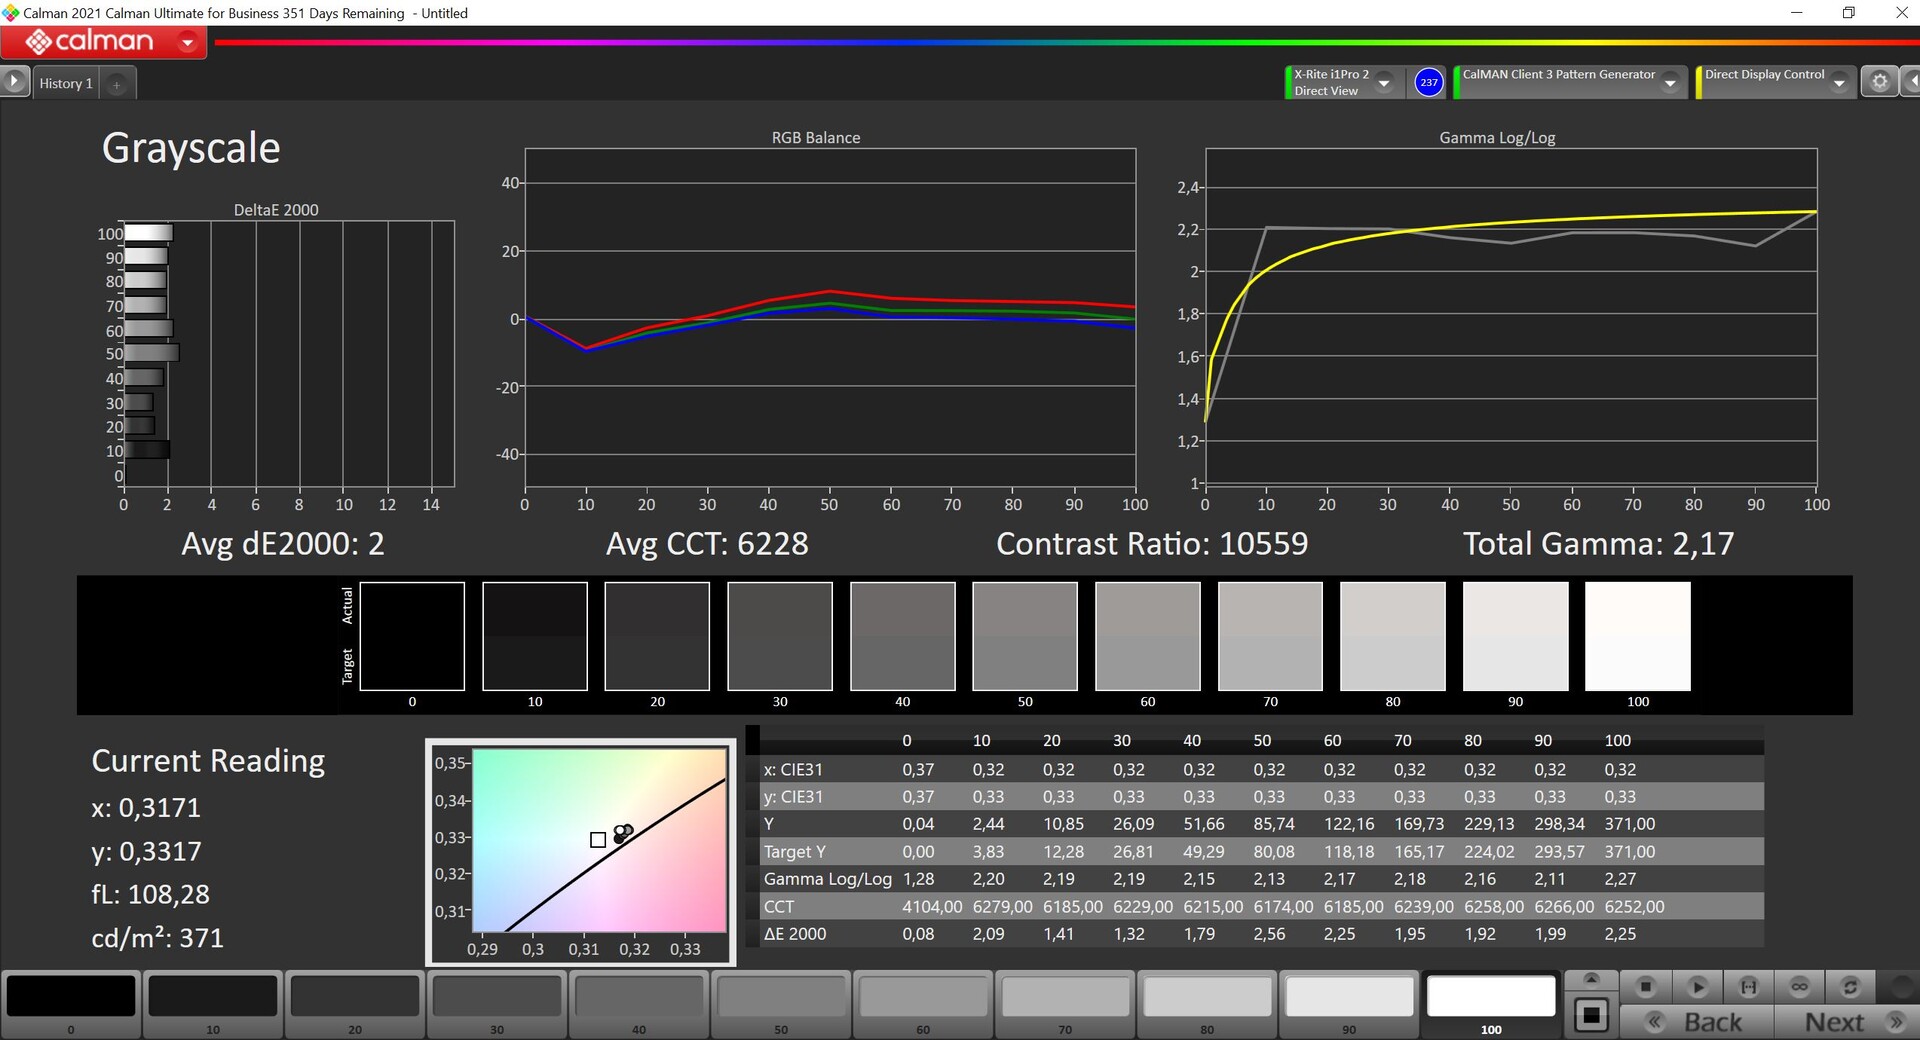
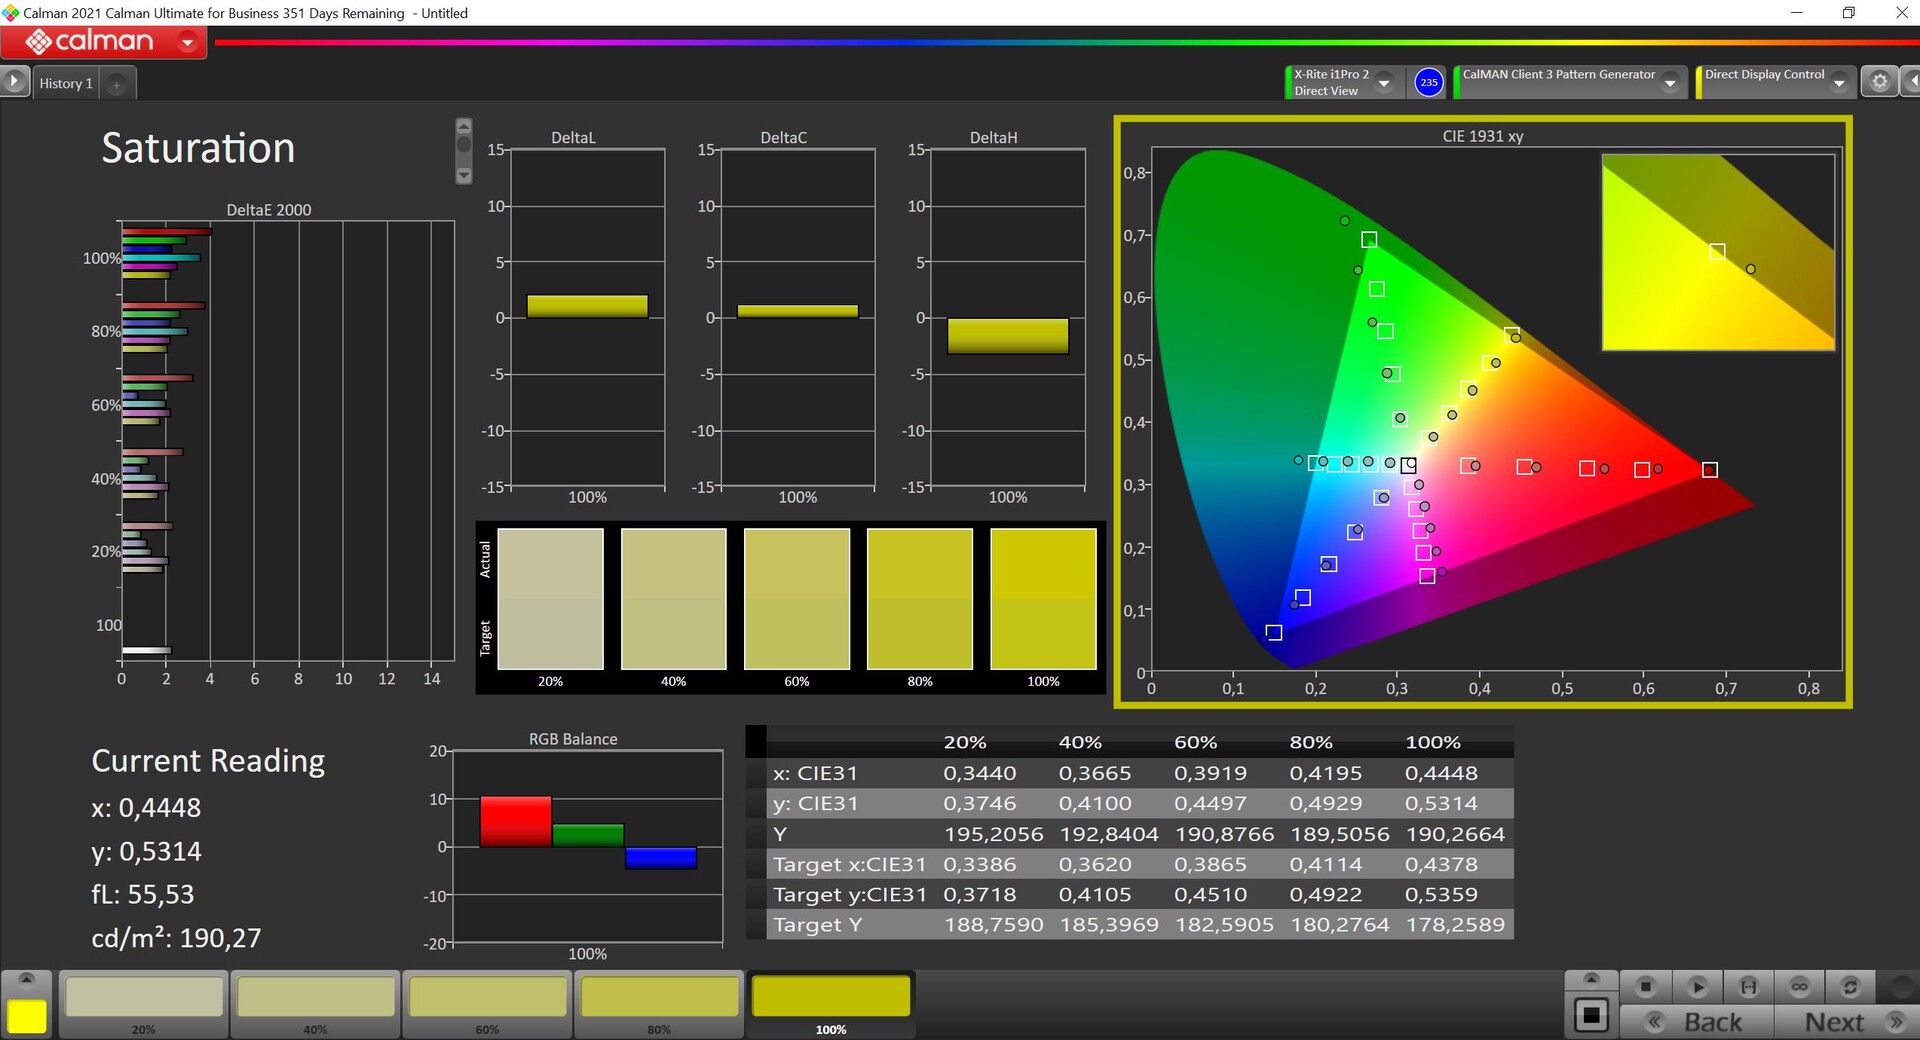
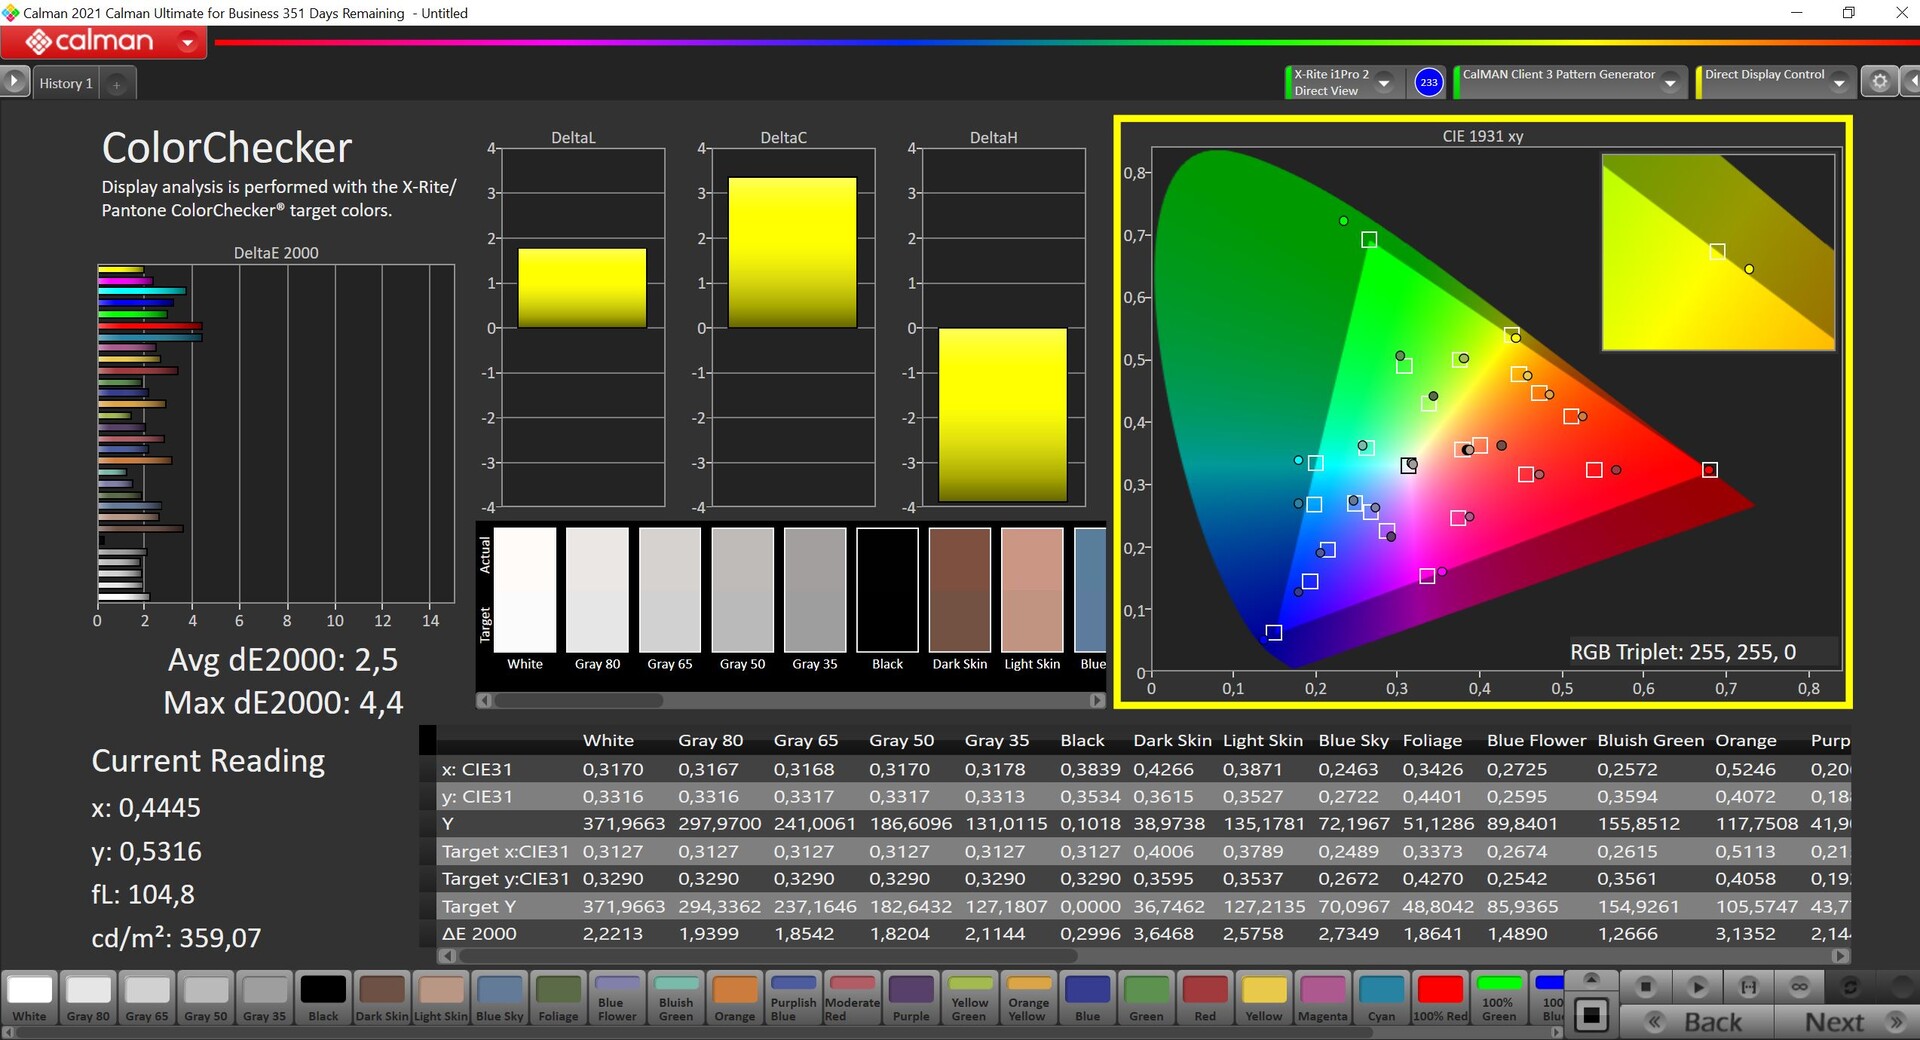
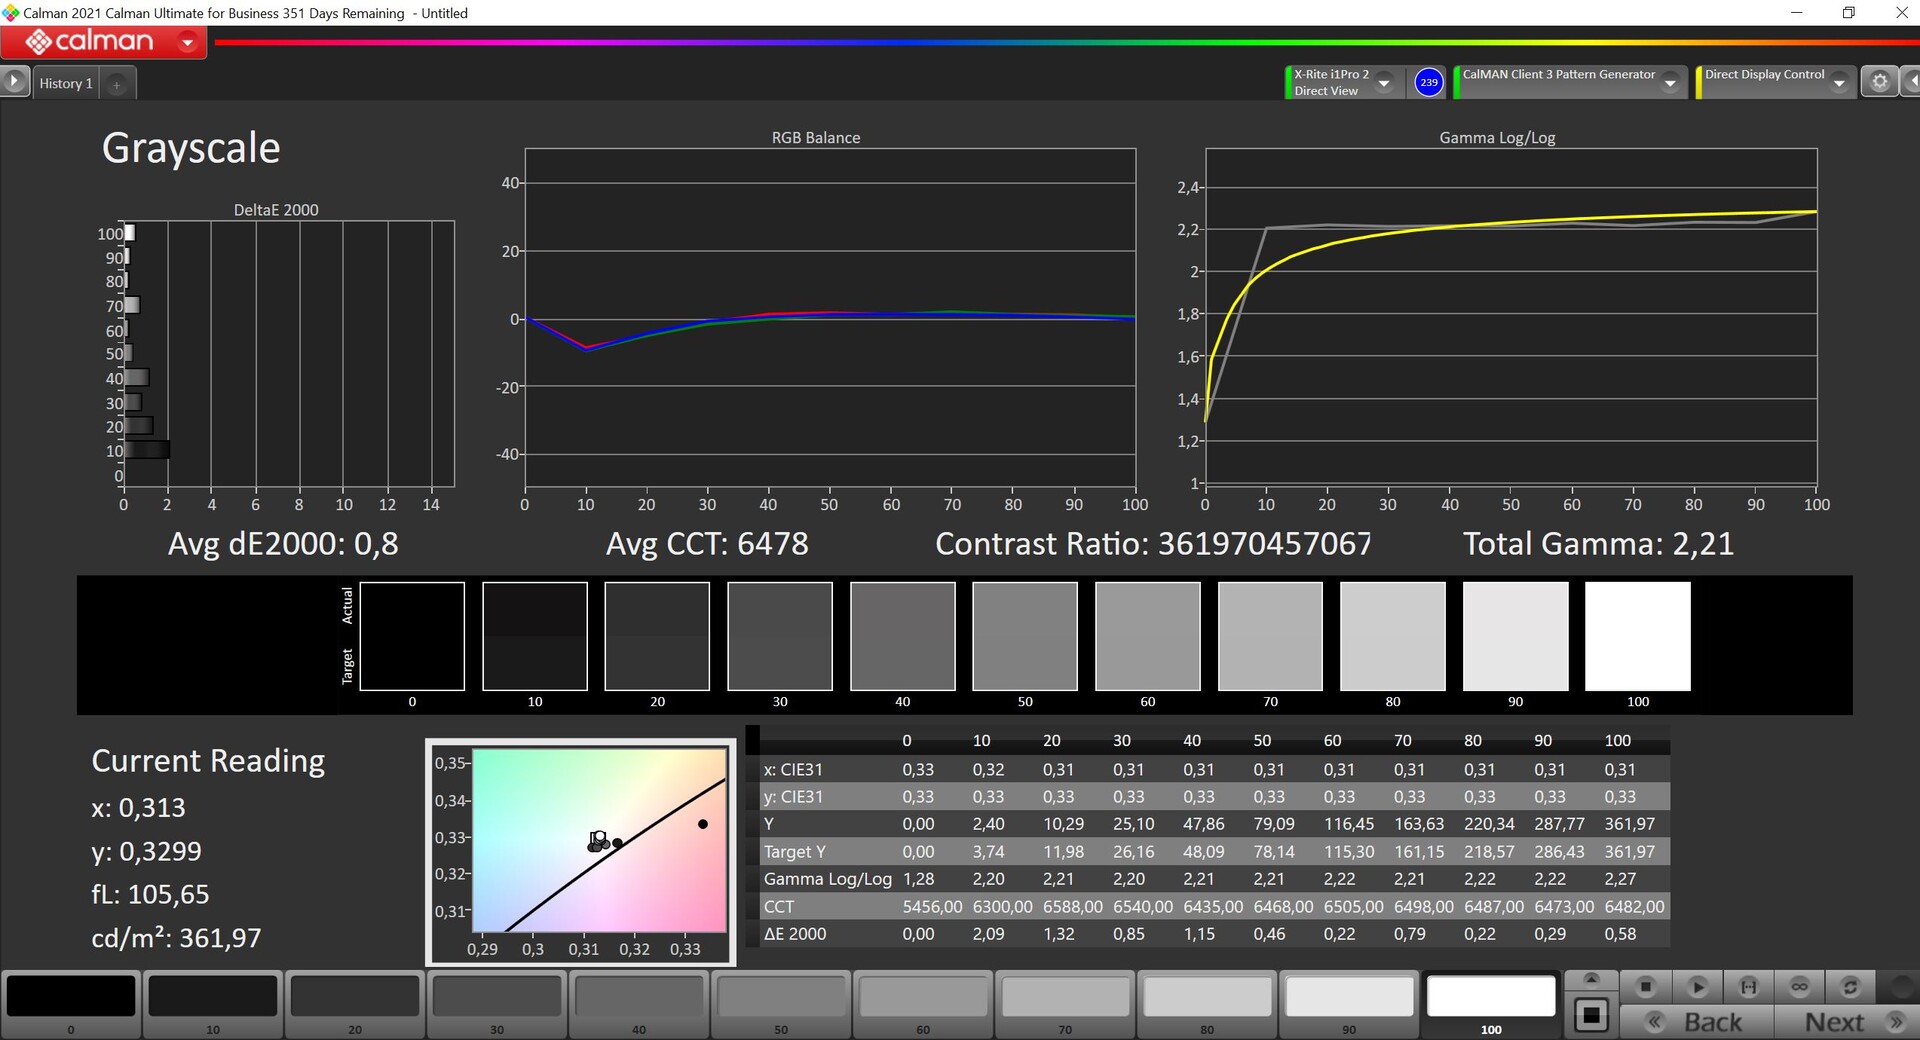
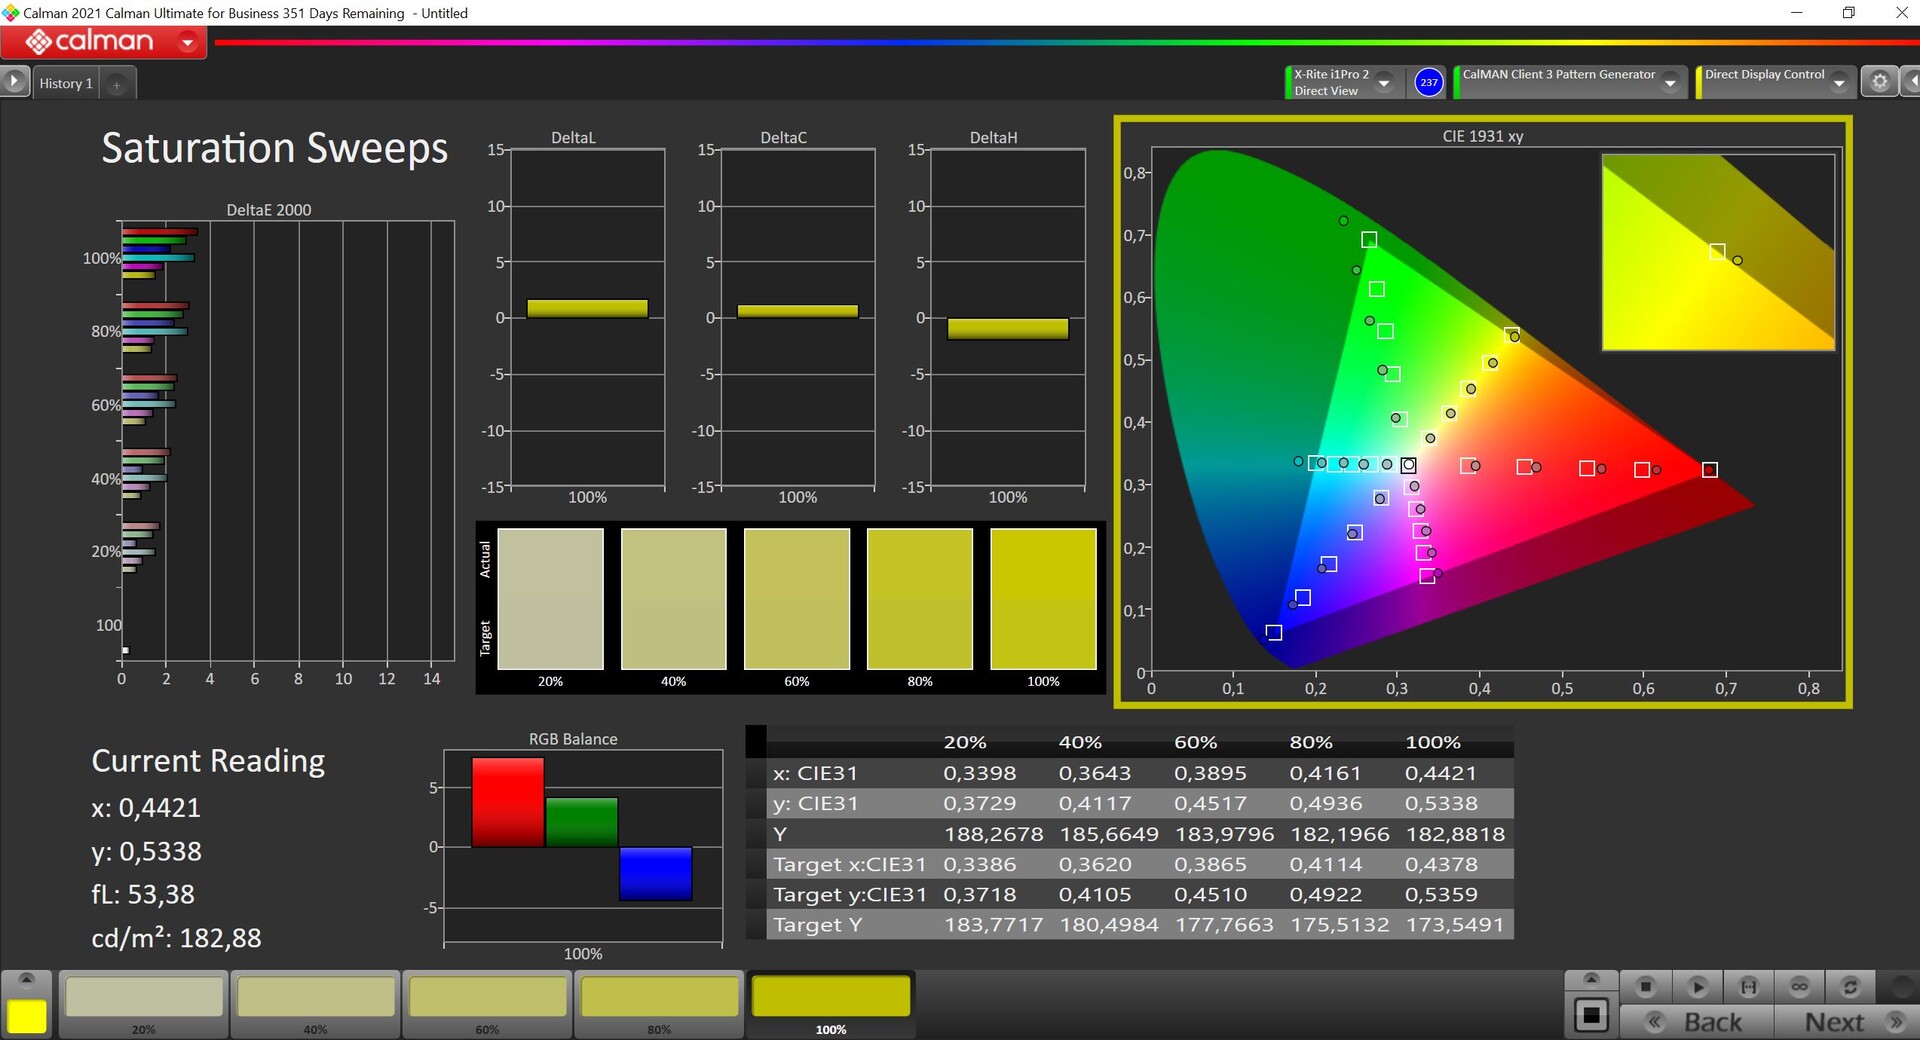
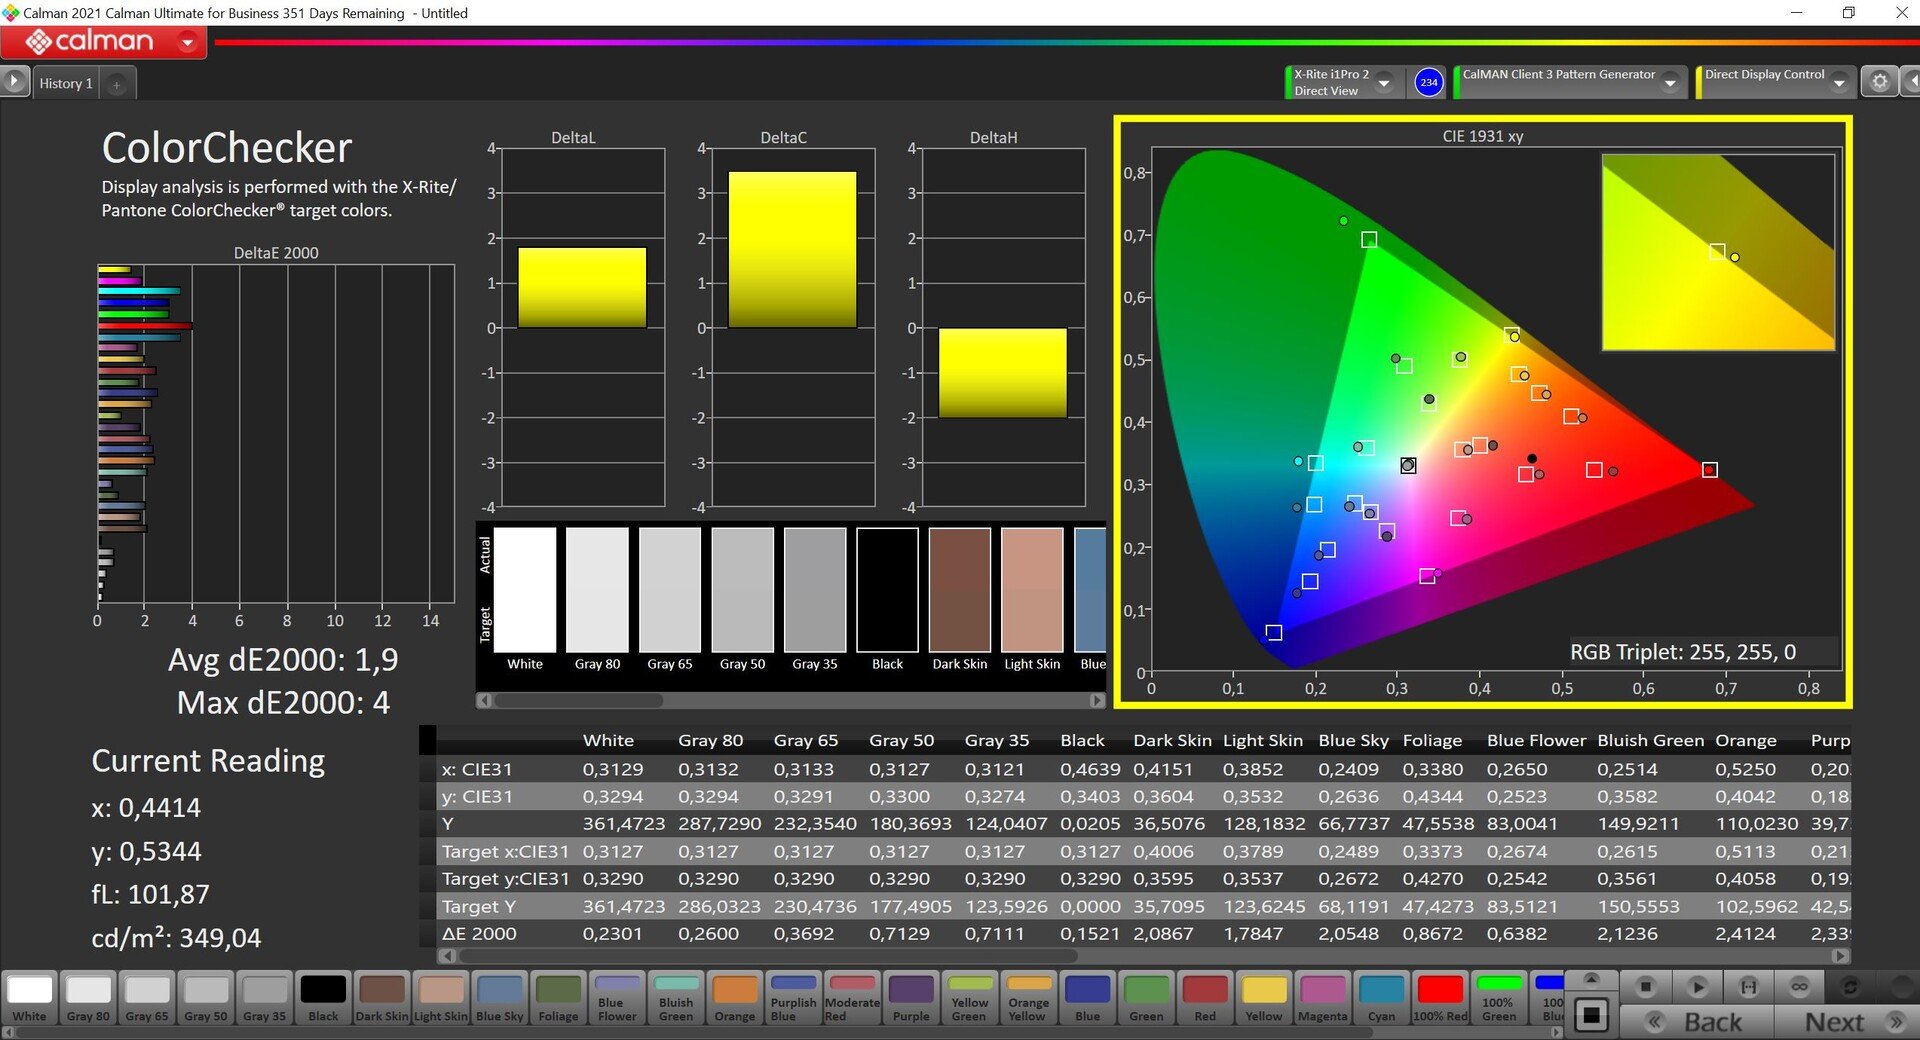
我们使用专业的CalMAN软件(X-Rite i1 Pro 2)进行的分析表明,交付的OLED屏幕已经进行了适当的校准。真红的偏色最小,色温略微过暖。我们能够通过自己的校准来进一步改善显示器(配置文件可在上面下载),大多数颜色都低于3的重要限制,P3色彩空间被完全覆盖。
Display Response Times
| ↔ Response Time Black to White | ||
|---|---|---|
| 1.6 ms ... rise ↗ and fall ↘ combined | ↗ 0.8 ms rise | 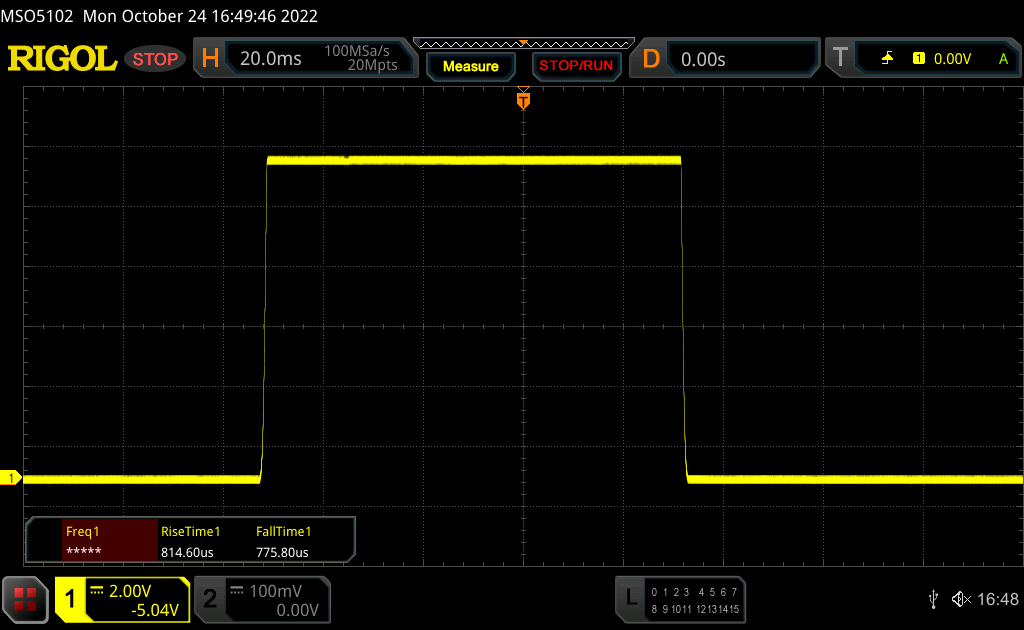 |
| ↘ 0.8 ms fall | ||
| The screen shows very fast response rates in our tests and should be very well suited for fast-paced gaming. In comparison, all tested devices range from 0.1 (minimum) to 240 (maximum) ms. » 10 % of all devices are better. This means that the measured response time is better than the average of all tested devices (19.8 ms). | ||
| ↔ Response Time 50% Grey to 80% Grey | ||
| 1.9 ms ... rise ↗ and fall ↘ combined | ↗ 1 ms rise | 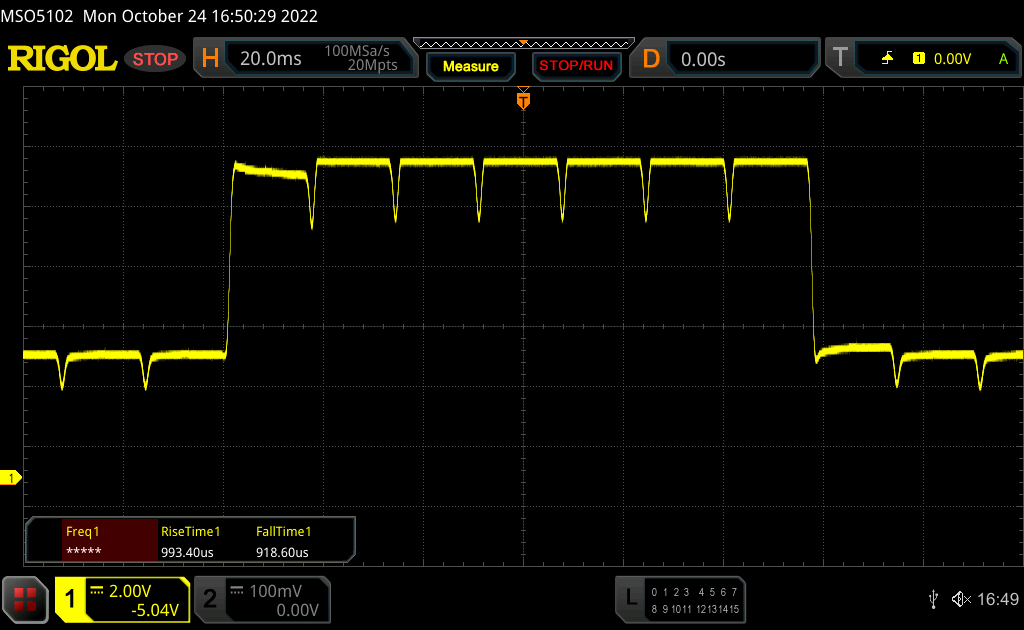 |
| ↘ 0.9 ms fall | ||
| The screen shows very fast response rates in our tests and should be very well suited for fast-paced gaming. In comparison, all tested devices range from 0.165 (minimum) to 636 (maximum) ms. » 9 % of all devices are better. This means that the measured response time is better than the average of all tested devices (31 ms). | ||
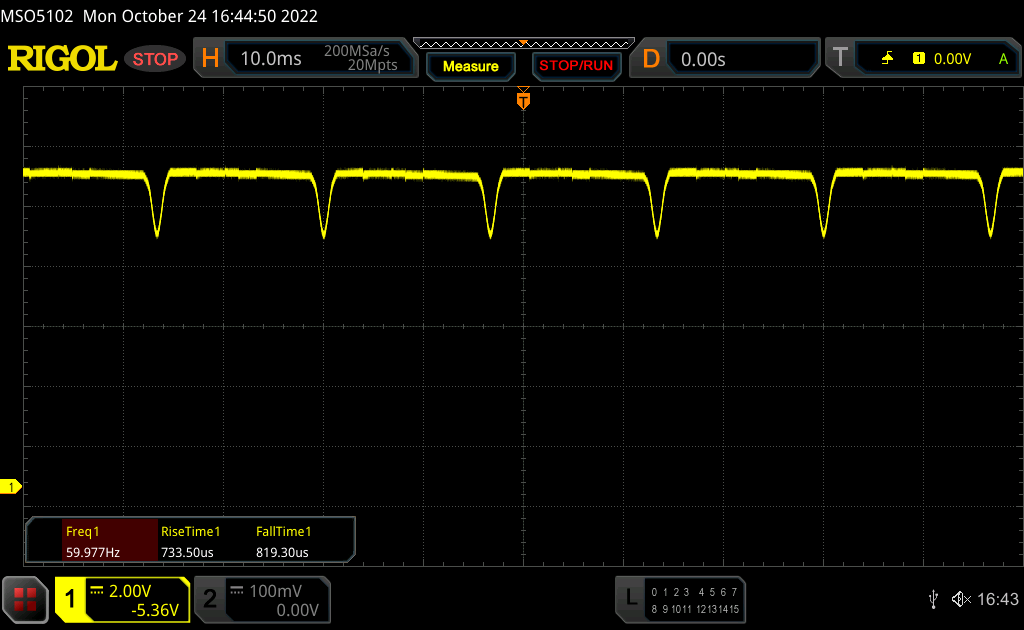
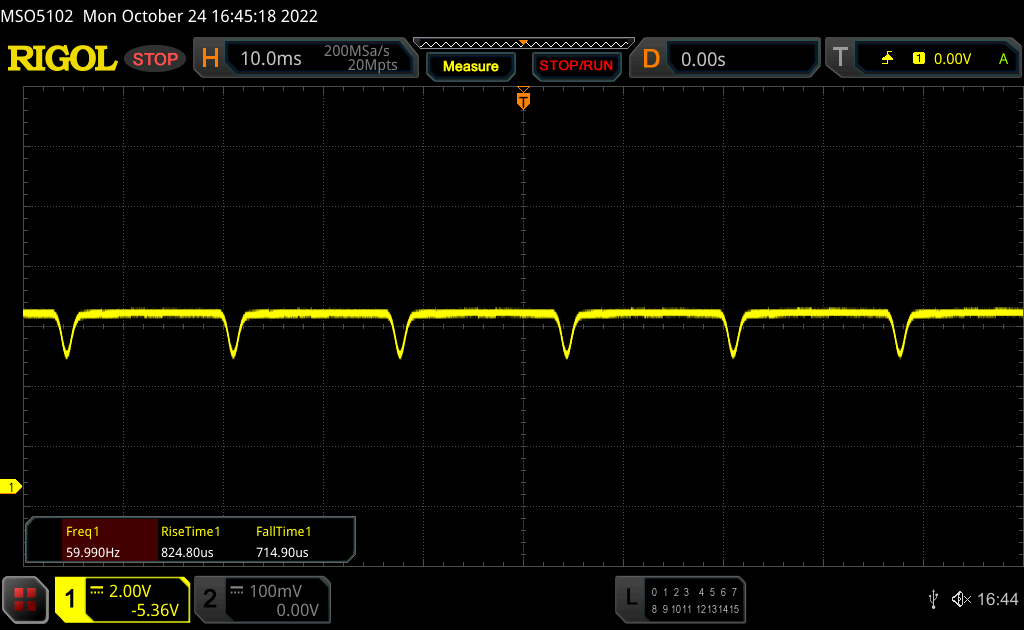
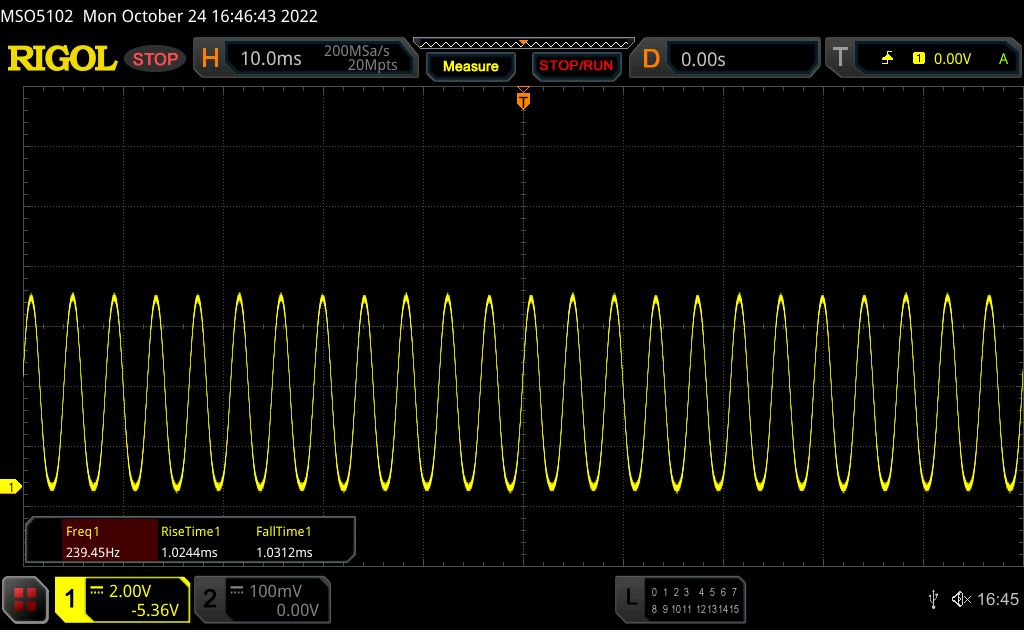
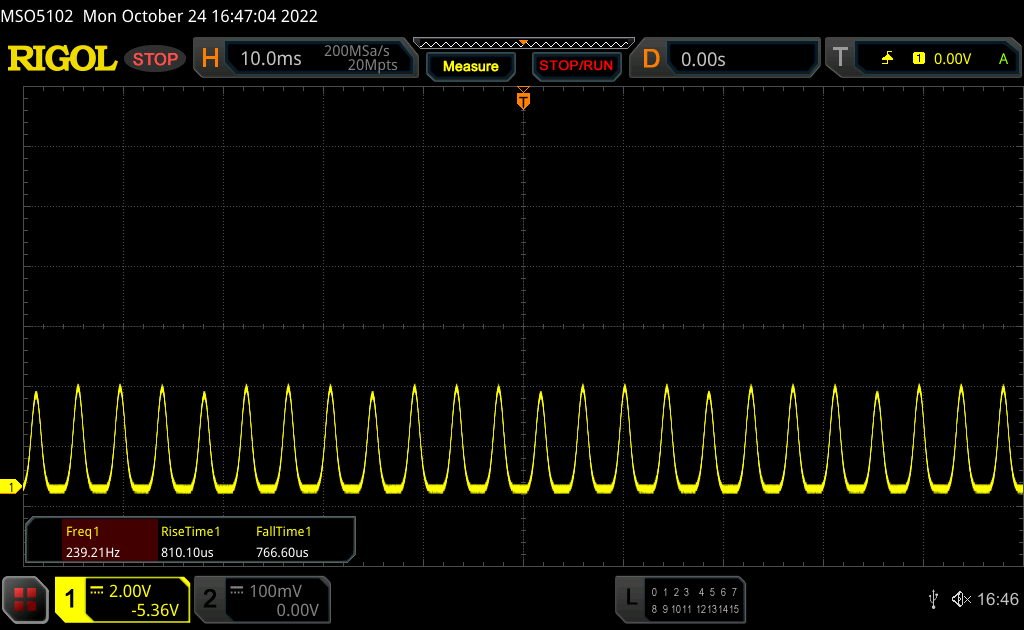
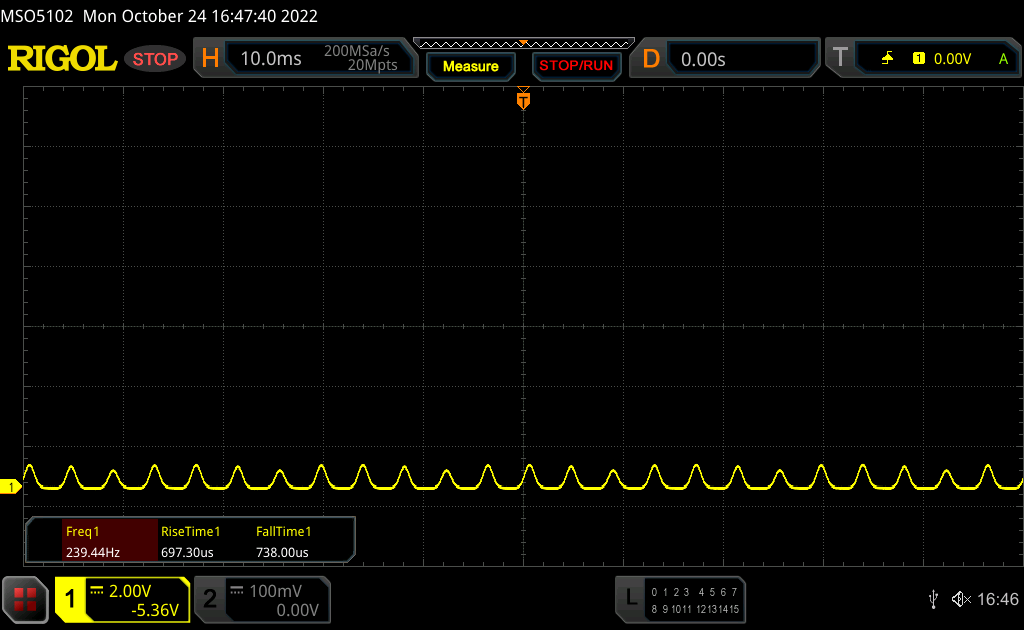
Screen Flickering / PWM (Pulse-Width Modulation)
| Screen flickering / PWM detected | 240 Hz | ≤ 50 % brightness setting | 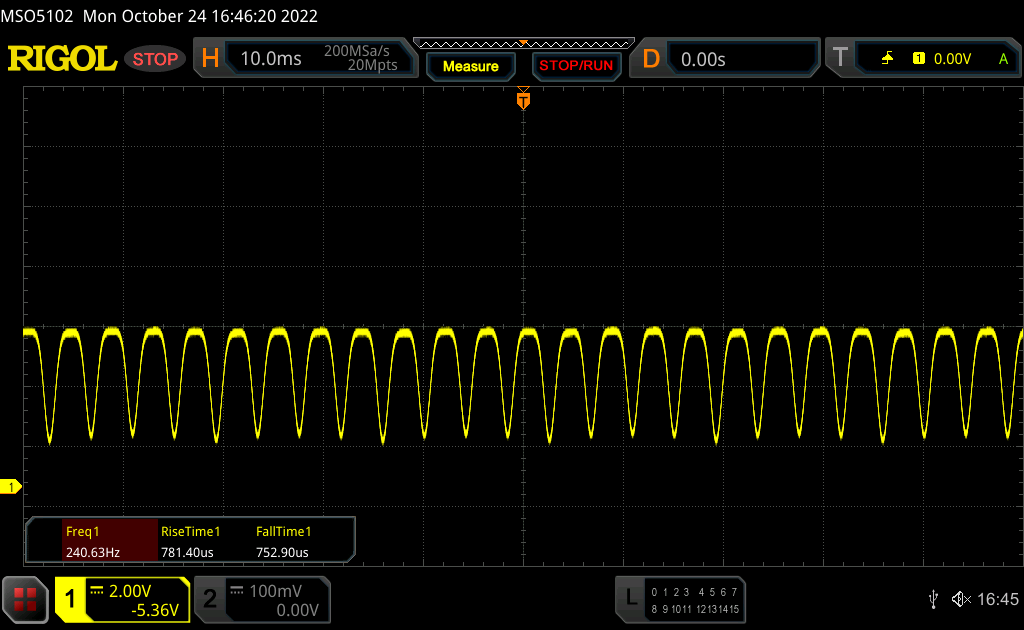 |
| ≤ 86 cd/m² brightness | |||
The display backlight flickers at 240 Hz (worst case, e.g., utilizing PWM) Flickering detected at a brightness setting of 50 % (86 cd/m²) and below. There should be no flickering or PWM above this brightness setting. The frequency of 240 Hz is relatively low, so sensitive users will likely notice flickering and experience eyestrain at the stated brightness setting and below. Flickering occurs at relatively low brightness settings, so extended use at this brightness setting or lower can cause eyestrain. In comparison: 52 % of all tested devices do not use PWM to dim the display. If PWM was detected, an average of 7757 (minimum: 5 - maximum: 343500) Hz was measured. | |||
在51-90%的亮度范围内,采用了频率为60赫兹的直流调光,但由于这里的振幅很低,应该没有问题。从50%(约86cd/m²)或更低的亮度开始,我们可以检测到众所周知的240赫兹的PWM闪烁。联想没有提供像华硕Zenbook S 13那样的软件解决方案,即使在较低的亮度水平也能实现直流调光。

反射发生时,当然是反射式显示屏的问题,但只要你能避免,即使在明亮的日子里,由于极高的对比度,屏幕内容也能在户外正常阅读。
性能 - AMD Ryzen 7 Pro 6860Z
测试条件
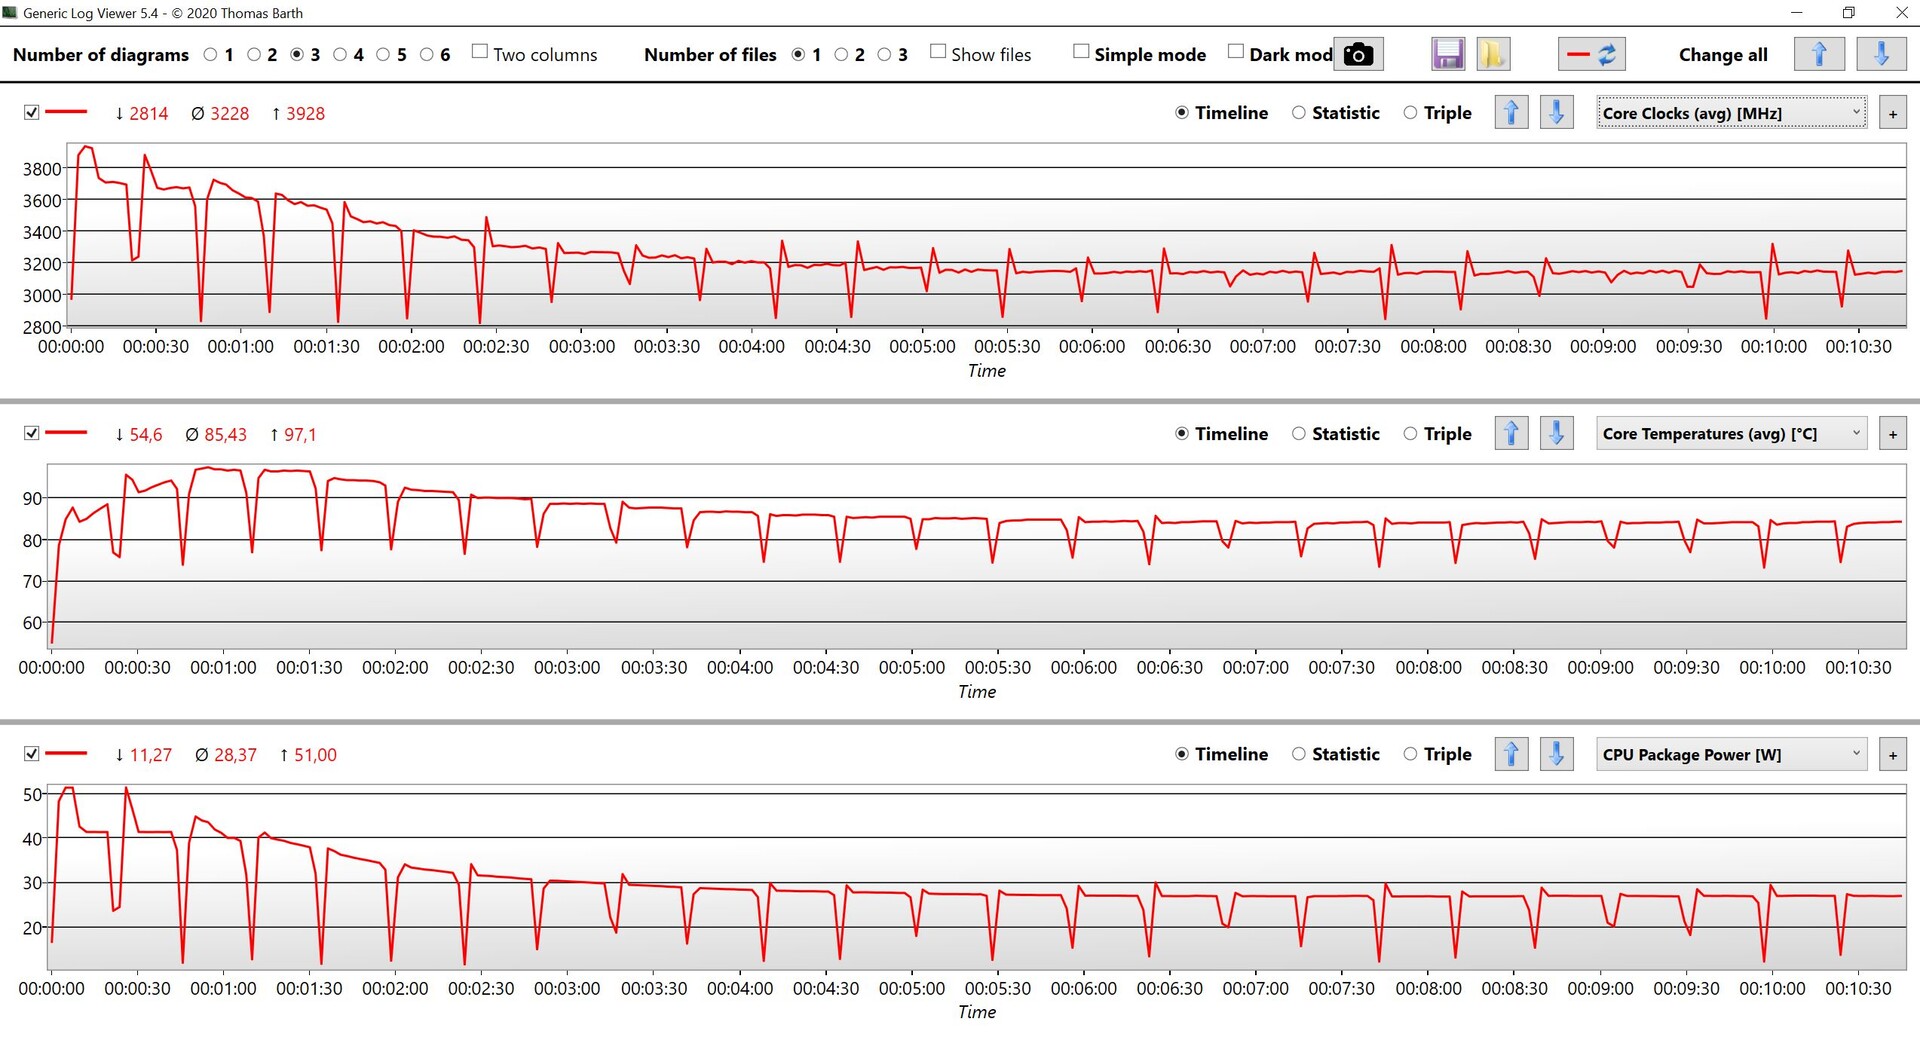
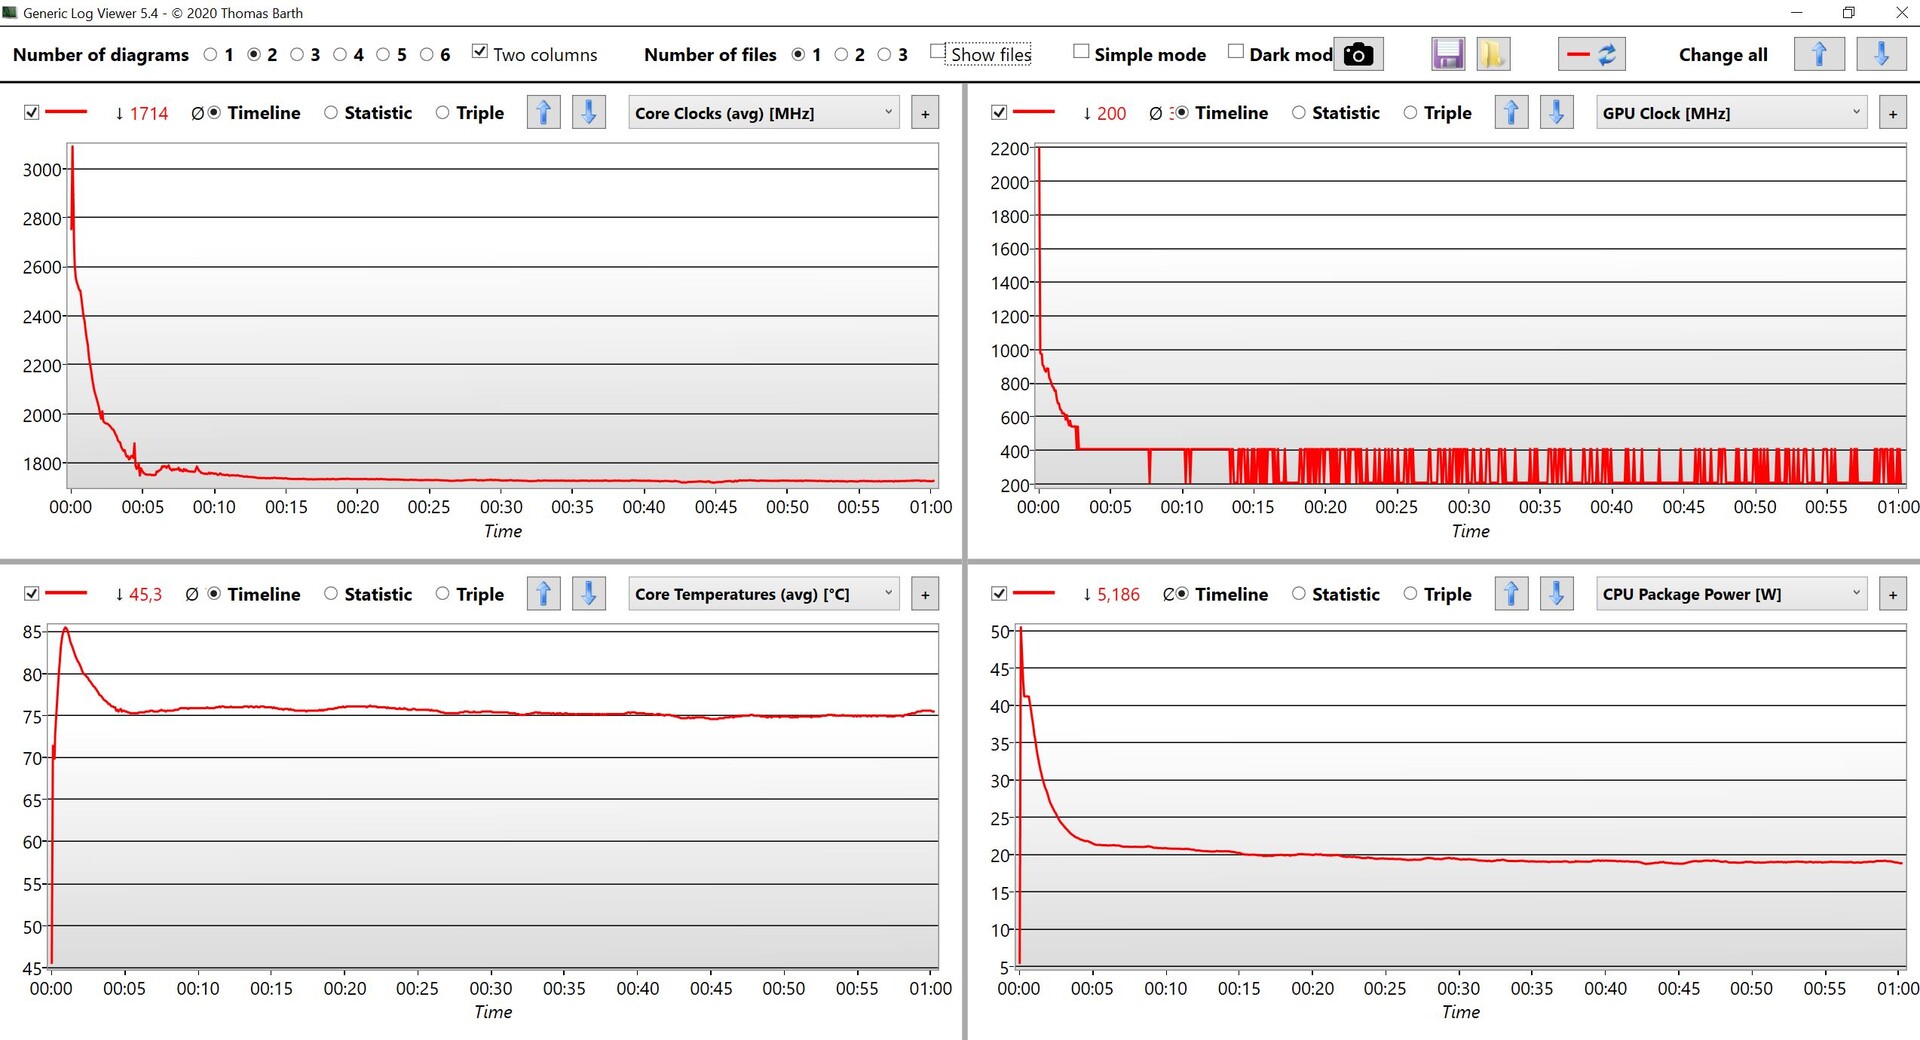
除了正常的Windows性能设置外,AMD ThinkPad还提供了智能冷却功能,可以通过组合键Fn+T来停用。在我们对Ryzen 7 Pro的测试中,当该功能被激活时,我们得到了稍好的结果。基本上,处理器在短时间内被分配到51瓦特,然后稳定到27瓦特。
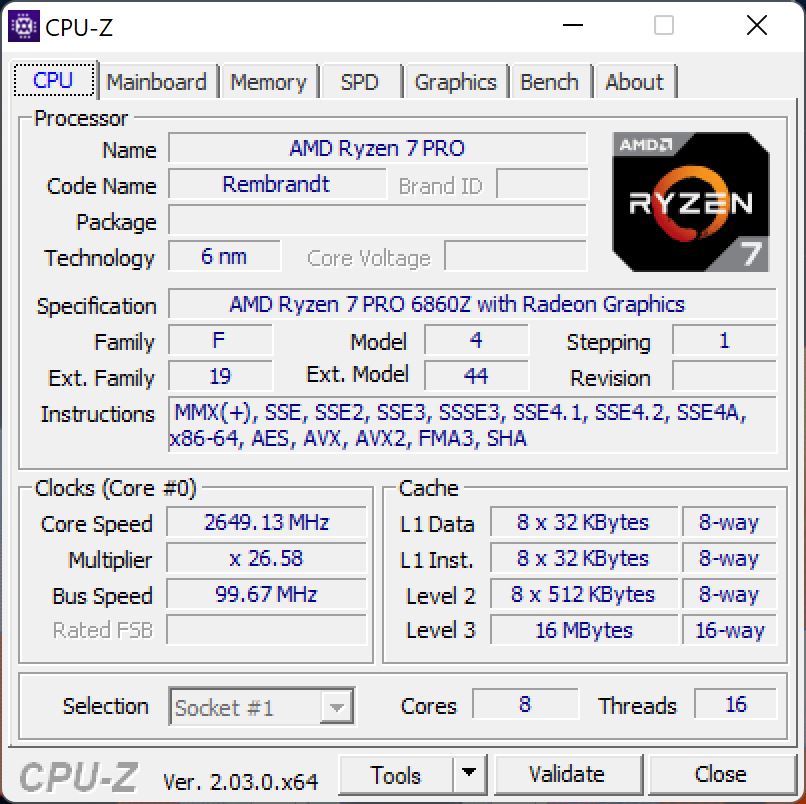
处理器
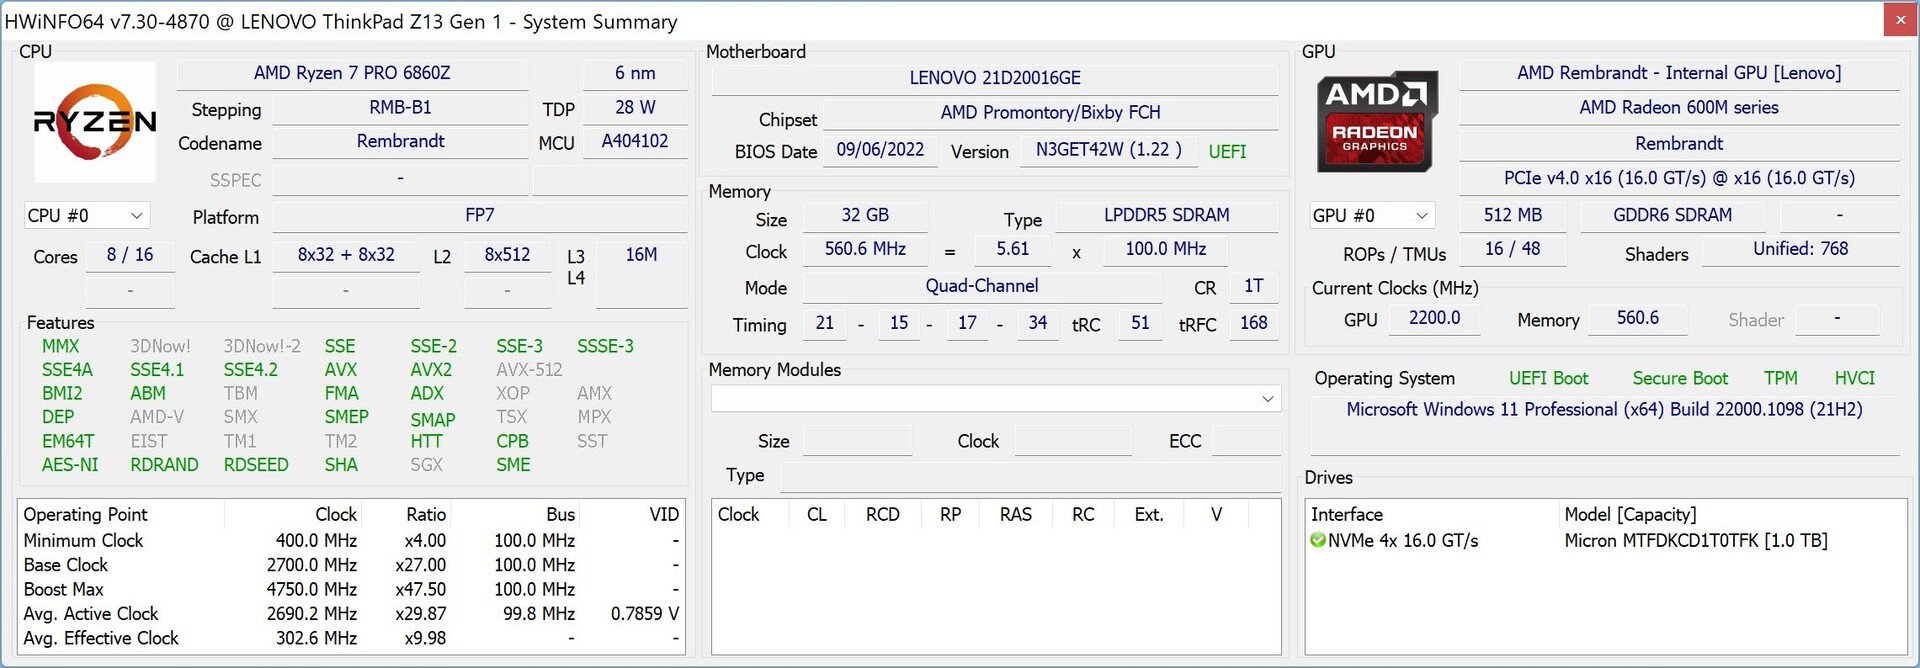
联想为ThinkPad Z13的顶级型号配备了AMD Ryzen 7 Pro 6860Z,这是该型号独有的。关于这款芯片的调整的文件很少,甚至在我们的测试之后,我们也没有什么头绪。原则上,它是一个标准的Ryzen 7 Pro 6850U(也可用于Z13),只是最大提升时钟被设置为4.75GHz,高出50MHz。两个Ryzen 7 Pro型号都可以配置高达32GB的内存。
CPU性能非常好,特别是在最初的几分钟,因为功耗不会立即下降。然而,在永久负载下,Ryzen 7 Pro 6860Z与Ryzen 7 Pro 6850U以及消费者Ryzen 7 6800U相当,如果它们在相同/相似的TDP(一般为25瓦)下运行。ThinkPad Z13的Ryzen 5 Pro 6650U在我们所有的CPU基准测试中平均慢19%。
Cinebench R15 score
在电池电量方面,多核性能降低了约30%,但单核性能保持稳定。更多CPU基准测试可在 我们的技术部分.
Cinebench R23: Multi Core | Single Core
Cinebench R20: CPU (Multi Core) | CPU (Single Core)
Cinebench R15: CPU Multi 64Bit | CPU Single 64Bit
Blender: v2.79 BMW27 CPU
7-Zip 18.03: 7z b 4 | 7z b 4 -mmt1
Geekbench 5.5: Multi-Core | Single-Core
HWBOT x265 Benchmark v2.2: 4k Preset
LibreOffice : 20 Documents To PDF
R Benchmark 2.5: Overall mean
| CPU Performance rating | |
| Lenovo ThinkPad Z16 G1 21D5S00T00 | |
| Dell XPS 13 Plus 9320 i7-1280P OLED | |
| Average of class Subnotebook | |
| Lenovo ThinkPad Z13 G1-21D20016GE | |
| Average AMD Ryzen 7 PRO 6860Z | |
| Lenovo ThinkPad T14 G3-21CF004NGE | |
| Asus Zenbook S 13 OLED | |
| Apple MacBook Air M2 10C GPU -5! | |
| Lenovo ThinkPad Z13 21D2CTO1WW | |
| Cinebench R23 / Multi Core | |
| Average of class Subnotebook (1555 - 21812, n=60, last 2 years) | |
| Lenovo ThinkPad Z16 G1 21D5S00T00 | |
| Dell XPS 13 Plus 9320 i7-1280P OLED | |
| Lenovo ThinkPad Z13 G1-21D20016GE | |
| Average AMD Ryzen 7 PRO 6860Z (n=1) | |
| Asus Zenbook S 13 OLED | |
| Lenovo ThinkPad T14 G3-21CF004NGE | |
| Lenovo ThinkPad Z13 21D2CTO1WW | |
| Apple MacBook Air M2 10C GPU | |
| Cinebench R23 / Single Core | |
| Average of class Subnotebook (358 - 2213, n=61, last 2 years) | |
| Dell XPS 13 Plus 9320 i7-1280P OLED | |
| Apple MacBook Air M2 10C GPU | |
| Lenovo ThinkPad T14 G3-21CF004NGE | |
| Lenovo ThinkPad Z16 G1 21D5S00T00 | |
| Asus Zenbook S 13 OLED | |
| Lenovo ThinkPad Z13 G1-21D20016GE | |
| Average AMD Ryzen 7 PRO 6860Z (n=1) | |
| Lenovo ThinkPad Z13 21D2CTO1WW | |
| Cinebench R20 / CPU (Multi Core) | |
| Lenovo ThinkPad Z16 G1 21D5S00T00 | |
| Average of class Subnotebook (579 - 8541, n=57, last 2 years) | |
| Dell XPS 13 Plus 9320 i7-1280P OLED | |
| Lenovo ThinkPad Z13 G1-21D20016GE | |
| Average AMD Ryzen 7 PRO 6860Z (n=1) | |
| Lenovo ThinkPad T14 G3-21CF004NGE | |
| Asus Zenbook S 13 OLED | |
| Lenovo ThinkPad Z13 21D2CTO1WW | |
| Apple MacBook Air M2 10C GPU | |
| Cinebench R20 / CPU (Single Core) | |
| Average of class Subnotebook (128 - 832, n=57, last 2 years) | |
| Dell XPS 13 Plus 9320 i7-1280P OLED | |
| Lenovo ThinkPad Z13 G1-21D20016GE | |
| Average AMD Ryzen 7 PRO 6860Z (n=1) | |
| Lenovo ThinkPad T14 G3-21CF004NGE | |
| Lenovo ThinkPad Z16 G1 21D5S00T00 | |
| Lenovo ThinkPad Z13 21D2CTO1WW | |
| Asus Zenbook S 13 OLED | |
| Apple MacBook Air M2 10C GPU | |
| Cinebench R15 / CPU Multi 64Bit | |
| Lenovo ThinkPad Z16 G1 21D5S00T00 | |
| Average of class Subnotebook (327 - 3345, n=57, last 2 years) | |
| Lenovo ThinkPad Z13 G1-21D20016GE | |
| Average AMD Ryzen 7 PRO 6860Z (n=1) | |
| Dell XPS 13 Plus 9320 i7-1280P OLED | |
| Lenovo ThinkPad T14 G3-21CF004NGE | |
| Asus Zenbook S 13 OLED | |
| Lenovo ThinkPad Z13 21D2CTO1WW | |
| Apple MacBook Air M2 10C GPU | |
| Cinebench R15 / CPU Single 64Bit | |
| Average of class Subnotebook (72.4 - 322, n=57, last 2 years) | |
| Lenovo ThinkPad Z16 G1 21D5S00T00 | |
| Asus Zenbook S 13 OLED | |
| Lenovo ThinkPad T14 G3-21CF004NGE | |
| Lenovo ThinkPad Z13 21D2CTO1WW | |
| Lenovo ThinkPad Z13 G1-21D20016GE | |
| Average AMD Ryzen 7 PRO 6860Z (n=1) | |
| Dell XPS 13 Plus 9320 i7-1280P OLED | |
| Apple MacBook Air M2 10C GPU | |
| Blender / v2.79 BMW27 CPU | |
| Apple MacBook Air M2 10C GPU | |
| Lenovo ThinkPad Z13 21D2CTO1WW | |
| Average of class Subnotebook (159 - 2271, n=58, last 2 years) | |
| Asus Zenbook S 13 OLED | |
| Lenovo ThinkPad T14 G3-21CF004NGE | |
| Lenovo ThinkPad Z13 G1-21D20016GE | |
| Average AMD Ryzen 7 PRO 6860Z (n=1) | |
| Dell XPS 13 Plus 9320 i7-1280P OLED | |
| Lenovo ThinkPad Z16 G1 21D5S00T00 | |
| 7-Zip 18.03 / 7z b 4 | |
| Lenovo ThinkPad Z16 G1 21D5S00T00 | |
| Lenovo ThinkPad Z13 G1-21D20016GE | |
| Average AMD Ryzen 7 PRO 6860Z (n=1) | |
| Lenovo ThinkPad T14 G3-21CF004NGE | |
| Dell XPS 13 Plus 9320 i7-1280P OLED | |
| Asus Zenbook S 13 OLED | |
| Average of class Subnotebook (11668 - 77867, n=57, last 2 years) | |
| Lenovo ThinkPad Z13 21D2CTO1WW | |
| 7-Zip 18.03 / 7z b 4 -mmt1 | |
| Average of class Subnotebook (2643 - 6699, n=59, last 2 years) | |
| Asus Zenbook S 13 OLED | |
| Lenovo ThinkPad Z16 G1 21D5S00T00 | |
| Lenovo ThinkPad T14 G3-21CF004NGE | |
| Lenovo ThinkPad Z13 G1-21D20016GE | |
| Average AMD Ryzen 7 PRO 6860Z (n=1) | |
| Lenovo ThinkPad Z13 21D2CTO1WW | |
| Dell XPS 13 Plus 9320 i7-1280P OLED | |
| Geekbench 5.5 / Multi-Core | |
| Dell XPS 13 Plus 9320 i7-1280P OLED | |
| Average of class Subnotebook (2557 - 17218, n=48, last 2 years) | |
| Apple MacBook Air M2 10C GPU | |
| Lenovo ThinkPad Z16 G1 21D5S00T00 | |
| Lenovo ThinkPad Z13 G1-21D20016GE | |
| Average AMD Ryzen 7 PRO 6860Z (n=1) | |
| Lenovo ThinkPad T14 G3-21CF004NGE | |
| Asus Zenbook S 13 OLED | |
| Lenovo ThinkPad Z13 21D2CTO1WW | |
| Geekbench 5.5 / Single-Core | |
| Apple MacBook Air M2 10C GPU | |
| Average of class Subnotebook (726 - 2224, n=48, last 2 years) | |
| Dell XPS 13 Plus 9320 i7-1280P OLED | |
| Asus Zenbook S 13 OLED | |
| Lenovo ThinkPad T14 G3-21CF004NGE | |
| Lenovo ThinkPad Z16 G1 21D5S00T00 | |
| Lenovo ThinkPad Z13 21D2CTO1WW | |
| Lenovo ThinkPad Z13 G1-21D20016GE | |
| Average AMD Ryzen 7 PRO 6860Z (n=1) | |
| HWBOT x265 Benchmark v2.2 / 4k Preset | |
| Lenovo ThinkPad Z16 G1 21D5S00T00 | |
| Lenovo ThinkPad Z13 G1-21D20016GE | |
| Average AMD Ryzen 7 PRO 6860Z (n=1) | |
| Dell XPS 13 Plus 9320 i7-1280P OLED | |
| Lenovo ThinkPad T14 G3-21CF004NGE | |
| Average of class Subnotebook (0.97 - 25.1, n=57, last 2 years) | |
| Asus Zenbook S 13 OLED | |
| Lenovo ThinkPad Z13 21D2CTO1WW | |
| LibreOffice / 20 Documents To PDF | |
| Lenovo ThinkPad Z13 21D2CTO1WW | |
| Average of class Subnotebook (39.9 - 220, n=56, last 2 years) | |
| Asus Zenbook S 13 OLED | |
| Lenovo ThinkPad T14 G3-21CF004NGE | |
| Lenovo ThinkPad Z16 G1 21D5S00T00 | |
| Lenovo ThinkPad Z13 G1-21D20016GE | |
| Average AMD Ryzen 7 PRO 6860Z (n=1) | |
| Dell XPS 13 Plus 9320 i7-1280P OLED | |
| R Benchmark 2.5 / Overall mean | |
| Lenovo ThinkPad Z13 21D2CTO1WW | |
| Asus Zenbook S 13 OLED | |
| Average of class Subnotebook (0.4024 - 1.456, n=58, last 2 years) | |
| Lenovo ThinkPad T14 G3-21CF004NGE | |
| Lenovo ThinkPad Z13 G1-21D20016GE | |
| Average AMD Ryzen 7 PRO 6860Z (n=1) | |
| Lenovo ThinkPad Z16 G1 21D5S00T00 | |
| Dell XPS 13 Plus 9320 i7-1280P OLED | |
* ... smaller is better
然而,高功耗值对效率也有负面影响,你可以清楚地看到,Ryzen 7 CPU在25-30瓦的范围内运行效率更高。在下面的分析中,我们看看两个CPU基准测试Cinebench R15和Cinebench R23 Multi各自在外部显示器上运行的效率。这样我们就可以排除不同显示器性能的影响因素。在这里,你可以清楚地看到,Ryzen 7 Pro 6860Z落后于 华硕Zenbook S 13(Ryzen 7 6800U)和 联想ThinkPad T14 G3(Ryzen 7 Pro 6850U)。
| Power Consumption / Cinebench R23 Multi Power Efficiency - external Monitor | |
| Apple MacBook Air M2 10C GPU | |
| Lenovo ThinkPad T14 G3-21CF004NGE | |
| Lenovo Yoga 7-14ARB G7 | |
| Lenovo Yoga Slim 7 Carbon 13IAP7-82U9005FGE | |
| Lenovo ThinkPad Z13 G1-21D20016GE | |
| Schenker Vision 14 2022 RTX 3050 Ti | |
AIDA64: FP32 Ray-Trace | FPU Julia | CPU SHA3 | CPU Queen | FPU SinJulia | FPU Mandel | CPU AES | CPU ZLib | FP64 Ray-Trace | CPU PhotoWorxx
| Performance rating | |
| Lenovo ThinkPad Z16 G1 21D5S00T00 | |
| Lenovo ThinkPad Z13 G1-21D20016GE | |
| Average AMD Ryzen 7 PRO 6860Z | |
| Asus Zenbook S 13 OLED | |
| Average of class Subnotebook | |
| Lenovo ThinkPad T14 G3-21CF004NGE | |
| Dell XPS 13 Plus 9320 i7-1280P OLED | |
| Lenovo ThinkPad Z13 21D2CTO1WW | |
| AIDA64 / FP32 Ray-Trace | |
| Lenovo ThinkPad Z16 G1 21D5S00T00 | |
| Average of class Subnotebook (1135 - 32888, n=58, last 2 years) | |
| Lenovo ThinkPad Z13 G1-21D20016GE | |
| Average AMD Ryzen 7 PRO 6860Z (n=1) | |
| Lenovo ThinkPad T14 G3-21CF004NGE | |
| Asus Zenbook S 13 OLED | |
| Dell XPS 13 Plus 9320 i7-1280P OLED | |
| Lenovo ThinkPad Z13 21D2CTO1WW | |
| AIDA64 / FPU Julia | |
| Lenovo ThinkPad Z16 G1 21D5S00T00 | |
| Lenovo ThinkPad Z13 G1-21D20016GE | |
| Average AMD Ryzen 7 PRO 6860Z (n=1) | |
| Lenovo ThinkPad T14 G3-21CF004NGE | |
| Asus Zenbook S 13 OLED | |
| Average of class Subnotebook (5218 - 123315, n=58, last 2 years) | |
| Lenovo ThinkPad Z13 21D2CTO1WW | |
| Dell XPS 13 Plus 9320 i7-1280P OLED | |
| AIDA64 / CPU SHA3 | |
| Lenovo ThinkPad Z16 G1 21D5S00T00 | |
| Average of class Subnotebook (444 - 5287, n=58, last 2 years) | |
| Lenovo ThinkPad Z13 G1-21D20016GE | |
| Average AMD Ryzen 7 PRO 6860Z (n=1) | |
| Dell XPS 13 Plus 9320 i7-1280P OLED | |
| Lenovo ThinkPad T14 G3-21CF004NGE | |
| Asus Zenbook S 13 OLED | |
| Lenovo ThinkPad Z13 21D2CTO1WW | |
| AIDA64 / CPU Queen | |
| Lenovo ThinkPad Z16 G1 21D5S00T00 | |
| Lenovo ThinkPad Z13 G1-21D20016GE | |
| Average AMD Ryzen 7 PRO 6860Z (n=1) | |
| Dell XPS 13 Plus 9320 i7-1280P OLED | |
| Lenovo ThinkPad T14 G3-21CF004NGE | |
| Asus Zenbook S 13 OLED | |
| Lenovo ThinkPad Z13 21D2CTO1WW | |
| Average of class Subnotebook (10579 - 95002, n=49, last 2 years) | |
| AIDA64 / FPU SinJulia | |
| Lenovo ThinkPad Z16 G1 21D5S00T00 | |
| Lenovo ThinkPad Z13 G1-21D20016GE | |
| Average AMD Ryzen 7 PRO 6860Z (n=1) | |
| Lenovo ThinkPad T14 G3-21CF004NGE | |
| Asus Zenbook S 13 OLED | |
| Lenovo ThinkPad Z13 21D2CTO1WW | |
| Dell XPS 13 Plus 9320 i7-1280P OLED | |
| Average of class Subnotebook (744 - 18418, n=58, last 2 years) | |
| AIDA64 / FPU Mandel | |
| Lenovo ThinkPad Z16 G1 21D5S00T00 | |
| Lenovo ThinkPad Z13 G1-21D20016GE | |
| Average AMD Ryzen 7 PRO 6860Z (n=1) | |
| Lenovo ThinkPad T14 G3-21CF004NGE | |
| Asus Zenbook S 13 OLED | |
| Lenovo ThinkPad Z13 21D2CTO1WW | |
| Average of class Subnotebook (3341 - 65433, n=58, last 2 years) | |
| Dell XPS 13 Plus 9320 i7-1280P OLED | |
| AIDA64 / CPU AES | |
| Asus Zenbook S 13 OLED | |
| Lenovo ThinkPad Z16 G1 21D5S00T00 | |
| Lenovo ThinkPad Z13 G1-21D20016GE | |
| Average AMD Ryzen 7 PRO 6860Z (n=1) | |
| Dell XPS 13 Plus 9320 i7-1280P OLED | |
| Average of class Subnotebook (638 - 96917, n=58, last 2 years) | |
| Lenovo ThinkPad T14 G3-21CF004NGE | |
| Lenovo ThinkPad Z13 21D2CTO1WW | |
| AIDA64 / CPU ZLib | |
| Lenovo ThinkPad Z16 G1 21D5S00T00 | |
| Average of class Subnotebook (164.9 - 1379, n=58, last 2 years) | |
| Dell XPS 13 Plus 9320 i7-1280P OLED | |
| Lenovo ThinkPad T14 G3-21CF004NGE | |
| Lenovo ThinkPad Z13 G1-21D20016GE | |
| Average AMD Ryzen 7 PRO 6860Z (n=1) | |
| Asus Zenbook S 13 OLED | |
| Lenovo ThinkPad Z13 21D2CTO1WW | |
| AIDA64 / FP64 Ray-Trace | |
| Lenovo ThinkPad Z16 G1 21D5S00T00 | |
| Average of class Subnotebook (610 - 17495, n=58, last 2 years) | |
| Lenovo ThinkPad Z13 G1-21D20016GE | |
| Average AMD Ryzen 7 PRO 6860Z (n=1) | |
| Lenovo ThinkPad T14 G3-21CF004NGE | |
| Dell XPS 13 Plus 9320 i7-1280P OLED | |
| Asus Zenbook S 13 OLED | |
| Lenovo ThinkPad Z13 21D2CTO1WW | |
| AIDA64 / CPU PhotoWorxx | |
| Average of class Subnotebook (6569 - 85600, n=58, last 2 years) | |
| Dell XPS 13 Plus 9320 i7-1280P OLED | |
| Lenovo ThinkPad Z16 G1 21D5S00T00 | |
| Lenovo ThinkPad Z13 21D2CTO1WW | |
| Lenovo ThinkPad T14 G3-21CF004NGE | |
| Asus Zenbook S 13 OLED | |
| Lenovo ThinkPad Z13 G1-21D20016GE | |
| Average AMD Ryzen 7 PRO 6860Z (n=1) | |
系统性能
ThinkPad Z13是一款反应非常迅速的设备,合成基准测试结果也非常好。我们在运行测试时没有发现任何问题。
CrossMark: Overall | Productivity | Creativity | Responsiveness
| PCMark 10 / Score | |
| Average of class Subnotebook (4920 - 9939, n=45, last 2 years) | |
| Lenovo ThinkPad Z16 G1 21D5S00T00 | |
| Asus Zenbook S 13 OLED | |
| Lenovo ThinkPad Z13 G1-21D20016GE | |
| Average AMD Ryzen 7 PRO 6860Z, AMD Radeon 680M (n=1) | |
| Lenovo ThinkPad T14 G3-21CF004NGE | |
| Dell XPS 13 Plus 9320 i7-1280P OLED | |
| Lenovo ThinkPad Z13 21D2CTO1WW | |
| PCMark 10 / Essentials | |
| Asus Zenbook S 13 OLED | |
| Dell XPS 13 Plus 9320 i7-1280P OLED | |
| Average of class Subnotebook (8552 - 11646, n=45, last 2 years) | |
| Lenovo ThinkPad Z13 G1-21D20016GE | |
| Average AMD Ryzen 7 PRO 6860Z, AMD Radeon 680M (n=1) | |
| Lenovo ThinkPad Z16 G1 21D5S00T00 | |
| Lenovo ThinkPad T14 G3-21CF004NGE | |
| Lenovo ThinkPad Z13 21D2CTO1WW | |
| PCMark 10 / Productivity | |
| Average of class Subnotebook (5435 - 16606, n=45, last 2 years) | |
| Asus Zenbook S 13 OLED | |
| Lenovo ThinkPad T14 G3-21CF004NGE | |
| Lenovo ThinkPad Z16 G1 21D5S00T00 | |
| Lenovo ThinkPad Z13 G1-21D20016GE | |
| Average AMD Ryzen 7 PRO 6860Z, AMD Radeon 680M (n=1) | |
| Lenovo ThinkPad Z13 21D2CTO1WW | |
| Dell XPS 13 Plus 9320 i7-1280P OLED | |
| PCMark 10 / Digital Content Creation | |
| Average of class Subnotebook (5722 - 13779, n=45, last 2 years) | |
| Lenovo ThinkPad Z16 G1 21D5S00T00 | |
| Lenovo ThinkPad Z13 G1-21D20016GE | |
| Average AMD Ryzen 7 PRO 6860Z, AMD Radeon 680M (n=1) | |
| Lenovo ThinkPad T14 G3-21CF004NGE | |
| Asus Zenbook S 13 OLED | |
| Dell XPS 13 Plus 9320 i7-1280P OLED | |
| Lenovo ThinkPad Z13 21D2CTO1WW | |
| CrossMark / Overall | |
| Dell XPS 13 Plus 9320 i7-1280P OLED | |
| Average of class Subnotebook (365 - 2356, n=60, last 2 years) | |
| Lenovo ThinkPad Z13 G1-21D20016GE | |
| Average AMD Ryzen 7 PRO 6860Z, AMD Radeon 680M (n=1) | |
| Apple MacBook Air M2 10C GPU | |
| Asus Zenbook S 13 OLED | |
| Lenovo ThinkPad Z16 G1 21D5S00T00 | |
| Lenovo ThinkPad Z13 21D2CTO1WW | |
| Lenovo ThinkPad T14 G3-21CF004NGE | |
| CrossMark / Productivity | |
| Dell XPS 13 Plus 9320 i7-1280P OLED | |
| Average of class Subnotebook (364 - 2277, n=60, last 2 years) | |
| Lenovo ThinkPad Z13 G1-21D20016GE | |
| Average AMD Ryzen 7 PRO 6860Z, AMD Radeon 680M (n=1) | |
| Asus Zenbook S 13 OLED | |
| Lenovo ThinkPad Z16 G1 21D5S00T00 | |
| Lenovo ThinkPad Z13 21D2CTO1WW | |
| Lenovo ThinkPad T14 G3-21CF004NGE | |
| Apple MacBook Air M2 10C GPU | |
| CrossMark / Creativity | |
| Dell XPS 13 Plus 9320 i7-1280P OLED | |
| Average of class Subnotebook (372 - 2743, n=60, last 2 years) | |
| Apple MacBook Air M2 10C GPU | |
| Lenovo ThinkPad Z16 G1 21D5S00T00 | |
| Lenovo ThinkPad Z13 G1-21D20016GE | |
| Average AMD Ryzen 7 PRO 6860Z, AMD Radeon 680M (n=1) | |
| Asus Zenbook S 13 OLED | |
| Lenovo ThinkPad Z13 21D2CTO1WW | |
| Lenovo ThinkPad T14 G3-21CF004NGE | |
| CrossMark / Responsiveness | |
| Dell XPS 13 Plus 9320 i7-1280P OLED | |
| Average of class Subnotebook (312 - 1854, n=60, last 2 years) | |
| Asus Zenbook S 13 OLED | |
| Lenovo ThinkPad Z13 G1-21D20016GE | |
| Average AMD Ryzen 7 PRO 6860Z, AMD Radeon 680M (n=1) | |
| Lenovo ThinkPad Z16 G1 21D5S00T00 | |
| Lenovo ThinkPad T14 G3-21CF004NGE | |
| Lenovo ThinkPad Z13 21D2CTO1WW | |
| Apple MacBook Air M2 10C GPU | |
| PCMark 10 Score | 6240 points | |
Help | ||
| AIDA64 / Memory Copy | |
| Average of class Subnotebook (14554 - 131023, n=58, last 2 years) | |
| Dell XPS 13 Plus 9320 i7-1280P OLED | |
| Lenovo ThinkPad T14 G3-21CF004NGE | |
| Lenovo ThinkPad Z13 21D2CTO1WW | |
| Lenovo ThinkPad Z16 G1 21D5S00T00 | |
| Lenovo ThinkPad Z13 G1-21D20016GE | |
| Average AMD Ryzen 7 PRO 6860Z (n=1) | |
| Asus Zenbook S 13 OLED | |
| AIDA64 / Memory Read | |
| Average of class Subnotebook (15948 - 127174, n=58, last 2 years) | |
| Dell XPS 13 Plus 9320 i7-1280P OLED | |
| Lenovo ThinkPad Z16 G1 21D5S00T00 | |
| Lenovo ThinkPad T14 G3-21CF004NGE | |
| Lenovo ThinkPad Z13 21D2CTO1WW | |
| Asus Zenbook S 13 OLED | |
| Lenovo ThinkPad Z13 G1-21D20016GE | |
| Average AMD Ryzen 7 PRO 6860Z (n=1) | |
| AIDA64 / Memory Write | |
| Average of class Subnotebook (15709 - 135141, n=58, last 2 years) | |
| Dell XPS 13 Plus 9320 i7-1280P OLED | |
| Lenovo ThinkPad Z16 G1 21D5S00T00 | |
| Lenovo ThinkPad Z13 21D2CTO1WW | |
| Lenovo ThinkPad Z13 G1-21D20016GE | |
| Average AMD Ryzen 7 PRO 6860Z (n=1) | |
| Lenovo ThinkPad T14 G3-21CF004NGE | |
| Asus Zenbook S 13 OLED | |
| AIDA64 / Memory Latency | |
| Lenovo ThinkPad Z16 G1 21D5S00T00 | |
| Lenovo ThinkPad Z13 21D2CTO1WW | |
| Lenovo ThinkPad Z13 G1-21D20016GE | |
| Average AMD Ryzen 7 PRO 6860Z (n=1) | |
| Asus Zenbook S 13 OLED | |
| Lenovo ThinkPad T14 G3-21CF004NGE | |
| Dell XPS 13 Plus 9320 i7-1280P OLED | |
| Average of class Subnotebook (6.1 - 159.9, n=56, last 2 years) | |
* ... smaller is better
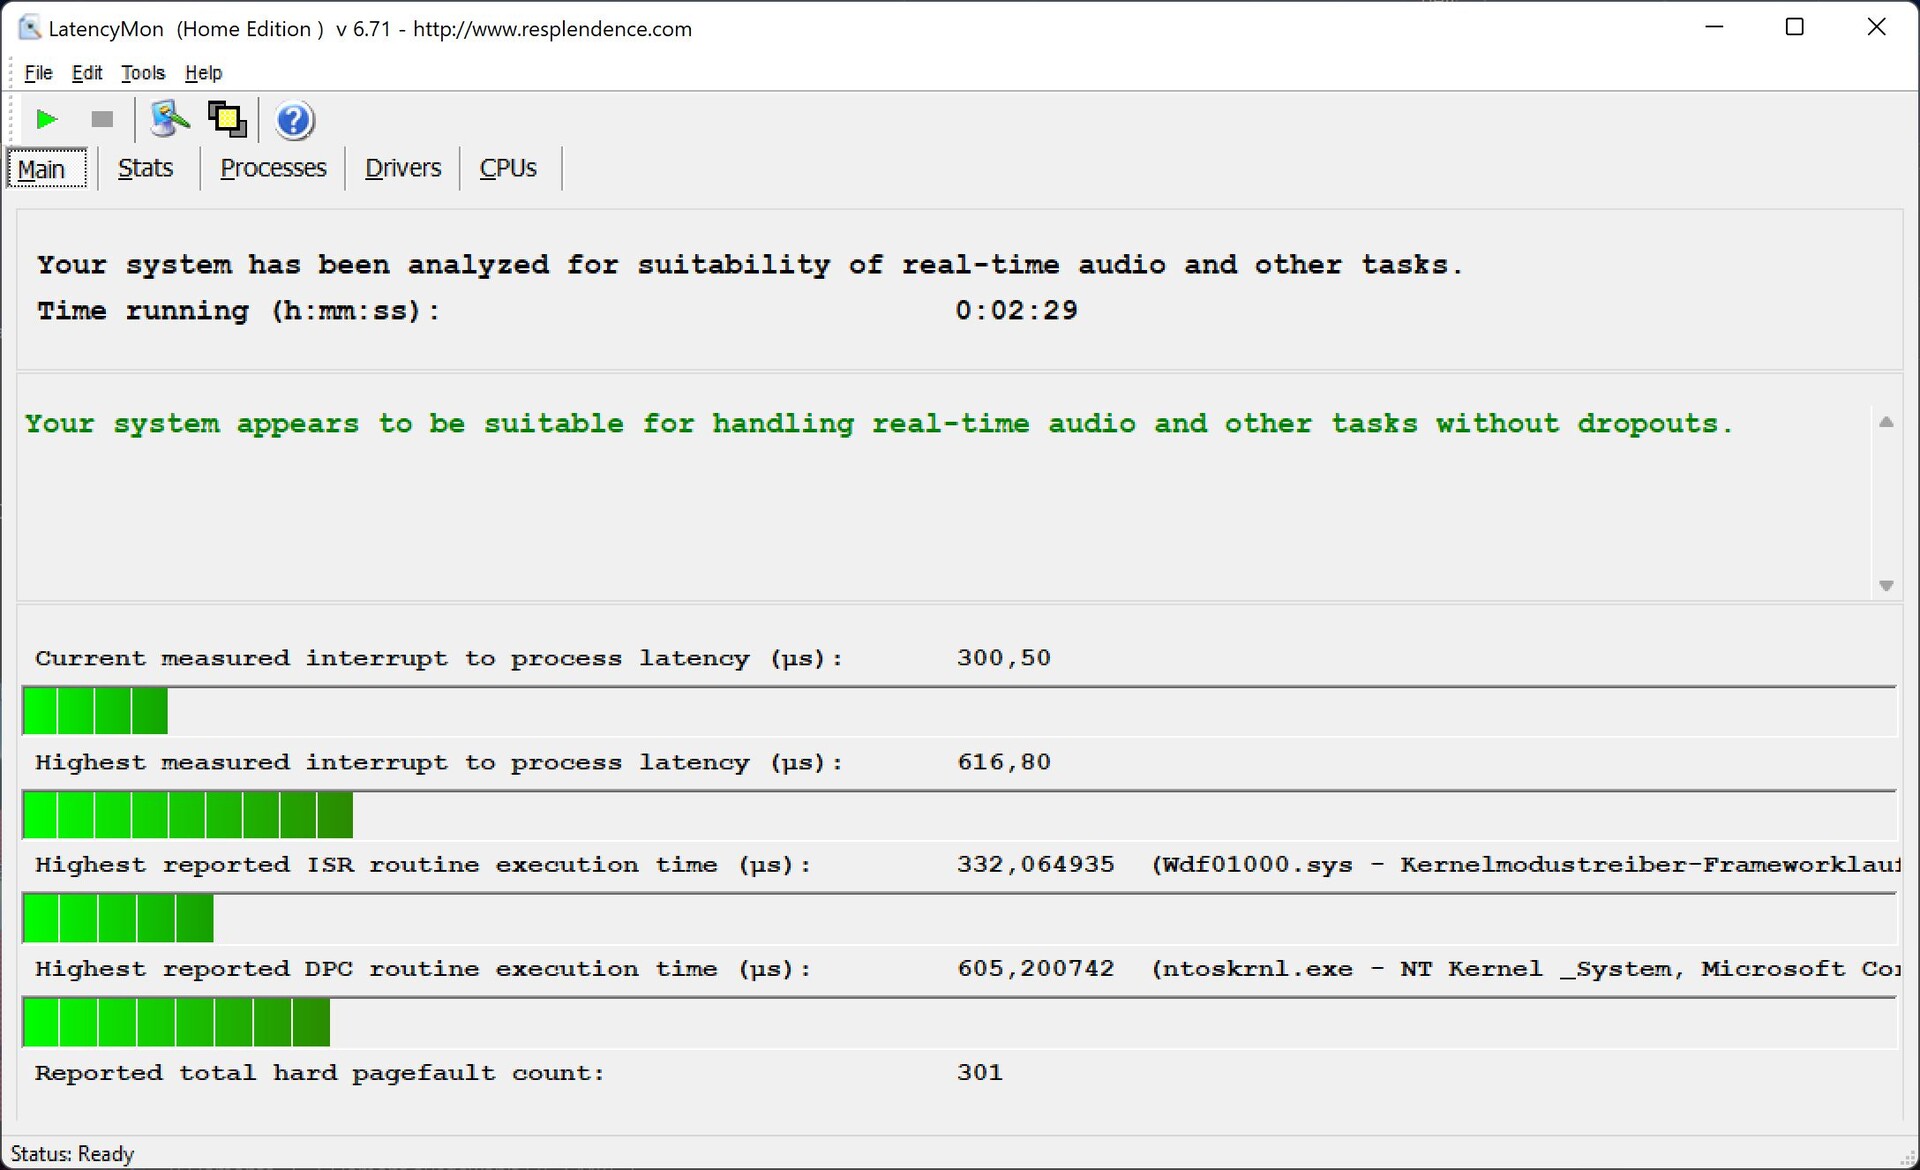
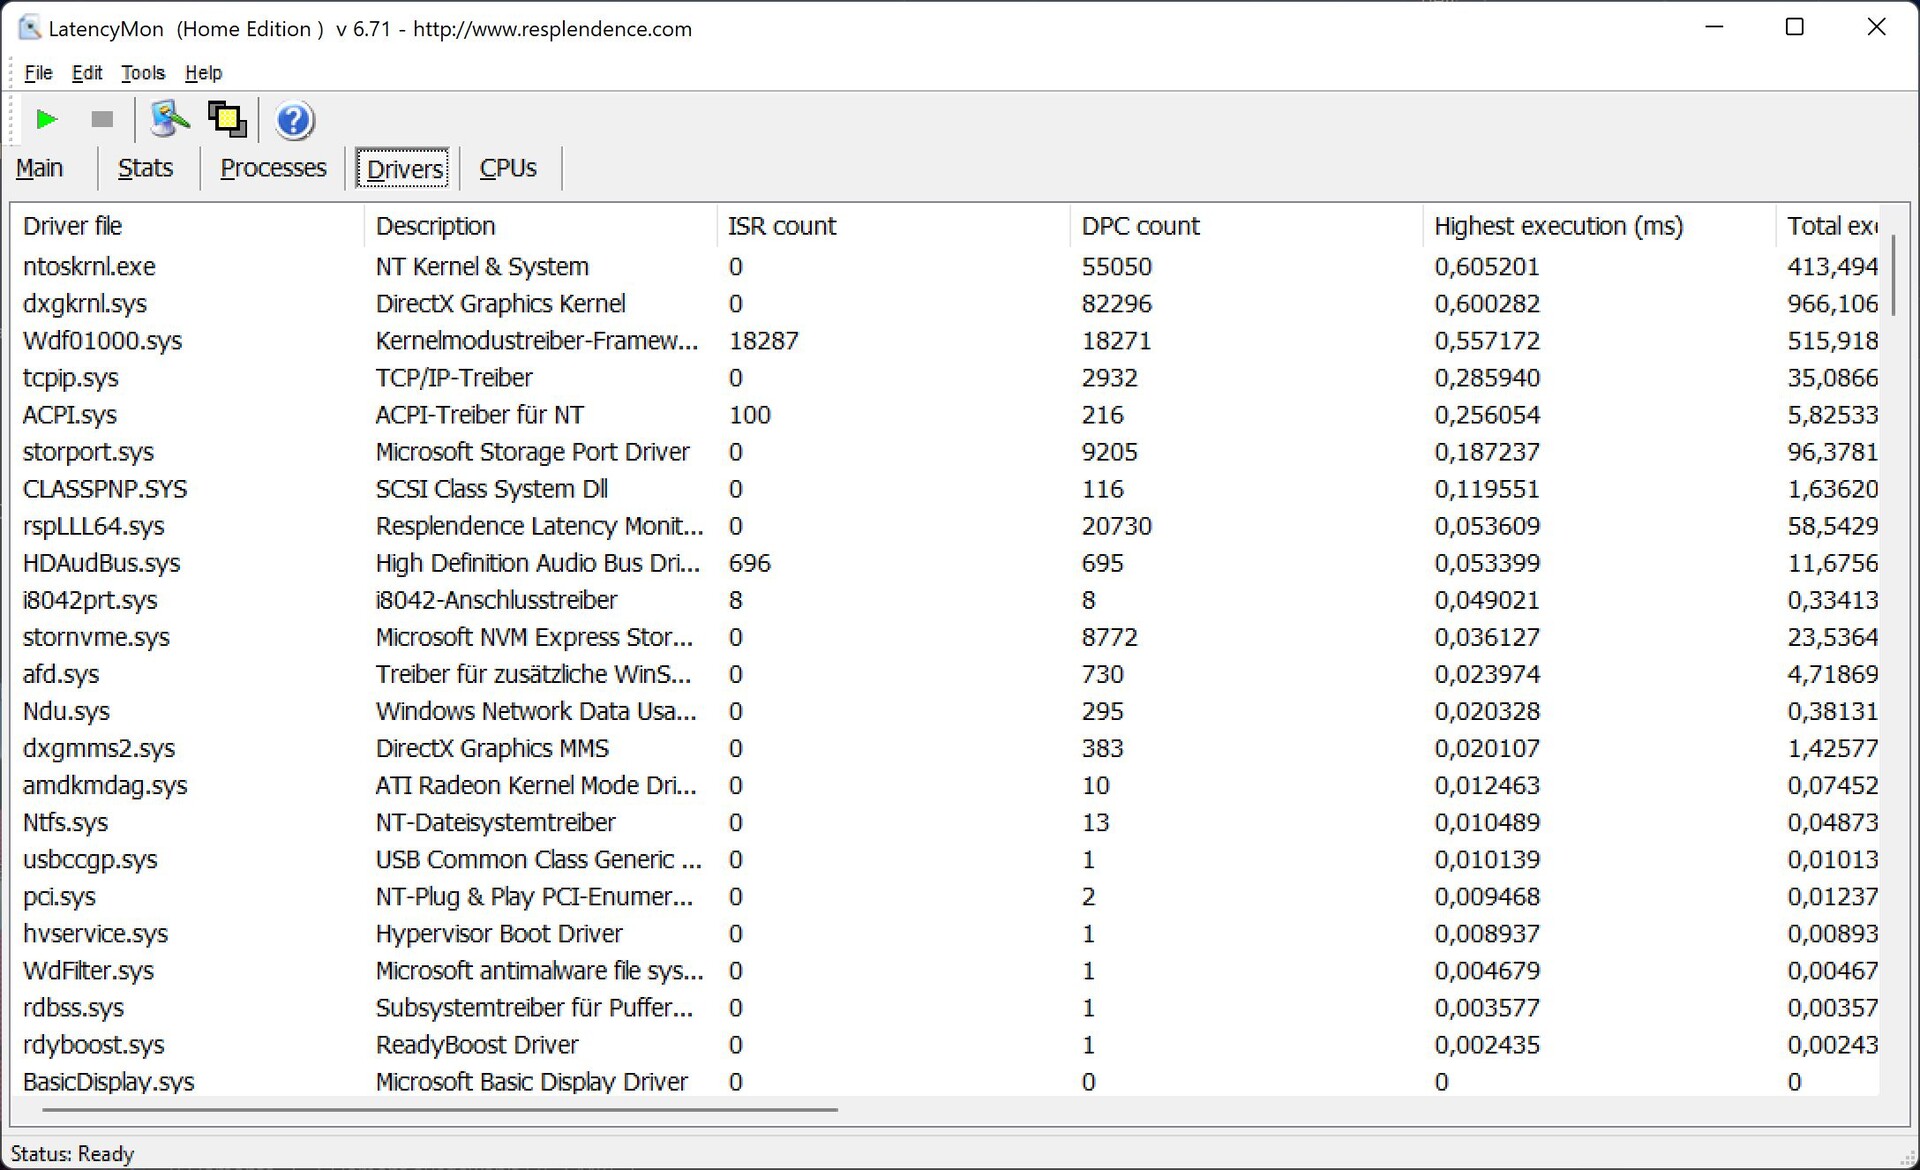
DPC延时
在我们的标准化延迟测试中(网页浏览、4K YouTube播放、CPU负载),测试设备在当前BIOS版本上表现非常好,没有显示出技术性能缺陷的证据。
| DPC Latencies / LatencyMon - interrupt to process latency (max), Web, Youtube, Prime95 | |
| Lenovo ThinkPad Z13 21D2CTO1WW | |
| Lenovo ThinkPad T14 G3-21CF004NGE | |
| Lenovo ThinkPad Z16 G1 21D5S00T00 | |
| Lenovo ThinkPad Z13 G1-21D20016GE | |
| Asus Zenbook S 13 OLED | |
| Dell XPS 13 Plus 9320 i7-1280P OLED | |
* ... smaller is better
存储设备
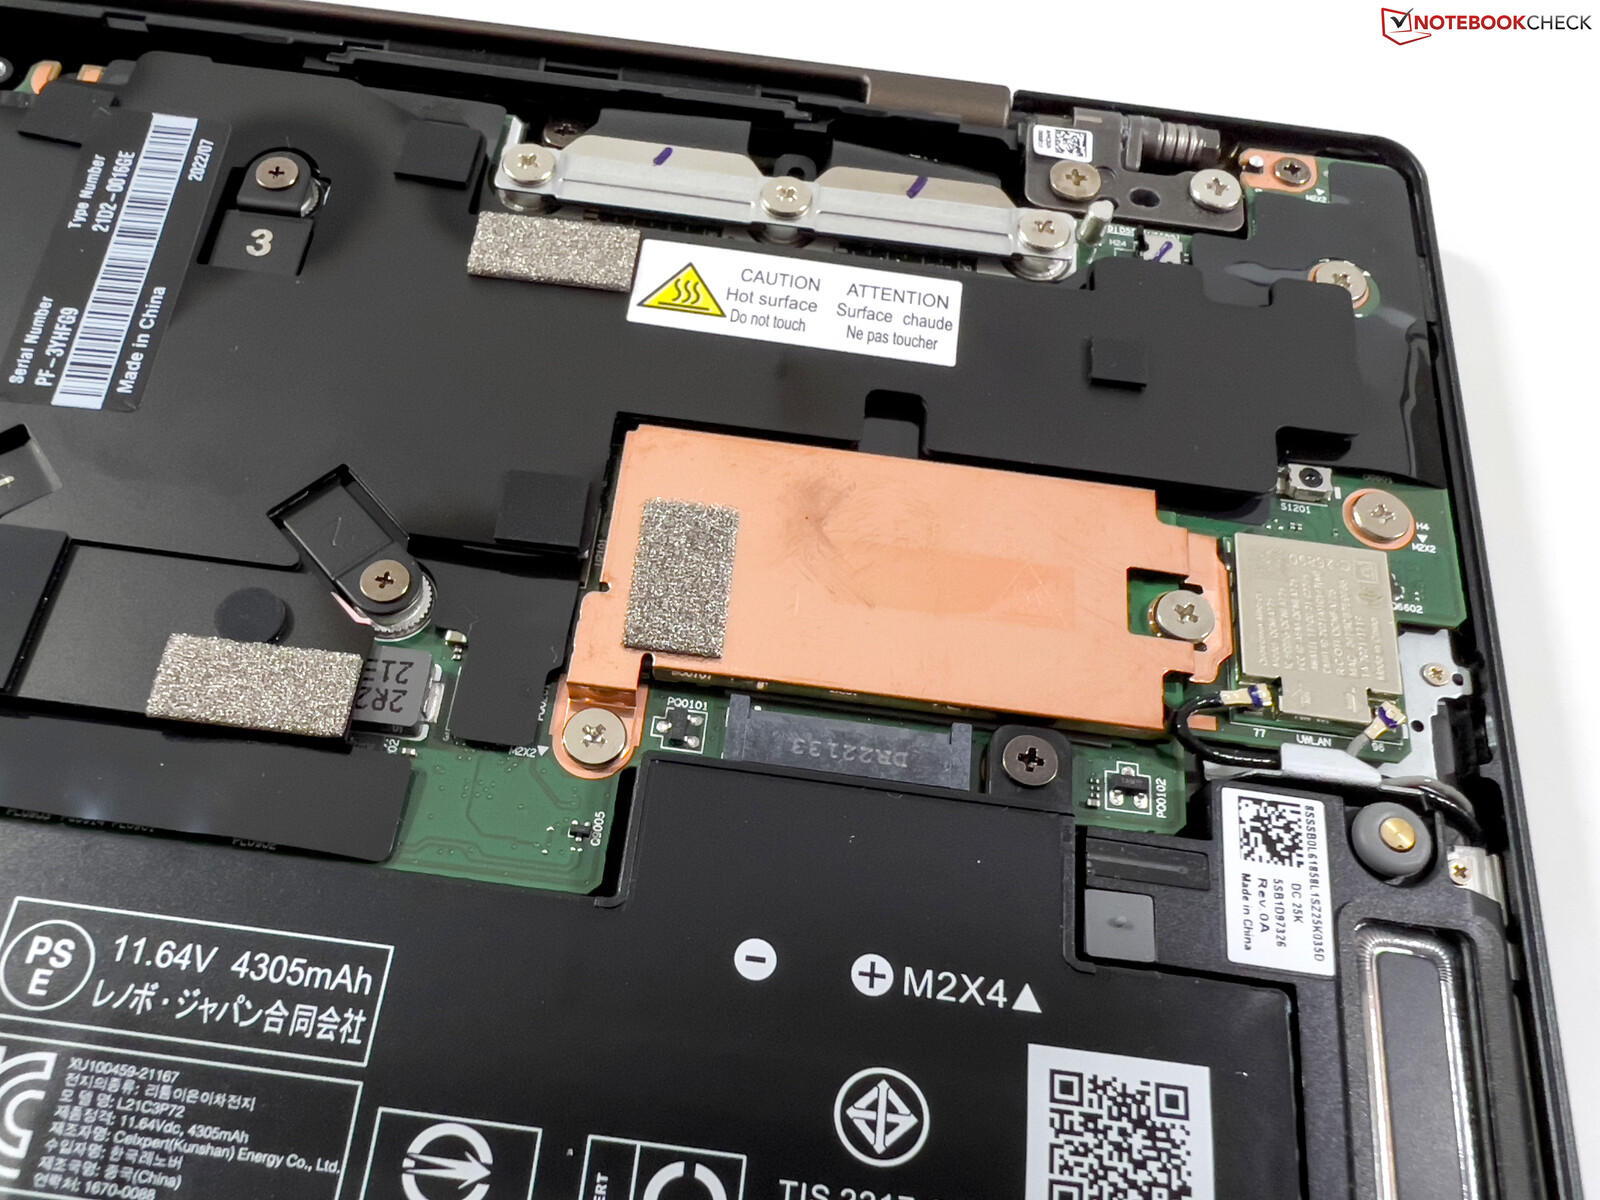
ThinkPad Z13只有空间容纳一个紧凑的M.2-2242固态硬盘,这至少是通过目前的PCIe 4.0接口连接。美光2450,允许安装PCIe 4.0固态硬盘,最大传输速率约为3.3GB/s。这可能会浪费一些潜在的容量,但至少性能保持不变,即使在永久负载下。在1TB的容量中,约有900GB在首次使用笔记本电脑时仍可供用户自由使用。更多的SSD基准测试可以在 这里.

* ... smaller is better
Disk Throttling: DiskSpd Read Loop, Queue Depth 8
图形卡
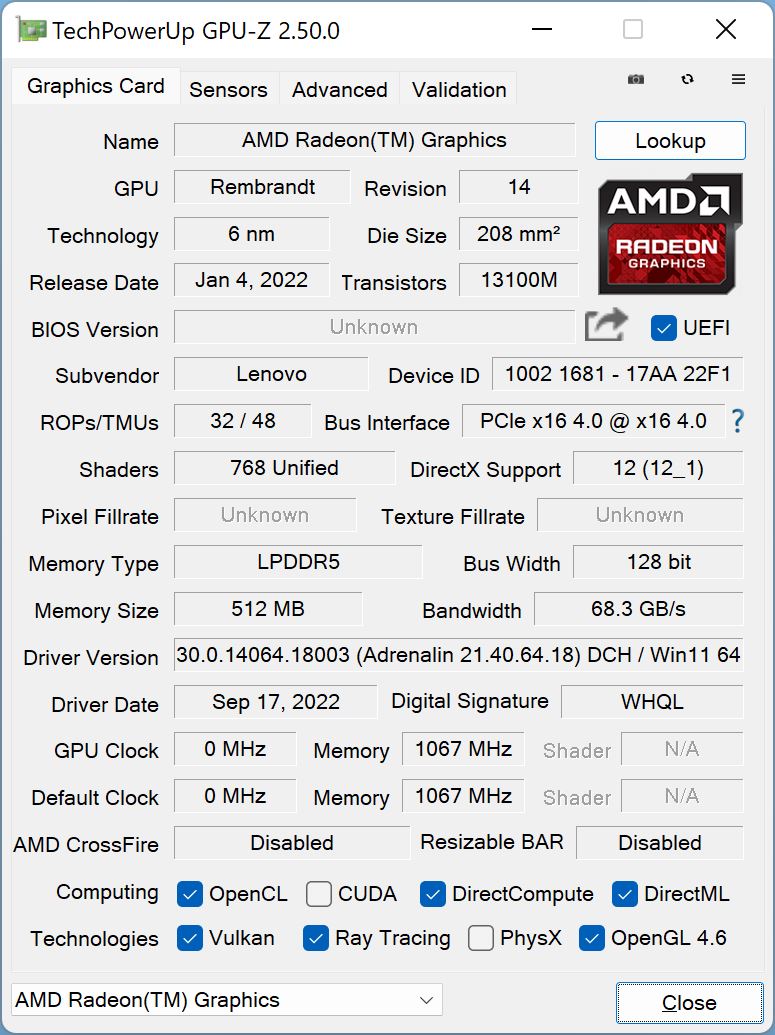
锐真7 Pro 6860Z使用著名的集成GPU Radeon 680M,最大时钟速度为2.2 GHz,与传统的Ryzen 7 CPU一样。在合成基准测试中,最初的结果也非常好,但性能没有保持稳定。3DMark压力测试(Time Spy )以82.7%的成绩失败,而在实验时(这对Radeon 680M来说是很有可能的),它的性能并不稳定。 Radeon 680M)与CPU同步负载时,芯片被节流得更多(总功率约为19瓦)。华硕Zenbook S 13或联想自己的 ThinkPad T14 G3在同步负载下的表现明显更好。
该 Radeon 660M在入门级的ThinkPad Z13上的Radeon 660M慢了大约35%,而且也受到节流的影响。电池电量并没有降低图形性能。更多的GPU基准测试可在 这里.
| 3DMark 11 Performance | 10387 points | |
| 3DMark Cloud Gate Standard Score | 31075 points | |
| 3DMark Fire Strike Score | 6287 points | |
| 3DMark Time Spy Score | 2416 points | |
Help | ||
* ... smaller is better
Witcher 3 FPS-Diagramm
| low | med. | high | ultra | QHD | |
|---|---|---|---|---|---|
| GTA V (2015) | 136.9 | 122.7 | 46.8 | 20.9 | |
| The Witcher 3 (2015) | 131 | 78 | 33 | 18.3 | |
| Dota 2 Reborn (2015) | 107.7 | 91.8 | 72.2 | 60.6 | |
| Final Fantasy XV Benchmark (2018) | 59.3 | 30.5 | 21.7 | ||
| X-Plane 11.11 (2018) | 51.8 | 40.6 | 34.3 | ||
| Far Cry 5 (2018) | 55 | 34 | 30 | 28 | |
| Strange Brigade (2018) | 133.5 | 55.3 | 44.8 | 38.9 | |
| F1 2021 (2021) | 155.3 | 75.1 | 54.9 | 23 | 15.8 |
| F1 22 (2022) | 71.4 | 61.1 | 44.5 | 9.35 |
排放和电力消耗
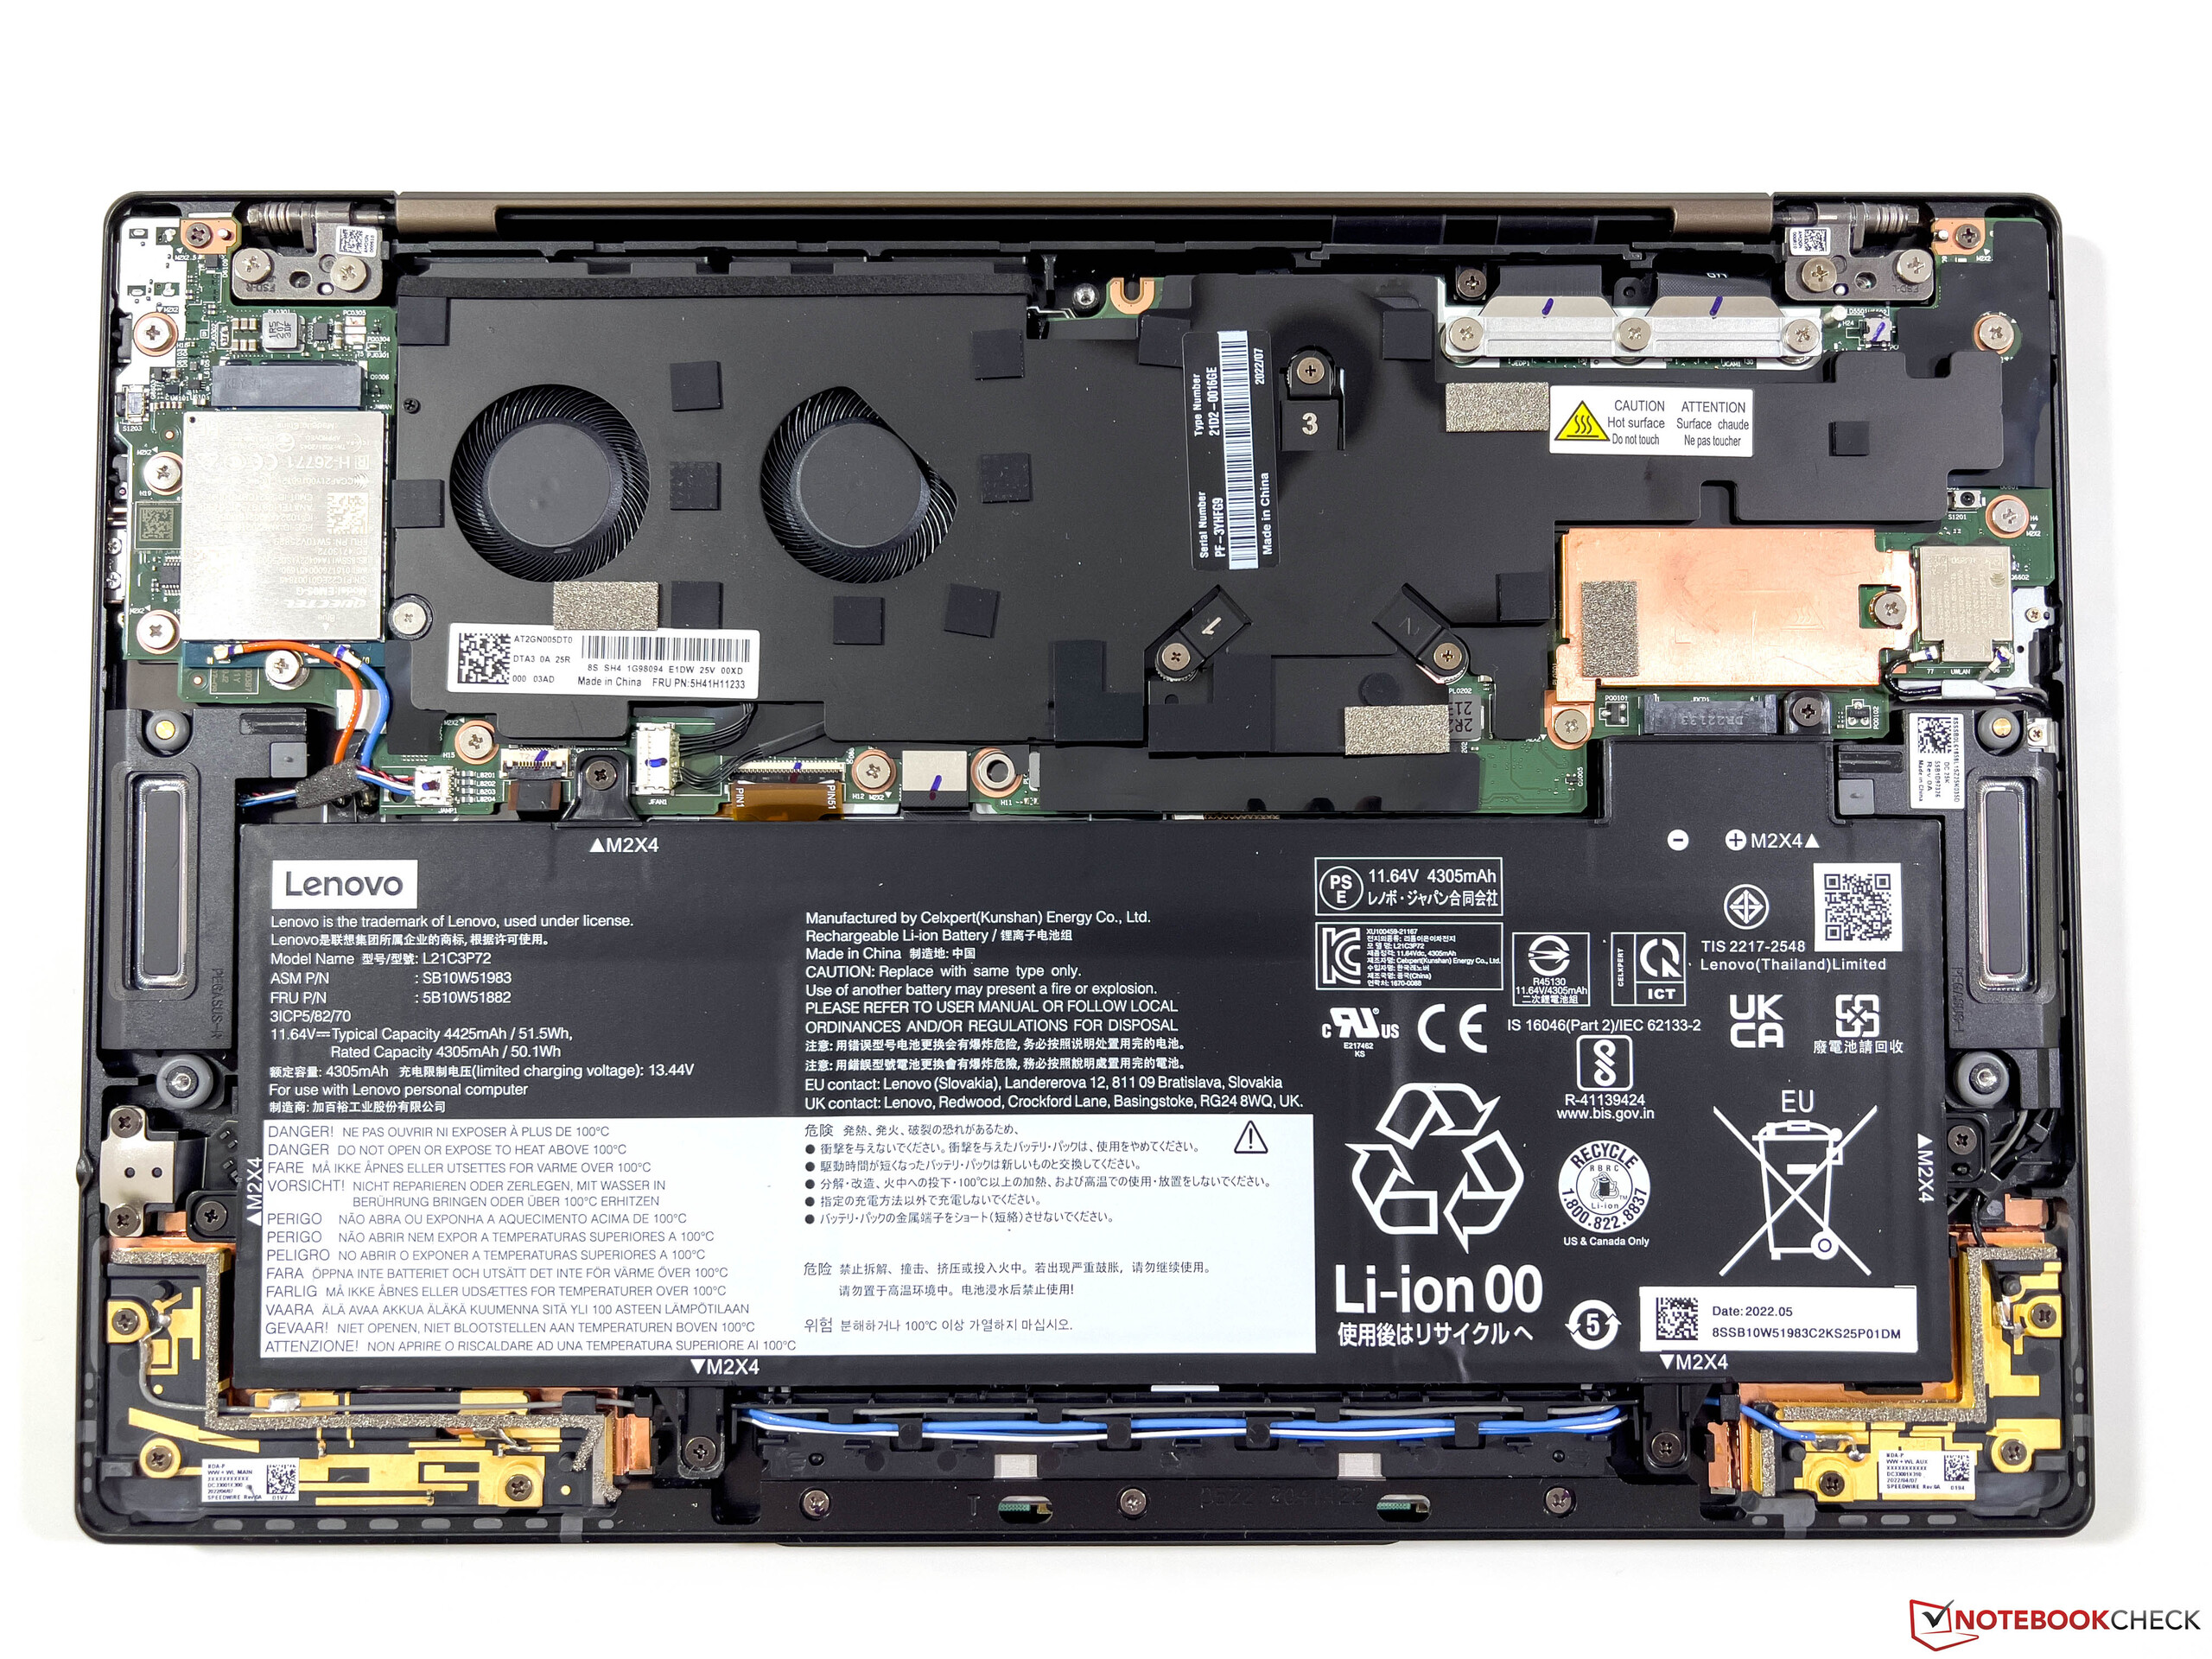
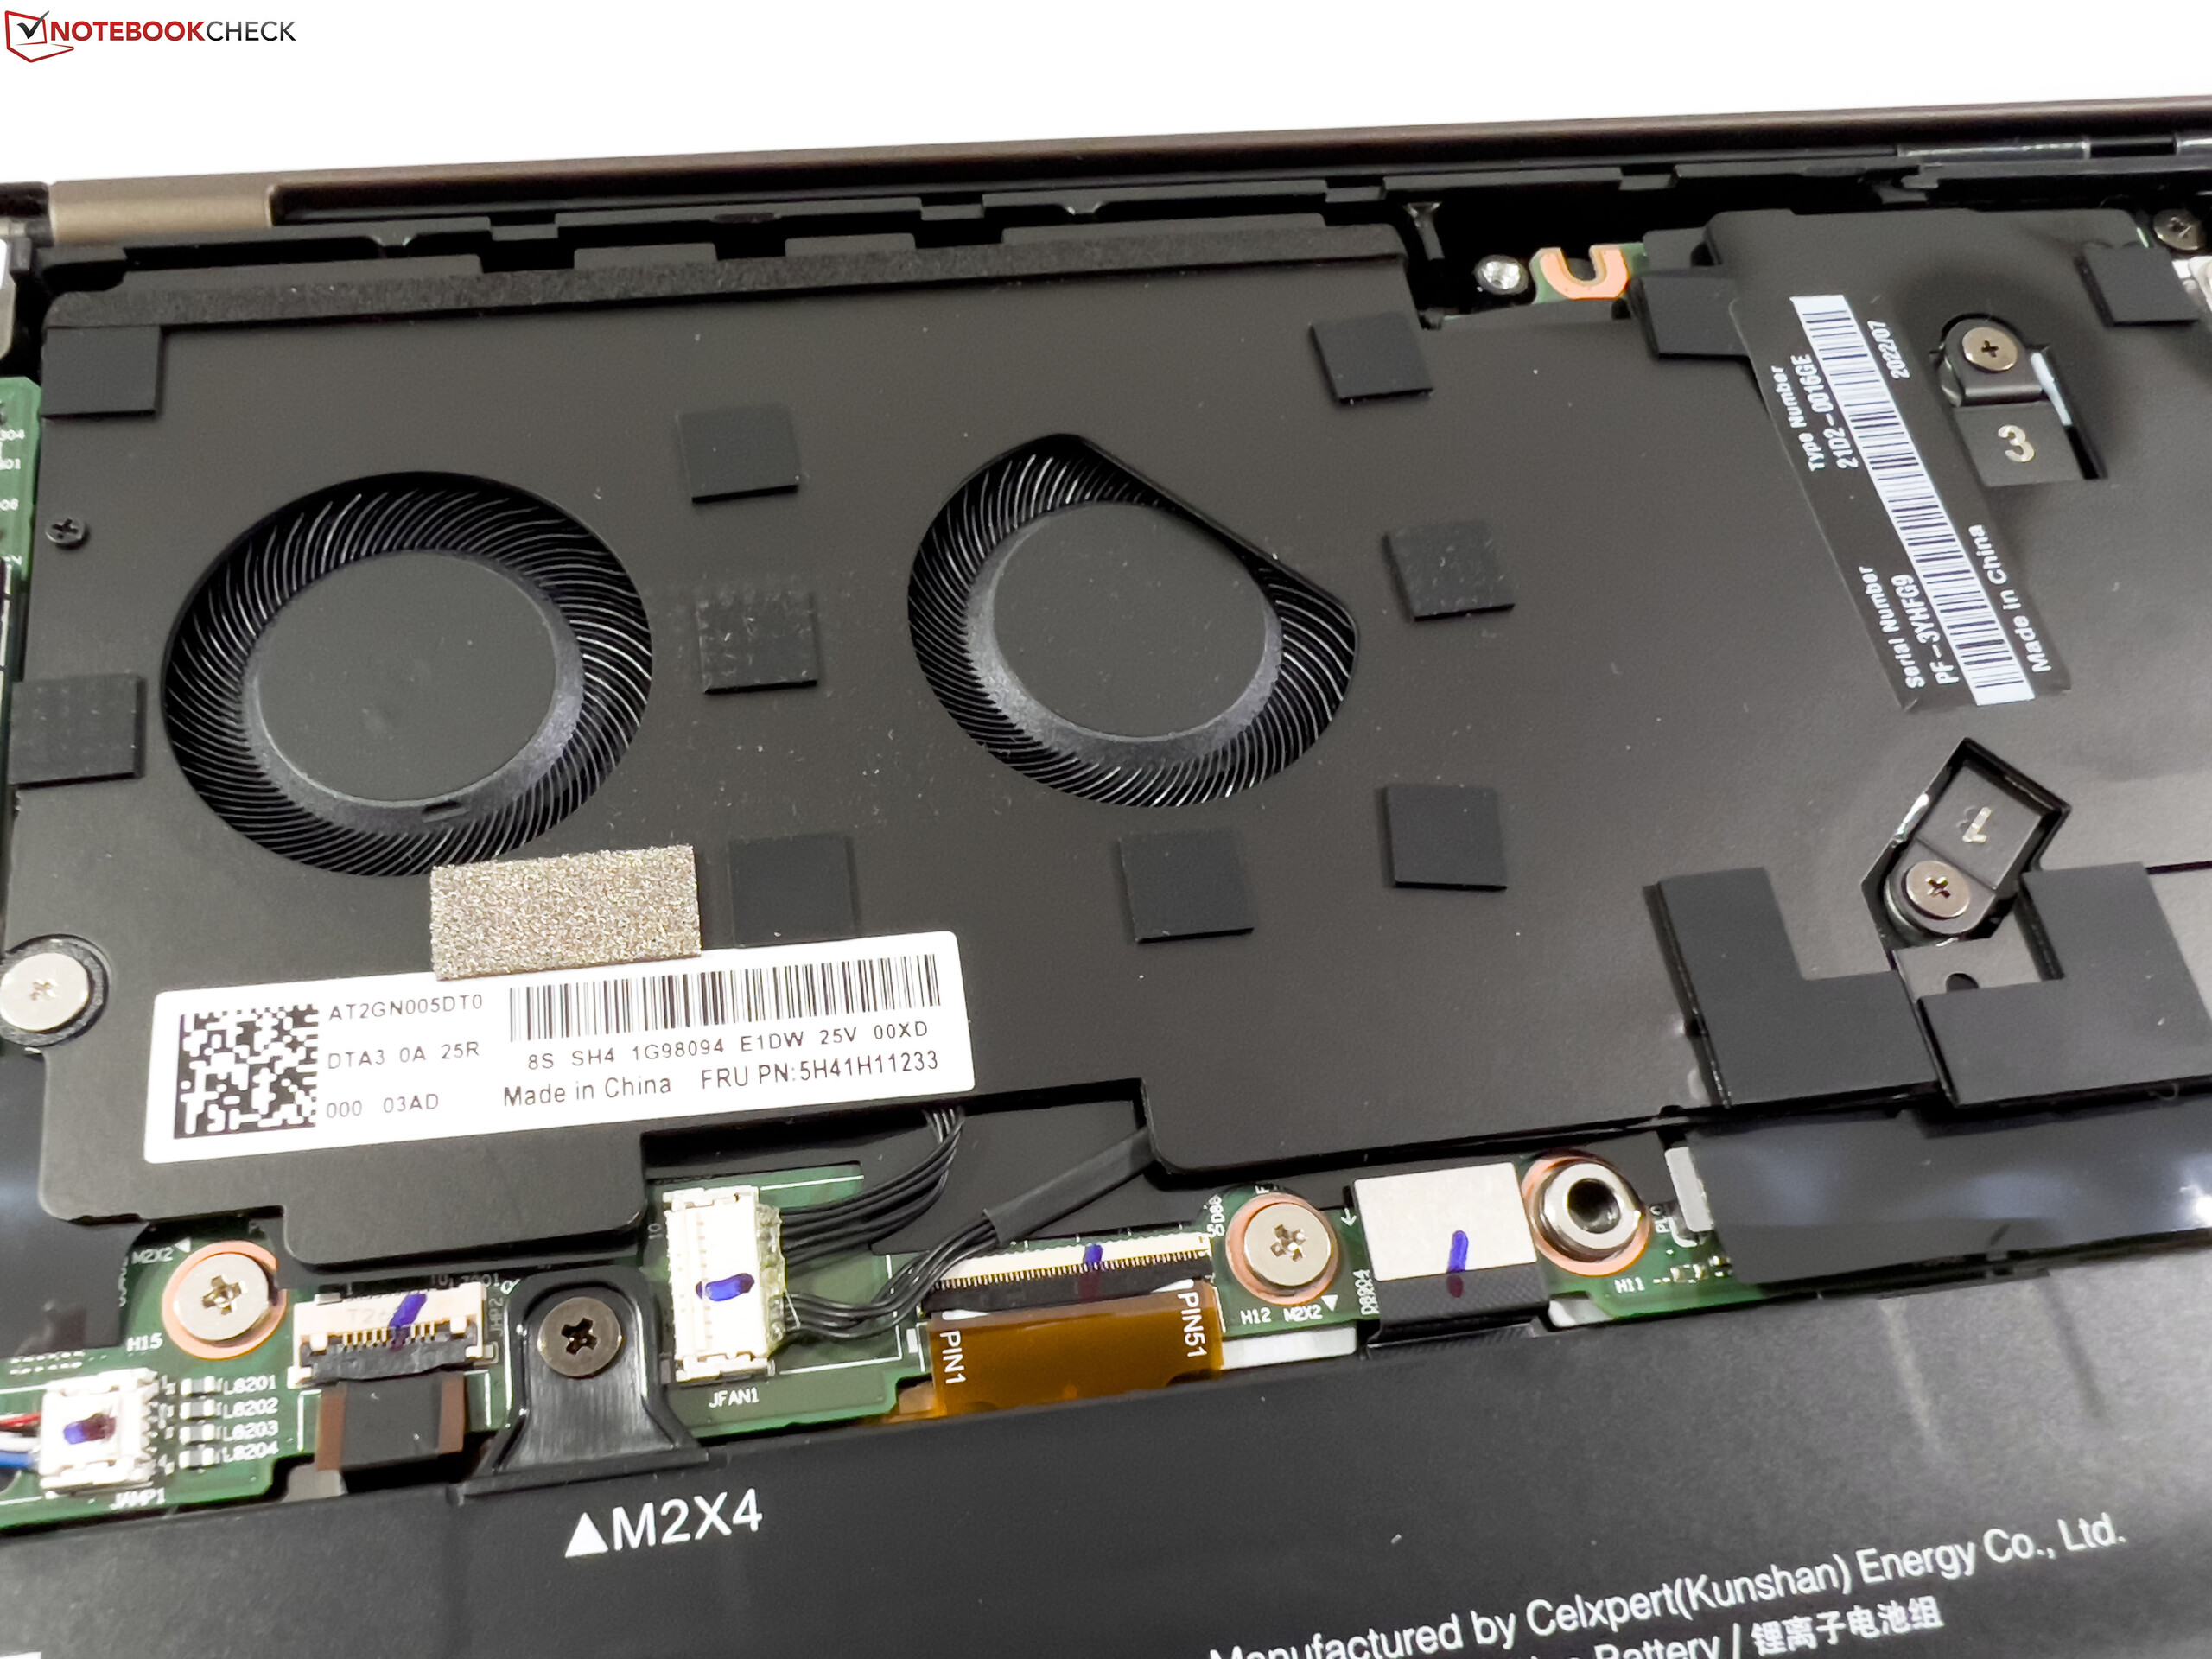
系统噪音
ThinkPad Z13使用两个小风扇进行冷却。这些风扇通常是闲置的,对于非常轻的任务,它们通常是无声的。但是,即使只是浏览时,风扇有时也会启动。由于TDP值较高,在增加负载的情况下,风扇几乎立即达到最大速度,这相当于约41 dB(A)。噪音明显可闻,但没有恼人的频率。我们无法检测到任何其他电子来源的噪音。
Noise level
| Idle |
| 24.3 / 24.3 / 24.3 dB(A) |
| Load |
| 41 / 41 dB(A) |
 | ||
30 dB silent 40 dB(A) audible 50 dB(A) loud |
||
min: | ||
| Lenovo ThinkPad Z13 G1-21D20016GE Radeon 680M, R7 PRO 6860Z, Micron 2450 1TB MTFDKCD1T0TFK | Asus Zenbook S 13 OLED Radeon 680M, R7 6800U, Samsung PM9A1 MZVL21T0HCLR | Dell XPS 13 Plus 9320 i7-1280P OLED Iris Xe G7 96EUs, i7-1280P, WDC PC SN810 512GB | Lenovo ThinkPad Z13 21D2CTO1WW Radeon 660M, R5 PRO 6650U, Lenovo UMIS AM630 RPJTJ512MGE1QDQ | Lenovo ThinkPad T14 G3-21CF004NGE Radeon 680M, R7 PRO 6850U, Kioxia BG5 KBG5AZNV512G | |
|---|---|---|---|---|---|
| Noise | 3% | 5% | 5% | 5% | |
| off / environment * (dB) | 24.3 | 24 1% | 23.4 4% | 23.71 2% | 24.2 -0% |
| Idle Minimum * (dB) | 24.3 | 24 1% | 23.4 4% | 23.71 2% | 24.2 -0% |
| Idle Average * (dB) | 24.3 | 24 1% | 23.4 4% | 23.71 2% | 24.2 -0% |
| Idle Maximum * (dB) | 24.3 | 24 1% | 23.4 4% | 23.71 2% | 25.8 -6% |
| Load Average * (dB) | 41 | 33.1 19% | 35 15% | 32.35 21% | 32.2 21% |
| Witcher 3 ultra * (dB) | 41 | 40.2 2% | 41.6 -1% | 38.8 5% | 34.1 17% |
| Load Maximum * (dB) | 41 | 41.7 -2% | 39.9 3% | 39.53 4% | 38.8 5% |
* ... smaller is better
温度
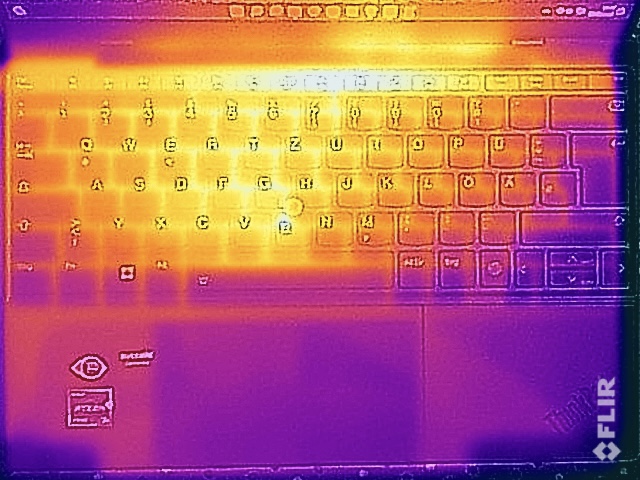
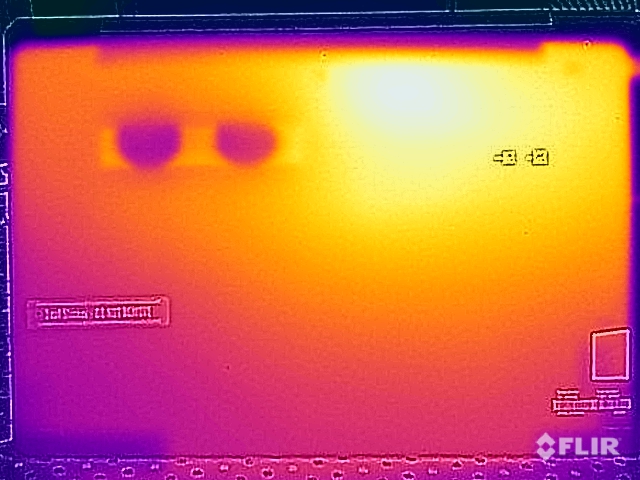
ThinkPad Z13的表面温度在低负载下并不重要,但在负载下我们测得的数值高于 入门级型号.这并不令人惊讶,因为冷却系统是相同的,风扇也工作在相当的水平,但处理器的TDP更高。顶盖表面的温度保持在不超过45℃的正常范围内,并保持安全。但我们在底层表面的中央上部区域测得的温度超过了50℃。 随着皮肤的直接接触,这很快就会让人感到不舒服。
虽然Ryzen 7 Pro的功耗在纯CPU负载下稳定在27瓦,但在CPU/GPU综合负载的压力测试中只有19瓦(在使用Ryzen 5 Pro的Z13中大约是14瓦)。鉴于这些低值,表面温度已经相当高。在压力测试之后,需要几分钟时间才能再次获得全功率。
(-) The maximum temperature on the upper side is 45.6 °C / 114 F, compared to the average of 35.9 °C / 97 F, ranging from 21.4 to 59 °C for the class Subnotebook.
(-) The bottom heats up to a maximum of 51 °C / 124 F, compared to the average of 39.2 °C / 103 F
(+) In idle usage, the average temperature for the upper side is 25.9 °C / 79 F, compared to the device average of 30.8 °C / 87 F.
(-) Playing The Witcher 3, the average temperature for the upper side is 38.9 °C / 102 F, compared to the device average of 30.8 °C / 87 F.
(+) The palmrests and touchpad are reaching skin temperature as a maximum (33 °C / 91.4 F) and are therefore not hot.
(-) The average temperature of the palmrest area of similar devices was 28.2 °C / 82.8 F (-4.8 °C / -8.6 F).
| Lenovo ThinkPad Z13 G1-21D20016GE AMD Ryzen 7 PRO 6860Z, AMD Radeon 680M | Asus Zenbook S 13 OLED AMD Ryzen 7 6800U, AMD Radeon 680M | Apple MacBook Air M2 10C GPU Apple M2, Apple M2 10-Core GPU | Lenovo ThinkPad Z13 21D2CTO1WW AMD Ryzen 5 PRO 6650U, AMD Radeon 660M | Lenovo ThinkPad T14 G3-21CF004NGE AMD Ryzen 7 PRO 6850U, AMD Radeon 680M | Dell XPS 13 Plus 9320 4K Intel Core i7-1260P, Intel Iris Xe Graphics G7 96EUs | |
|---|---|---|---|---|---|---|
| Heat | -3% | 8% | -4% | 3% | 1% | |
| Maximum Upper Side * (°C) | 45.6 | 47.9 -5% | 44.7 2% | 44.9 2% | 48.2 -6% | 41.1 10% |
| Maximum Bottom * (°C) | 51 | 56.1 -10% | 44.6 13% | 44.3 13% | 52.8 -4% | 48.8 4% |
| Idle Upper Side * (°C) | 27 | 26.8 1% | 25.1 7% | 31.4 -16% | 24.4 10% | 28 -4% |
| Idle Bottom * (°C) | 27.9 | 27.3 2% | 25.3 9% | 31.5 -13% | 24.5 12% | 29.3 -5% |
* ... smaller is better
发言人
Lenovo ThinkPad Z13 G1-21D20016GE audio analysis
(±) | speaker loudness is average but good (77.6 dB)
Bass 100 - 315 Hz
(-) | nearly no bass - on average 15.4% lower than median
(±) | linearity of bass is average (9.5% delta to prev. frequency)
Mids 400 - 2000 Hz
(+) | balanced mids - only 3.2% away from median
(+) | mids are linear (5.1% delta to prev. frequency)
Highs 2 - 16 kHz
(+) | balanced highs - only 3.1% away from median
(+) | highs are linear (3.8% delta to prev. frequency)
Overall 100 - 16.000 Hz
(+) | overall sound is linear (14.7% difference to median)
Compared to same class
» 31% of all tested devices in this class were better, 5% similar, 64% worse
» The best had a delta of 5%, average was 18%, worst was 53%
Compared to all devices tested
» 19% of all tested devices were better, 4% similar, 77% worse
» The best had a delta of 4%, average was 23%, worst was 134%
Apple MacBook Air M2 10C GPU audio analysis
(+) | speakers can play relatively loud (82.7 dB)
Bass 100 - 315 Hz
(±) | reduced bass - on average 12.2% lower than median
(±) | linearity of bass is average (12.6% delta to prev. frequency)
Mids 400 - 2000 Hz
(+) | balanced mids - only 1.1% away from median
(+) | mids are linear (3.1% delta to prev. frequency)
Highs 2 - 16 kHz
(+) | balanced highs - only 2.4% away from median
(+) | highs are linear (1.9% delta to prev. frequency)
Overall 100 - 16.000 Hz
(+) | overall sound is linear (9.5% difference to median)
Compared to same class
» 5% of all tested devices in this class were better, 2% similar, 93% worse
» The best had a delta of 5%, average was 18%, worst was 53%
Compared to all devices tested
» 4% of all tested devices were better, 1% similar, 95% worse
» The best had a delta of 4%, average was 23%, worst was 134%
消耗功率
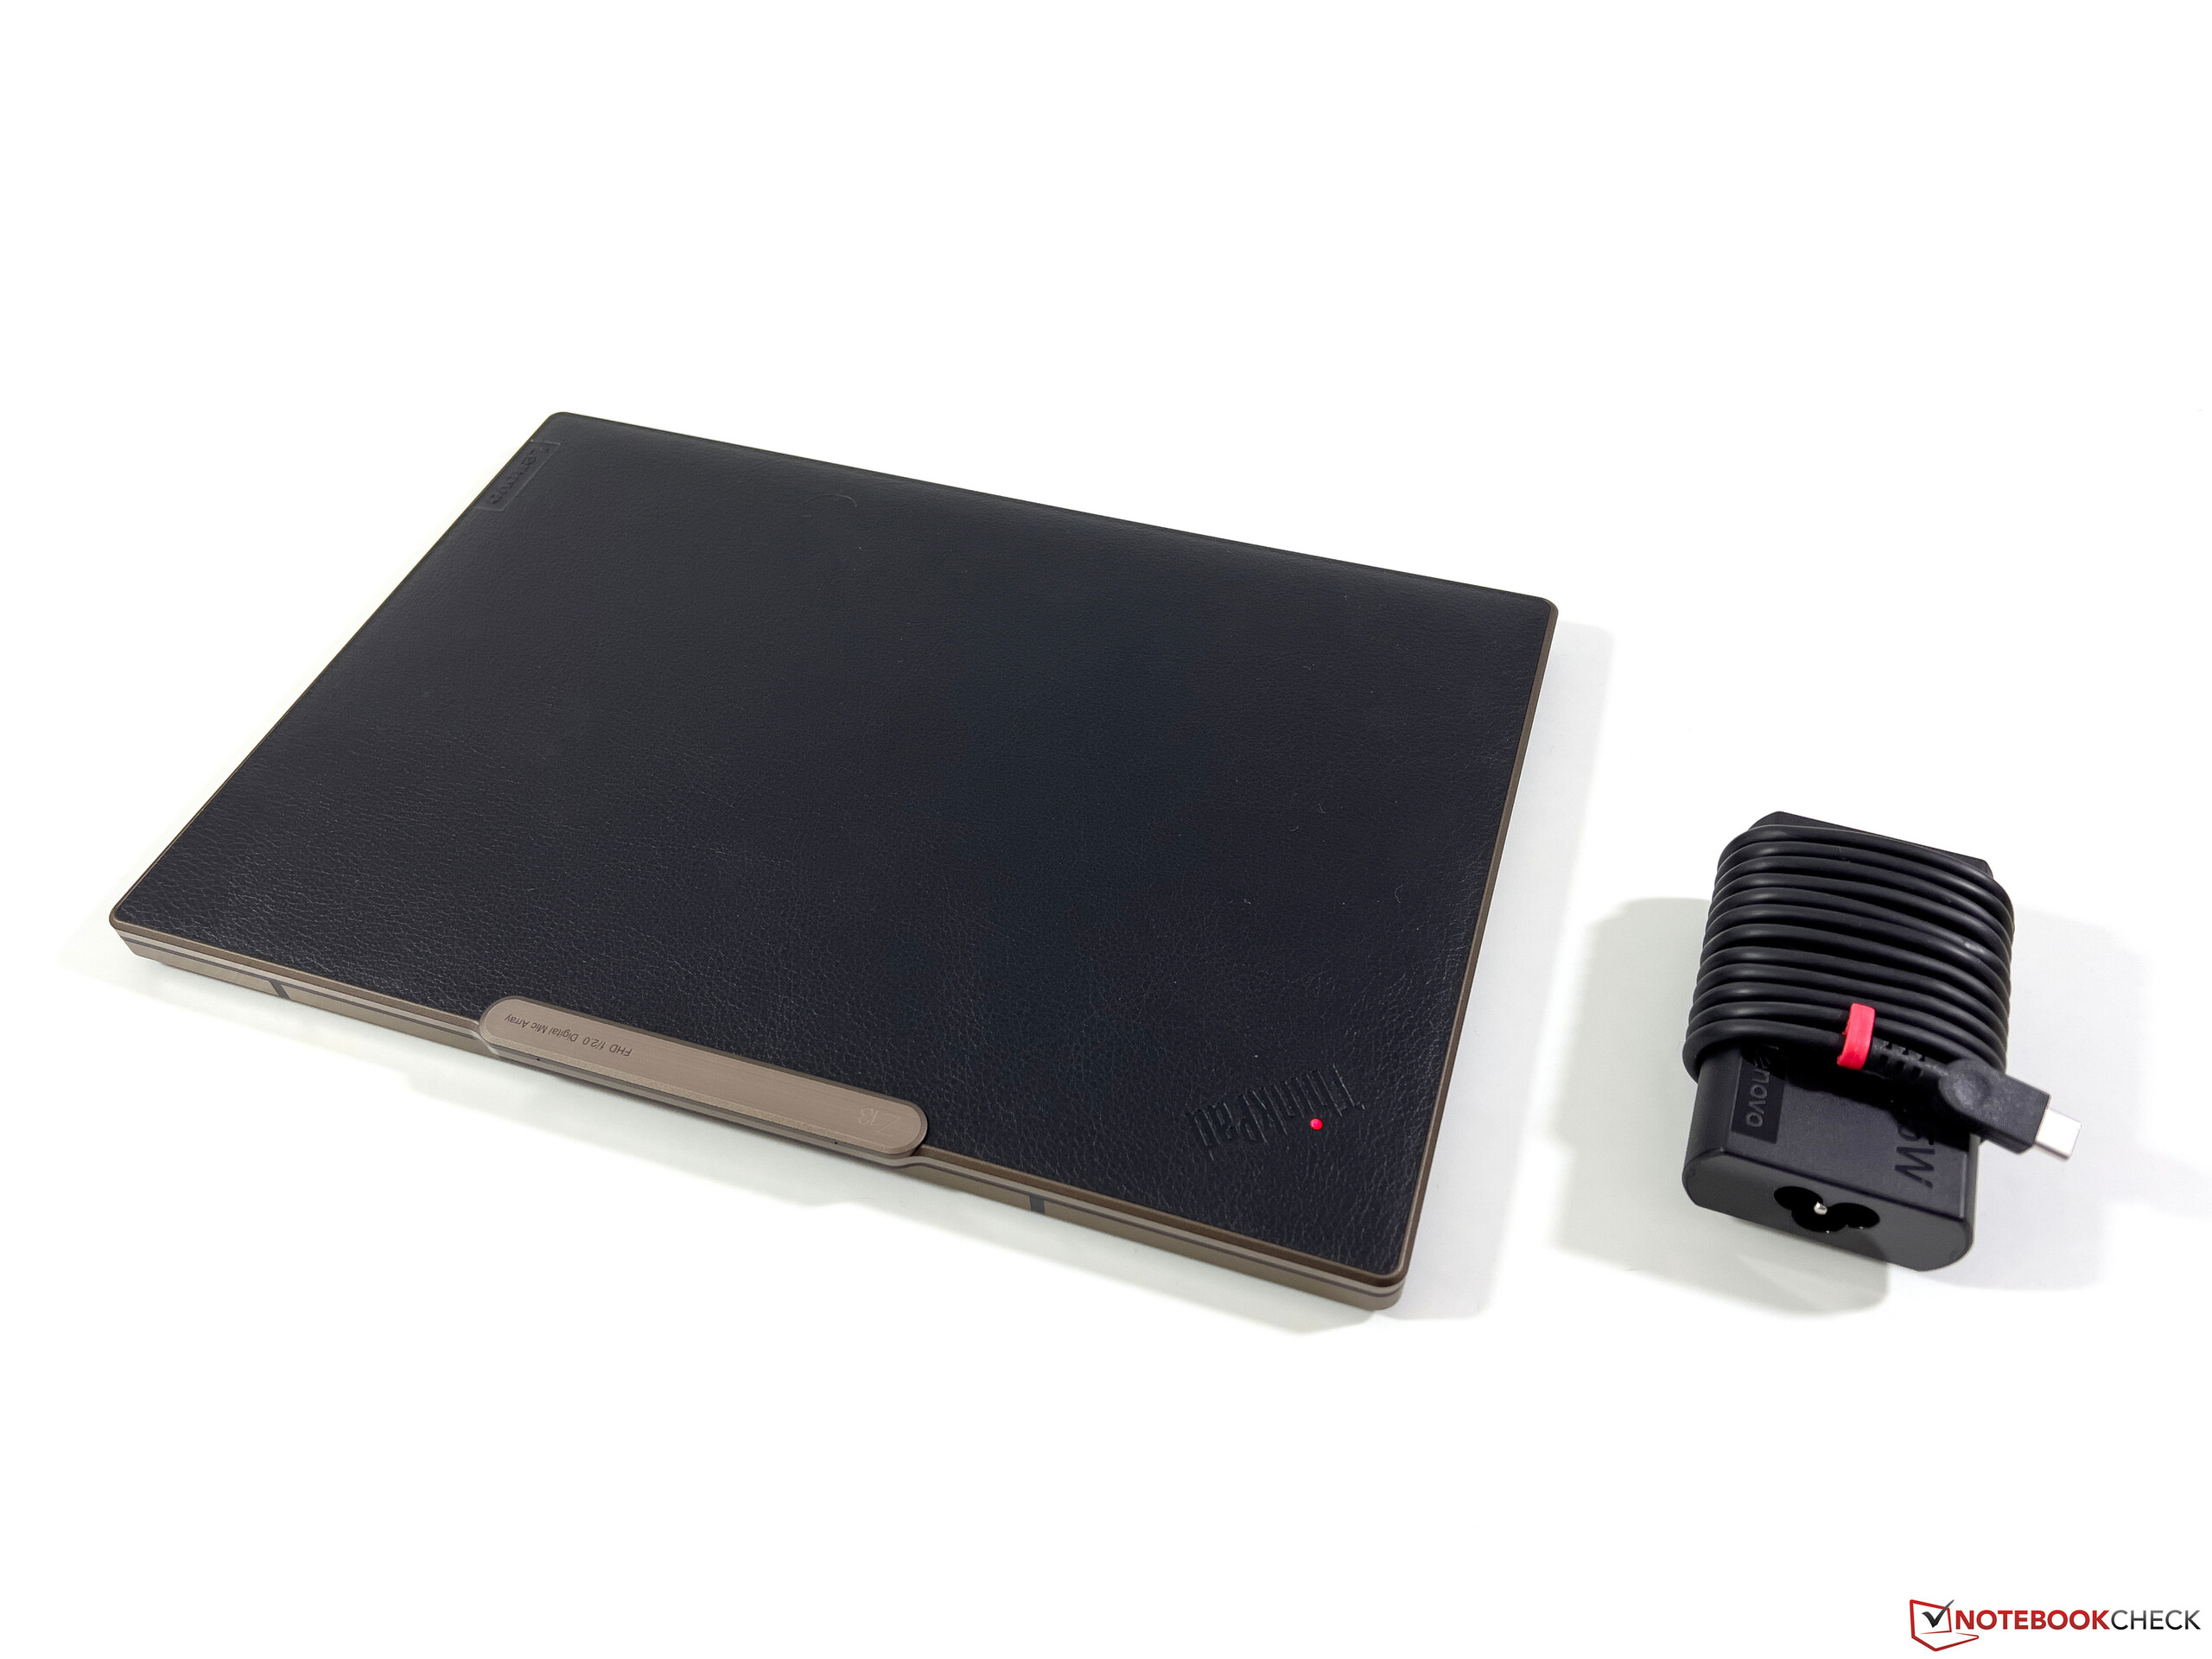
在功耗测量中,OLED屏幕的影响是显而易见的。即使在背景图像相当暗的情况下,我们测得空闲时的最大功率为8.4瓦,但在明亮的图像下则为11-12瓦。在负载情况下,最大约为63瓦,尽管该值在连续负载情况下迅速降至约46瓦,然后稳定在30瓦左右。因此,所提供的65瓦的电源是完全足够的。
| Off / Standby | |
| Idle | |
| Load |
|
Key:
min: | |
Power Consumption Witcher 3 / Stresstest
Power Consumption external Monitor
电池寿命
OLED屏幕大大降低了电池寿命,我们的WLAN测试包括大量的网站,唤起了OLED面板的最坏情况。电池寿命明显比 入门级型号Z13的IPS面板的电池寿命明显更差。它即使在全亮度下也能达到10小时以上。另一方面,OLED机型在150cd/m²下只能达到7.5小时,在全SDR亮度下不到6小时,因此运行时间也比配备较大67Wh电池的Zenbook S 13短得多。
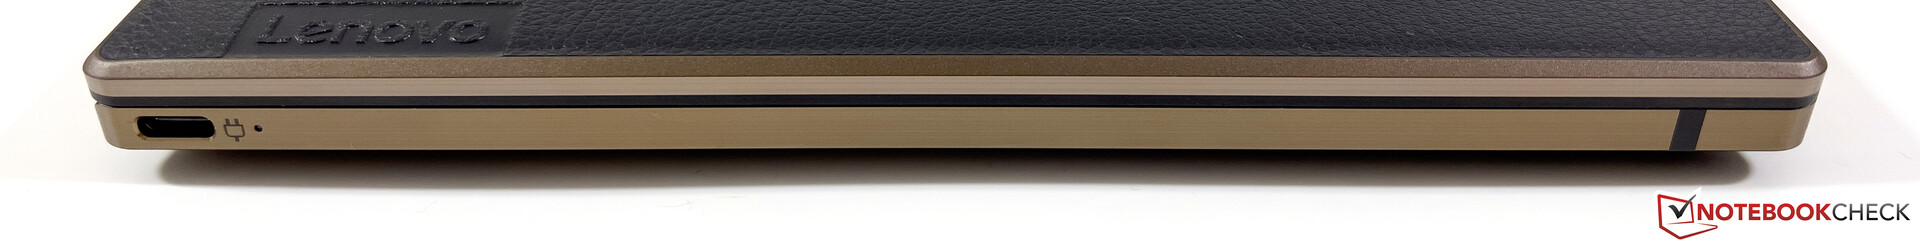
当设备开启时,完全充电只需要两个多小时;大约64分钟后,80%的容量又可以使用。
Pros
Cons
评语 - ThinkPad Z13提出了一些问题
在测试了ThinkPad Z13的高端版本后,我们想知道这是否真的还是一台商务笔记本电脑,是否真的还是一台ThinkPad。在配备OLED屏幕和人造革盖子的配置中,它实际上是消费机型华硕Zenbook S 13的理想竞争对手。更重要的是,你不得不放弃一些ThinkPad的典型特征。这包括显示屏的开启角度有限,省去了Kensington锁的插槽,以及改变了按钮布局,不包括翻页和关页的专用按钮。然而,对于ThinkPad的长期用户来说,最大的问题是取消了专用的TrackPoint键。我们只能希望联想不要在其他型号系列中采用这种解决方案。
这款笔记本本身以其高质量的外壳、出色的键盘和玻璃触摸板以及出色的系统性能证明了其在日常使用中的说服力。然而,人们不得不严重质疑为什么Ryzen 7 Pro 6860Z首先作为一个处理器存在,因为它实际上是一个普通的6850U。而且,虽然高功率限制确保了良好的基准测试结果,但它也导致了更多的风扇活动和性能不一致。最重要的是,图形性能在永久性负载下往往有些不稳定,而其他设备,如ThinkPad T14 G3或华硕Zenbook S 13却不受影响。具有极高对比度的OLED屏幕基本上能提供非常好的图像质量,但在明亮的地方会有轻微的网格效应。有PWM闪烁,而且OLED屏幕对电池的消耗很大。
由于采用了OLED面板并使用了仿皮,ThinkPad Z13高端型号看起来更像是一件时尚产品,而不是一台商务笔记本电脑。总的来说,它是一款非常好的次笔记本,但不一定是一款非常好的商务笔记本。
对于生产性使用,采用普通IPS面板的 配备普通IPS面板的ThinkPad Z13是更好的选择,因为它可以使电池运行时间大大延长。如果你作为ThinkPad用户一直在使用并喜欢TrackPoint,你应该在购买新的Z13之前试用一下,因为省略了专用的TrackPoint键会成为许多用户不购买的理由。另一方面,如果你正在寻找一款采用OLED面板和AMD CPU的副笔记本,你应该看看 华硕Zenbook S13,它有一个好的键盘,更稳定的性能,并有一个软件解决方案来解决恼人的PWM闪烁。它只是一个更好的整体包装。
价格和可用性
配备AMD Ryzen 7 Pro 6860Z的ThinkPad Z13可以在联想网站上配置。 可以在联想网站上进行配置起价约为2700欧元(2700美元)。
Lenovo ThinkPad Z13 G1-21D20016GE
- 10/28/2022 v7 (old)
Andreas Osthoff
Price comparison

