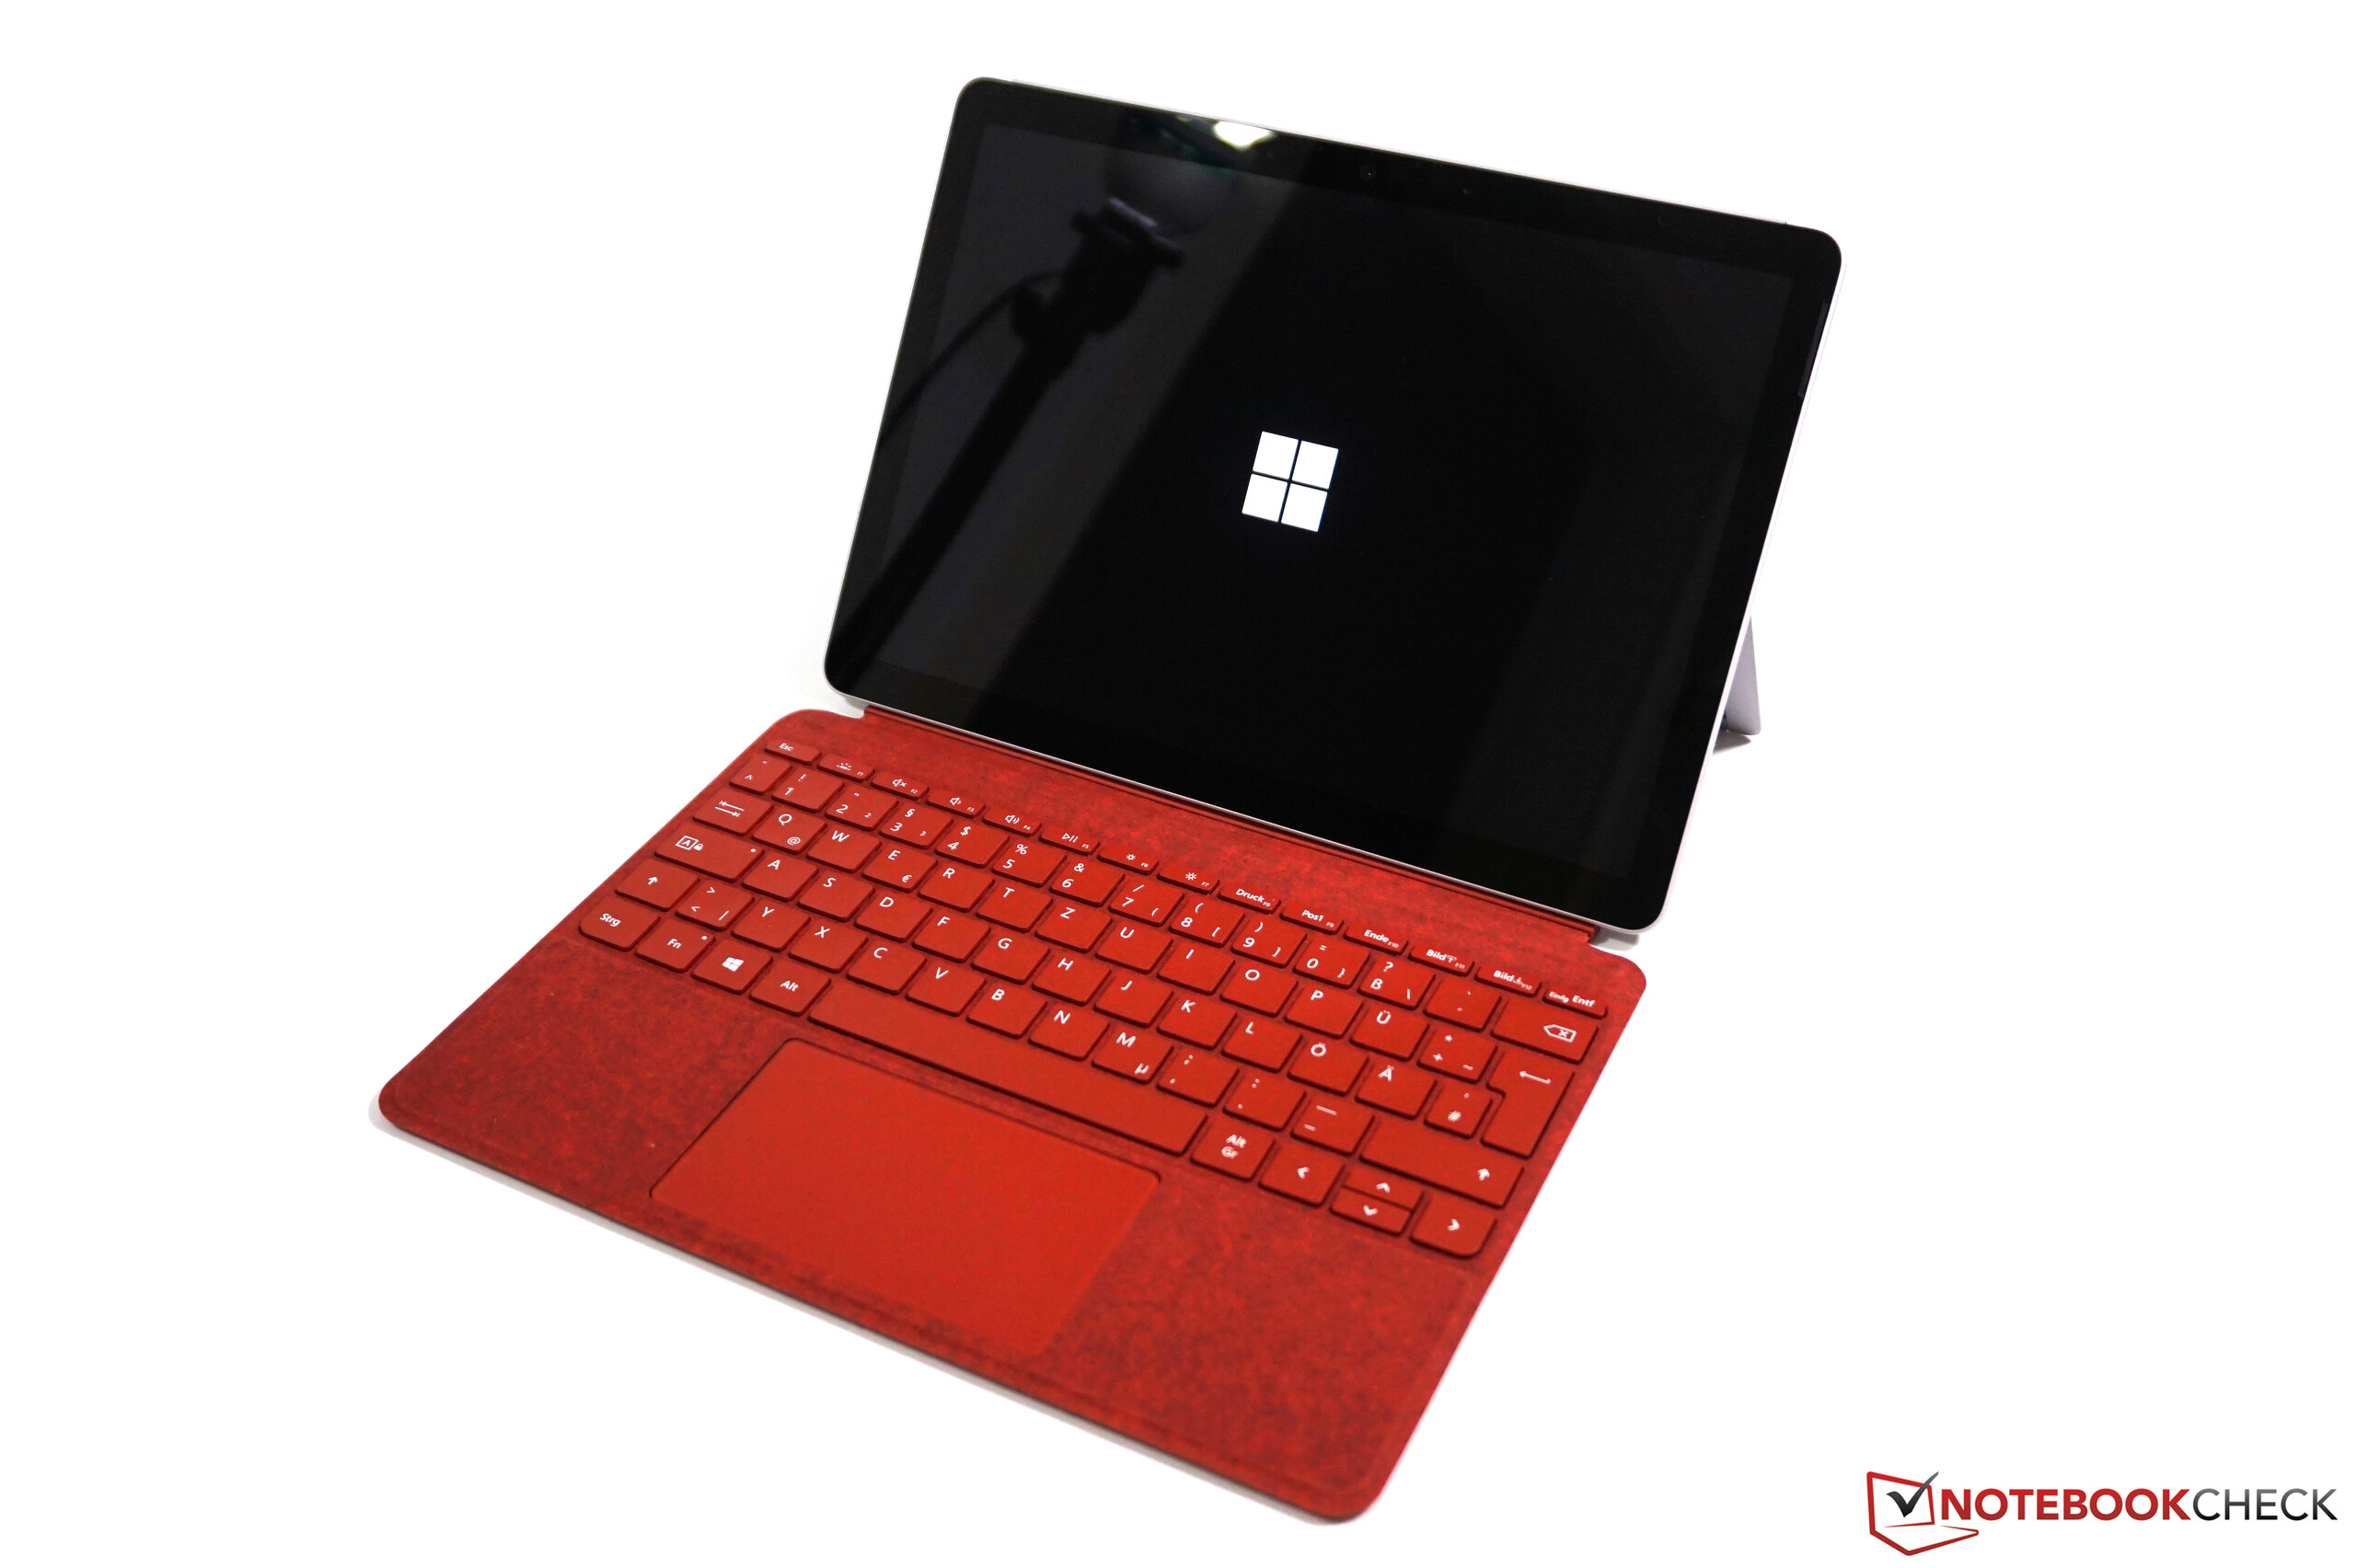
微软Surface Go 3评测--紧凑的可折叠机现在有了Windows 11
Possible competitors in comparison
Rating | Date | Model | Weight | Height | Size | Resolution | Price |
|---|---|---|---|---|---|---|---|
| 85.3 % v7 (old) | 10 / 2021 | Microsoft Surface Go 3 Core i3 i3-10100Y, UHD Graphics 615 | 783 g | 8.3 mm | 10.50" | 1920x1280 | |
| 85.4 % v7 (old) | 06 / 2020 | Microsoft Surface Go 2, m3-8100Y m3-8100Y, UHD Graphics 615 | 790 g | 8.3 mm | 10.50" | 1920x1280 | |
| 86.2 % v7 (old) | 01 / 2021 | Lenovo Tab P11 Pro SD 730G, Adreno 618 | 485 g | 5.8 mm | 11.50" | 2560x1600 | |
| 90.7 % v7 (old) | 10 / 2020 | Apple iPad Air 4 2020 A14, A14 Bionic GPU | 458 g | 6.1 mm | 10.90" | 2360x1640 | |
| 88.4 % v7 (old) | 04 / 2020 | Microsoft Surface Pro 7 Core i5-1035G4 i5-1035G4, Iris Plus Graphics G4 (Ice Lake 48 EU) | 1.1 kg | 8.5 mm | 12.30" | 2736x1824 |
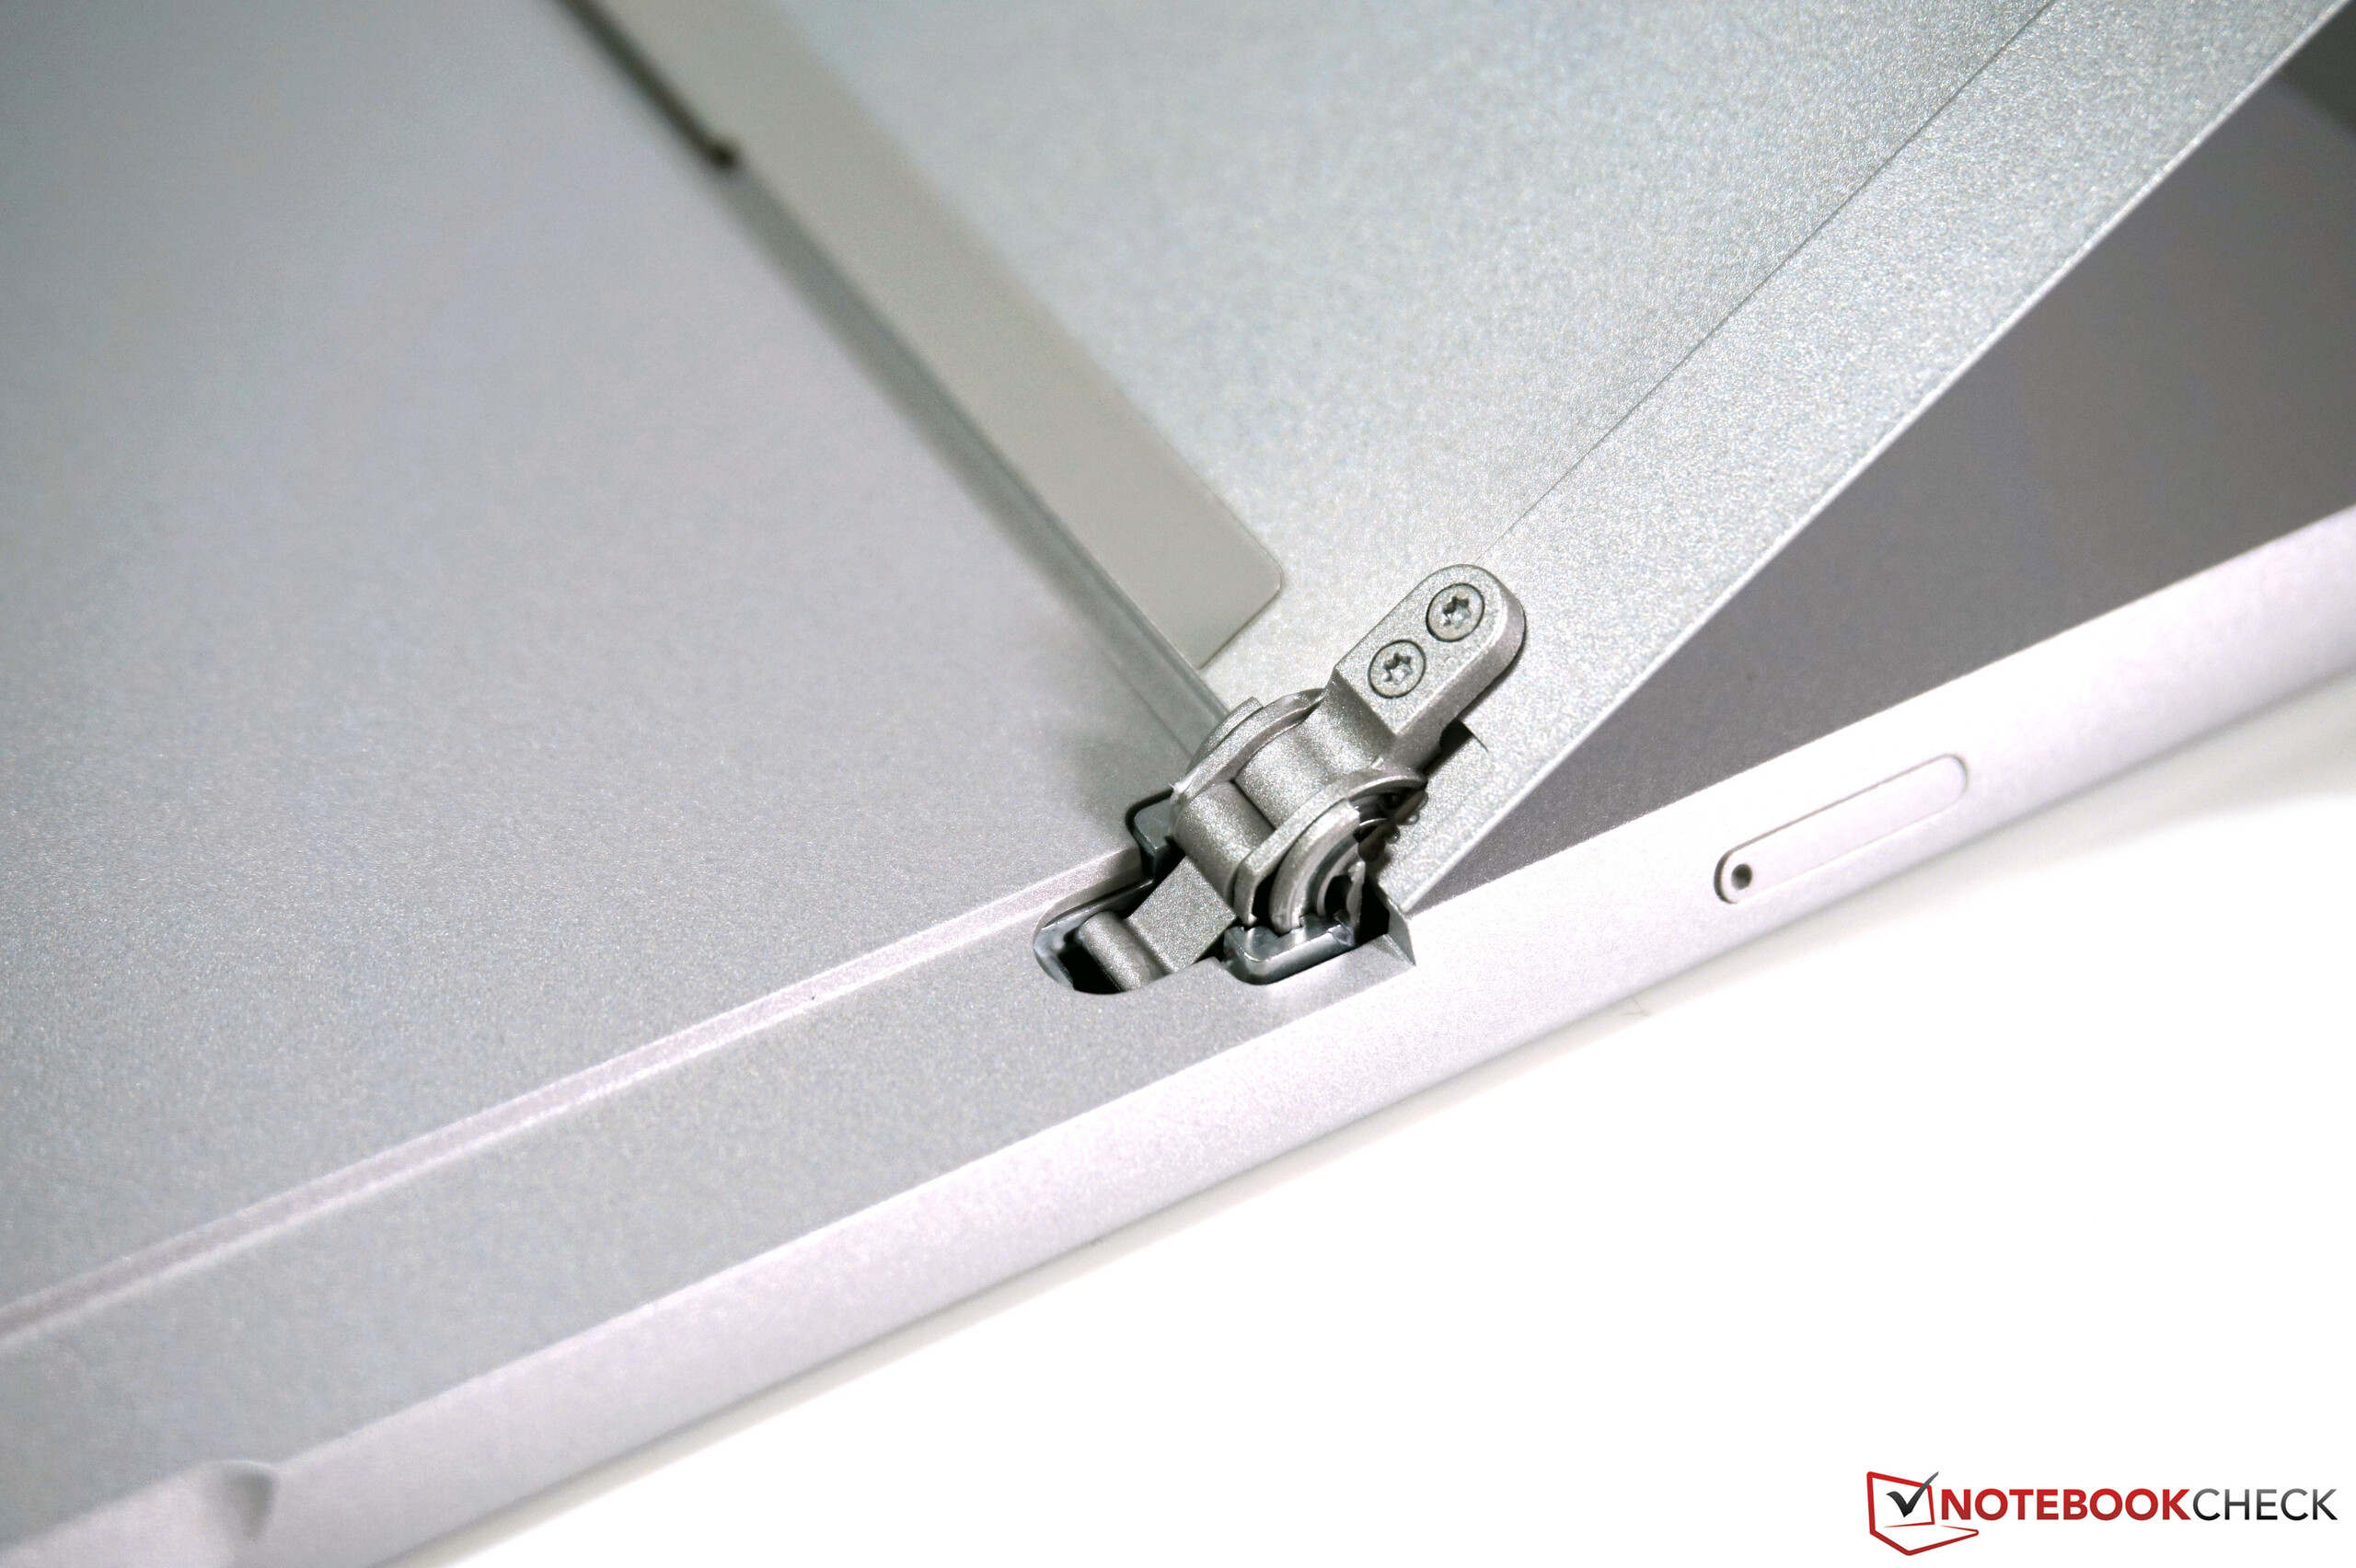
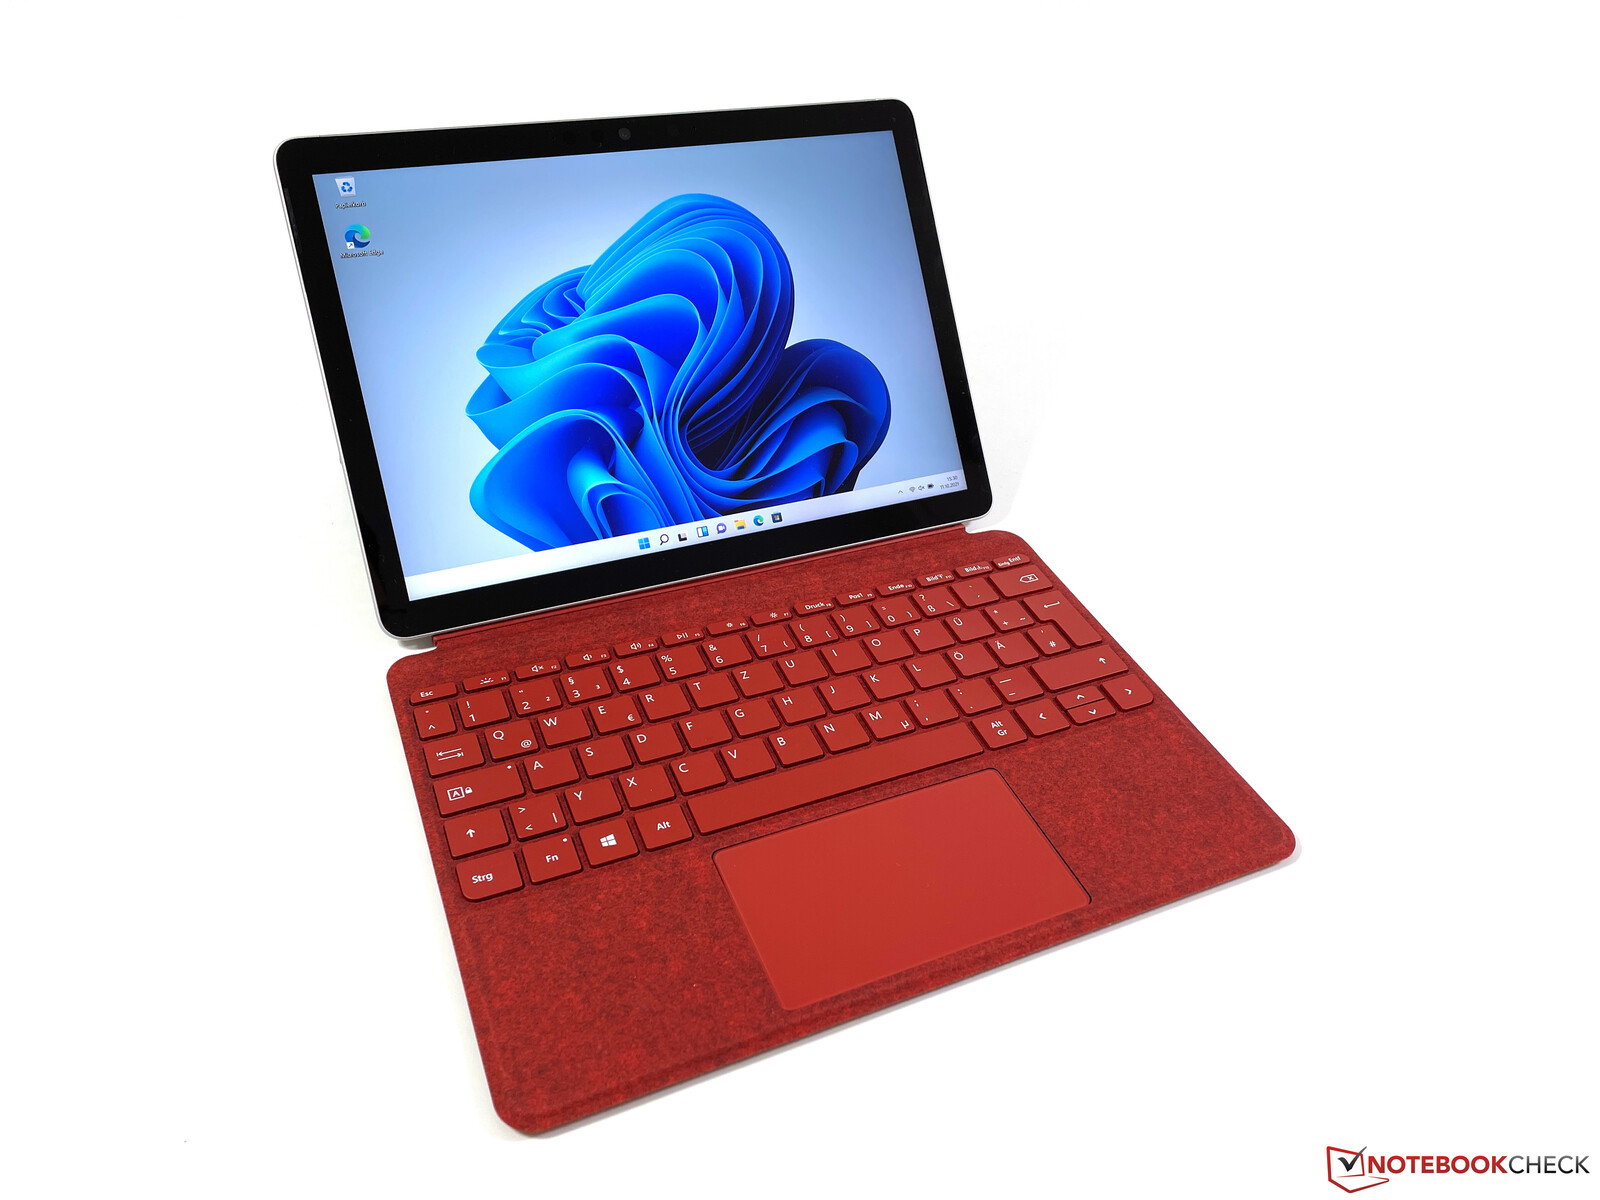
外壳、设备和输入装置
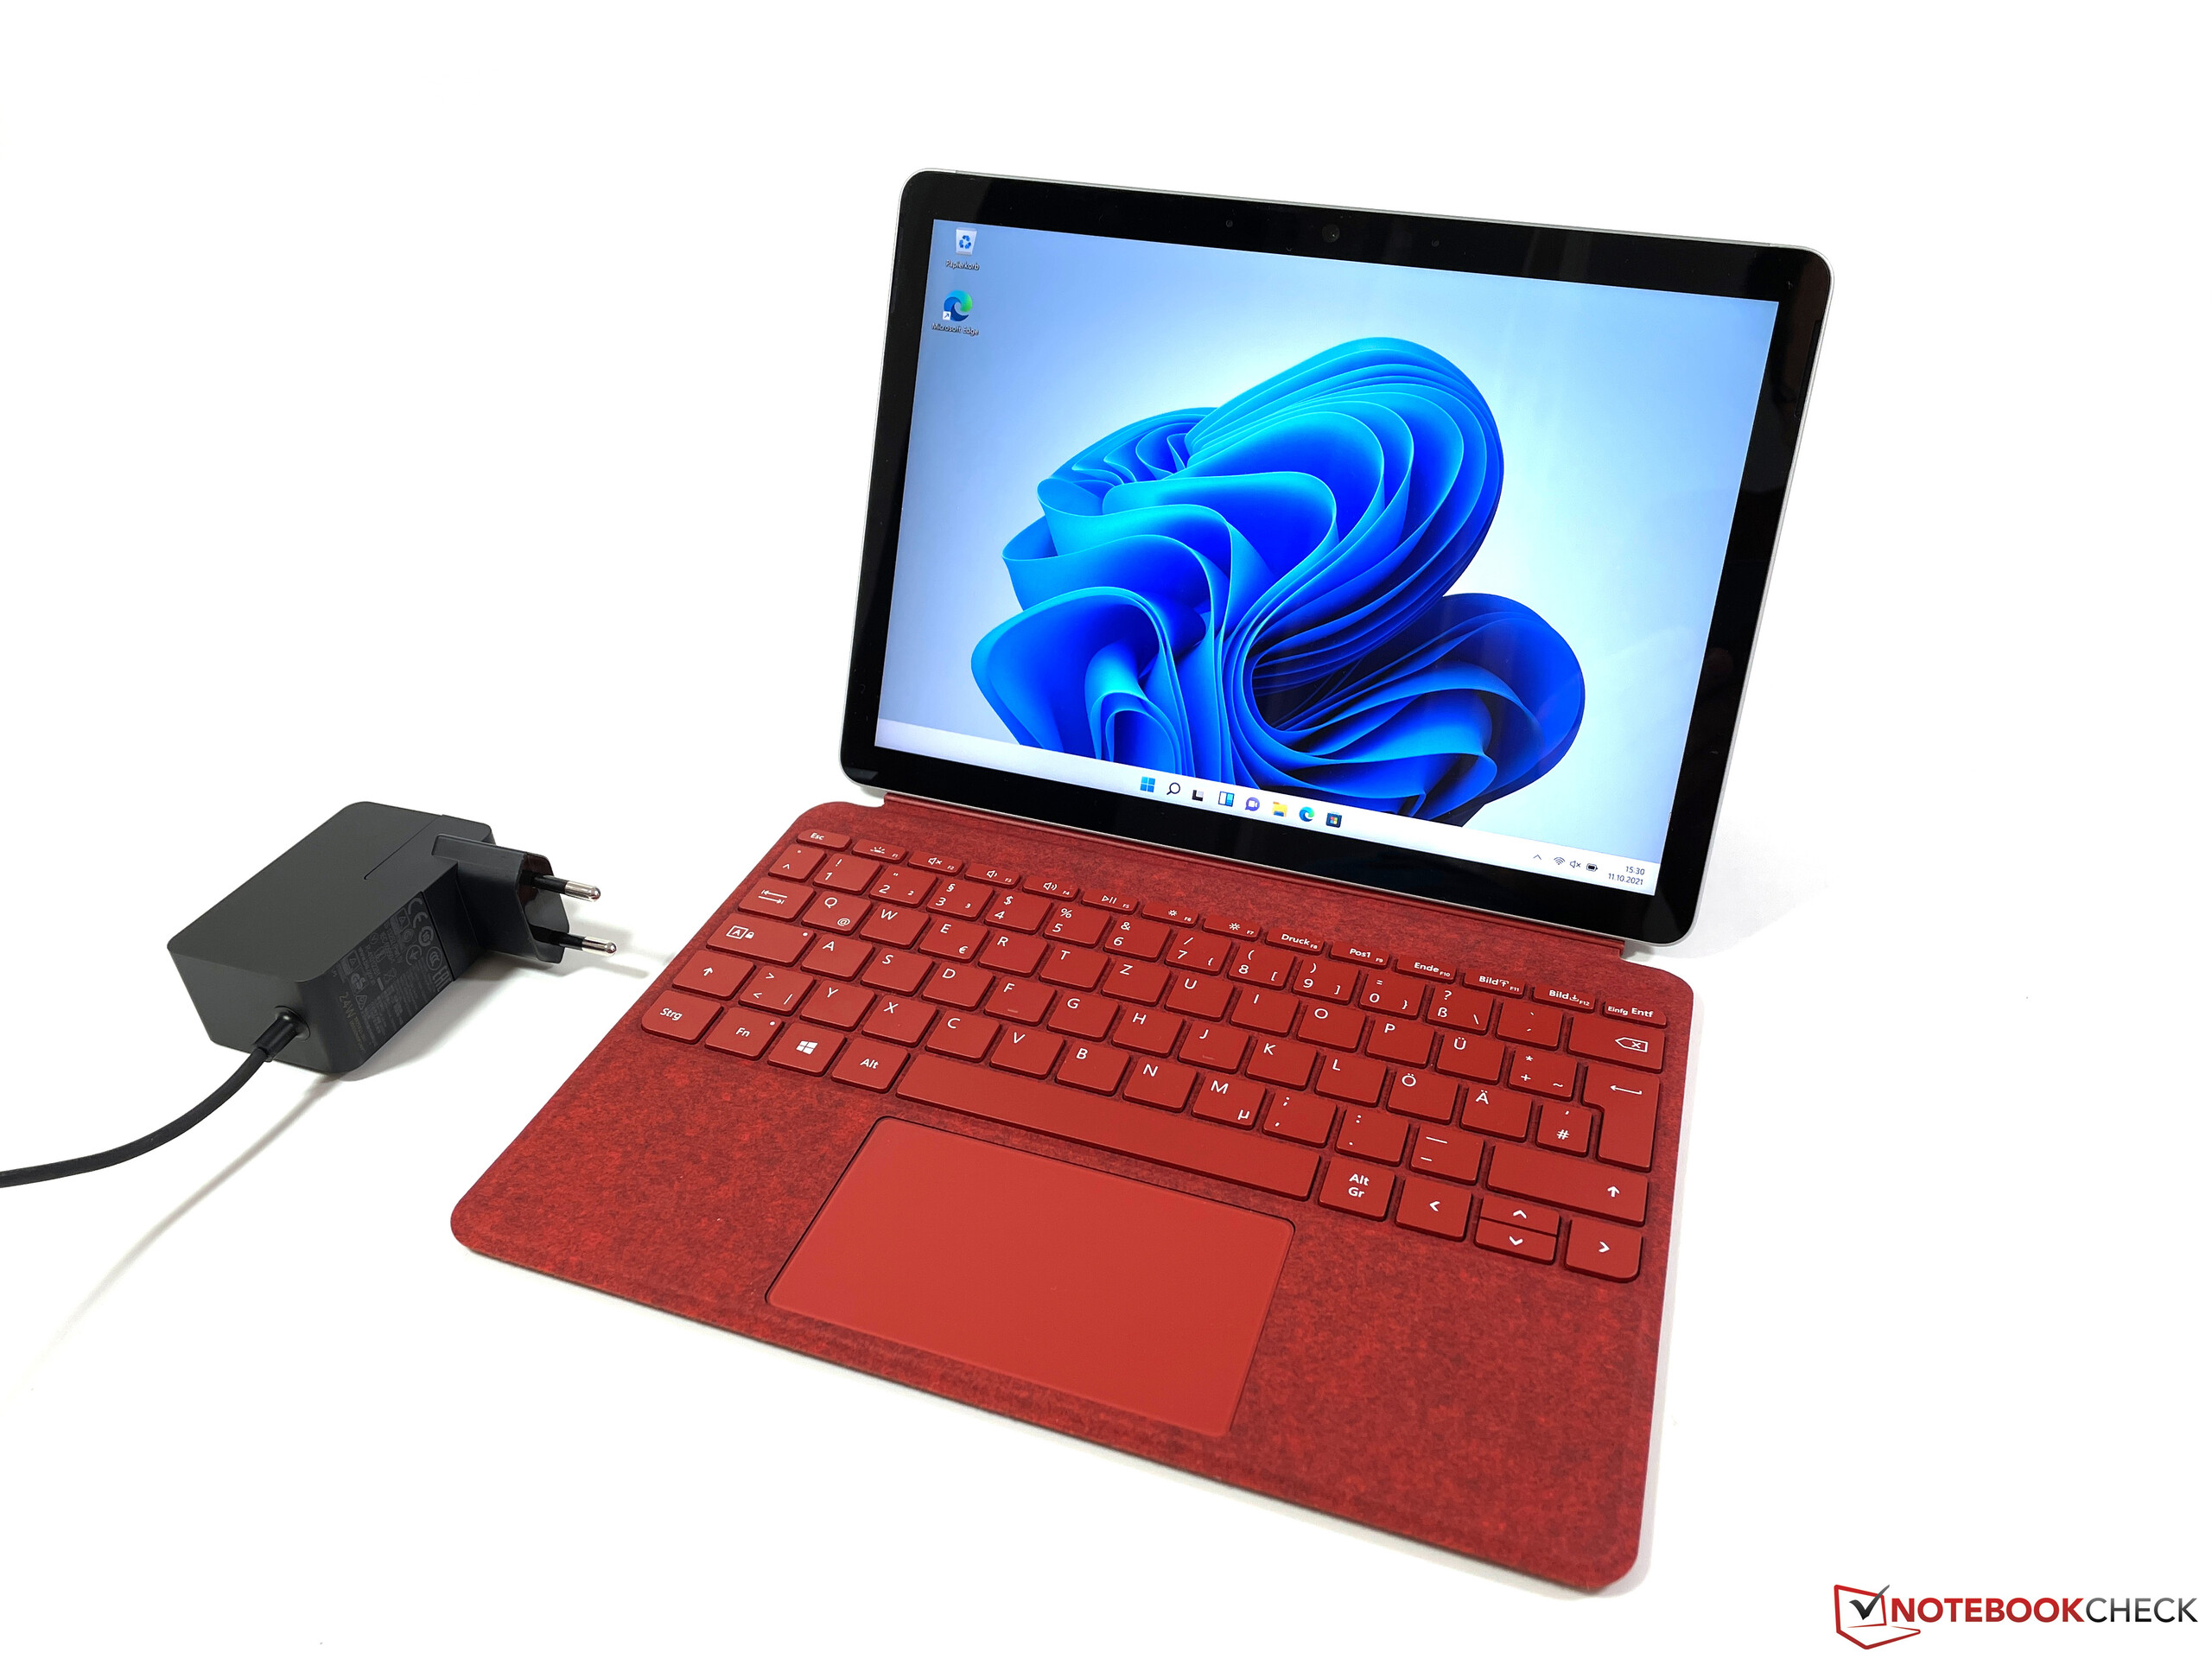
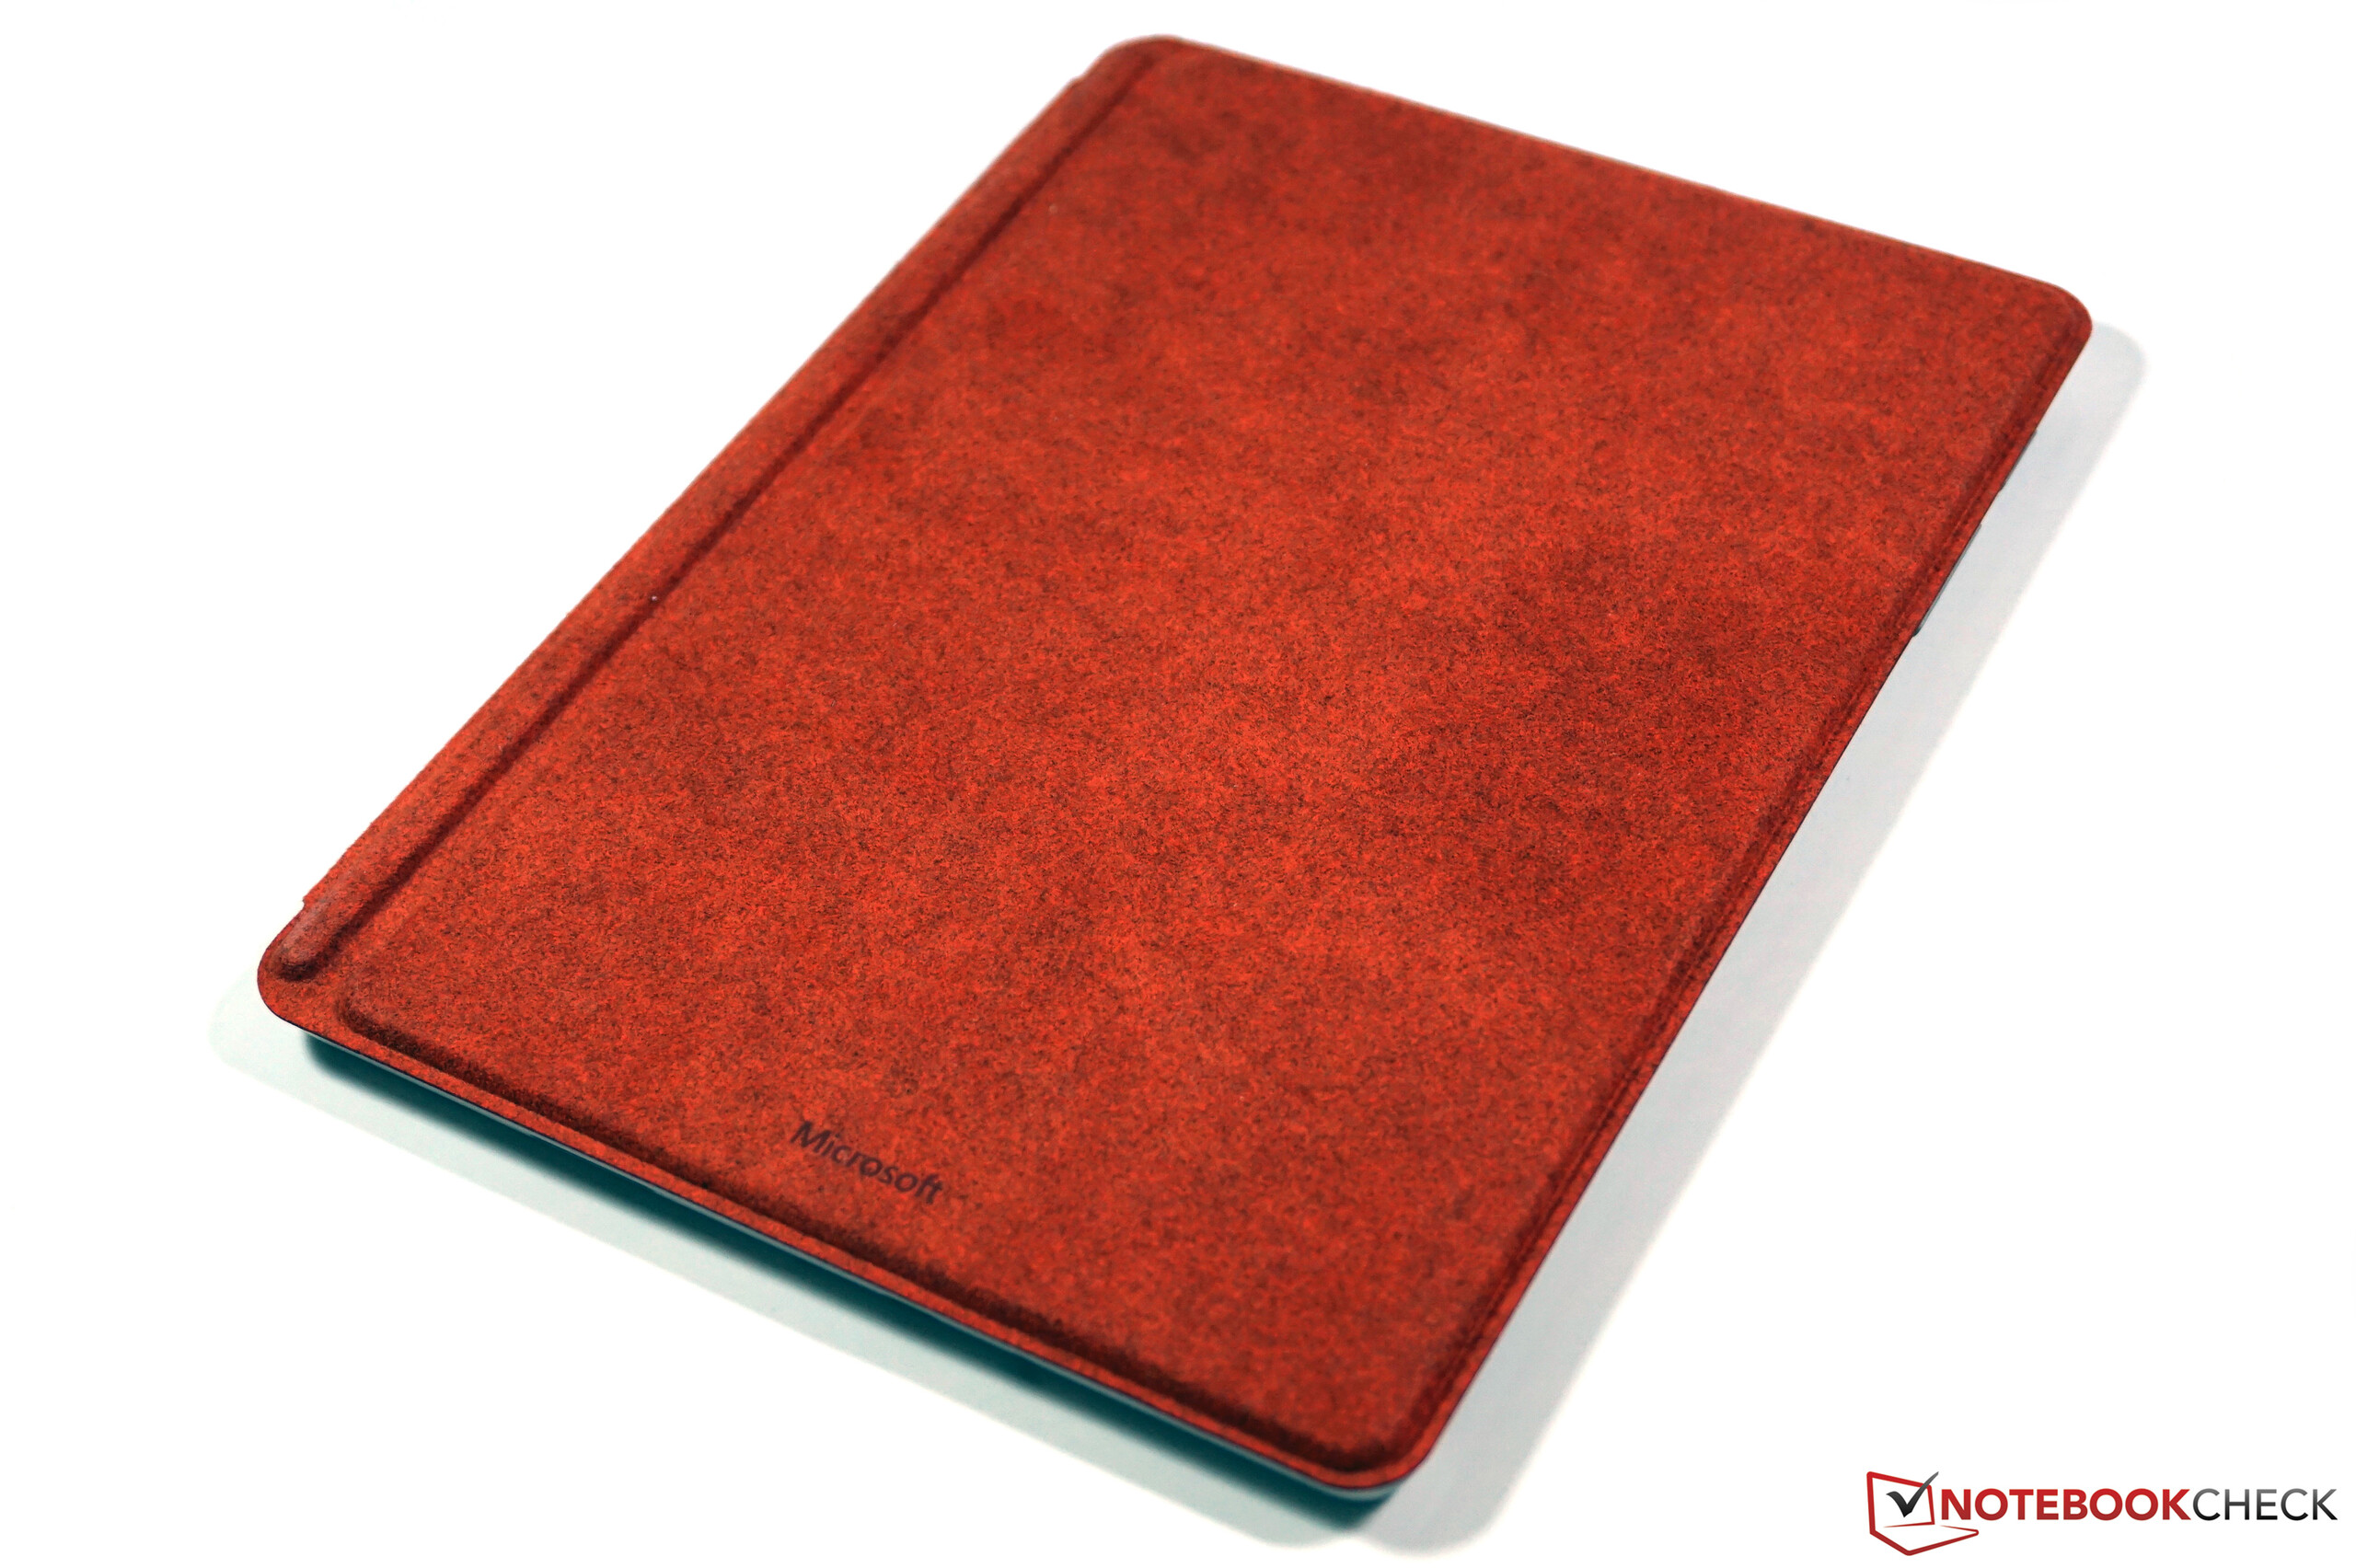
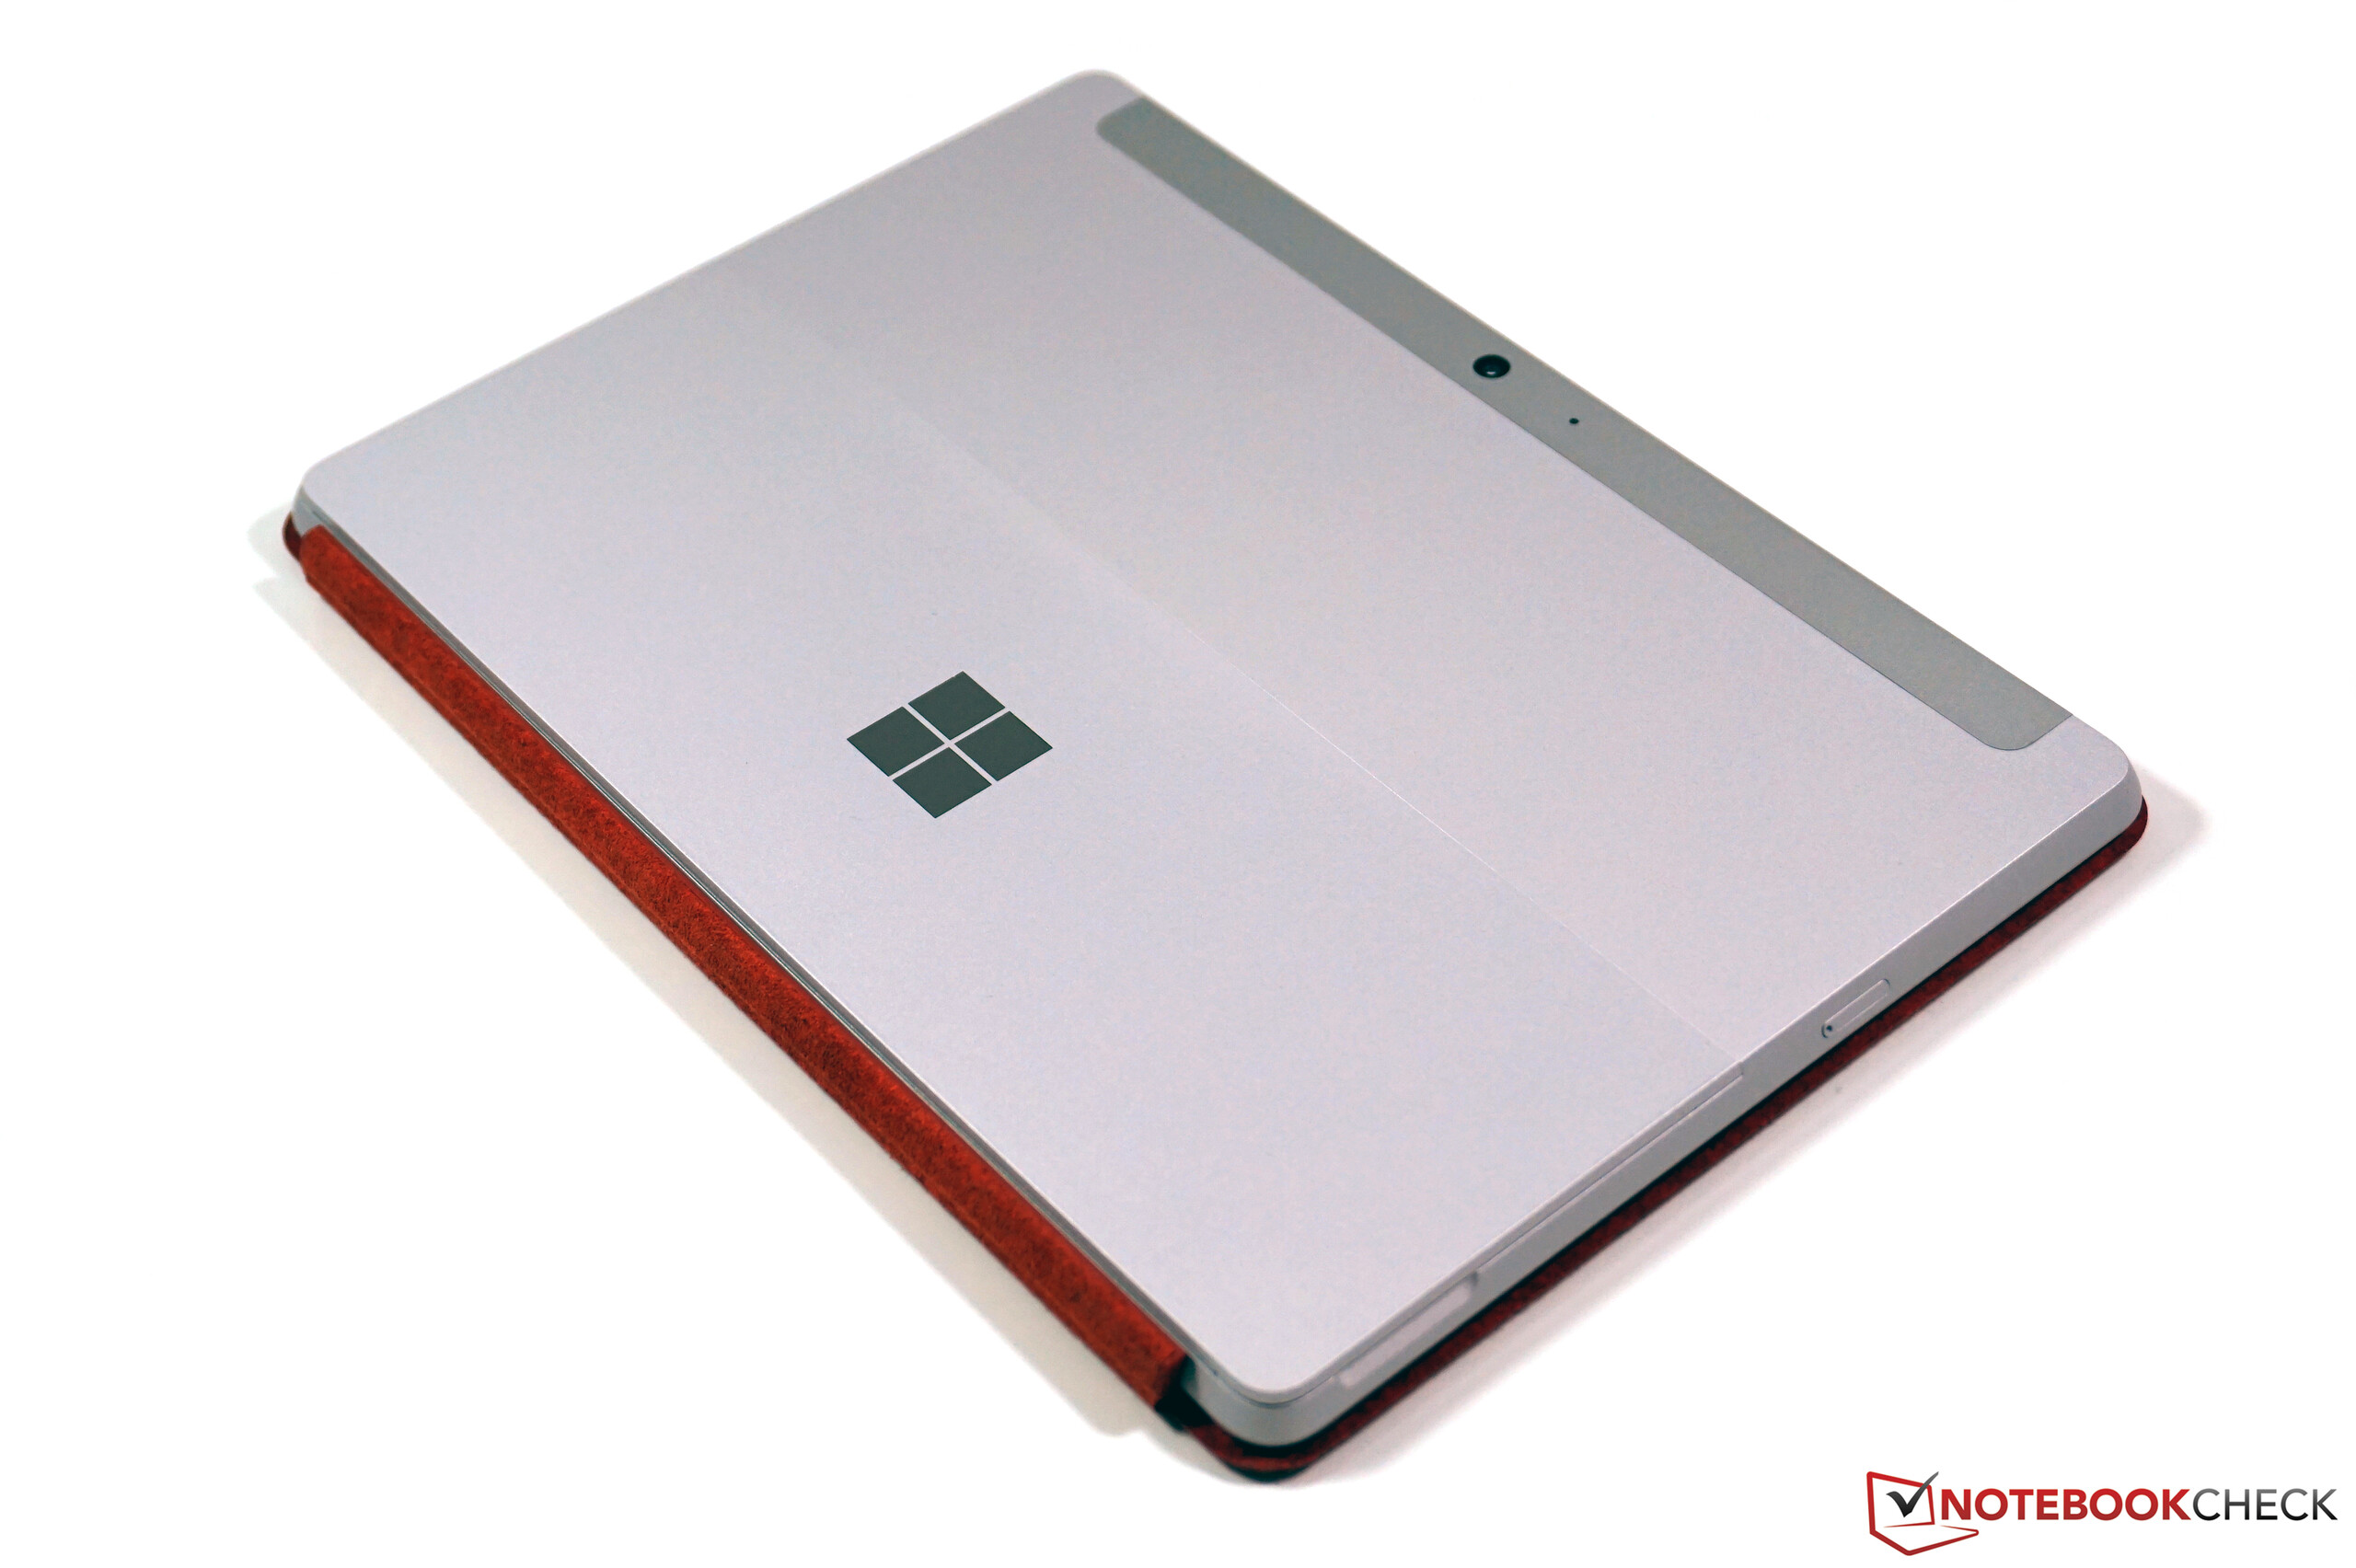
Surface Go的外壳没有被改变,仍然以高质量的做工而令人信服。镁合金外壳非常坚固,各种可选的键盘盖可以实现一定程度的定制。我们评测样品的红色Alcantara盖子又要129欧元(约150美元)。然而,我们仍然喜欢发光的键盘。当然,由于设备紧凑,按键相对较小,但打字的感觉是清脆而精确的。
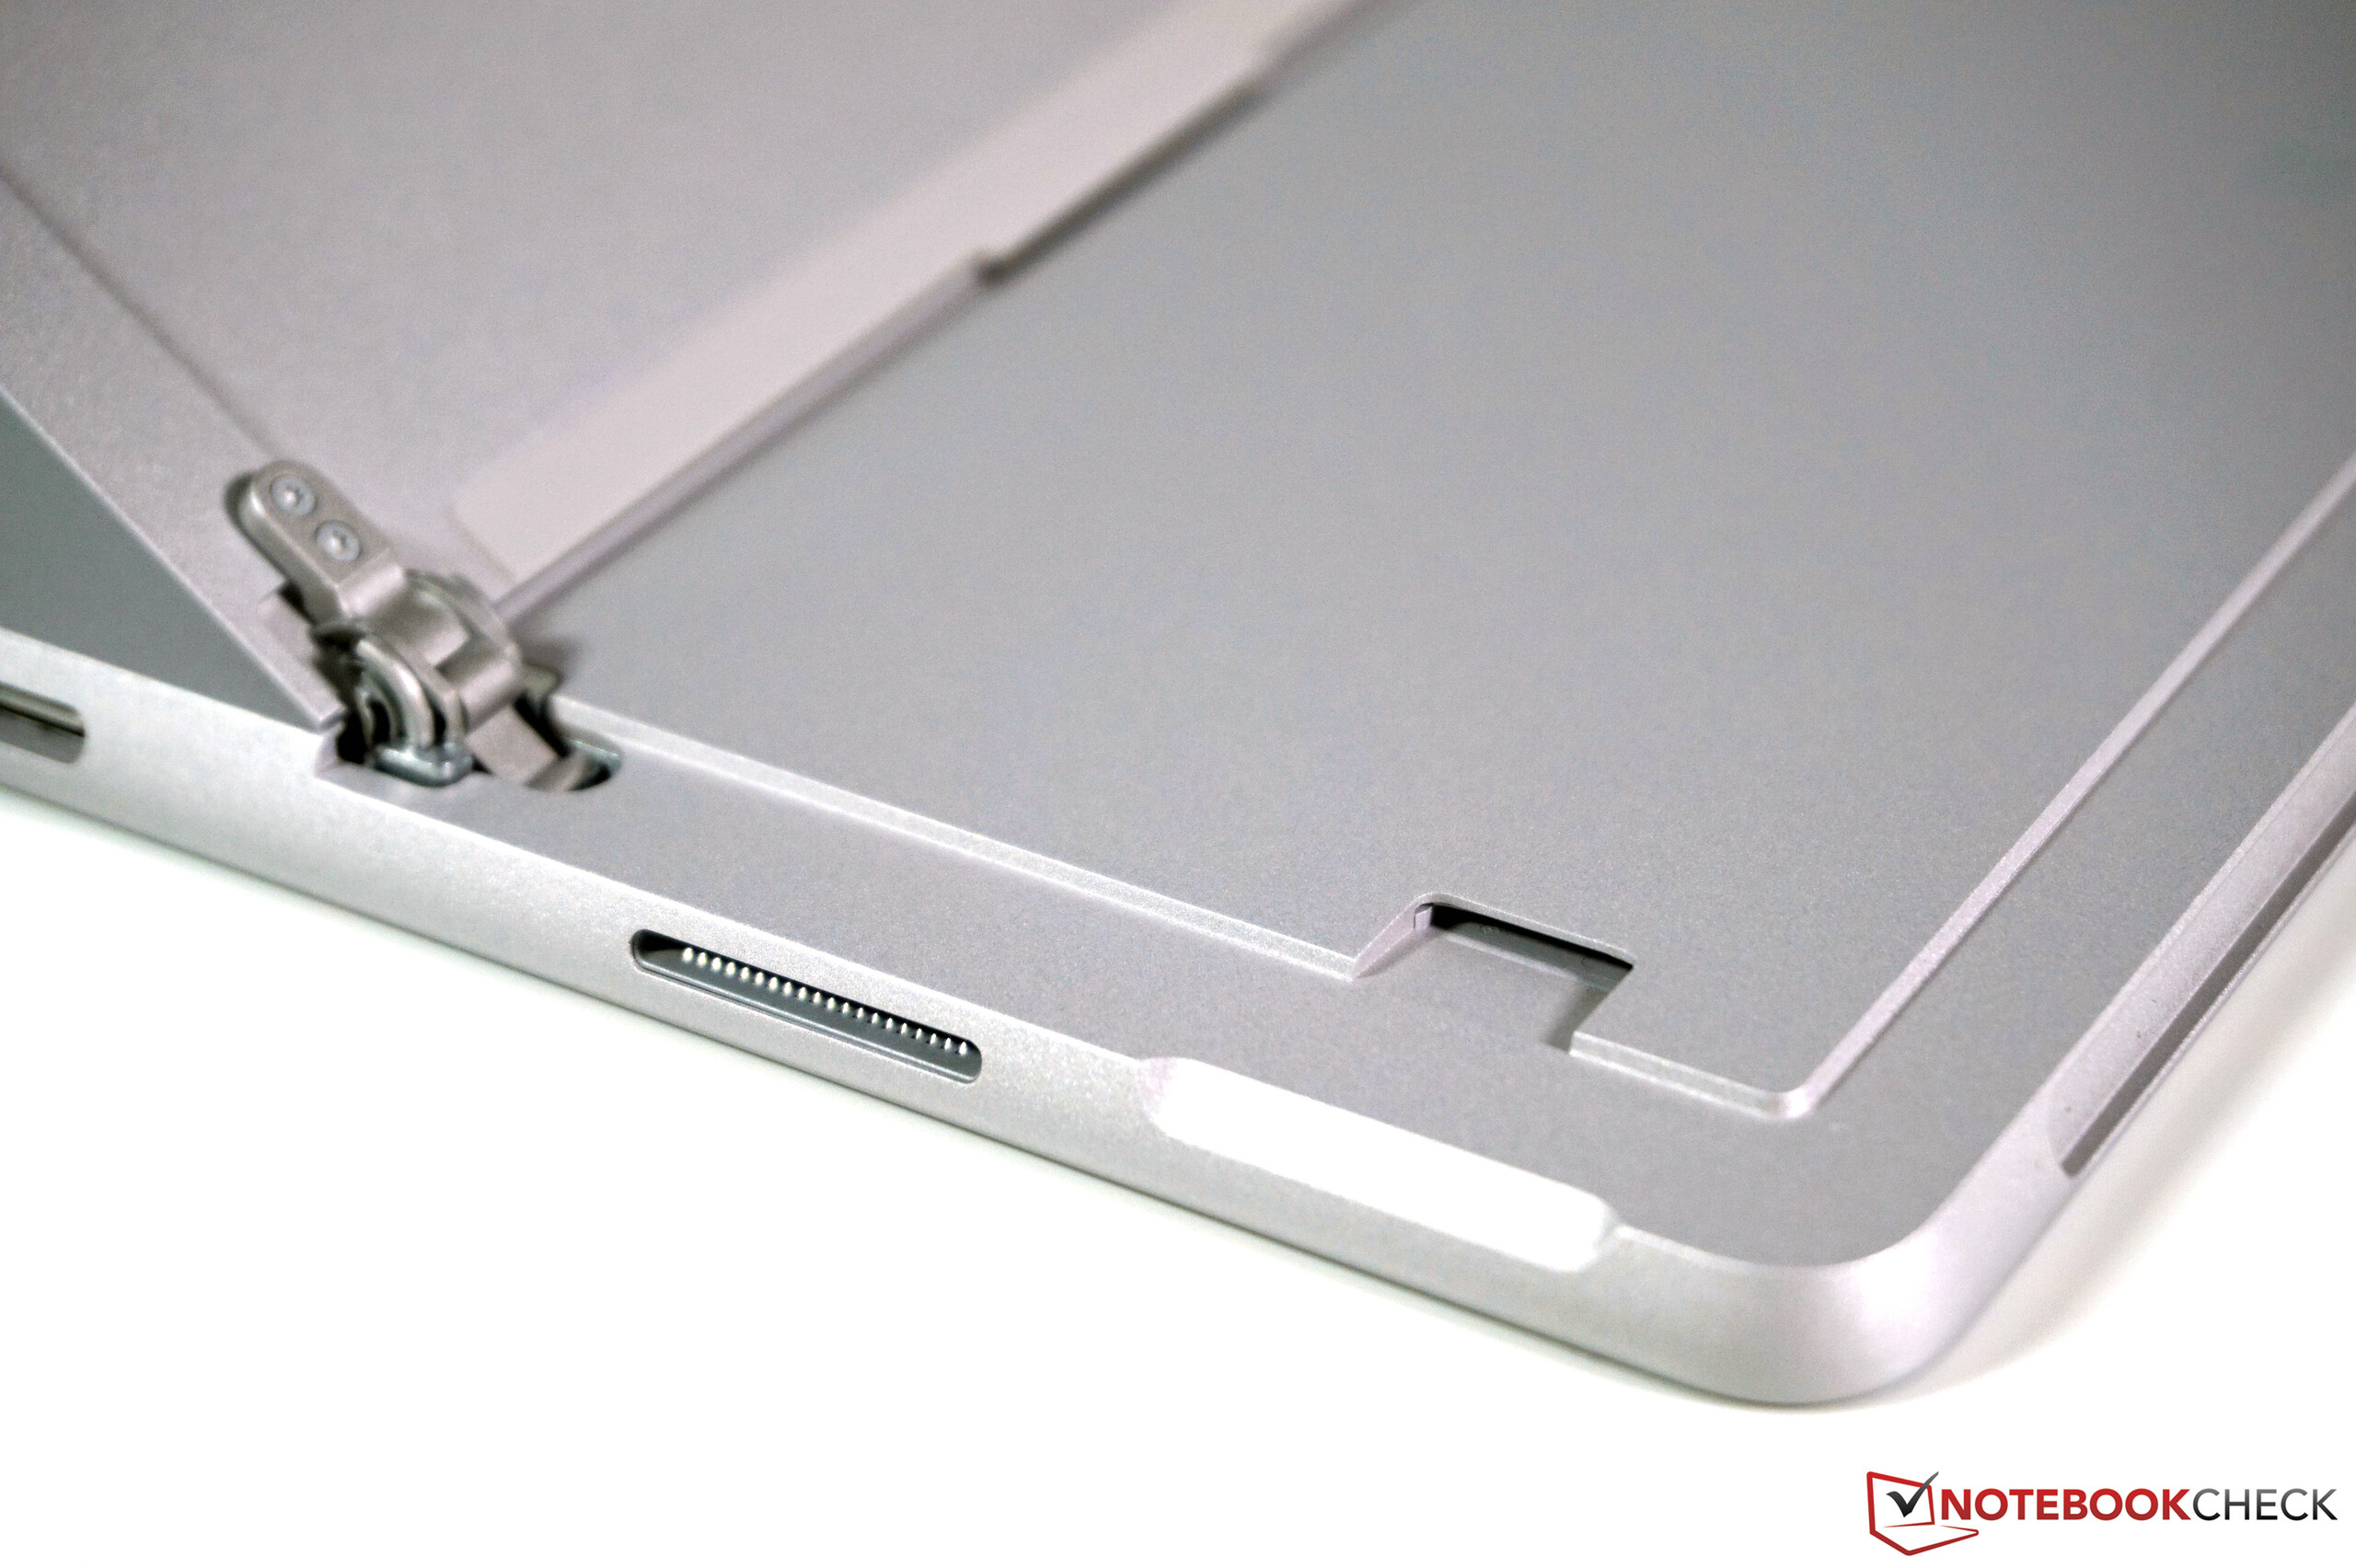
除了USB-C接口(也可用于充电),微软仍然依赖自己的Surface Connector,由于其方向性(电缆要么向上粘,要么挂在键盘周围),在实践中往往有点令人讨厌。WLAN的性能非常好,而且还有一个微型SD读卡器。
在网络摄像头方面,Surface Go 3比大多数笔记本有明显的优势,因为两个内置传感器(500万像素和800万像素)的图像质量简直是明显的好。一个新功能是额外的红外摄像头,现在还支持Windows Hello的面部识别。还为企业客户提供了一个LTE模块。
| SD Card Reader | |
| average JPG Copy Test (av. of 3 runs) | |
| Microsoft Surface Go 2, m3-8100Y (Toshiba Exceria Pro M501 64 GB UHS-II) | |
| Microsoft Surface Go 3 Core i3 (AV Pro V60) | |
| Microsoft Surface Pro 7 Core i5-1035G4 (Toshiba Exceria Pro M501 64 GB UHS-II) | |
| Average of class Convertible (28.1 - 197, n=23, last 2 years) | |
| Lenovo Tab P11 Pro (Toshiba Exceria Pro M501) | |
| maximum AS SSD Seq Read Test (1GB) | |
| Average of class Convertible (28.9 - 254, n=22, last 2 years) | |
| Microsoft Surface Go 2, m3-8100Y (Toshiba Exceria Pro M501 64 GB UHS-II) | |
| Microsoft Surface Pro 7 Core i5-1035G4 (Toshiba Exceria Pro M501 64 GB UHS-II) | |
| Microsoft Surface Go 3 Core i3 (AV Pro V60) | |


显示屏 - Surface Go继续采用3:2触摸屏
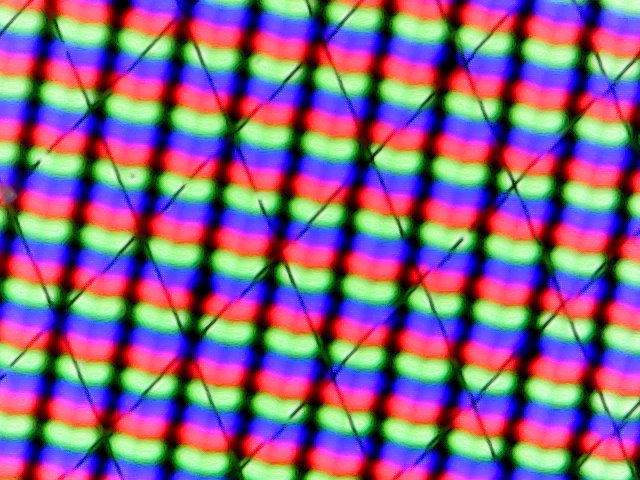
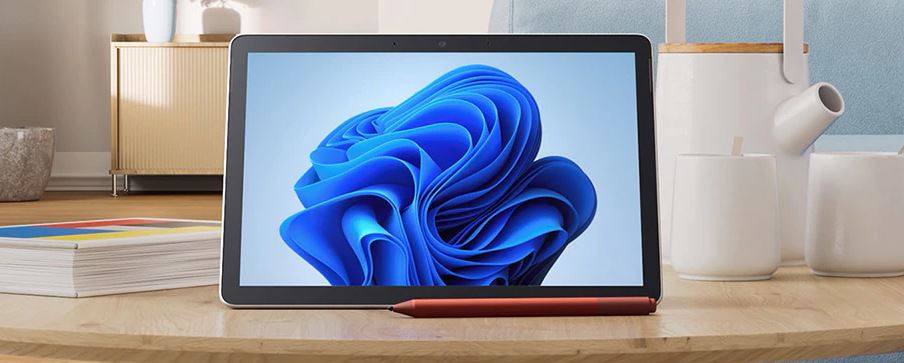
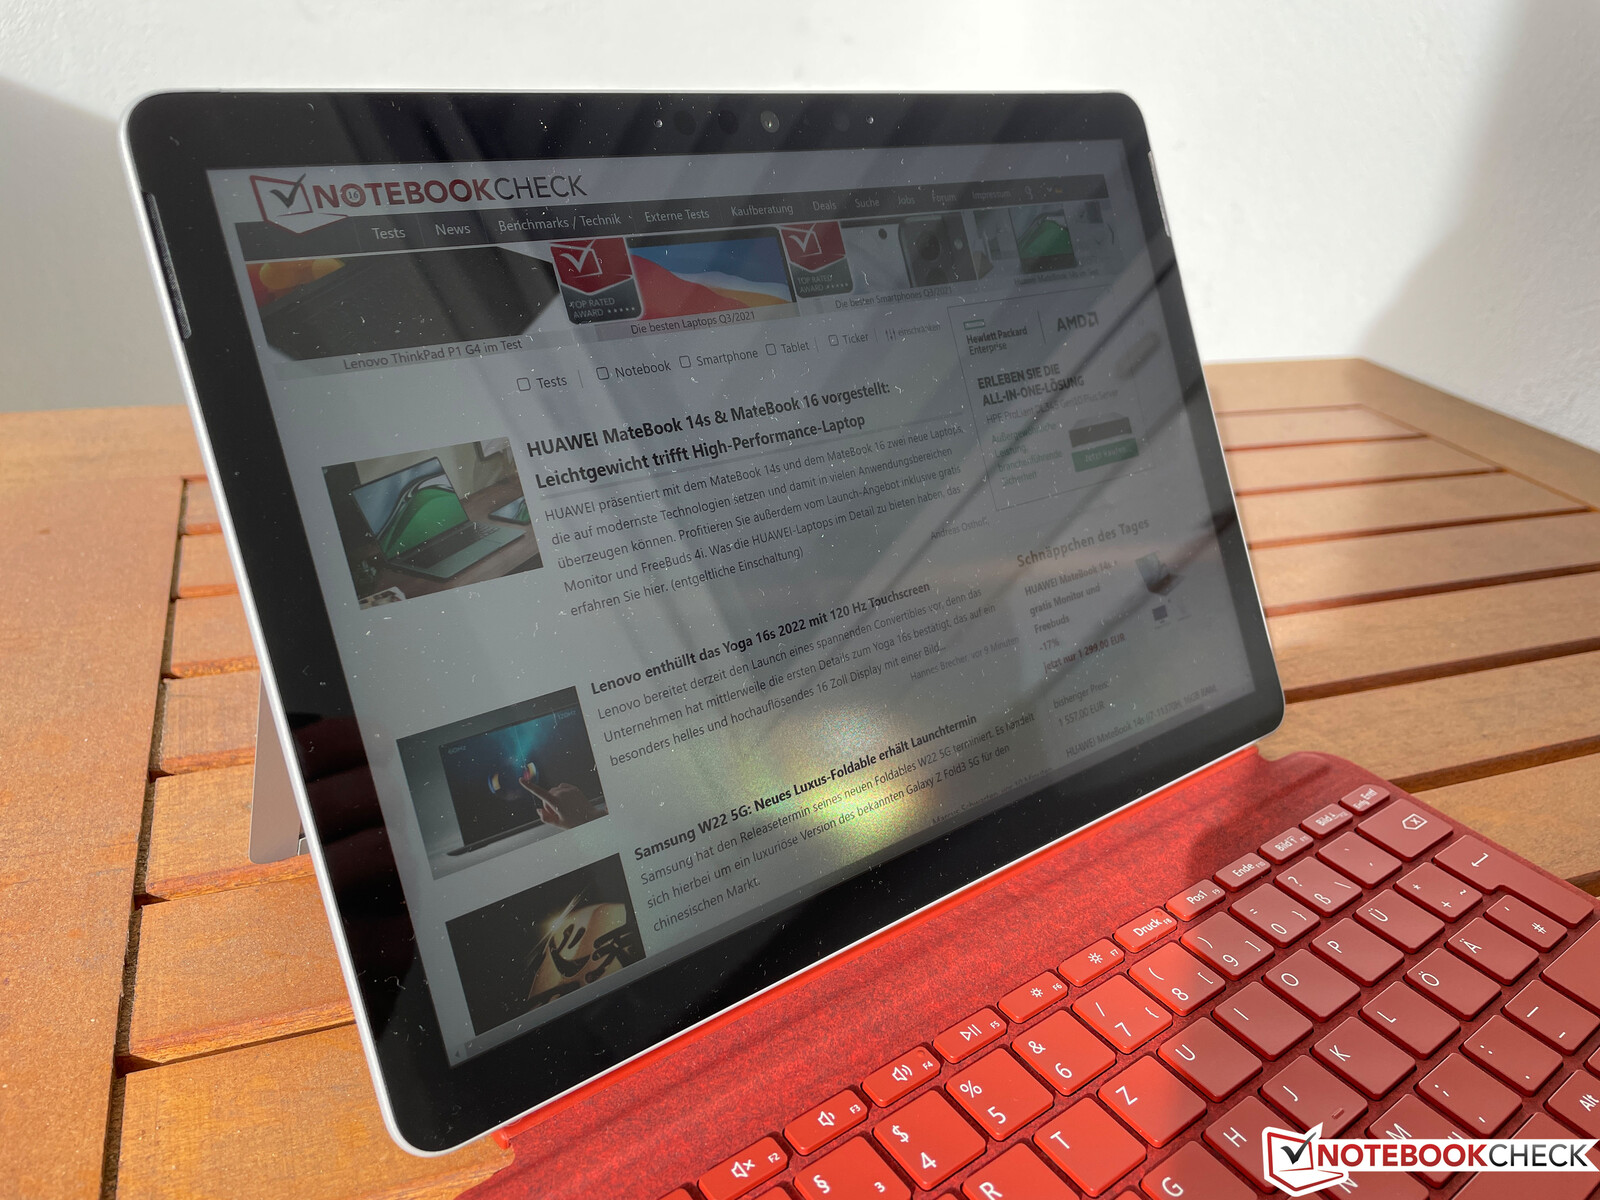
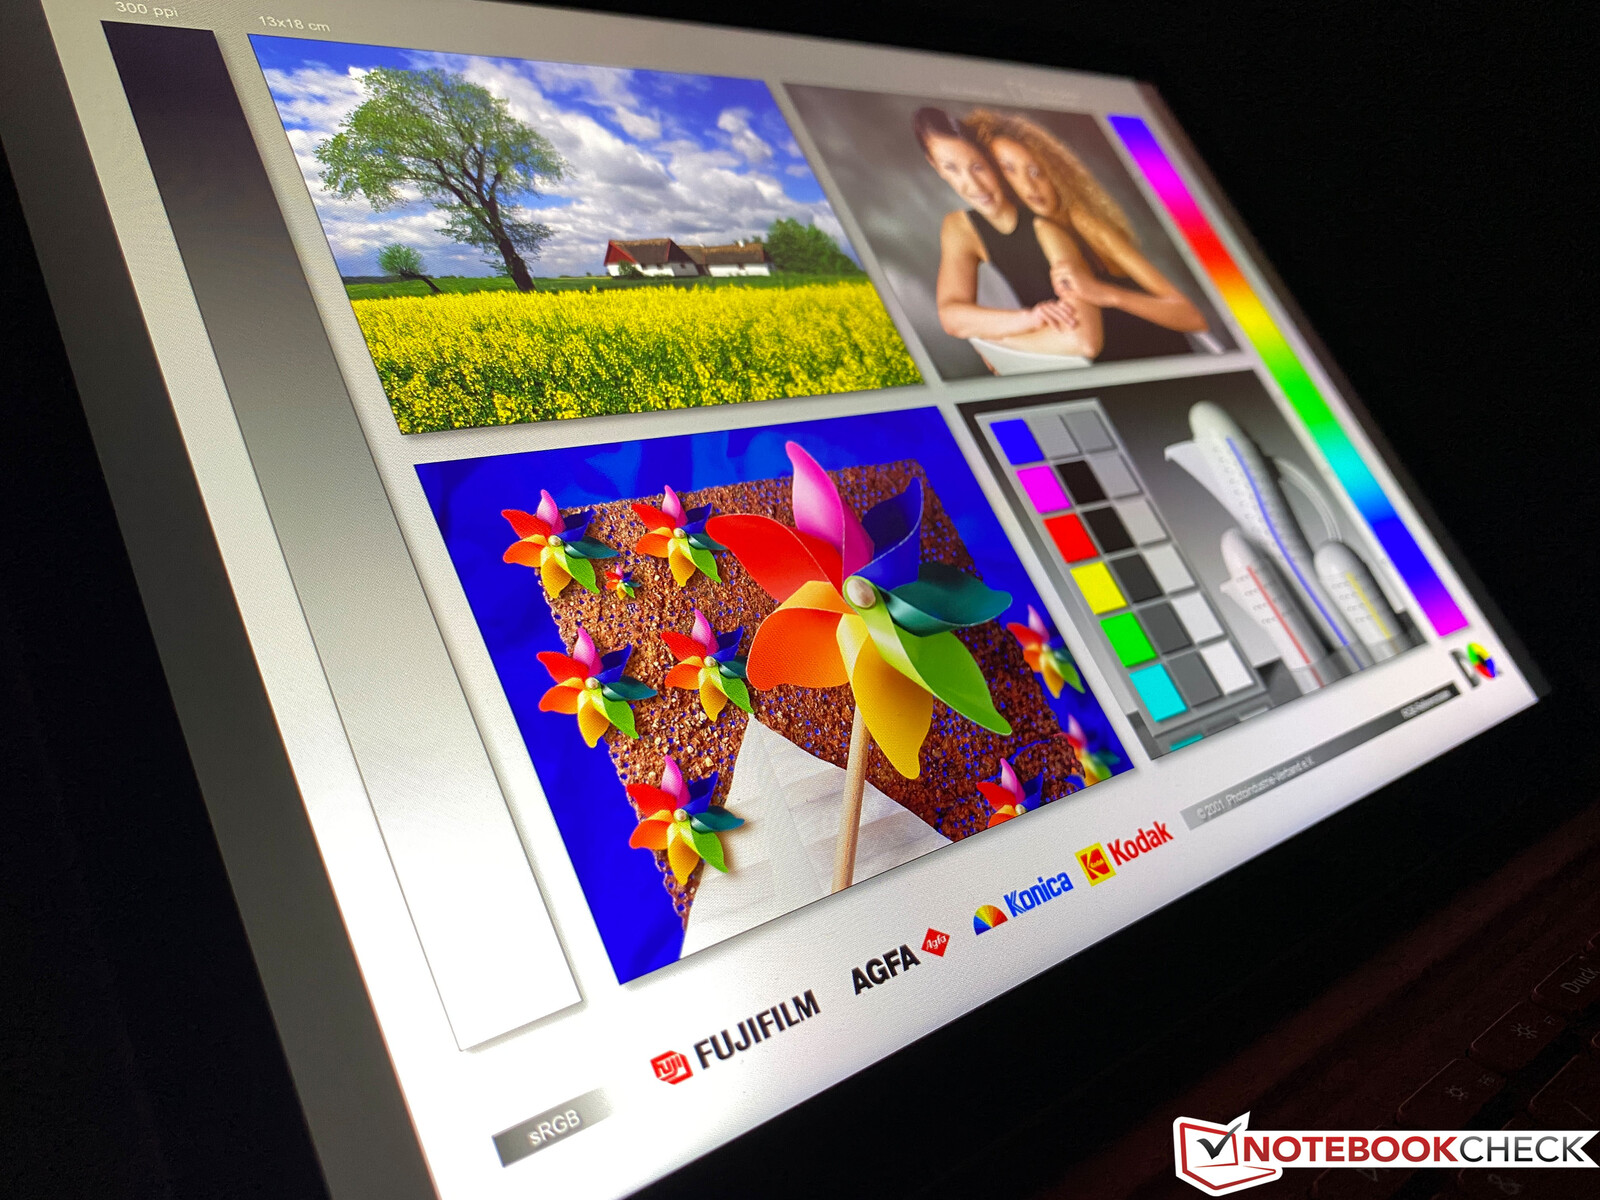
微软也没有对显示屏进行改动,甚至安装了相同的面板(NV105WAM-N31),分辨率为1,920 x 1,280像素,3:2格式。这使得紧凑的10.5英寸触摸屏上的图片非常清晰,面板的整体图片印象非常好。浑浊也不是一个大问题。
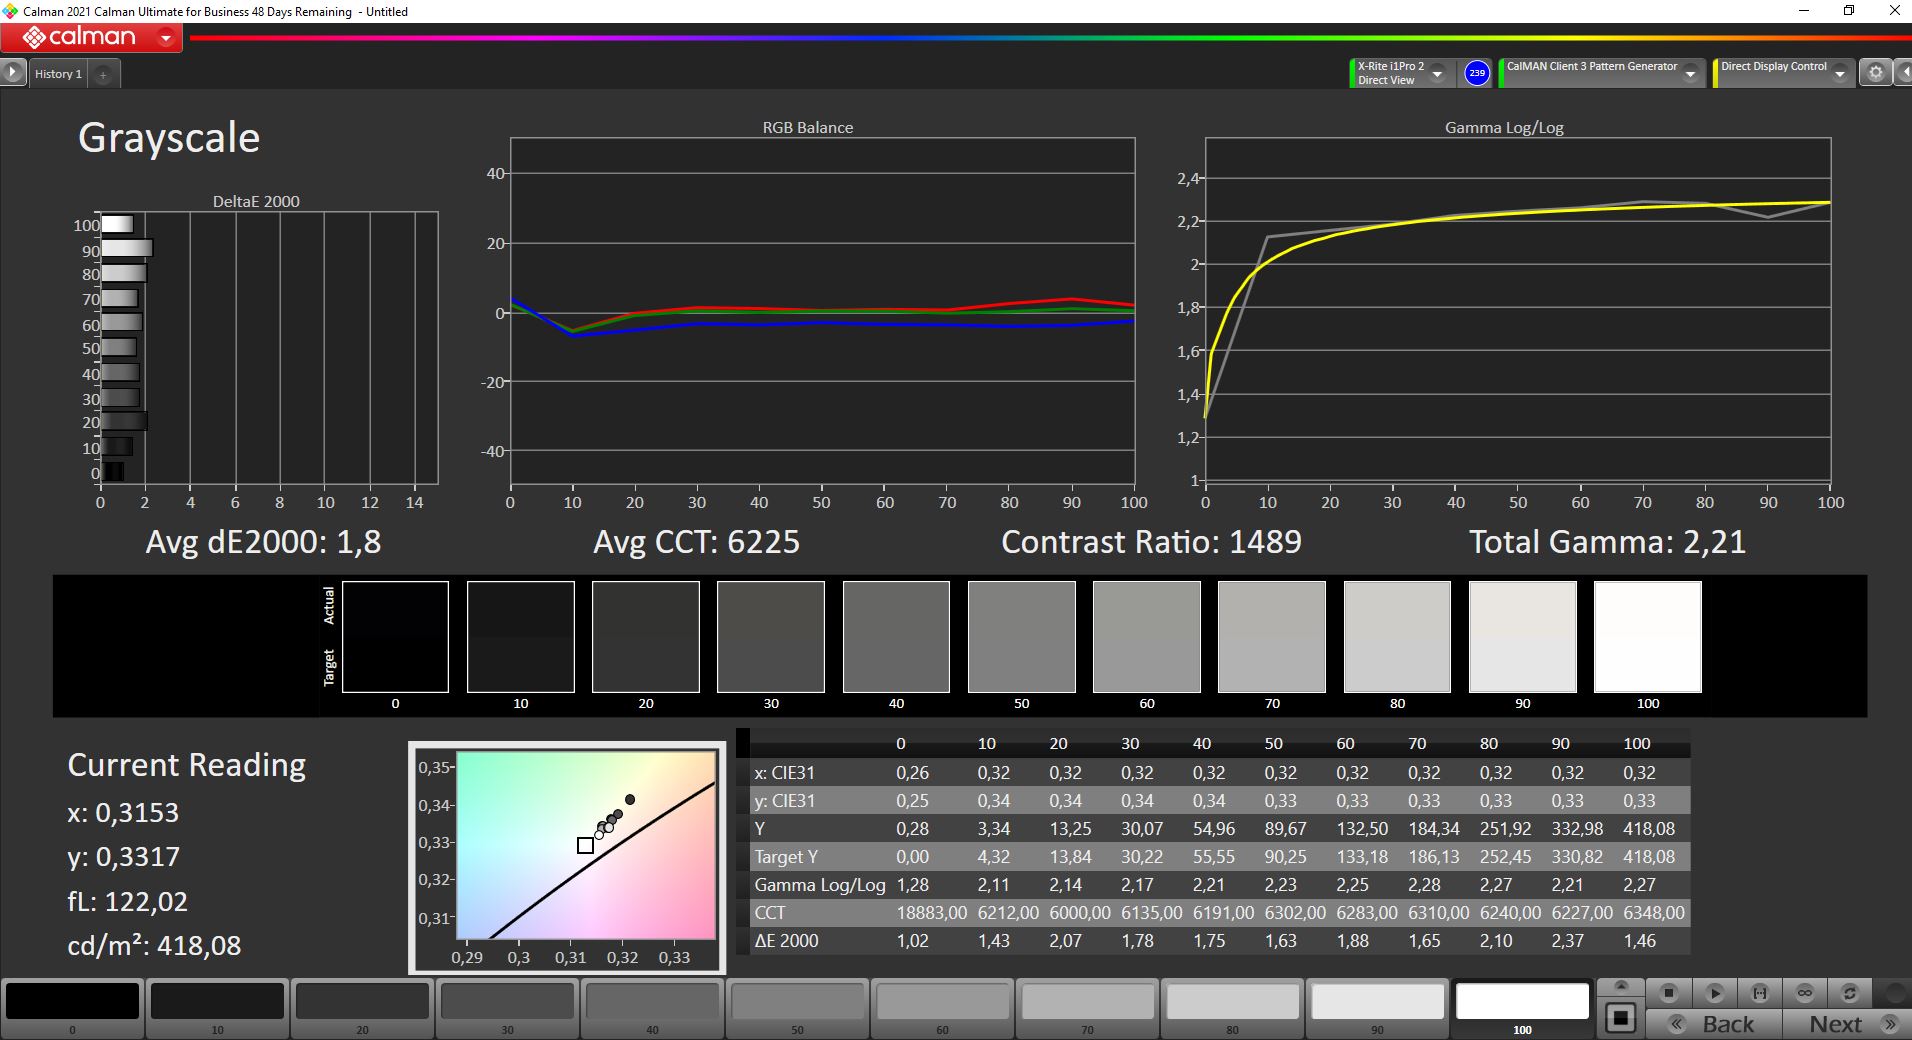
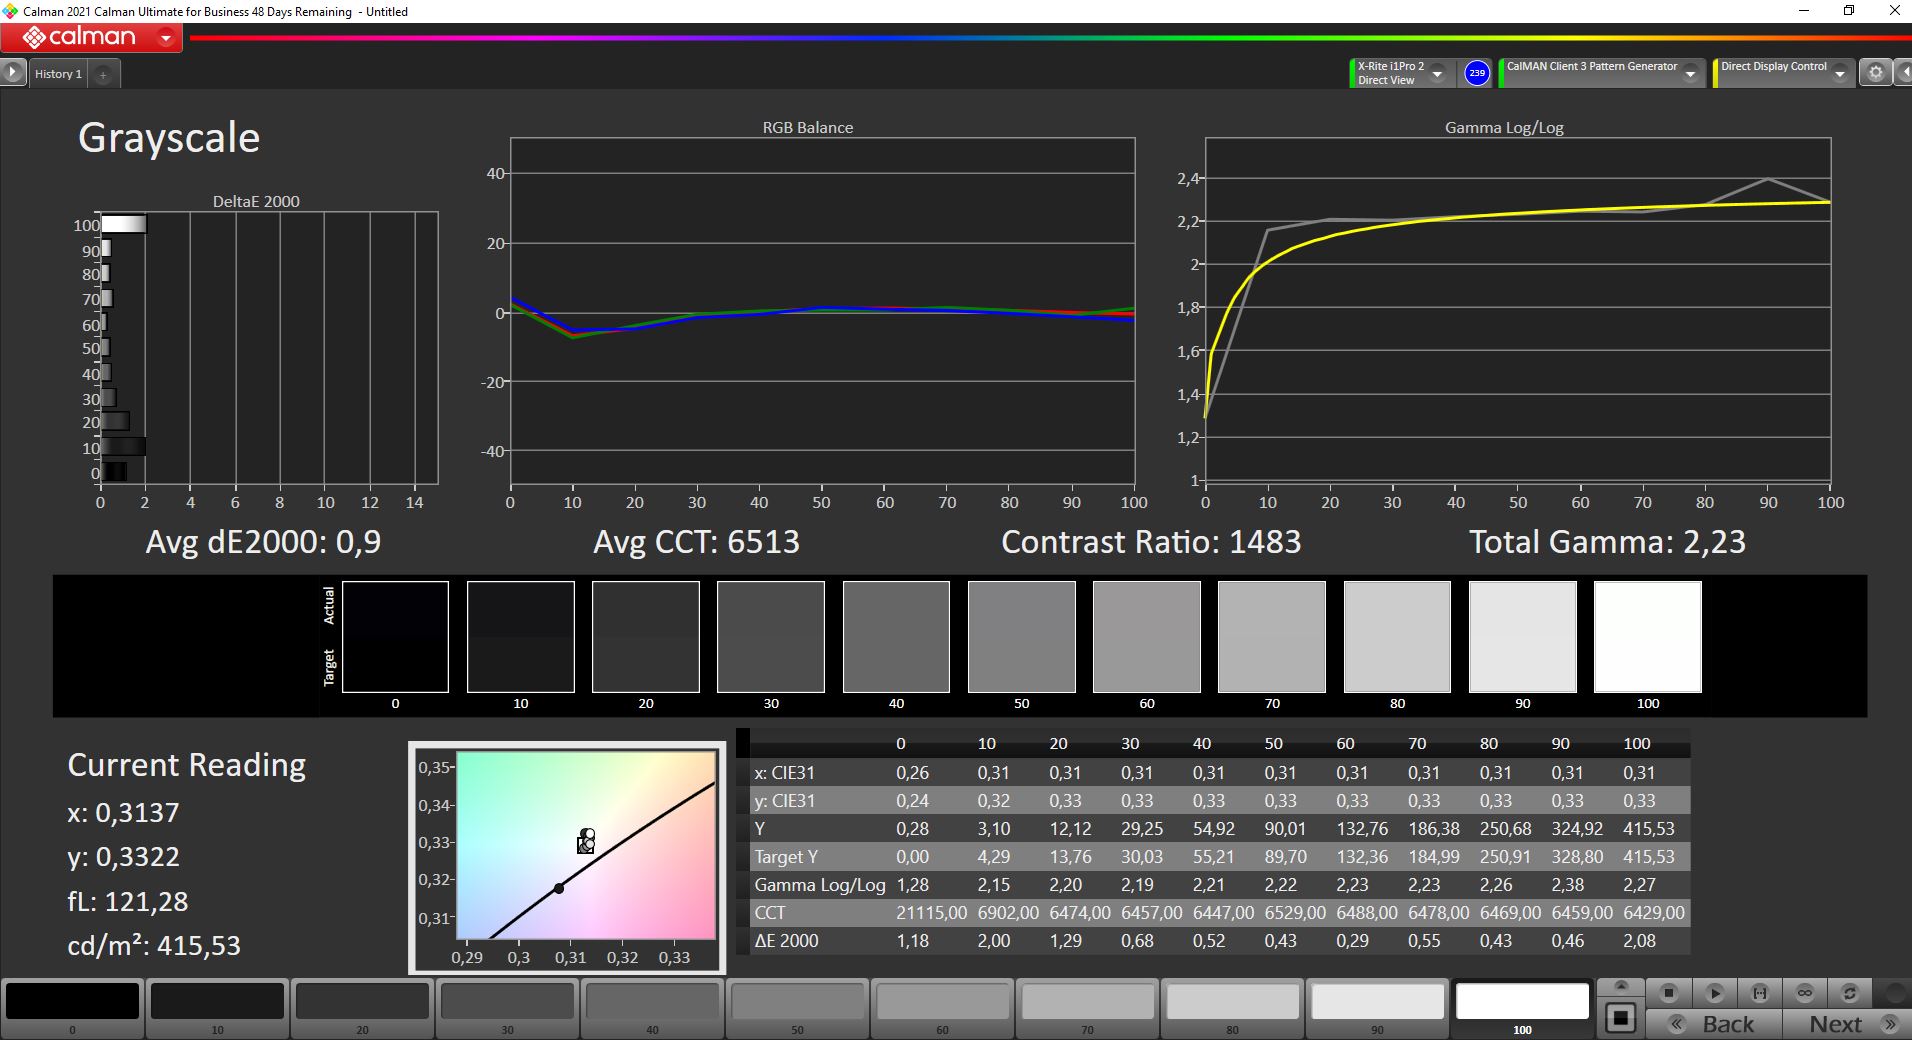
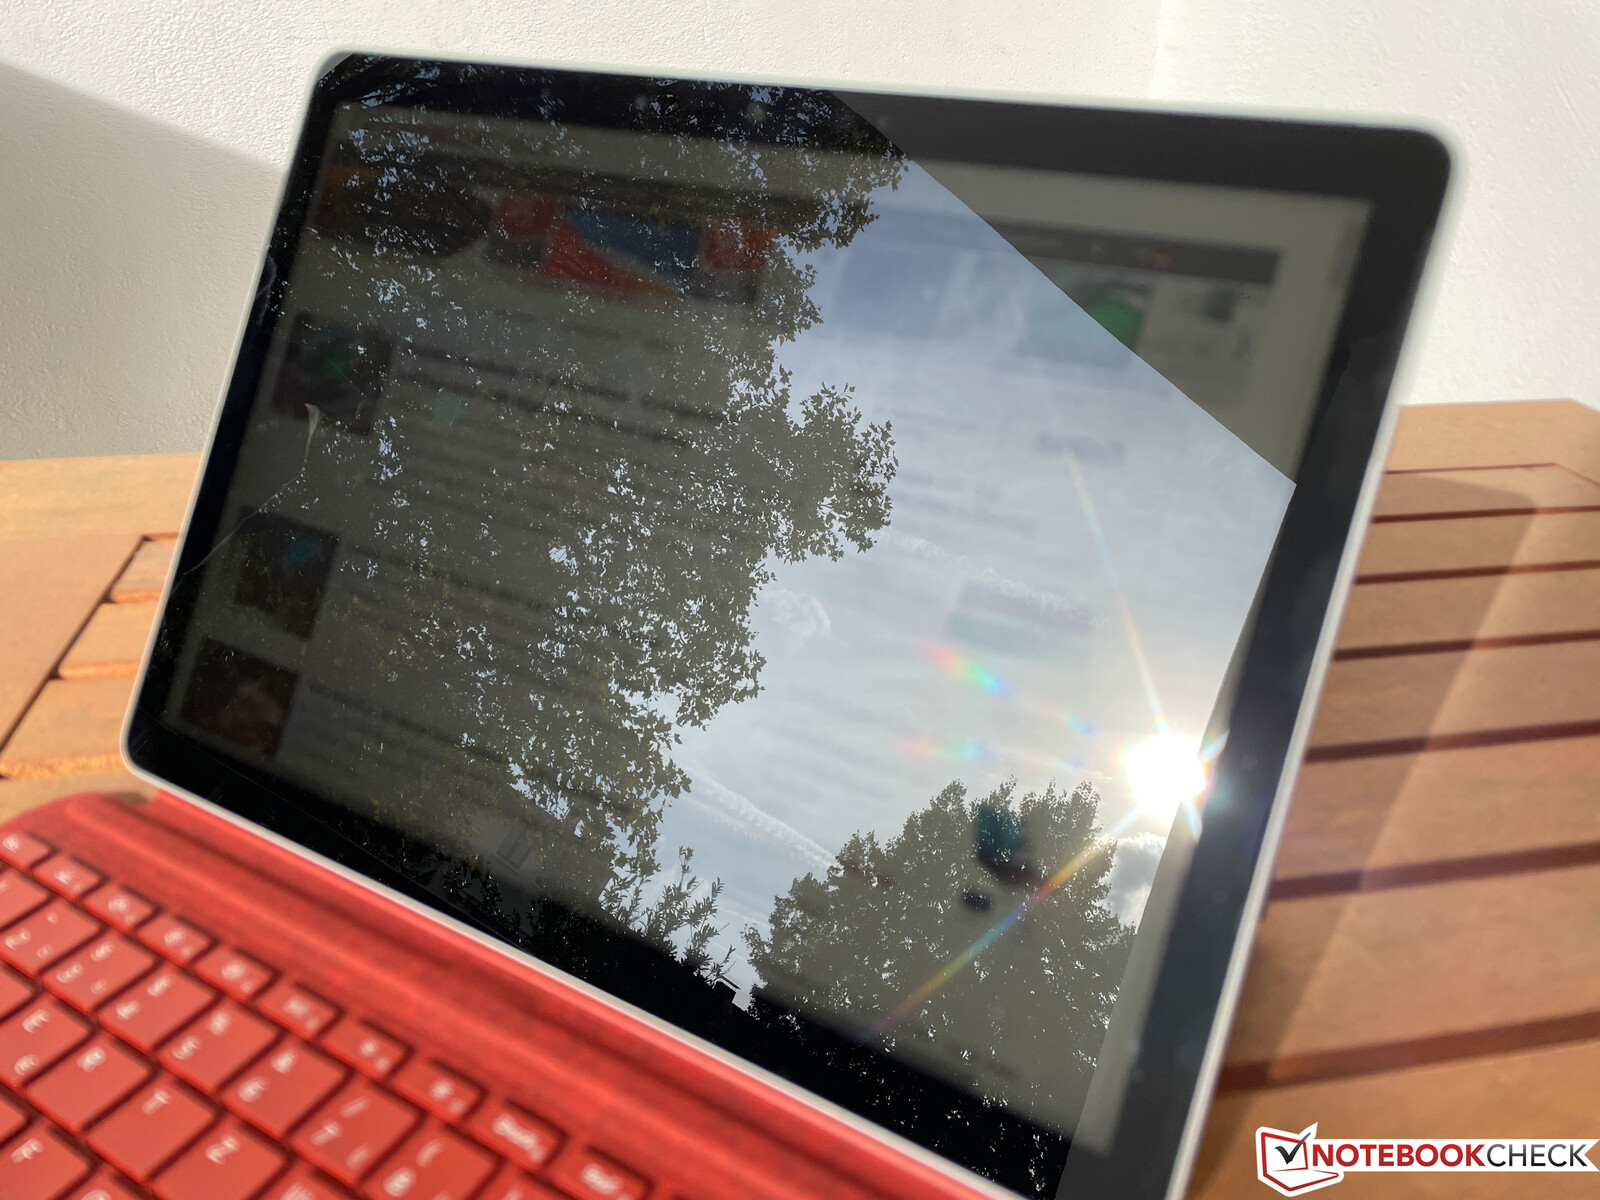
在测量方面,与前代产品相比几乎没有任何变化。略高于400cd/m²的亮度在许多情况下是足够的,但小面板在户外应该更亮,因为反射很快就能看到。
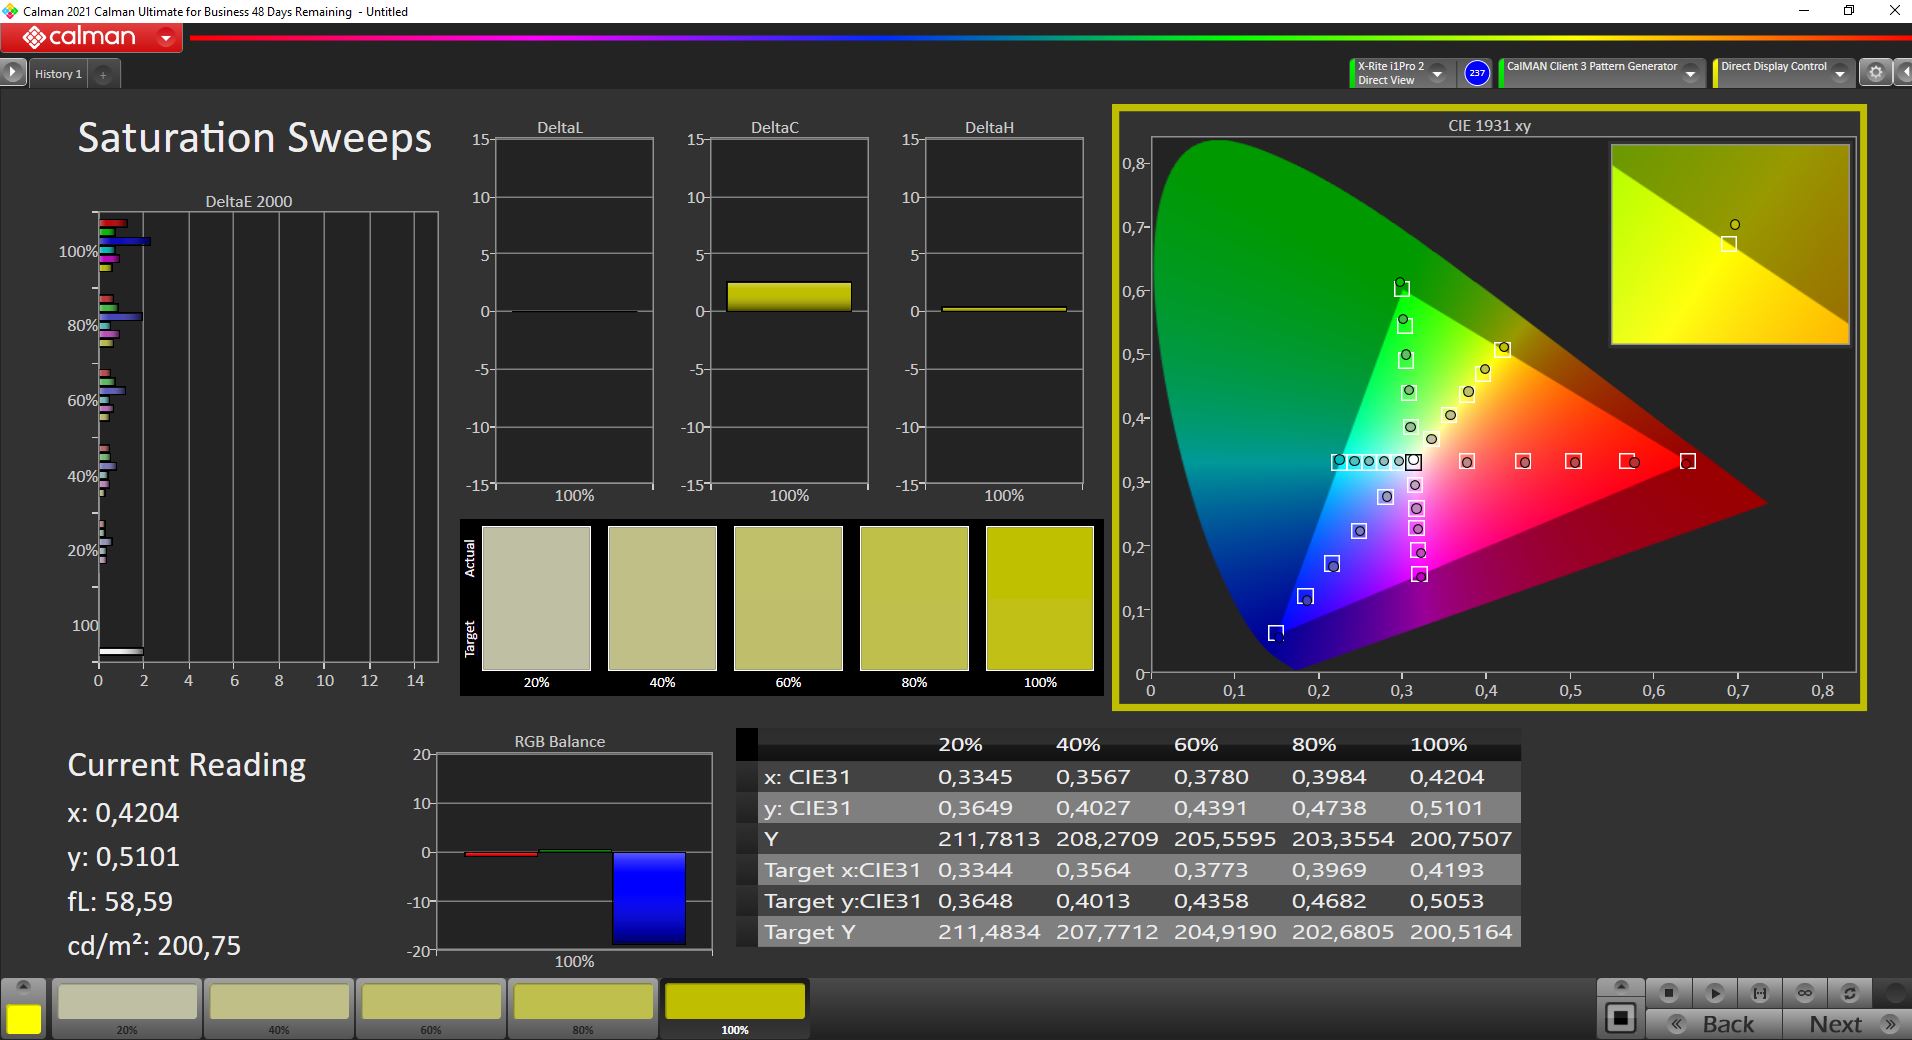
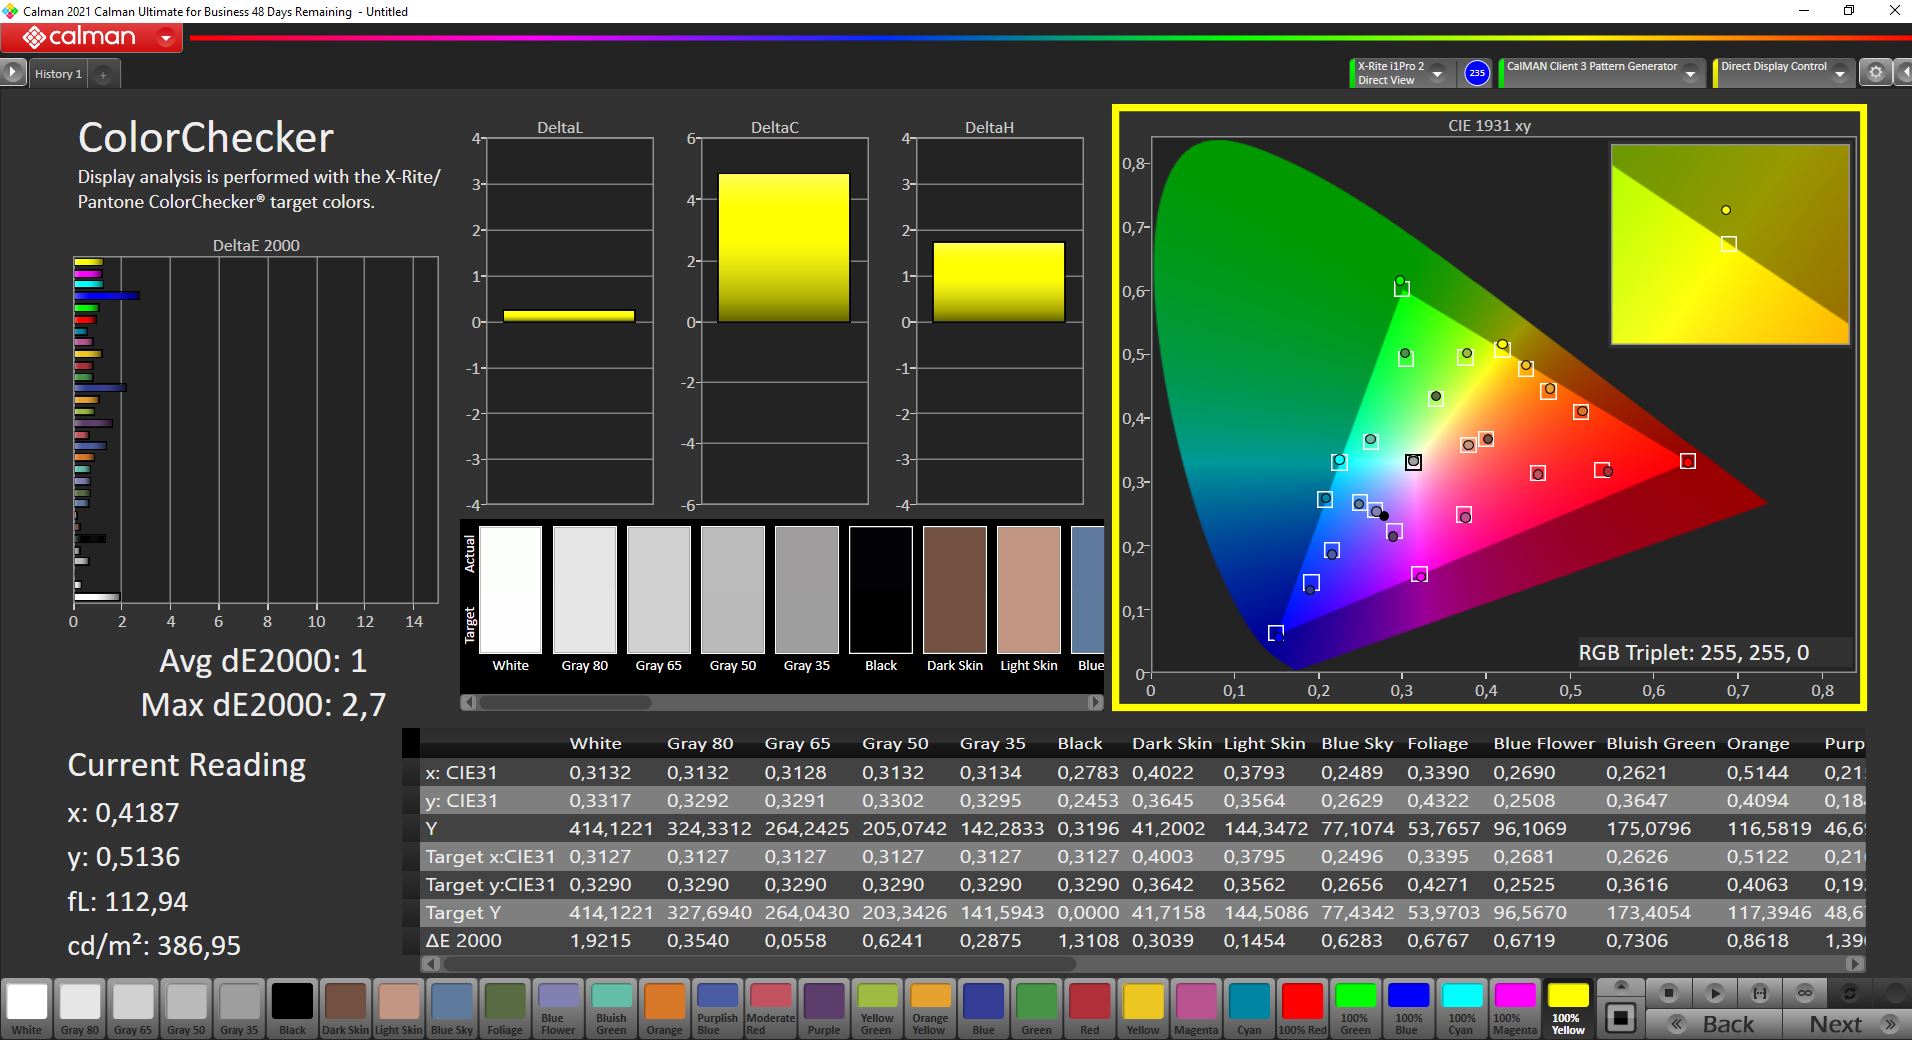
小的sRGB色彩空间被完全覆盖,面板在出厂状态下已经被校准得非常好。我们可以通过自己的校准来提高一些数值,但这并不是真的需要。因此,图片/视频也可以在Surface Go 3上合理地编辑。唯一的缺点仍然是在亮度为94%或更低时的PWM闪动。然而,916赫兹的频率相对较高,实际上不应该导致问题。
| |||||||||||||||||||||||||
Brightness Distribution: 90 %
Center on Battery: 419 cd/m²
Contrast: 1493:1 (Black: 0.28 cd/m²)
ΔE ColorChecker Calman: 1.2 | ∀{0.5-29.43 Ø4.72}
calibrated: 1
ΔE Greyscale Calman: 1.8 | ∀{0.09-98 Ø4.97}
69.8% AdobeRGB 1998 (Argyll 3D)
99.1% sRGB (Argyll 3D)
69% Display P3 (Argyll 3D)
Gamma: 2.21
CCT: 6225 K
| Microsoft Surface Go 3 Core i3 NV105WAM-N31, IPS , 1920x1280, 10.5" | Lenovo Tab P11 Pro OLED, 2560x1600, 11.5" | Apple iPad Air 4 2020 IPS, 2360x1640, 10.9" | Microsoft Surface Pro 7 Core i5-1035G4 LG Philips LP123WQ112604, IPS, 2736x1824, 12.3" | Microsoft Surface Go 2, m3-8100Y NV105WAM-N31, IPS, 1920x1280, 10.5" | |
|---|---|---|---|---|---|
| Display | -4% | 0% | |||
| Display P3 Coverage (%) | 69 | 66 -4% | 68.7 0% | ||
| sRGB Coverage (%) | 99.1 | 93.8 -5% | 100 1% | ||
| AdobeRGB 1998 Coverage (%) | 69.8 | 66.9 -4% | 70.1 0% | ||
| Response Times | 85% | -19% | -5% | 0% | |
| Response Time Grey 50% / Grey 80% * (ms) | 37.2 ? | 4.4 ? 88% | 46.8 ? -26% | 34.8 ? 6% | 37.2 ? -0% |
| Response Time Black / White * (ms) | 22.8 ? | 4 ? 82% | 25.6 ? -12% | 26.4 ? -16% | 22.8 ? -0% |
| PWM Frequency (Hz) | 962 ? | 60.2 ? | 21550 ? | 962 ? | |
| Screen | -31% | -6% | -106% | 18% | |
| Brightness middle (cd/m²) | 418 | 372 -11% | 509 22% | 480.4 15% | 404 -3% |
| Brightness (cd/m²) | 415 | 375 -10% | 486 17% | 485 17% | 402 -3% |
| Brightness Distribution (%) | 90 | 95 6% | 93 3% | 91 1% | 88 -2% |
| Black Level * (cd/m²) | 0.28 | 0.39 -39% | 0.48 -71% | 0.28 -0% | |
| Contrast (:1) | 1493 | 1305 -13% | 1001 -33% | 1443 -3% | |
| Colorchecker dE 2000 * | 1.2 | 1.8 -50% | 1.3 -8% | 5 -317% | 0.7 42% |
| Colorchecker dE 2000 max. * | 2.6 | 4.2 -62% | 2.8 -8% | 7.72 -197% | 1.2 54% |
| Colorchecker dE 2000 calibrated * | 1 | 2.44 -144% | 0.7 30% | ||
| Greyscale dE 2000 * | 1.8 | 2.8 -56% | 2.2 -22% | 5.9 -228% | 1 44% |
| Gamma | 2.21 100% | 2.29 96% | 2.21 100% | 2.38 92% | 2.15 102% |
| CCT | 6225 104% | 6718 97% | 6833 95% | 7805 83% | 6485 100% |
| Color Space (Percent of AdobeRGB 1998) (%) | 99.3 | 60.3 | 64.5 | ||
| Color Space (Percent of sRGB) (%) | 93.2 | 99.7 | |||
| Total Average (Program / Settings) | 27% /
-2% | -13% /
-9% | -38% /
-70% | 6% /
11% |
* ... smaller is better
Display Response Times
| ↔ Response Time Black to White | ||
|---|---|---|
| 22.8 ms ... rise ↗ and fall ↘ combined | ↗ 10.4 ms rise | 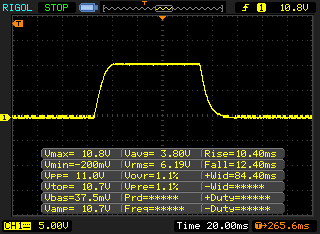 |
| ↘ 12.4 ms fall | ||
| The screen shows good response rates in our tests, but may be too slow for competitive gamers. In comparison, all tested devices range from 0.1 (minimum) to 240 (maximum) ms. » 51 % of all devices are better. This means that the measured response time is worse than the average of all tested devices (19.8 ms). | ||
| ↔ Response Time 50% Grey to 80% Grey | ||
| 37.2 ms ... rise ↗ and fall ↘ combined | ↗ 18.4 ms rise | 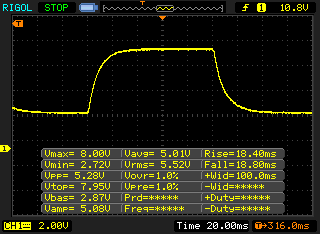 |
| ↘ 18.8 ms fall | ||
| The screen shows slow response rates in our tests and will be unsatisfactory for gamers. In comparison, all tested devices range from 0.165 (minimum) to 636 (maximum) ms. » 54 % of all devices are better. This means that the measured response time is worse than the average of all tested devices (31 ms). | ||
Screen Flickering / PWM (Pulse-Width Modulation)
| Screen flickering / PWM detected | 962 Hz | ≤ 94 % brightness setting | 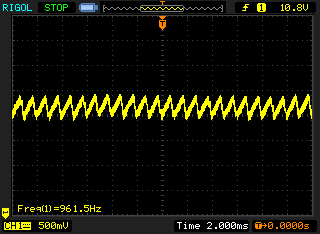 |
The display backlight flickers at 962 Hz (worst case, e.g., utilizing PWM) Flickering detected at a brightness setting of 94 % and below. There should be no flickering or PWM above this brightness setting. The frequency of 962 Hz is quite high, so most users sensitive to PWM should not notice any flickering. In comparison: 52 % of all tested devices do not use PWM to dim the display. If PWM was detected, an average of 7781 (minimum: 5 - maximum: 343500) Hz was measured. | |||


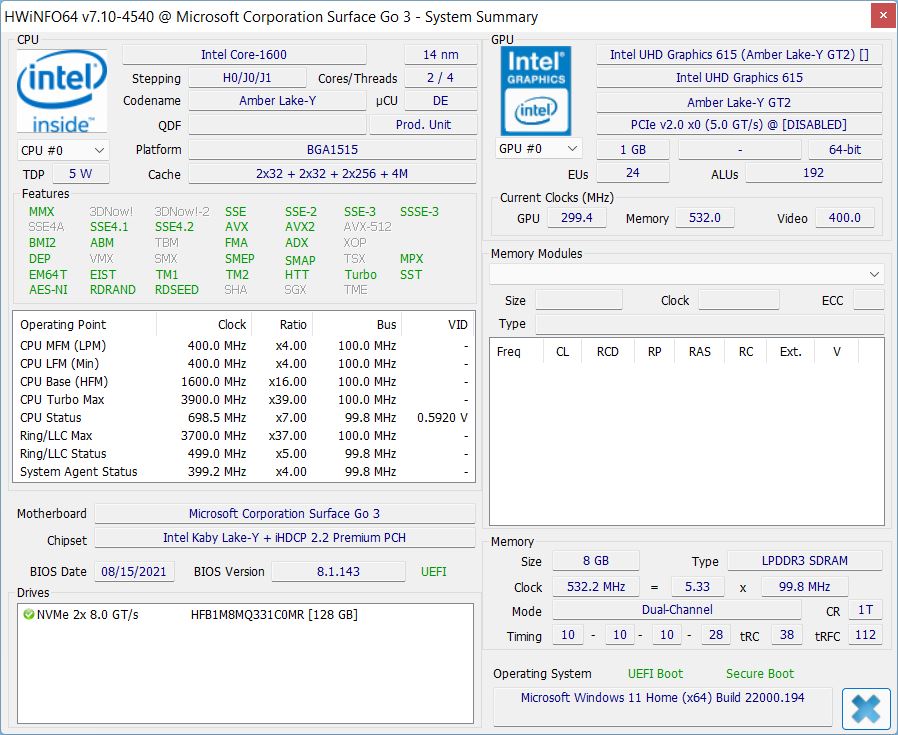
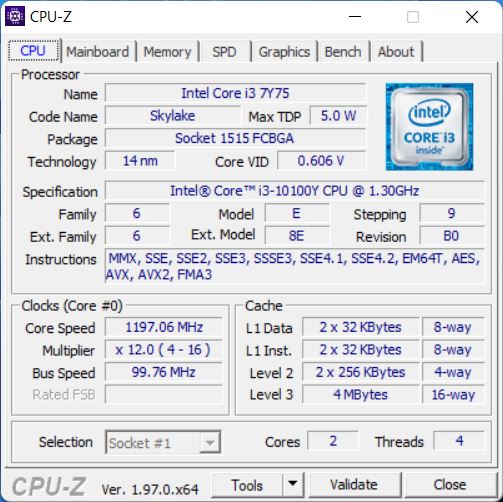
性能、排放和电池寿命
现在可以选择安装Core m3-8100Y,而不是Core i3-10100Y。它仍然是一个被动冷却的处理器,有两个核心和四个线程,但它至少可以提供稳定的性能。总而言之,性能水平不是特别高,例如Apple ,iPad Air的处理能力要强得多。与旧的 m3-8100Y中的一个优势是 Surface Go 2也不存在。
新的Windows 11至少运行得相当流畅,但Surface Go 3显然只适用于简单的任务,多任务处理很快就把硬件推向了极限。特别是在启动应用程序时,总是有短暂的等待时间。与Android 或iOS相比,Windows 11提供了更多的可能性,但现在你也可以用这些平板电脑相当有成效地工作。默认情况下,Surface Go 3在S模式下配备了Windows 11(只能安装来自微软商店的应用程序),但你可以轻松地停用它。
视频播放没有问题(即使是高分辨率的视频),但Surface Go 3不适合游戏。只有来自微软商店的非常简单的游戏(纸牌游戏等)可以合理运行。
这款敞篷车是完全被动冷却的,因此是完全无声的。扬声器还不错,但不会变得特别响亮。Android 或iOS的竞争对手在电池寿命方面也有优势。在Wi-Fi测试中,Surface Go 3仅能运行7小时(或在全亮度下4:41小时)。
Cinebench R15 Multi Endurance test
Cinebench R20: CPU (Multi Core) | CPU (Single Core)
Cinebench R15: CPU Multi 64Bit | CPU Single 64Bit
Blender: v2.79 BMW27 CPU
7-Zip 18.03: 7z b 4 | 7z b 4 -mmt1
Geekbench 5.5: Multi-Core | Single-Core
HWBOT x265 Benchmark v2.2: 4k Preset
LibreOffice : 20 Documents To PDF
R Benchmark 2.5: Overall mean
| Cinebench R23 / Multi Core | |
| Average of class Convertible (1317 - 30959, n=50, last 2 years) | |
| Microsoft Surface Go 3 Core i3 | |
| Average Intel Core i3-10100Y (n=1) | |
| Cinebench R23 / Single Core | |
| Average of class Convertible (740 - 2188, n=50, last 2 years) | |
| Microsoft Surface Go 3 Core i3 | |
| Average Intel Core i3-10100Y (n=1) | |
| Cinebench R20 / CPU (Multi Core) | |
| Average of class Convertible (595 - 12102, n=50, last 2 years) | |
| Microsoft Surface Pro 7 Core i5-1035G4 | |
| Microsoft Surface Go 3 Core i3 | |
| Average Intel Core i3-10100Y (n=1) | |
| Microsoft Surface Go 2, m3-8100Y | |
| Cinebench R20 / CPU (Single Core) | |
| Average of class Convertible (273 - 834, n=50, last 2 years) | |
| Microsoft Surface Pro 7 Core i5-1035G4 | |
| Microsoft Surface Go 3 Core i3 | |
| Average Intel Core i3-10100Y (n=1) | |
| Microsoft Surface Go 2, m3-8100Y | |
| Cinebench R15 / CPU Multi 64Bit | |
| Average of class Convertible (478 - 4940, n=49, last 2 years) | |
| Microsoft Surface Pro 7 Core i5-1035G4 | |
| Microsoft Surface Go 2, m3-8100Y | |
| Microsoft Surface Go 3 Core i3 | |
| Average Intel Core i3-10100Y (n=1) | |
| Cinebench R15 / CPU Single 64Bit | |
| Average of class Convertible (149.8 - 317, n=49, last 2 years) | |
| Microsoft Surface Pro 7 Core i5-1035G4 | |
| Microsoft Surface Go 3 Core i3 | |
| Average Intel Core i3-10100Y (n=1) | |
| Microsoft Surface Go 2, m3-8100Y | |
| Blender / v2.79 BMW27 CPU | |
| Microsoft Surface Go 2, m3-8100Y | |
| Microsoft Surface Go 3 Core i3 | |
| Average Intel Core i3-10100Y (n=1) | |
| Microsoft Surface Pro 7 Core i5-1035G4 | |
| Average of class Convertible (105 - 1051, n=49, last 2 years) | |
| 7-Zip 18.03 / 7z b 4 | |
| Average of class Convertible (12977 - 121368, n=49, last 2 years) | |
| Microsoft Surface Pro 7 Core i5-1035G4 | |
| Microsoft Surface Go 3 Core i3 | |
| Average Intel Core i3-10100Y (n=1) | |
| Microsoft Surface Go 2, m3-8100Y | |
| 7-Zip 18.03 / 7z b 4 -mmt1 | |
| Average of class Convertible (3672 - 6655, n=49, last 2 years) | |
| Microsoft Surface Go 3 Core i3 | |
| Average Intel Core i3-10100Y (n=1) | |
| Microsoft Surface Go 2, m3-8100Y | |
| Microsoft Surface Pro 7 Core i5-1035G4 | |
| Geekbench 5.5 / Multi-Core | |
| Average of class Convertible (1608 - 22023, n=49, last 2 years) | |
| Apple iPad Air 4 2020 | |
| Microsoft Surface Go 3 Core i3 | |
| Average Intel Core i3-10100Y (n=1) | |
| Lenovo Tab P11 Pro | |
| Microsoft Surface Go 2, m3-8100Y | |
| Geekbench 5.5 / Single-Core | |
| Average of class Convertible (806 - 2275, n=49, last 2 years) | |
| Apple iPad Air 4 2020 | |
| Microsoft Surface Go 3 Core i3 | |
| Average Intel Core i3-10100Y (n=1) | |
| Microsoft Surface Go 2, m3-8100Y | |
| Lenovo Tab P11 Pro | |
| HWBOT x265 Benchmark v2.2 / 4k Preset | |
| Average of class Convertible (3.43 - 36.2, n=49, last 2 years) | |
| Microsoft Surface Pro 7 Core i5-1035G4 | |
| Microsoft Surface Go 3 Core i3 | |
| Average Intel Core i3-10100Y (n=1) | |
| Microsoft Surface Go 2, m3-8100Y | |
| LibreOffice / 20 Documents To PDF | |
| Microsoft Surface Go 3 Core i3 | |
| Average Intel Core i3-10100Y (n=1) | |
| Microsoft Surface Go 2, m3-8100Y | |
| Average of class Convertible (42.5 - 84.3, n=49, last 2 years) | |
| R Benchmark 2.5 / Overall mean | |
| Microsoft Surface Go 3 Core i3 | |
| Average Intel Core i3-10100Y (n=1) | |
| Microsoft Surface Go 2, m3-8100Y | |
| Average of class Convertible (0.3915 - 0.84, n=49, last 2 years) | |
* ... smaller is better
| PCMark 10 / Score | |
| Average of class Convertible (3229 - 10123, n=46, last 2 years) | |
| Microsoft Surface Pro 7 Core i5-1035G4 | |
| Microsoft Surface Go 2, m3-8100Y | |
| Microsoft Surface Go 3 Core i3 | |
| Average Intel Core i3-10100Y, Intel UHD Graphics 615 (n=1) | |
| DPC Latencies / LatencyMon - interrupt to process latency (max), Web, Youtube, Prime95 | |
| Microsoft Surface Go 3 Core i3 | |
| Microsoft Surface Go 2, m3-8100Y | |
* ... smaller is better
| Microsoft Surface Go 3 Core i3 SK hynix HFB1M8MQ331C0MR | Microsoft Surface Go 2, m3-8100Y Toshiba KBG30ZPZ128G | Microsoft Surface Go MHN-00003 64 GB eMMC Flash | Average SK hynix HFB1M8MQ331C0MR | Average of class Convertible | |
|---|---|---|---|---|---|
| CrystalDiskMark 5.2 / 6 | 38% | -71% | 0% | 282% | |
| Write 4K (MB/s) | 90.8 | 100.6 11% | 26.91 -70% | 90.8 ? 0% | 144.3 ? 59% |
| Read 4K (MB/s) | 41.13 | 51.1 24% | 19.72 -52% | 41.1 ? 0% | 67.3 ? 64% |
| Write Seq (MB/s) | 801 | 126.2 | 2553 ? | ||
| Read Seq (MB/s) | 1209 | 268 | 2965 ? | ||
| Write 4K Q32T1 (MB/s) | 199.4 | 270.8 36% | 62.9 -68% | 199.4 ? 0% | 454 ? 128% |
| Read 4K Q32T1 (MB/s) | 251.6 | 307.2 22% | 39.82 -84% | 252 ? 0% | 580 ? 131% |
| Write Seq Q32T1 (MB/s) | 372.9 | 853 129% | 131.3 -65% | 373 ? 0% | 4395 ? 1079% |
| Read Seq Q32T1 (MB/s) | 1639 | 1776 8% | 259.3 -84% | 1639 ? 0% | 5814 ? 255% |
| Write 4K Q8T8 (MB/s) | 234.8 | 235 ? 0% | 817 ? 248% | ||
| Read 4K Q8T8 (MB/s) | 316.7 | 317 ? 0% | 1237 ? 291% |
| low | med. | high | ultra | |
|---|---|---|---|---|
| The Witcher 3 (2015) | 9.3 | |||
| Dota 2 Reborn (2015) | 57.2 | 25.9 | 12.9 | 11.6 |
| X-Plane 11.11 (2018) | 8.06 | 6.26 | 6.09 |
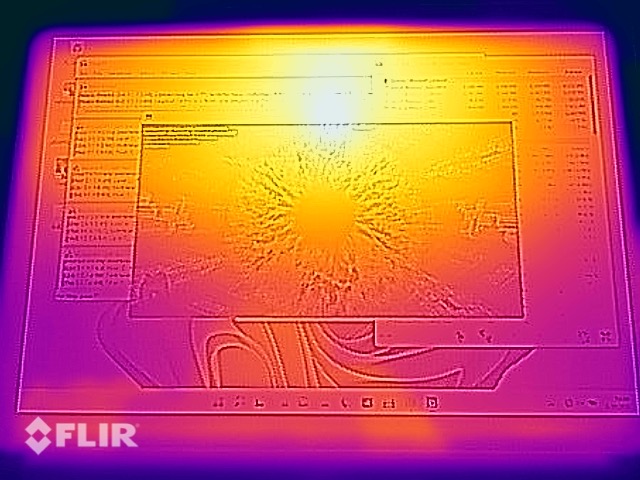
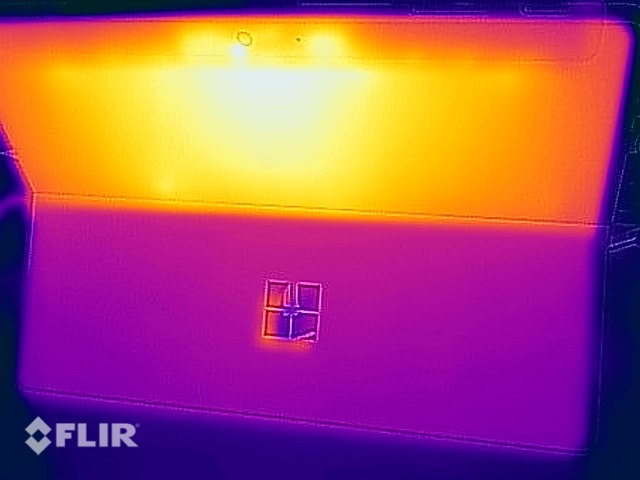
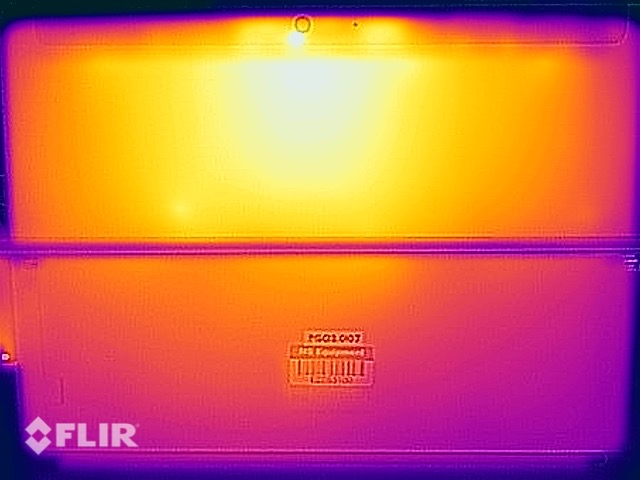
温度
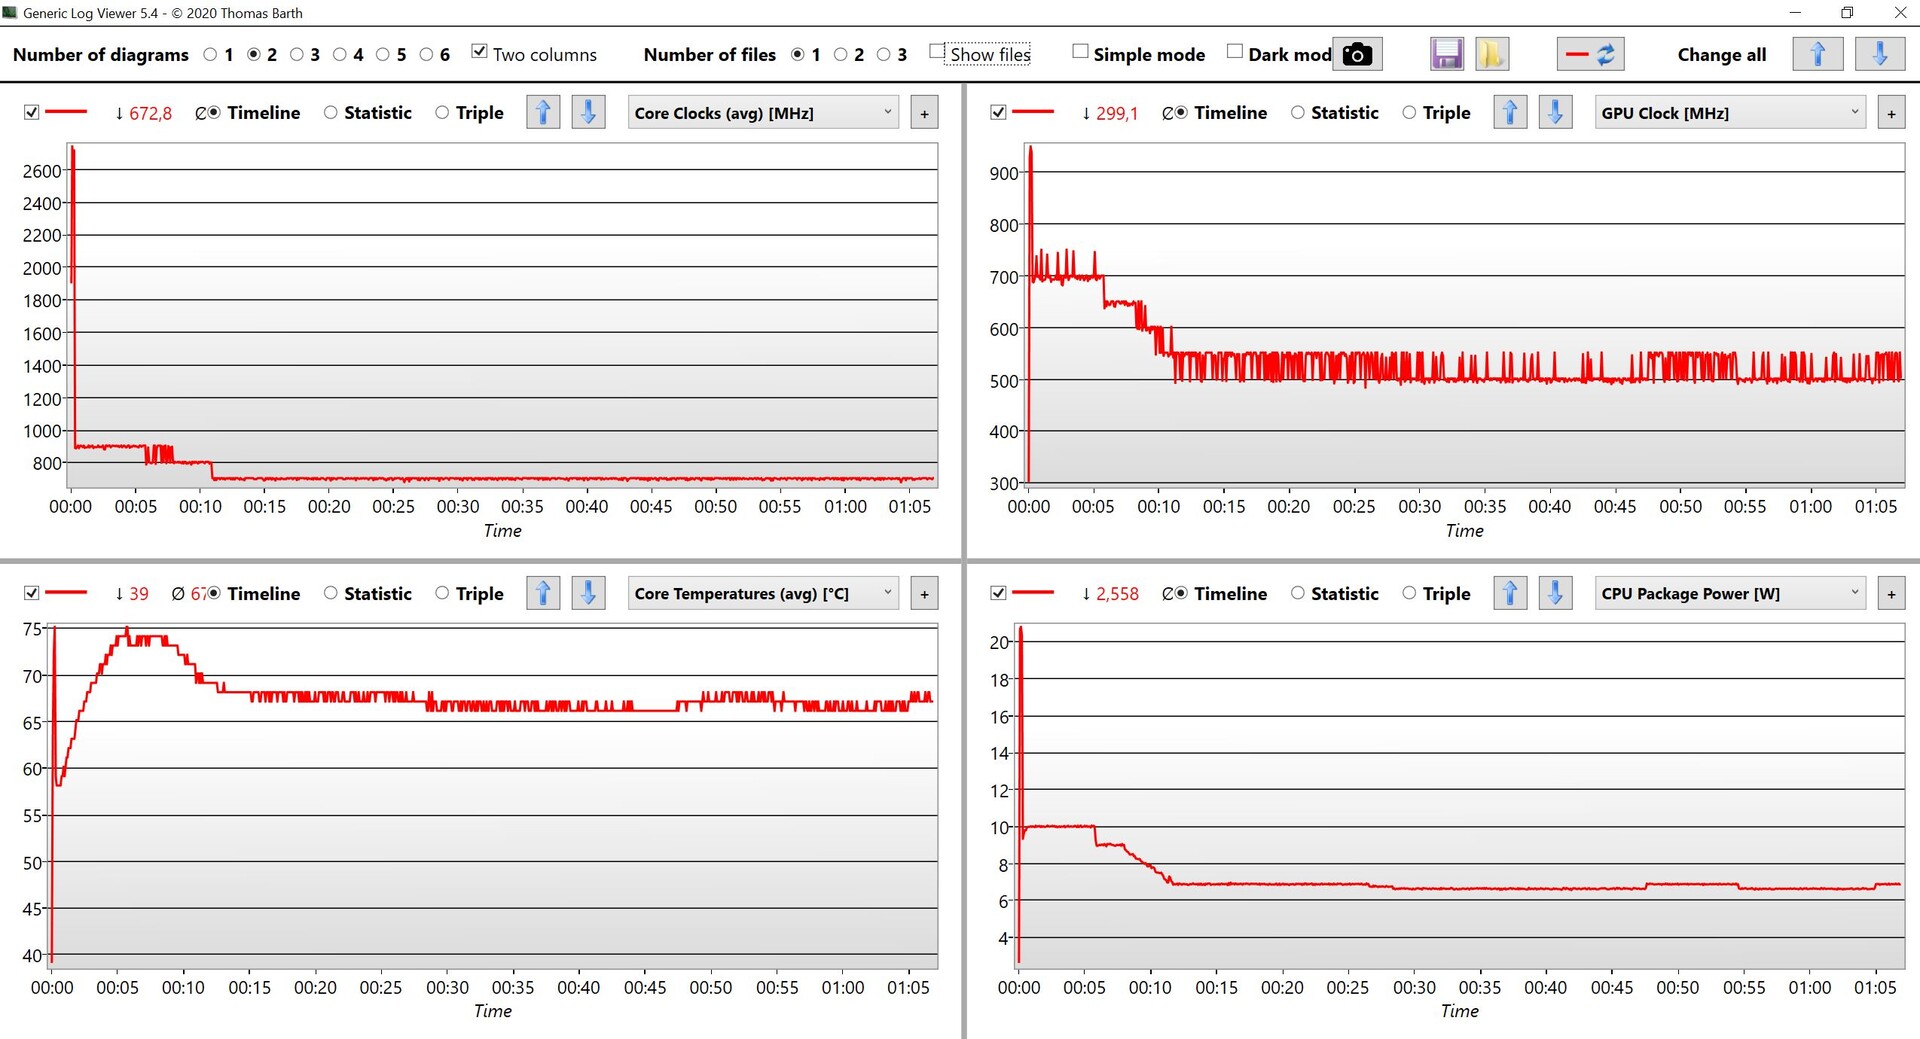
(-) The maximum temperature on the upper side is 46.1 °C / 115 F, compared to the average of 35.4 °C / 96 F, ranging from 19.6 to 60 °C for the class Convertible.
(±) The bottom heats up to a maximum of 42.7 °C / 109 F, compared to the average of 36.9 °C / 98 F
(+) In idle usage, the average temperature for the upper side is 24.4 °C / 76 F, compared to the device average of 30.3 °C / 87 F.
(+) The palmrests and touchpad are reaching skin temperature as a maximum (35.2 °C / 95.4 F) and are therefore not hot.
(-) The average temperature of the palmrest area of similar devices was 28 °C / 82.4 F (-7.2 °C / -13 F).
演讲者
Microsoft Surface Go 3 Core i3 audio analysis
(±) | speaker loudness is average but good (75 dB)
Bass 100 - 315 Hz
(±) | reduced bass - on average 12% lower than median
(±) | linearity of bass is average (12.2% delta to prev. frequency)
Mids 400 - 2000 Hz
(±) | higher mids - on average 6.5% higher than median
(+) | mids are linear (4.1% delta to prev. frequency)
Highs 2 - 16 kHz
(+) | balanced highs - only 4.6% away from median
(+) | highs are linear (6.4% delta to prev. frequency)
Overall 100 - 16.000 Hz
(±) | linearity of overall sound is average (19.4% difference to median)
Compared to same class
» 47% of all tested devices in this class were better, 6% similar, 47% worse
» The best had a delta of 6%, average was 20%, worst was 57%
Compared to all devices tested
» 48% of all tested devices were better, 7% similar, 45% worse
» The best had a delta of 4%, average was 24%, worst was 134%
Apple iPad Air 4 2020 audio analysis
(+) | speakers can play relatively loud (86.3 dB)
Bass 100 - 315 Hz
(±) | reduced bass - on average 14.2% lower than median
(±) | linearity of bass is average (12.2% delta to prev. frequency)
Mids 400 - 2000 Hz
(+) | balanced mids - only 3.8% away from median
(+) | mids are linear (3.8% delta to prev. frequency)
Highs 2 - 16 kHz
(±) | higher highs - on average 5.3% higher than median
(+) | highs are linear (4.9% delta to prev. frequency)
Overall 100 - 16.000 Hz
(+) | overall sound is linear (12.9% difference to median)
Compared to same class
» 21% of all tested devices in this class were better, 4% similar, 75% worse
» The best had a delta of 7%, average was 20%, worst was 129%
Compared to all devices tested
» 12% of all tested devices were better, 3% similar, 85% worse
» The best had a delta of 4%, average was 24%, worst was 134%
能源消耗
| Off / Standby | |
| Idle | |
| Load |
|
Key:
min: | |
Energy consumption Stress test
电池寿命
Pros
Cons
结论 - 最紧凑的Windows 11版本
Surface Go 3仍然是相当无敌的,因为几乎没有任何Windows转换机有这么小的显示屏。这个设备级别现在被Android 和iOS平板电脑所主导。微软的小型敞篷车在新的Windows 11系统下功能更全面,但你不应该期望太高,因为整体性能很低。Surface Go 3足以完成简单的任务,如浏览互联网、写邮件或看视频,但这对Android 或iOS平板电脑来说也是如此。
从 Surface Go 2是不值得的,因为新的酷睿i3处理器并没有提供任何额外的性能。这是由于被动冷却,但该设备至少在任何时候都是安静的。我们也仍然喜欢紧凑的键盘。
现在有了Windows 11,但除此之外没有真正的创新。Surface Go 3只是一个没有性能优势的迷你更新。
新的Windows 11运行流畅,所有的应用程序都可以在正常模式下安装(以S模式交付),但总的来说,800欧元(约928美元)的价格相当昂贵。对于许多用户来说,目前来自联想 ,三星 或Apple 的平板电脑可能是更好的选择。
价格和可用性
Surface Go 3可以在Microsoft而我们的测试设备价格为679欧元(+129欧元/~788美元+~150美元的键盘)。在数码港等网上商店,目前只有配备奔腾处理器的较慢型号,售价599欧元(~$695).
Microsoft Surface Go 3 Core i3
- 10/15/2021 v7 (old)
Andreas Osthoff
Price comparison

